


Abstract
Software vulnerabilities pose a severe threat to system security and stability. To reinforce the hierarchical structure of source code, enhance the distinctiveness of embedded features, and reduce feature confusion, we propose CADetect, a vulnerability detection model based on clustering-aware heterogeneous code graphs. First, a hierarchical clustering algorithm is applied to constrain and optimize the embedding vectors. This enhances the model’s ability to differentiate between diverse node and edge types within the heterogeneous code graphs, while streamlining code structures and reducing redundant information. Subsequently, multi-scale convolutions with varying kernel sizes are designed to extract vulnerability features at different granularities, effectively mitigating the information loss commonly caused by single-scale convolutions. Finally, extensive evaluations on the FFmpeg+Qemu, BigVul, and Reveal datasets demonstrate the effectiveness of the proposed model, and ablation studies confirm the specific contributions of the clustering algorithm and multi-scale convolutions.
1. Introduction
Software vulnerability detection serves as a critical line of defense in information security. According to the latest statistics from the U.S. National Vulnerability Database [https://nvd.nist.gov/], the number of vulnerabilities in the cybersecurity domain has now exceeded 250,000. This figure highlights the severity of the current cybersecurity landscape and its associated challenges. Consequently, developing precise and efficient vulnerability detection technologies has become an urgent necessity. Traditional vulnerability detection methods rely heavily on manually designed signatures [1,2,3]. The selection and weighting of these signatures are inherently constrained by human expertise, often failing to yield high-quality rules capable of identifying potential vulnerabilities [4,5]. In recent years, deep learning techniques have achieved remarkable success in this domain. These techniques enable the automatic extraction of vulnerability features from massive volumes of complex data, eliminating the need for manual intervention while simultaneously enhancing detection accuracy and adaptability [6,7,8,9].
Deep learning-based vulnerability detection methods are typically categorized into two main paradigms: text analysis and graph structure analysis [10]. The former generally treats vulnerability detection as a text classification problem, employing natural language processing techniques to directly extract code features for classification [11]. While this approach efficiently scales to large codebases, it tends to disregard the deep structural and logical dependencies between statements [12], resulting in high false positive rates. Conversely, graph-based approaches construct representations of source code to capture hierarchical dependencies and execution logic, exposing intrinsic relationships among functional components such as functions, classes, and modules [13]. This enables the extraction of more accurate vulnerability features, effectively overcoming the limitations of text-based methods. Representative models include AMPLE [14], MAGNET [15], and VulTR [16]. Although these approaches successfully learn heterogeneous relationships and consider multiple graph types (e.g., abstract syntax trees, control flow, and data flow), they still struggle to fully distinguish between different node and edge types in highly complex code graphs. This uncertainty in representation learning leads to ambiguous distinctions between vulnerable and benign code. To address these limitations, this paper proposes CADetect, a vulnerability detection model based on clustering-aware heterogeneous code graphs. By explicitly distinguishing between diverse node and edge types, it simultaneously employs multi-scale convolutions to extract features at different granularities, thereby capturing both local details and global dependencies.
The main contributions of this paper are as follows:
- We propose CADetect, a vulnerability detection model based on clustering-aware heterogeneous code graphs. By optimizing the output of Graph Convolutional Networks (GCNs) to better align with hierarchical code dependencies, it significantly improves vulnerability detection accuracy;
- We design a Clustering-Enhanced Feature Module (CEFM) to explicitly distinguish vulnerability features across different structural levels and retain the most representative semantic information;
- We introduce a Triple-Scale Convolutional Network (TSCN) to simultaneously capture local details and long-range global dependencies, effectively mitigating information loss.
2. Related Work
2.1. Embedded Representation of Source Code
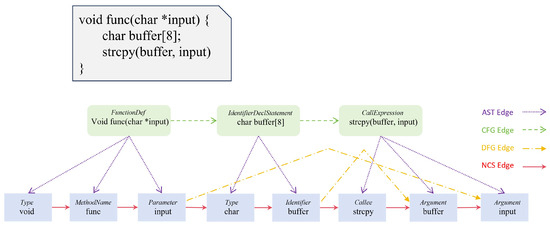
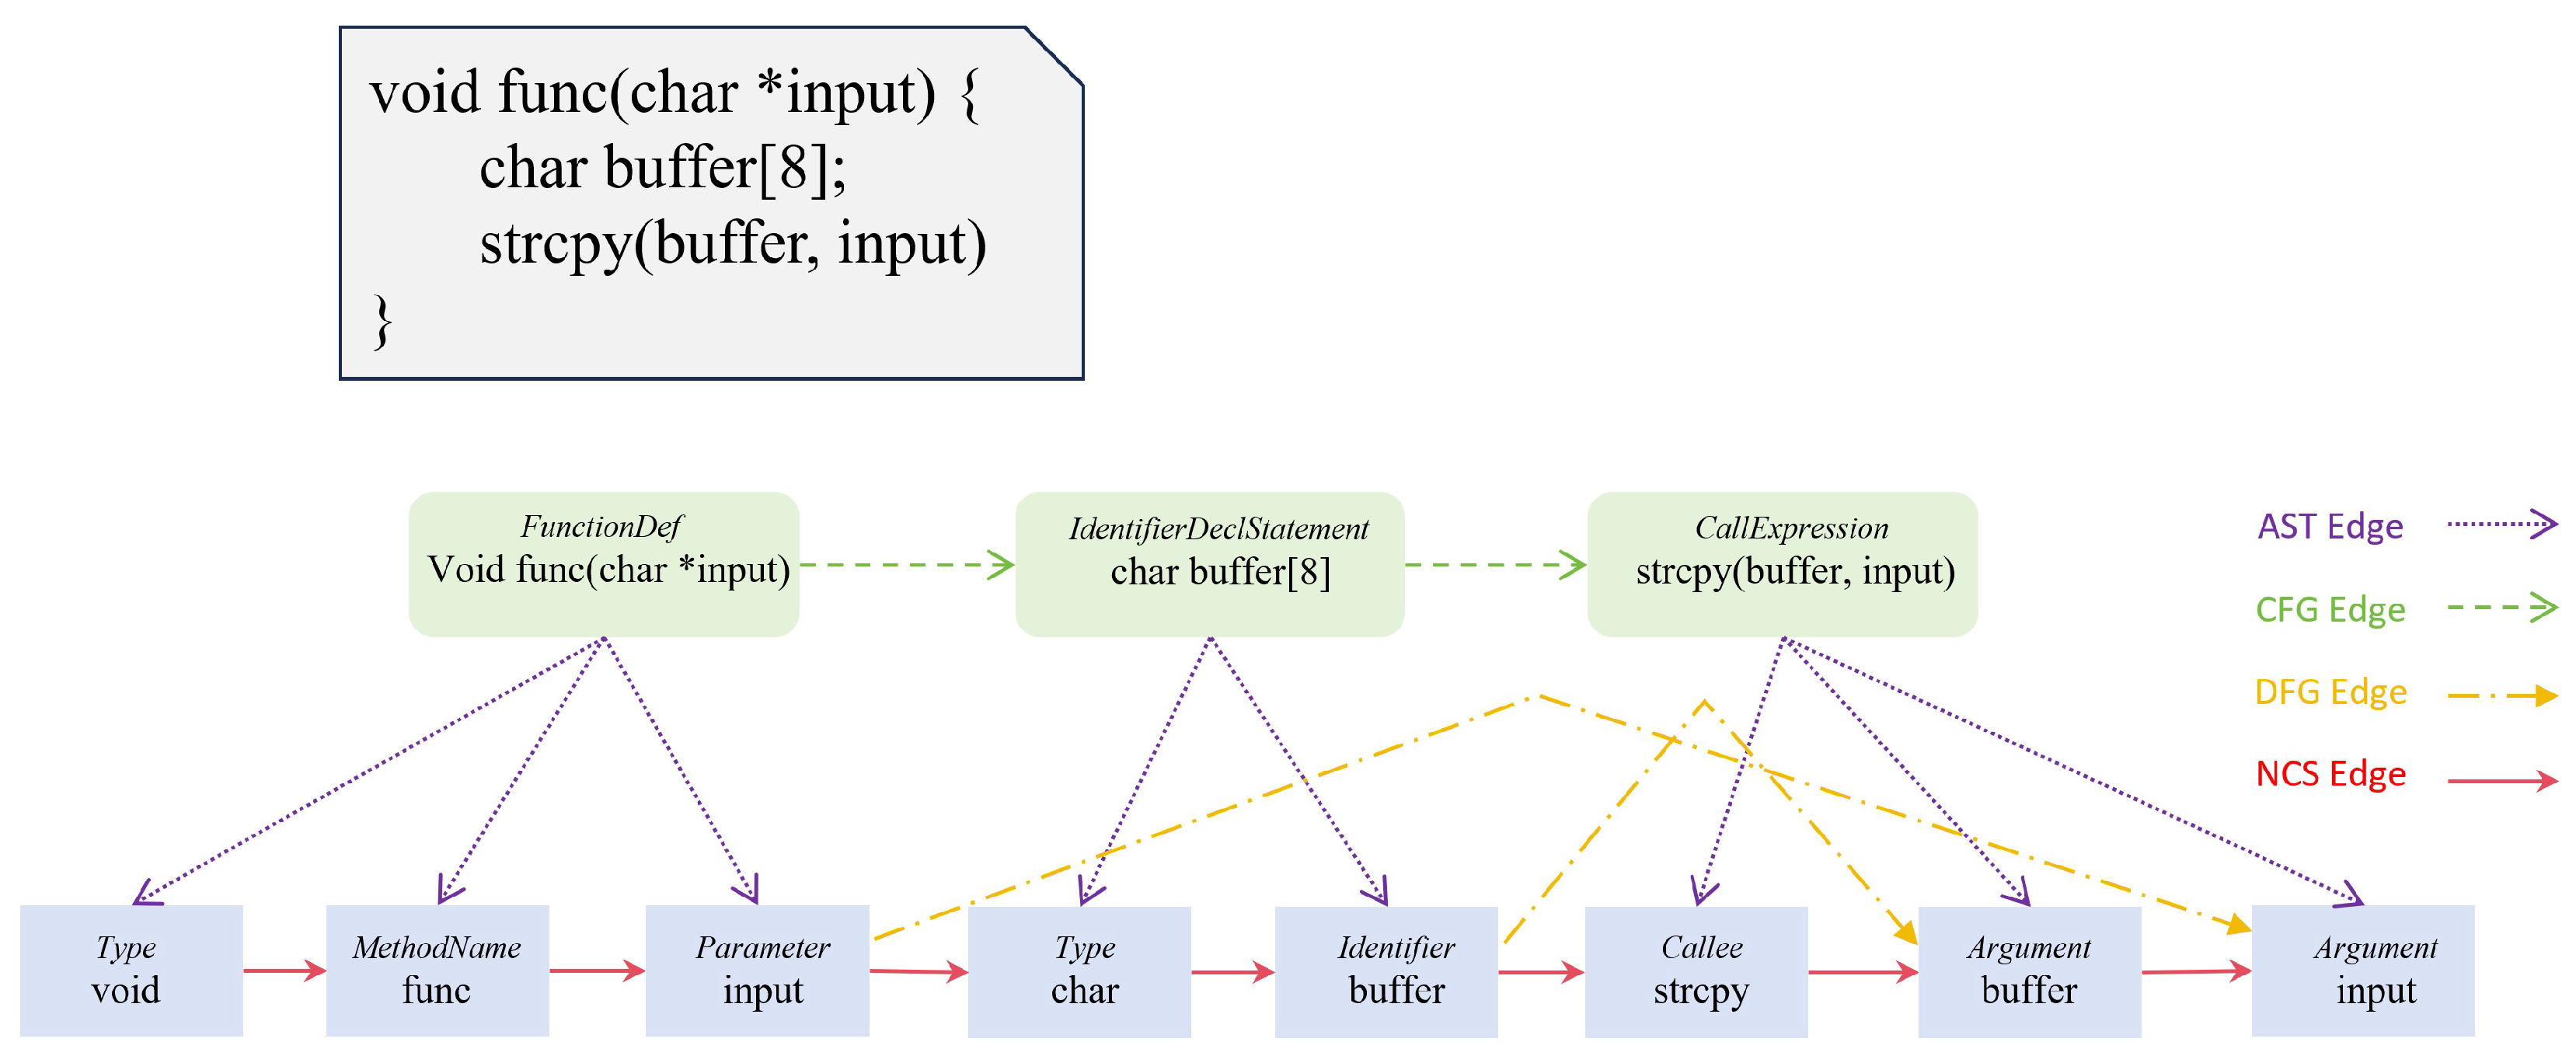
Code embedding enables the effective processing of complex code functions, enhancing the representation of vulnerable code. Existing methods [1,17,18] treat source code as natural language text sequences and employ backbone networks (such as recurrent and convolutional neural networks) to learn feature embeddings of the code. These approaches typically focus only on superficial code semantics, often neglecting the intrinsic constraints between data and control flows [19]. However, unlike natural language, code is not merely a sequence of words. It inherently possesses rich structural information, such as execution logic (e.g., conditional and loop statements) and dependencies between variables—features that are not explicitly captured by natural language sequences. Consequently, understanding the complex structures of code using pure text representations becomes significantly more challenging. Graph data structures have been proven to better capture intricate code structures like multi-level nesting or recursive logic [15]. Code functions can be abstracted into various types of code structure graphs, such as Abstract Syntax Trees (AST), Control Flow Graphs (CFG), Data Flow Graphs (DFG), and Natural Code Sequences (NCS) [20]. As shown in Figure 1, these graphs are considered among the most effective representations of source code [21]. Numerous approaches utilize code structure graphs as inputs to learn code embeddings (e.g., the AMPLE [14], MAGNET [15], and VulTR [16] models), successfully extracting the hierarchical information embedded within the code. Inspired by these methods, this paper employs a unified code graph structure that integrates AST, CFG, DFG, and NCS into a heterogeneous graph to extract code embeddings.
Figure 1.
Code Representation of Union Graph.
2.2. Graph Neural Network Model for Vulnerability Detection
In vulnerability detection tasks, Graph Neural Networks (GNNs) represent the most widely adopted technology to date [22]. By treating code elements (such as variables and functions) as nodes, and dependencies between elements as edges, GNNs propagate information and extract features based on the feature vectors of each node and its neighbors, thereby enhancing node feature representations [21,22]. This approach is particularly well-suited for representing code characteristics such as control flow, data flow, and deep logical dependencies. GNN-based vulnerability detection models effectively process code structure graphs containing diverse relationships like data flow, control flow, and function calls. For instance, Devign [2] and Reveal [3] employ gated graph neural networks to parse hybrid graph structures, learning and extracting structural information from source code; IVDetect [23] employs graph convolutional neural networks to learn and represent code structural information. Although these methods can process code structural graphs containing multiple relationship types, they uniformly convert different relationship types into a single adjacency matrix format, ignoring distinctions between node and edge types. This prevents models from capturing relationships between different node and edge types, leading to a loss of critical structural information and contextual relationships, which impacts vulnerability detection accuracy and effectiveness. Therefore, this paper aims to enhance the representation capabilities of heterogeneous nodes and edges in code structural graphs while efficiently capturing both local features and global dependencies. This approach improves the accuracy and robustness of vulnerability detection.
Beyond traditional graph neural network architectures, contemporary research has increasingly focused on broader structural optimization and compression strategies to handle high-dimensional deep learning frameworks. From a theoretically rigorous perspective, formal methods have been successfully employed to optimize network structures. For instance, Ressi et al. [24] proposed a novel technique for compressing neural networks via formal methods, specifically leveraging the concept of lumpability from Markov chains to prune filters while preserving exact behavioral outcomes without requiring data dependence or fine-tuning. While such formal techniques excel in strict structural verification and exact compression guarantees, our proposed CADetect approaches structural optimization from an empirical, data-driven angle. Specifically, the CEFM introduces dynamic clustering constraints to aggregate heterogeneous code nodes based on multi-relational graph topology. Both paradigms—formal network compression and empirical graph clustering—share the fundamental objective of distilling complex structural representations. Contextualizing CADetect alongside these contemporary formal compression models highlights its position as a highly scalable, heuristic alternative tailored specifically for heterogeneous code graph optimization.
3. CADetect Model
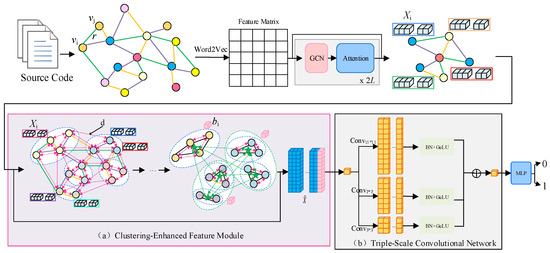
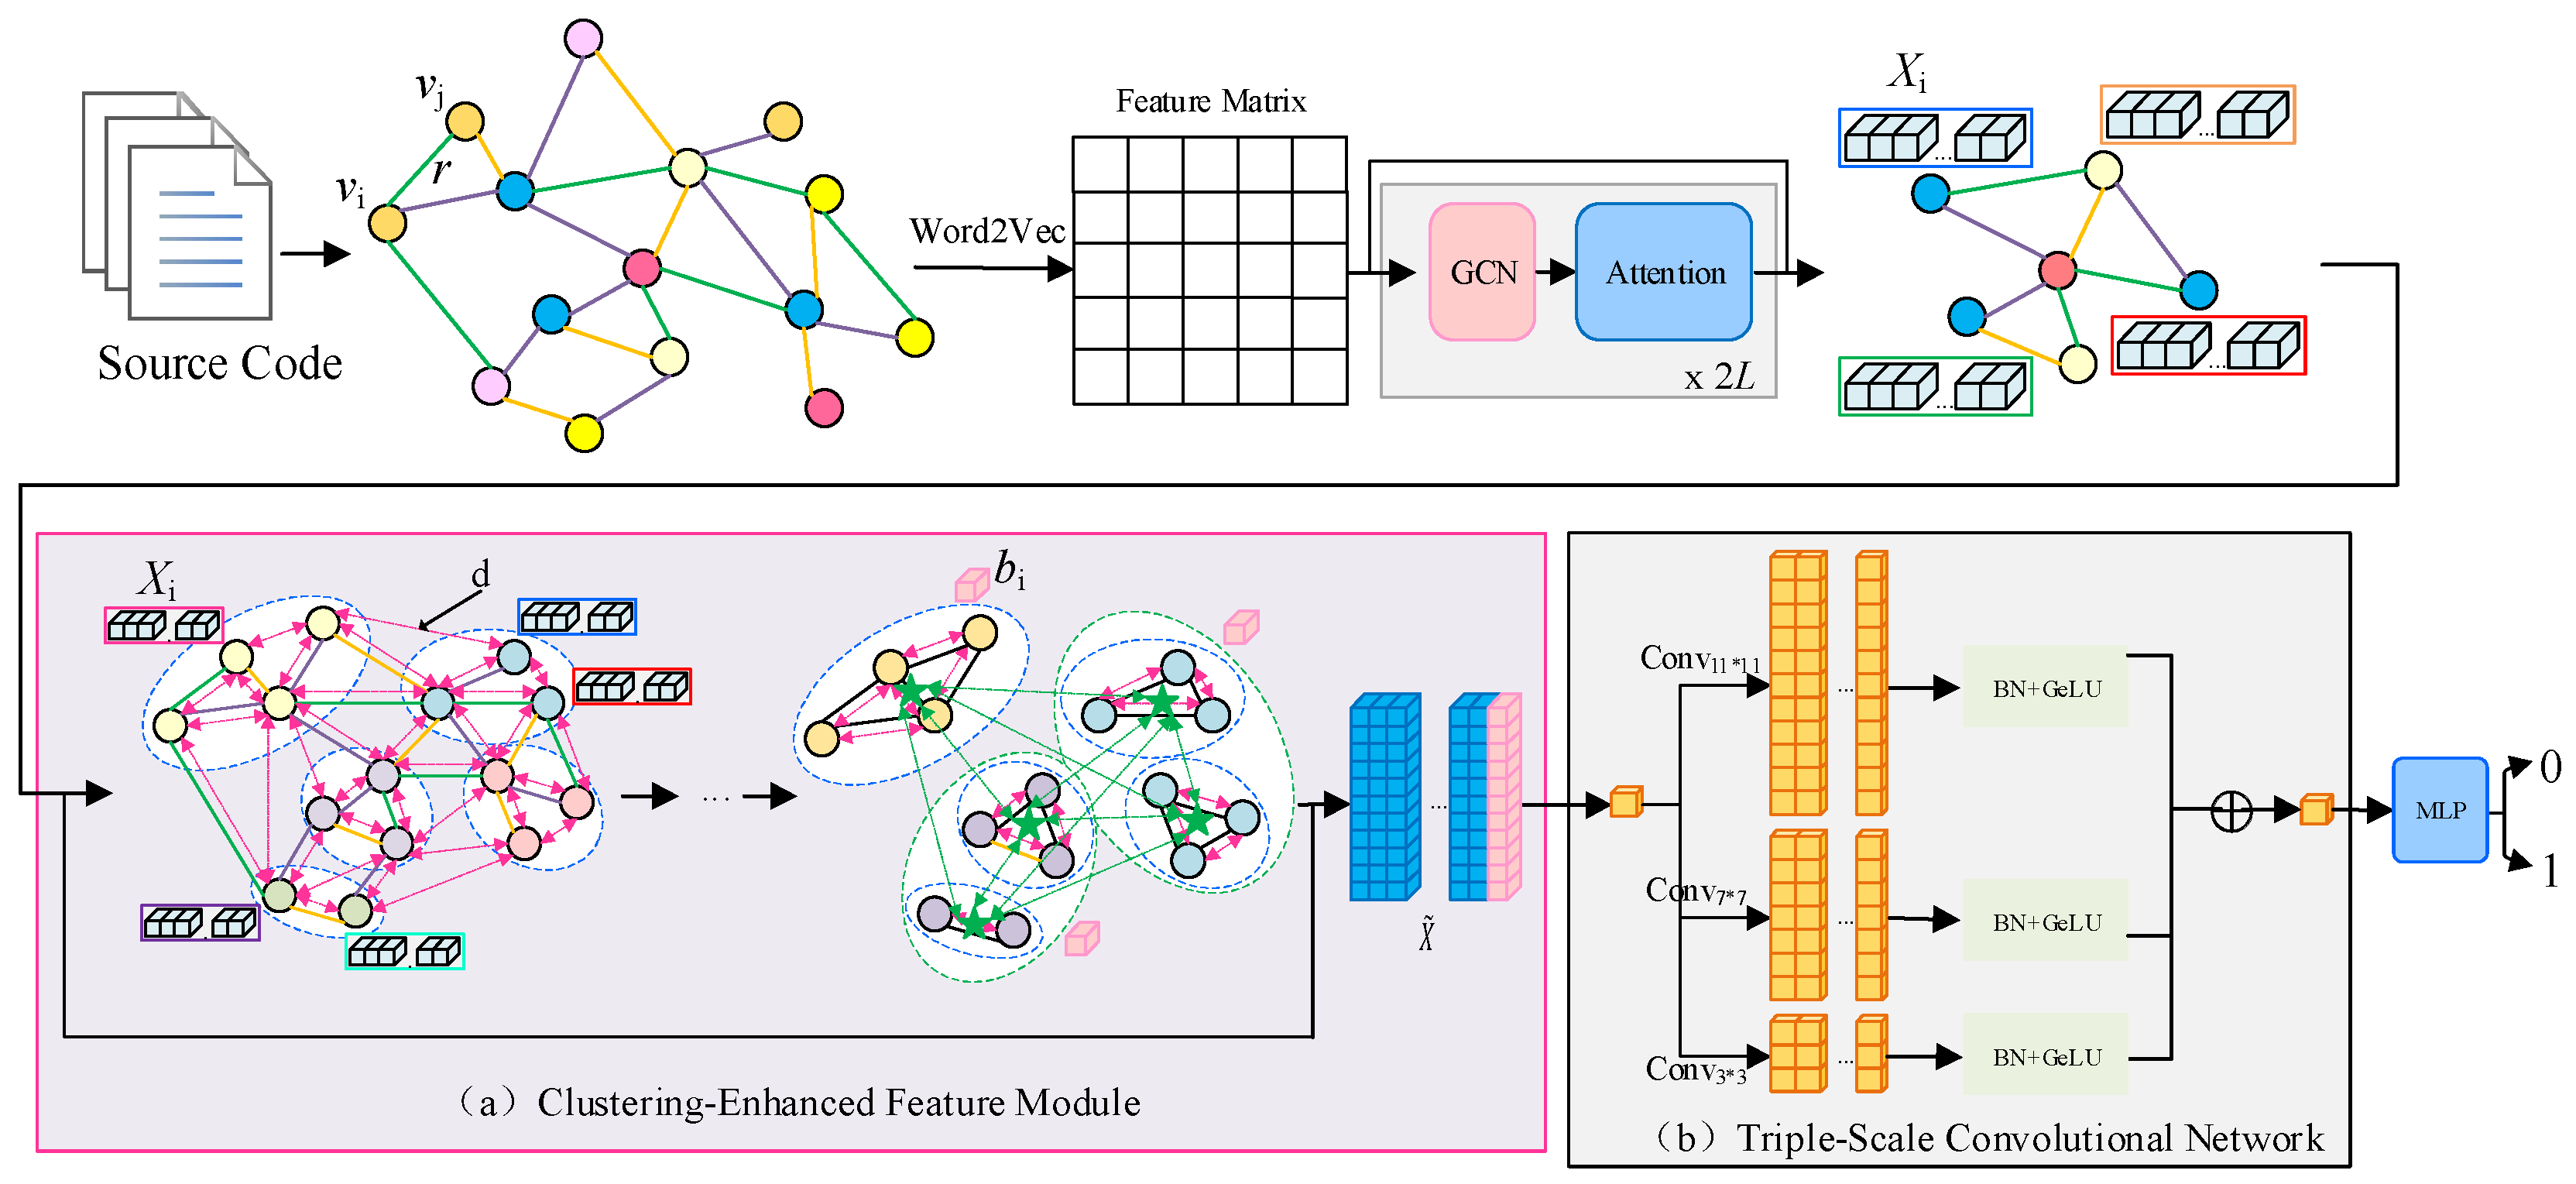
The overall architecture of CADetect is shown in Figure 2. Nodes and edges of different colors within the modules represent distinct types. For instance, node types include variables, statements, functions, and operators, while edge types encompass AST, CFG, DFG, and others. Figure 2a depicts the CEFM, designed to enhance the distinguishability of heterogeneous nodes and edges. This module improves the hierarchical and discriminative nature of feature representations, while simultaneously streamlining code structures and mitigating the impact of redundant information. Figure 2b illustrates the TSCN, which captures both local features and global dependencies of vulnerabilities through convolutions with varying different kernel sizes.
Figure 2.
CADetect model. The dashed elliptical frames represent single heterogeneous node clusters; the symbol d refers to the intra-cluster aggregation distance; green five-pointed stars denote cluster centroids for feature aggregation. Label 0 denotes vulnerability-free functions, and label 1 denotes vulnerable functions.
In this model, source code functions are initially represented as a unified heterogeneous code structure graph comprising multiple types of nodes and edges. Here, denotes the node set, denotes the total number of nodes, and each node is vector initialized using word2vec that has been pre-trained with source code. denotes the edge set. represents the number of edges. This set describes the connectivity relationships among nodes in the graph. denotes the edge type set, where represents the total number of edge types. These types define the specific semantic relationships represented by the various edges within the graph.
To learn the heterogeneous information embedded in the graph, the GCN employs a message-passing mechanism to aggregate features from local neighboring nodes at each node, thereby forming node embedding vectors that encapsulate code semantics. After passing through two GCN layers, each node representation incorporates code structural information, semantic context, and feature information from its neighbors. The processing procedure for each node is shown in Equation (1):
where denotes the feature representation of node at layer , is a non-linear activation function, denotes the set of all neighbor nodes of with edge type , is the weight matrix for at the layer , is the weight matrix used for self-connections, and represents the number of nodes between and with .
To fully integrate edge information from diverse types within the heterogeneous code graph, we employ a multi-head attention mechanism. To explicitly capture the distinct semantics of different structural relations within the heterogeneous graph, the multi-head attention mechanism incorporates relation-specific weights. Let denote the set of heterogeneous edge types. The computational process is shown in Equations (2)–(4). For a specific edge type connecting node and its neighbor , the relation-aware attention score for the -th attention head at layer is calculated using a scaled dot-product operation:
where and are the current feature representations of the corresponding nodes, is the dimensionality of the attention head, and is a trainable relation-specific projection matrix that enables the model to dynamically evaluate the importance of different dependency types, such as control flow and data flow.
Subsequently, a softmax function is applied across all heterogeneous neighbors to normalize the scores into the final attention coefficient :
Finally, the node representation is updated by aggregating the relation-weighted features from all attention heads:
3.1. Clustering-Enhanced Feature Module (CEFM)
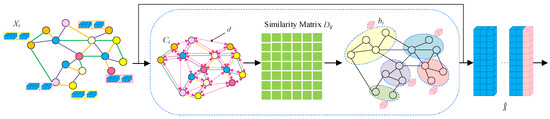
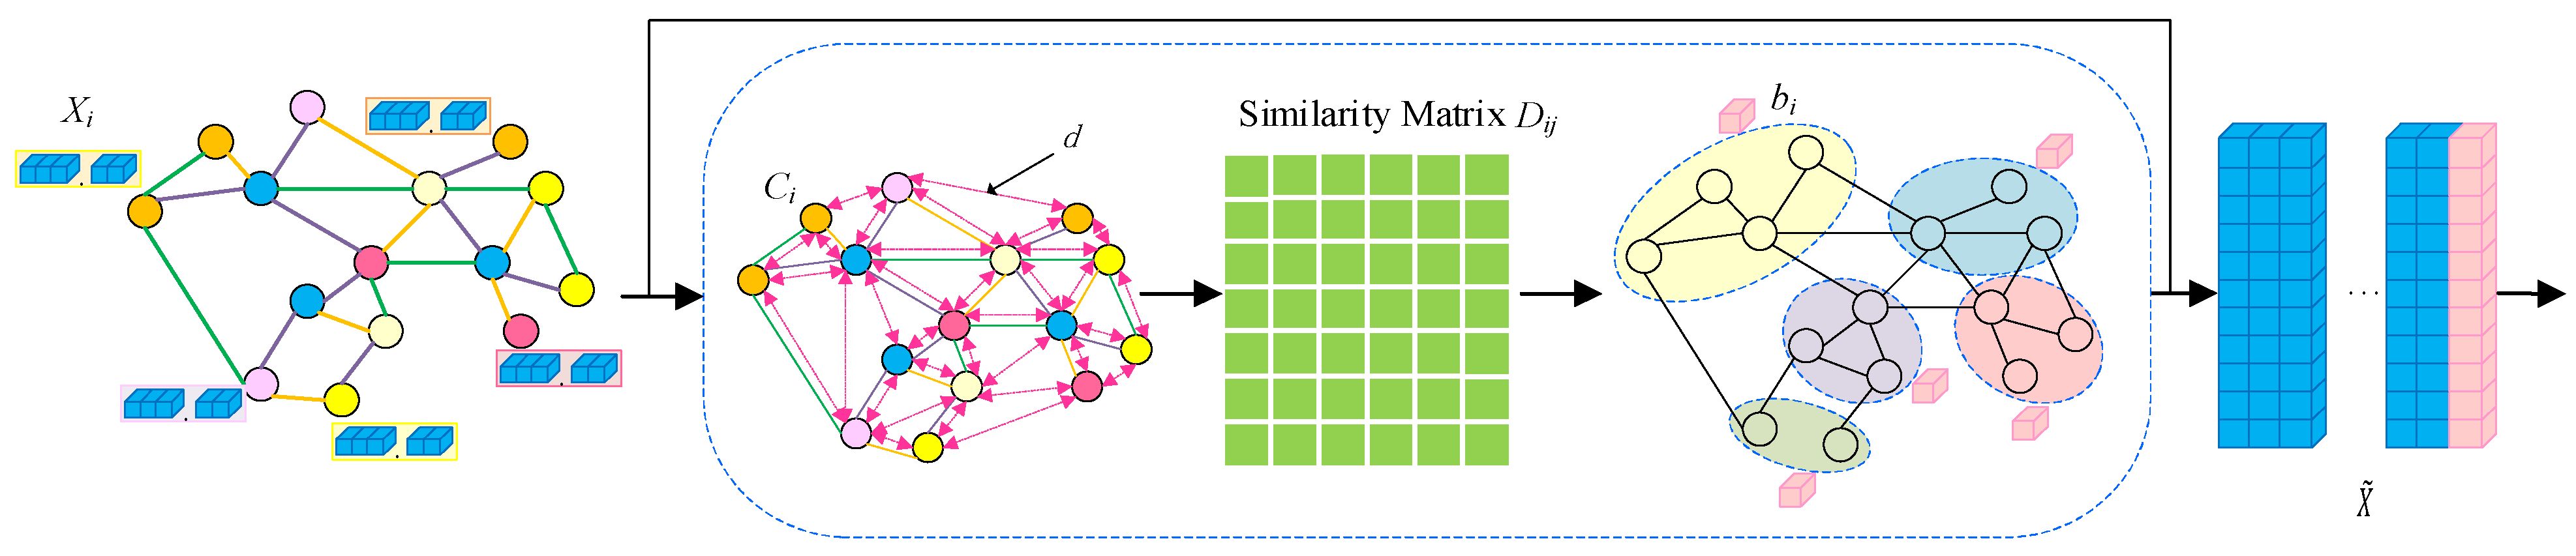
The emergence of vulnerabilities typically involves multiple types of dependencies, which manifest across various layers within the code. Although GCNs can extract rich feature information, the complex local patterns they generate may not always correlate closely with vulnerabilities. Hierarchical clustering methods group nodes with similar features into the same cluster, thereby enhancing the model’s ability to capture high-level semantic patterns related to vulnerabilities. This approach more effectively identifies code logic errors, execution sequence anomalies, and potential vulnerabilities. Therefore, this module employs a hierarchical clustering algorithm to optimize and constrain the embeddings generated by the GCN. This enhances the distinguishability between different node and edge types, improves the model’s structural awareness, and reduces interference from redundant information. The process workflow of the CEFM is shown in Figure 3.
Figure 3.
Clustering-Enhanced Feature Module.
In hierarchical clustering, the Euclidean distance between nodes determines which nodes are more likely to be grouped together. First, each node vector in is treated as an initial cluster, denoted as set , where and represent the number of clusters. The Euclidean distance between each pair of clusters is calculated to generate the initial similarity matrix , as shown in Equation (5):
where and denote the number of samples in their respective clusters, is the node with index in cluster , is the node with index in , and denotes the Euclidean distance between and .
Next, based on the similarity values in the similarity matrix , the algorithm identifies the two closest clusters and merges them into a new cluster. Subsequently, the similarity between the newly merged cluster and the remaining clusters is recalculated using the weighted average method, thereby updating . The calculation process is shown in Equations (6) and (7):
where denotes the distance between and , while and denote the centroids of and , respectively (i.e., the mean values of all samples within the clusters). denotes the updated similarity matrix, denotes the center of mass of the merged cluster , and denotes the center of mass of cluster .
This cluster updating process is performed iteratively until the number of merged clusters meets the preset threshold , forming a hierarchical clustering tree. The final cluster label is represented as shown in Equation (8):
where denotes the cluster label of sample .
Finally, the cluster label obtained for each sample is converted into a one-hot encoding format. This is then concatenated with the node feature representation output by the GCN to yield the augmented feature representation . Since the clustering labels reflect the node clustering results, which embody the similarity among nodes of the same type, this approach helps enhance the capability of the model to distinguish node features, enabling it to better identify different node types.
It is essential to note that the integration of clustering labels strictly preserves permutation invariance and avoids overfitting to positional noise. The hierarchical clustering is initialized and performed on the continuous node embeddings dynamically generated by the GCN layers. Since the message-passing paradigm of GCNs is inherently permutation-equivariant, any alteration in the input node ordering merely results in an identical permutation of the rows in the output embedding matrix. Consequently, the pairwise Euclidean distances between node representations remain mathematically invariant. This guarantees that the clustering algorithm consistently groups the same semantic nodes and assigns identical one-hot labels regardless of the initial absolute indexing, completely isolating the model from positional noise.
3.2. Triple-Scale Convolutional Network (TSCN)
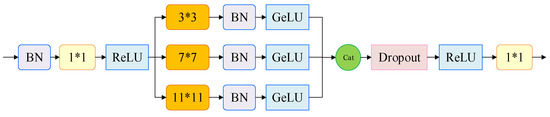
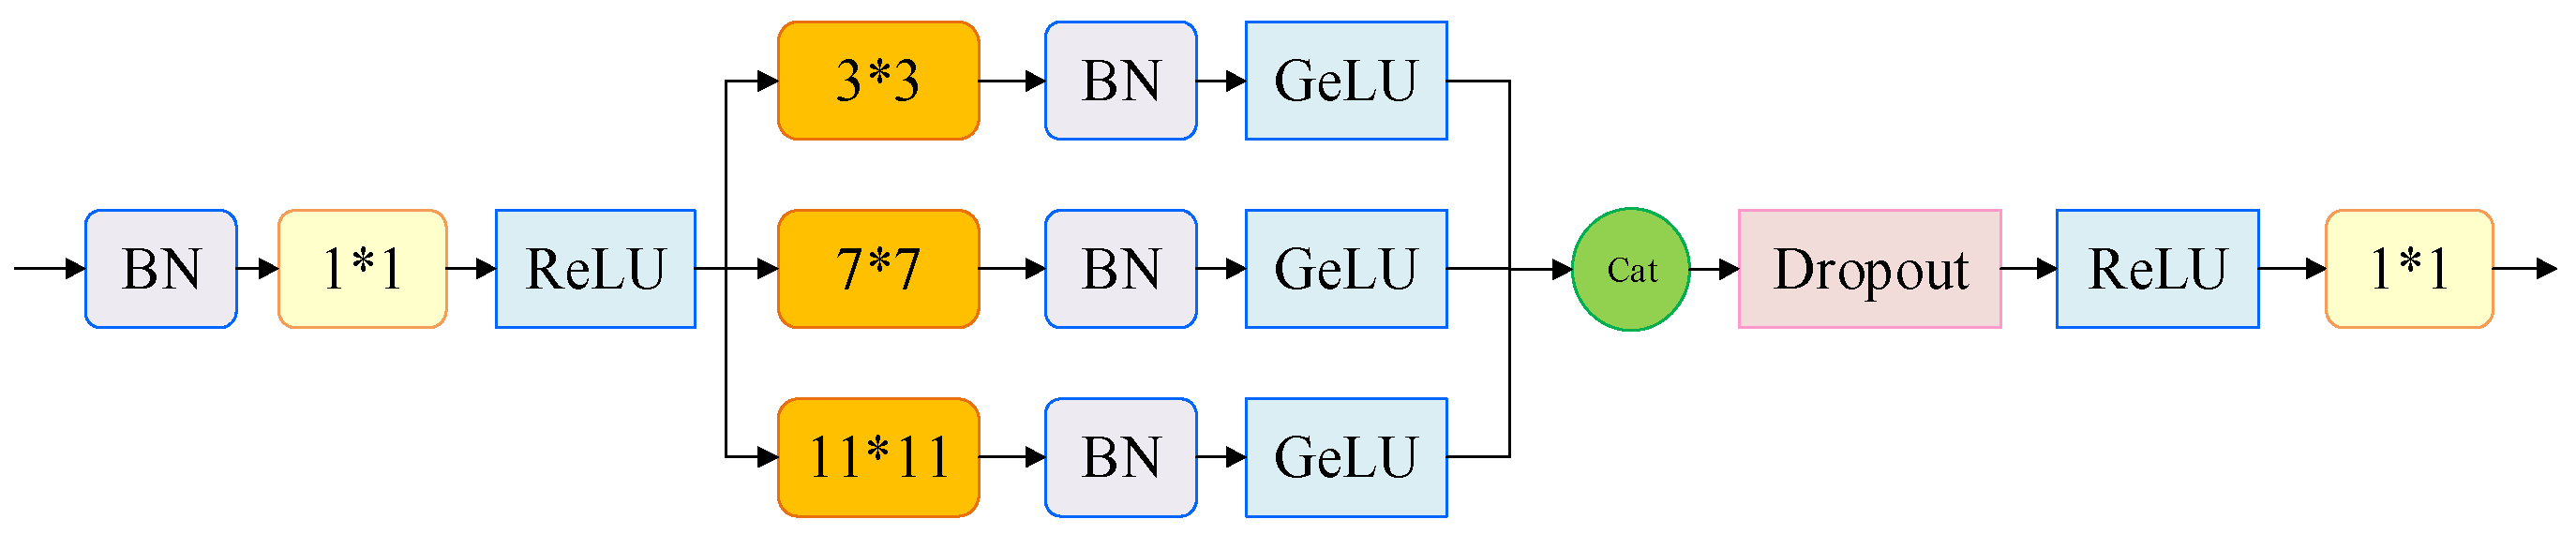
The size of the convolution kernel in a convolutional neural network determines the receptive field, which defines the extent of the input region the network can focus on. To enable the analysis of code structure graphs from different perspectives, this module employs a Triple-Scale Convolutional Network with three distinct kernel sizes, as illustrated in Figure 4. Small convolutional kernels extract local vulnerability patterns, such as those within single lines of code or individual variables. Medium convolutional kernels can capture more complex local structures within a certain range, identifying dependencies involving multiple variables. Large convolutional kernels help capture long-range dependencies and global features, effectively processing code segments with complex, extended execution logic.
Figure 4.
Triple-Scale Convolutional Network.
Specifically, a convolution operation is performed on the input feature enhancement matrix , executing parallel convolutions using three convolutional kernels of different sizes. Following each convolution layer, a Batch Normalization (BN) layer and a GeLU activation function are applied. Finally, the outputs from each convolutional branch are concatenated. The multi-branch convolution operation can be expressed as shown in Equations (9)–(12):
where , and represent the convolutional kernels of three distinct sizes, while , and denote the normalized parameters for each convolutional layer.
Finally, a Multi-Layer Perceptron (MLP) layer is employed to perform the final binary vulnerability classification.
3.3. Overall Workflow of the Model
The overall workflow of the proposed model is shown in Algorithm 1.
| Algorithm 1: CADetect Model |
| Input: Heterogeneous Code Structure Graphs |
| Parameters: GCN layer count L, Maximum Number of Clusters for Hierarchical Clustering τ |
| Output: Binary classification result y = {0, 1} // Step 1: Feature Extraction via GCN { for l = 1 in range(1, L + 1) # Initialize the GCN model # Attention Mechanism Weight Allocation } // Step 2: Clustering-Enhanced Feature Module (CEFM) |
| D = ComputeDistanceMatrix(X, metric=“Euclidean”) # Equation (5): Calculate pairwise Euclidean distances between nodes Z = Linkage(D, update_strategy=“weighted_average”) # Equations (6) and (7): Perform hierarchical clustering cluster_labels = AssignClusters(Z, threshold=τ, criterion=‘maxcluster’) # Equation (8): Set the number of clusters to threshold τ = Concat(X, OneHot(cluster_labels)) # Concatenate X with one-hot encoded cluster labels // Step 3: Triple-Scale Convolutional Network (TSCN) # Perform a small convolution operation # Perform a medium convolution operation # Perform a large convolution operation // Step 4: Classification return y |
4. Experiments and Analysis of Results
4.1. Dataset
To validate the performance of the proposed model in vulnerability detection tasks, this paper employs three vulnerability datasets: FFmpeg+Qemu provided by Zhou et al. [2], BigVul provided by Fan et al. [25], and Reveal provided by Chakraborty et al. [3]. The FFmpeg+Qemu dataset, manually collected and annotated, is widely regarded as a benchmark dataset in the field of software vulnerability detection. It integrates code examples and vulnerability details from two open-source projects, containing 10,067 vulnerable functions and 12,294 non-vulnerable functions with a relatively balanced distribution of positive and negative samples. The BigVul dataset is one of several large-scale real-world vulnerability datasets closely tied to practical scenarios, offering high versatility and representativeness. It encompasses 188,636 C/C++ functions from 348 open-source projects and includes 3754 real code vulnerabilities. These vulnerabilities span 91 distinct common vulnerability types, such as buffer overflows and SQL injections. The Reveal dataset is constructed from two open-source projects involving extensive security vulnerability remediation efforts. This dataset is primarily used for vulnerability classification tasks targeting individual functions.
4.2. Experimental Environment and Parameter Settings
All experimental work in this paper was conducted on an Ubuntu 22.04.3 LTS operating system with an NVIDIA GeForce RTX 3090 graphics card. The proposed model and benchmark models were implemented and evaluated using Python 3.9.18, the PyTorch [26] 2.1.1 framework, and the Deep Graph Library (DGL) [27] 2.4.0. All baseline models were replicated using their publicly released source code, retaining the hyperparameter configurations specified in their original publications. To ensure a fair comparison, all methods were subjected to the same partitioning standard. The datasets were randomly partitioned into training, validation, and testing sets using an 8:1:1 ratio. Furthermore, following the research approaches of Devign and Reveal, the Joern [20] tool was employed to process the FFmpeg+Qemu, BigVul, and Reveal datasets, thereby extracting structured graph information from the source code. The hyperparameter settings used in the proposed model are summarized in Table 1.
Table 1.
Parameter settings of the proposed model.
4.3. Evaluation Measures
To evaluate the predictive performance of the proposed model, four evaluation metrics are employed: Accuracy (Acc), Precision (P), Recall (R), and F1 score (F1). The calculation formulas for these metrics are presented in Equations (13)–(16):
- Accuracy: Accuracy represents the overall classification accuracy of the model when detecting code vulnerabilities, i.e., the proportion of correctly predicted samples (both vulnerable and non-vulnerable) out of the total samples.
- Precision: Precision measures the proportion of samples correctly classified as vulnerable among all samples predicted to contain vulnerabilities.
- Recall: Recall measures the proportion of actual vulnerable samples that are correctly identified by the model.
- F1 Score: The F1 score is the harmonic mean of precision and recall. It provides a comprehensive evaluation of model performance by balancing the trade-off between identifying positive and negative samples.
4.4. Analysis of Experimental Results
4.4.1. Baseline Models
To validate the effectiveness of the proposed model in vulnerability detection tasks, it was compared with three text-based models and six graph-based models:
- VulDeePecker [1] segments source code into dependent code chunks while learning feature representations using LSTM networks and attention mechanisms.
- Russell et al. [17] employ convolutional neural networks to learn pre-labeled source code embeddings, utilizing random forests as classification tools for vulnerability detection.
- SySeVR [18] uses a bidirectional recurrent neural network to learn three feature representations (such as code statements, program dependencies, and program slices), thereby completing vulnerability detection tasks.
- Devign [2] combines gated graph neural networks with convolutional neural networks to learn representations of code structure graphs for vulnerability classification.
- Reveal [3] utilizes gated graph neural networks to extract graph features from code property graphs for vulnerability detection.
- IVDetect [23] employs a feature-attention graph convolutional network to parse program dependency graphs and provides explanations for detected results.
- MAGNET [15] creates meta-path representations for each code fragment and uses a hierarchical attention graph neural network to learn and analyze code features and their dependencies.
- AMPLE [14] utilizes an edge-aware graph convolutional network to extract vulnerability features from simplified code structure graphs for detection.
4.4.2. Analysis of Comparative Experimental Results
The experimental results of the proposed model on three datasets, compared with the aforementioned vulnerability detection benchmark models, are shown in Table 2, Table 3 and Table 4.
Table 2.
Comparison of Experimental Results Across Models on the FFmpeg+Qemu Dataset.
Table 3.
Comparison of Experimental Results Across Models on the Bigvul Dataset.
Table 4.
Comparison of Experimental Results Across Models on the Reveal Dataset.
The experimental results in Table 2, Table 3 and Table 4 demonstrate that the proposed model outperforms all baseline methods in terms of F1 score across the FFmpeg+Qemu, BigVul, and Reveal datasets. Compared to the best baseline model, the proposed model achieves F1 score improvements of 2.44%, 2.84%, and 2.02%, respectively. These results demonstrate that by incorporating a hierarchical clustering algorithm, the proposed model effectively extracts vulnerability-related patterns by grouping nodes with similar features across diverse code structure graphs. This approach also mitigates noise interference, enhancing the robustness of the vulnerability detection model. Furthermore, convolutions with varying kernel sizes capture code features across multiple perspectives, enabling the model to adapt to feature extraction demands across different code fragments. A comparison of the results in Table 2, Table 3 and Table 4 clearly indicates that graph-based vulnerability detection models significantly outperform traditional text-based approaches. Converting source code functions into code structure graphs enables a more effective capture of intrinsic structural features and semantic dependencies within the code. This approach provides richer contextual information for the vulnerability detection model, ultimately leading to a substantial improvement in detection effectiveness.
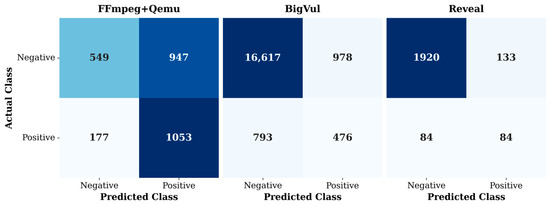
To provide a deeper understanding of the model’s performance, it is essential to analyze the trade-off between Precision and Recall. As observed in the comparative results, while CADetect achieves superior overall F1-scores, it exhibits a slightly lower Precision metric on certain datasets compared to specific baselines. In the domain of software vulnerability detection, the penalty for a False Negative (failing to detect a critical vulnerability) is fundamentally more severe than that for a False Positive (flagging benign code for manual review).
By integrating multi-granularity syntactic and semantic patterns through the CEFM and TSCN modules, CADetect adopts a more proactive and sensitive detection strategy. It effectively captures diverse structural anomalies that match known vulnerability templates, which significantly boosts Recall. However, this high structural sensitivity inevitably introduces some False Positives by occasionally misclassifying structurally complex but benign code as vulnerable, thereby marginally lowering Precision.
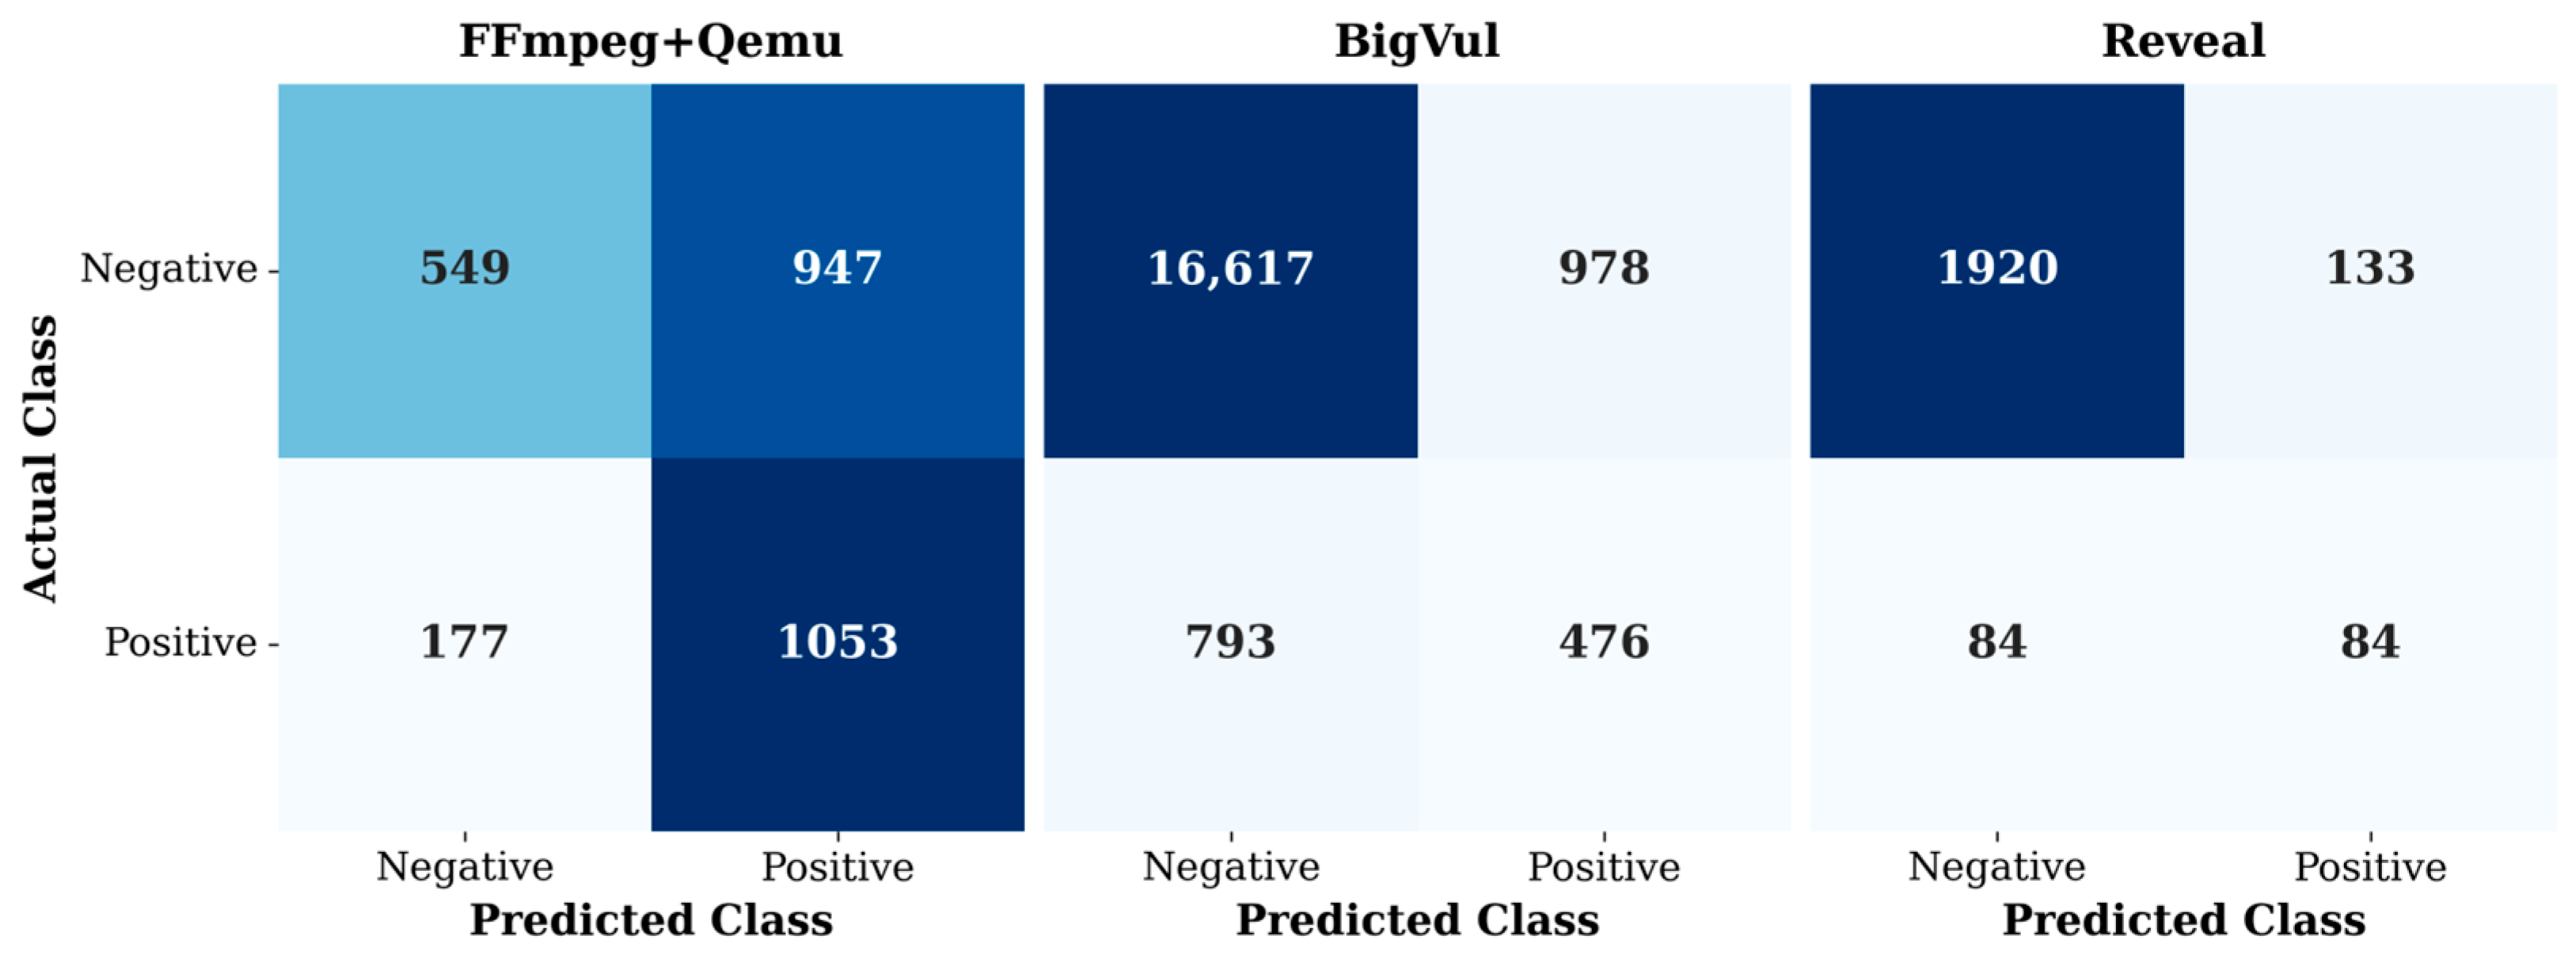
To visually and comprehensively illustrate this trade-off, we conducted a confusion matrix study across all three evaluated datasets, as shown in Figure 5. The matrices consistently demonstrate that CADetect maintains a remarkably low False Negative rate relative to the True Positives, prioritizing the capture of actual vulnerabilities. This trade-off mechanism perfectly aligns with the strict security requirements of real-world codebase auditing, where maximizing the detection of potential threats is the absolute priority.
Figure 5.
Precision–Recall trade-off analysis.
4.5. Analysis of Ablation Experiment Results
To investigate the specific contribution of each module to model performance, ablation experiments were conducted by sequentially removing the CEFM, the TSCN, and both modules simultaneously. All other settings remained consistent with the original model to isolate their respective impacts on overall model effectiveness. The ablation results for each module are presented in Table 5, where bold values indicate optimal performance.
Table 5.
Results of ablation experiments across various datasets.
As shown in Table 5, the CEFM enhances the model’s performance across all datasets. For instance, in terms of the F1 score, the model achieves improvements of 0.97%, 0.95%, and 4.66% on the FFmpeg+Qemu, BigVul, and Reveal datasets, respectively. This module optimizes node embeddings generated by the GCN through hierarchical clustering, enabling structurally similar code segments to cluster in the embedding space while separating unrelated nodes. Results demonstrate that the CEFM enhances graph representation learning by distinguishing node and edge types, thereby strengthening the model’s structural semantic awareness and improving vulnerability detection performance. This validates the effectiveness of the CEFM in modeling heterogeneous graph structures.
The TSCN concurrently employs multiple convolutional kernels to capture fine-grained syntactic features, local logical dependencies, and long-range dependencies within the code. Compared to variants without the TSCN, the model achieved F1 score improvements of 3.28%, 2.77%, and 2.7% on the FFmpeg+Qemu, BigVul, and Reveal datasets, respectively. When both the CEFM and TSCN were removed, the F1 scores of the model decreased by 4.74%, 3.89%, and 7.45% on the FFmpeg+Qemu, BigVul, and Reveal datasets, respectively. This reveals the synergistic effect between the two modules, where the structural awareness of the CEFM complements the multi-scale feature extraction of the TSCN. This demonstrates that both modules are indispensable for enhancing the model’s understanding of complex code structures, improving feature extraction, and optimizing overall performance. In summary, the ablation experiments confirm that combining the CEFM and TSCN effectively enhances the performance of vulnerability detection models.
4.6. Visual Analytics
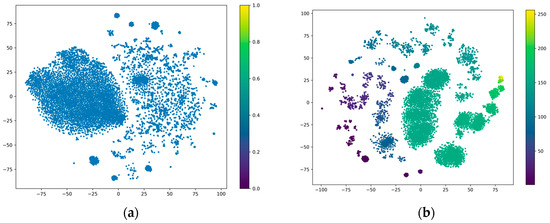
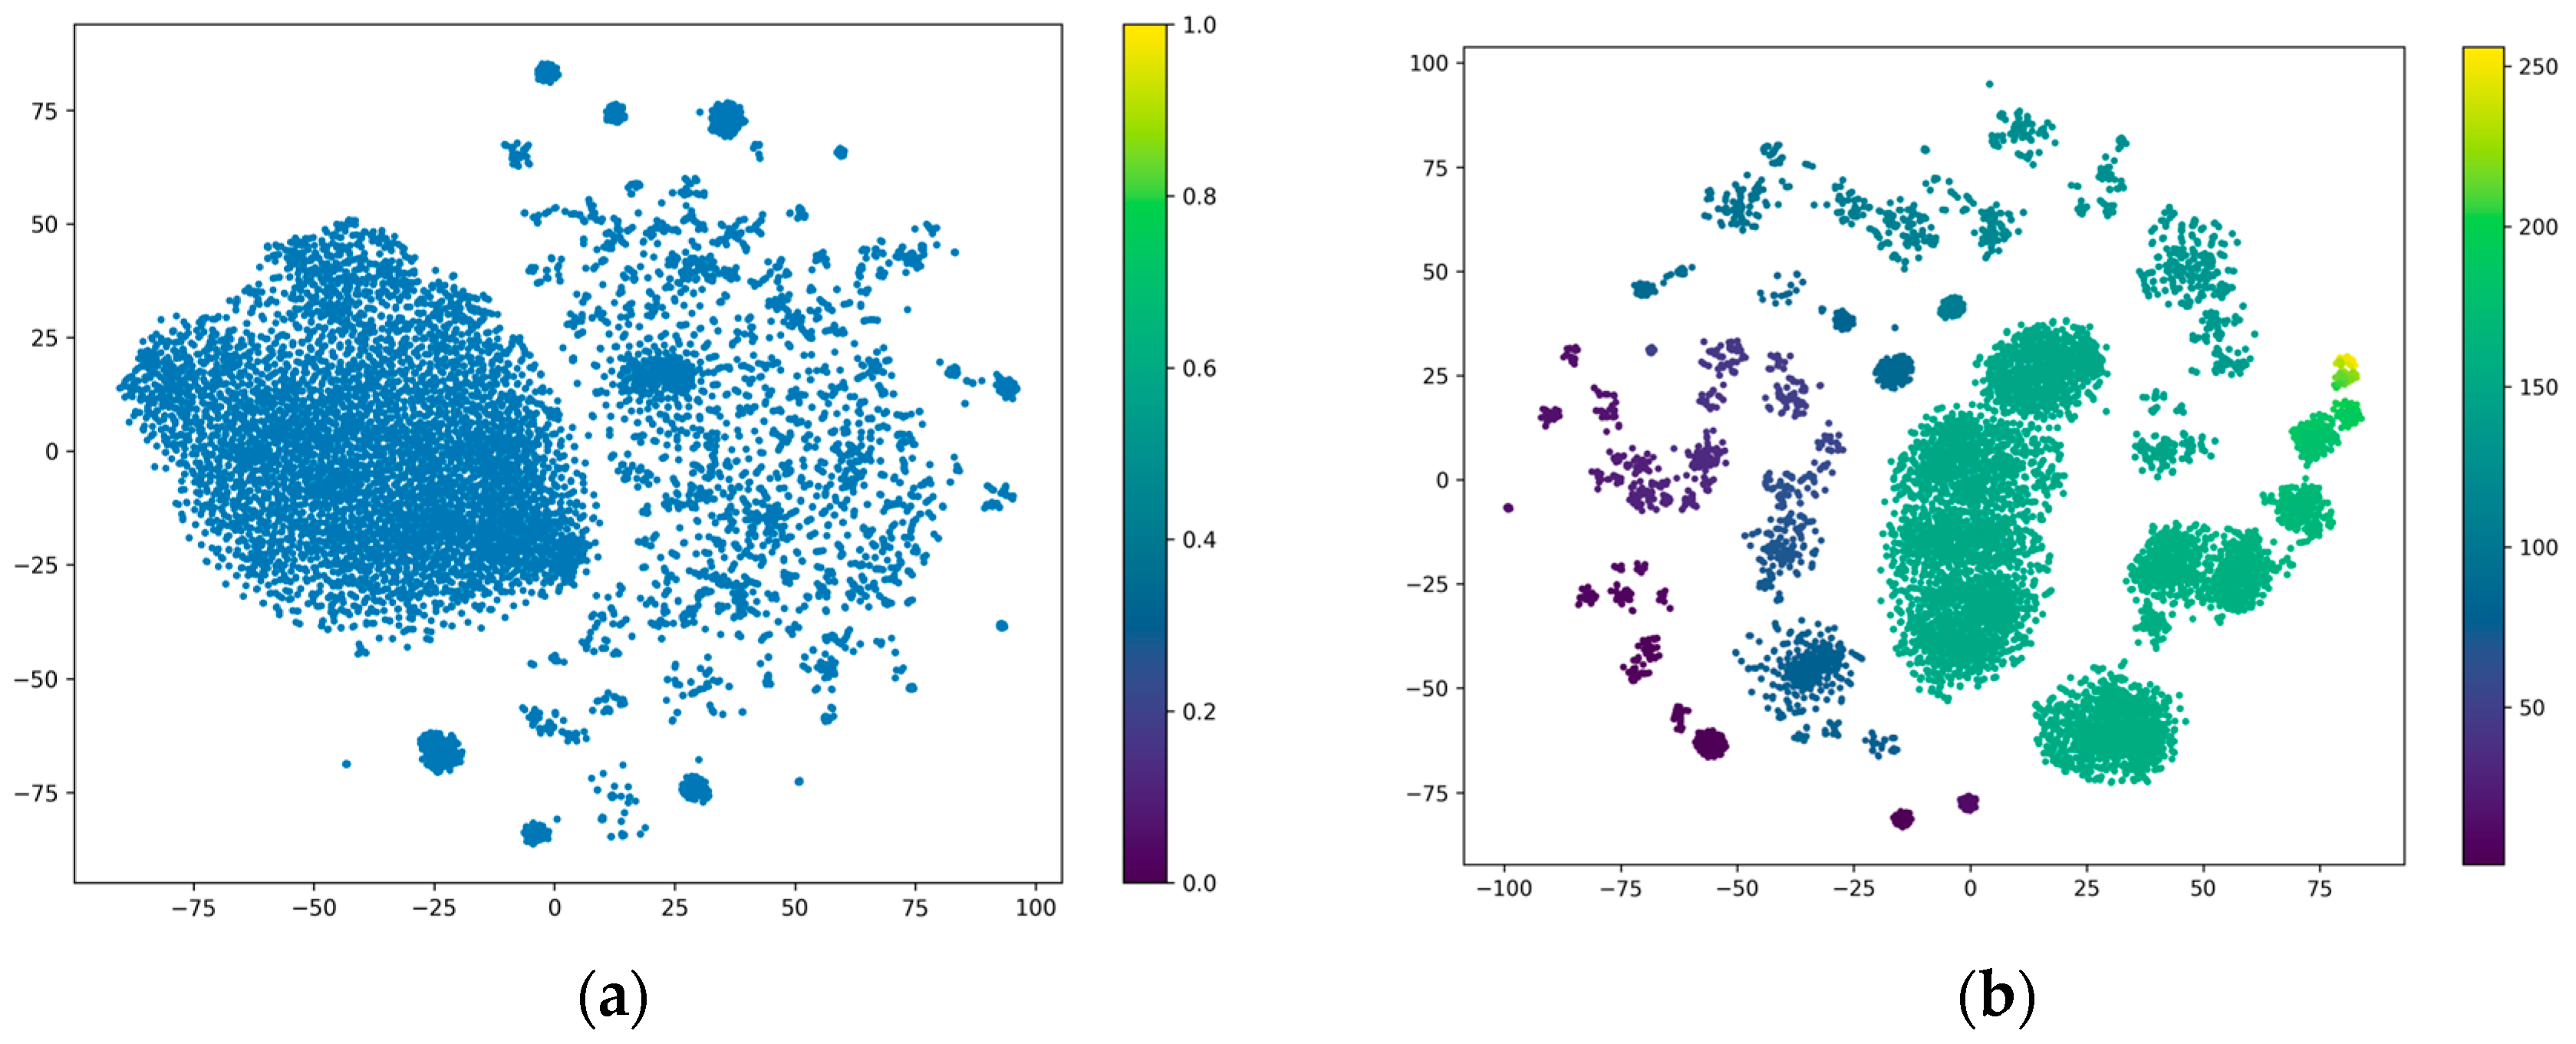
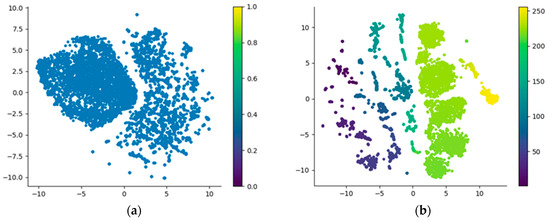
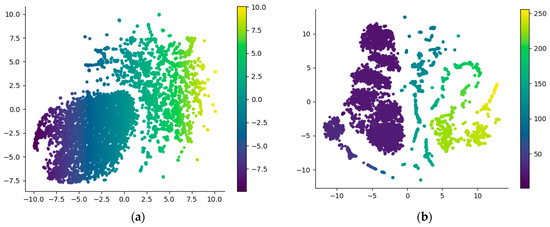
To further verify the effectiveness of CEFM in enhancing vulnerability features, we employed t-SNE to perform dimensionality reduction and visualization on the feature representations before and after clustering across three datasets: FFmpeg+Qemu, BigVul, and Reveal. The visualization results are shown in Figure 6, Figure 7 and Figure 8. Observations of the cluster structures reveal that nodes of the same type are aggregated into identical clusters, while nodes of different types form distinct boundaries, thereby better reflecting the heterogeneous relationships within code functions.
Figure 6.
Enhanced Feature Visualization on the FFmpeg+Qemu Dataset. (a) Feature distribution before clustering; (b) feature distribution after clustering.
Figure 7.
Enhanced Feature Visualization on the BigVul Dataset. (a) Feature distribution before clustering; (b) feature distribution after clustering.
Figure 8.
Enhanced Feature Visualization on the Reveal Dataset. (a) Feature distribution before clustering; (b) feature distribution after clustering.
Comparing pre- and post-clustering features reveals that before adding the CEFM, numerous nodes were distributed in a highly entangled manner, with even different node types failing to form distinct groupings. Heterogeneous code structure graphs are characterized by nodes and edges possessing different structural types, yet the pre-clustering features failed to reflect this heterogeneity. After incorporating the CEFM, node distributions form multiple distinct clusters, each representing specific node and edge types. The post-clustering cluster structure better reflects the intrinsic structured relationships between diverse nodes and edges in the code structure graph. This demonstrates that the CEFM effectively distinguishes between different node and edge types, enabling the model to capture more discriminative vulnerability features.
5. Discussion
5.1. Hyper-Parameter Sensitivity Analysis
This section explores the impact of the maximum number of clusters (threshold ) in the CEFM on the performance of CADetect. As illustrated in Table 6, the F1 scores across the three datasets exhibit a pronounced inverted U-shaped pattern as the threshold increases. This phenomenon can be attributed to the following two factors:
Table 6.
The impact of the maximum number of clusters on the performance of the proposed model.
Information Loss and Coarseness: When the threshold is set too small, the model achieves relatively low F1 scores. This is because an overly small forces nodes with distinct semantic types into the same cluster, which leads to the loss of critical vulnerability-related information and reduces the distinctiveness of the features.
Noise Interference and Complexity: Conversely, when the threshold is set too high, the code graph is not sufficiently simplified. The presence of excessive redundant nodes and structural noise makes it difficult for the model to learn the underlying vulnerability patterns, resulting in a decline in performance.
Empirical results demonstrate that setting the threshold to 30 allows CADetect to achieve the optimal balance between feature distinctiveness and structural integrity, yielding the best F1 scores of 65.20%, 43.64%, and 34.95% on the FFmpeg+Qemu, Reveal, and BigVul datasets, respectively.
5.2. Scalability of Hierarchical Clustering
Although hierarchical clustering with the weighted average method typically entails substantial computational overhead, its implementation in CADetect still exhibits favorable scalability. This efficiency primarily stems from a localized computing strategy: the clustering operation is strictly constrained to the local node set of a single function graph instead of the entire global graph. While some real-world software functions may yield exceptionally large heterogeneous graphs, statistical analysis of practical codebases (such as BigVul) reveals that the vast majority of functions maintain a bounded and manageable node count. Furthermore, during training and inference, graph processing is parallelized across mini-batches. Consequently, the quadratic scaling complexity is strictly confined to a micro-level limit per graph, preventing exponential memory or time consumption. As shown in Table 7, on the BigVul dataset, CADetect follows a lightweight architecture principle, and its average inference time is lower than that of AMPLE. This demonstrates that CADetect achieves significant performance breakthroughs at a minimal and acceptable time cost.
Table 7.
Comparison of resource consumption and performance across different models.
5.3. Impact of Convolutional Kernel Sizes
The Triple-Scale Convolutional Network (TSCN) utilizes convolutional kernels of varying sizes. To determine the most effective combination for vulnerability detection, we conducted validation experiments, with the results detailed in Table 8.
Table 8.
Performance comparison of different convolution kernel size combinations.
As shown in Table 8, the kernel combination achieves optimal performance across all datasets. Further analysis reveals that the interval between kernel sizes should be neither too narrow nor too wide. When the combination is tightened to , the F1 score on the BigVul dataset drops by 1.2%. This indicates that a maximum kernel size of 7 fails to provide a sufficiently broad receptive field, making it difficult for the model to capture the long-range global dependencies present in complex vulnerable code.
Conversely, excessively wide combinations, such as , also negatively impact performance. Although larger kernels can capture information from greater distances, they inevitably incorporate excessive irrelevant node features into the computation, which interferes with the ability of the model to precisely identify critical vulnerability patterns.
6. Conclusions
This paper proposes CADetect, a vulnerability detection model based on clustering-aware heterogeneous code graphs. By integrating a clustering algorithm with multi-scale convolutional kernels, the model leverages joint code structure graphs to detect vulnerabilities within source code functions. Its innovative design incorporates hierarchical clustering into the feature enhancement phase, enabling the optimization and constraint management of heterogeneous nodes and edges. Additionally, a composite convolutional network with multiple scales is designed to capture both local features and global dependencies within the code structure graph, significantly enhancing vulnerability detection efficiency and accuracy. Comparative and ablation experiments across three vulnerability datasets demonstrate the model’s enhanced detection performance. Future work will explore the integration of advanced Large Language Models (LLMs) to further optimize performance and enable fine-grained prediction of vulnerable lines of code, thereby elevating overall detection accuracy.
Author Contributions
All authors (S.L., L.W. and J.H.) contributed equally to the methodology, software, validation, formal analysis, data curation, visualization, and writing. All authors have read and agreed to the published version of the manuscript.
Funding
This work was supported by the National Natural Science Foundation of China (62067007), and the Guangxi Science and Technology Innovation Platform Program Project (Guike LT2600640001).
Data Availability Statement
The data is available upon request from the corresponding author.
Conflicts of Interest
The authors declare no conflicts of interest.
References
- Li, Z.; Zou, D.; Xu, S.; Ou, X.; Jin, H.; Wang, S.; Deng, Z.; Zhong, Y. VulDeePecker: A Deep Learning-Based System for Vulnerability Detection. In Proceedings of the 2018 Network and Distributed System Security Symposium, San Diego, CA, USA, 18–21 February 2018. [Google Scholar]
- Zhou, Y.; Liu, S.; Siow, J.; Du, X.; Liu, Y. Devign: Effective Vulnerability Identification by Learning Comprehensive Program Semantics via Graph Neural Networks. Adv. Neural Inf. Process. Syst. 2019, 32, 915. Available online: https://dl.acm.org/doi/10.5555/3454287.3455202 (accessed on 12 July 2026).
- Chakraborty, S.; Krishna, R.; Ding, Y.; Ray, B. Deep Learning Based Vulnerability Detection: Are We There Yet? IEEE Trans. Softw. Eng. 2020, 48, 3280–3296. [Google Scholar]
- Qiu, S.; Wang, S.; Tian, X.; Huang, M.; Huang, Q. Visualization-Based Software Defect Prediction via Convolutional Neural Network with Global Self-Attention. In Proceedings of the 2022 IEEE 22nd International Conference on Software Quality, Reliability and Security (QRS), Guangzhou, China, 5–9 December 2022; IEEE: Piscataway, NJ, USA, 2022; pp. 189–198. [Google Scholar]
- Yan, H.; Luo, S.; Pan, L.; Zhang, Y. HAN-BSVD: A Hierarchical Attention Network for Binary Software Vulnerability Detection. Comput. Secur. 2021, 108, 102286. [Google Scholar] [CrossRef] [Scilit]
- Bui, N.D.Q.; Wang, Y.; Hoi, S. Detect-Localize-Repair: A Unified Framework for Learning to Debug with CodeT5. In Proceedings of the Findings of the Association for Computational Linguistics: EMNLP 2022, Abu Dhabi, United Arab Emirates, 7–11 December 2022; Association for Computational Linguistics: Kerrville, TX, USA, 2022. [Google Scholar]
- Wang, Y.; Wang, W.; Joty, S.; Hoi, S.C.H. CodeT5: Identifier-Aware Unified Pre-Trained Encoder-Decoder Models for Code Understanding and Generation. In Proceedings of the 2021 Conference on Empirical Methods in Natural Language Processing, Punta Cana, Dominican Republic, 7–11 November 2021; Association for Computational Linguistics: Kerrville, TX, USA, 2021. [Google Scholar]
- Hin, D.; Kan, A.; Chen, H.; Babar, M.A. LineVD: Statement-Level Vulnerability Detection Using Graph Neural Networks. In Proceedings of the 19th International Conference on Mining Software Repositories; Association for Computing Machinery: New York, NY, USA, 2022. [Google Scholar]
- Xiao, W.; Hou, Z.; Wang, T.; Zhou, C.; Pan, C. MSGVUL: Multi-Semantic Integration Vulnerability Detection Based on Relational Graph Convolutional Neural Networks. Inf. Softw. Technol. 2024, 170, 107442. [Google Scholar] [CrossRef] [Scilit]
- Tang, G.; Yang, L.; Zhang, L.; Cao, W.; Meng, L.; He, H.; Kuang, H.; Yang, F.; Wang, H. An Attention-Based Automatic Vulnerability Detection Approach with GGNN. Int. J. Mach. Learn. Cyber. 2023, 14, 3113–3127. [Google Scholar] [CrossRef] [Scilit]
- Ling, M.; Tang, M.; Bian, D.; Lv, S.; Tang, Q. A Dual Graph Neural Networks Model Using Sequence Embedding as Graph Nodes for Vulnerability Detection. Inf. Softw. Technol. 2025, 177, 107581. [Google Scholar] [CrossRef] [Scilit]
- Tang, W.; Tang, M.; Ban, M.; Zhao, Z.; Feng, M. CSGVD: A Deep Learning Approach Combining Sequence and Graph Embedding for Source Code Vulnerability Detection. J. Syst. Softw. 2023, 199, 111623. [Google Scholar] [CrossRef] [Scilit]
- Tang, M.; Tang, W.; Gui, Q.; Hu, J.; Zhao, M. A Vulnerability Detection Algorithm Based on Residual Graph Attention Networks for Source Code Imbalance (RGAN). Expert Syst. Appl. 2024, 238, 122216. [Google Scholar] [CrossRef] [Scilit]
- Wen, X.-C.; Chen, Y.; Gao, C.; Zhang, H.; Zhang, J.M.; Liao, Q. Vulnerability Detection with Graph Simplification and Enhanced Graph Representation Learning. In Proceedings of the 2023 IEEE/ACM 45th International Conference on Software Engineering (ICSE), Melbourne, Australia, 14–20 May 2023; IEEE: Piscataway, NJ, USA, 2023; pp. 2275–2286. [Google Scholar]
- Wen, X.-C.; Gao, C.; Ye, J.; Li, Y.; Tian, Z.; Jia, Y.; Wang, X. Meta-Path Based Attentional Graph Learning Model for Vulnerability Detection. IEEE Trans. Softw. Eng. 2024, 50, 360–375. [Google Scholar] [CrossRef] [Scilit]
- He, H.; Wang, S.; Wang, Y.; Liu, K.; Yu, L. VulTR: Software Vulnerability Detection Model Based on Multi-Layer Key Feature Enhancement. Comput. Secur. 2025, 148, 104139. [Google Scholar] [CrossRef] [Scilit]
- Russell, R.; Kim, L.; Hamilton, L.; Lazovich, T.; Harer, J.; Ozdemir, O.; Ellingwood, P.; McConley, M. Automated Vulnerability Detection in Source Code Using Deep Representation Learning. In Proceedings of the 2018 17th IEEE International Conference on Machine Learning and Applications (ICMLA), Orlando, FL, USA, 17–20 December 2018; IEEE: Piscataway, NJ, USA, 2018; pp. 757–762. [Google Scholar]
- Li, Z.; Zou, D.; Xu, S.; Jin, H.; Zhu, Y.; Chen, Z. SySeVR: A Framework for Using Deep Learning to Detect Software Vulnerabilities. IEEE Trans. Dependable Secur. Comput. 2022, 19, 2244–2258. [Google Scholar] [CrossRef] [Scilit]
- Qiu, F.; Liu, Z.; Hu, X.; Xia, X.; Chen, G.; Wang, X. Vulnerability Detection via Multiple-Graph-Based Code Representation. IEEE Trans. Softw. Eng. 2024, 50, 2178–2199. [Google Scholar] [CrossRef] [Scilit]
- Yamaguchi, F.; Golde, N.; Arp, D.; Rieck, K. Modeling and Discovering Vulnerabilities with Code Property Graphs. In Proceedings of the 2014 IEEE Symposium on Security and Privacy, San Jose, CA, USA, 18–21 May 2014; IEEE: Piscataway, NJ, USA, 2014; pp. 590–604. [Google Scholar]
- Dong, Y.; Tang, Y.; Cheng, X.; Yang, Y.; Wang, S. SedSVD: Statement-level software vulnerability detection based on Relational Graph Convolutional Network with subgraph embedding. Inf. Softw. Technol. 2023, 158, 107168. [Google Scholar] [CrossRef] [Scilit]
- Tran, H.-C.; Tran, A.-D.; Le, K.-H. DetectVul: A Statement-Level Code Vulnerability Detection for Python. Future Gener. Comput. Syst. 2025, 163, 107504. [Google Scholar] [CrossRef] [Scilit]
- Li, Y.; Wang, S.; Nguyen, T.N. Vulnerability Detection with Fine-Grained Interpretations. In Proceedings of the 29th ACM Joint Meeting on European Software Engineering Conference and Symposium on the Foundations of Software Engineering, Athens, Greece, 20 August 2021; pp. 292–303. [Google Scholar]
- Ressi, D.; Romanello, R.; Rossi, S.; Piazza, C. Compressing Neural Networks via Formal Methods. Neural Netw. 2024, 178, 106411. [Google Scholar] [CrossRef] [Scilit] [PubMed]
- Fan, J.; Li, Y.; Wang, S.; Nguyen, T.N. A C/C++ Code Vulnerability Dataset with Code Changes and CVE Summaries. In Proceedings of the 17th International Conference on Mining Software Repositories, Seoul, Republic of Korea, 29–30 June 2020; ACM: New York, NY, USA, 2020; pp. 508–512. [Google Scholar]
- Paszke, A.; Gross, S.; Massa, F.; Lerer, A.; Bradbury, J.; Chanan, G.; Killeen, T.; Lin, Z.; Gimelshein, N.; Antiga, L.; et al. PyTorch: An Imperative Style, High-Performance Deep Learning Library. Adv. Neural Inf. Process. Syst. 2019, 32. [Google Scholar] [CrossRef] [Scilit]
- Wang, M.; Zheng, D.; Ye, Z.; Gan, Q.; Li, M.; Song, X.; Zhou, J.; Ma, C.; Yu, L.; Gai, Y.; et al. Deep Graph Library: A Graph-Centric, Highly-Performant Package for Graph Neural Networks. arXiv 2019, arXiv:1909.01315. [Google Scholar]

Disclaimer/Publisher’s Note: The statements, opinions and data contained in all publications are solely those of the individual author(s) and contributor(s) and not of MDPI and/or the editor(s). MDPI and/or the editor(s) disclaim responsibility for any injury to people or property resulting from any ideas, methods, instructions or products referred to in the content. |
© 2026 by the authors. Licensee MDPI, Basel, Switzerland. This article is an open access article distributed under the terms and conditions of the Creative Commons Attribution (CC BY) license.