


Abstract
The creation of Basic Probability Assignment (BPA) still represents a basic problem in the Dempster-Shafer (D-S) theory of evidence especially when it comes to representing continuous uncertainty and class ambiguity. In order to overcome this problem, this paper suggests a BPA construction model depending on Gaussian overlap. The main principle behind the approach is the creation of focal elements based on the overlaps between conditional probability distributions of classes, allowing characterisation of uncertainty in a data driven manner. Namely, attribute level evidence is represented by Gaussian distributions, and singleton and composite focal elements are composite focal elements are generated through Gaussian product responses and normalized to obtain BPAs. Composite focal elements are further projected into singleton-level decision scores through proportional belief and plausibility transformations for decision-making and attribute-weight calculation. Moreover, to dynamically modify the role played by different attributes, a Kullback-Leibler (KL) divergence-based weighting scheme is used. These parts combine to form a full pipeline of continuous evidence modeling to BPA generation as proposed by the given method. The experimental results show that the proposed method achieves 98.00 ± 2.67% accuracy on the Iris dataset, 97.21 ± 1.76% accuracy on the Wine dataset, and 90.86 ± 1.20% accuracy on the Breast Cancer Wisconsin dataset. Compared with existing BPA generation methods, the proposed method obtains the best performance on the Iris and Wine datasets. Compared with classical machine learning models, the method also achieves the highest accuracy on the Iris dataset and remains competitive on the Wine and Breast Cancer Wisconsin datasets.
1. Introduction
Dempster–Shafer (D–S) evidence theory [1,2,3] has been widely applied in uncertainty reasoning and information fusion due to its ability to handle incomplete [4,5,6,7,8], and conflicting information [9,10,11,12]. As a core component of D–S theory, the construction of basic probability assignments (BPAs) plays a critical role in evidence combination and decision-making. However, generating reliable BPAs remains a challenging task, particularly in data-driven scenarios where uncertainty is continuous and difficult to represent using discrete or heuristic rules.
Existing BPA generation methods are mainly based on distance measures, interval representations [13,14,15], or data-driven techniques [16] such as k-nearest neighbors and cloud models. Although these approaches have demonstrated effectiveness in specific applications, they often rely on predefined rules or empirical assumptions and lack a clear connection to the underlying data distribution. In particular, the construction of composite propositions is typically handled in an indirect manner, which limits the interpretability of the resulting BPAs, especially in the presence of class ambiguity and overlapping evidence.
To overcome these constraints, this paper suggests a Gaussian-overlap-based framework to generate BPA. The suggested method uses Gaussian distributions to model evidences at the attribute level to represent uncertainty continuously. Moreover, it directly employs the overlap between class-conditional distributions to build focal elements, i.e., singleton propositions are created in areas of low overlap whereas compound propositions are obtained in overlapping areas through Gaussian product modeling. The mechanism of these overlaps allows generating multi-focal elements in a data-driven manner and directly correlates distribution features with the BPA construction.
Besides, composite propositions are converted into singleton representations through proportional belief and proportional plausibility transformations to simplify the next stages of processing. Also, the adopted adaptive strategy of weighting uses KL-divergence to adaptively change the contribution of attributes. These elements combined form a unified BPA construction framework. Experimental data on standard datasets show that the proposed approach successfully represents uncertainty and performs competitively relative to other methods.
In addition, the conventional synthesis rule can also cause the conflict paradox phenomenon [17,18,19,20] in a high-conflict evidence setting, which puts the stability and reasonableness of the algorithm at risk. D-S evidence theory has become a valuable supporting tool [20] in the area of complex information fusion because of its distinctive benefits when dealing with uncertain information of various sources [21]. The further optimization of the BPA mechanisms and efficient deployment will be vital in developing and applying the theory in practice.
Conclusively, this paper offers a unified framework of BPA generation in Dempster-Shafer evidence theory in terms of the continuous uncertainty modeling. In contrast to the traditional methods that are based on distance measures or the interval representations, the proposed method uses Gaussian distributions to model attribute-level evidence allowing describing uncertainty in a continuous and probabilistic way. With such a representation, a Gaussian-overlap-driven mechanism is designed to build both singleton and composite propositions, and overlapping regions naturally produce multi-focal elements. In order to make the generated evidence more usable, a proportional belief and proportional plausibility transformation scheme is developed to convert composite propositions into singleton representations. Also, a KL-divergence-based weighting strategy is used to quantify attribute discriminability and adaptively modify their contributions. By integrating these components, a complete BPA construction pipeline is established. Extensive experiments on multiple benchmark datasets demonstrate the effectiveness and stability of the proposed method.
The remainder of this paper is organized as follows. Section 2 introduces the basic concepts of D-S evidence theory. Section 3 presents the proposed BPA generation framework based on Gaussian overlap modeling, proportional transformation, and KL-divergence-based attribute weighting. Section 4 reports the experimental setup, comparison results, and performance analysis on benchmark datasets. Finally, Section 5 summarizes the main findings and discusses the limitations and future research directions.
2. D-S Evidence Theory
Definition 1: Recognition framework.
If is a finite set of mutually exclusive elements, this construction is known as a recognition frame.
The set consisting of elements formed by the power set of under condition is
Definition 2: Basic probability assignment (BPA).
If is a recognition frame, the power set of will combine into a set of propositions if the function satisfies the following two conditions:
Let m be the BPA, and let m(A) be the basic probability number of proposition A. Here, A is called a focal element of the power set if (m(A) > 0). The value m(A) can be used to measure the reliability of a particular situation, i.e., the mass function, which serves as the confidence level for the precise assignment to (A).
Definition 3: Dempster combination rule.
Consider two mutually independent bodies of evidence within the recognition frame, denoted as and , with corresponding focal elements and , respectively. The Dempster combination rule can be expressed as follows:
where
is known as the conflict coefficient. It serves as a measure of the degree of contradiction between the pieces of evidence. Specifically, K is the sum of the confidence levels of conflicting combinations of the underlying assumptions and quantifies the degree of conflict among multiple sources of evidence. Its value range is [0, 1]. A larger value indicates a more significant contradiction among the bodies of evidence. When , it signifies that the evidence is completely conflicting and cannot be fused.
3. Methodology
3.1. Gaussian Distribution
The Gaussian distribution, also known as the normal distribution, is a widely used probability distribution that characterizes the distribution of data and statistical patterns. According to the Central Limit Theorem, even if the original data does not follow a normal distribution, the distribution of its sample mean will converge to a Gaussian distribution as long as the sample size is sufficiently large. This result holds under the condition that the overall distribution pattern is independent, highlighting the central importance of the normal distribution in statistical inference.
The Gaussian distribution describes a continuous random variable X with two parameters and , where denotes the mean and denotes the variance. The distribution can be denoted as , and its probability density function is
where
The product of Gaussian functions still satisfies the Gaussian distribution and can be used to describe the joint probability distribution of multiple independent random variables. Therefore, when using Gaussian functions to construct the BPA model in D-S evidence theory, overlapping parts will occur in the constructed model, indicating uncertainty and ambiguity. As a result, this paper employs the product of multiple Gaussian functions in the overlapping regions to generate a new Gaussian distribution, whose joint mean and joint variance optimize the weight of information and uncertainty.
In the BPA construction, the product of multiple Gaussian distributions defines the focal elements of the overlapping region, generating multi-focal propositions that represent the probability of sample values belonging to each single-focal proposition, as well as the degree of overlap and reliability of the individual single-focal elements. This illustrates the intuitive principle of “consensus-enhanced confidence” and supports the D-S evidence combination. Using this method in D-S theory merges the rigor of probability statistics with the flexibility of evidence theory.
Given the probability distributions of two independent Gaussian distributions, . If is the probability distribution of is the probability distribution of , then:
A more intuitive expression can be obtained by combining the constant terms in Equation (6) as , as shown in Equation (7):
where
As a scaling factor, the integral of the multiplied probability density of is not equal to 1, i.e., , but the properties of its variance and mean remain unchanged. Thus, the product of two Gaussian distributions continues to obey the Gaussian distribution. The Gaussian function model constructed through this scaling factor avoids the possibility of being scaled up after multiplication, thus . Therefore, the BPA function is generated by using the Gaussian function model after multiplication to compute the function values of its multi-focal elements.
In this study, Gaussian distributions are used as a parametric approximation of class-conditional attribute distributions, rather than as a strict assumption that all real-world features follow a normal distribution. The main reason for adopting Gaussian modeling is its analytical tractability. Specifically, the product of Gaussian functions has a closed-form expression, which enables the overlap between class-conditional distributions to be explicitly calculated and mapped to composite focal elements in the D-S evidence framework.
However, we acknowledge that real-world data may be skewed, multimodal, or heavy-tailed. In such cases, the Gaussian approximation may lead to biased overlap estimation and affect the generated BPAs. Non-parametric methods such as Kernel Density Estimation can provide more flexible density modeling, but they require bandwidth selection, are sensitive to sample size, and lack the simple closed-form overlap representation used in the present method. Therefore, KDE-or Gaussian-mixture-based BPA generation will be investigated in future work.
3.2. Daniel’s Scale Conversion Method
Daniel [22] proposed the proportional reliability conversion formula and proportional likelihood conversion formula:
This probability reassignment is achieved by analyzing the proportion of confidence that single propositions contribute within composite propositions. However, its optimistic transformation strategy may introduce heightened uncertainty risks in decision-making processes.
The formula for the proportional likelihood conversion is
This probability reassignment is accomplished by evaluating the likelihood distribution of single propositions within composite propositions. However, its conservative transformation strategy may constrain strategic refinement in decision-making processes.
3.3. KL Divergence
In probability and information theory [23,24], the Kullback–Leibler divergence (KL divergence, abbreviated as KLD) is a measure of the difference between two probability distributions, P and Q. A smaller difference indicates a higher weight assigned. For two continuous probability distributions P and Q, the KL divergence is defined as:
where
In information theory, KL divergence quantifies the loss of information that occurs when the true distribution P is approximated by the distribution Q. It measures the degree of difference between the two probability distributions, where P represents the actual probability distribution and Q serves as its approximate representation. Thus, the essence of KL divergence lies in assessing the difference between two distributions, making it an important mathematical tool for uncertainty modeling and statistical analysis.
In this study, the direction of KL divergence is explicitly fixed. The normalized original singleton support distribution X is regarded as the reference distribution P, and the transformed distribution obtained by the proportional belief or proportional plausibility transformation is regarded as the approximating distribution Q. Therefore, the divergence is calculated as , rather than ). This setting is consistent with the interpretation of KL divergence as the information loss incurred when is used to approximate X.
3.4. BPA Generation Procedure
3.4.1. Overall Procedure Description
The proposed approach in this paper is a Basic Probability Assignment Generation based on Gaussian Overlap Modeling to apply to the D-S Evidence Theory. The general steps involved in this approach are:
- (1)
- The evidence representation based on Gaussian distributions.
To represent the attributes of the training data, Gaussian distributions are built considering various classes to describe the attributes of the underlying data. It is a continuous representation of uncertainty at the attribute level. Singleton propositions are created in areas of well-separated class distributions with individual Gaussian models. On the other hand, composite propositions are formed in areas of high overlap between class distributions by multiplying several Gaussian functions allowing a distribution-based creation of multi-focal elements.
It should be noted that the proposed framework adopts univariate Gaussian modeling at the attribute level rather than calculating the full multidimensional overlap between multivariate class-conditional distributions. Each attribute is regarded as an individual evidence source before Dempster fusion, and its one-dimensional Gaussian overlap is used to generate the corresponding attribute-level BPA. Therefore, the method implicitly assumes that attribute-level evidence sources are independent or weakly dependent. The KL-divergence-based weighting strategy evaluates the reliability of each attribute-level BPA, but it does not explicitly model the covariance structure among attributes. This design improves interpretability and computational efficiency, making the proposed framework more suitable for low- and medium-dimensional tabular datasets. For high-dimensional datasets with strongly correlated or redundant features, feature selection or dimensionality reduction, such as PCA-based preprocessing, is recommended before applying the proposed BPA generation method.
No manually specified overlap threshold τ is used in this process. The mass assigned to a composite proposition is determined by the continuous Gaussian-product response and subsequent normalization, rather than by a binary threshold-based decision.
- (2)
- The evidence representation based on Gaussian distributions.
The responses of the test sample are analyzed using the given Gaussian models. Support degrees of singleton and composite subsets are derived by evaluating the corresponding function values across each individual class distribution as well as the overlapping region. This is the step that sets up a systematic mapping between continuous attribute observations and the D-S propositions space.
- (3)
- Conversion of composite statements to singleton representations. Decision-oriented projection of composite propositions.
To In order to allow the next stage of fusion and decision-making the composite propositions formed by overlapping areas are also converted into singleton-based representations. The proportional belief and proportional plausibility transformations are not used to eliminate these composite focal elements. Instead, they serve as decision-oriented projections that redistribute the mass of composite propositions into singleton-level decision scores when a crisp classification output or attribute-level weighting is required. while partially preserving the uncertainty information through belief- and plausibility-guided redistribution.
- (4)
- KL divergence based on attribute weighting.
To put a number to the uniformity of singleton evidence and the transformed probability representation, a measure of distributional difference that is used is Kullback-Leibler (KL) divergence. With a lower divergence implying a greater uniformity and reliability, it is the inverse of the KL divergence that is adopted to find the attribute weights. The mechanism allows the dynamic change of attribute contributions to the BPA generation process. as represented by the formula:
- (5)
- A unified BPA construction framework.
By A unified BPA construction framework is set up by combining Gaussian-based evidence modeling, overlap-driven proposition generation, proportional transformation, and KL-divergence-based weighting. The framework gives a systematic and interpretable method of converting continuous evidence to BPA representations in the D-S theory.
- (6)
- The weighted evidence is aggregated to construct the final BPA.
3.4.2. Algorithm Implementation
For clarity and reproducibility, the detailed implementation of the proposed BPA generation method is presented in Algorithm 1.
| Algorithm 1. BPA generation based on Gaussian overlap modeling |
|
Computational complexity analysis:
Let N be the number of samples, D be the number of attributes, and C be the number of classes. In the proposed framework, the estimation of Gaussian parameters for all class-conditional attribute distributions requires O(ND) time. For each attribute, singleton evidence responses are calculated for C classes, and composite evidence responses are calculated for class pairings, which requires O(C2) operations. Therefore, the overlap-based BPA generation process for all samples has a dominant time complexity of O(NDC2).
The proportional belief and proportional plausibility transformations redistribute the mass of composite focal elements to singleton-level decision representations, and their complexity is also bounded by O(NDC2). The KL-divergence-based weighting is calculated over the transformed singleton distributions and does not exceed this order. After the projection into singleton-level representations, Dempster fusion is performed on the attribute-level BPAs, and its computational cost is lower than or comparable to the BPA generation step.
Therefore, the overall computational complexity of the proposed method is O(NDC2), and the storage complexity is O(DC2) for storing the Gaussian parameters and pairwise overlap-related quantities. This shows that the proposed method scales linearly with the number of samples and attributes, and quadratically with the number of classes. The method is therefore computationally feasible for low- and medium-dimensional tabular datasets with a moderate number of classes.
In practical implementation, the composite focal elements are mainly constructed from pairwise class overlaps, rather than exhaustively enumerating all subsets of the frame of discernment.
To demonstrate the implementation process of the method proposed in this paper, the Iris dataset serves as an example for a detailed explanation. This dataset comprises three categories: Setosa, Versicolor, and Virginica, which will be used as components of the recognition framework. Each category contains 50 samples, totaling 150 samples. Each sample has four features (denoted as t = 4): sepal length (SL), sepal width (SW), petal length (PL), and petal width (PW). In the experimental design, 40 samples (N = 40) were randomly selected from each category to construct the training set, while the remaining samples were reserved for testing. Taking a sample from the Se category as the object to be recognized and using SL as the feature, this paper details the simulation process and key implementation details of the proposed method as follows.
Step 1: The overlap among Gaussian distributions of different classes.
Since the product of Gaussian functions adheres to the Gaussian distribution, the product of Gaussian distributions can be used to describe the joint probability distribution of multiple independent random variables. In D-S evidence theory, the constructed models inherently contain overlapping regions, signifying intrinsic uncertainty and fuzziness. To address this issue, a product-of-Gaussians approach is employed in the overlapping parts to generate a new Gaussian distribution. The resulting joint mean and joint variance optimally balance information weighting and uncertainty reduction. The BPA construct defines the focal elements of the overlapping regions, illustrating the intuitive principle of “consensus-enhanced confidence” and supporting the combination of D-S evidence. Thus, using this method in D-S theory combines the rigor of probability statistics with the flexibility of evidence theory.
Taking the attribute SL as an example, Equation (5) is used to find the mean and the variance of the three categories in the training set, while Equations (7) and (8) are used to build multiple Gaussian product distribution curves. The scaling factor for hierarchically related categories is derived using Equation (8).
First, taking the hierarchically related classes m(Se,Ve) under the attribute SL as an example, the joint mean, joint variance, and scaling factor for m(Se,Ve) are derived based on the means and variances computed separately for classes Se and Ve under this attribute. The computational results are as follows:
Following these steps, the mean, variance, and scaling factor of both single and hierarchically related categories under SL attributes were calculated; the results are shown in Table 1.
Table 1.
Means, variances, and scaling factors for each category under SL attributes.
The categories Se, Ve, and Vi do not have hierarchically related categories and consist of single categories, making them single-focal-element propositions. Therefore, there is no need to compute their scaling factors. The remaining multiple categories have hierarchically related categories and are classified as multi-focal-element propositions. Consequently, the product of multiple Gaussian distributions is calculated. Equation (8) is used to compute the joint mean, joint variance, and scaling factors for these categories. The multi-focal-element model function is constructed by fusing the products of their corresponding single-focal-element model functions. This formulation represents the probability of a sample belonging to multiple single-element subsets while also capturing the intersection relationships among these subsets and their confidence levels.
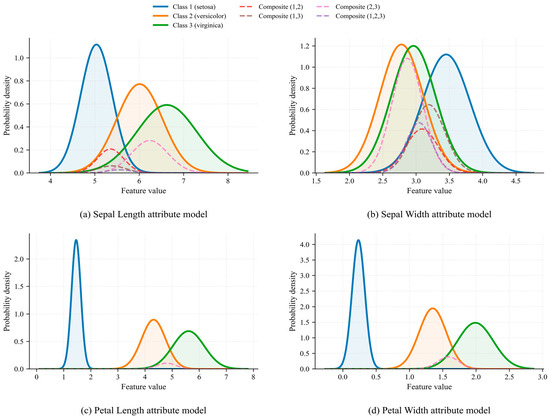
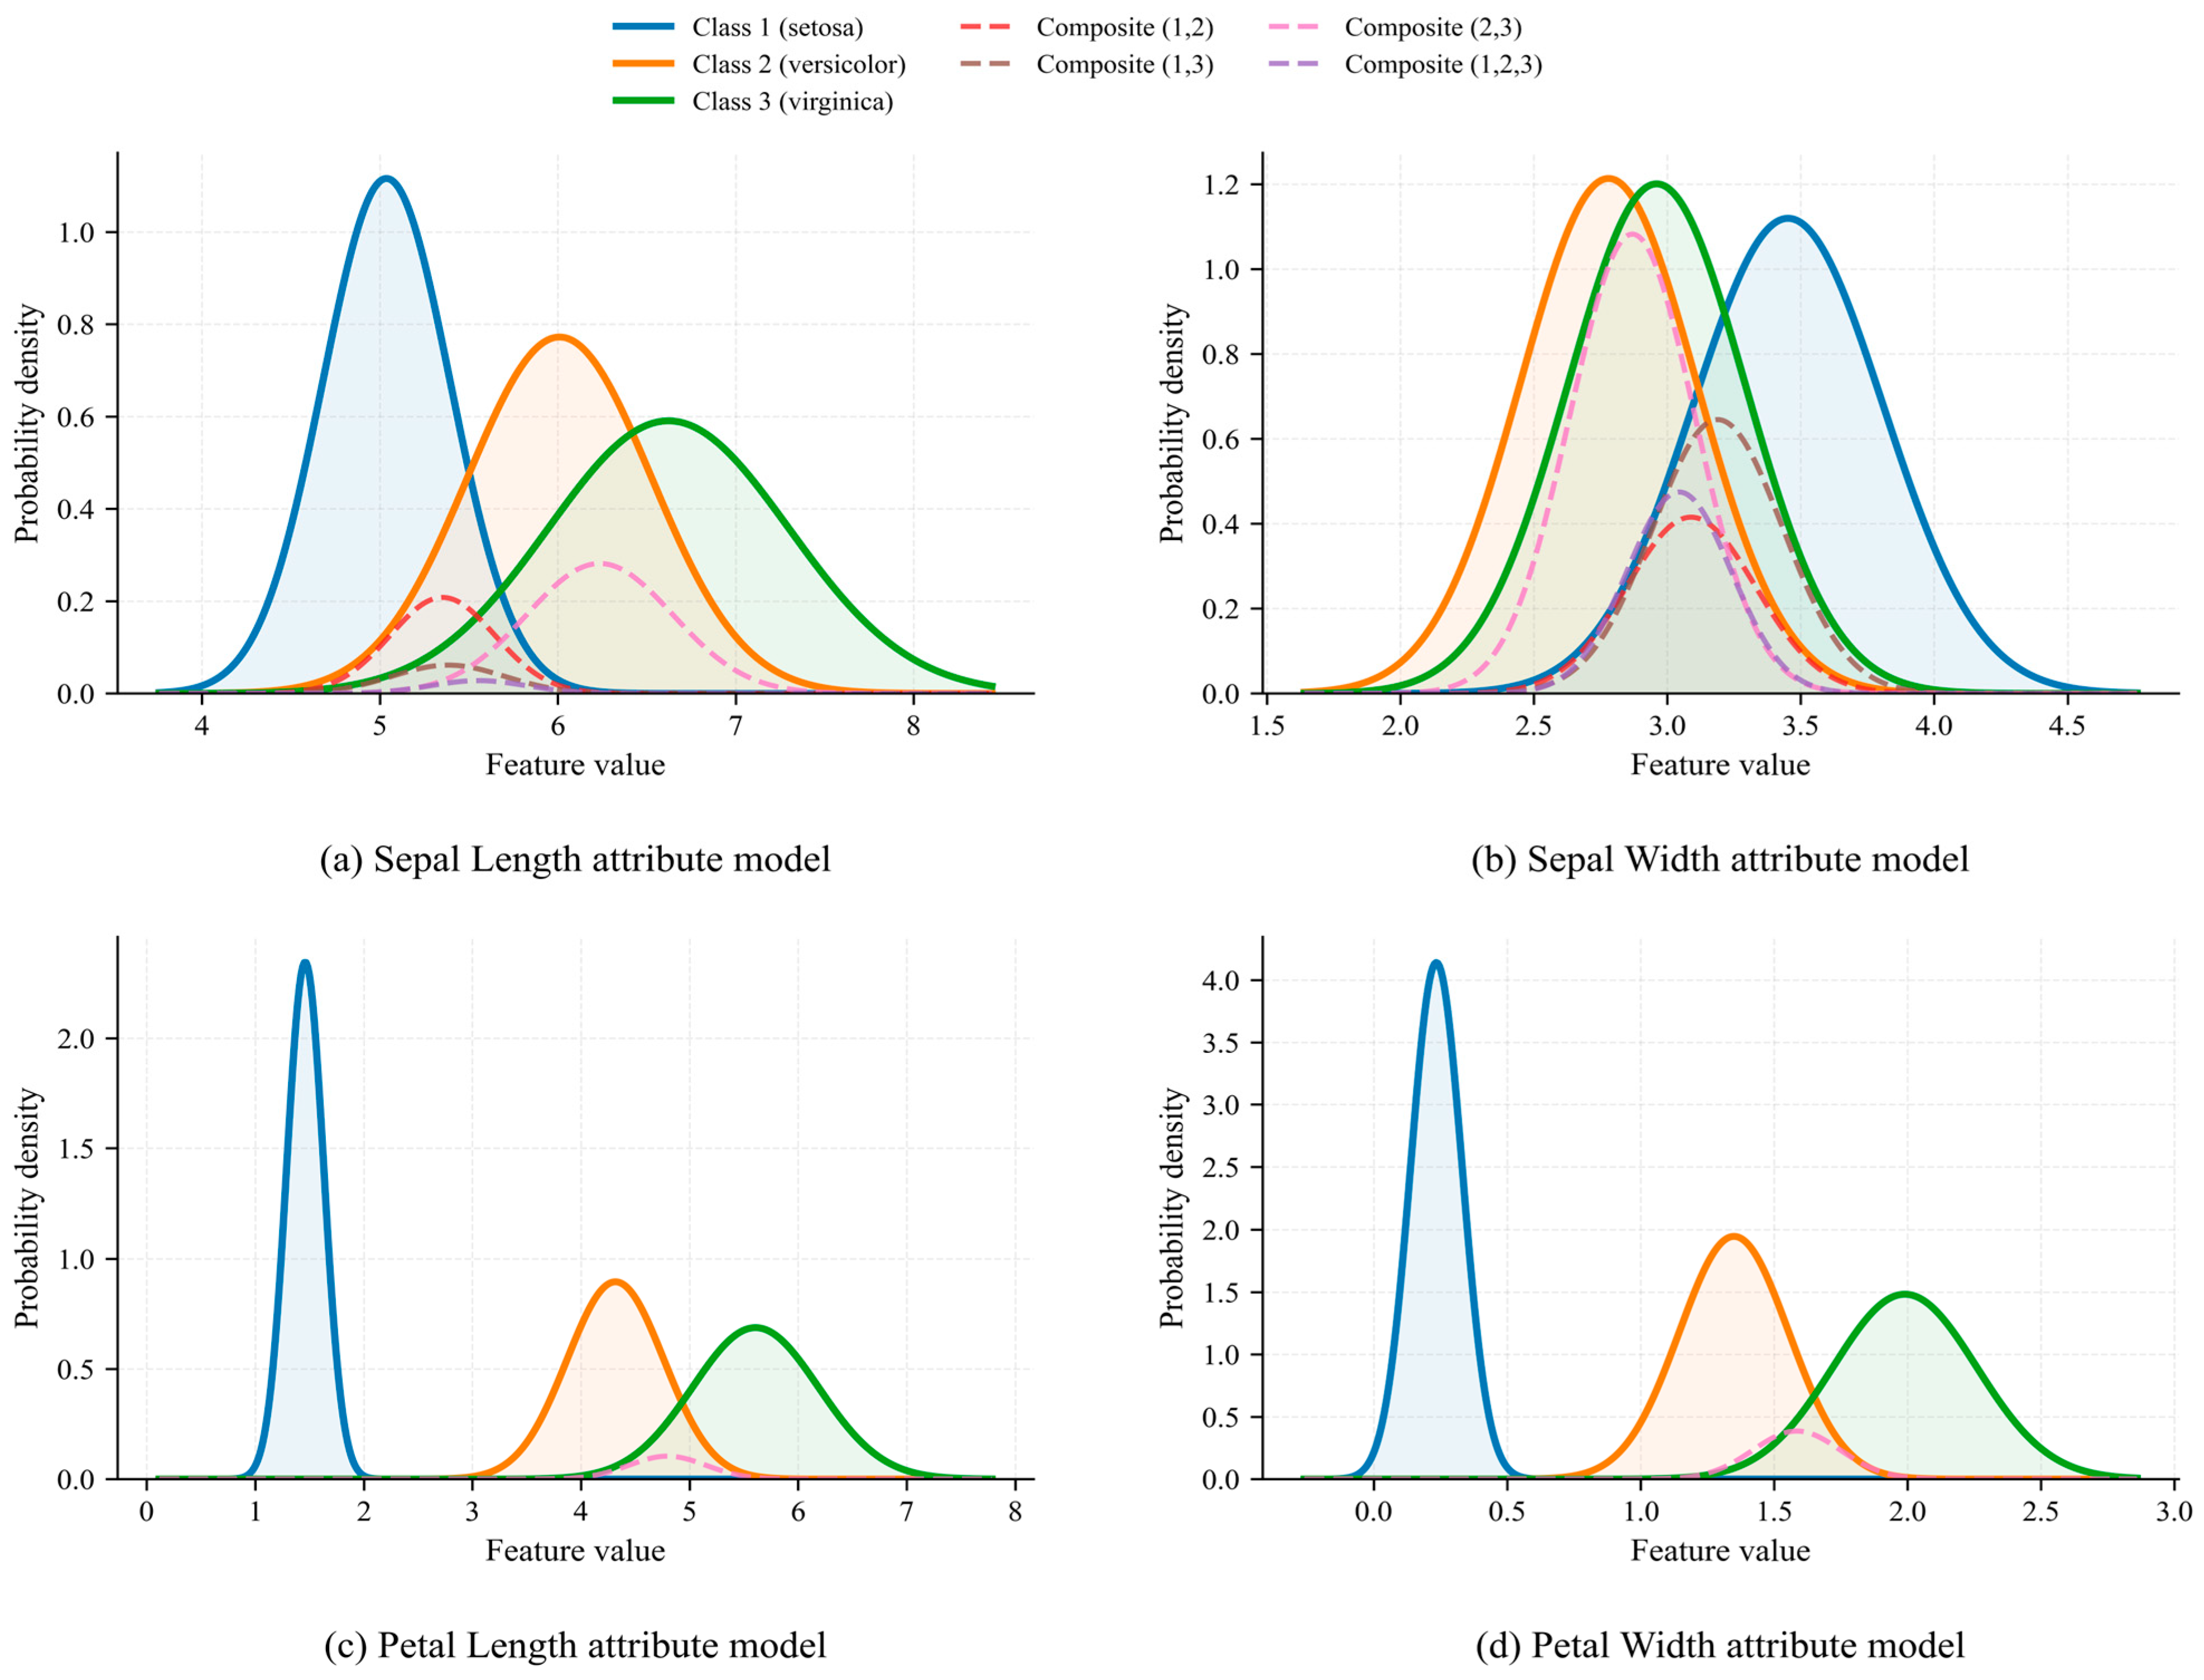
Next, the data presented in Table 1 was used to construct a Gaussian distribution curve under the SL attribute, as illustrated in Figure 1a. Similar computational steps and processes are followed to establish Gaussian distribution curves for each attribute, as depicted in Figure 1.
Figure 1.
Gaussian distribution curves for each attribute of Iris dataset.
As shown in Figure 1, the petal length and petal width attributes exhibit much smaller inter-class overlap than sepal length and sepal width, indicating stronger discriminative ability. This difference is also reflected in the attribute-level BPA results. For the tested Iris sample, the BPAs generated from petal length and petal width assign nearly all belief mass to the correct singleton class, whereas sepal-related attributes produce more ambiguous evidence due to larger distributional overlap. Therefore, petal attributes are not manually emphasized in the proposed framework; instead, their stronger contribution is automatically reflected through lower overlap, stronger singleton evidence, and the subsequent attribute-level weighting process.
Step 2: Match the Gaussian function values of samples to be tested.
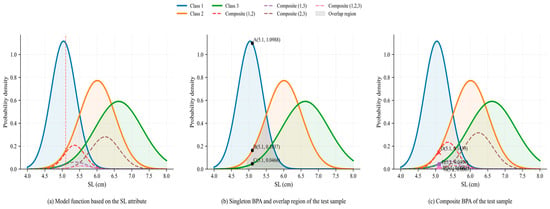
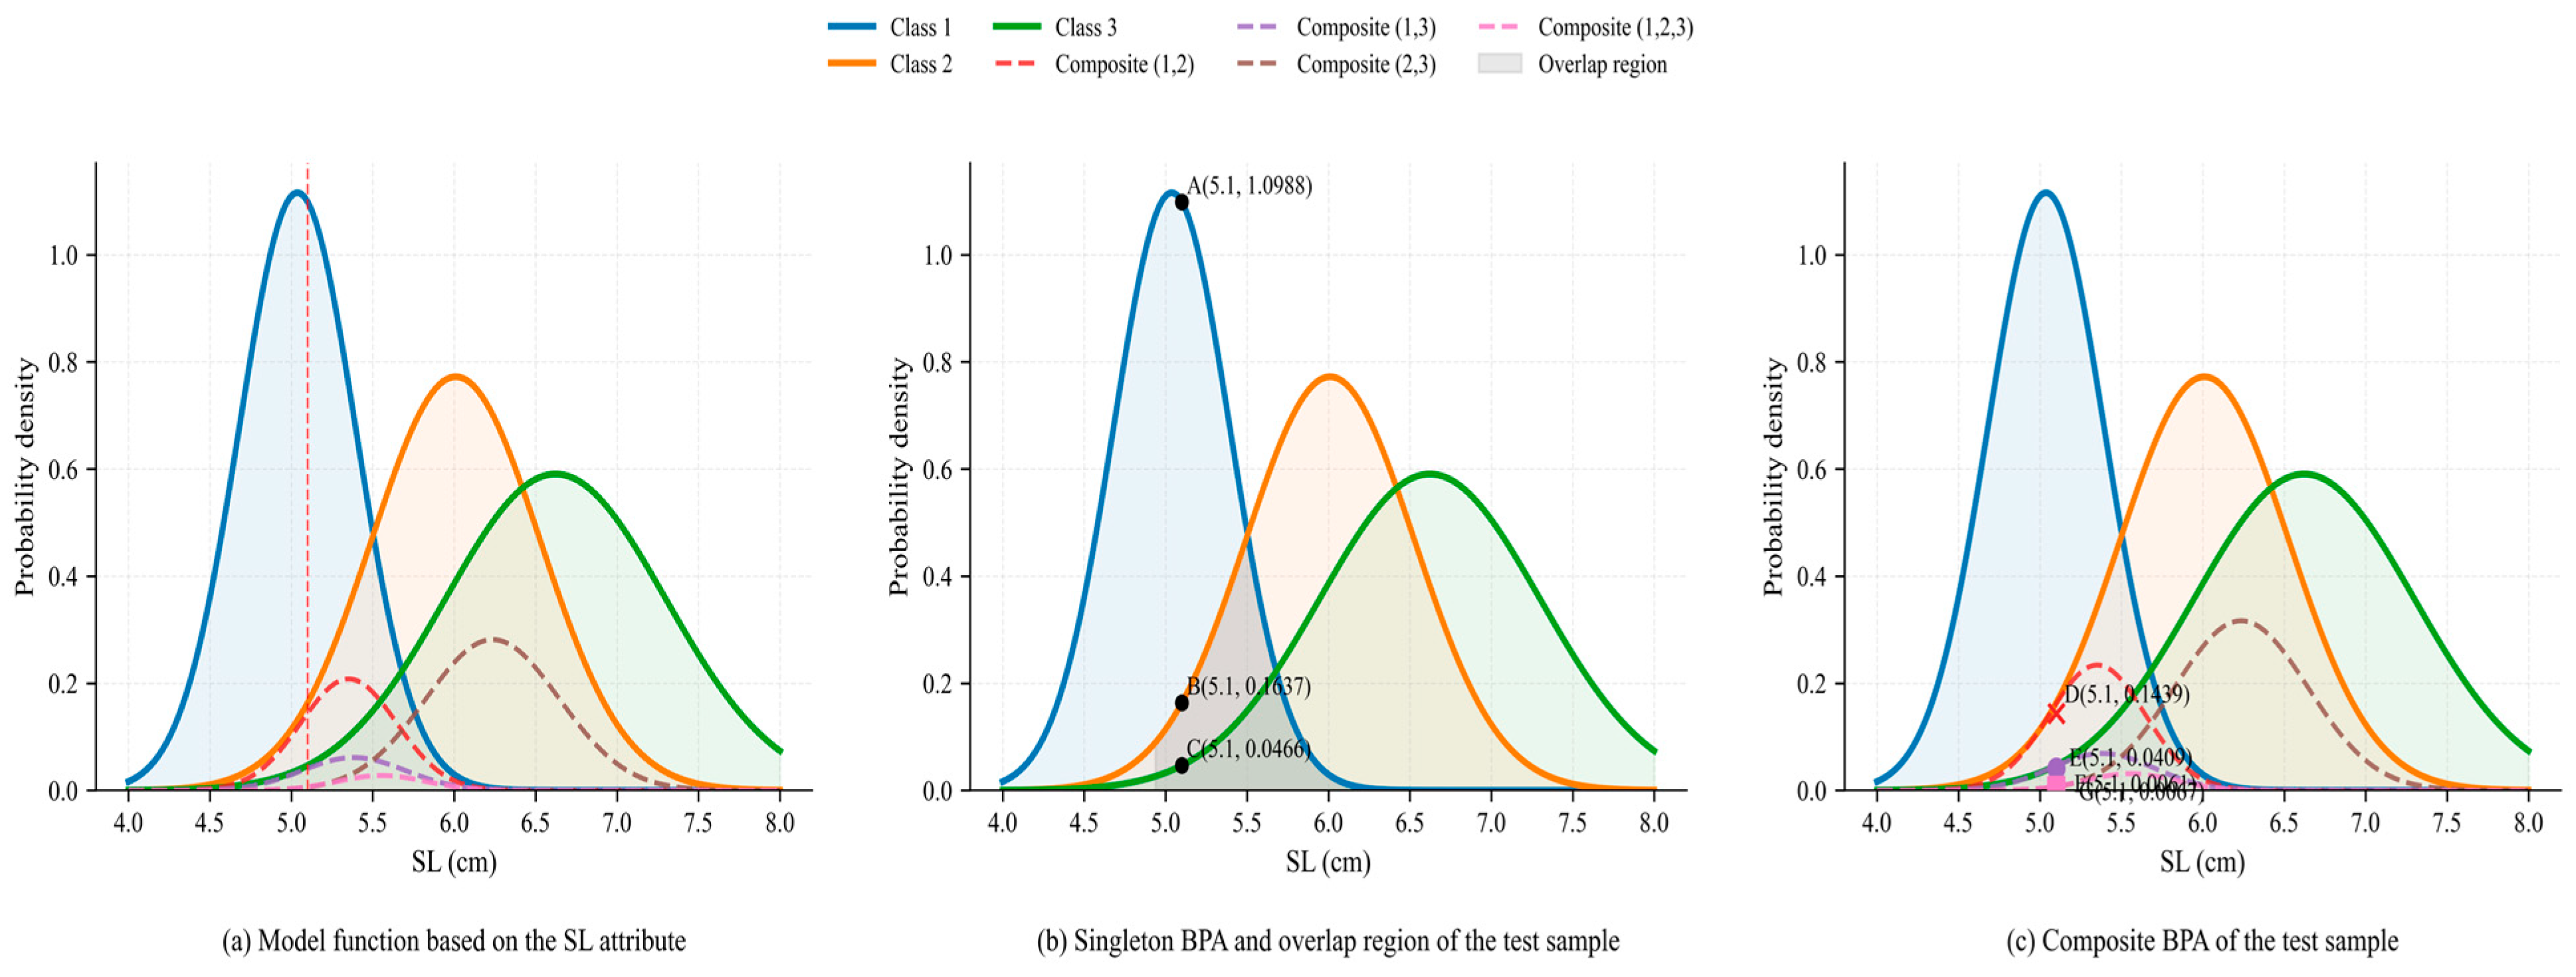
A test sample is randomly selected from the test data set. The values of each attribute in the sample are substituted into the Gaussian distribution curve model fitted to the corresponding attribute, yielding the corresponding function values based on the intersection of the sample attribute values and the model curve. For example, if a test sample is randomly selected from the Se category , the initial BPA function is generated by obtaining the Gaussian function values from the Gaussian distribution curve model fitted to its corresponding attributes. Taking the SL attribute as an example, the sample value to be tested is , corresponding to the position in the Gaussian distribution curve, as shown in Figure 2a, while its corresponding Gaussian function values are illustrated in Figure 2b,c. Since the mass function value must conform to the principle that the probabilities sum to 1 in D-S evidence theory, the function values need to be normalized to generate the initialized BPA function, i.e., . The results are presented in Table 2.
Figure 2.
Gaussian distribution curve of SL attributes and function values for test sample x = 5.1.
Table 2.
Results of BPA generation for SL attributes.
Step 3: Employ proportional functions for conversion.
In D-S evidence theory, conflict amplification and the exponential growth of computation increase with the number of elements and the complexity of focal elements within the recognition framework. When multi-focal-element propositions undergo Dempster’s combinatorial rule for fusion [25], computational complexity becomes high. Therefore, a proportional formula is applied to convert multi-focal elements into single-focal elements.
The BPA function values generated in Table 2 are converted to proportionality using Equations (9) and (10), where denotes the initial single-element function value, denotes the converted function value of the proportional confidence function, and denotes the converted function value of the proportional likelihood function. The BPA function values obtained from the SL attribute in Table 2 serve as an example.
, and are subsequently calculated and normalized. The calculated and results are shown in Table 3.
Table 3.
Probability distribution of propositions.
Step 4: Calculate the KL divergence.
KL divergence is utilized to measure the differences in distributions. A smaller difference indicates a higher weight assigned. The differences between the probability distributions, known as KL divergence, are calculated from the results in Table 3. Since KL divergence must conform to the principle that the probabilities sum to 1, X needs to be normalized before applying Equation (11) to calculate its . The result is shown below:
Here, X is used as the reference distribution because it is directly obtained from the original Gaussian evidence response, while Q1 and Q2 are transformed distributions generated by PropBel and PropPl, respectively. Therefore, and measure the information loss introduced by the two transformations.
The calculated KL divergence quantifies the differences among the probability distributions. A smaller difference corresponds to a higher weight assigned. Therefore, the inverse is used to determine the weight after normalization. The weight calculated using Equation (12) after normalization is as follows:
The weights are linearly combined to produce the final BPA. Taking as an example, the linear combination method is
This combination yields the final BPA, with the result shown in Table 4.
Table 4.
Basic probability assignment (BPA).
The BPAs for the other three attributes are obtained sequentially by following the steps above. The results are presented in Table 5.
Table 5.
Eneration of BPA for propositions.
The BPA generated using the method proposed in this paper is fused with traditional Dempster combination rules to produce the recognition result for the sample . The fusion result is
Based on the maximum belief decision principle in D-S evidence theory, the recognition result in the Se category. This outcome aligns with the ground truth, thereby validating the accuracy and feasibility of the proposed method.
4. Experiments and Results
4.1. Experimental Setup
To verify the validity of the proposed method, three classic datasets from the official UCI website—the Iris dataset, Wine dataset and Breast Cancer Wisconsin—were selected and evaluated experimentally using five-fold cross-validation. The Iris dataset contains three classes of samples: Setosa (Se), Versicolor (Ve), and Virginica (Vi), with 50 samples in each class, each having four features. The Wine dataset is similarly divided into three classes: Class A (59 samples), Class B (71 samples), and Class C (48 samples), with each sample containing 13-dimensional attribute features. The Wisconsin Breast Cancer dataset consists of two classes of samples: malignant (212 samples) and benign (357 samples). All experimental results are reported as the mean classification accuracy ± standard deviation obtained from five-fold cross-validation. The standard deviation is used to reflect the stability of the method across different data splits. Since paired significance tests were not conducted in the current study, the performance comparison is interpreted based on cross-validation mean accuracy and variance rather than formal statistical significance.
4.2. Comparison with Existing BPA Generation Methods
The experimental results were compared with those in Refs. [26,27,28]. The results are shown in Table 6.
Table 6.
Experimental comparison results.
As shown in Table 6, the proposed approach achieves superior classification performance on both the Iris and Wine datasets. On the Iris dataset, the method attains an average accuracy of 98.00%, exceeding those reported in Refs. [26,27,28]., and slightly outperforming the cloud model-based method in Ref. [27]. The relatively small standard deviation further indicates that the method maintains stable performance under simple data distributions. On the Wine dataset, the proposed method also yields the highest accuracy of 97.21%, demonstrating stronger discriminative capability compared with the competing approaches. This suggests that the Gaussian distribution-based BPA generation strategy is effective in capturing class distinctions during multi-attribute fusion.
The approach presented in Ref. [27] is the most effective when used with the Breast Cancer Wisconsin dataset whereas the suggested approach gives a slightly lower accuracy. However, it is better than the interval-based approach in Ref. [26] and comparable with the KNN-based approach in Ref. [28]. Due to the increased dimensionality and more complicated class distribution of this dataset, the classification problem has more stringent requirements on the ability to model uncertainty and represent overlap. Despite the fact that the proposed method is not the most accurate, the smaller variance suggests that the performance is more even across the various folds.
The relatively lower performance on the Breast Cancer Wisconsin dataset may be related to its higher dimensionality and more complex feature distribution. Unlike Iris and Wine, the Breast Cancer Wisconsin dataset contains 30 attributes, which may include correlated or redundant features. Since the proposed framework adopts univariate Gaussian modeling at the attribute level, it does not explicitly capture covariance among attributes or complex non-Gaussian feature distributions. As a result, the estimated overlap between class-conditional distributions may be less accurate, which can affect the generated BPAs and the final fusion result.
This indicates that the proposed method is more suitable for low- and medium-dimensional tabular datasets with relatively clear attribute-level distribution patterns. For datasets with higher dimensionality, stronger feature dependence, or more complex distributional characteristics, feature selection, PCA-based preprocessing, Gaussian mixture modeling, kernel density estimation, or covariance-aware evidence modeling may be required to further improve robustness and generalizability.
The recorded benefits of the Iris and Wine datasets are a result of the continuous representation of class distributions and the explicit consideration of overlapping areas. Through the use of the Gaussian functions and their product form, the method allows the creation of multi-focal elements as well as single focal elements and thus preserves the information about uncertainty. This method offers a greater description of inter-class relationships than traditional BPA construction procedures relying on distance or interval representations and leads to better classification performance.
4.3. Comparison with Classical Machine Learning Methods
In order to confirm the viability of the suggested approach in practice under classification problems and guarantee the completeness and exemplification of the comparisons, this paper chooses the Decision Tree (CART), Random Forest (RF) and XGBoost models as base models. They embrace the conventional classification models, the ensemble learning approaches, and the combination model of the form: dimensionality reduction + neural network. To make the experiment fairer, the same data partitioning strategy is applied to all the methods. Experimental results are presented in Table 7.
Table 7.
Experimental comparison results with machine learning methods.
As presented in Table 7, the suggested BPA generation algorithm, based on Gaussian overlap modeling and KL divergence weighting, proves highly competitive in various datasets. The approach proved effective with the Iris dataset with a classification accuracy of 98.00% which is more than a number of other existing methods. It shows that the proposed framework is stable and has good discriminatory power when used to classify low-dimensional datasets. The method attained an accuracy of 97.21% in the Wine dataset, which is higher than the traditional machine learning algorithms especially in situations where the borders of the classes are overlapping. Using Gaussian distributions and their products, the approach successfully models the ambiguity at the boundary of the classes and introduces uncertainty into the process of classification, which leads to better predictive performance. With respect to the Breast Cancer Wisconsin dataset, the proposed approach does not outperform the ensemble models like Random Forest (RF), XGBoost but is comparable in terms of the classification accuracy and the variance per cross-validation folds is relatively low. It implies that the method can preserve some level of stability and robustness when working with high-dimensional data and complicated class distributions, thus demonstrating its power in modeling uncertainty. However, because of the high-dimensionality and elaborate class distribution of this dataset, more severe requirements are placed on the representation of uncertainty and overlap handling. Conventional ensemble methods are able to utilize the combination of various decision trees to efficiently model nonlinear relationships and complex class boundaries, which is the major reason why they tend to have greater accuracy on the Breast Cancer data. In contrast, the method proposed addresses continuous Gaussian modeling and explicitly treats overlapping regions. Although this method is effective in capturing uncertainty and enhancing classification accuracy in some tasks, it could be vulnerable to redundancy and noise in high-dimensional settings, causing somewhat lower performance. Nonetheless, by the use of KL divergence-based attributing contributions and a multi-focal generation mechanism, the method has low variance and exhibits high robustness, which reflects well-adaptability, even in high-dimensional environments. As a result, although the accuracy of the Breast Cancer dataset is slightly lower than of traditional machine learning schemes, the proposed scheme remains quite promising especially concerning low- or medium-complexity data. Moreover, the combination of feature selection or deep learning mechanism could also improve its performance in complex, high dimensional context. To sum up, the obtained experimental findings on various datasets prove that the proposed method performs well with low-to-medium complexity data. Such a success is mainly due to the BPA generation strategy developed on the basis of Gaussian overlap modeling that is capable of accurately representing ambiguity and uncertainty between classes hence achieving higher classification accuracy and stability. Even though its performance on high-dimensional datasets is slightly lower than that of other classical machine learning algorithms, the method still produces stable results and demonstrates high robustness. Subsequent work might examine the combination of feature selection or deep learning approaches to improve its performance in complex and high-dimensional environments. Experimental findings confirm that the proposed approach does not only produce quality BPAs under the Dempster-Shafer evidence theory but has practical application to real-life classification problems.
Although CART, Random Forest, and XGBoost are used as representative classical machine learning baselines in this study, more advanced uncertainty-aware models, such as fuzzy neural networks and evidential deep learning models, are also relevant for comparison. These models can directly estimate prediction uncertainty through neural architectures. However, the present study focuses on BPA generation under the D-S evidence theory framework for low- and medium-dimensional tabular datasets. A direct comparison with evidential deep learning requires additional neural architecture design, hyperparameter tuning, and calibration-oriented evaluation. Therefore, such models will be included in future work to further evaluate the proposed method under more complex and large-scale scenarios.
4.4. Discussion
The experimental results indicate that the proposed Gaussian-overlap-based BPA generation framework provides a useful way to connect continuous attribute distributions with D-S evidence modeling. From a theoretical perspective, the main implication of this study is that the overlap between class-conditional distributions can be used as a data-driven basis for constructing both singleton and composite focal elements. This provides a more explicit link between statistical distribution modeling and evidential reasoning, especially when class ambiguity exists in overlapping regions.
From a practical perspective, the proposed method is suitable for low- and medium-dimensional tabular classification tasks where interpretability and evidence-level representation are important. Compared with purely black-box classifiers, the proposed framework provides an interpretable process from attribute-level Gaussian modeling to BPA generation, attribute weighting, and evidence fusion. This may be useful in decision-support scenarios where the source and contribution of evidence need to be examined.
However, the present study also has several limitations. First, the method adopts Gaussian approximation at the attribute level, which may not fully capture skewed, multimodal, or heavy-tailed feature distributions. Second, the current framework treats attributes as independent or weakly dependent evidence sources and does not explicitly model the covariance structure among attributes. Third, the method is mainly evaluated on low- and medium-dimensional benchmark datasets, and its applicability to high-dimensional real-world data requires further validation. Finally, the current experiments focus mainly on classification accuracy, while calibration-oriented uncertainty metrics such as Brier Score, Expected Calibration Error, and OOD detection are not included.
Future work will investigate more flexible density estimation methods, such as kernel density estimation and Gaussian mixture models, as well as feature selection, PCA-based preprocessing, covariance-aware evidence modeling, and calibration-based uncertainty evaluation. These extensions may further improve the robustness and applicability of the proposed BPA generation framework in more complex real-world classification tasks.
5. Conclusions
The present work deals with the problem of calculating the BPA in the context of the D-S theory of evidence. Our approach to creating a BPA will be developed through Gaussian distribution and KL divergence. In this method, it creates a Gaussian distribution curve model of each attribute using Gaussian functions. Single-focal-element proposition is generated in non-overlapping areas by a single Gaussian distribution whereas a composite model (which is the product of Gaussian functions and a scaling factor) is used to derive multi-focal-element propositions in overlapping areas.
The main insight of this work is that the ambiguity caused by overlapping class distributions can be represented by composite focal elements during the initial evidence construction stage, instead of being directly assigned to a single class. Proportional belief and proportional plausibility transformations are further employed to project composite evidence into singleton-level decision representations. Meanwhile, KL-divergence-based weighting is introduced to measure the reliability of attribute-level evidence. Overall, the proposed framework enhances the interpretability of BPA construction and offers a data-driven mechanism for evidence generation in classification problems. In terms of classification accuracy, the proposed method achieved 98.00 ± 2.67% on Iris, 97.21 ± 1.76% on Wine, and 90.86 ± 1.20% on Breast Cancer Wisconsin, demonstrating its effectiveness for low- and medium-dimensional tabular classification tasks.
Author Contributions
Z.W.: Conceptualization, Methodology, Writing—original draft, Validation, Data curation, Software. J.X.: Conceptualization, Formal analysis, Supervision, Writing—review and editing, Funding acquisition, Project administration. All authors have read and agreed to the published version of the manuscript.
Funding
This work was supported by the National Natural Science Foundation of China under Grant (No. 62006091).
Data Availability Statement
The datasets can be accessed at: Iris: https://archive.ics.uci.edu/ml/datasets/Iris (accessed on 10 March 2026). Wine: https://archive.ics.uci.edu/ml/datasets/Wine (accessed on 10 March 2026). Breast Cancer Wisconsin (Diagnostic): https://archive.ics.uci.edu/ml/datasets/Breast+Cancer+Wisconsin+(Diagnostic) (accessed on 10 March 2026).
Conflicts of Interest
The authors declare no conflict of interest.
References
- Dempster, A.P. Upper and lower probabilities induced by a multivalued mapping. Ann. Math. Stat. 1967, 38, 325–339. [Google Scholar] [CrossRef] [Scilit]
- Shafer, G. A Mathematical Theory of Evidence. Master’s Thesis, Princeton University Press, Princeton, NJ, USA, 1976. [Google Scholar]
- Yu, S.; Wang, X. A generalized measure of basic probability assignment uncertainty and its application in evidence combination. Control Theory Appl. 2024, 41, 567–576. [Google Scholar]
- Tang, Y.; Zhang, X.; Zhou, Y.; Huang, Y.; Zhou, D. A new correlation belief function in Dempster-Shafer evidence theory and its application in classification. Sci. Rep. 2023, 13, 7609. [Google Scholar] [CrossRef] [Scilit] [PubMed]
- Palash, D.; Sonom, S. A new belief entropy measure in the weighted combination rule under DST with faulty diagnosis and real-life medical application. Int. J. Mach. Learn. Cybern. 2022, 14, 1179–1203. [Google Scholar] [CrossRef] [Scilit]
- Yuan, R.; Chen, Z.; Wei, Y.; Chen, Z. Two-stage multi-source information fusion bearing fault diagnosis based on improved Stacking and Dempster–Shafer evidence theory. Ind. Eng. 2025, 28, 56–67. [Google Scholar]
- Gao, Y. Research on Security Risk Assessment Method of LTE-R System Based on Improved Evidence Theory. Master’s Thesis, Lanzhou Jiaotong University, Lanzhou, China, 2023. [Google Scholar]
- Shams, G.; Hatefi, S.M.; Nemati, S. A Dempster-Shafer evidence theory for environmental risk assessment in failure modes and effects analysis of Oil and Gas Exploitation Plant. Sci. Iran. 2024, 31, 1674–1690. [Google Scholar]
- Xiong, L.; Su, X. An improved method to determine basic probability assignment based on fuzzy mathematics. MATEC Web Conf. 2022, 355, 02002. [Google Scholar] [CrossRef] [Scilit]
- Zhang, Y.; Xiao, Q.; Deng, X.; Jiang, W. A multi-source information fusion method for ship target recognition based on Bayesian inference and evidence theory. J. Intell. Fuzzy Syst. 2022, 42, 2331–2346. [Google Scholar] [CrossRef] [Scilit]
- Zhao, J.; Xu, S. Technical condition assessment of ship equipment based on information fusion. Ship Sci. Technol. 2022, 44, 178–181. [Google Scholar]
- Kenn, M.; Karch, R.; Singer, C.F.; Dorffner, G.; Schreiner, W. Flexible Risk Evidence Combination Rules in Breast Cancer Precision Therapy. J. Pers. Med. 2023, 13, 119. [Google Scholar] [CrossRef] [Scilit] [PubMed]
- Zhu, C.; Qin, B.; Xiao, F.; Cao, Z.; Pandey, H.M. A fuzzy preference-based Dempster-Shafer evidence theory for decision fusion. Inf. Sci. 2021, 570, 306–322. [Google Scholar]
- Tang, Y.; Wu, D.; Liu, Z. A new approach for generation of generalized basic probability assignment the evidence theory. Pattern Anal. Appl. 2021, 24, 1007–1023. [Google Scholar] [CrossRef] [Scilit]
- Fei, L.; Xia, J.; Feng, Y.; Liu, L. A novel method to determine basic probability assignment in Dempster–Shafer theory and its application in multi-sensor information fusion. Int. J. Distrib. Sens. Netw. 2019, 15, 1550147719865876. [Google Scholar] [CrossRef] [Scilit]
- Jiang, Y.; Tan, J.; Jiang, X.; Zou, H. Conflict evidence fusion algorithm based on triangular divergence and belief entropy. Comput. Eng. Appl. 2023, 59, 132–140. [Google Scholar]
- Li, H.; Xiao, F. A method for combining conflicting evidences with improved distance function and Tsallis entropy. Int. J. Intell. Syst. 2020, 35, 1814–1830. [Google Scholar] [CrossRef] [Scilit]
- Tian, M.; Ye, J.; Wan, Y. An improved conflict evidence method based on iterative correction. Control Eng. 2021, 28, 565–570. [Google Scholar]
- Chang, Y.S.; Zhang, Q.D. A fuzzy rule extraction method based on Dempster–Shafer theory. Soft Comput. 2024, 28, 7709–7720. [Google Scholar] [CrossRef] [Scilit]
- Yang, J.; Huang, Z.; Miao, Q.; Sun, R. A novel information fusion method based on Dempster-Shafer evidence theory for conflict resolution. Intell. Data Anal. 2011, 15, 399–411. [Google Scholar] [CrossRef] [Scilit]
- Urbani, M.; Gasparini, G.; Brunelli, M. A numerical comparative study of uncertainty measures in the Dempster–Shafer evidence theory. Inf. Sci. 2023, 639, 119027. [Google Scholar] [CrossRef] [Scilit]
- Daniel, M. Consistency of probabilistic transformations of belief functions. In Proceedings of the 10th International Conference on Information Processing and Management of Uncertainty in Knowledge-Based Systems (IPMU), Perugia, Italy, 4–9 July 2004; pp. 1135–1142. [Google Scholar]
- Huang, W.; Zhang, B.; Zhang, K.; Gao, H.; Wan, R. Improved autoencoder with LSTM module and KL divergence for anomaly detection. IEEE Trans. Instrum. Meas. 2024, 73, 3534011. [Google Scholar] [CrossRef] [Scilit]
- Ji, S.; Zhang, Z.; Ying, S.; Wang, L.; Zhao, X.; Gao, Y. Kullback–Leibler divergence metric learning. IEEE Trans. Cybern. 2020, 52, 2047–2058. [Google Scholar] [CrossRef] [Scilit]
- Barnett, J.A. Computational methods for a mathematical theory of evidence. In Proceedings of the 7th International Joint Conference on Artificial Intelligence, Vancouver, BC, Canada, 24–28 August 1981; Morgan Kaufmann Publishers: San Francisco, CA, USA, 1981; pp. 868–875. [Google Scholar]
- Li, J.; Xie, B.; Jin, Y.; Zhou, L. Generation Method and Application of Basic Probability Assignment Based on Interval Numbers. Acta Electron. Sin. 2012, 40, 1092–1096. [Google Scholar]
- Guo, Q.; Wen, W.; Wang, Y.; Qi, L.; Kaliuzhny, M. Generation Method of Basic Probability Assignment Based on Cloud Model and Its Application. J. Electron. Inf. Technol. 2023, 45, 905–912. [Google Scholar]
- Bai, X.T. Improvements to D-S Evidence Theory and Its Application in Transformer Fault Diagnosis. Master’s. Thesis, Anhui University of Science and Technology, Huainan, China, 2024. [Google Scholar]

Disclaimer/Publisher’s Note: The statements, opinions and data contained in all publications are solely those of the individual author(s) and contributor(s) and not of MDPI and/or the editor(s). MDPI and/or the editor(s) disclaim responsibility for any injury to people or property resulting from any ideas, methods, instructions or products referred to in the content. |
© 2026 by the authors. Licensee MDPI, Basel, Switzerland. This article is an open access article distributed under the terms and conditions of the Creative Commons Attribution (CC BY) license.