


Abstract
Early prediction of diabetes remains a major healthcare challenge, as timely diagnosis can significantly reduce the risk of severe complications. Most existing studies emphasize complex predictive models or extensive preprocessing pipelines, while comparatively limited attention has been given to improving feature representations. In this study, we propose a statistical framework for enriching the feature space of diabetes data using Gaussian Mixture Models (GMMs) and Kernel Density Estimation (KDE) to capture latent distributional characteristics and local density patterns. The resulting enriched features enhance class discrimination while preserving model simplicity, allowing standard classifiers to operate more effectively. The proposed framework is evaluated on two diabetes datasets with different sample sizes and class distributions. Models trained on the enriched feature set are compared with baseline models trained solely on the original features, using multiple strategies, including direct feature concatenation and ensemble-based approaches. Experimental results show that the enriched feature space consistently outperforms the original feature set, leading to notable improvements in overall predictive performance. In particular, the framework achieves a substantial increase in sensitivity for the minority class (diabetic cases), which is especially important for clinical applications where positive samples are typically scarce relative to healthy cases.
1. Introduction
Diabetes mellitus is a chronic metabolic disorder characterized by elevated blood glucose levels resulting from impaired insulin secretion, insulin resistance, or a combination of both [1]. According to the International Diabetes Federation (IDF) Diabetes Atlas 2025, approximately 537 million adults aged 20–79 are currently living with diabetes [2]. This number is projected to increase to 783 million worldwide by 2045 [1].
Type 2 diabetes (T2D) is the most prevalent form of diabetes, accounting for approximately 95% of all cases worldwide [3]. It develops when body cells become resistant to insulin and, over time, the pancreas is unable to produce sufficient insulin to compensate for this resistance, leading to chronic hyperglycemia [4]. The progressive nature of T2D often results in substantial metabolic dysfunction and long-term damage to multiple organ systems, including the cardiovascular, renal, and nervous systems [3,5]. Beyond its high prevalence, T2D represents a major public health challenge due to its severe complications and associated mortality. In 2024 alone, diabetes was estimated to have contributed to 3.4 million deaths globally, corresponding to approximately one death every nine seconds [2].
Early detection and intervention are crucial for preventing disease progression and reducing the risk of complications in individuals with diabetes [3]. However, traditional diagnostic methods based on clinical biomarkers, such as fasting glucose, HbA1c, and oral glucose tolerance tests [6], may fail to identify early-stage metabolic dysfunction. In recent years, machine learning (ML) has emerged as a powerful tool for predictive modeling in healthcare, offering the ability to analyze complex, multidimensional datasets to identify individuals at high risk [7,8]. By integrating clinical, genetic, and lifestyle factors, ML algorithms can enhance the early prediction of diabetes, thereby enabling timely interventions and supporting personalized treatment strategies [7,8].
ML approaches have been widely applied to diabetes prediction and are often evaluated using publicly available benchmark datasets. One of the main challenges, common to many medical datasets, is the high degree of class imbalance [9], which can bias predictive models toward the majority class and thereby limit their clinical usefulness. To mitigate this issue and improve predictive performance, various methodologies have been proposed, including data-level strategies such as oversampling and undersampling, algorithm-level modifications through cost-sensitive learning, and hybrid approaches that combine preprocessing, feature engineering, and advanced classification techniques across diverse datasets.
Sharma et al. [10] examined the performance of several classification algorithms on the PIMA Indian Diabetes dataset. Their findings indicated that the Logistic Regression (LR) model achieved superior performance compared with the other evaluated classifiers for this dataset. Similarly, Ağraz et al. [11] proposed a hybrid approach that combined the Dendritic Neuron Model (DNM), LR, and an Artificial Neural Network (ANN) on the same dataset. Their hybrid model outperformed the standalone classifiers in terms of AUC, accuracy, and sensitivity. Ahmed et al. [12] also focused exclusively on the PIMA dataset, applying feature selection followed by multiple machine learning algorithms to improve predictive performance. Their results demonstrated that the Random Forest classifier outperformed the other models.
Reza et al. [13] investigated two stacking-based ensemble models for diabetes classification using the PIMA dataset and a local healthcare dataset. The first model employed a classical stacking approach, integrating the base learners Random Forest (RF), Decision Trees (DT), and Support Vector Machines (SVM), with LR as the meta-classifier. The second model replaced the base learners with three customized sequential neural networks, again using LR as the meta-classifier. Both models were evaluated using train–test splits and cross-validation. The results demonstrated that both classical stacking and neural network–based stacking approaches outperformed individual classifiers, highlighting the effectiveness of ensemble learning. Similarly, Sivashankari and Vengatesan [14] proposed a stacked ensemble for PIMA-based diabetes prediction, using multiple level-0 base classifiers, namely RF, K-Nearest Neighbors (KNN), DT, Gradient Boosting, SVM, and Gaussian Naïve Bayes, to generate probability outputs, which were then used as input to an LR meta-classifier. Their ensemble achieved superior performance compared with individual classifiers, including RF, KNN, LR, Gradient Boosting, AdaBoost, and SVM. Tripathi et al. [15] applied a soft voting ensemble on the PIMA dataset, comparing LR, KNN, SVM, DT, AdaBoost, and Gradient Boosting, and achieved up to 82.8% accuracy, surpassing the performance of the individual models.
Although much research has focused on the PIMA dataset, several studies have extended their methodologies to other datasets or applied them across multiple datasets. Shi et al. [16] proposed an integrated Bagging–RF model to enhance diabetes prediction using two Kaggle datasets. Their preprocessing pipeline included outlier removal, one-hot encoding, age-based stratification into three groups (50–60, 60–70, and 70–80 years), and SMOTE oversampling. The Bagging–RF model was compared with RF, Gaussian Naïve Bayes (GNB), LR, KNN, DT, Extra Trees (ET), AdaBoost, and XGBoost (XGB) and evaluated using accuracy, precision, sensitivity, specificity, AUC, and F1-score. Bagging–RF consistently achieved the highest performance, with accuracy ranging from 93.7% to 97.4% and superior F1-scores. Talukder et al. [17] aimed to improve the reliability of diabetes prediction by integrating data engineering with machine learning. Using PIMA, the Iraqi Medical City dataset (Mendeley), and the Kaggle “Diabetes Prediction Dataset,” they applied preprocessing steps including missing value handling, outlier removal, normalization, label encoding, and random oversampling, followed by training LR, RF, SVM, and XGBoost. Their results showed that robust preprocessing significantly enhanced accuracy, sensitivity, and AUC across all datasets. Uddin et al. [18] designed a framework to reduce false negatives in diabetes detection, training LR, KNN, Naïve Bayes, RF, SVM, DT, and Linear Regression on a 2019 diabetes dataset and PIMA. Preprocessing involved missing value handling, normalization, categorical encoding, and SMOTE oversampling. Their analysis revealed that Random Forest achieved the highest performance, with up to 97% accuracy on the 2019 dataset and 80% accuracy on the PIMA dataset. Importantly, balancing the dataset significantly reduced false negatives, highlighting the importance of data balancing techniques in enhancing model sensitivity and improving practical reliability in clinical prediction tasks [18].
Despite the advances demonstrated in these studies, a common limitation remains the inherently restricted feature space typically available for diabetes prediction tasks. Most previous works have relied on multi-stage preprocessing pipelines or increasingly complex model architectures to improve prediction performance [19]. While these strategies can achieve incremental improvements in predictive accuracy, they often come at the cost of increased computational complexity and reduced model interpretability. More importantly, such methods do not fundamentally address the core challenge posed by the limited diversity and richness of input features, underscoring the need for novel approaches that expand the feature space to achieve substantial and meaningful gains in predictive performance.
This study differs from the previous works by shifting focus from model complexity to feature representation itself. Instead of relying on deeper architectures, heavy pre-processing, or ensemble pipelines, we investigate whether classical models can achieve comparable or superior performance when supplied with richer, probabilistically enhanced features. Our key idea is that diabetes datasets are typically low-dimensional and contain limited discriminative information in their raw form; therefore, improving what the classifier sees is more impactful than increasing model complexity. We introduce a feature enrichment framework using GMM capture latent sub-population structures and KDE to encode local density information, generating new probability-based features that reflect the underlying data distribution. These enriched representations are appended to the original variables, enabling traditional classifiers, such as logistic regression, to learn from distribution-aware input rather than raw measurements alone.
Several prior studies have employed GMM and KDE in biomedical and signal processing applications to extract informative features; however, their use in diabetes prediction remains relatively limited. Suwalska and Polańska [20] proposed a GMM-based feature expansion framework for single-cell mass cytometry, in which marker intensity distributions were modeled as mixtures of Gaussian components. By projecting the data into an expanded feature space using GMM membership probabilities, their approach improved clustering accuracy and the identification of rare cell subtypes compared to standard methods. Ghaderi et al. [21] introduced three novel surface electromyography (sEMG) features derived from KDE, namely the trimmed mean of the density, density entropy, and derivative-based density measures, for myoelectric signal analysis. When combined with ensemble learning, these KDE-based features achieved exceptionally high classification accuracy (approximately 99%) for hand and wrist motion recognition across multiple benchmark datasets, demonstrating their effectiveness for biomedical feature extraction. In a related context, Chushig-Muzo et al. [22] proposed a methodology to improve the interpretability of autoencoder-derived latent representations from electronic health records. By integrating GMM with hierarchical clustering and Kullback–Leibler divergence, their approach successfully identified clinically meaningful patient subgroups, particularly among hypertensive and insulin-dependent diabetic cases, thereby enhancing transparency in deep learning-based decision support systems. Collectively, these studies demonstrate that GMM and KDE can enhance data representations by capturing latent distributional structures and local density variations. However, to the best of our knowledge, no existing study has jointly utilized GMM-based soft cluster probabilities and KDE-derived log-density features for feature augmentation in early diabetes detection datasets.
The proposed framework is evaluated on two widely used public datasets: the PIMA Indian Diabetes dataset and the Kaggle Diabetes Prediction Dataset. The evaluation aims to assess both predictive performance and cross-dataset robustness. LR, a widely adopted and interpretable baseline in clinical decision support systems, is employed to isolate the impact of feature enrichment without the confounding effects of complex model architectures. The evaluation considers four modeling strategies: (1) models trained using original features only, (2) models trained using original features enriched with GMM and KDE derived features, (3) block-wise stacking with LR as the meta-classifier, and (4) ensemble averaging across feature blocks.
The experimental results demonstrate that the proposed feature representation consistently improves overall predictive performance and significantly enhances sensitivity to the minority class without significantly compromising other evaluation metrics, thereby representing a meaningful advancement for medical prediction tasks.
2. Materials and Methods
This section provides a detailed description of the diabetes datasets used in this research, the proposed methodology for feature representation and model development, and the evaluation metrics employed to assess predictive performance.
2.1. Datasets
To evaluate the impact of feature space enrichment on diabetes prediction, we utilized two widely recognized binary classification datasets with distinct distributions and feature compositions. This selection enables the assessment of the proposed methodology on both small-scale clinical benchmarks and large-scale electronic health record (EHR)-based data, thereby ensuring robustness and generalizability. Detailed descriptions of each dataset are provided below.
2.1.1. Pima Indians Diabetes Dataset (PIMA)
The PIMA dataset, originally collected by the National Institute of Diabetes and Digestive and Kidney Diseases (NIDDK), is publicly available through the UCI Machine Learning Repository [23]. It contains 768 samples, each representing a female patient of Pima Indian heritage, aged at least 21 years. Each sample has seven numerical features derived from medical examinations, along with a binary outcome which indicates the presence or absence of diabetes. The features are as follows [23]:
- Pregnancies: Number of times pregnant;
- Glucose: Plasma glucose concentration (mg/dL);
- BloodPressure: Diastolic blood pressure (mmHg);
- SkinThickness: Triceps skin fold thickness (mm);
- Insulin: 2-hour serum insulin (U/);
- BMI: Body mass index (kg/m2);
- DiabetesPedigreeFunction: Likelihood of diabetes based on family history;
- Age: Age in years.
This dataset is an imbalanced dataset that contains 500 non-diabetic and 268 diabetic samples. Some features have zero values that are physiologically implausible, such as Glucose, BloodPressure, SkinThickness, Insulin, and BMI features. These values were treated as missing and imputed using the median of each respective feature, a method known for its robustness to outliers and effectiveness in clinical datasets [24,25,26].
To ensure uniform scaling and improve convergence during model training, all features were standardized to have zero mean and unit variance.
2.1.2. Electronic Health Records Dataset (EHRs)
The EHRs dataset was collected from surveys, medical records, and laboratory tests conducted by healthcare providers in hospitals and clinics. This dataset is publicly available on Kaggle and is widely utilized in the field of diabetes prediction [27,28,29,30]. The dataset comprises 100,000 samples, each containing eight features, namely six numerical and two categorical, along with a target variable indicating the presence or absence of diabetes. The features are as follows [31]:
- gender: Categorical variable indicating the patient’s gender (e.g., male, female, or other).
- age: Numerical variable representing the patient’s age in years.
- hypertension: Binary variable indicating the presence or absence of hypertension.
- heart_disease: Binary variable indicating the presence or absence of heart disease.
- smoking_history: Categorical variable detailing the patient’s smoking history (e.g., never, former, current, or no info).
- bmi: Numerical variable representing the Body Mass Index (kg/m2).
- HbA1c_level: Numerical variable indicating the level of hemoglobin A1c, a measure of blood sugar levels over time (percent).
- blood_glucose_level: Numerical variable representing the current blood glucose level (mg/dL).
The dataset is highly imbalanced, with 8500 diabetic and 91,500 non-diabetic samples. To facilitate the application of various classification algorithms, the categorical features (gender and smoking_history) were converted into binary features.
2.2. Proposed Methodology
This study introduces a feature space enrichment framework designed to improve the predictive performance of diabetes classification models. The framework enhances the original feature set by generating additional, informative variables using two statistical modeling techniques: GMM and KDE. These enriched features are concatenated with the original ones to form a more comprehensive and discriminative feature vector for model training.
Beyond evaluating the enriched feature vector directly, two ensemble learning approaches are applied to further assess its potential: a block-wise stacking ensemble and a block-wise soft voting ensemble, both detailed in this section.
2.2.1. Feature Enrichment
The first step of the proposed framework involves generating new features using GMM and KDE to capture latent patterns and distributional characteristics in the diabetes data. These additional variables are integrated with the original features to construct a more representative feature space, aiming to improve classification performance.
- Feature Space Enrichment Using Gaussian Mixture Models (GMMs)
GMM is a probabilistic model that represents data as a mixture of multiple Gaussian distributions [32]. It is effective for capturing complex feature distributions, especially when the data follow more than one normal distribution [32]. Unlike traditional clustering techniques, such as k-mean, which assume well-separated spherical clusters, GMM can model elliptical clusters, making it highly effective in identifying underlying patterns within the data. This capability allows GMM to handle complex distributions more effectively, ensuring that subtle variations and multimodal characteristics in the dataset are well captured [32].
Each Gaussian distribution represents a cluster and has its own mean and covariance. The model also includes mixing coefficients (weights) that determine the importance of each Gaussian component in the mixture. The goal of GMM is to estimate parameters, including mean values, covariances, and mixing coefficients, to best describe the data [33].
The probability density function of the GMM is given by
Here, represents the mixing coefficient for the Gaussian component k-th, where , is the multivariate Gaussian distribution with mean and covariance matrix , and represents the set of model parameters.
To estimate the parameters of GMM, the Expectation–Maximization (EM) algorithm is used, which iteratively improves the model fit. The EM algorithm consists of two key steps: In the expectation step, the algorithm calculates the probability that each data point belongs to each cluster [33], as shown in the following equation:
where these probabilities are based on the current estimates of the Gaussian parameters.
For the maximization step, the probabilities from the expectation step is used to update the parameters of the Gaussian distributions (means and covariances) and the mixing coefficients to better fit the data. These two steps are repeated until the model converges, meaning that the parameters no longer change significantly [33]. This iterative process effectively handles the complexities of overlapping clusters with varying shapes in the data, which are common in real-world datasets.
The main challenge in applying GMM is determining the optimal number of clusters (Gaussian components) that best represent the underlying data structure. Selecting an inappropriate number of clusters can lead to overfitting or underfitting, resulting in poor performance for any model. To address this challenge, several methods have been proposed in the literature [33]. In this study, the Bayesian Information Criterion (BIC) is used to determine the optimal number of clusters for the diabetic datasets [34]. BIC is a statistical criterion that compares models by balancing goodness of fit with model complexity, thereby helping to prevent overfitting and ensuring more reliable clustering results [34]. We evaluated GMM models for to , and the model with the lowest BIC value was selected. To further enhance robustness, each candidate GMM was fitted using multiple random initializations, and the average BIC value was used to confirm the stability of the selected K. This procedure ensures that the probabilistic features derived from the GMM are consistent, reproducible, and do not depend on arbitrary initialization.
In this study, we applied a GMM to each non-categorical feature individually, rather than to the entire feature space, to enrich the representation of the data. This decision is based on the correlation analysis of the features, which shows that there are no pairs of features with a correlation higher than 0.62, as illustrated in Figure 1. As a result, modeling the full feature set using a multivariate GMM with the complete feature set is unlikely to extract meaningful structure because strong interactions between features are not present. In contrast, applying the GMM to each feature separately captures the local distributional characteristics within each feature, which can be beneficial for enriching the original feature space.
Figure 1.
Correlation plots for the two diabetes datasets. Each plot shows the pairwise correlations between the features in the dataset, where the color gradient represents the degree of correlation.
For each feature, we add cluster probabilities (soft assignments) as new features.
To apply per-feature GMM, the distributions of all non-categorical features were examined to understand the underlying characteristics of each feature, such as skewness, modality, and overall distribution shape. The blue histograms in Figure 2 show the distribution of the features in the PIMA dataset, where we can notice that some of the features, such as Glucose, Blood Pressure, and BMI, have approximately normal distributions, while other features exhibit skewness and non-Gaussian characteristics. Figure 3 (blue histograms) illustrates that most features in the EHRs dataset display skewed and multimodal distributions.
Figure 2.
The distribution of features in the PIMA dataset before and after applying a transformation to improve their suitability for clustering. The blue histograms present the original distributions of non-categorical features, while the green histograms present the distributions after applying the Box–Cox transformation.
Figure 3.
The distribution of features in the EHRs dataset before and after applying a transformation to improve their suitability for clustering. The blue histograms present the original distributions of non-categorical features, while the green histograms present the distributions after applying the Box–Cox transformation.
Although GMM is a probabilistic model that assumes data is generated from a mixture of multiple Gaussian distributions, it can still be applied to non-Gaussian data because it models clusters using multiple Gaussian components. However, when a dataset exhibits complex shapes (e.g., skewed or multimodal distributions), GMM might struggle to fit the data properly, leading to unstable clustering and less accurate cluster assignments that may not reflect meaningful underlying structure.
To address this issue, we apply the Box–Cox transformation, a power transformation that aims to stabilize variance and make the data more normally distributed. Figure 2 (green histograms) illustrates the transformed feature distributions, demonstrating a significant reduction in skewness. The DiabetesPedigreeFunction, Glucose, and BloodPressure distributions become more symmetric, making them more amenable to clustering. The transformation notably improves Age and Insulin, although the latter still exhibits a zero-inflated pattern. While some features retain minor deviations from normality, the overall transformation effectively enhances Gaussian-like behavior across most variables. The distributions of the non-categorical features from the PIMA dataset are shown both before and after the Box–Cox transformation. On the other hand, Figure 3 illustrates that the distributions of BMI are significantly improved in the EHRs dataset, becoming more symmetric and Gaussian-like, making it more suitable for GMM, whereas the transformation has a limited effect on features such as blood glucose level, HbA1c level, and age.
- Feature Space Enrichment Using Kernel Density Estimation (KDE)
KDE is a non-parametric technique used to estimate the probability density function of a random variable based on observed data points without assuming any specific distribution [35]. It effectively captures the local density of the data points, highlighting regions of high and low data concentration [35]. In contrast to GMM, which is a parametric and assumes the data follow a specific distribution that has a number of parameters, such as mean and covariance [36], KDE constructs the density estimate by centering a kernel function at each data point and summing their contributions to form a smooth approximation of the underlying distribution [37]. In this study, we employed a Gaussian kernel, which is a symmetric kernel function centered at zero, under the assumption that the data originate from a smooth latent distribution.
A key challenge in using KDE is finding the appropriate bandwidth, which determines the smoothness of the density estimation. A narrow bandwidth captures more specific details but increases the risk of overfitting, whereas a broad bandwidth generates a smoother estimate that may oversimplify the data and obscure important structural information [35,37]. To address this, we adopted a cross-validated bandwidth selection strategy. Specifically, candidate values were drawn from the grid [0.1,0.2,0.5,1,2], and the optimal bandwidth for each feature was chosen by maximizing the training log-likelihood, ensuring stable and informative KDE-derived features.
After applying GMM to each feature, we further enriched the feature space using KDE to capture the local probability density of each data point. While GMM provides the probability that a data point belongs to a specific cluster (e.g., “low” or “high”-glucose clusters), KDE complements this by providing a non-parametric estimation of how typical or anomalous a sample is within the broader distribution of each feature. For example, a patient assigned to a “high-risk” GMM cluster for glucose levels might have a low KDE value, suggesting that their data value is in a sparsely populated region that likely indicates an outlier or rare clinical case.
Therefore, this hybrid approach that relies on both GMM and KDE to enrich the feature space can capture both subgroup membership and local uncertainty, which is particularly important in medical datasets.
2.2.2. Classification Frameworks
After enriching the feature space with GMM and KDE-based features, three classification frameworks were designed to evaluate the effectiveness of the proposed approach. The first framework trains the classification model on the concatenation of the original and enriched features to assess the direct contribution of feature augmentation. Building on this, two ensemble learning frameworks were introduced to further investigate the predictive value of the enriched feature space, as illustrated in Figure 4. The first ensemble employs a block-wise stacking strategy, in which base classifiers are trained on individual feature blocks (each original feature together with its corresponding GMM and KDE representations), and their outputs are combined using a meta-classifier. The second ensemble adopts a block-wise averaging scheme, where probability predictions from the same block-wise classifiers are aggregated through simple averaging to form the final decision. These three frameworks enable a systematic comparison between single-model learning and ensemble-based strategies, providing insights into the impact of feature enrichment on predictive performance.
Figure 4.
The block-wise ensemble learning framework for diabetes prediction. Each feature is first enriched with its corresponding GMM cluster probabilities and KDE log-density values, forming a feature block consisting of an original feature (O) together with its GMM and KDE representations. For each block, a base classifier is trained independently to generate predicted probabilities. These probability outputs are then concatenated to construct a meta-feature space. Two ensemble strategies are subsequently applied. In the block-wise stacking ensemble framework, the concatenated probability vectors serve as input to a meta-classifier for final prediction. In the block-wise soft voting ensemble framework, the average of the predicted probabilities across all feature blocks is used to determine the final classification.
2.3. Evaluation Metrics
To assess the performance of the classification models, particularly in the context of imbalanced datasets, we employ several evaluation metrics that capture both minority and majority class performance:
- Accuracy measures the proportion of correctly predicted cases to the total cases:where TP (True Positive) represents cases in which the model correctly predicts diabetic instances, TN (True Negative) represents cases in which the model correctly predicts non-diabetic instances, FP (False Positive) represents cases in which the model incorrectly predicts diabetic instances, and FN (False Negative) represents cases in which the model incorrectly predicts non-diabetic instances.Although widely used, accuracy alone can be misleading in imbalanced datasets, as a model biased toward the majority class may achieve high accuracy while failing to detect minority (diabetic) cases.
- Precision measures the proportion of correctly predicted positive cases out of all cases predicted as positive:It reflects the reliability of the model in minimizing false positives, which is crucial for avoiding unnecessary interventions.
- Sensitivity (Recall or True Positive Rate) indicates the proportion of actual positive cases that were correctly identified:
- Specificity (True Negative Rate) measures the proportion of actual negative cases correctly identified:
- F1-score is the harmonic mean of precision and recall, providing a balance between the two:It provides a balanced measure between precision and recall, particularly suitable for imbalanced datasets.
- Area Under the ROC Curve (AUC) evaluates the ability of the model to distinguish between the positive and negative classes across all classification thresholds. An AUC of 1.0 indicates perfect classification, while 0.5 represents random guessing.
- Matthews Correlation Coefficient (MCC) is a balanced measure that takes into account all four quadrants of the confusion matrix and is especially informative in imbalanced datasets:MCC is especially informative for imbalanced datasets as it provides a balanced evaluation even when class sizes differ substantially.
In the context of diabetes prediction, the selected evaluation metrics provide complementary insights into clinical performance. Sensitivity is particularly important because false negatives may correspond to missed diabetes cases, delaying early intervention and increasing the risk of complications. Specificity helps limit false positives, thereby avoiding unnecessary diagnostic follow-up or treatment for non-diabetic individuals. AUC provides an overall measure of discriminative ability independent of decision thresholds, which is essential for clinical settings where risk stratification may vary. F1-score balances precision and recall under class imbalance, while MCC offers a robust, threshold-independent summary of model quality that accounts for all four outcomes in the confusion matrix. Together, these metrics enable a comprehensive and clinically relevant evaluation of model performance in both balanced and highly imbalanced diabetes prediction.
3. Experimental Results
This section presents the experimental setup and the results obtained using the enriched feature vectors generated by the proposed approach.
3.1. Experimental Setup
To evaluate the effectiveness of the proposed feature space enrichment framework, experiments were conducted on two publicly available diabetes datasets: the PIMA Indian Diabetes dataset and the Kaggle Diabetes Prediction dataset. Both datasets contain a combination of categorical and continuous variables, with a binary target variable indicating the presence or absence of diabetes.
Each dataset was randomly split into training (75%) and testing (25%) subsets using a stratified sampling strategy to preserve the original class distribution. The preprocessing pipeline included imputing physiologically implausible zero values (for selected PIMA features) using the median of the corresponding feature, applying the Box–Cox transformation to reduce skewness in non-categorical features, and standardizing all continuous variables to achieve zero mean and unit variance.
For feature space enrichment, GMMs were applied independently to each transformed feature. The optimal number of mixture components was selected using the Bayesian Information Criterion (BIC), and the resulting soft cluster membership probabilities were incorporated as additional features. In parallel, KDE was applied to each feature, with the bandwidth automatically selected via cross-validation. The resulting log-density values were then appended to the feature set. Finally, the concatenation of the original and enriched features formed the extended feature space.
To address class imbalance in both datasets, a class-weighting strategy was employed. Specifically, the contribution of each class to the loss function was adjusted in proportion to its prevalence, such that misclassification of minority-class (diabetic) instances incurred a higher penalty. This approach enhances sensitivity to the minority class without introducing the drawbacks commonly associated with synthetic oversampling methods, such as data duplication or overfitting, while preserving the original data distribution.
Logistic Regression (LR) was used across all experimental setups to train the diabetes prediction models. It was selected for this study due to its simplicity and interpretability, and it demonstrated effectiveness in diabetes prediction, where it has been shown in many cases to outperform more complex models [28,38,39,40,41,42,43,44,45,46,47].
Hyperparameter tuning was conducted using grid search with stratified 5-fold cross-validation, repeated three times on the training data. Both L1 (Lasso) and L2 (Ridge) regularization penalties were evaluated, with the inverse regularization strength parameter (C) tuned over the values 0.01, 0.1, 1, and 10. The maximum number of iterations (max_iter) was set to 5000 to ensure model convergence.
3.2. Impact of Feature Enrichment on Prediction Performance
This section presents the experimental results of the proposed feature space enrichment framework evaluated on two diabetes datasets. The objective is to examine whether enriching the original feature space with GMM and KDE-based features can improve classification performance, particularly with respect to detecting minority-class (diabetic) cases.
For both datasets, Logistic Regression was used as the base classifier across all experimental setups. We evaluated three methodological configurations:
- Baseline model: Trained on the original features only.
- Feature-enriched model: Trained on the concatenation of original features with GMM-derived soft probabilities and KDE-based log-density estimates.
- Ensemble models: Incorporating enriched feature blocks through two ensemble strategies, block-wise stacking with Logistic Regression as the meta-classifier and block-wise soft voting.
Each experimental configuration was evaluated using stratified 5-fold cross-validation repeated three times on the training set, followed by independent assessment on the held-out test set. Performance was reported using a comprehensive set of metrics appropriate for imbalanced classification tasks, including accuracy, precision, sensitivity (recall), specificity, F1-score, AUC, and the MCC.
To facilitate interpretation, the results are presented separately for each dataset.
3.2.1. PIMA Dataset Results
The performance of the proposed framework on the PIMA dataset was evaluated using both the baseline and enriched feature representations. As shown in Table 1, the baseline model, which trains an LR classifier using the original features, achieved an AUC of 0.85 on the validation set, which decreased to 0.79 on the independent test set. Similarly, the F1-score reached 0.68 on the validation set but declined to 0.62 on the test set. In terms of sensitivity, the model correctly identified 68% of diabetic cases. These results indicate that, although the baseline model exhibits reasonable predictive performance, the observed decrease from validation to test metrics highlights limitations in generalizability when relying solely on the original feature space.
Table 1.
Performance comparison of baseline, feature-enriched, and ensemble models on the PIMA dataset.
When feature space enrichment using GMM and KDE was applied, the F1-score improved to 0.67 on the validation set and 0.68 on the test set, while the MCC increased from 0.38 to 0.49 on the test set. Although the improvement in AUC was modest, reaching 0.80 on the test set, the enriched representation consistently enhanced sensitivity, which is particularly important for identifying diabetic cases. Moreover, the consistent performance observed across the validation and test sets suggests that the enriched features contribute to improved model stability and generalizability.
The block-wise stacking ensemble achieved the strongest overall performance among all evaluated models. On the validation set, it attained an F1-score of 0.76 and an MCC of 0.52, representing the highest values across all approaches. On the test set, the stacking model maintained strong performance, achieving an F1-score of 0.68, an MCC of 0.47, and an AUC of 0.82, thereby outperforming both the baseline and the enriched LR models. This consistent performance indicates that the stacking strategy effectively integrates information from multiple feature blocks.
The block-wise soft voting ensemble also improved performance over the baseline, but its gains were less than stacking. On the test set, it reached an F1-score of 0.67 and MCC of 0.44, with an AUC of 0.81. While these results indicate moderate improvement, the soft voting framework did not leverage the feature-block structure as effectively as stacking.
To evaluate whether the observed gains in sensitivity are achieved at the expense of increased false positive rates or reduced precision, we analyzed the trade-offs among evaluation metrics. Compared with the baseline model, the feature-enriched framework achieves higher sensitivity while maintaining comparable precision and specificity, as shown in Table 2. In particular, the increase in the true positive rate is not accompanied by a disproportionate rise in false positives, indicating a balanced precision–recall behavior. This trade-off is clinically favorable, as reducing false negatives (missed diabetic cases) is generally prioritized over a moderate increase in follow-up screening.
Table 2.
Metric trade-off analysis on the PIMA dataset (test set).
Figure 5 presents the confusion matrices of the four models evaluated on the PIMA test set. The results show that the feature-enriched and ensemble configurations (stacking and soft voting) reduced the number of false negatives compared with the baseline model, indicating improved sensitivity to diabetic cases. In particular, the feature-enriched model and the stacking ensemble achieved a more balanced trade-off between correctly identifying diabetic and non-diabetic patients. These findings demonstrate the effectiveness of the proposed feature space enrichment in enhancing model generalization and reliability.
Figure 5.
Confusion matrices of the LR models evaluated on the PIMA test set. Each matrix displays the distribution of correctly and incorrectly classified cases, with true diabetic and non-diabetic samples on the vertical axis (actual class) and predicted outcomes on the horizontal axis (predicted class). The top left and bottom right cells represent correctly identified non-diabetic (TN) and diabetic (TP) cases, respectively, while the off-diagonal cells correspond to misclassifications: FP and FN.
Analysis of the confusion matrices reveals a consistent reduction in false negatives with only a marginal change in false positives, indicating that the proposed enrichment framework improves the detection of diabetic cases without substantially increasing unnecessary clinical alarms.
To assess robustness, we report the mean and standard deviation of performance metrics across stratified cross-validation folds, as shown in Table 3. The enriched model exhibits lower variability across folds while consistently improving sensitivity, indicating that the observed performance gains are stable and not driven by favorable data splits.
Table 3.
Cross-validation performance variability (mean ± standard deviation) across test folds.
Figure 6 presents the learning curves for the LR models trained on the PIMA dataset under three configurations: baseline, feature-enriched, and block-wise stacking ensemble. The baseline model exhibits a noticeable gap between training and validation accuracy, indicating mild overfitting due to limited feature expressiveness. In contrast, the feature-enriched model demonstrates smoother convergence and reduced log-loss, reflecting improved generalization. The stacking ensemble further stabilizes the learning process, achieving higher validation accuracy and lower loss across varying sample sizes. These learning curves confirm that the proposed enrichment strategy not only enhances predictive performance but also promotes more stable and efficient model training, thereby mitigating overfitting in small and imbalanced medical datasets.
Figure 6.
Learning curves for LR models trained on the PIMA dataset. Each panel shows the evolution of training and validation performance in terms of accuracy (left) and log-loss (right) as the number of training samples increases. (a) Baseline model using original features, (b) feature-enriched model incorporating GMM and KDE representations, and (c) block-wise stacking ensemble. The shaded regions represent the standard deviation over cross-validation folds. The curves demonstrate that feature enrichment and stacking improve convergence stability and reduce the generalization gap between training and validation performance.
Overall, as illustrated in Figure 7, the enriched features improve performance, stability, and generalization in the PIMA prediction task. In addition, the stacking ensemble achieves the highest AUC, making it the most effective configuration for this dataset.
Figure 7.
Comparison of test performance metrics for PIMA prediction across three approaches: baseline (original features), feature space enrichment (original + GMM + KDE), and block-wise stacking. The bar plots show values of AUC (%), Sensitivity (%), Specificity (%), and MCC (%). Results indicate that feature enrichment and stacking consistently improve the values relative to the baseline.
To evaluate the robustness of the probabilistic enrichment with respect to modeling choices, we conducted a sensitivity analysis by varying the number of Gaussian components (K) around the BIC-selected value for each feature. Table 4 reports the classification performance across all tested configurations. The results indicate that performance remains largely stable for different values of K, with variations in F1-score, AUC, and MCC generally confined to a narrow range (typically ).
Table 4.
Sensitivity of enriched model performance to varying GMM components (K). The final selected K per feature (determined by BIC) is indicated in the last column.
Notably, for features such as Pregnancies, SkinThickness, and DiabetesPedigreeFunction, performance remained nearly unchanged across all tested values of K, indicating that the mixture representations for these variables are inherently stable. In contrast, for Glucose, Insulin, and BloodPressure, slightly higher MCC and AUC values were observed at , , and , respectively. Moreover, BMI and Age benefited more substantially from higher values of K (4 and 10), reflecting greater heterogeneity in the underlying distributions of these clinical attributes.
The final selected numbers of components (last column in Table 4) coincide with the best or near-best performing configurations, confirming that BIC-based selection is not only theoretically well grounded but also empirically stable under perturbation.
In addition to the GMM component analysis, we evaluated the robustness of the KDE-based density features by varying the kernel bandwidth parameter within the range [0.5,2.0]. As summarized in Table 5, model performance remained nearly identical across all bandwidth settings, with no measurable change in F1-score and only negligible fluctuations in AUC and MCC (less than 0.002). These results indicate that the KDE-derived enriched features are highly stable and exhibit minimal sensitivity to the choice of bandwidth.
Table 5.
Impact of KDE bandwidth variation on enriched model performance.
The selected bandwidth value of (highlighted in the table) yields performance equivalent to or slightly better than the other tested settings. This stability indicates that KDE-based enrichment does not require precise hyperparameter tuning to achieve optimal performance and can generalize effectively without extensive parameter search, thereby enhancing reproducibility for future applications and external datasets.
The subgroup misclassification analysis presented in Table 6 shows that the proposed GMM–KDE enrichment improves prediction performance across most clinical intervals compared with the baseline model. The most notable gains are observed in borderline ranges, particularly for mid-level Glucose (+0.1087 and +0.1295), BMI (+0.1221 and +0.1043), and Age (+0.1292) subgroups, where class boundaries are inherently more ambiguous. These findings indicate that the probabilistic enrichment facilitates better discrimination among patients whose clinical profiles fall within overlapping distributions. In contrast, extreme values (e.g., very low or very high glucose levels and very high age) exhibit smaller improvements, suggesting that these cases remain more challenging and leave room for further methodological enhancements. Overall, the results confirm that the enriched feature space primarily strengthens discrimination in clinically ambiguous regions while maintaining stable performance across different subgroups.
Table 6.
Subgroup misclassification analysis comparing baseline and enriched model performance across clinical quartiles. The results show that GMM-KDE feature enrichment provides the largest improvement for borderline cases such as mid-range Glucose, BMI, and Age groups.
Given the limited sample size of the PIMA dataset and the use of probabilistic feature enrichment, we conducted an explicit robustness analysis using nested cross-validation to assess the risk of overfitting and optimistic bias. A stratified 5 × 5 nested cross-validation protocol was employed, in which the outer loop was used for unbiased performance estimation and the inner loop for model and hyperparameter selection. All preprocessing steps, including feature scaling, Box–Cox transformation, and GMM/KDE-based feature enrichment, were performed strictly within each outer training fold and subsequently applied to the corresponding validation and test partitions. This procedure ensured that no distributional information was shared across folds.
Table 7 reports the mean and standard deviation of performance metrics across the outer folds. The baseline model trained on the original features achieved an average AUC of 0.81 ± 0.03 and an MCC of 0.39 ± 0.05, while the enriched model achieved a higher AUC of 0.84 ± 0.02 and MCC of 0.48 ± 0.04. Importantly, the enriched representation also improved sensitivity (0.76 ± 0.05) compared to the baseline (0.69 ± 0.06), with comparable variability across folds.
Table 7.
Nested cross-validation results on the PIMA dataset (mean ± std).
The relatively low standard deviations observed across all evaluation metrics indicate stable performance and demonstrate that the improvements achieved through probabilistic feature enrichment are consistent across different data splits, rather than being driven by a small number of favorable partitions. These results confirm that the proposed enrichment strategy enhances generalization on the PIMA dataset without inducing overfitting.
3.2.2. EHRs Dataset Results
The EHRs dataset is substantially larger than the PIMA dataset and exhibits pronounced class imbalance, with a significantly higher number of non-diabetic samples compared to diabetic cases. Despite this imbalance, Table 8 shows that the baseline LR model already demonstrates strong predictive capability, achieving AUC values of approximately 0.96 on both the validation and test sets. These results indicate excellent discrimination between diabetic and non-diabetic cases.
Table 8.
Performance comparison of baseline, feature-enriched, and ensemble models on the EHRs dataset.
Introducing feature enrichment through GMM and KDE further improved performance relative to the baseline model. The results show that sensitivity increased from 0.88 to 0.91, enhancing the model’s ability to correctly identify diabetic cases. This improvement was accompanied by increases in the F1-score (from 0.57 to 0.61) and MCC (from 0.56 to 0.61). These findings indicate that feature enrichment improves the balance between sensitivity and specificity while preserving overall accuracy and maintaining stable AUC performance.
Although the ensemble frameworks based on stacking and soft voting improved performance relative to the baseline model, the observed gains were modest. In particular, the stacking approach achieved a slight increase in AUC compared with the feature-enriched model, while no substantial improvements were observed across the remaining evaluation metrics.
On the EHRs dataset, feature enrichment increases sensitivity while slightly reducing the false positive rate compared with the baseline model, as shown in Table 9, indicating improved detection of diabetic cases without an increase in false alarms.
Table 9.
Metric trade-off analysis on the EHRs dataset (test set).
Figure 8 displays the confusion matrices for the EHRs dataset. Across all implemented methodologies, the models exhibit strong discrimination between diabetic and non-diabetic samples, consistent with the high AUC values reported earlier. The feature-enriched and ensemble approaches (stacking and soft voting) further reduced the number of false negatives compared with the baseline model, correctly identifying a greater proportion of diabetic cases while maintaining low false-positive rates. These results confirm that the enriched feature representations enhance the model’s ability to generalize and sustain balanced predictive performance, even in the presence of substantial class imbalance.
Figure 8.
Confusion matrices of the LR models evaluated on the EHRs test set. Each matrix displays the distribution of correctly and incorrectly classified cases, with true diabetic and non-diabetic samples on the vertical axis (actual class) and predicted outcomes on the horizontal axis (predicted class). The top left and bottom right cells represent correctly identified non-diabetic (TN) and diabetic (TP) cases, respectively, while the off-diagonal cells correspond to misclassifications: FP and FN.
Figure 9 presents the learning curves of LR models for the EHRs dataset, comparing the baseline and feature-enriched configurations. Unlike the smaller PIMA dataset, both models exhibit rapid convergence and minimal divergence between training and validation curves, indicating well-generalized learning without evidence of overfitting. The stability of the log-loss across increasing sample sizes further confirms reliable optimization behavior and model consistency. The feature-enriched configuration demonstrates slightly higher accuracy and lower log-loss, suggesting that the GMM and KDE-derived features enable the model to capture finer probabilistic structure in the data. Overall, these learning curves highlight the robustness and scalability of the proposed enrichment framework when applied to large and heterogeneous medical datasets.
Figure 9.
Learning curves for LR models trained on the EHRs dataset. Each panel shows the evolution of training and validation performance in terms of accuracy (left) and log-loss (right) as the number of training samples increases. (a) Baseline model using original features, and (b) feature-enriched model incorporating GMM and KDE representations. The shaded regions represent the standard deviation over cross-validation folds. The curves demonstrate that feature enrichment improves convergence stability and reduces the generalization gap between training and validation performance.
Overall, as illustrated in Figure 10, the feature-enriched model improves predictive performance, particularly by increasing sensitivity and enhancing the F1-score and MCC, while maintaining stable AUC and accuracy. In contrast, ensemble methods such as stacking and voting yield only marginal additional gains, achieving slight improvements in AUC but having minimal impact on the remaining evaluation metrics compared with the feature-enriched model.
Figure 10.
Comparison of test performance metrics for EHRs prediction across three approaches: baseline (original features), feature space enrichment (original + GMM + KDE), and block-wise stacking. The bar plots show values of AUC (%), Sensitivity (%), Specificity (%), and MCC (%). Results indicate that feature enrichment model provides the best results.
3.3. Interpretability and Feature Contribution Analysis
To enhance transparency and identify which enriched variables contribute most to diabetes prediction, a post hoc interpretability analysis was conducted using SHAP (SHapley Additive exPlanations) [48]. SHAP quantifies the marginal contribution of each feature to the model output and enables assessment of whether the performance gains achieved through enrichment arise from a small subset of highly informative probabilistic features or from a more distributed contribution across the enriched feature space.
Figure 11 presents the mean absolute SHAP values for the Logistic Regression model trained on the enriched PIMA dataset. After feature scaling, the results indicate that BMI is the most influential predictor, followed closely by Glucose, which is consistent with established clinical knowledge. Importantly, several enriched variables appear prominently among the top contributors, including Age_KDE, Age_GMM_Prob_5, BMI_GMM_Prob_1, and BMI_GMM_Prob_2. This demonstrates that the enrichment process introduces meaningful latent representations rather than redundant transformations. In addition, multiple KDE-based features rank in the mid-to-lower importance range, indicating that density-based features contribute to prediction, albeit with lower relative impact compared to GMM-derived probabilities and primary clinical variables.
Figure 11.
Mean absolute SHAP feature importance for the enriched PIMA model, showing contribution strength of original, GMM-derived, and KDE-derived features after scaling.
The SHAP beeswarm visualization in Figure 12 provides deeper insight into the directional effect of each feature. Each point represents a sample, with red indicating high feature values and blue representing low values. A clear positive trend is visible for both BMI and Glucose, where high values push predictions toward the diabetic class, matching real clinical behavior. Several enriched variables, particularly Age_KDE and GMM-based cluster memberships such as Age_GMM_Prob_5 and BMI_GMM_Prob_1, also show structured and non-random contribution patterns, confirming that the enrichment framework captures latent metabolic subgroups and density-based deviations that influence classification. KDE features tend to cluster near zero with occasional strong positive impact for low–density regions, suggesting their role in detecting atypical or outlier-like risk profiles.
Figure 12.
SHAP beeswarm summary for the enriched PIMA model. Color reflects feature magnitude (red = high; blue = low), while horizontal displacement indicates positive or negative effect on diabetes prediction.
Overall, the SHAP analysis confirms that the enriched feature space contributes meaningfully to prediction rather than acting as a passive dimensional expansion. The integration of GMM and KDE-derived features alongside the original clinical variables results in a more expressive representation, leading to improved sensitivity and enhanced classification stability. Although some lower-ranked KDE and GMM features exhibit limited individual impact, they do not degrade performance, suggesting that targeted feature pruning or redundancy analysis could further optimize dimensionality in future work. This interpretability assessment corroborates the performance improvements reported in Section 3.2.1.
4. Discussion
The experimental results obtained from both the PIMA and EHRs datasets demonstrate the effectiveness of the proposed feature space enrichment framework in improving diabetes prediction. The consistent performance gains observed across datasets of different sizes and class imbalance levels underscore the generalizability of the proposed approach.
On the smaller and more imbalanced PIMA dataset, the baseline LR model achieved only moderate performance, with noticeable reductions in generalization from the validation to the test sets. Incorporating GMM and KDE-derived features significantly improved both stability and sensitivity, confirming that feature space enhancement is particularly valuable when working with limited or weakly informative predictors. Furthermore, the block-wise stacking ensemble achieved the best overall performance, supporting prior findings that meta-learning approaches can more effectively integrate complementary feature information than simple averaging strategies [13,14].
In addition to quantitative performance evaluation, the SHAP-based interpretability analysis demonstrated that both original clinical variables and enriched probabilistic features contribute meaningfully to the final predictions. After feature scaling, BMI and Glucose emerged as the most influential predictors in the PIMA model, consistent with established clinical knowledge. Importantly, several enriched features, including Age_KDE, Age_GMM_Prob_5, BMI_GMM_Prob_1, and BMI_GMM_Prob_2, exhibited substantial impact, confirming that the performance gains reported in Section 3.2.1 arise from the additional probabilistic structure introduced by GMM and KDE rather than from the original features alone. The SHAP beeswarm visualization further revealed interpretable patterns: higher values of BMI and Glucose consistently shifted predictions toward the diabetic class, while KDE-based features frequently highlighted low-density patient profiles associated with atypical or high-risk metabolic conditions. Collectively, these findings indicate that the enriched features provide complementary information beyond traditional clinical indicators, enhancing model transparency and reinforcing the clinical relevance of the proposed enrichment framework.
Because the PIMA dataset contains a relatively small number of samples, we carefully addressed the risk of overfitting and potential information leakage during probabilistic feature construction. All GMM and KDE models were fitted exclusively on the training folds within the cross-validation pipeline, and enriched features for validation and test instances were generated using models learned solely from their corresponding training subsets. This procedure prevents the density estimators from accessing information outside their respective folds and avoids leakage of distributional patterns. Furthermore, the use of stratified repeated 5-fold cross-validation, together with regularized classifiers and class-weighting, reduces variance and helps preserve model generalization.
In contrast, on the substantially larger EHRs dataset, where the baseline model already demonstrated strong discriminative performance, the proposed enrichment yielded incremental yet consistent improvements in sensitivity, F1-score, and MCC without compromising AUC or specificity. These findings indicate that the proposed framework not only generalizes effectively to large-scale datasets but also provides measurable benefits in identifying minority diabetic cases, even when overall predictive performance is already high.
Although the enriched features are mathematically derived, they offer intuitive interpretations in clinical settings. GMM-based probabilities reflect the degree to which a patient belongs to latent subgroups characterized by similar patterns in variables such as glucose, BMI, or HbA1c. These subgroups may correspond to clinically meaningful phenotypes, including patients exhibiting early metabolic dysregulation or those with more stable metabolic profiles. In parallel, KDE-derived density values indicate how typical or atypical a patient’s measurements are relative to the broader population. Low-density values may signal rare or extreme combinations of risk factors, which are often associated with elevated clinical concern. Taken together, these probabilistic features help identify clusters of patients with shared characteristics while also highlighting individuals who reside in high-risk or unusual regions of the feature space, thereby enhancing clinical interpretability and supporting more informed decision-making.
The proposed framework introduces additional preprocessing through GMM and KDE modeling; however, the associated computational cost remains modest, as both models are fitted independently for each feature rather than on the full multivariate space. This per-feature design results in computational complexity that scales approximately linearly with the number of variables, enabling efficient feature enrichment even for large datasets. Moreover, feature enrichment is performed only once during model training, while deployment in a clinical environment requires evaluating mixture probabilities and KDE values for new patient records, followed by logistic regression inference. These operations are computationally lightweight and can be executed in real time, making the proposed framework practical for routine clinical use.
The proposed GMM–KDE enrichment framework demonstrates consistent performance gains; however, this study focuses exclusively on probabilistic feature representations. Other feature space transformation strategies, such as Principal Component Analysis (PCA) [49], Independent Component Analysis (ICA) [50], autoencoder-based embeddings [51], or hybrid pipelines combining statistical and deep representations, may yield competitive or complementary improvements. Consequently, the observed performance enhancement should not be interpreted as unique to GMM and KDE-derived features, and systematic benchmarking against alternative enrichment techniques remains an important direction for future work.
A second limitation concerns the scope of the feature relevance assessment. While SHAP analysis was conducted and demonstrated that enriched probabilistic features contribute meaningfully to the prediction process, the study does not evaluate whether all generated GMM/KDE components are equally informative or whether some may be redundant or collinear with the original clinical predictors. Future work should therefore extend the relevance analysis toward redundancy-aware feature selection, for example, by using mRMR [52,53], ReliefF [54], or sparsity-inducing models such as LASSO or ElasticNet [55], to retain only the most discriminative representations and avoid unnecessary dimensionality inflation. In addition, projection-based relevance evaluation may help assess whether the enriched features meaningfully separate diabetic and non-diabetic cases.
5. Conclusions
This study introduces a probabilistic feature enrichment framework for early diabetes prediction by integrating GMM and KDE into the feature representation process. By augmenting the original clinical variables with probabilistic descriptors, the proposed framework captures latent distributional characteristics that may not be fully represented by conventional features, thereby improving the discriminative capability of standard classifiers without increasing model complexity. Comprehensive experiments conducted on two benchmark datasets—the smaller and more imbalanced PIMA dataset and the larger EHRs dataset—demonstrate the robustness of the proposed approach across heterogeneous data settings. On the PIMA dataset, feature enrichment led to substantial improvements in sensitivity and generalization performance, underscoring its effectiveness in scenarios with limited or weakly informative predictors. On the EHRs dataset, where the baseline model already exhibited strong discriminative performance, the proposed enrichment consistently improved sensitivity, F1-score, and MCC, confirming its ability to enhance predictive balance in highly imbalanced clinical data. Importantly, the use of class-weighted learning enabled improved detection of minority diabetic cases without the drawbacks associated with synthetic oversampling techniques.
Overall, the findings highlight the clinical significance of probabilistic feature enrichment, as improved sensitivity translates into fewer false negatives and a reduced risk of missed diabetes diagnoses—an essential factor for early intervention and the prevention of complications. Future work will extend this framework to more advanced classifiers, such as Support Vector Machines (SVMs) and XGBoost, and will further evaluate its applicability across broader healthcare prediction tasks.
Future work will focus on refining the enriched feature space through feature attribution and relevance–redundancy analysis to identify the most informative probabilistic components and reduce dimensionality without sacrificing discriminative performance. In addition, extending the framework to multi-class prediction settings, performing case-level and subgroup-specific error analyses, and exploring alternative or hybrid enrichment strategies, such as PCA, ICA, and autoencoder-based representations—represent promising directions for future research.
Author Contributions
Conceptualization, H.A. and S.Q.; methodology, H.A. and Y.Q.; validation, Y.Q. and M.H.; formal analysis, H.A. and Y.Q.; investigation, H.A.; writing—original draft preparation, H.A.; writing—review and editing, S.Q. and M.H.; visualization, H.A. and M.H.; supervision, S.Q.; project administration, S.Q. All authors have read and agreed to the published version of the manuscript.
Funding
This research received no external funding.
Data Availability Statement
The dataset analyzed in this study is publicly available from Kaggle (https://www.kaggle.com/datasets/uciml/pima-indians-diabetes-database, accessed on 29 June 2025 and https://www.kaggle.com/datasets/iammustafatz/diabetes-prediction-dataset, accessed on 29 June 2025). All code used for preprocessing, probabilistic feature enrichment (GMM and KDE), and classification experiments is available from the corresponding author upon reasonable request.
Conflicts of Interest
The authors declare no conflicts of interest.
References
- Sun, H.; Saeedi, P.; Karuranga, S.; Pinkepank, M.; Ogurtsova, K.; Duncan, B.B.; Stein, C.; Basit, A.; Chan, J.C.; Mbanya, J.C.; et al. IDF Diabetes Atlas: Global, regional and country-level diabetes prevalence estimates for 2021 and projections for 2045. Diabetes Res. Clin. Pract. 2022, 183, 109119. [Google Scholar] [CrossRef] [Scilit] [PubMed]
- International Diabetes Federation. IDF Diabetes Atlas, 11th ed.; Technical Report; International Diabetes Federation: Brussels, Belgium, 2025. [Google Scholar]
- World Health Organization. Diabetes Fact Sheet. 2024. Available online: https://www.who.int/news-room/fact-sheets/detail/diabetes (accessed on 29 June 2025).
- Chatterjee, S.; Khunti, K.; Davies, M.J. Type 2 Diabetes Mellitus; StatPearls Publishing: Treasure Island, FL, USA, 2024. Available online: https://www.ncbi.nlm.nih.gov/books/NBK513253/ (accessed on 24 June 2025).
- Campos, C.d.S. Chronic hyperglycemia and glucose toxicity: Pathology and clinical sequelae. Postgrad. Med. 2012, 124, 90–97. [Google Scholar] [CrossRef] [Scilit] [PubMed]
- Tabák, A.G.; Herder, C.; Rathmann, W.; Brunner, E.J.; Kivimäki, M. Prediabetes: A high-risk state for diabetes development. Lancet 2012, 379, 2279–2290. [Google Scholar] [CrossRef] [Scilit] [PubMed]
- Shailaja, K.; Seetharamulu, B.; Jabbar, M.A. Machine Learning in Healthcare: A Review. In Proceedings of the 2018 International Conference on Electronics, Communication and Aerospace Technology (ICECA), Coimbatore, India, 29–31 March 2018; pp. 910–914. [Google Scholar] [CrossRef] [Scilit]
- Kavakiotis, I.; Tsave, O.; Salifoglou, A.; Maglaveras, N.; Vlahavas, I.; Chouvarda, I. Machine Learning and Data Mining Methods in Diabetes Research. Comput. Struct. Biotechnol. J. 2017, 15, 104–116. [Google Scholar] [CrossRef] [Scilit]
- Toleva, B.; Atanasov, I.; Ivanov, I.; Hooper, V. An Effective Methodology for Diabetes Prediction in the Case of Class Imbalance. Bioengineering 2025, 12, 35. [Google Scholar] [CrossRef] [Scilit]
- Sharma, A.; Guleria, K.; Goyal, N. Prediction of Diabetes Disease Using Machine Learning Model. In Proceedings of the International Conference on Communication, Computing and Electronics Systems. Lecture Notes in Electrical Engineering; Springer: Singapore, 2021; Volume 768, pp. 551–558. [Google Scholar] [CrossRef] [Scilit]
- Ağraz, M.; Eğrioğlu, E.; Baš, E.; Chen, M.; Göksülük, D.; Furkan Burak, M. Diabetes development prediction using a hybrid model combining dendritic artificial neuron model and logistic regression. Endocrinol. Res. Pract. 2025, 29, 84–93. [Google Scholar] [CrossRef] [Scilit]
- Ahmed, A.; Khan, J.; Arsalan, M.; Ahmed, K.; Shahat, A.A.; Alhalmi, A.; Naaz, S. Machine Learning Algorithm-Based Prediction of Diabetes Among Female Population Using PIMA Dataset. Healthcare 2024, 13, 37. [Google Scholar] [CrossRef] [Scilit]
- Reza, M.; Islam, M.R.; Das, N.; Hoque, M.N.; Rahman, M.S.; Rahman, M.M. Improving diabetes disease patients classification using stacking ensemble method with PIMA and local healthcare data. Heliyon 2024, 10, e24536. [Google Scholar] [CrossRef] [Scilit]
- Sivashankari, M.; Vengatesan, K. Diabetes prediction using machine learning algorithms. Mater. Today Proc. 2022, 51, 382–386. [Google Scholar] [CrossRef] [Scilit]
- Tripathi, R.P.; Sharma, M.; Gupta, A.K.; Pandey, D.; Pandey, B.K.; Shahul, A.; George, A.S.H. Timely prediction of diabetes by means of machine learning practices. Augment. Hum. Res. 2023, 8, 1. [Google Scholar] [CrossRef] [Scilit]
- Shi, J.; Yu, G.; Zhang, C.; Han, L.; Li, X.; Xu, W.; Zhang, L. Integrated Bagging–Random Forest learning model for diabetes prediction. PeerJ Comput. Sci. 2024, 10, e2302. [Google Scholar] [CrossRef] [Scilit] [PubMed]
- Talukder, M.A.; Islam, M.M.; Uddin, M.A.; Kazi, M.K.I.; Khalid, M.; Akhter, A.; Chowdhury, S.Z.; Kim, J.; Moni, M.A. Toward reliable diabetes prediction: Innovations in data engineering and machine learning applications. Digit. Health 2024, 10, 20552076241271867. [Google Scholar] [CrossRef] [Scilit] [PubMed]
- Uddin, M.A.; Islam, M.M.; Talukder, M.A.; Hossain, M.A.A.; Akhter, A.; Aryal, S.; Muntaha, M. Machine Learning Based Diabetes Detection Model for False Negative Reduction. Biomed. Mater. Devices 2024, 2, 427–443. [Google Scholar] [CrossRef] [Scilit]
- Qawqzeh, Y.K. Neural Network-based Diabetic Type II High-Risk Prediction using Photoplethysmogram Waveform Analysis. Int. J. Adv. Comput. Sci. Appl. 2019, 10. [Google Scholar] [CrossRef] [Scilit]
- Suwalska, A.; Polańska, J. GMM-Based Expanded Feature Space as a Way to Extract Useful Information for Rare Cell Subtypes Identification in Single-Cell Mass Cytometry. Int. J. Mol. Sci. 2023, 24, 14033. [Google Scholar] [CrossRef] [Scilit]
- Ghaderi, P.; Nosouhi, M.; Jordanic, M.; Marateb, H.R.; Mañanas, M.A.; Farina, D. Kernel Density Estimation of Electromyographic Signals and Ensemble Learning for Highly Accurate Classification of a Large Set of Hand/Wrist Motions. Front. Neurosci. 2022, 16, 795943. [Google Scholar] [CrossRef] [Scilit]
- Chushig-Muzo, D.; Soguero-Ruiz, C.; de Miguel-Bohoyo, P.; Mora-Jiménez, I. Interpreting clinical latent representations using autoencoders and probabilistic models. Comput. Methods Programs Biomed. 2021, 207, 106181. [Google Scholar] [CrossRef] [Scilit]
- Smith, J.; Everhart, J.; Dickson, W.; Knowler, W.; Johannes, R. Using the ADAP learning algorithm to forecast the onset of diabetes mellitus. In Proceedings of the Annual Symposium on Computer Application in Medical Care, Orlando, FL, USA, 7–11 November 1988; pp. 261–265. [Google Scholar]
- Santhanam, T.; Padmavathi, M.S. Comparison of K-Means clustering and statistical outliers in reducing medical datasets. In Proceedings of the 2015 International Conference on Computing and Network Communications (CoCoNet); IEEE: Piscataway, NJ, USA, 2015; pp. 1–6. [Google Scholar]
- Padmavathi, M.S.; Sumathi, C.P. A New Method of Data Preparation for Classifying Diabetes Dataset. Indian J. Sci. Technol. 2019, 12, 1–9. [Google Scholar] [CrossRef] [Scilit]
- Asha, V.; Lamani, M.R.; Padmaja, K.; Gondhale, T.A. Enhancing diabetes prediction accuracy with AdvanSVM: A machine learning approach using the PIMA dataset. Seybold Rep. J. 2024, 19, 51–72. [Google Scholar]
- Idris, N.; Ismail, M.A.; Jaya, I.; Osman, A.; Abulfaraj, A.; Binzagr, F. Stacking with Recursive Feature Elimination-Isolation Forest for classification of diabetes mellitus. PLoS ONE 2024, 19, e0302595. [Google Scholar] [CrossRef] [Scilit]
- Xia, Y. A Machine Learning-Based Prediction Study for Type 2 Diabetic Mellitus. Sci. Technol. Eng. Chem. Environ. Prot. 2024, 1. [Google Scholar] [CrossRef] [Scilit]
- Deng, T.; Luo, W.; Huang, K. Identifying Key Factors that Influence Diabetes Prediction: A Meta Analysis of Two Datasets and Three Machine Learning Models. Appl. Comput. Eng. 2025, 132, 200–212. [Google Scholar] [CrossRef] [Scilit]
- Maza, D.; Ojo, J.O.; Akinlade, G.O. A predictive machine learning framework for diabetes. Turk. J. Eng. 2024, 8, 583–592. [Google Scholar] [CrossRef] [Scilit]
- Mustafa, M. Diabetes Prediction Dataset. 2022. Available online: https://www.kaggle.com/datasets/iammustafatz/diabetes-prediction-dataset (accessed on 24 May 2025).
- Reynolds, D.A. Gaussian mixture models. In Encyclopedia of Biometrics; Springer: Boston, MA, USA, 2009; pp. 659–663. [Google Scholar]
- Zeng, H.; Cheung, Y.M. A new feature selection method for Gaussian mixture clustering. Pattern Recognit. 2009, 42, 243–250. [Google Scholar] [CrossRef] [Scilit]
- Zhou, B.; Hansen, J.H. Unsupervised audio stream segmentation and clustering via the Bayesian information criterion. In Proceedings of the INTERSPEECH, Beijing, China, 16–20 October 2000; pp. 714–717. [Google Scholar]
- Peter, D.H. Kernel estimation of a distribution function. Commun. Stat.-Theory Methods 1985, 14, 605–620. [Google Scholar] [CrossRef] [Scilit]
- Gidel, S.; Blanc, C.; Chateau, T.; Checchin, P.; Trassoudaine, L. Comparison between GMM and KDE Data Fusion methods for particle filtering: Application to pedestrian detection from laser and video measurements. In Proceedings of the 13th International Conference on Information Fusion, Edinburgh, UK, 26–29 July 2010; pp. 1–7. [Google Scholar]
- Weglarczyk, S. Kernel density estimation and its application. ITM Web of Conf. 2018, 23, 00037. [Google Scholar] [CrossRef] [Scilit]
- Shakya, S.; Ceh-Varela, E.; Maes, L. Machine Learning Analysis of Factors Contributing to Diabetes Development. Cloud Comput. Data Sci. 2024, 5, 157–182. [Google Scholar] [CrossRef] [Scilit]
- Rajput, M.; Khedgikar, S. Diabetes prediction and analysis using medical attributes: A Machine learning approach. J. Xi’an Univ. Archit. Technol. 2022, 14, 98–103. [Google Scholar]
- Mousa, G.; Abu-Hassan, H.; Al-Rimmawi, H. Prediction of Type 2 Diabetes using logistic regression techniques. Turk. J. Comput. Math. Educ. 2024, 15, 1–13. [Google Scholar]
- Tigga, N.; Garg, S. Predicting Type 2 Diabetes Using Logistic Regression. In Fourth International Conference on Microelectronics, Computing and Communication Systems; Springer: Ranchi, India, 2019; pp. 491–500. [Google Scholar]
- Joshi, R.; Dhakal, C. Predicting Type 2 Diabetes Using Logistic Regression and Machine Learning Approaches. Int. J. Environ. Res. Public Health 2021, 18, 7346. [Google Scholar] [CrossRef] [Scilit]
- Rajendra, P.; Latifi, S. Prediction of diabetes using logistic regression and ensemble techniques. Comput. Methods Programs Biomed. Update 2021, 1, 100032. [Google Scholar] [CrossRef] [Scilit]
- Pradhan, A. A Comprehensive Analysis of Diabetes Risk Prediction Using Logistic Regression. Int. J. Comput. Trends Technol. (IJCTT) 2024, 72, 192–219. [Google Scholar] [CrossRef] [Scilit]
- Lynam, A.L.; Dennis, J.M.; Owen, K.R.; Oram, R.A.; Jones, A.G.; Shields, B.M.; Ferrat, L.A. Logistic regression has similar performance to optimised machine learning algorithms in a clinical setting: Application to the discrimination between type 1 and type 2 diabetes in young adults. Diagn. Progn. Res. 2020, 4, 6. [Google Scholar] [CrossRef] [Scilit] [PubMed]
- Nguyen, B.; Zhang, Y. A Comparative Study of Diabetes Prediction Based on Lifestyle Factors Using Machine Learning. arXiv 2025, arXiv:2503.04137. [Google Scholar] [CrossRef] [Scilit]
- Noh, J.H.; Kim, J.H. Development of Causal Discovery-Based Predictive Models for Type 2 Diabetes Mellitus Using a Nationwide Health Screening Dataset. Biomedicines 2025, 13, 490. [Google Scholar] [CrossRef] [Scilit]
- Lundberg, S.M.; Lee, S.I. A unified approach to interpreting model predictions. In Proceedings of the 31st International Conference on Neural Information Processing Systems; Curran Associates Inc.: Red Hook, NY, USA, 2017; pp. 4768–4777. [Google Scholar]
- Pechenizkiy, M.; Tsymbal, A.; Puuronen, S. PCA-based feature transformation for classification: Issues in medical diagnostics. In Proceedings of the 17th IEEE Symposium on Computer-Based Medical Systems, Bethesda, MD, USA, 25 June 2004; Volume 17, pp. 535–540. [Google Scholar] [CrossRef] [Scilit]
- Kwak, N.; Choi, C.H. Feature Extraction Based on ICA for Binary Classification Problems. IEEE Trans. Knowl. Data Eng. 2003, 15, 1374–1388. [Google Scholar] [CrossRef]
- Li, H.; Feng, A.; Lin, B.; Su, H.; Liu, Z.; Duan, X.; Pu, H.; Wang, Y. A novel method for credit scoring based on feature transformation and ensemble model. PeerJ Comput. Sci. 2021, 7, e579. [Google Scholar] [CrossRef] [Scilit]
- Mary, P.; Nagarajan, R. Feature Selection in Microarray using Proposed Hybrid Minimum Redundancy-Maximum Relevance (MRMR) and Modified Genetic Algorithm (MGA). Int. J. Exp. Res. Rev. 2024, 39, 82–91. [Google Scholar] [CrossRef] [Scilit]
- Wang, G.; Lauri, F.; Hajjam, A. Feature Selection by mRMR Method for Heart Disease Diagnosis. IEEE Access 2022, 10, 100786–100796. [Google Scholar] [CrossRef] [Scilit]
- Li, J.; Liu, H. Feature Selection and Classification Model Construction on Type 2 Diabetic Patients’ Data. In Proceedings of the 4th International Conference on Advances in Data Mining; Lecture Notes in Computer Science; Springer: Berlin/Heidelberg, Germany, 2004; Volume 3275, pp. 349–364. [Google Scholar] [CrossRef] [Scilit]
- Maeda-Gutiérrez, V.; Galván Tejada, C.; Galván Tejada, J.; Cruz, M.; Celaya Padilla, J.; Gamboa-Rosales, H.; García, A.; Luna-Garcia, H.; Villalba, K. Evaluating Feature Selection Methods for Accurate Diagnosis of Diabetic Kidney Disease. Biomedicines 2024, 12, 2858. [Google Scholar] [CrossRef] [Scilit]
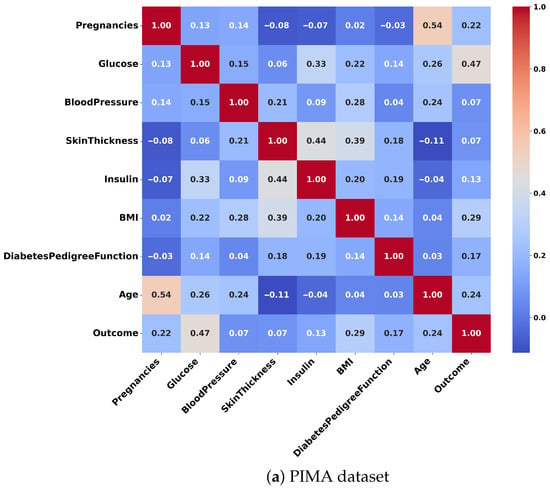
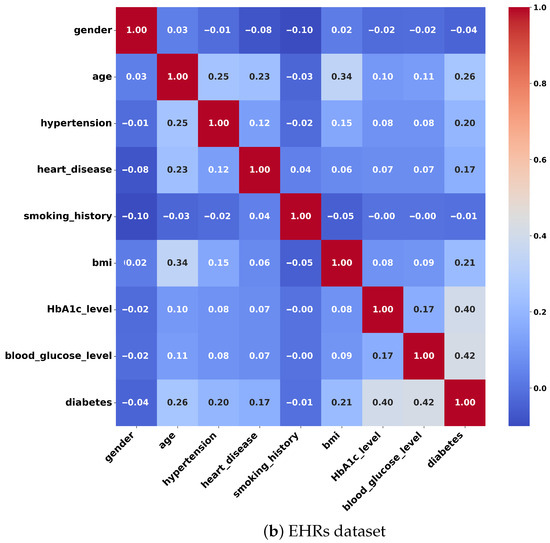
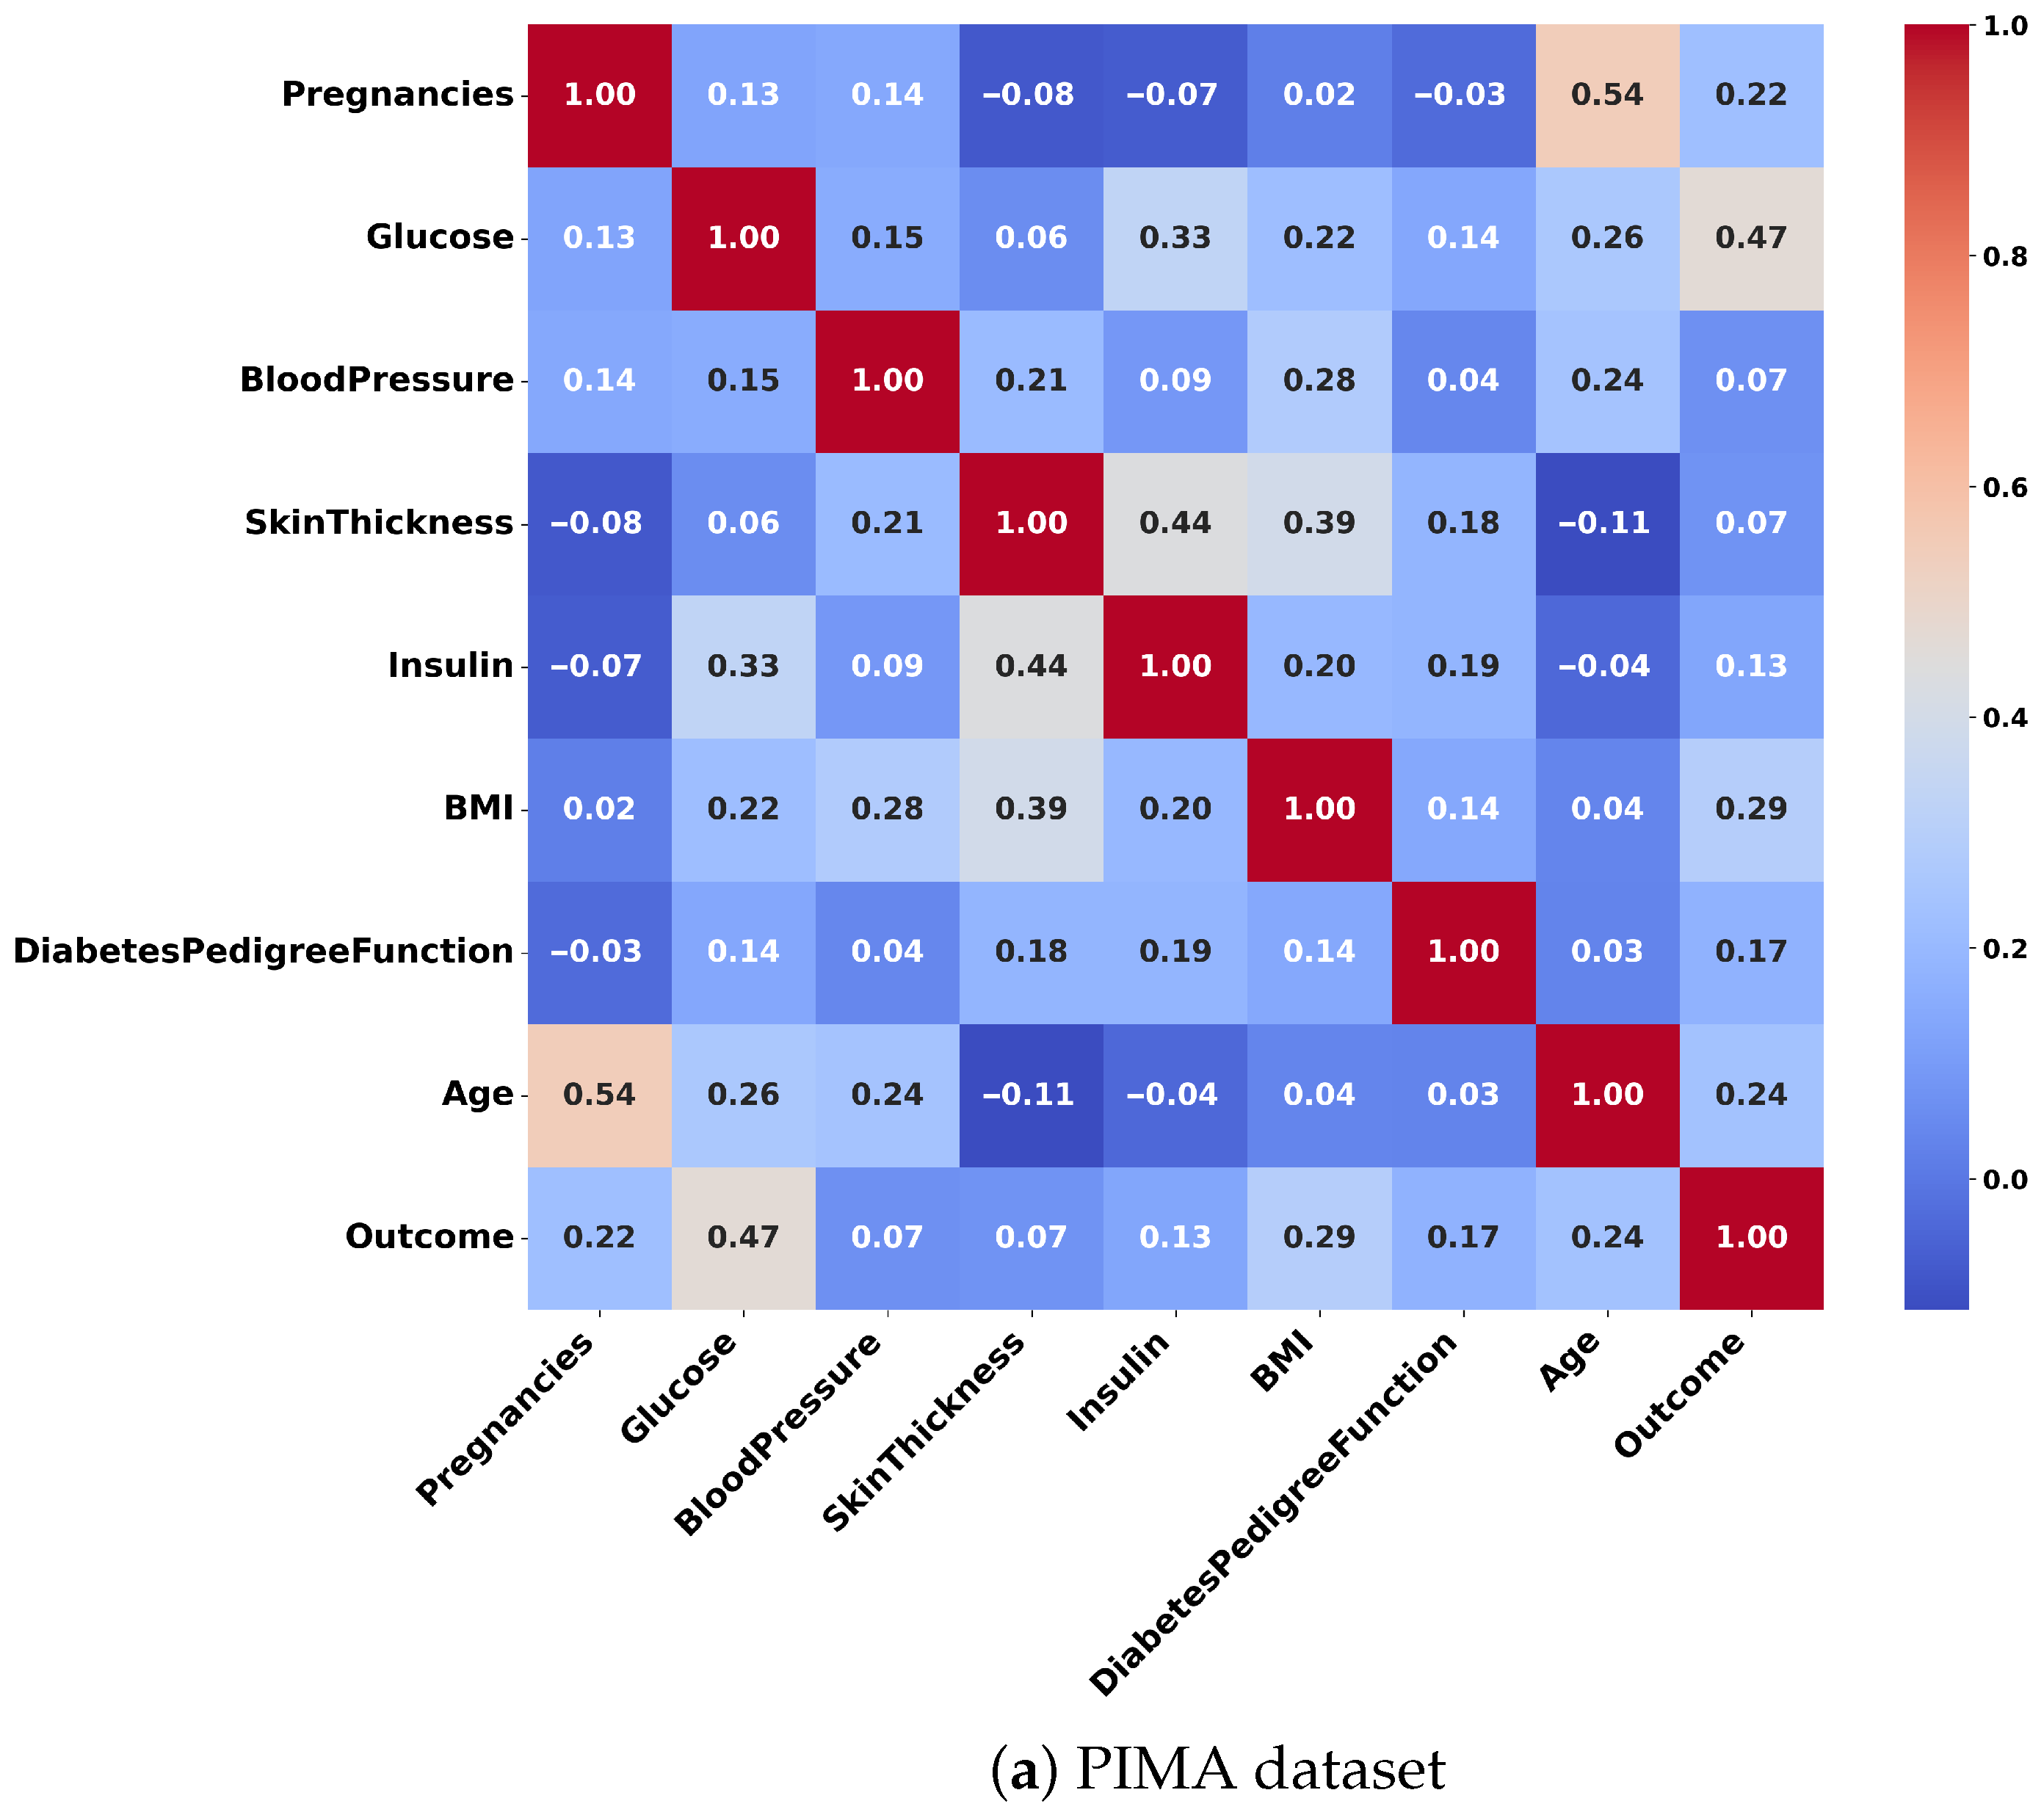
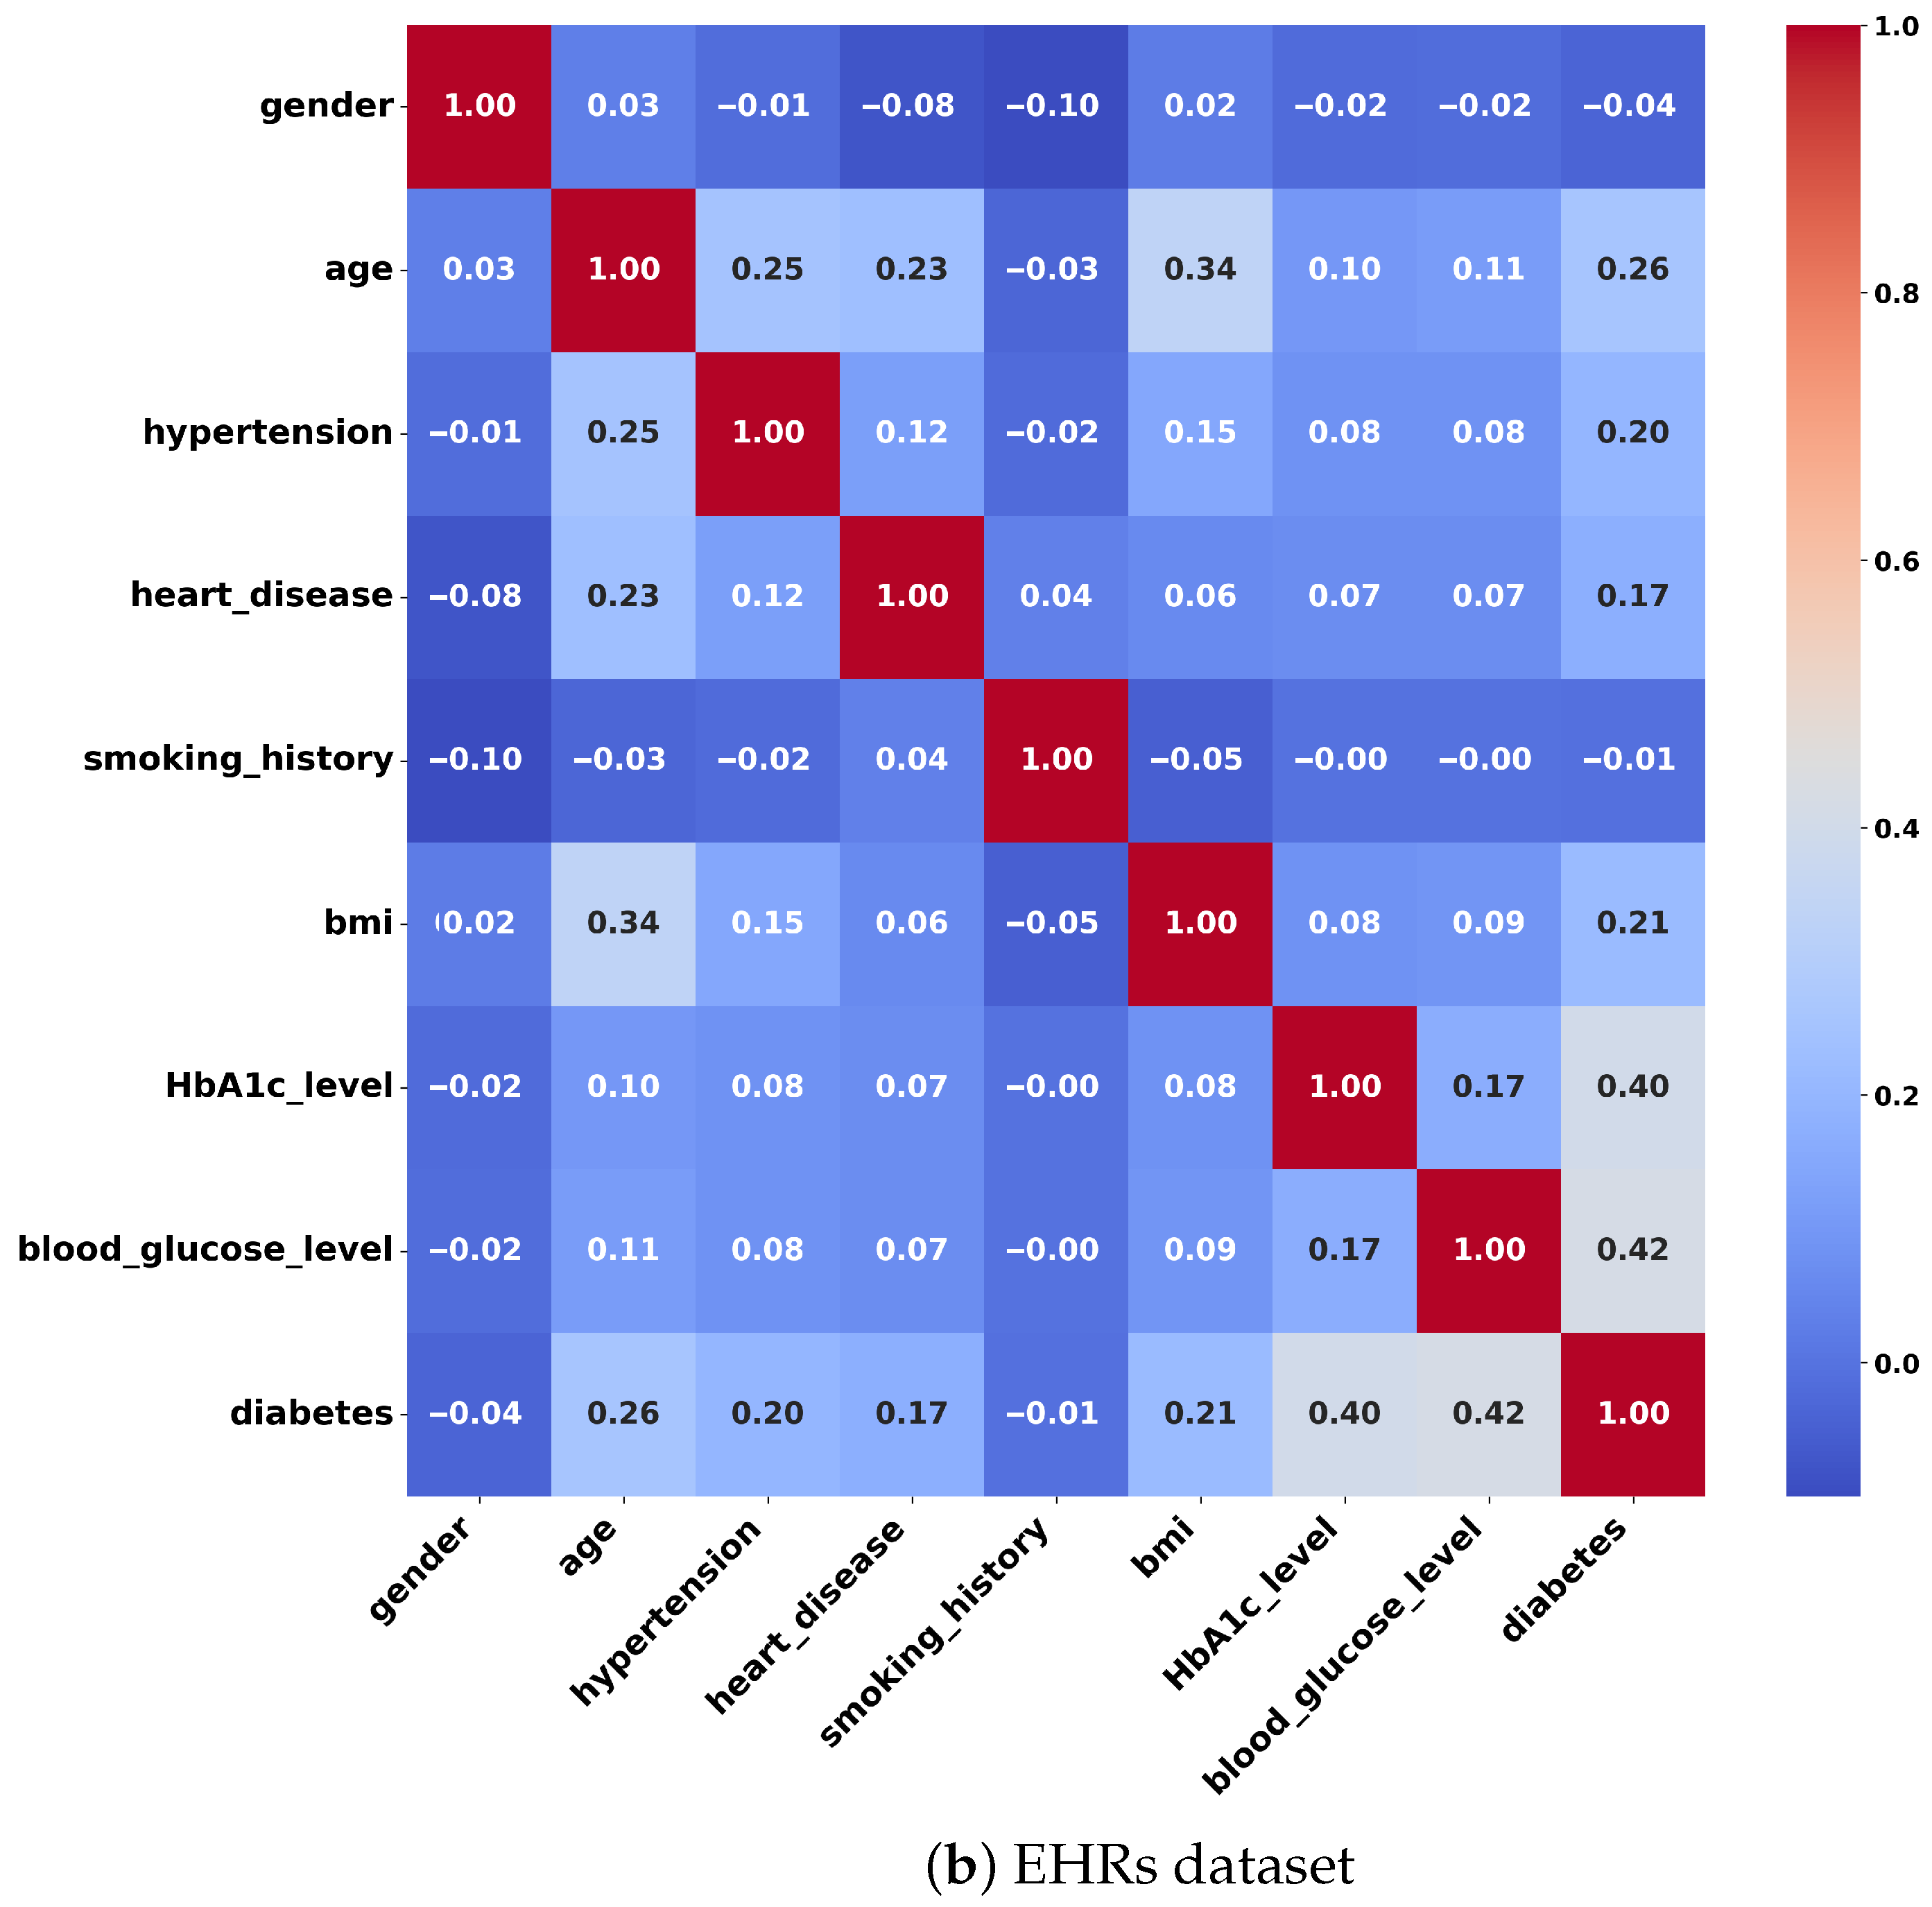
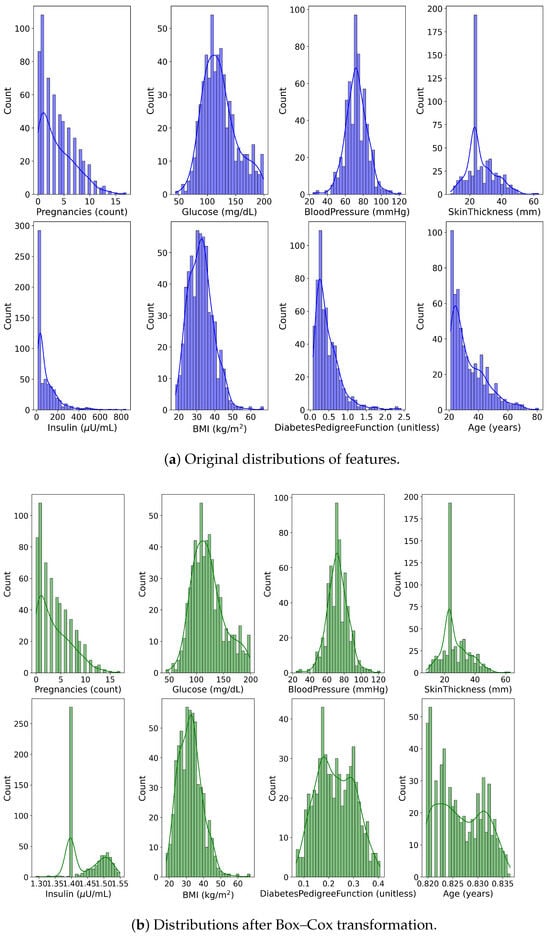
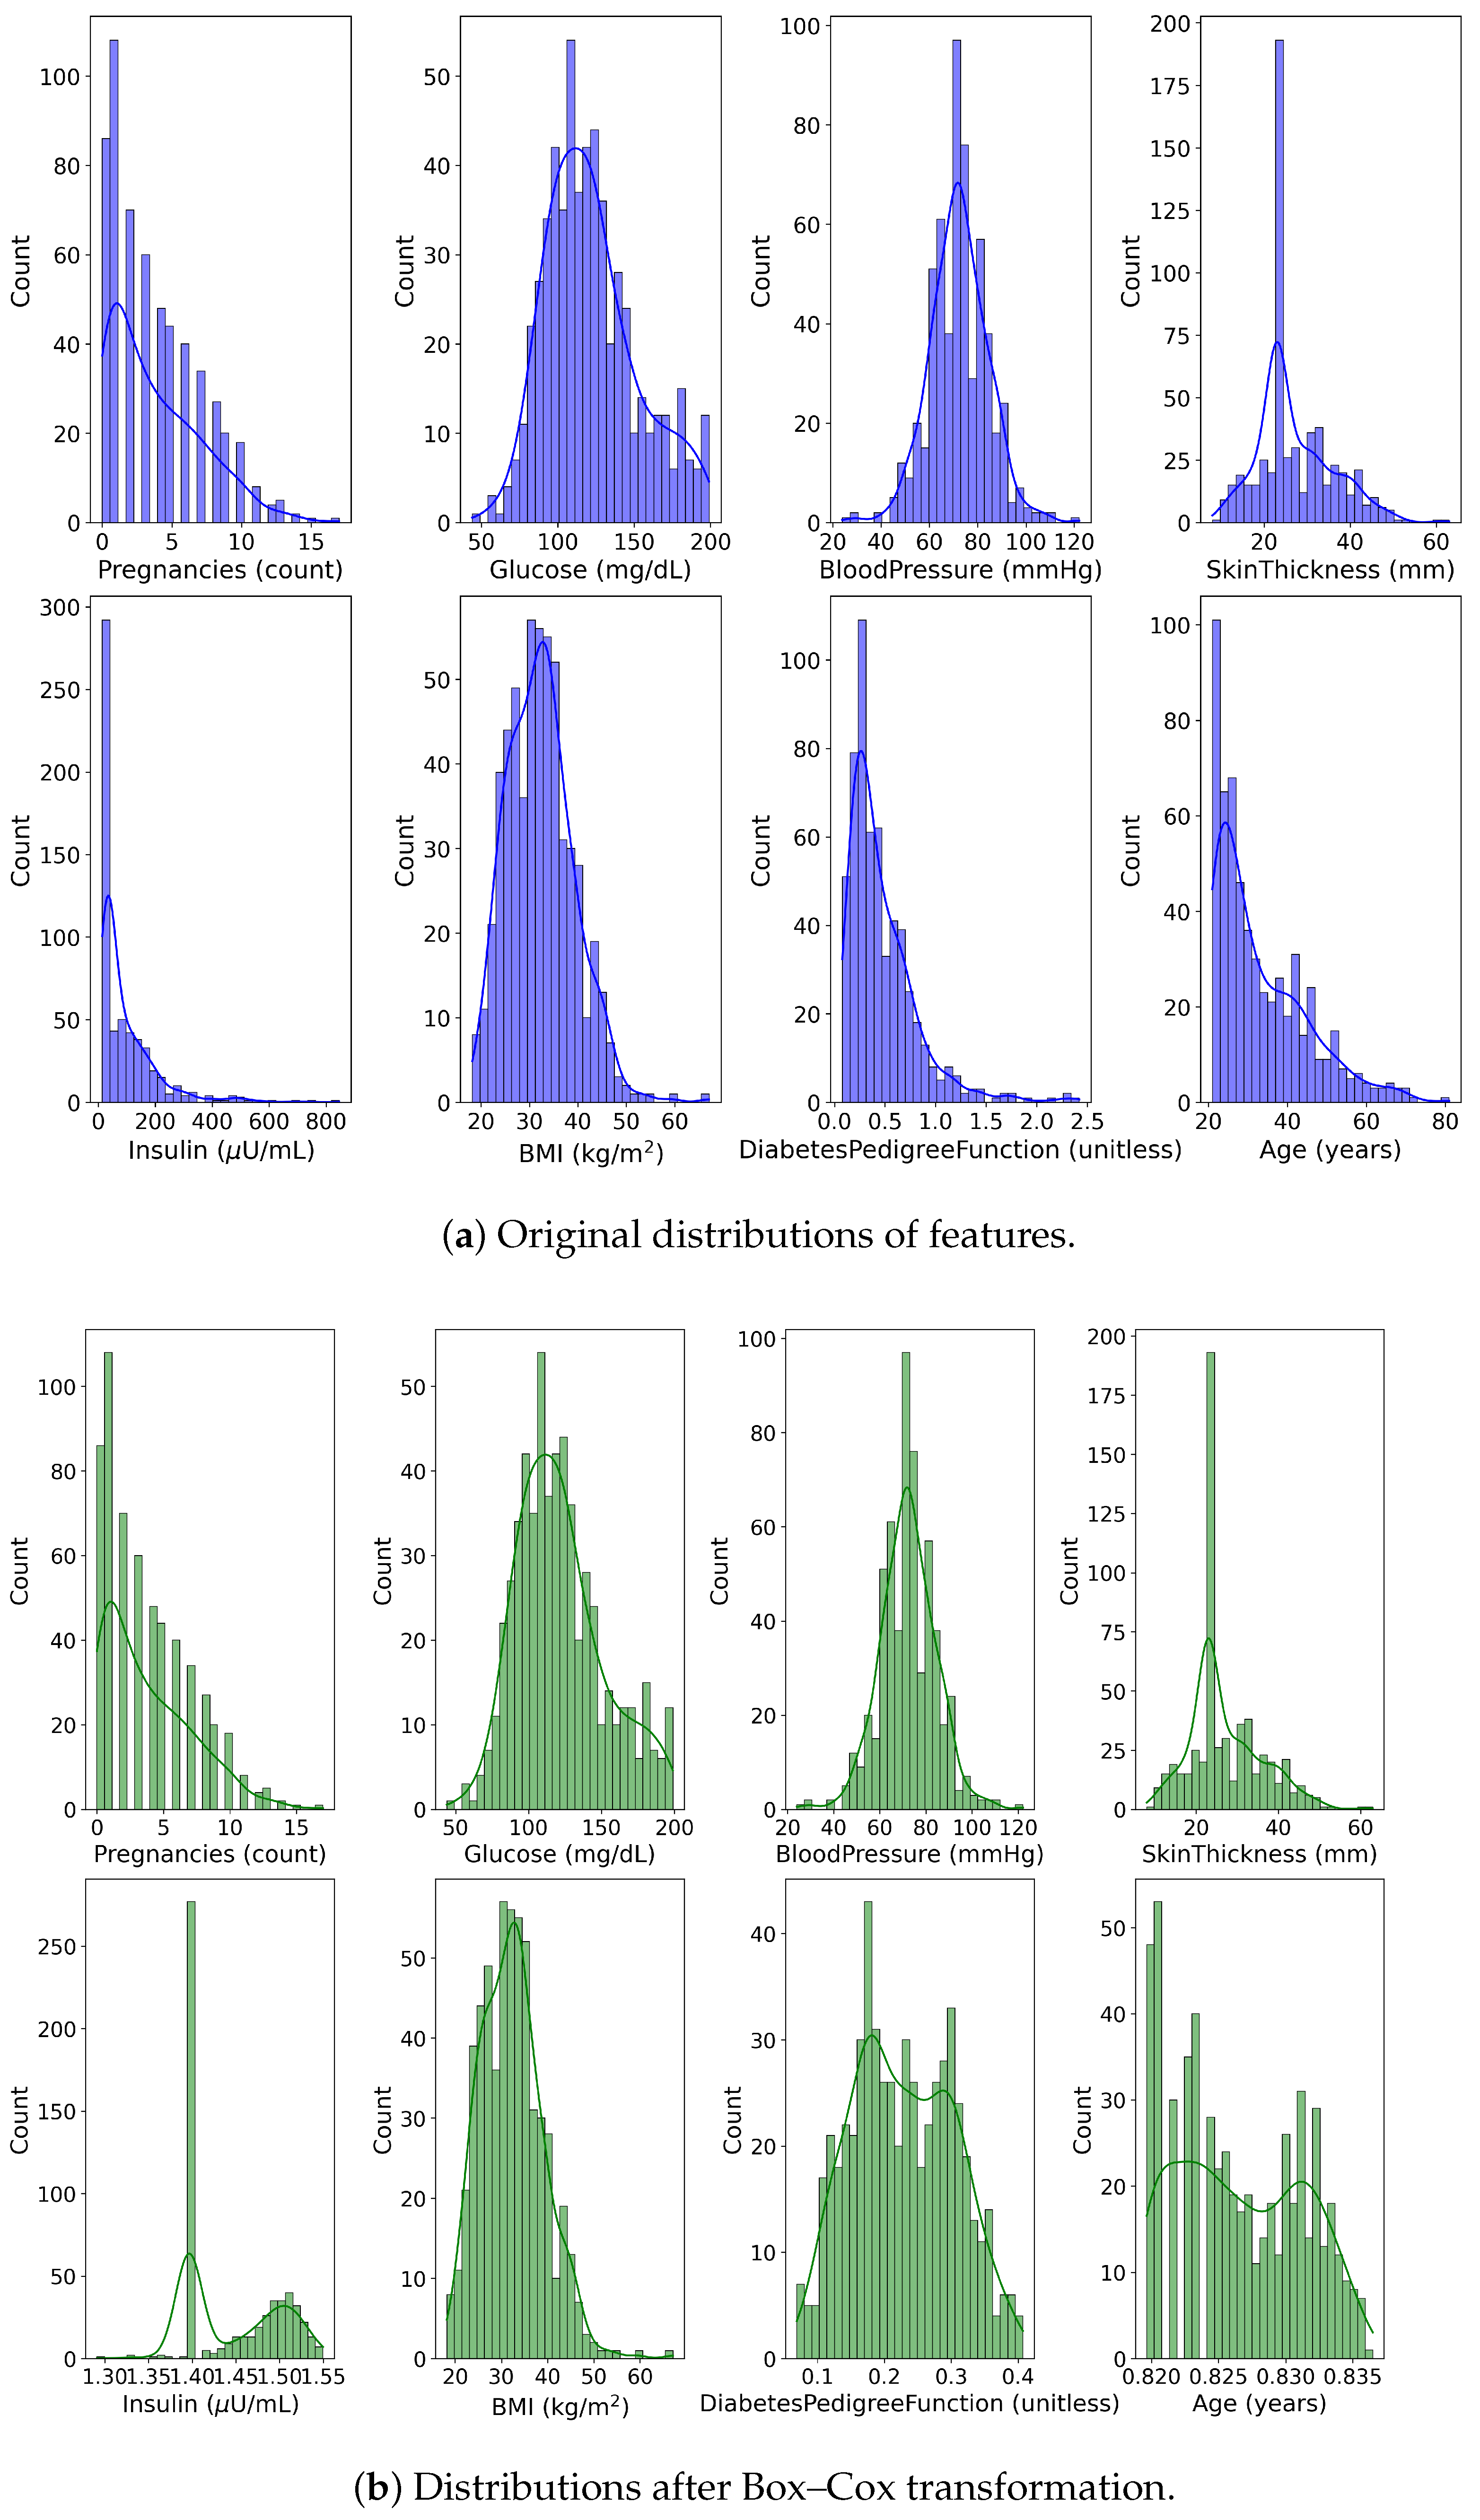
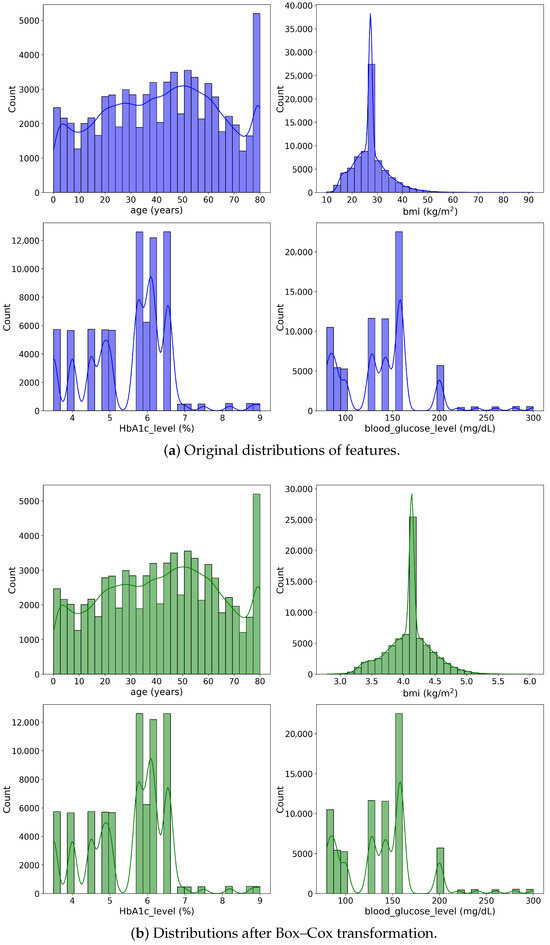
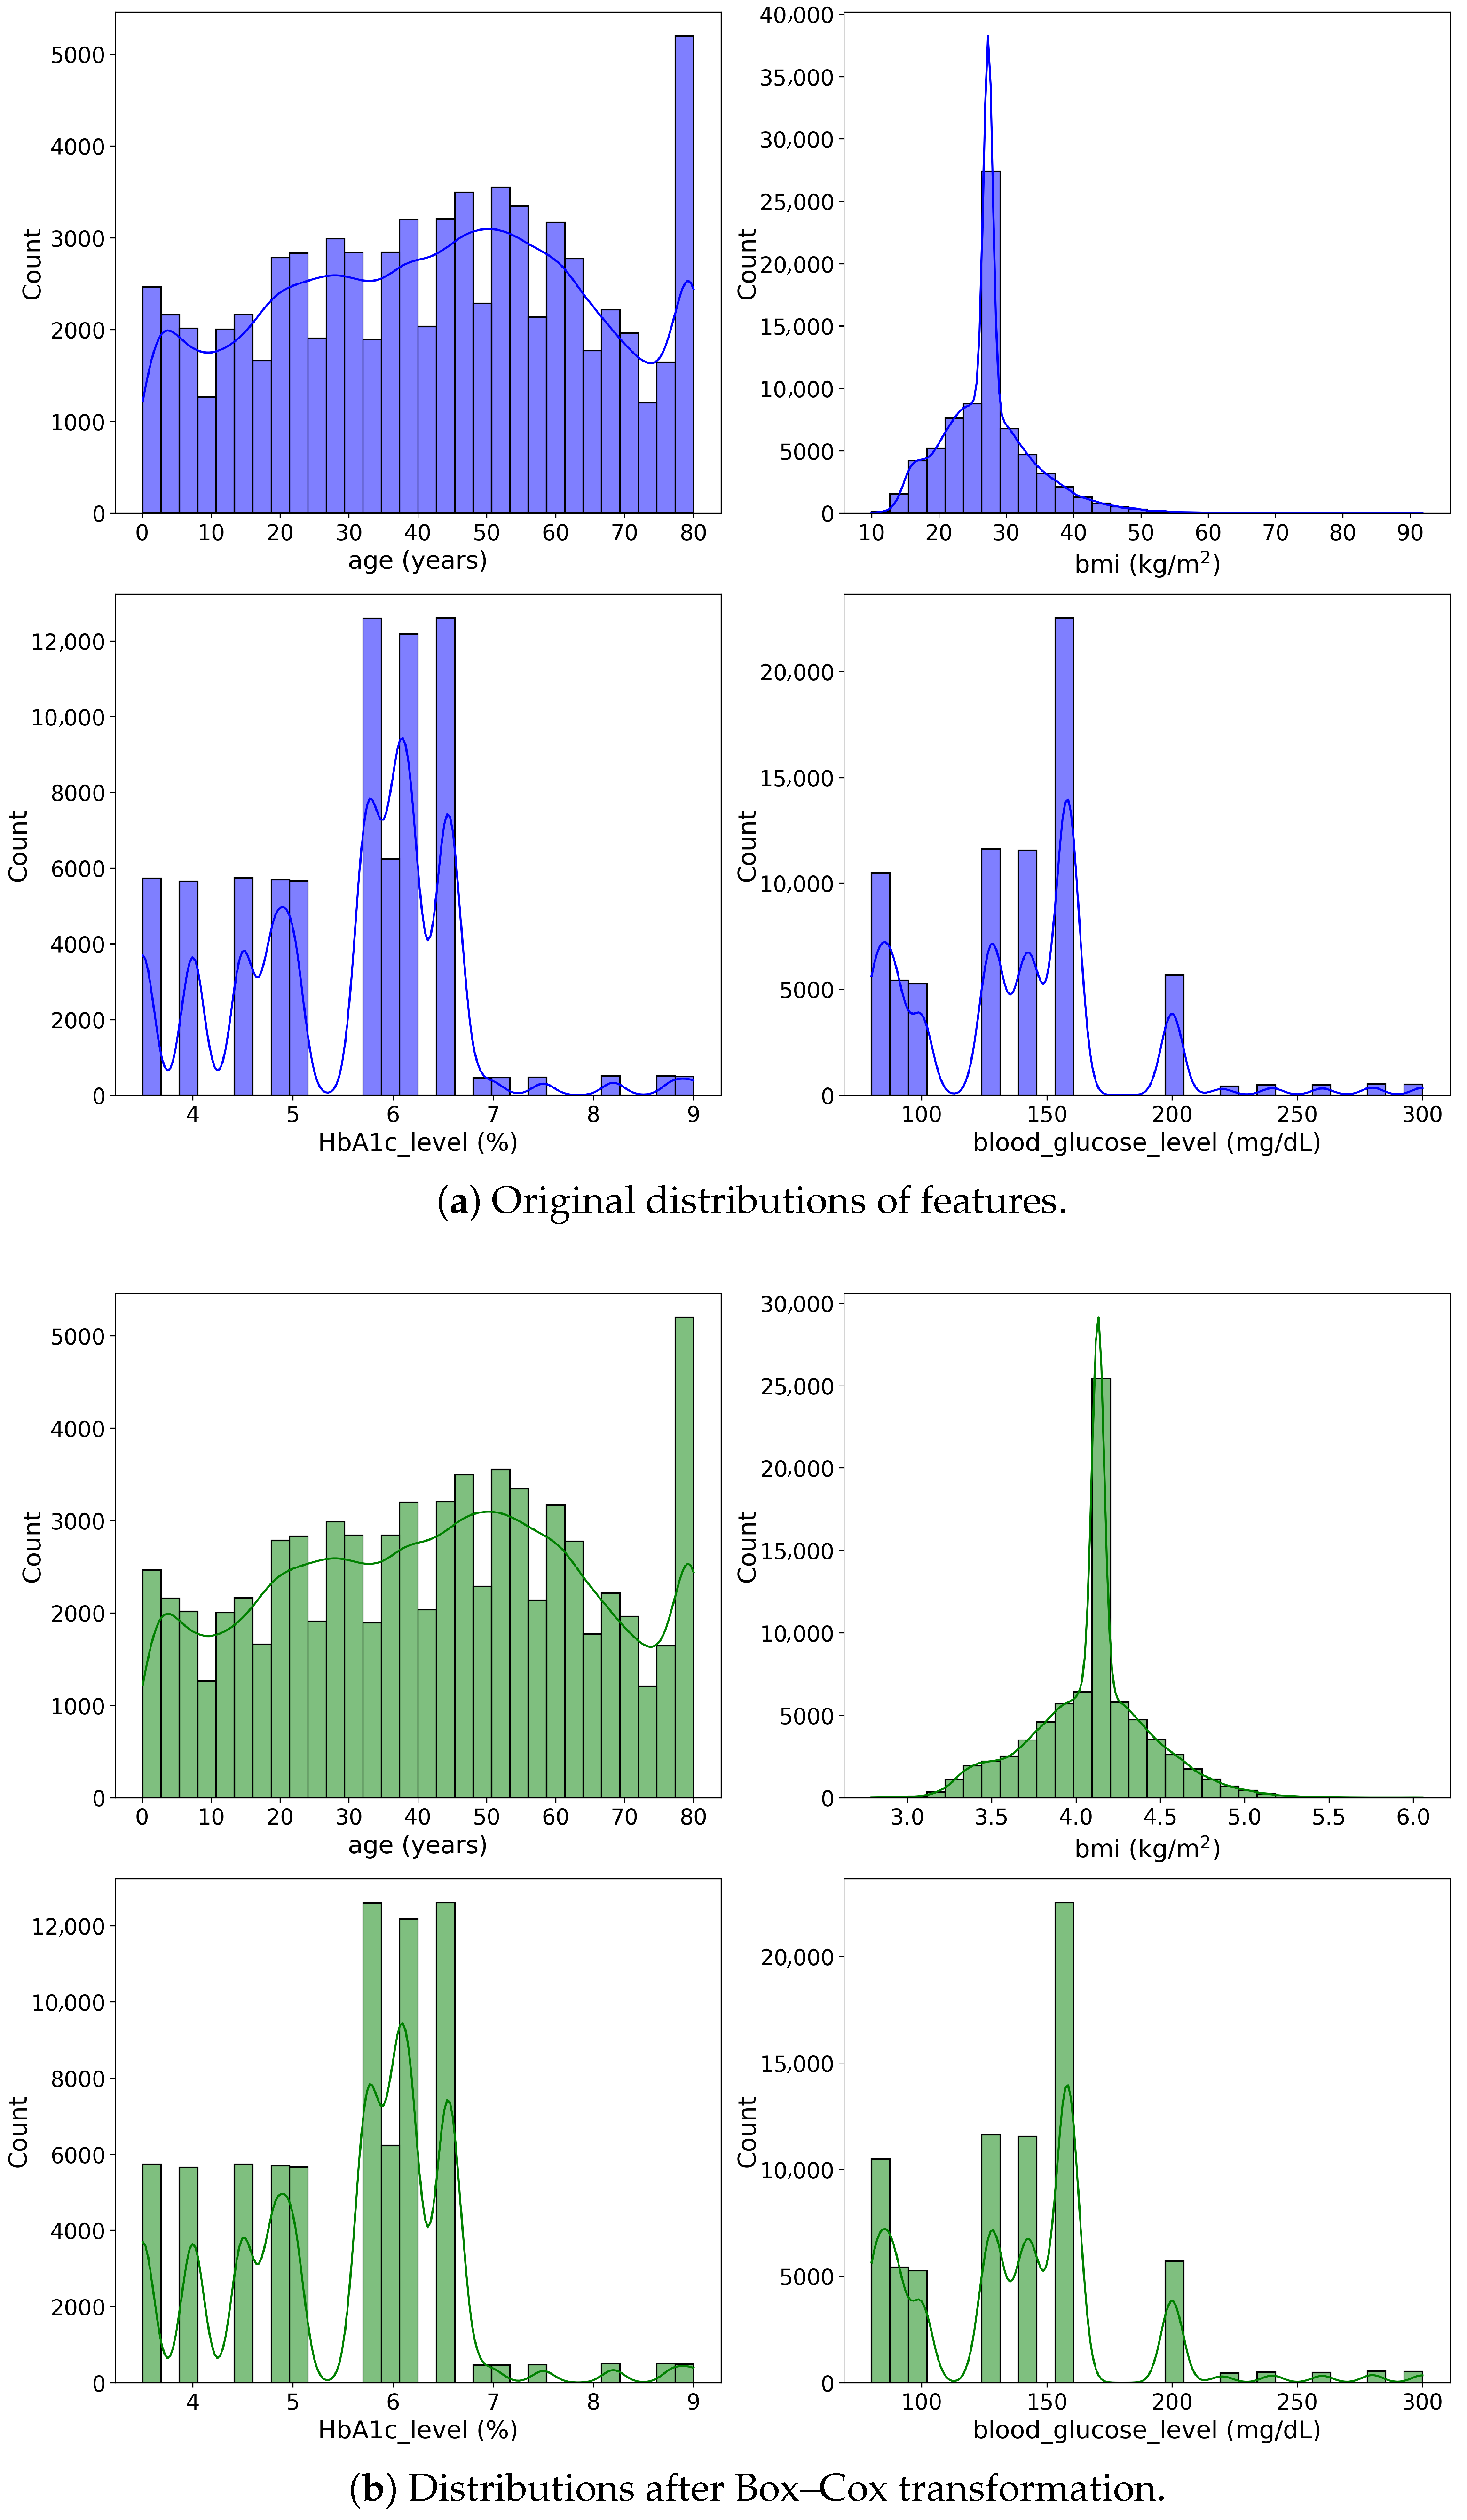
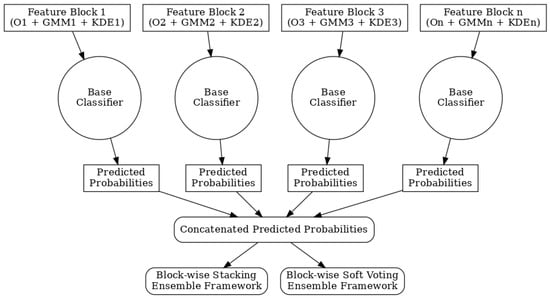
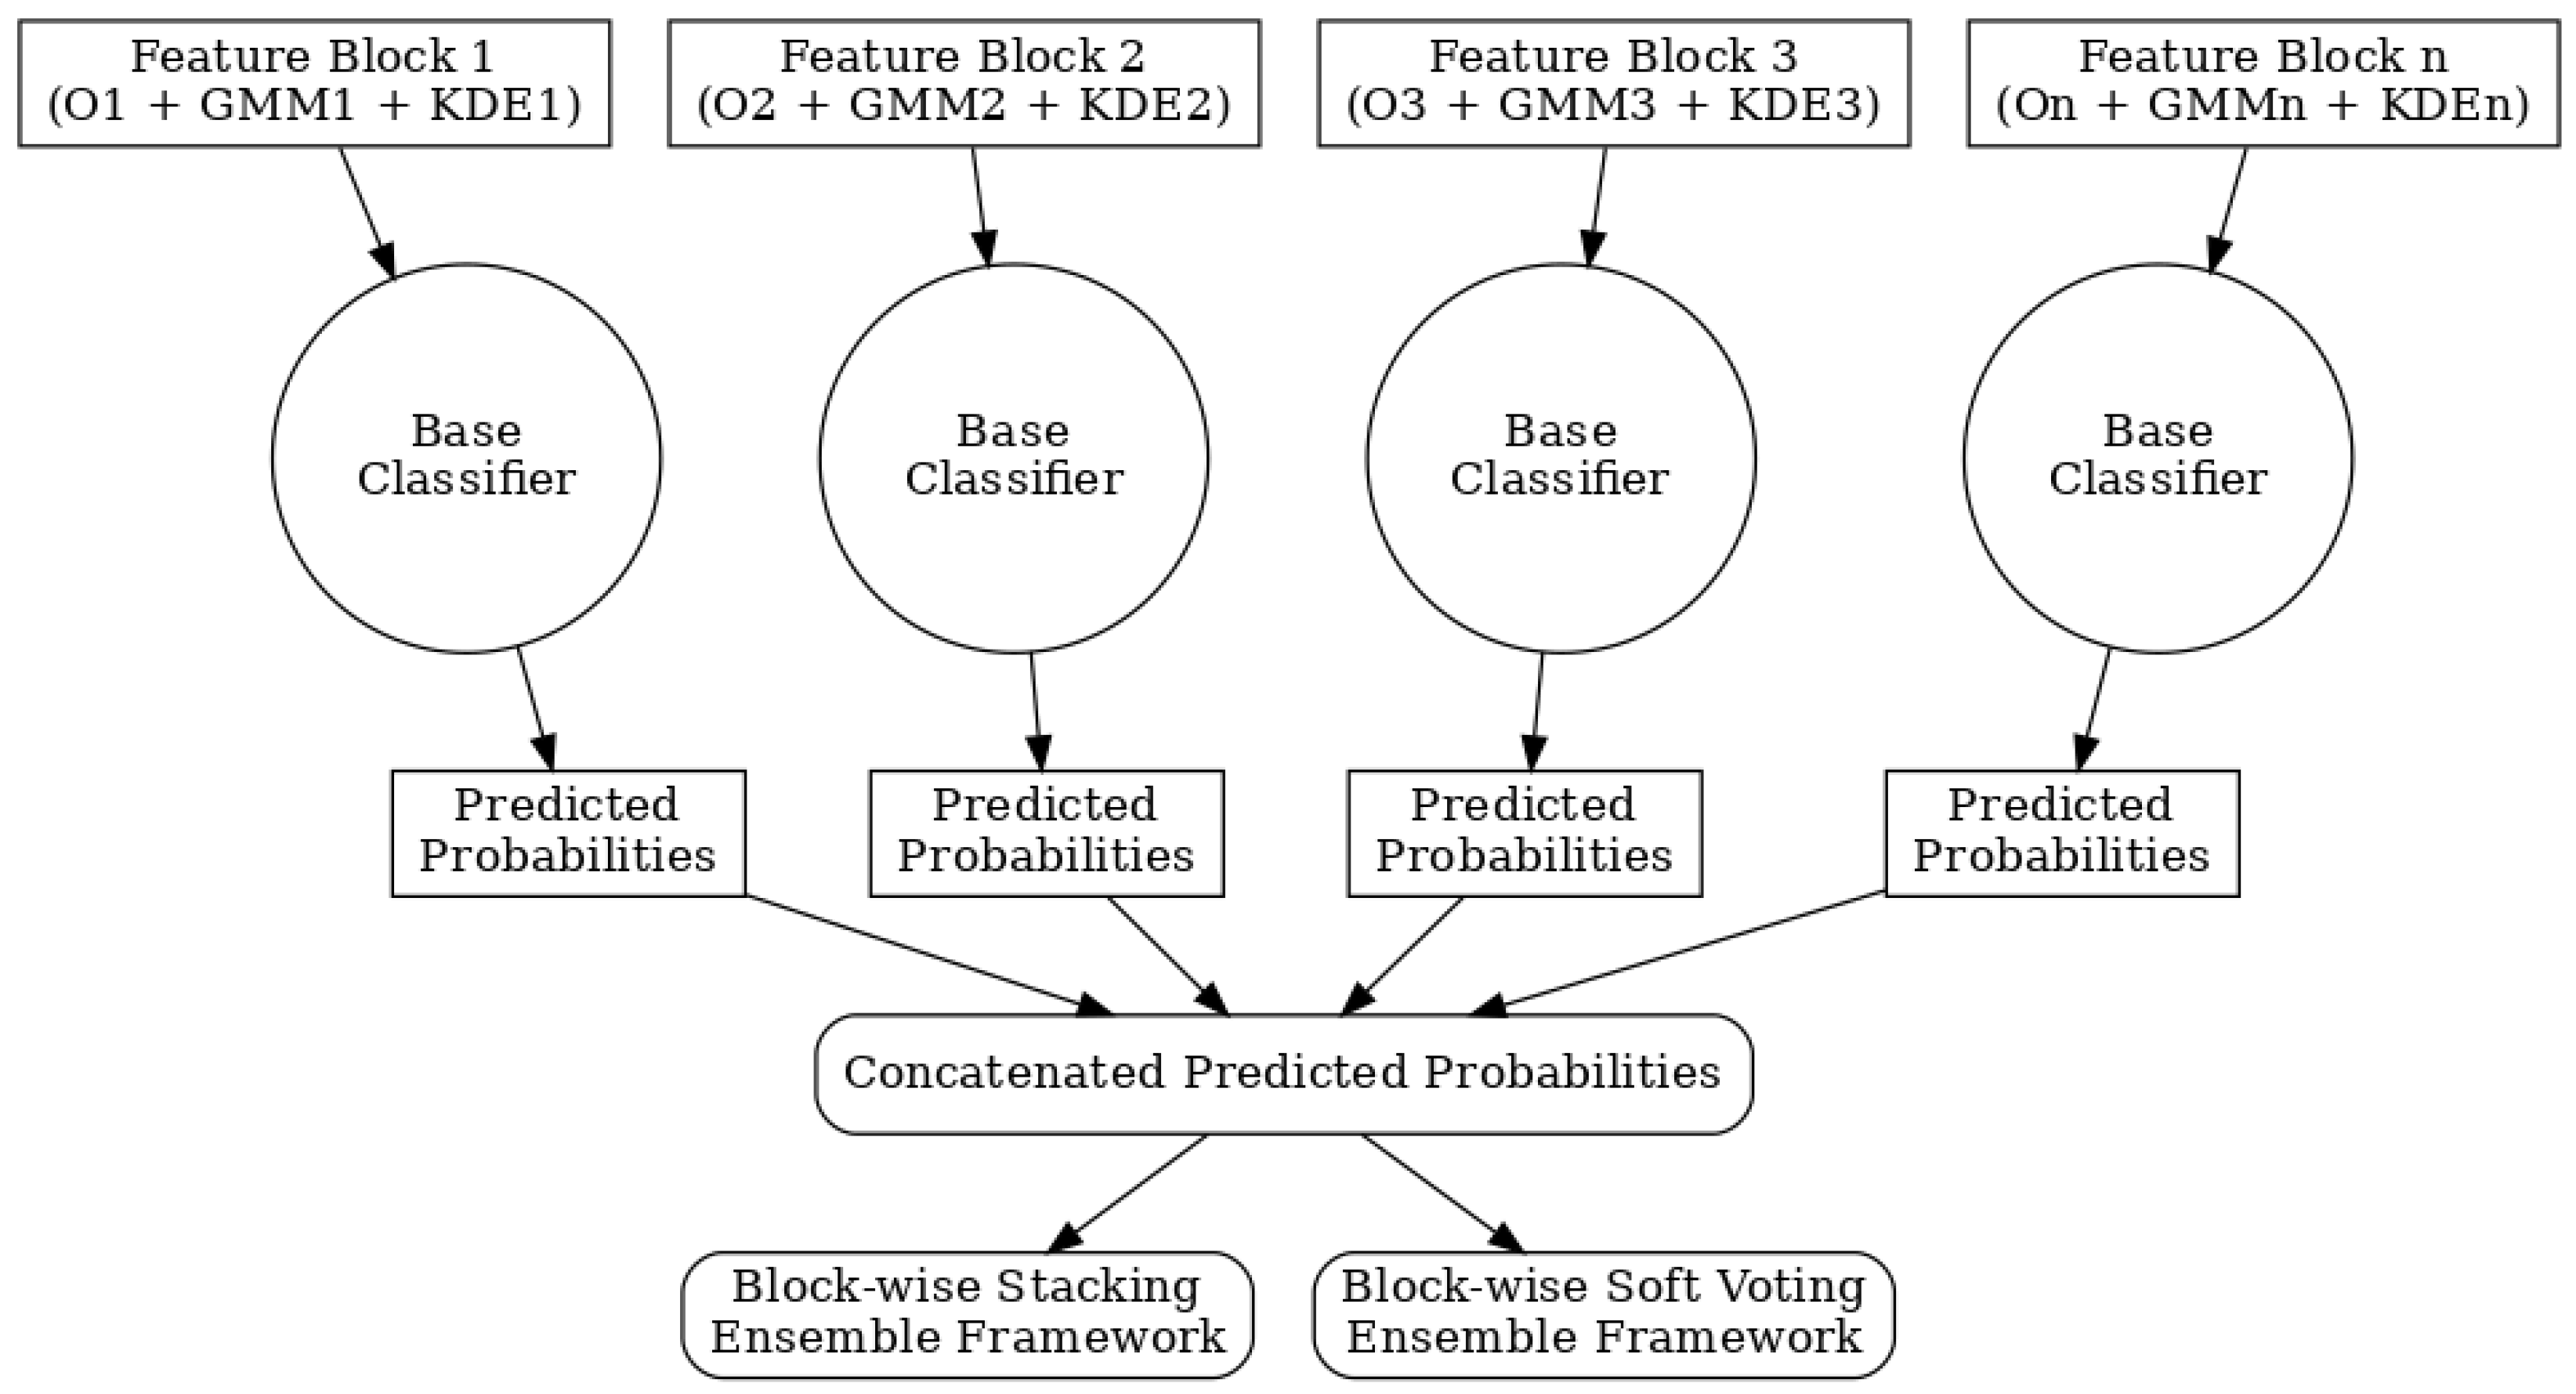
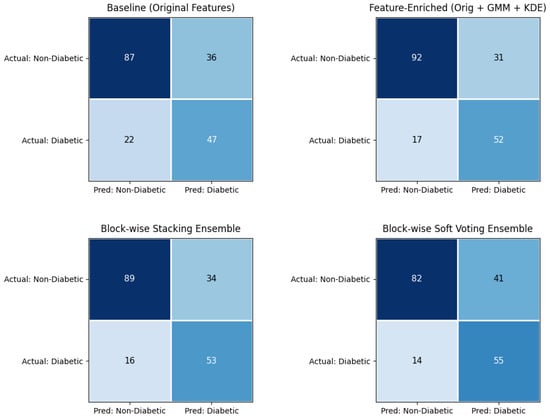
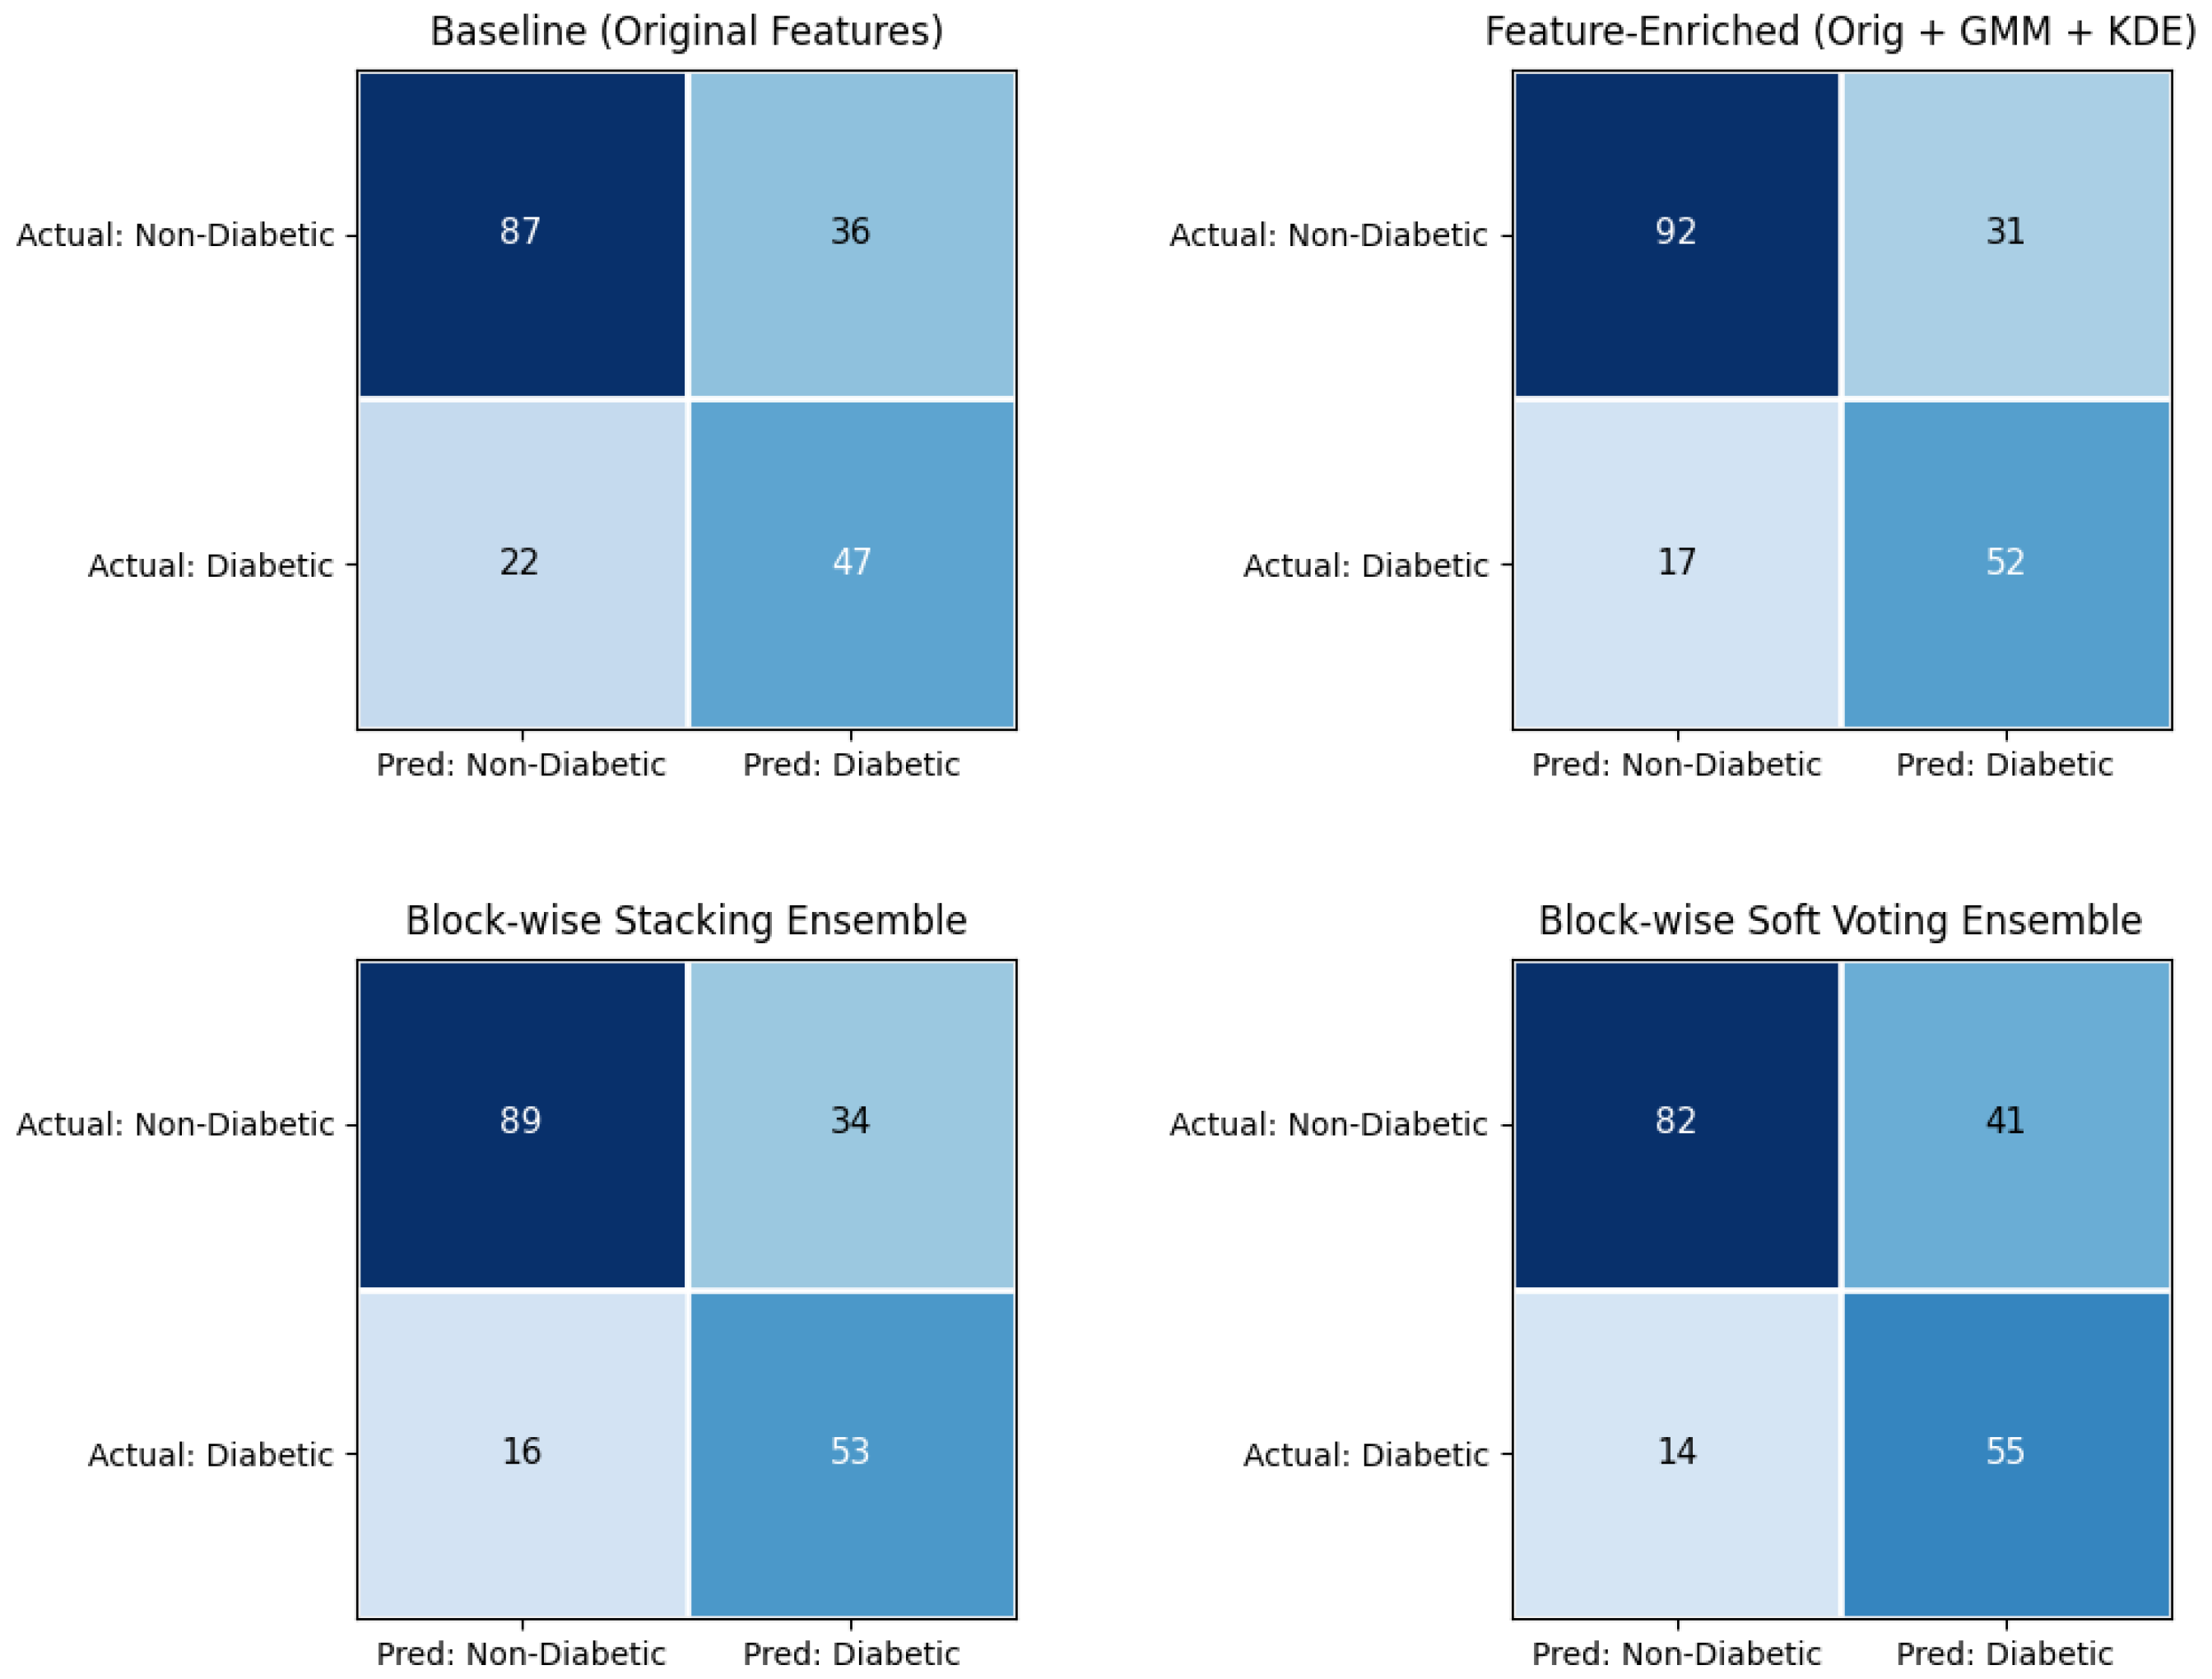
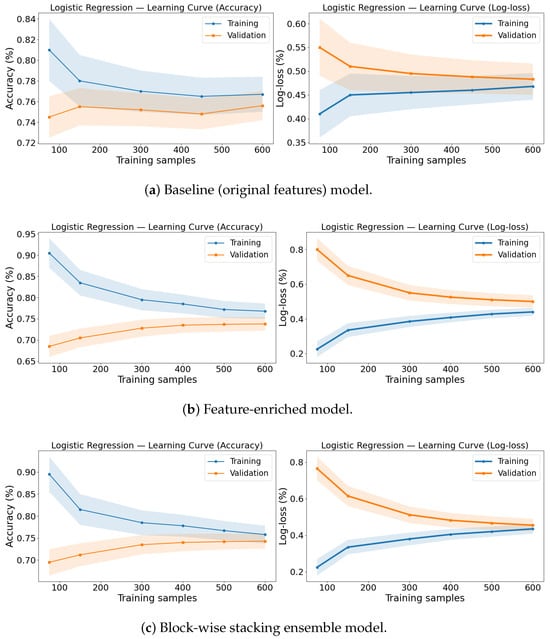
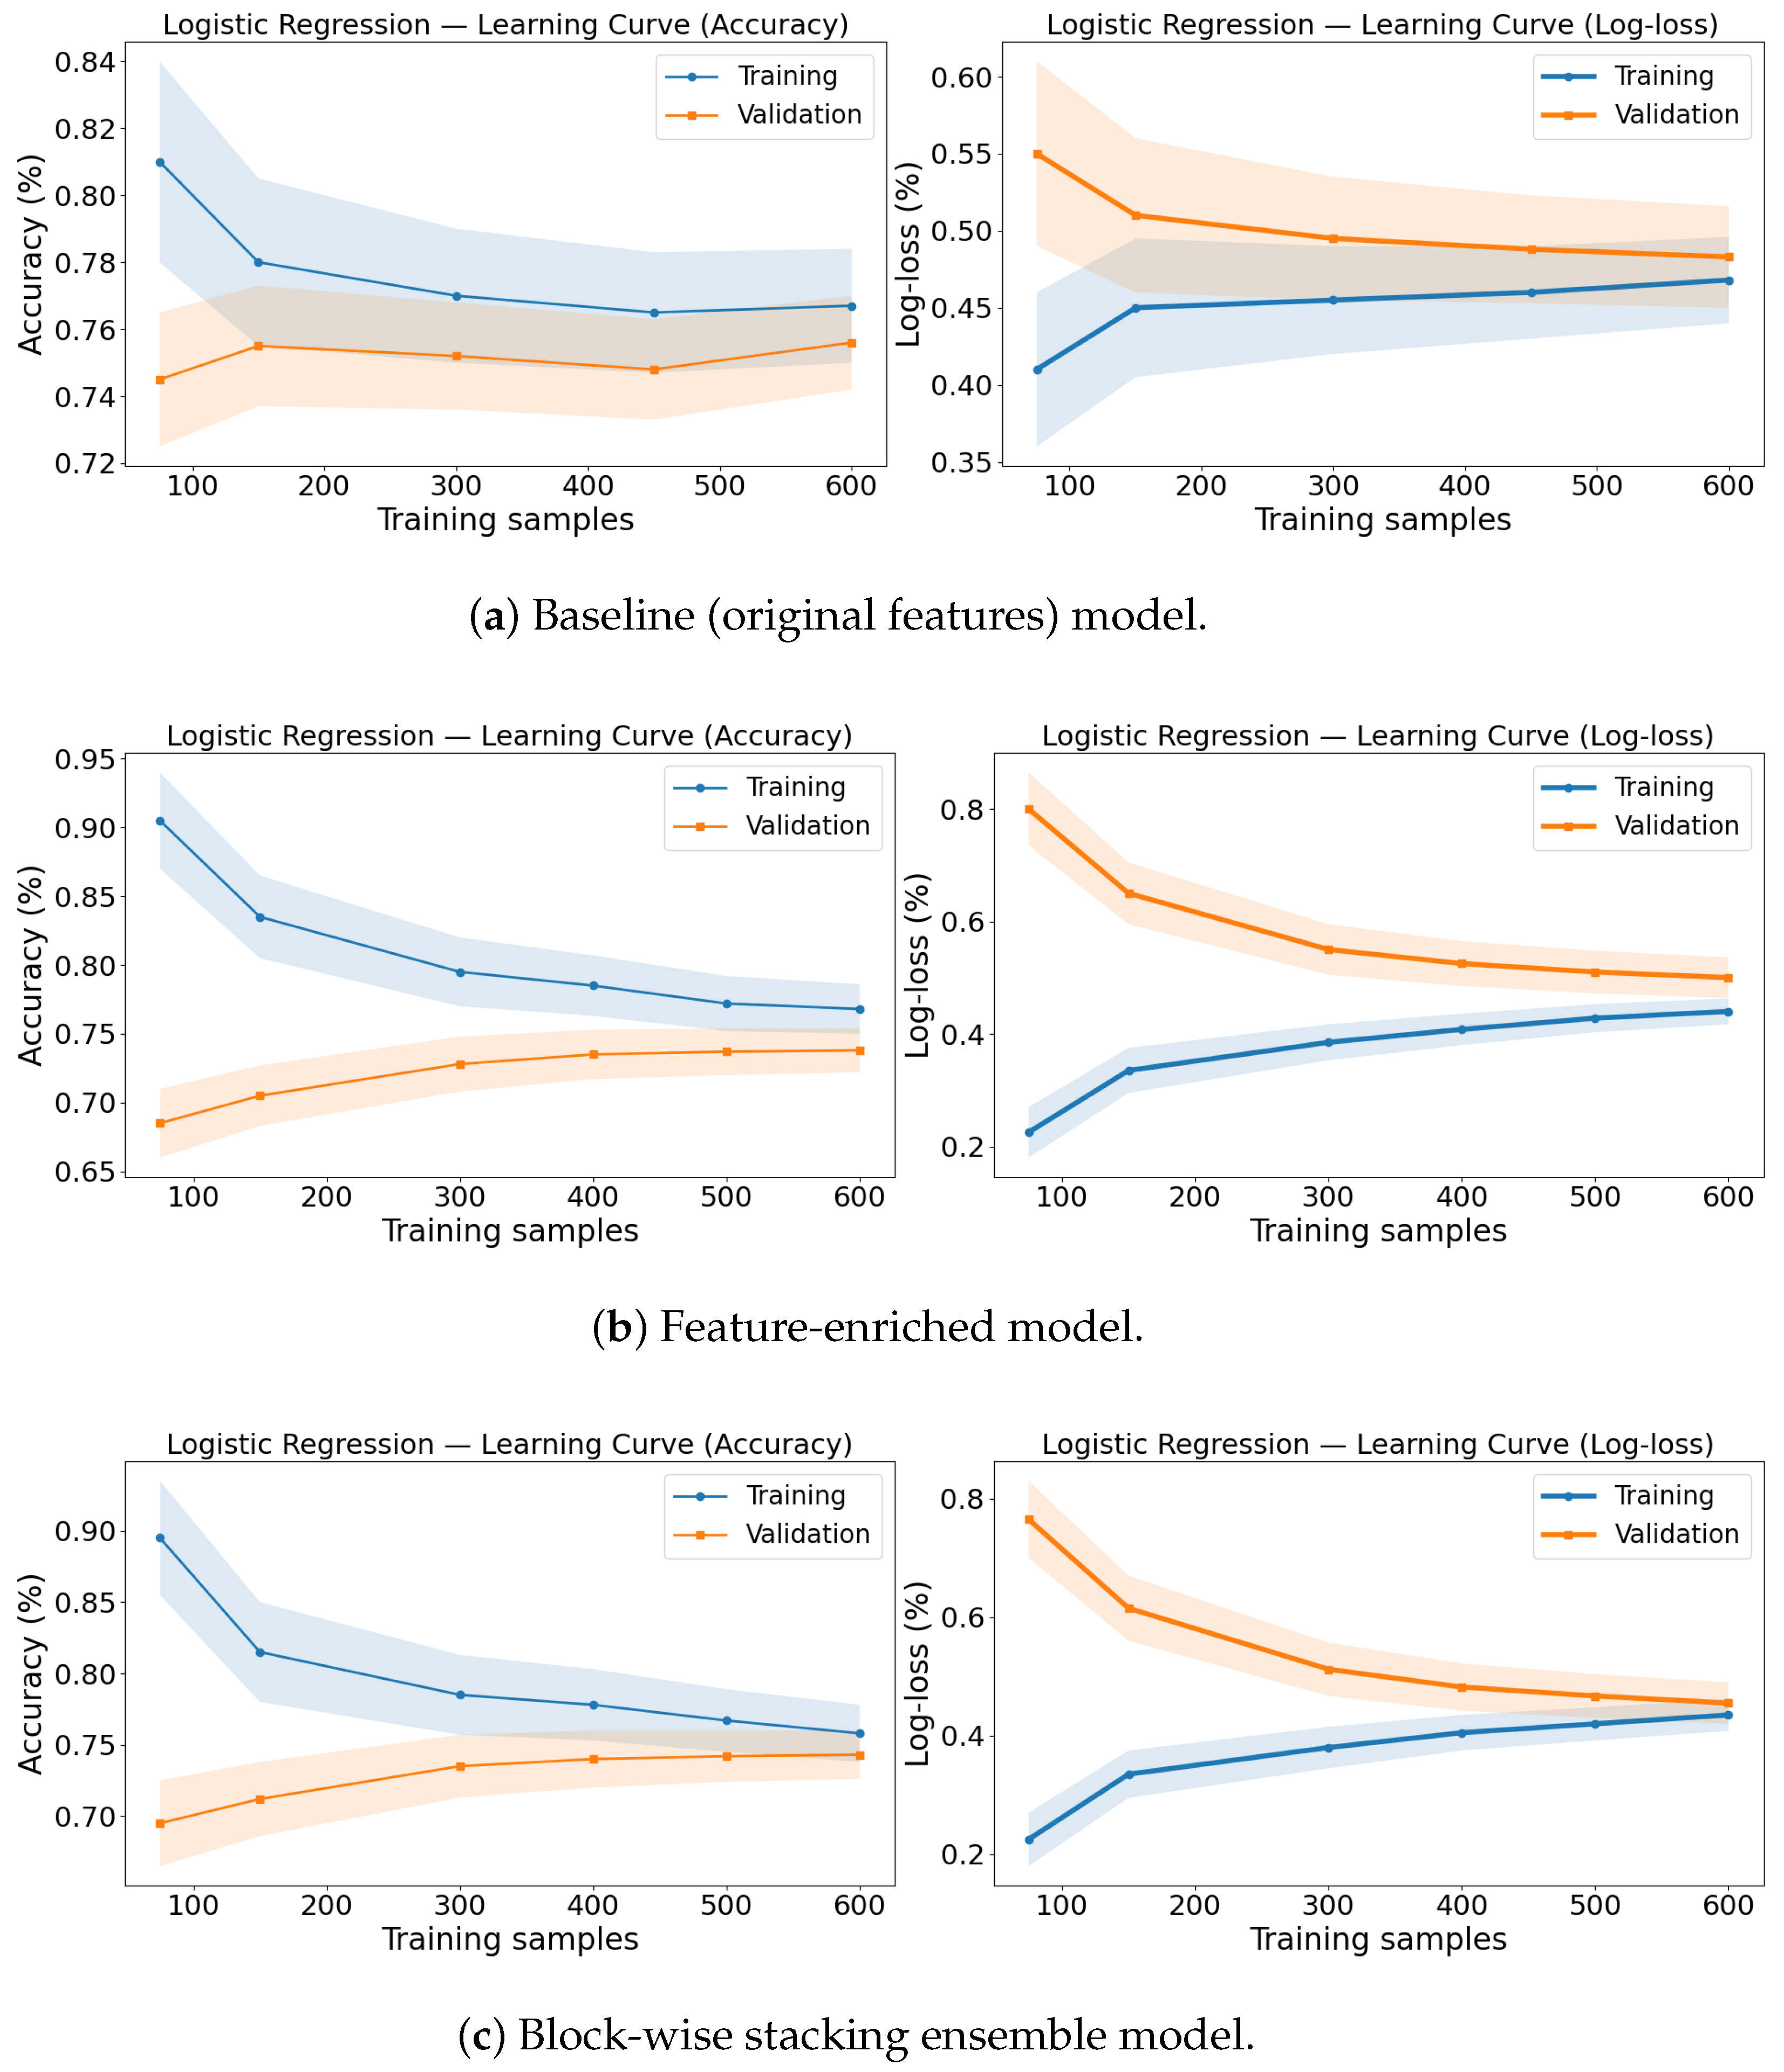
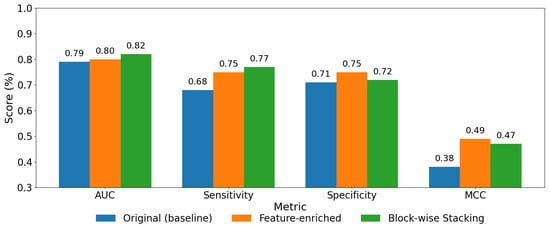
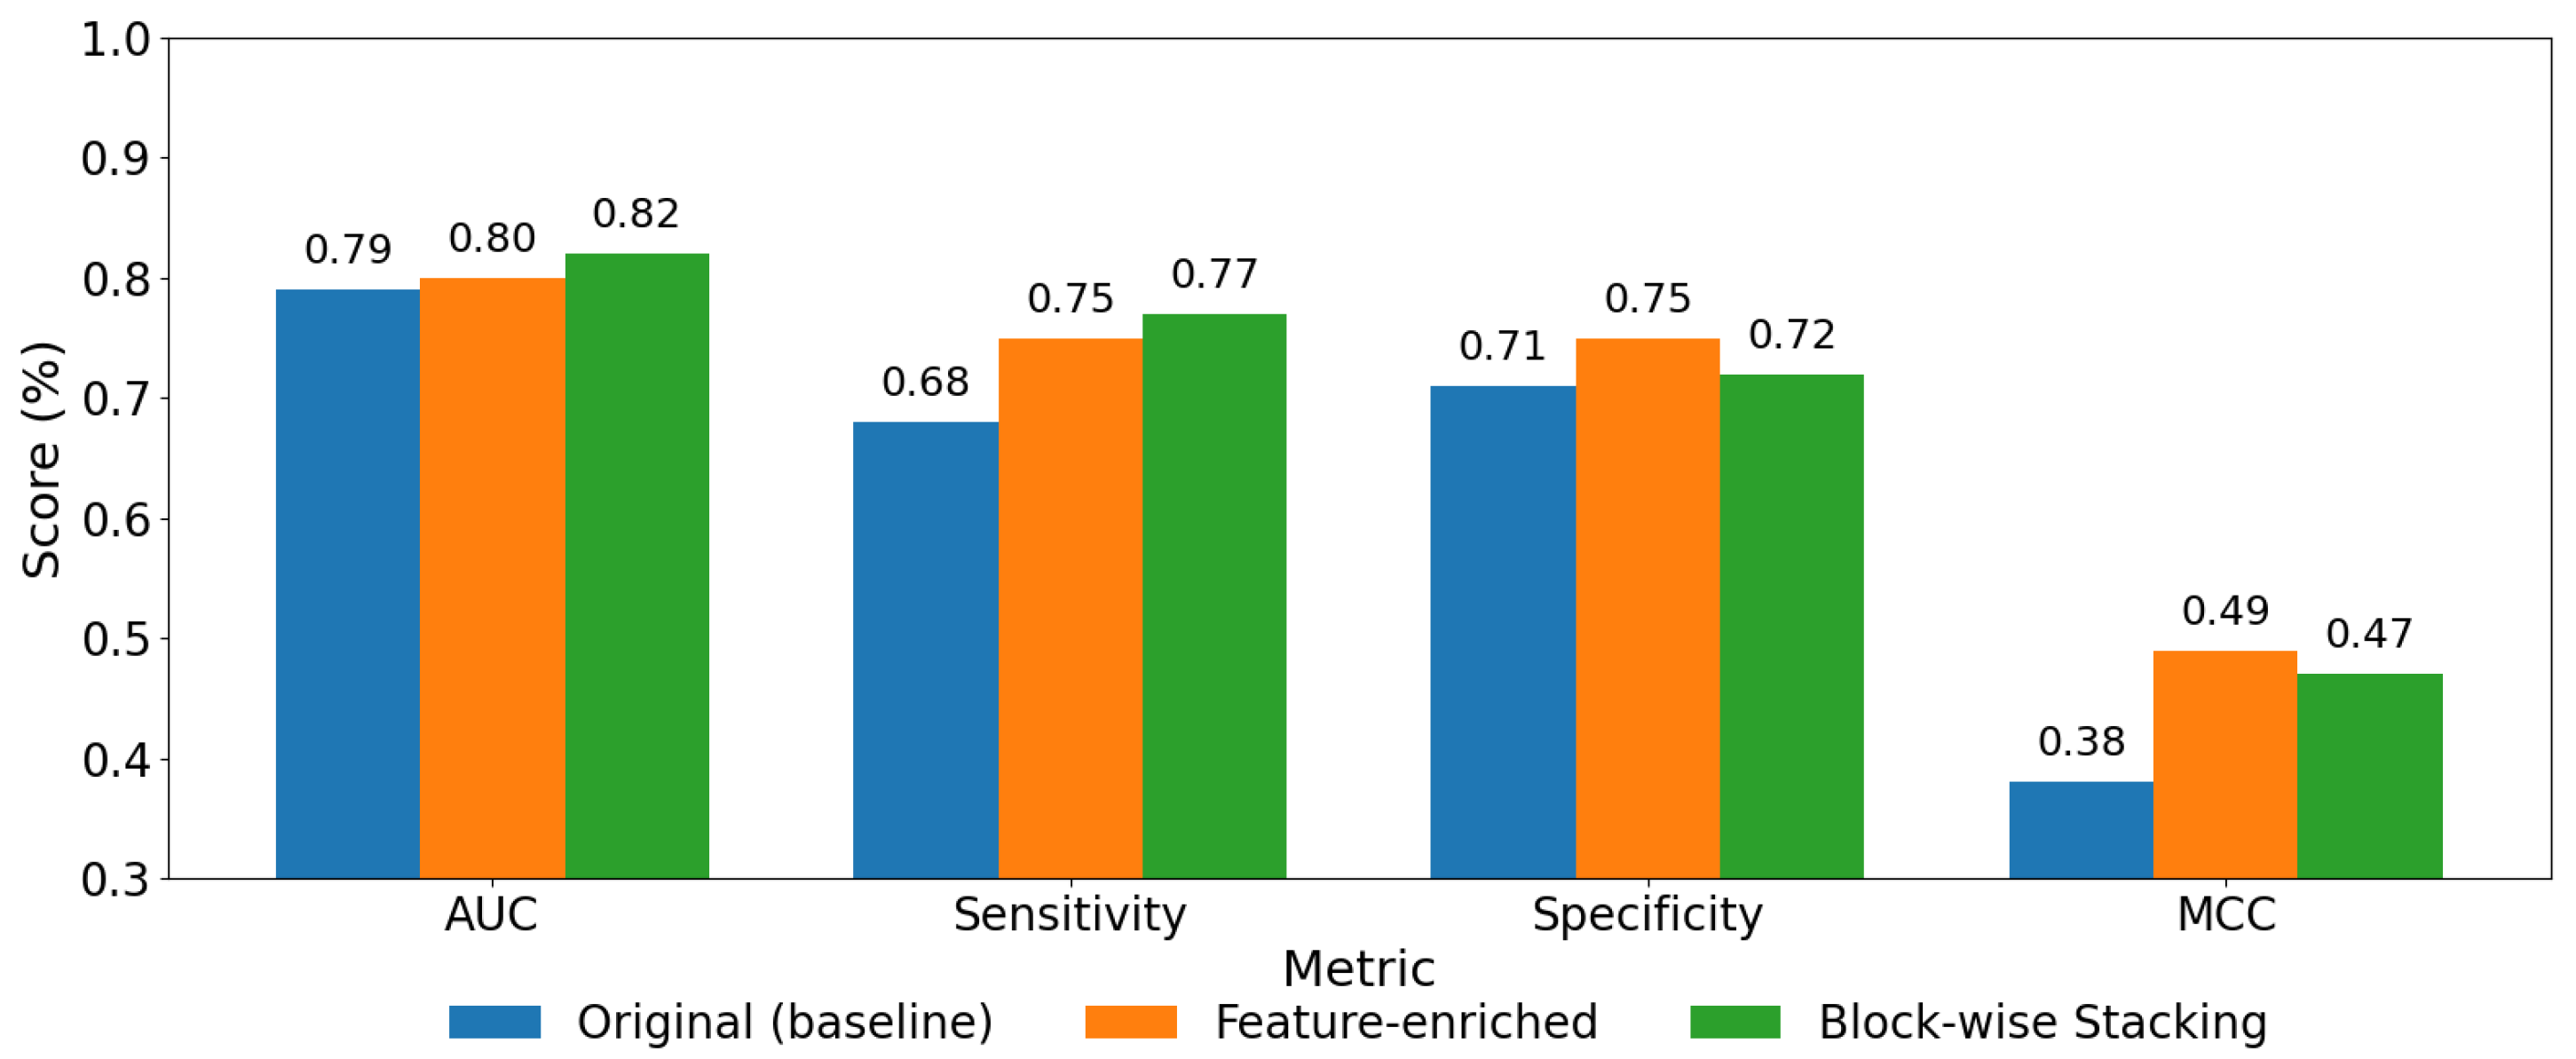
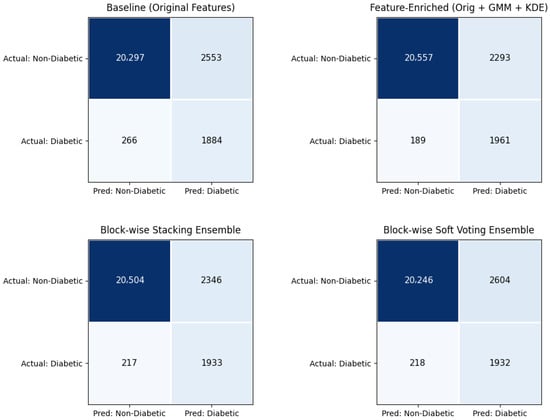
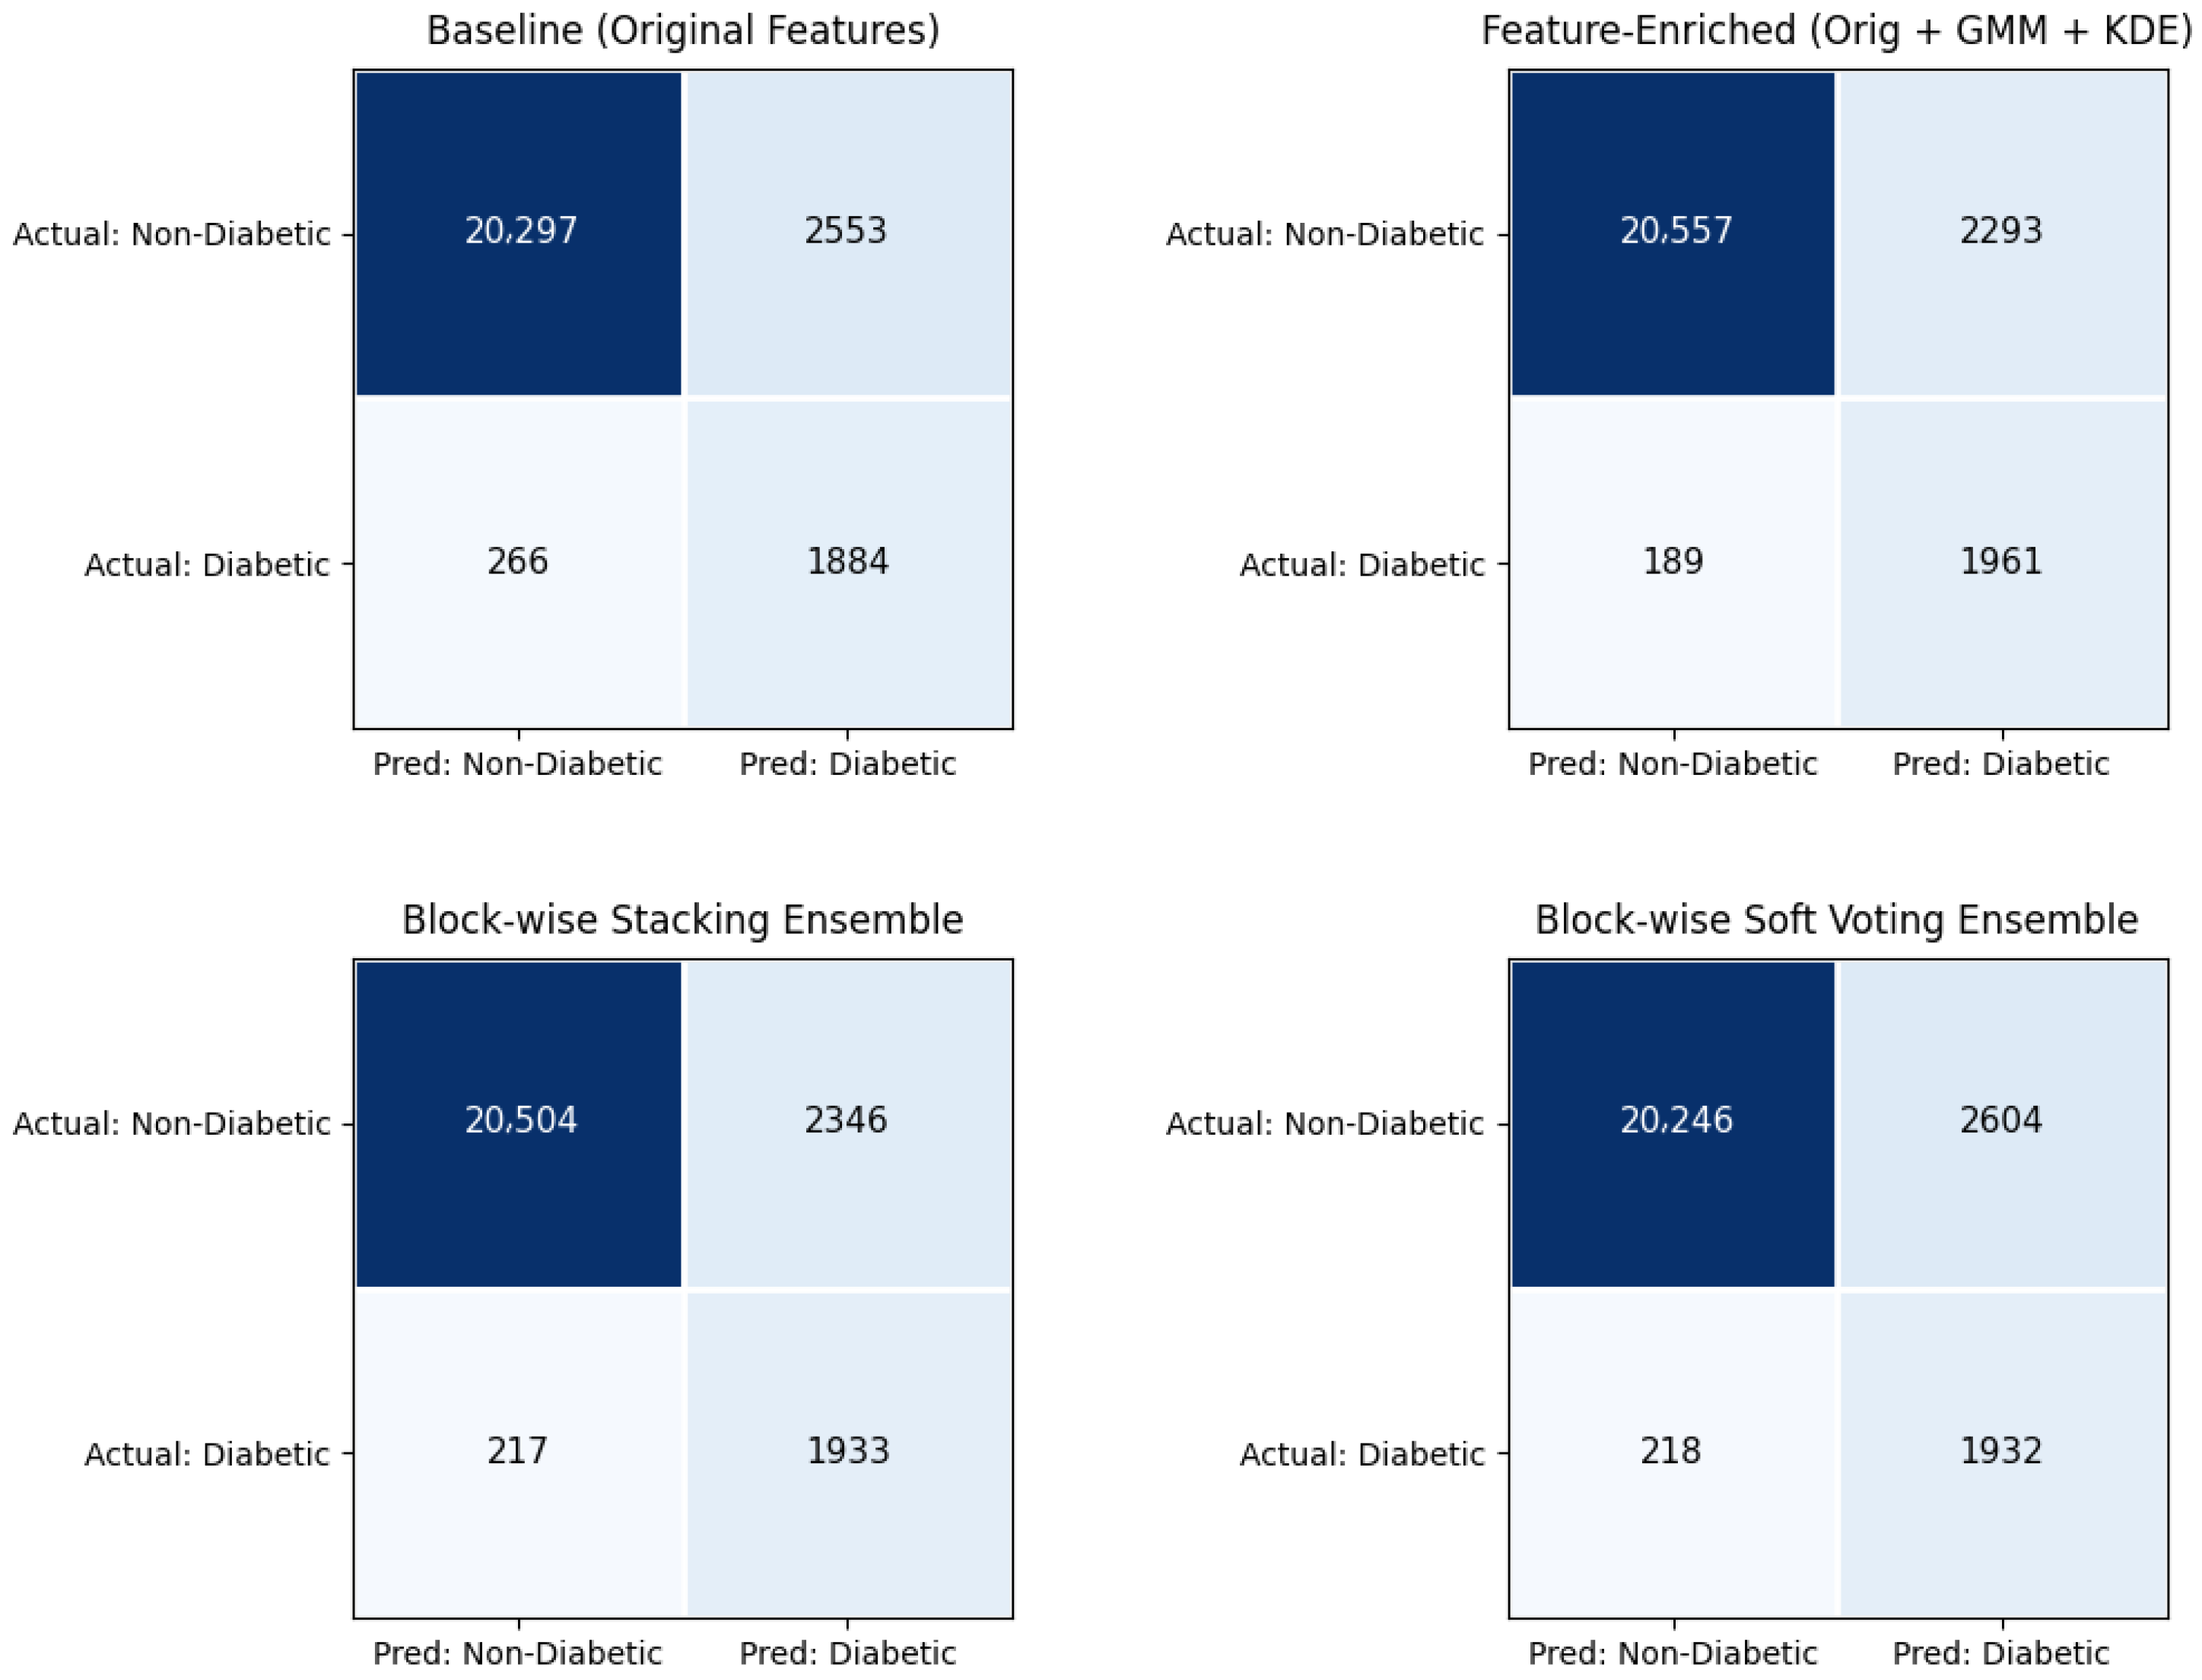
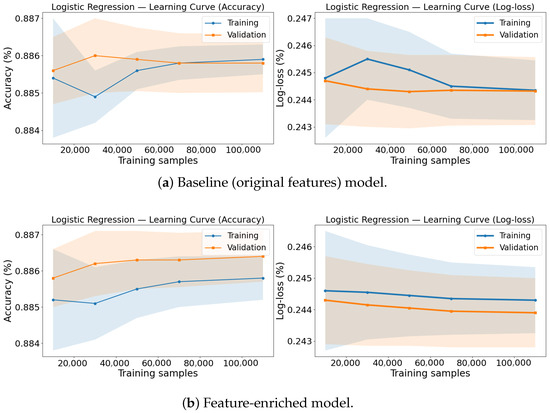
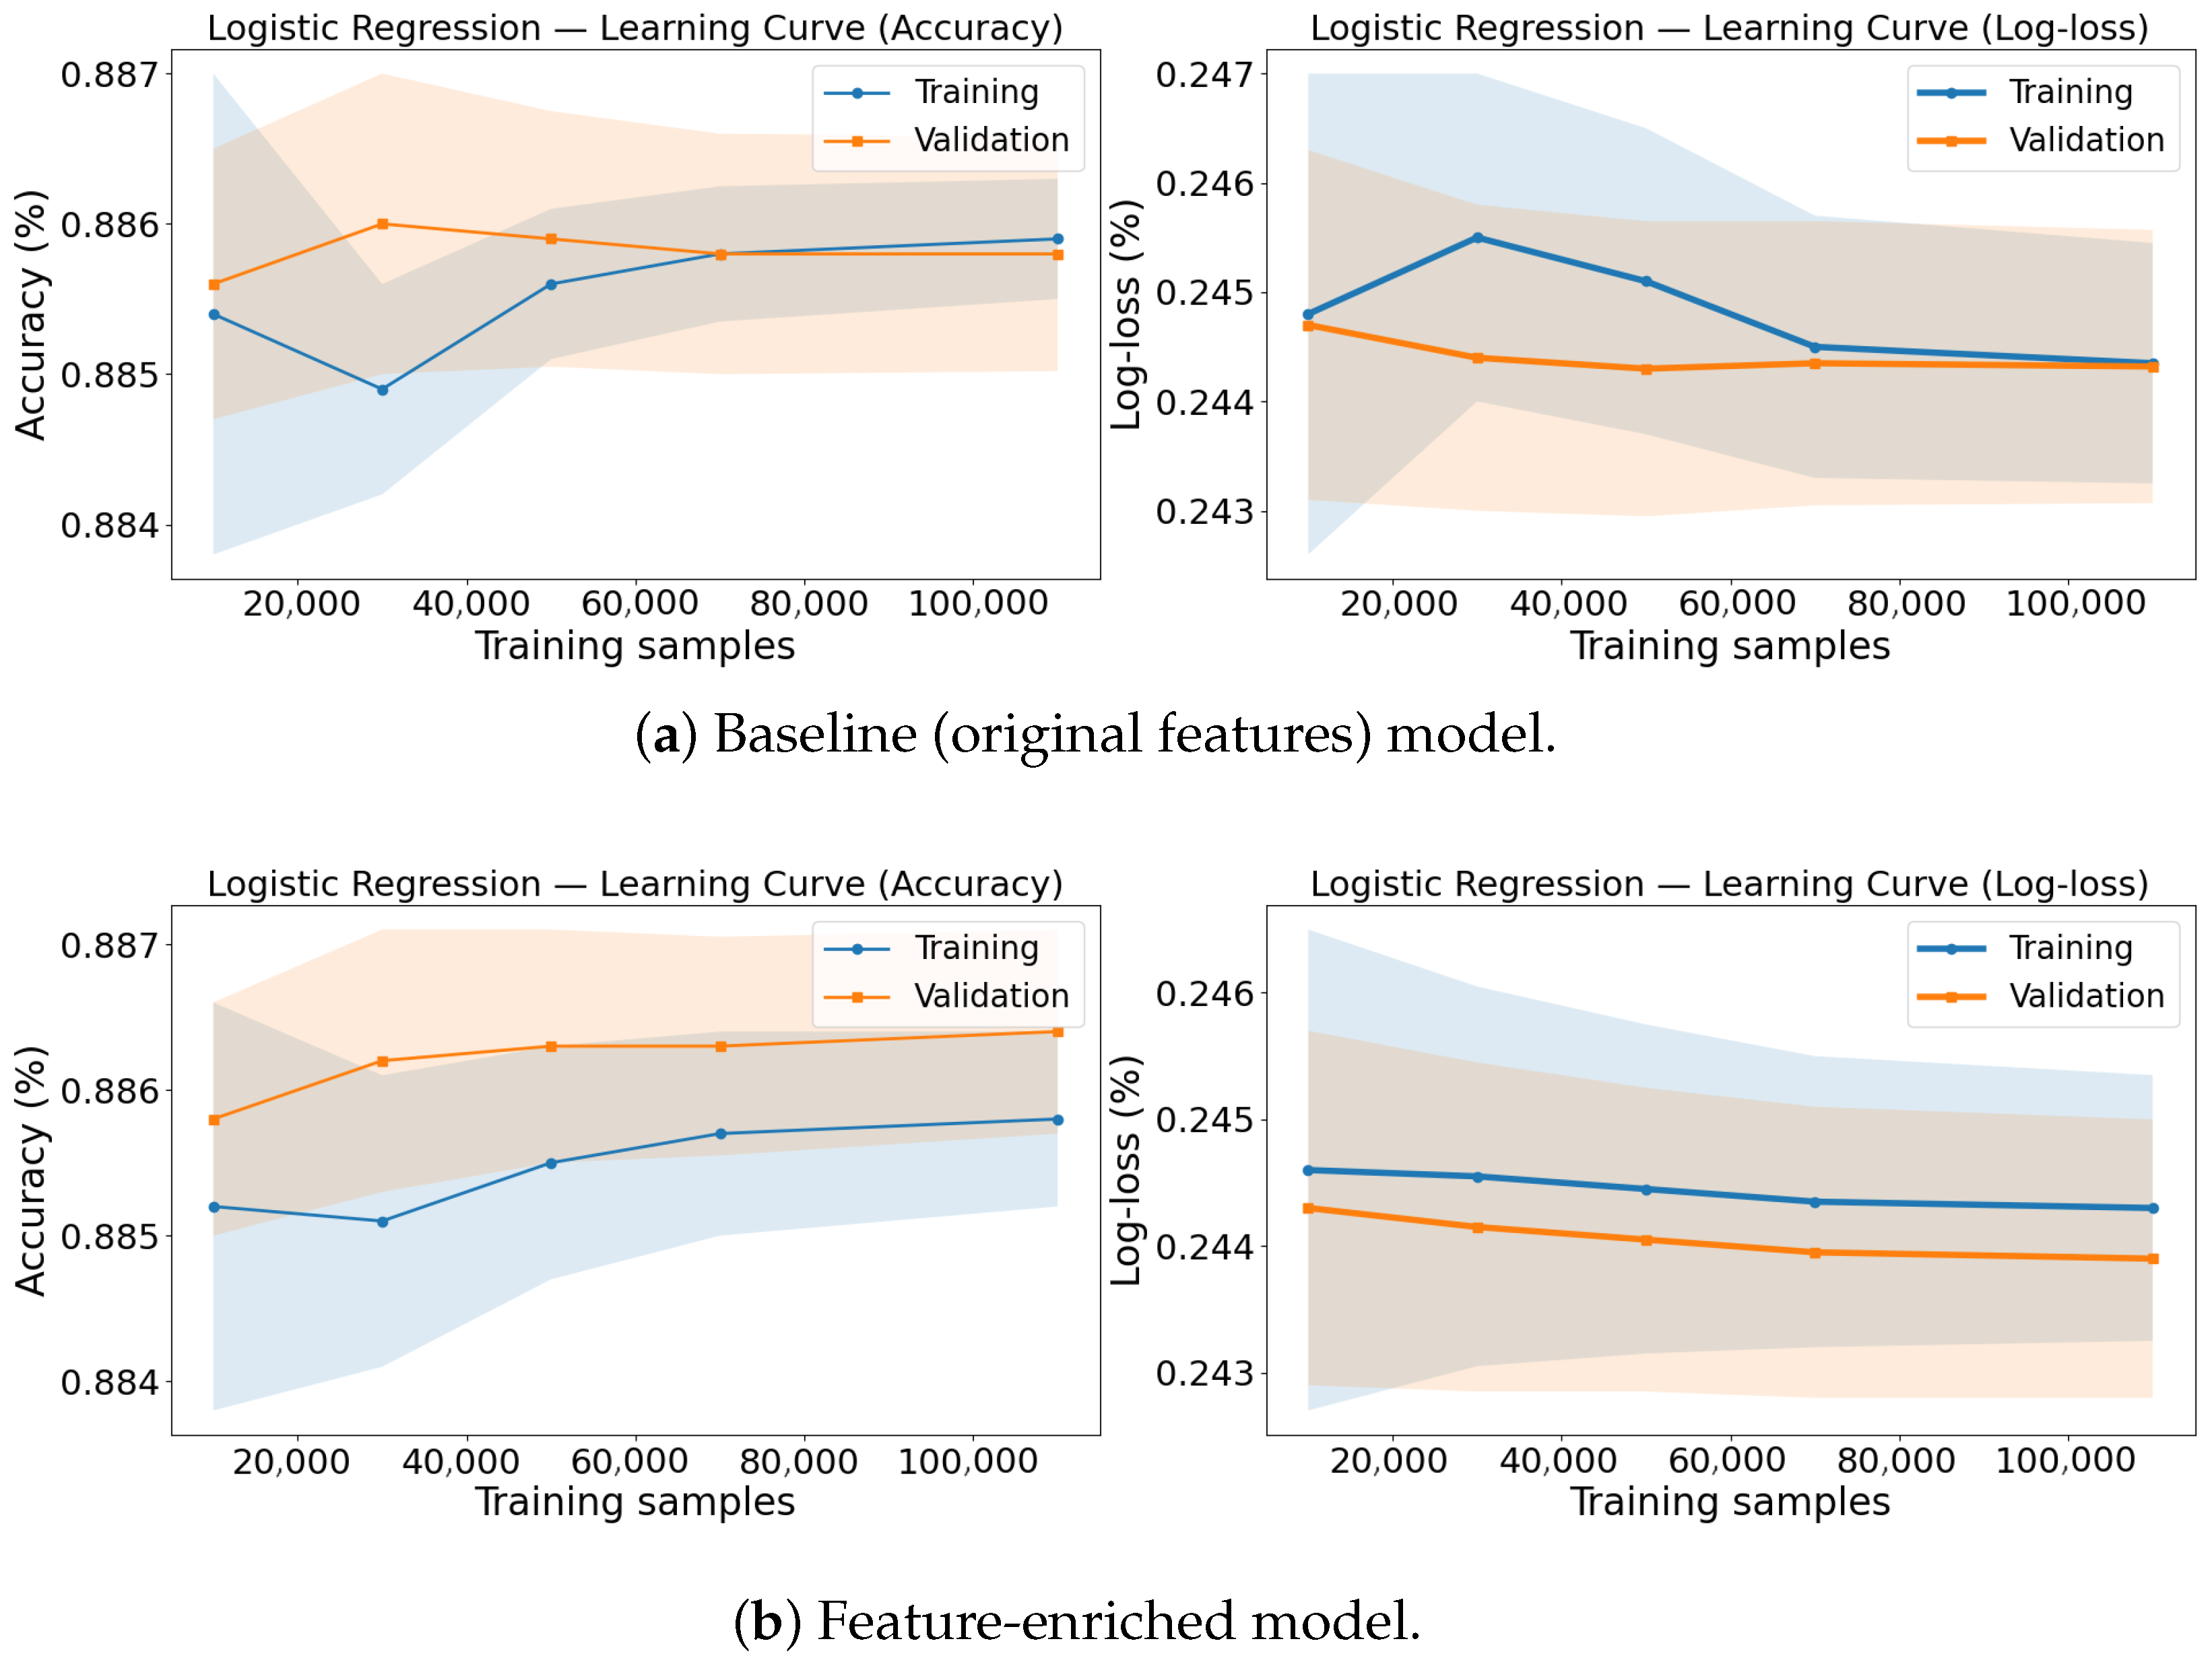
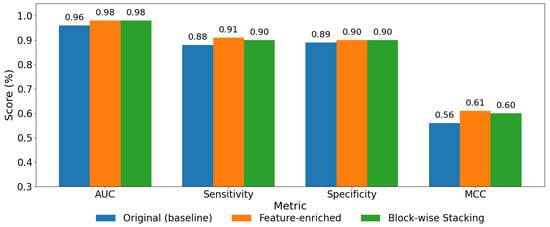
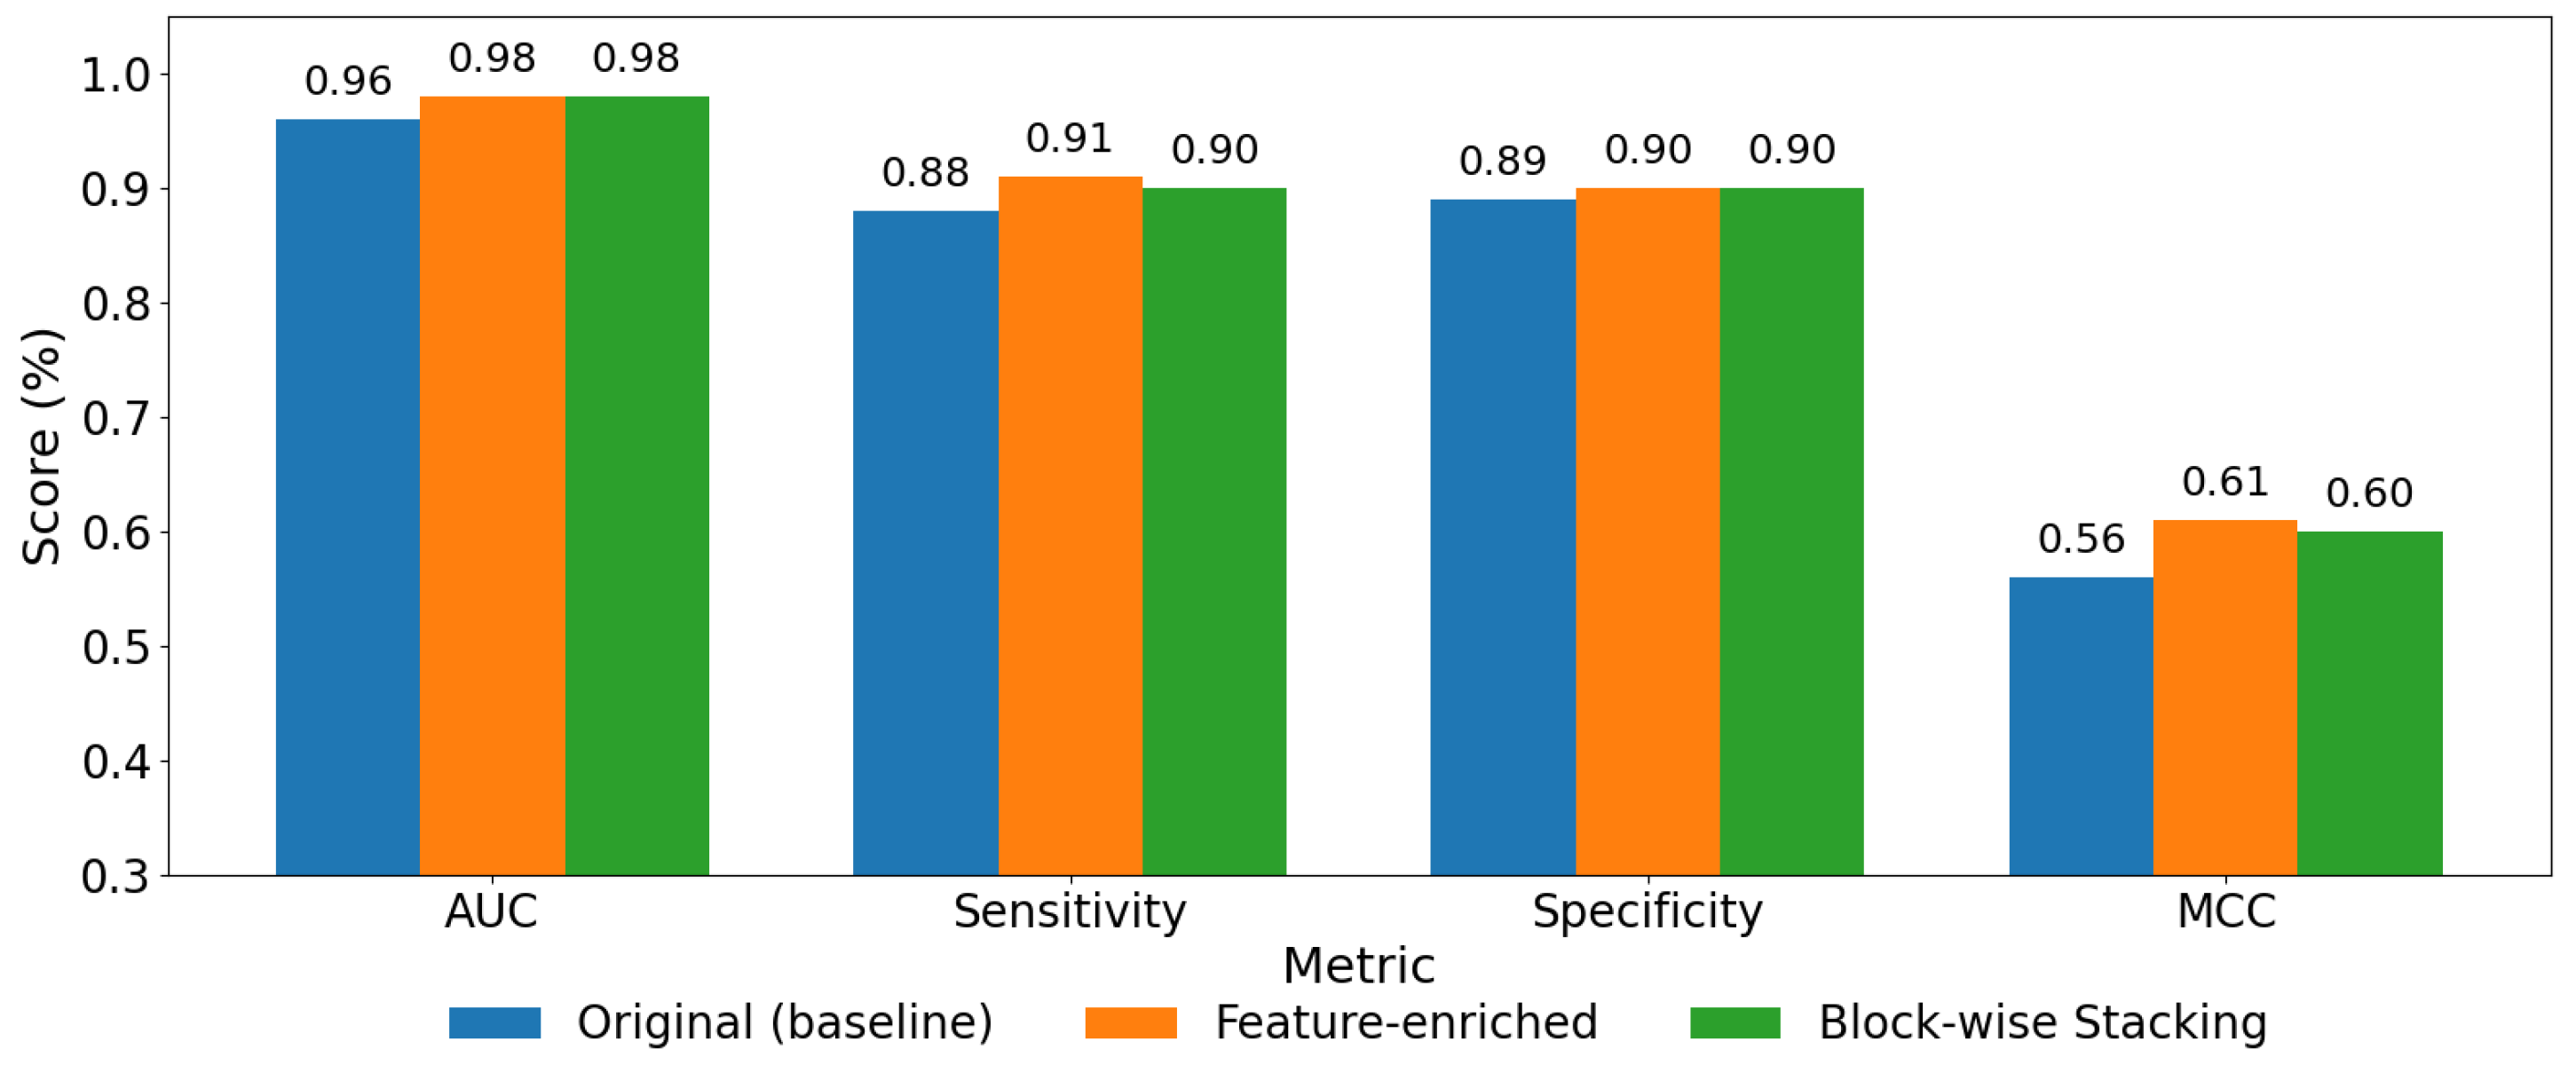
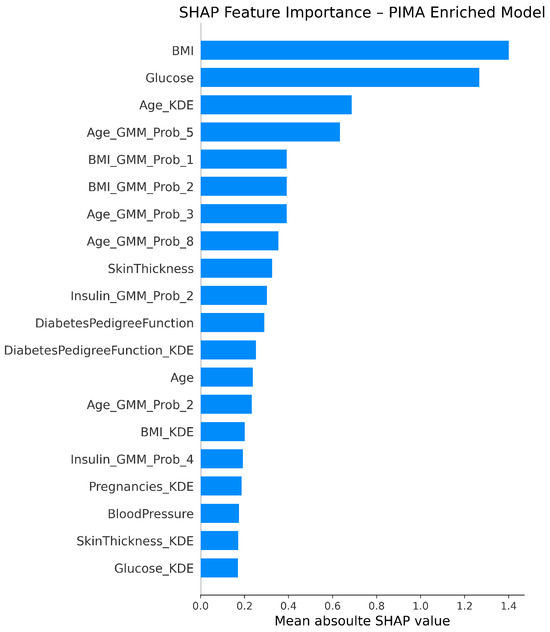
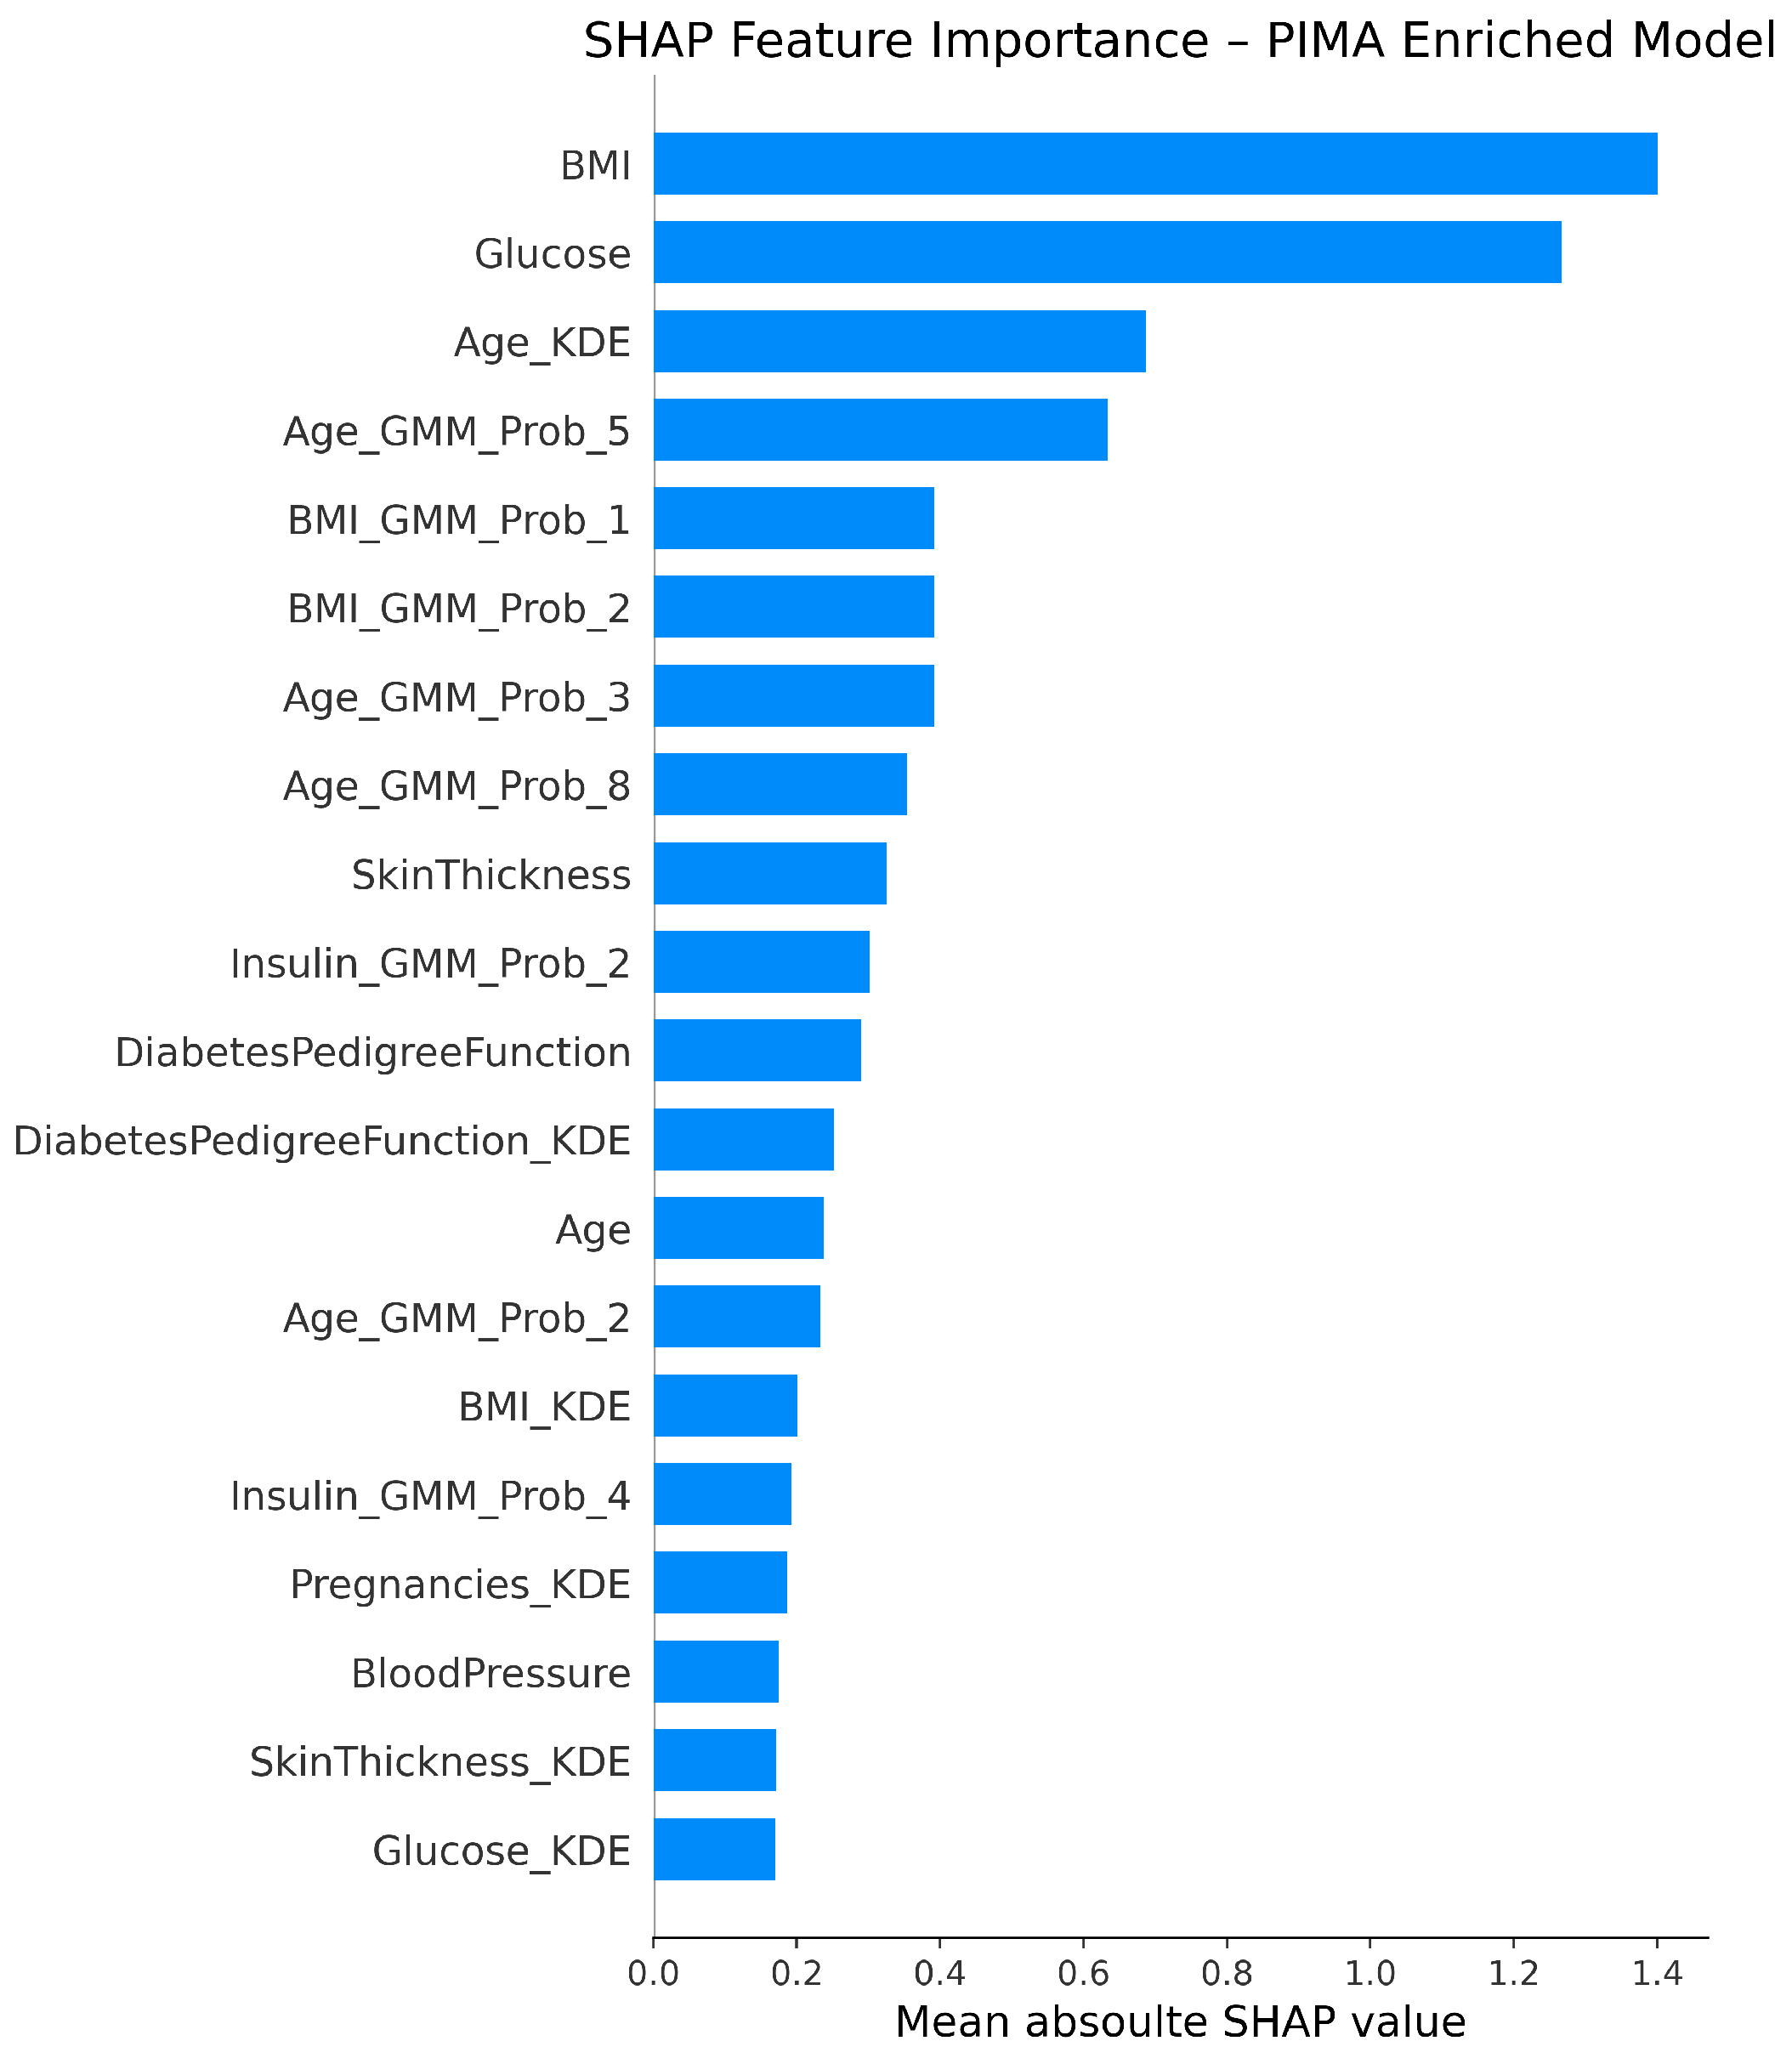
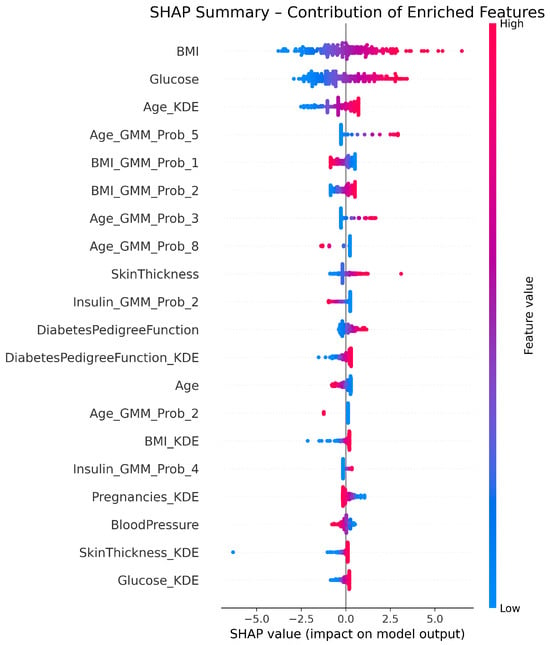
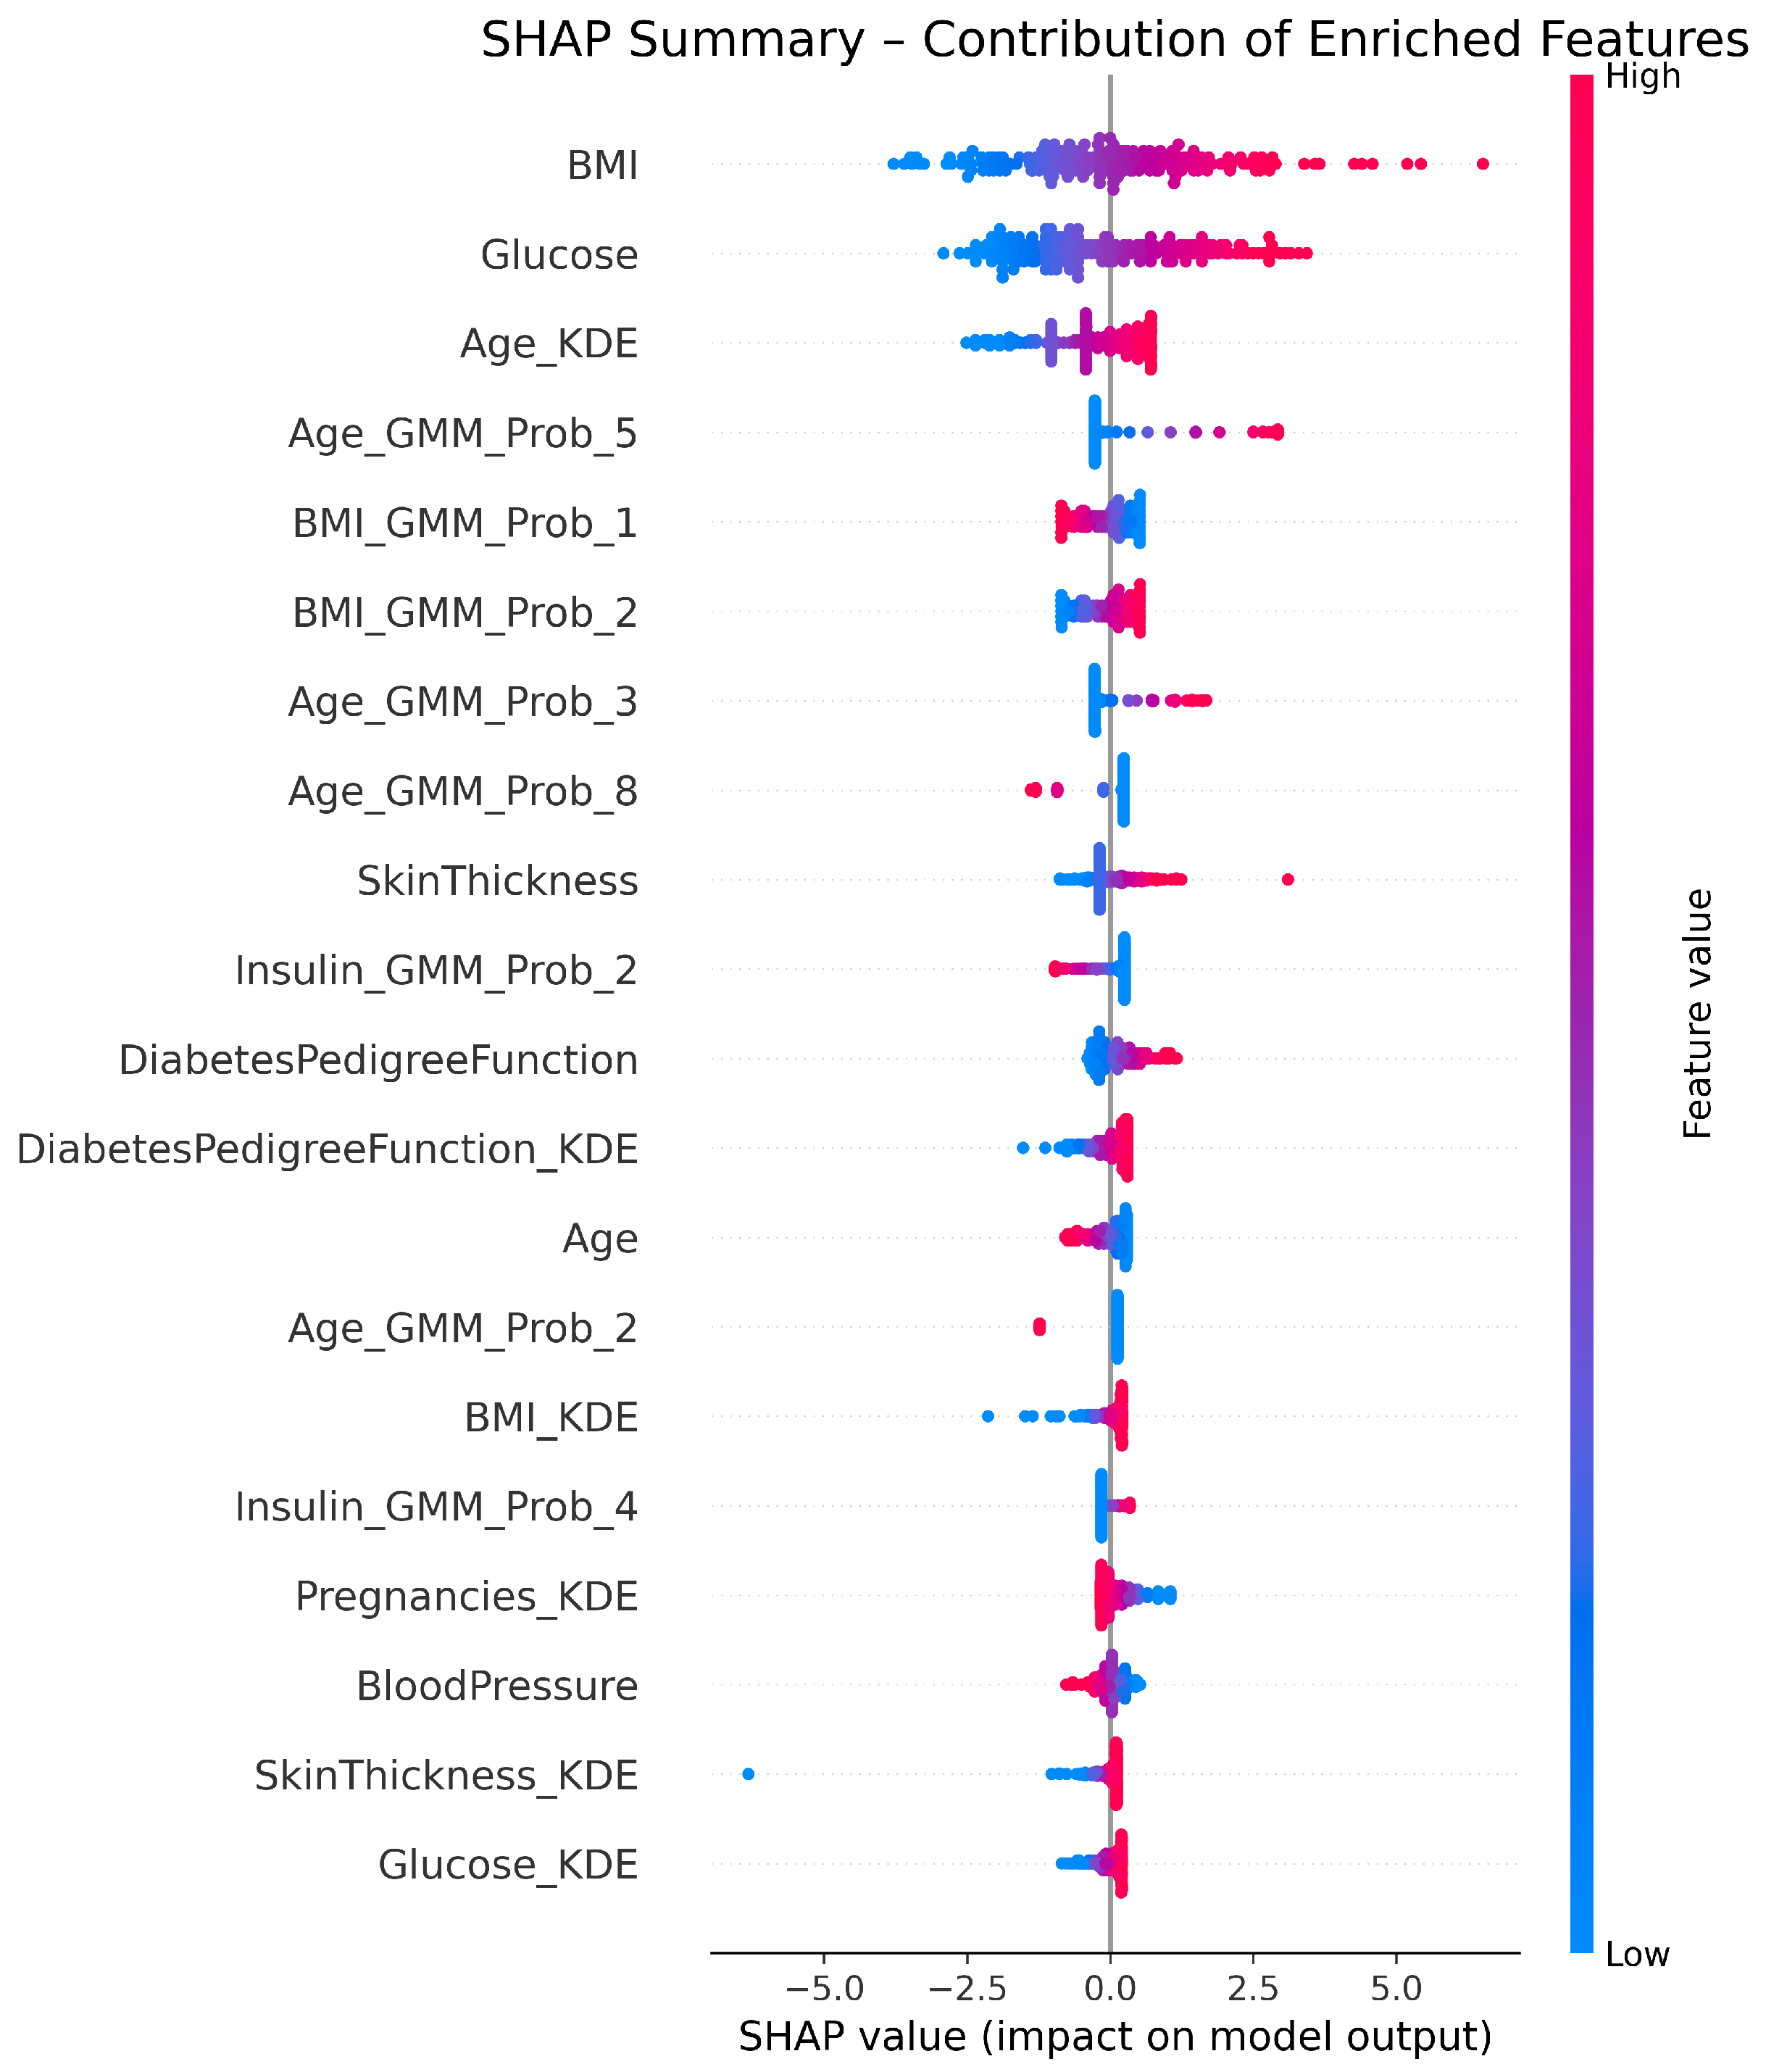

Disclaimer/Publisher’s Note: The statements, opinions and data contained in all publications are solely those of the individual author(s) and contributor(s) and not of MDPI and/or the editor(s). MDPI and/or the editor(s) disclaim responsibility for any injury to people or property resulting from any ideas, methods, instructions or products referred to in the content. |
© 2026 by the authors. Licensee MDPI, Basel, Switzerland. This article is an open access article distributed under the terms and conditions of the Creative Commons Attribution (CC BY) license.