


Abstract
Abdominal aortic aneurysm refers to the irreversible abnormal dilation of the aorta at the abdominal level, and it is acknowledged as one of the leading causes of mortality on a global scale. Most abdominal aortic aneurysms are asymptomatic until they approach the point of rupture; thus, it is essential to establish an efficient workflow for the accurate detection of this condition to enhance clinical outcomes. The incorporation of artificial intelligence learning algorithms into healthcare workflows holds the prospect of significantly improving the accuracy of decision-making related to patient mortality risk. Since the potential surgical repair of an aortic aneurysm depends upon the maximum external diameter of the aneurysm, this study aims to develop an end-to-end algorithmic method for classifying low-risk and high-risk cases based on abdominal aortic aneurysm data. To perform the predictive analysis, we adopt neuro-fuzzy systems, ensembles of neuro-fuzzy systems, and hybrid evolutionary-based fuzzy classifiers. The models are trained using features extracted from the radiomics framework and exhibit high generalisation performance, as measured by the adopted metrics, and estimated on a K-fold cross-validation basis. Numerical studies further reveal that the hybrid evolutionary-based fuzzy system exhibits exceptional accuracy in distinguishing between the two identified classes.
1. Introduction
The surgical treatment of an abdominal aortic aneurysm (AAA) is contingent upon two primary factors: the maximum external diameter of the aneurysm and its progression over time. In terms of the diameter, AAAs are categorised into small and large [1]. For male patients, a diameter exceeding 55 mm is considered clinically significant and typically warrants referral for intervention due to an increased risk of rupture [2]. The risk of aneurysm rupture rises with its size. For aneurysms over 6 cm, the risk of rupture is between and [3].
The emergence of artificial intelligence (AI) and machine learning (ML) has enabled the development of advanced algorithms capable of predicting disease progression, which yield the potential to significantly enhance the quality of medical diagnostics and treatment [4]. These methodologies are equipped with the ability to automatically learn from problem-specific data, allowing for the creation of dedicated models based on the patient’s characteristics. They facilitate data analysis, ensure precise diagnoses, and aid in the formulation of effective treatment recommendations. Thus, an AI-based scheme empowers healthcare professionals to make well-informed decisions based on robust clinical data and scientific research, ultimately contributing to increased treatment efficacy.
2. Related Work
The current status of AI algorithms, with respect to research into AAAs, is provided in [5]. The beneficial role of machine learning and artificial intelligence in abdominal aortic aneurysms is presented in [6] in terms of aneurysm rupture risk assessment as well as imaging enhancements. A gradient boosting and a support vector machine are studied in [7] in terms of AAA growth rate prediction. Furthermore, machine learning models, specifically ensemble boosted trees, are incorporated within a full pipeline to classify patients’ clinical outcomes [8]. The recent literature has increasingly explored the application of machine learning methods for the risk assessment and classification of abdominal aortic aneurysms [9]. Several studies have focused on distinguishing between elective and emergent repair needs using morphological data. For instance, Lee et al. [10] utilised surface curvatures estimated via the biquintic Hermite finite element method on segmented AAAs, achieving an classification accuracy. Similarly, Parikh et al. [11] employed a decision tree framework based on geometric quantification measures, reporting an average accuracy of for the same clinical task. Beyond geometry, multi-modal approaches have shown promise in characterising AAA symptoms and growth. Rengarajan et al. [12] developed a generalised additive model (GAM) incorporating demographic, geometric, and biomechanical features to differentiate between symptomatic and asymptomatic cases, reaching an AUC of 0.89. In a more comprehensive approach, Jalalahmadi et al. [13] utilised BestFirst feature selection with an ensemble of decision trees—integrating clinical, morphometric, and textural data—to classify aneurysms into slow, medium, or quick growth categories. Furthermore, Stoecker et al. [14] demonstrated that gradient-boosted regression trees, trained on demographics and image-derived geometric properties, could predict future AAA expansion with a mean relative error of . The integration of machine learning methods is moreover studied in [15], where the authors refer to the need for transparency in artificial intelligence-based decisions, an issue that is evident in deep learning models. The latter are interpreted as black-box models, making interpretability a quite challenging issue, and sometimes even elusive.
Even though fuzzy systems are widely used in medical applications, e.g., in the design of decision-making systems and classification tasks [16,17,18], the landscape of current state-of-the-art machine learning methods, as thoroughly studied in [19], lacks their systematic incorporation. This research is driven by the need to address this deficiency, as well as the wish to investigate classification tasks associated with AAAs from a fuzzy systems perspective. Therefore, we focus on the development of learning algorithms within a supervised learning framework aimed at classifying low-risk and high-risk cases based on the maximum aorta diameter. Instances with a diameter exceeding 55 mm are identified as high-risk—surgical repair may be considered [1]. We solve the classification problem based on the chosen formal threshold. The main contributions pertain to the development of fuzzy classifiers designed to distinguish between low-risk and high-risk classes, utilising radiomics data related to AAAs. To achieve this, we employ neuro-fuzzy systems and ensembles of neuro-fuzzy classifiers on these data sets via a bootstrap aggregating scheme. Furthermore, we develop hybrid fuzzy inference systems using evolutionary algorithms in combination with the Wang–Mendel method, effectively transforming labelled numerical data into valuable knowledge bases through the automated generation of fuzzy rules.
3. Preliminaries
3.1. Classification Task
The task in this study pertains to the classification of low-risk and high-risk classes based on AAA data. Consider the data , where denote the input features. Furthermore, let the target vector, i.e., the classes . We wish to assign an input feature x to one of the two classes. This problem is viewed in a binary sense; thus, , i.e., each label corresponds to a low-risk or a high-risk class, respectively. From the notation perspective, the set is denoted as , where .
3.2. Fuzzy Classifiers
Fuzzy systems, based on the theory of fuzzy sets, fuzzy IF-THEN rules, and fuzzy reasoning, are models endowed with a universal approximation property [20,21] capable of inferring unknown input–output mappings. A key and distinctive aspect of fuzzy systems theory is the systematic approach to transforming a collection of linguistic rules into a nonlinear mapping. There are two main categories of fuzzy systems: the Mamdani fuzzy systems and the Takagi–Sugeno–Kang fuzzy systems. This distinction pertains to the form of consequents of the fuzzy rules. In this study, we approach the problem of classification using both approaches. However, we start the analysis with the Mamdani fuzzy systems.
A fuzzy system contains four conceptual components: the fuzzifier, the fuzzy rule base, the fuzzy inference engine, and the defuzzifier. An input to the system, after being fuzzified, activates a fuzzy rule to a certain degree. Each fuzzy rule generates, through inference, an output fuzzy set. The formulation of fuzzy systems, which follows, is based on [22].
Let a fuzzy system , where the m-dimensional input space is and is the output space. Consider generating fuzzy partitions on each input , each with a cardinality . The fuzzy system’s rule base consists of rules of the form:
where for and are the input and output variables of the fuzzy system, respectively. The index set , defined as:
pertains to a dictionary, indicating the input fuzzy sets and output fuzzy sets that correspond to a specific fuzzy rule.
The antecedent of each rule is a fuzzy relation on , defined as:
where the ∧ operator is a triangular norm (t-norms) associated with the linguistic connective and of the rule’s antecedent. Following the formalism of fuzzy theory, we view the fuzzy rule as a fuzzy implication , defined in . The latter is defined as:
Given an arbitrary input fuzzy set in U, then each rule generates an output fuzzy set , given by:
The fuzzy sets are aggregated via a sequence of t-conorms, i.e., ∨, to generate the aggregated output fuzzy set , given by Equation (6).
The aggregated fuzzy set is then processed by the defuzzification module to generate the fuzzy system’s output. The defuzzification computing module maps the fuzzy sets in onto crisp points .
Fuzzy systems typically generate continuous outputs. In light of binary classification, we employ a threshold scheme to assign a class to a given input. Specifically, an input pattern is classified as low-risk when the defuzzified value is below a given threshold. Conversely, it is classified as high-risk when the defuzzified value exceeds this threshold. This is well established in the fuzzy classification literature. Thus, even though the output domain of the fuzzy system is continuous, its final computed output is binary.
3.2.1. Wang–Mendel Method
The method of Wang–Mendel [23] is a data-based procedure for generating Mamdani fuzzy systems. The training of the fuzzy system, under the WM framework, pertains to the extraction of fuzzy rules given a set of labelled numerical data. In addition to that, it provides a systematic framework for effectively reducing the number of fuzzy rules in the final inference system, yielding an interpretable and computationally efficient model.
The method starts by initially placing fuzzy partitions on top of each input and output variable of the system to cover the associated universes of discourse. For all observations in , a fuzzy rule is generated. This step involves calculating the membership degrees of the input vector for each fuzzy partition. The fuzzy set with the highest membership is retained as the antecedent for the inputs and the consequent for the outputs, respectively. For every fuzzy rule in the rule base, the degree is computed. For the pth fuzzy rule, the degree is given by:
where and represent the maximum degree of membership for fuzzy sets associated with each input and output, respectively. Therefore, the index denotes the instance from the dictionary , which indicates the fuzzy set on which the pth observation attains its maximum degree of membership.
For example, let the pth observation attain its maximum degree of membership along the first input dimension in the fuzzy set, along the mth input dimension in the fuzzy set, and in the output dimension in the fuzzy set. According to the WM method, the pth generated fuzzy rule is given by:
Since the rule base may contain conflicting rules—the rules with identical antecedents—a removal process is implemented. Among these conflicting rules, the ones that contribute to the final rule base are selected based on having the maximum degree. Finally, we determine the fuzzy system’s parameters: fuzzy connective t-norms and t-conorms, fuzzy implication, aggregation, and defuzzification operators. We provide a simple pseudocode, as outlined in Algorithm 1, to facilitate implementation in a programming language.
| Algorithm 1 Wang–Mendel method. |
Require: Training Data , type of membership functions, cardinality of fuzzy partitions for all inputs and of output .
|
The Wang–Mendel method is proven to be highly efficient in classification tasks, as presented in [24], supporting the decision to consider it as a classification model option.
3.2.2. Adaptive-Network-Based Fuzzy Inference System
The adaptive-network fuzzy inference system (ANFIS) [25], a nuance of a neuro-fuzzy system, is one of the most successful models in the landscape of computational intelligence. It provides an efficient supervised learning algorithm for training TSK models by combining the benefits of neural networks and fuzzy systems. There are two sets of trainable parameters. The former set consists of the membership functions’ parameters of the antecedent parts of the fuzzy rules, while the latter consists of the linear rules’ consequent parameters. The training resembles the analogous procedure used in neural networks and involves a gradient descent-based method for determining the antecedent parameters. Training evolves in two phases: the forward pass, where the consequents’ parameters are computed in batch mode via least squares, and the backward pass, where gradient descent updates the antecedents’ parameters. The layers of an adaptive-network-based fuzzy inference system, along with their functionality, are as follows:
- Layer 1: Computation of membership degrees , where for all on each fuzzy partition;
- Layer 2: Computation of every fuzzy rule’s firing degree;
- Layer 3: Normalisation of every fuzzy rule’s firing degree;
- Layer 4: Multiplication of every fuzzy rule’s firing degree with its corresponding rule consequent;
- Layer 5: Combination of previous layer outputs to generate the network output.
3.3. Evolutionary Algorithm
Although the method of WM provides a fast and efficient way to train fuzzy systems, it does not present explicit guidelines for selecting the parameters of the antecedent and consequent membership functions. On the one hand, we can generate uniform fuzzy partitions on each input and output of the fuzzy system and use this vanilla version of the WM fuzzy system. However, we adopt a somewhat different approach, since we are interested in developing fuzzy classifiers with a high degree of accuracy. We develop a hybrid fuzzy system by incorporating evolutionary optimisation, intermixed with the WM method of designing fuzzy systems. In particular, we employ differential evolution [26], a well-known evolutionary algorithm, to effectively fine-tune both antecedent and consequent parameters of the fuzzy model. To be precise, we care about optimising the membership functions’ parameters, which correspond to the antecedent and consequents of the fuzzy rules.
Differential evolution starts by generating an initial population of candidate solutions within a feasible set. Through the application of variation operators, the search is directed towards the most promising solutions. A greedy selection criterion is then implemented to determine which individuals will be kept for the next generation. It involves a minimal number of control parameters: the mutation scaling , the crossover probability , and the population size . In the proposed classification methodology, the set of parameters to be optimised consists of the cores and standard deviations of each input fuzzy partition’s membership functions of the WM fuzzy system.
The parameter refers to each of the optimisable parameters. Candidate solutions are represented by a population of individuals, referred to as . For every generation g, the population of the parameters is:
where and . Each column of the above-defined matrix represents the set of the model’s parameters, composing the optimisable set. Parameter M stands for the search space dimension. The dynamics of mutation are described by Equation (8), following the DE/best/1/bin variation in the differential evolution algorithm.
where , and are picked from with , which are all mutually different. The number is generated from sampling the uniform distribution on . Vector denotes the individual displaying the best fitness in the current generation. Crossover, i.e., the process of generating the trial vectors , follows the binomial operation:
where , and the integer number is randomly picked from .
Consequently, the selection of each generation’s best solutions, which will be retained in the subsequent generation, is performed in a greedy sense, i.e., comparing the trials with individuals of and keeping those with the best fitness. Similarly to the WM fuzzy system case, we provide a pseudocode of differential evolution, outlined in Algorithm 2.
| Algorithm 2 Differential evolution (DE/Best/1/bin). |
|
3.4. Ensemble Method
To enhance the generalisation accuracy of a single classifier, ensemble learning [27] is considered. Ensemble learning lies its foundations on the idea of combining the strengths of a collection of simpler base models. We construct a committee machine based on bootstrapped aggregating, i.e., bagging, thus training independent base learners using bootstrap samples. The bootstrap samples are generated from the available data set through uniform sampling with replacement. By employing a bagging learning algorithm [28], the prediction variance is reduced via the combination of the base learners.
In the fuzzy systems literature, ensemble learning is studied [29,30]. In this study, we employ an ANFIS-based ensemble, as studied in [31], with a modification that pertains to the aggregation method. Since the task involves classification, we incorporate a majority voting method to aggregate the classification results generated by each fuzzy model. The bagging methodology is illustrated in Algorithm 3.
| Algorithm 3 ANFIS-based bagging algorithm. |
|
We combine the predictions of the classifiers within the ensemble using a majority voting scheme. Consider that a classifier has a probability of predicting the correct class given by p. The probability of the ensemble making the correct classification is given below.
thus, as if , and if . Therefore, the probability of the ensemble predicting the correct class increases rapidly, given that the base learners display a probability of a correct answer that is greater than , i.e., a random guess in the binary class case. This result is known as the Condorcet Jury Theorem and formalises the probability of a plurality-based jury decision being the correct one [32]. For a rigorous mathematical proof of why bagging works within a classification setting, readers are referred to [28].
4. Materials and Methods
4.1. Data and Feature Extraction
The data considered in this study refer to features generated by a radiomics feature extraction framework. The radiomics feature extraction was performed using Python’s (version 3.9.23) module pyradiomics (version 3.0.1). This robust pipeline was designed for multi-dimensional feature calculation, encompassing both three-dimensional (3D) volumetric and two-dimensional (2D) analysis across the Axial, Coronal, and Sagittal planes. AAA volumes have been thoroughly examined for any data discrepancies and label overlaps. We decided to apply a volume cropping to narrow the Field of View (FOV), creating a bounding box that surrounded the area of interest, starting near the Renal Arteries and expanding to the level of the bifurcation of the Common Iliac Arteries. All images (3D Computed Tomography (CT) volumes) and their segmented masks were standardised to ensure feature consistency. This involved resampling the input volumes to a standard isotropic voxel spacing of 1 using B-spline interpolation. Intensity values were then discretised with a fixed bin width of 25 Hounsfield Units, which is appropriate for CT data, before feature calculation. Expert personnel reviewed the original 3D CT volumes and labelled the lumen, the intraluminal thrombus (ILT), and any calcifications based on 3D Slicer software [33]. Subsequently, a single unified VOI was created by merging these individual labels for feature extraction. A comprehensive suite of radiomics features was calculated for the 3D standard volumetric features, including first-order, shape, and textural features (calculated from Gray Level Co-occurrence Matrix, Gray Level Run Length Matrix, Gray Level Size Zone Matrix, Neighboring Gray Tone Difference Matrix, and Gray Level Dependence Matrix). In addition, through 2D plane-wise analysis, features were computed independently on each slice along the respective dimension (Axial, Coronal, Sagittal). The resulting slice-level feature values were then aggregated into a single summary value per feature for each plane. To avoid redundancy and potential instability with 2D aggregation, 2D shape features were not calculated since they were already described by the 3D shape features. Moreover, to capture features across multiple scales and intensity transformations, a full range of image filters was applied before feature computation, including (a) Original; (b) Wavelet (8 sub-bands); (c) Laplacian of Gaussian with sigma values equal to 1.0, 2.0, 3.0, and 5.0; (d) Square; (e) Square Root; (f) Logarithm; (g) Exponential; and (h) Gradient. The final output feature space that was used for the downstream analysis comprised a total of 5636 features per patient, calculated across the four extraction modes (3D and the three 2D planes), with each set containing features derived from the eight enabled image filters.
4.2. Data Normalisation
To train the fuzzy classifiers, all features , where , are mapped into using the min-max normalisation technique given below.
where represents the normalised jth feature, whereas and . This method is beneficial in the case where the features are on different scales that vary by orders of magnitude; the feature with large variability will dominate in terms of predictive influence. Alternative methods of data normalisation have also been considered to assess their potential impact on performance. The techniques evaluated include the Z-score ( and the unit-vector scaling methods, i.e., . The results obtained are identical, with the maximum observed difference in accuracy being less than . Consequently, and in light of the computational efficiency that the min-max normalisation scheme fosters in the optimisation process of the fuzzy models, it is applied throughout this study.
4.3. Feature Selection
Feature selection simplifies a classification task by picking a subset of the available features that should be considered as model inputs. This process facilitates the reduction in complexity, yielding simpler and computationally efficient predictive models. Feature selection—an essential procedure within a machine learning workflow—refers to the determination of a subset of considered features, so that the reduced data set leads to an optimal performance of the predictive model [34].
Due to the high dimensionality of the feature space generated from the radiomics pipeline, this study considers filter-based methods for the systematic determination of a proper subset, which will serve as input to the fuzzy classifiers. We adopt the method of Minimum Redundancy Maximum Relevance (mRMR) [35] for feature selection. The mRMR algorithm determines an optimal set of features that are highly relevant to the target variable, while being minimally redundant with each other. It ranks the importance of features based on the evaluation of redundancy and relevance, which is determined through mutual information.
The feature importance of an m-dimensional feature in comprises two terms [36]:
where y corresponds to the target variable, i.e., the ground truth class, while denotes the cardinality of the feature set. The first term in the latter expression corresponds to the relevance of to the target variable, while the second to the redundancy of a feature with respect to another , with . High redundancy indicates that the feature contains information already available in the selected features. The mutual information is given by:
where and are the sample spaces associated with the discrete variables x and y, respectively. By scaling the summation by the inverse number of selected features, the effect of feature redundancy is gradually reduced. As more non-redundant features are selected, it becomes increasingly difficult for new features to be redundant to those that have already been included. The selected features in the reduced feature set emerge as the solution to the optimisation problem below.
where the fraction in the latter expression is the mutual information quotient. The quotient scheme ranks features based on the quotient of their relevance and redundancy, with the idea that a feature should have high relevance and low redundancy to be selected [37]. The decision of selecting the mRMR algorithm for feature selection in the proposed methodology is supported by the benchmark study [38], which indicates the superiority of this method in feature selection tasks. It should be mentioned that even though the latter paper suggests that the method of mRMR is superior, numerical studies have been carried out to examine the method’s performance in this particular problem. Compared to the ReliefF method, which is an alternative filter-based feature selection method, the method of Minimum Redundancy Maximum Relevance generated features which had higher accuracy when considering the observed maximum accuracy in all the models. The results of ReliefF-based classification showed slightly inferior performance compared to the mRMR-based scheme, supporting the appropriateness of mRMR selection in this study.
4.4. Cross-Validation
We employ cross-validation (CV), specifically a K-fold scheme, to quantify the generalisation performance of the predictive models. Generalisation refers to the average performance computed over different data sets not participating in the training procedure. Given a small data set, K-fold cross-validation is a widely acknowledged method for estimating the generalisation performance of a model. In that scheme, multiple fuzzy classifiers are trained and tested on numerous random K non-overlapping partitions of the original data. Consequently, the test error is estimated by aggregating the predictions generated from each of the K models. To maintain the same class proportions in each fold, we incorporate a stratified scheme of cross-validation.
4.5. Supervised Learning
A total of 66 patients are included in this study, each associated with 5635 features. The data include information about the patients’ maximum aorta diameters, which is considered the target variable of the supervised learning problem. The data set is constructed by mapping the radiomics-generated features to the target variable y, representing the maximum aortic diameter. We approach this as a binary classification problem, where the low-risk class corresponds to and the high-risk class corresponds to . We group patients’ diameters within the two classes, i.e., when , we set y to unity, whereas when , we set y to zero. The radiomics features are separated into 11 distinct subgroups, based on 3D volumetric features and 2D features generated from analysis along the Axial, Coronal, and Sagittal planes. The subgroups consist of the four extraction modes—3D and the three 2D planes—with each set containing features derived from the enabled image filters.
We group the extracted features into subsets as presented in Table 1.
Table 1.
The radiomics features extracted grouped into subsets.
Patients without recorded diameter measurements were excluded from the analysis. After removing patients with missing values, the total number of participants was 44. The data included 42 male and 2 female individuals. Since the high-risk classes varied in diameter between males and females, the female subjects were excluded to avoid introducing bias into the data. This decision was made to ensure that the data set maintained consistent labelling. Consequently, and following the latter exclusion, the final data set comprised a matrix. In the latter data, 19 instances corresponded to the high-risk class, while 23 to the low-risk class.
A feature selection scheme was applied to each subgroup, with the features being ranked based on their importance as determined by the Minimum Redundancy Maximum Relevance (mRMR) method. Table 2 presents the maximum observed 5-fold accuracy of the fuzzy classifiers based on features selected from the methods of mRMR and ReliefF. In particular, both the latter methods were used to select features from the set of 2D Axial and the full set of radiomics features.
Table 2.
Observed 5-fold accuracy using different feature selection methods. The exponent near the values refers to the number of inputs for which the model performs best.
It is quite clear that feature selection based on the mRMR method is superior, considering that the best performance is achieved using a more compact set of features. For example, when the ensemble of neuro-fuzzy classifiers is considered, the features selected by the ReliefF method lead to slightly higher accuracy, but at a computational cost of seven inputs, rather than three, if mRMR-selected features are considered.
Following the feature selection process, we train and test the classification models by progressively expanding the input space, starting with , then , and so on, up to seven inputs. For example, the input combination consists of the highest-ranked and second-highest-ranked features, according to the mRMR scheme. For each input space, the models are trained and tested, and their performance on each subset of features is evaluated using K-fold cross-validation. Based on the numerical experiments, it has been determined that the features yielding the highest accuracy across all predictive models consist of the 2D Axial features.
4.6. Classification Models
In this section, we discuss the details of the classification algorithms, i.e., the fuzzy models. We consider ANFIS, an ensemble of ANFIS, a fuzzy classifier based on the WM method, and an evolutionary-optimised WM-based fuzzy system. In terms of the adaptive-network fuzzy inference system, we consider two Gaussian membership functions for each input . The fuzzy rules correspond to a zero-order TSK consequent. The training of the neuro-fuzzy model is performed using a hybrid-learning scheme, i.e., the antecedents are tuned using gradient descent, while the consequents are computed via least-squares. The training occurs over thirty epochs. The mechanism in which the fuzzy rules are generated corresponds to grid partitioning; hence, the overall number of rules is given by , where nMFs refers to the number of fuzzy sets generating partitions on each dimension.
The ensemble is developed using a bagging approach, which involves randomly sampling the data with replacement for each fold. By numerical experiments, it is found that the number of base models that yield the best performance for the ensemble is six. Each base model corresponds to the previously mentioned adaptive-network fuzzy inference system. The ensemble’s aggregation is implemented using majority voting.
Regarding the Wang–Mendel fuzzy system, the following hold: Each input is fuzzified using uniform fuzzy partitions, with three Gaussian membership functions assigned to each. A uniform fuzzy partition with two Gaussian membership functions is used for the output variable. The selection of Gaussian membership functions is due to their minimal parameterisation, which facilitates effective optimisation—each fuzzy set is characterised by its kernel and its standard deviation. The Mamdani-type fuzzy inference system uses minimum t-norms, as well as minimum fuzzy implication. Furthermore, the aggregation, i.e., the process of generating an overall fuzzy set, corresponding to the fuzzy union of each fuzzy rule, is implemented using a maximum t-conorm. The defuzzification is performed using the centre of gravity method.
To optimise the performance of the fuzzy classifier, which is based on the Wang–Mendel method, we proceed with an evolutionary algorithm approach. We consider a DE/Best/1/bin version of differential evolution to facilitate the early exploration of promising solutions within the search space. We assume a maximum number of thirty generations, quite sufficient for the problem studied, and at the same time ensures fair comparison with the iteration considered for ANFIS training. The decision variables, associated with the optimisation problem, consist of all kernels and standard deviations of each fuzzy set on the input and output fuzzy partitions. The population size is set as ten-fold the number of decision variables. The boundary constraints are enforced by adopting a projection technique [39]. The differential evolution hyperparameters, i.e., the mutation scaling and the probability of crossover, are set as and , respectively, following the guidelines of the differential evolution methodology.
As far as the classification problem is concerned, the computed outputs generated by each fuzzy model are thresholded to generate a binary output, i.e., . Provided that the rescaled output domain lies in , the threshold value is ; hence, values below this threshold are considered low-risk cases, while greater values are assigned to the high-risk class.
4.7. Complete Methodology
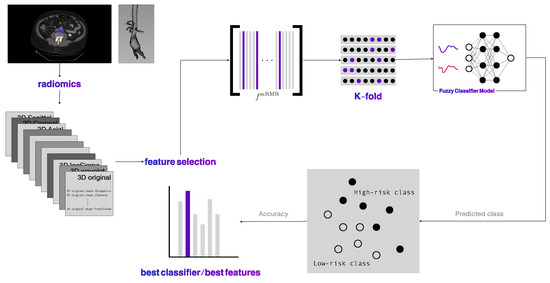
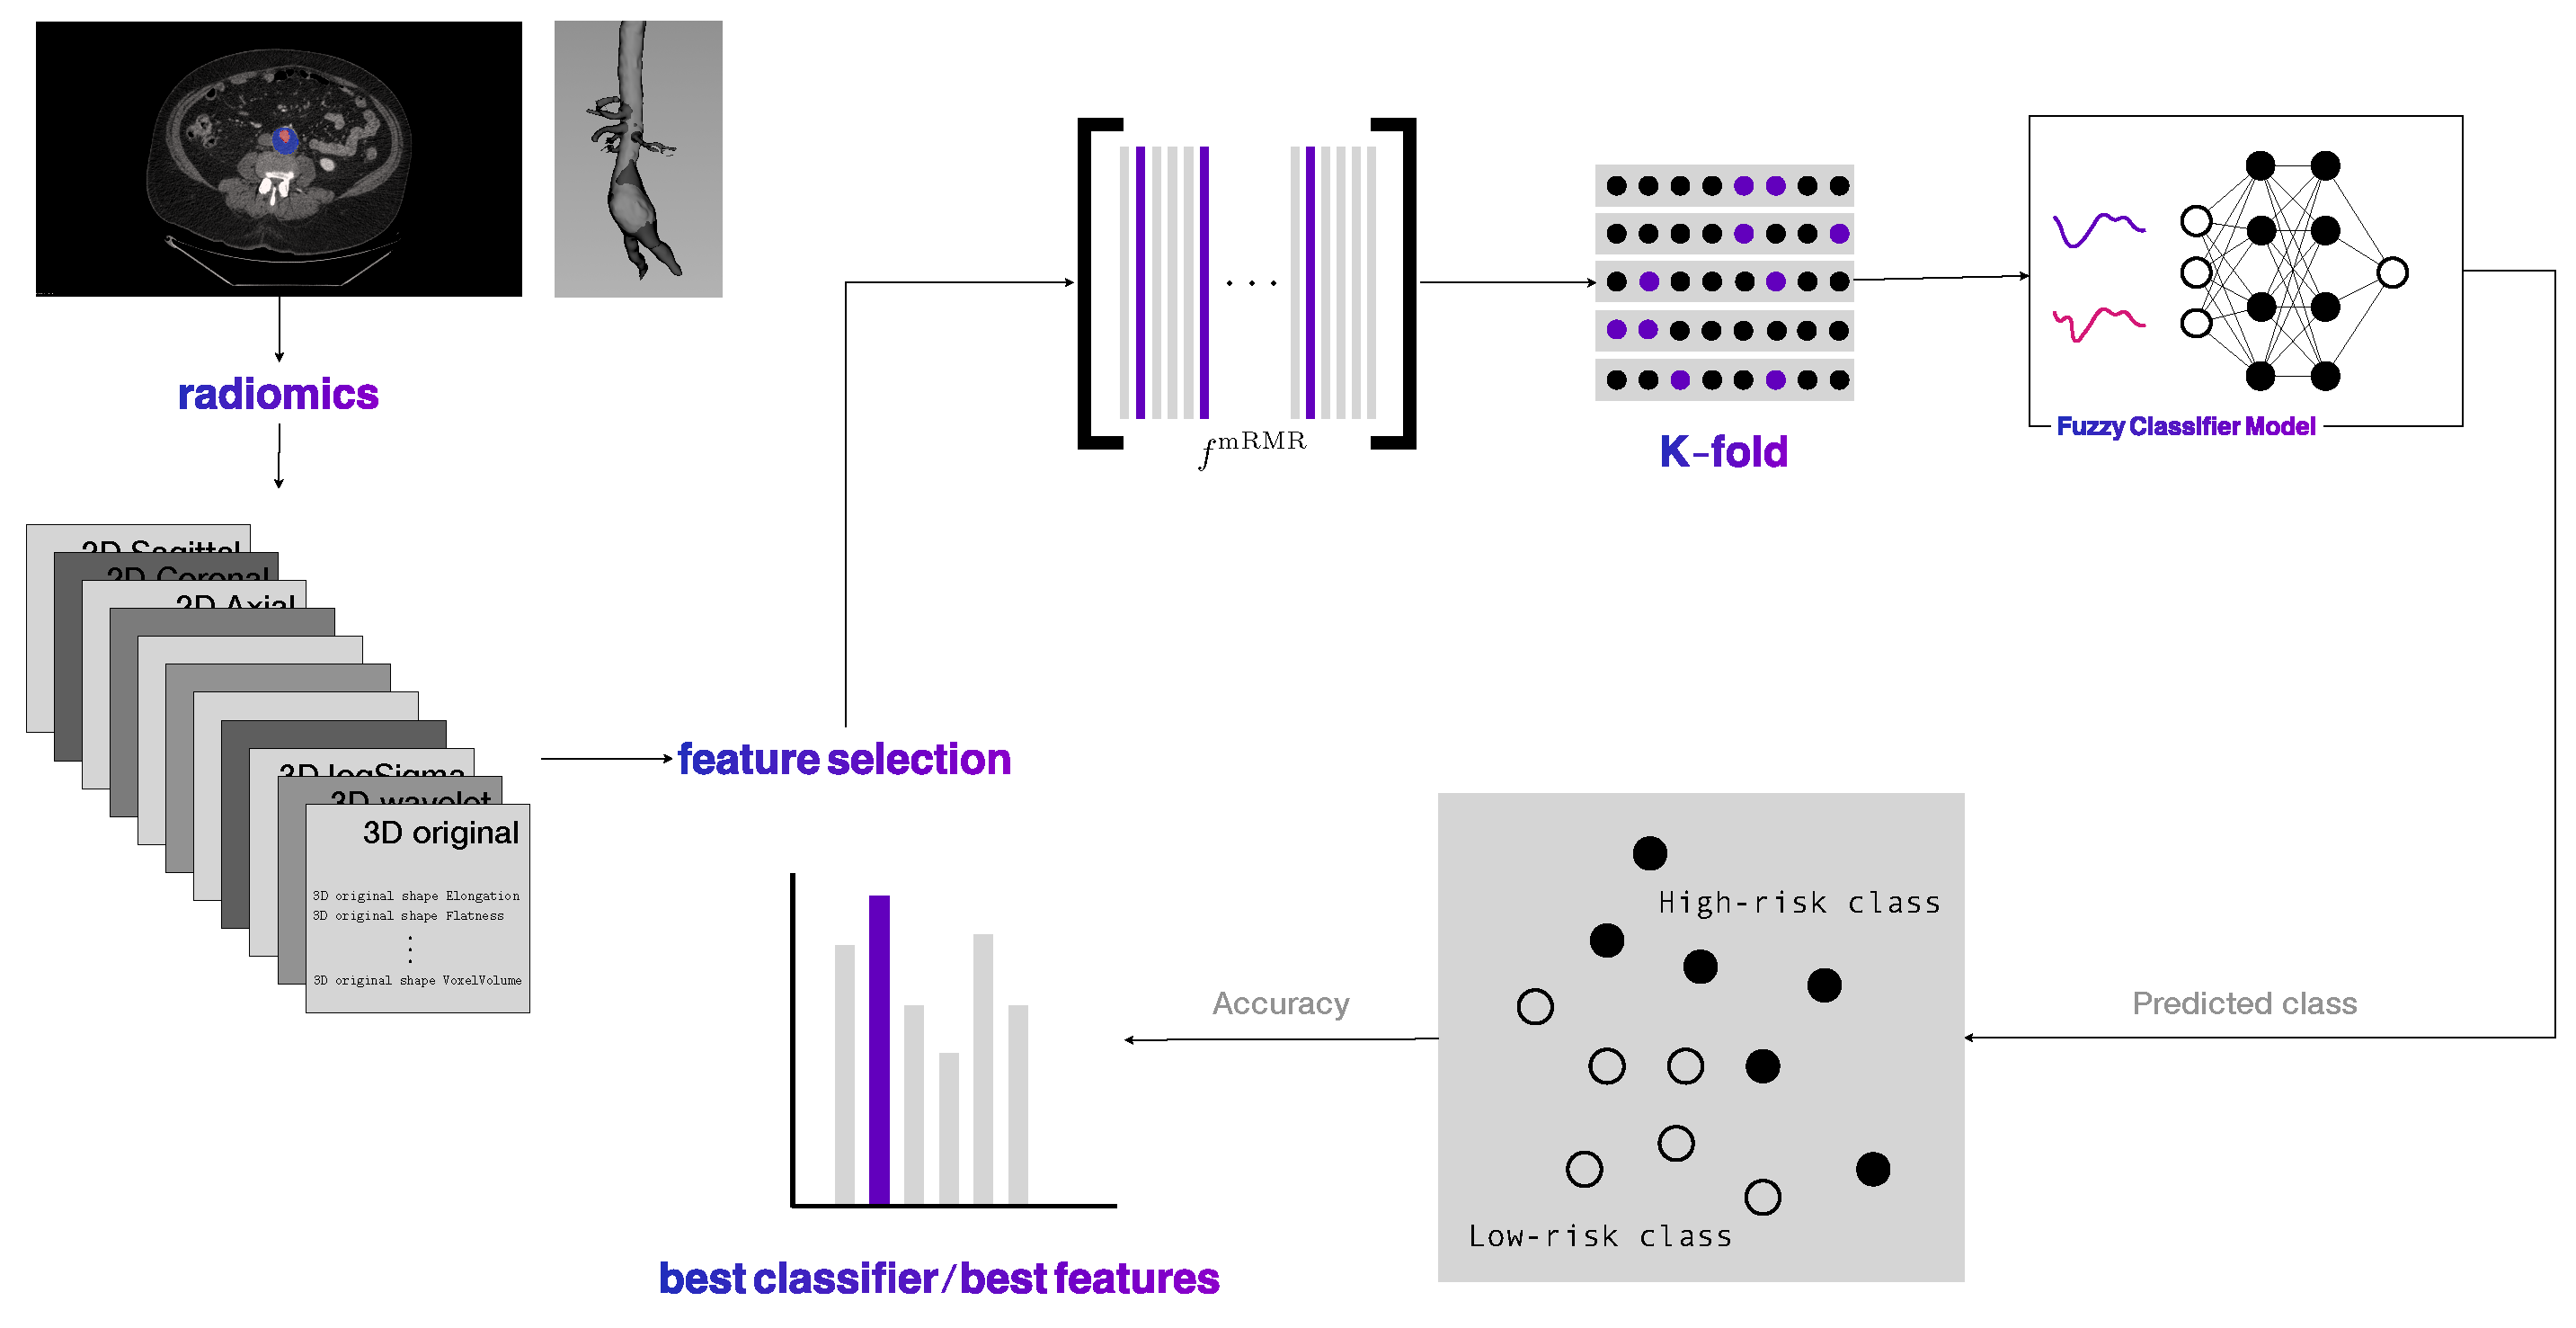
Figure 1 illustrates a flowchart of the proposed methodology, in the case where the predictive model is a fuzzy classifier.
Figure 1.
Flowchart of the methodology.
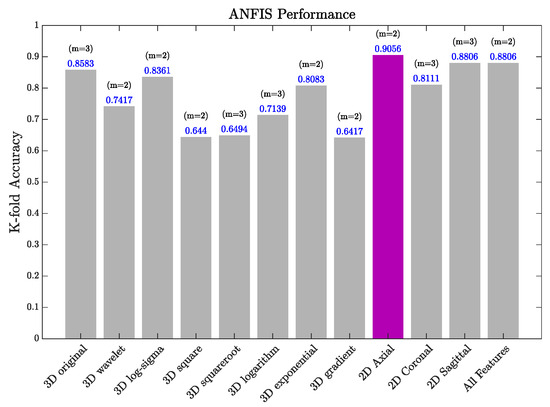
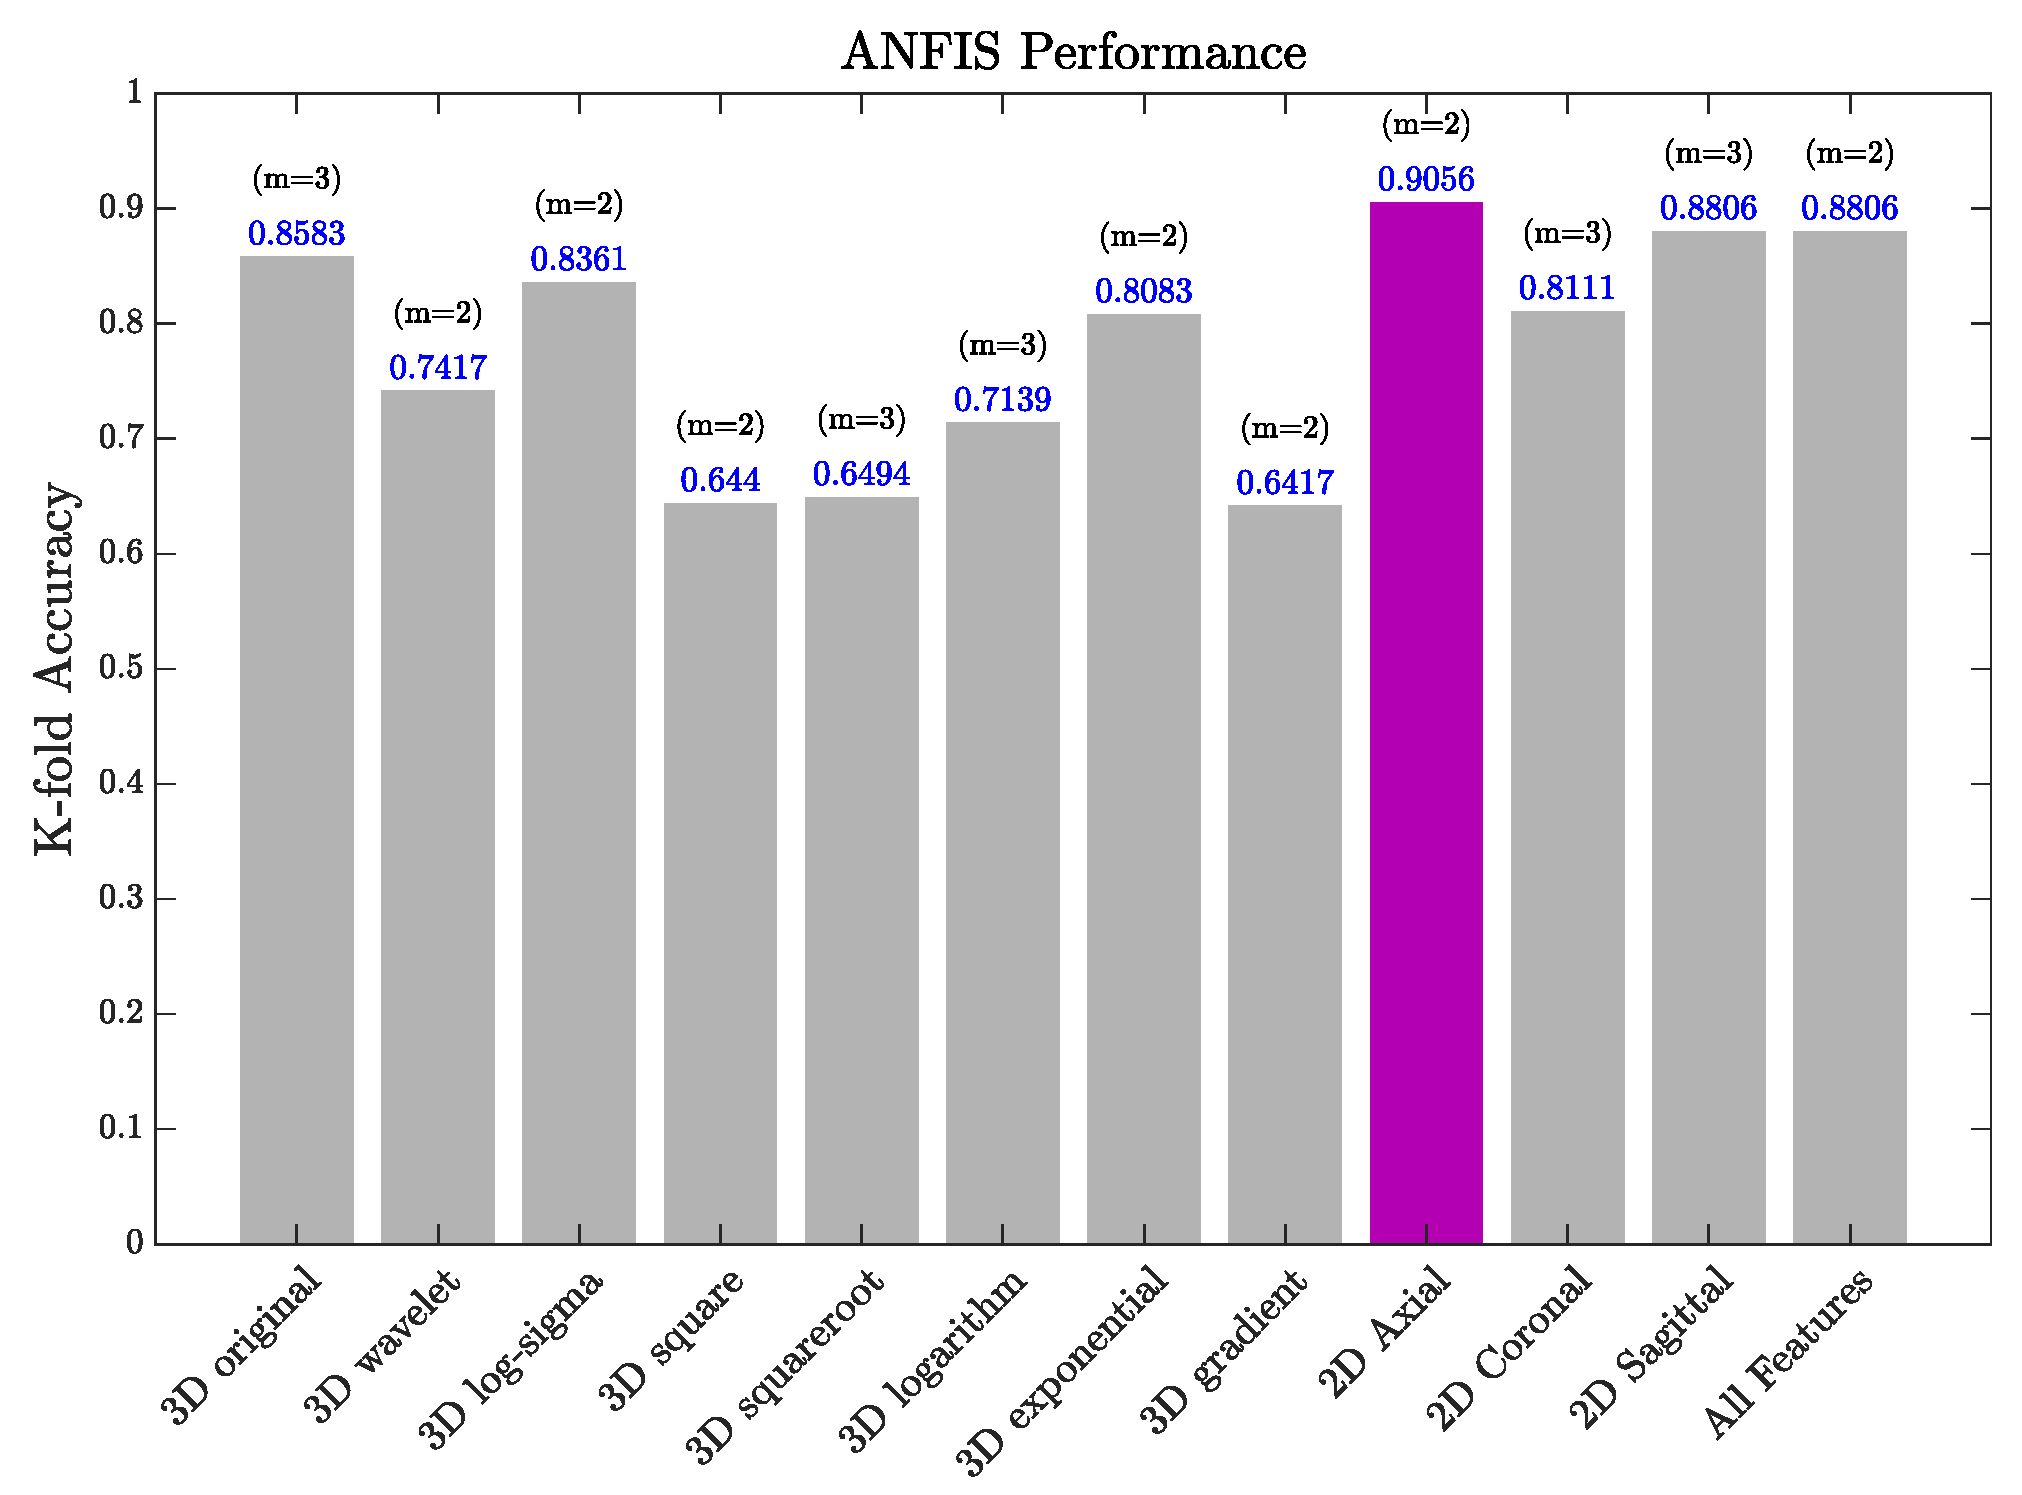
We present the results of the fuzzy models’ performance in classifying the low-risk and high-risk classes. The results obtained correspond to the test performance of five-fold cross-validation. Figure 2 illustrates the five-fold performance of the adaptive-network fuzzy inference system when different subgroups of features are taken into consideration. As clearly indicated, the feature group that yields the highest five-fold accuracy consists of the 2D Axial features. Therefore, when considering the latter group of features, the model achieves even higher accuracy than when all features are included. Furthermore, we report the input dimension under which the neuro-fuzzy classifier achieves its best performance, e.g., for 2D Coronal features, the model achieves a five-fold accuracy of , using three inputs.
Figure 2.
ANFIS five-fold performance with respect to the feature subsets.
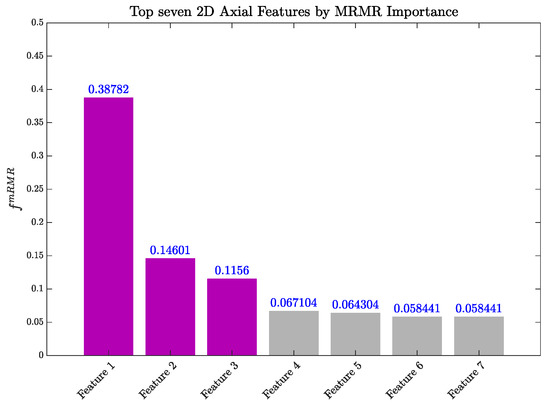
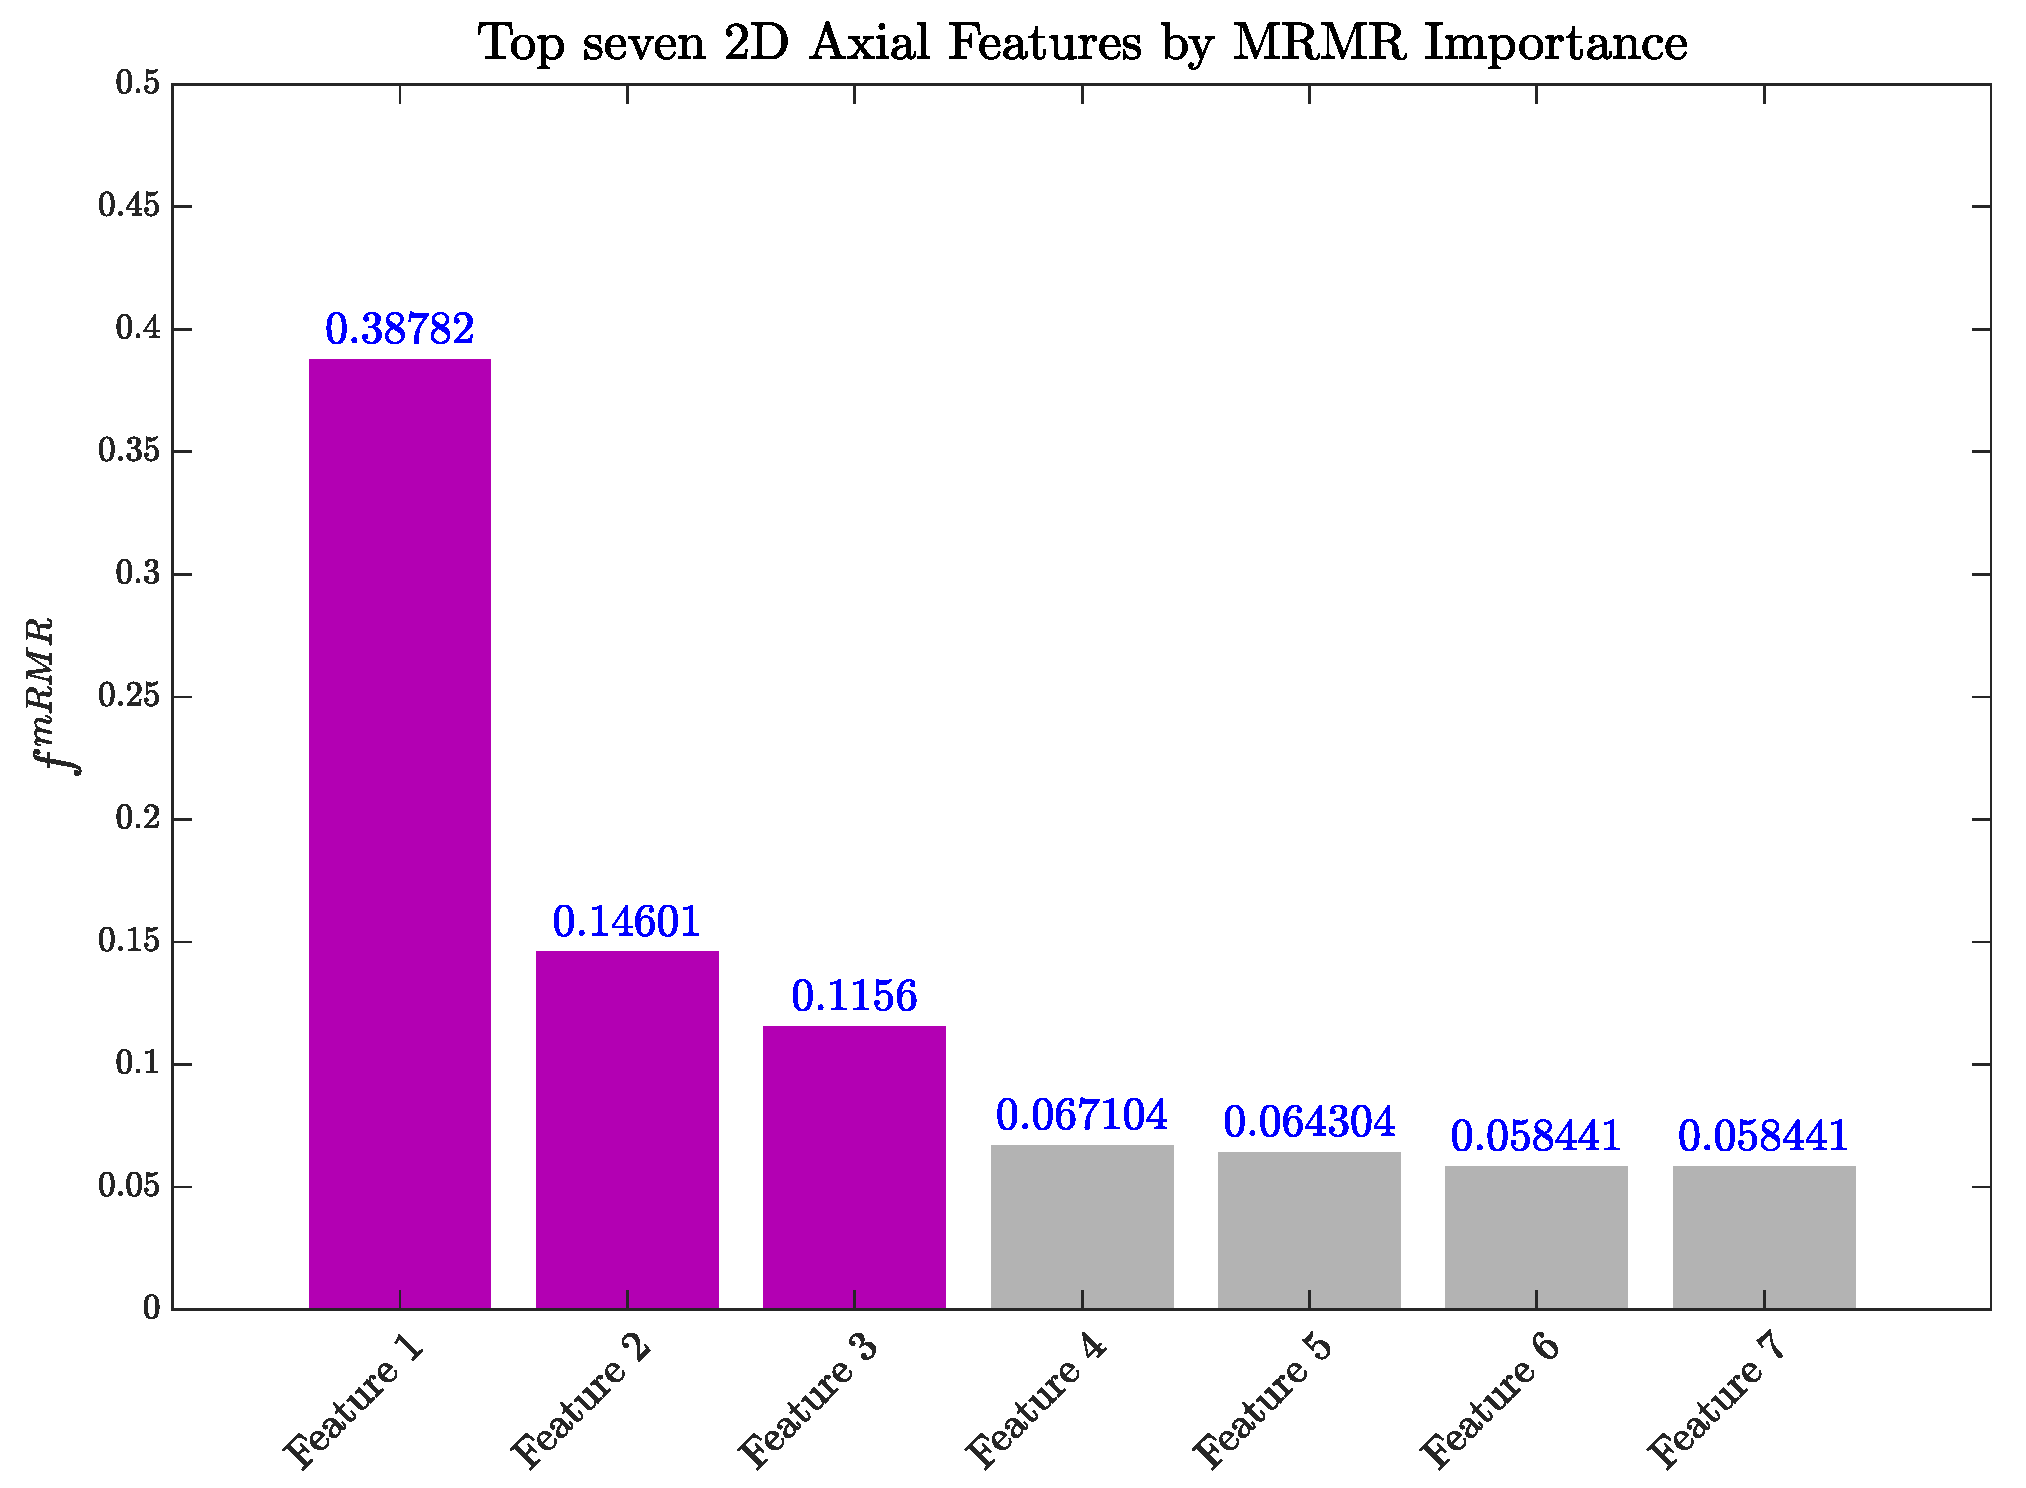
The importance score, computed via the mRMR feature selection scheme, is illustrated in Figure 3, for the case of 2D Axial features.
Figure 3.
2D Axial features ranked by importance via the MRMR scheme.
The features selected from the subgroup of 2D Axial radiomics features are presented in Table 3.
Table 3.
Most important features selected from the 2D Axial subset.
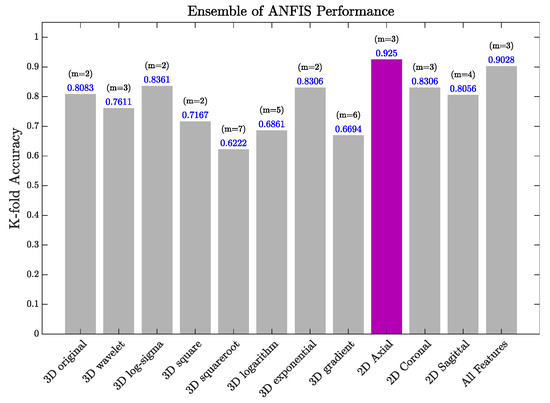
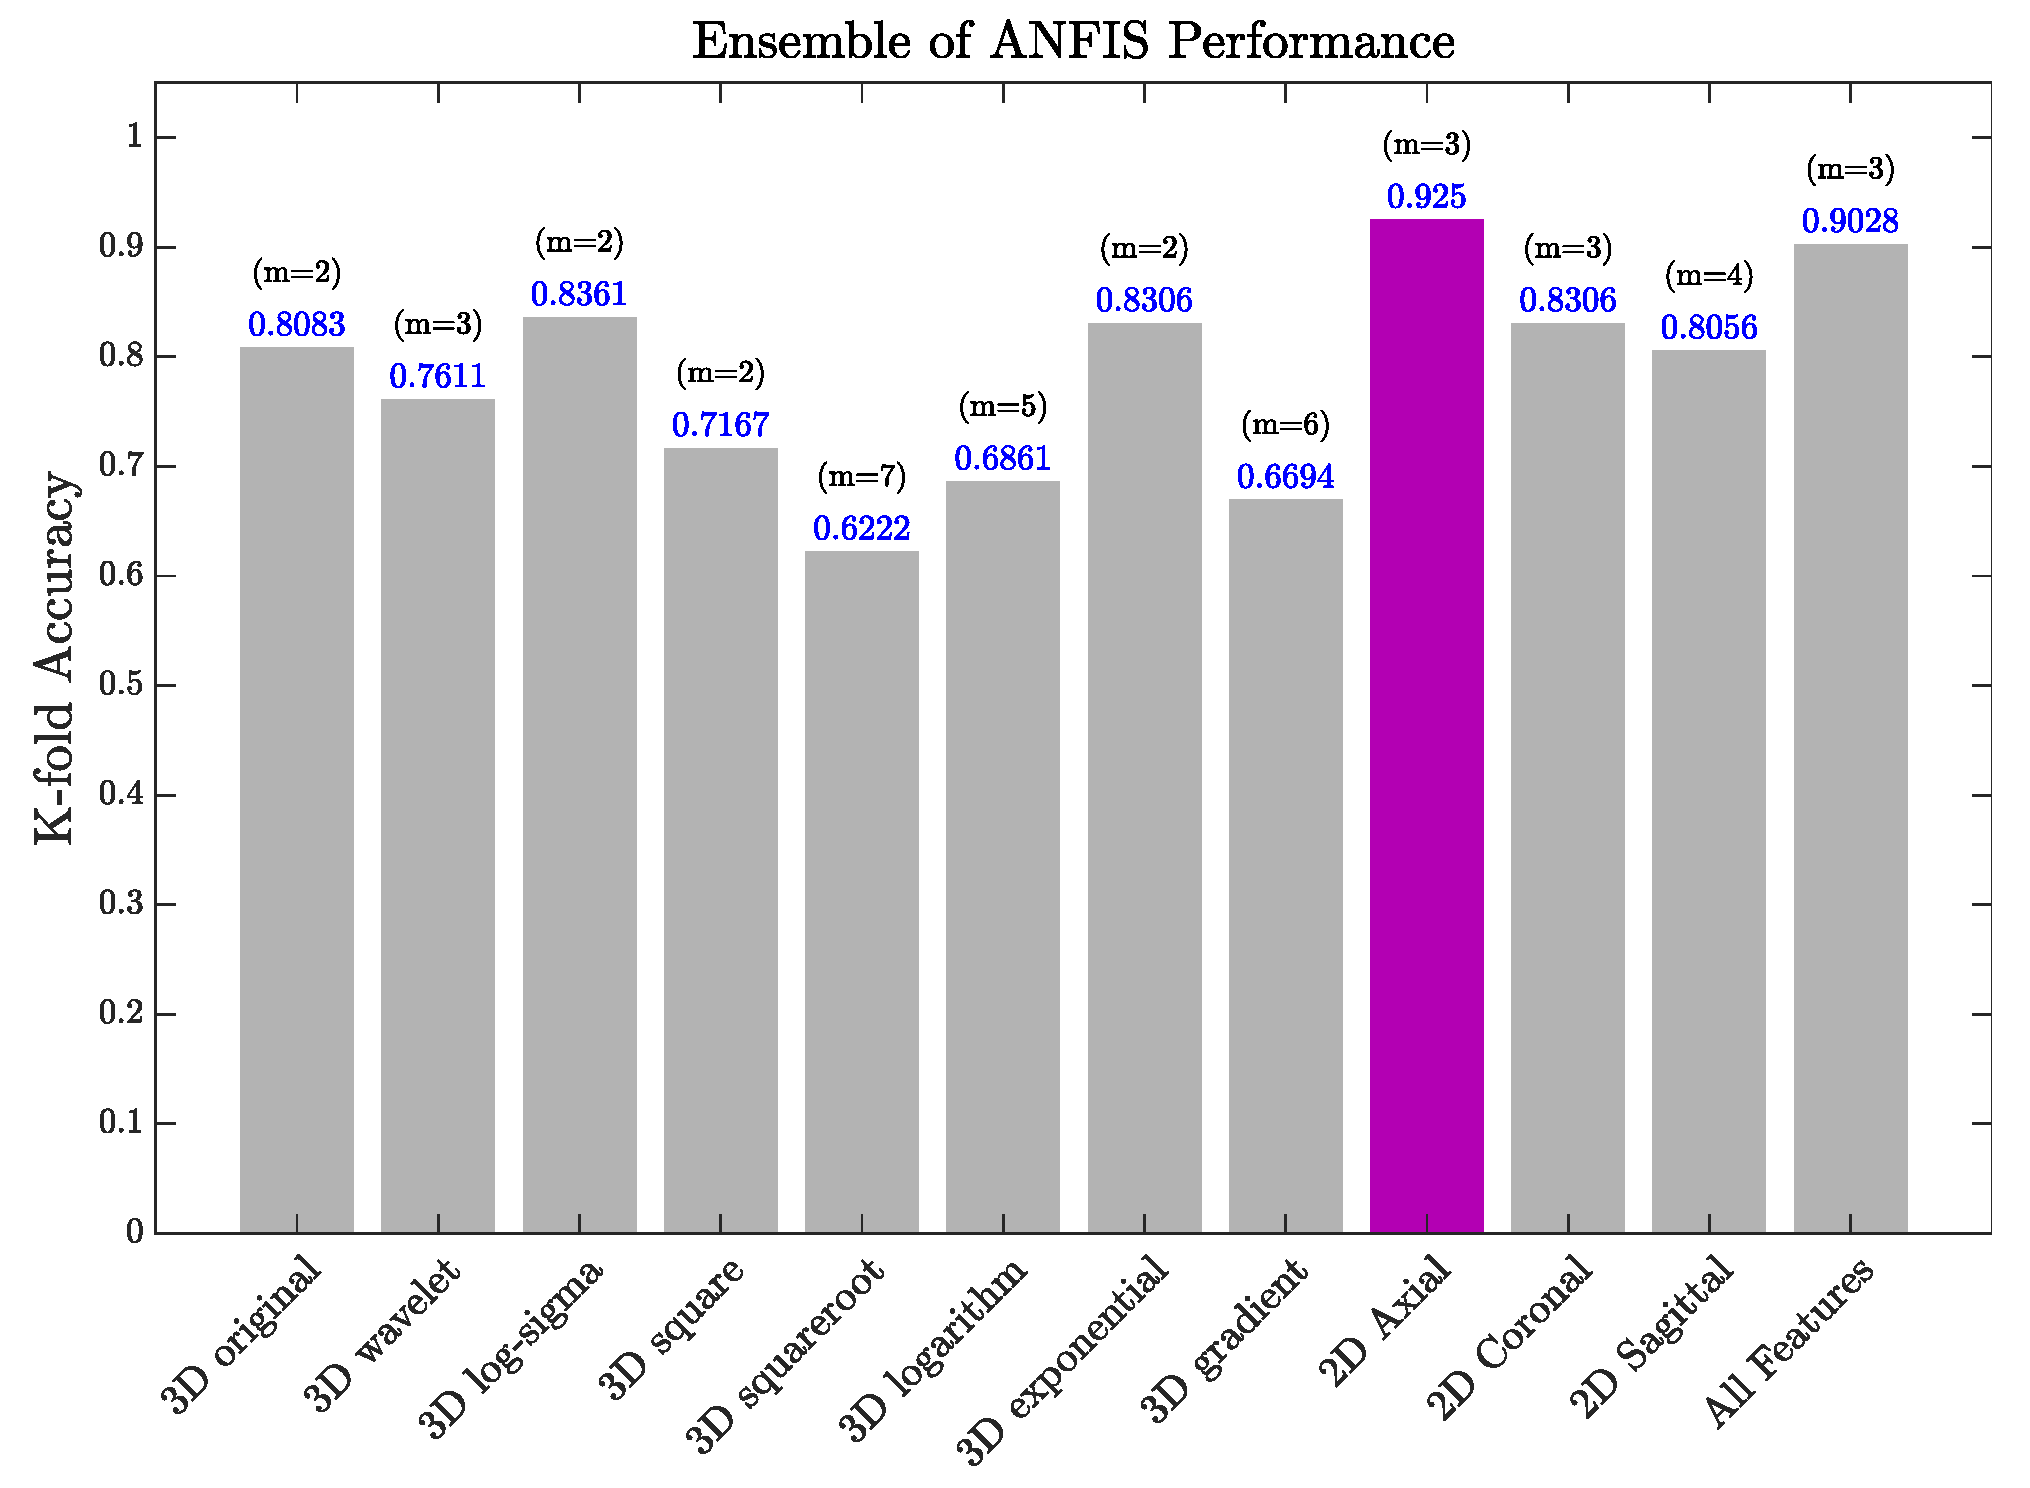
The five-fold performance of the ensemble of adaptive-network fuzzy inference systems is presented in Figure 4. The 2D Axial features also provide improved accuracy for the ensemble model compared to the other subgroups.
Figure 4.
Ensemble of ANFIS five-fold performance with respect to the feature subsets.
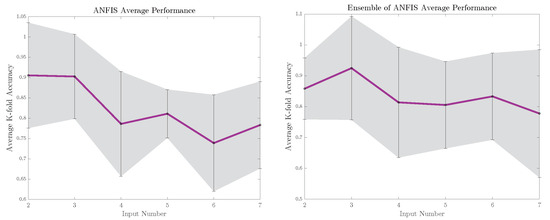
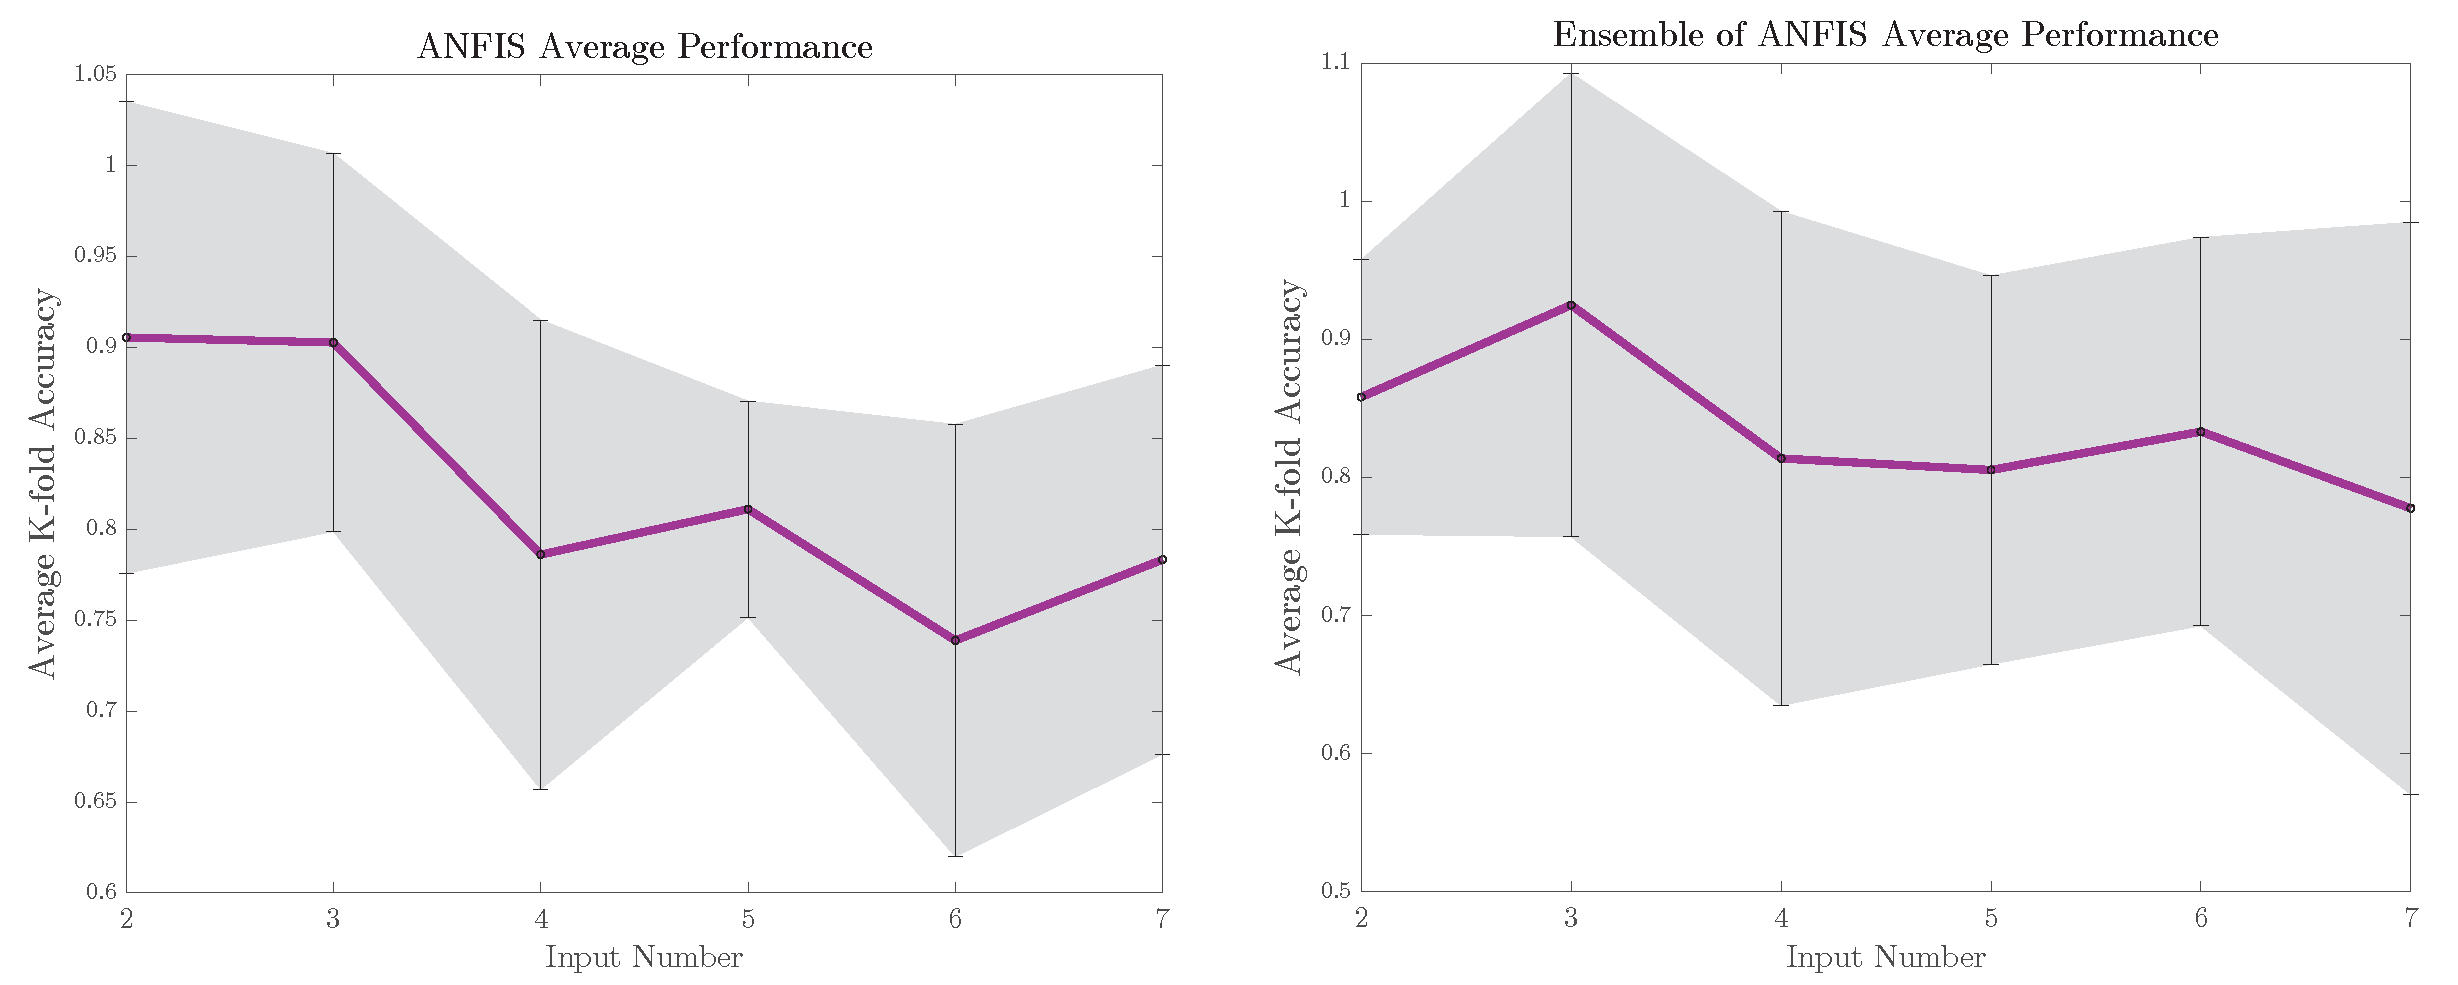
The five-fold average accuracy of the adaptive-network fuzzy inference system, as well as the ensemble of adaptive-network fuzzy inference systems with respect to the number of inputs, is demonstrated in Figure 5 (purple line). The error bars correspond to the standard deviation of the computed five-fold average accuracy for each input sequence.
Figure 5.
(left) ANFIS average performance as a function of increasing inputs. (right) Ensemble of ANFIS average performance as a function of increasing inputs.
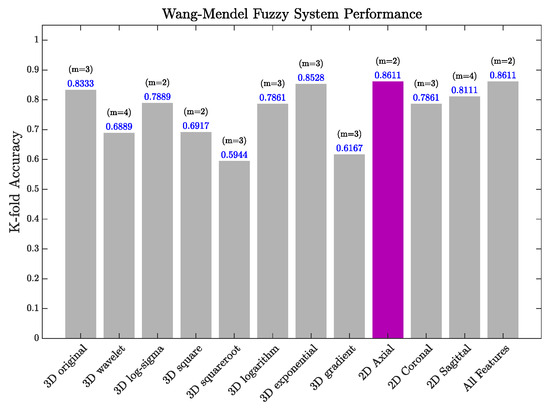
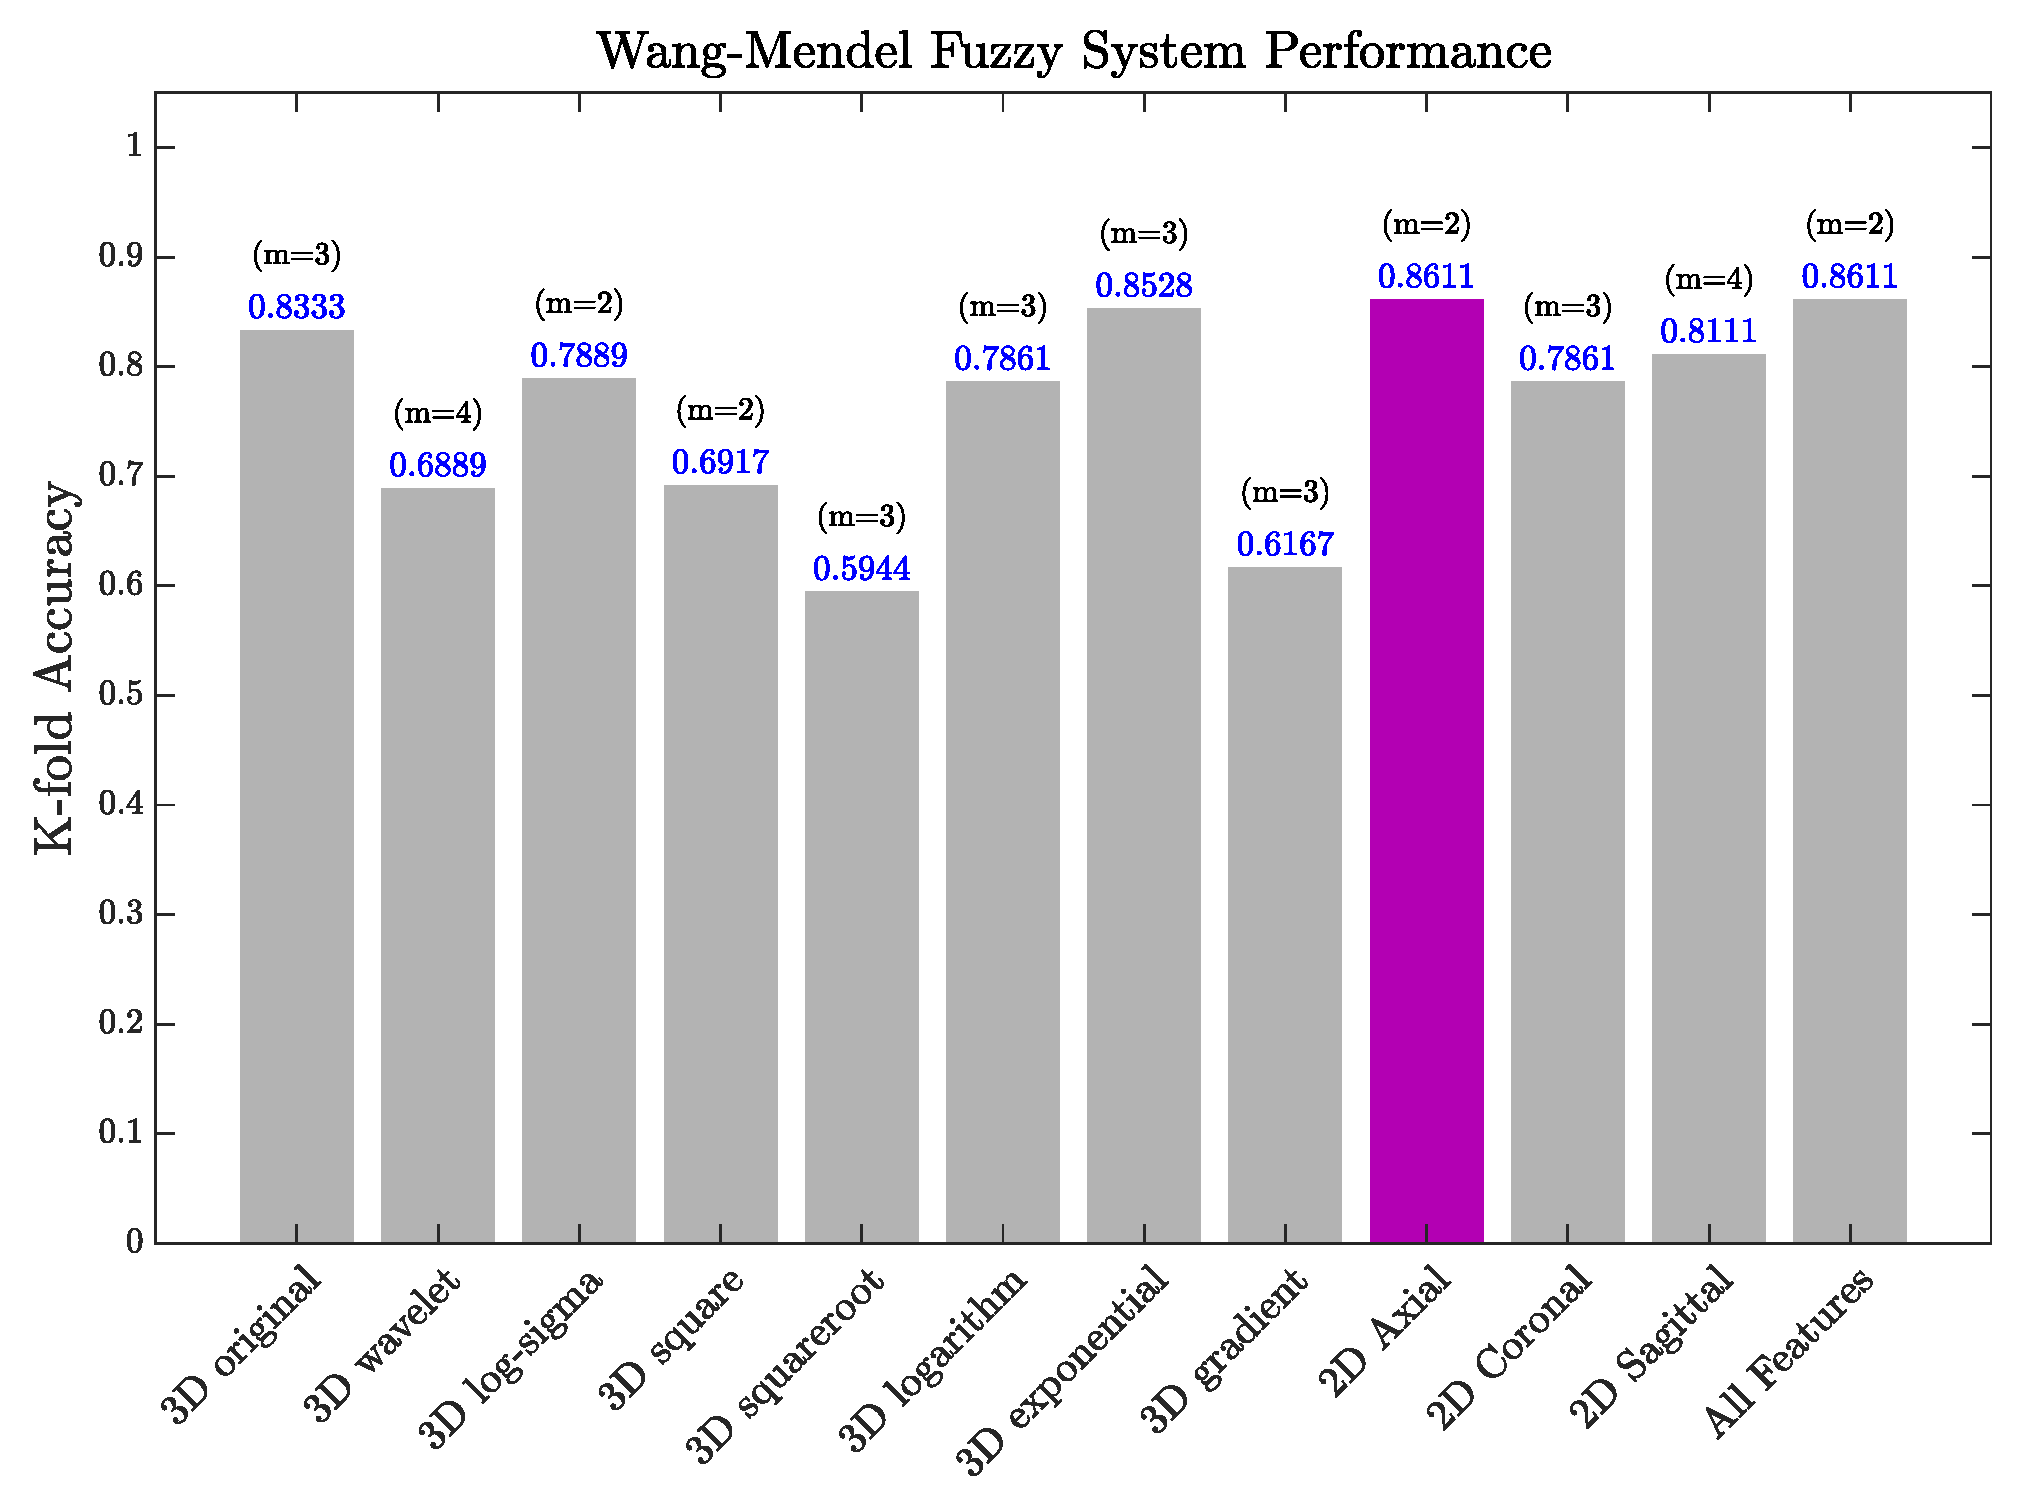
The accuracy of the Wang–Mendel fuzzy classifier, as measured on a five-fold basis, is illustrated in Figure 6.
Figure 6.
Wang–Mendel fuzzy classifier’s five-fold performance with respect to the feature subsets.
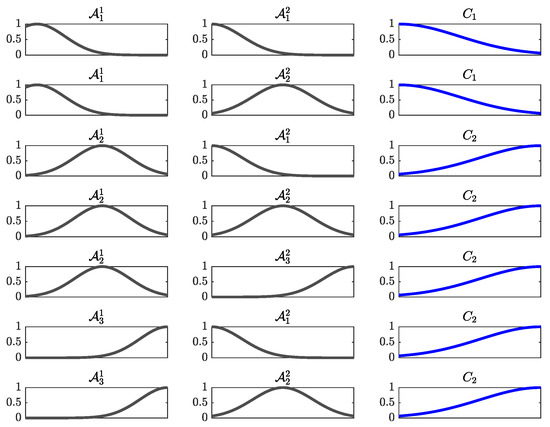
To elucidate the rationale underlying the fuzzy classification, we present the generated fuzzy rules, obtained by using the WM method, for one of the five-fold models. The seven generated fuzzy rules, when two inputs are considered, are illustrated in Figure 7. Each input’s fuzzy partition displays a cardinality of three while being generated using Gaussian membership functions.
Figure 7.
WM-method-generated fuzzy rules when two inputs are considered. The membership functions of the rules’ consequent, are depicted in blue.
The fuzzy rules that correspond to Figure 7 are shown below.
where the fuzzy sets and with quantify linguistic variables. In this light, the fuzzy sets and correspond to the linguistic values low-risk and high-risk, respectively. Thus, they represent the two classes of the classification problem. In this case, model inputs correspond to and x2 ← 2D Axial log-sigma-3-0-mm-3D firstorder TotalEnergy, while the y variable is the maximum diameter of the aorta, i.e., the prediction by the model.
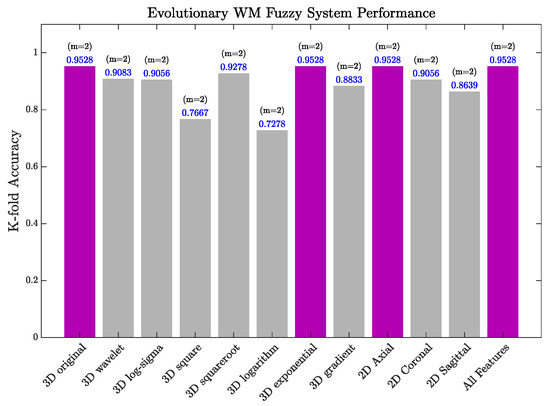
The WM-based fuzzy classifier is further optimised using differential evolution. The resulting optimised model’s performance is presented in Figure 8.
Figure 8.
Optimised WM fuzzy classifier’s five-fold performance with respect to the feature subsets.
The classification accuracy of the evolutionary fuzzy system is exceptionally high across the majority of feature subsets. Additionally, it is worth noting that this performance is achieved at a low computational cost, as we consider a model with only two inputs. To provide a complete perspective on the predictive performance of the fuzzy classifier models, we include diverse classification metrics, computed when considering the 2D Axial features and the best number of inputs on which each of the models performs best. The results are presented in Table 4. Besides the standard metrics, F1-Score, recall, specificity, and accuracy, we also include Cohen’s kappa score () [40]. The latter provides a statistical measure to assess the classification performance, adjusting for agreement that could occur by random chance. Classifiers associated with values of greater than are considered as perfect agreement, while values between and are considered as substantial agreement.
Table 4.
Various classification metrics of the prediction results, associated with the 2D Axial Features. The exponent in the model’s name refers to the number of inputs for which the model performs best.
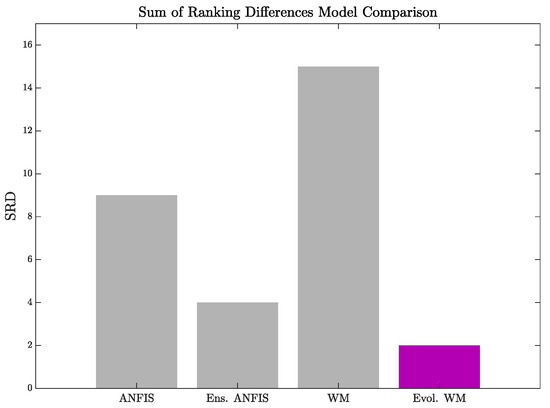
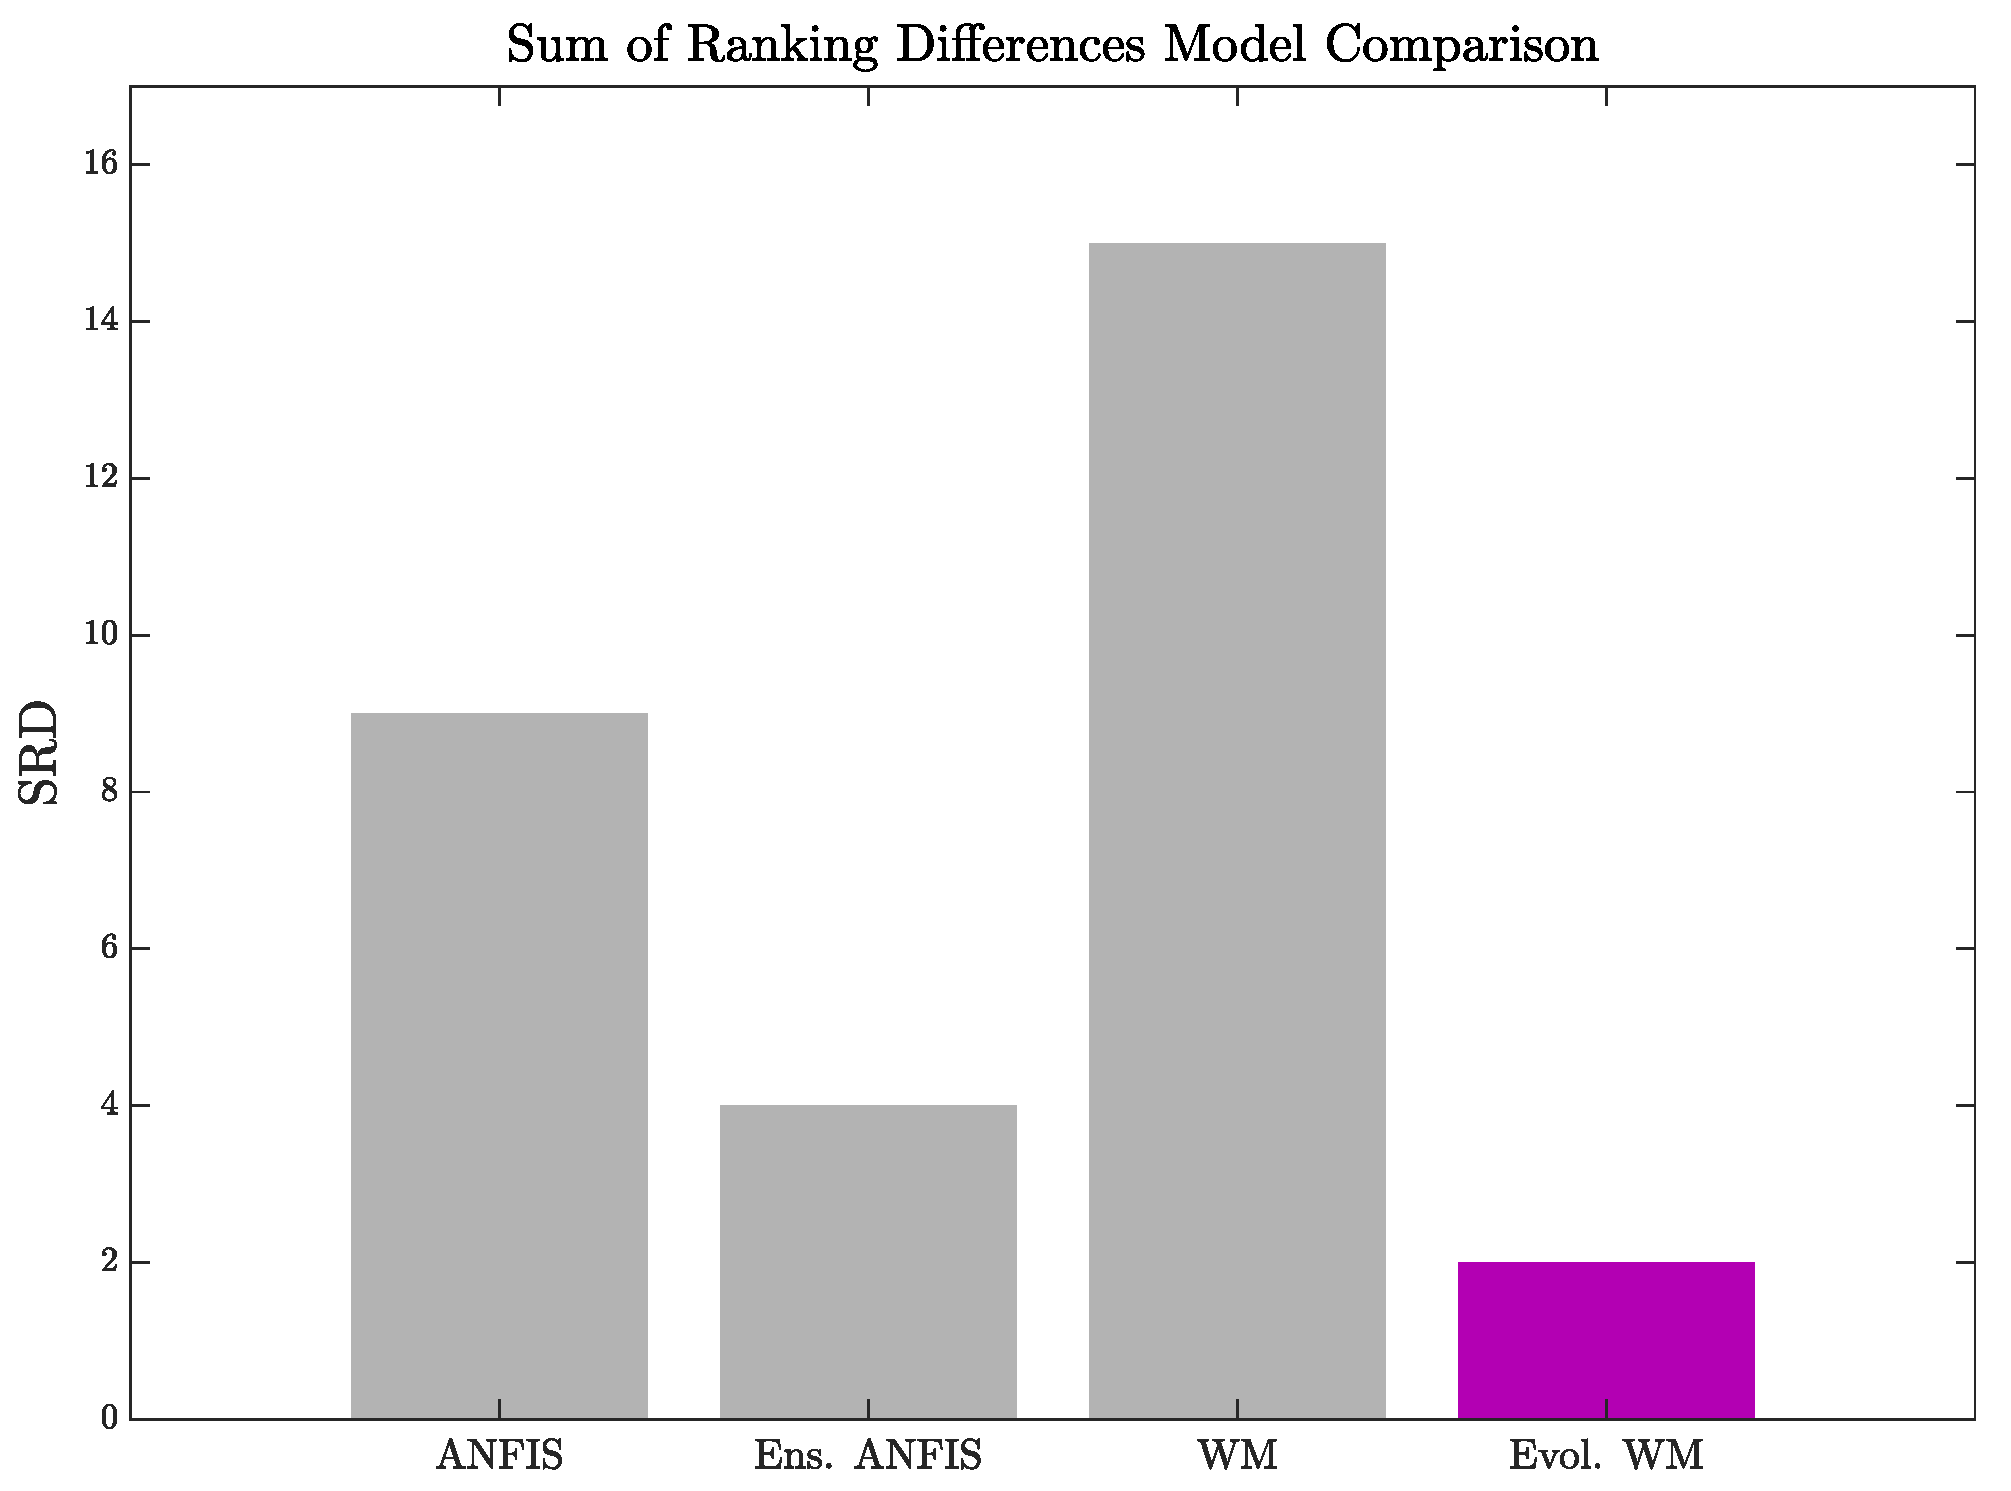
To perform a fair comparison of the fuzzy predictive models systematically, we adopt the method of sum of ranking differences (SRD) proposed in [41,42], which is a non-parametric and rank-based measure. It provides a simple and quite effective framework for comparing models, in light of multiple performance metrics. Furthermore, it is rather general; the only requirement concerns the creation of a non-empty matrix that contains the data to be studied. The method is based on the computed SRD, and the smaller the value, the better the model/method. The metrics considered for the computation of SRD are those presented in Table 4. The SRD-based model comparison results are illustrated in Figure 9.
Figure 9.
Model comparison based on the sum of ranking differences method.
It is evident that according to the SRD methodology, the evolutionary-optimised fuzzy classifier ranks as the best across all fuzzy models, followed, as expected, by the ensemble of neuro-fuzzy systems (ensemble of ANFIS).
A comparison with a support vector machine is also considered to verify that the evolutionary-optimised fuzzy classification model exhibits excellent accuracy performance, even compared to a powerful machine learning model. The support vector classifier uses a linear kernel function, since numerical experiments have proven that it yields the best performance. The best five-fold accuracy results of the support vector classifier are presented in Table 5.
Table 5.
The results of the support vector machine classification for feature subgroups.
Even though there is still no consensus on the notion of interpretability of machine learning or systems emerging from fuzzy modelling [43], we can argue that the proposed fuzzy classifier is considered interpretable in the sense of Gacto et al.’s study in [44]. Elaborating on this, the fuzzy classifier, which is based on the method of Wang–Mendel, seems to fulfil all requirements posed upon a fuzzy system to be considered as interpretable. To support this claim, we can refer to the minimum number of fuzzy rules, the small number of features, as well as the number of membership functions. In terms of the semantics of the rule base level, it should be mentioned that the rule base is consistent, which is guaranteed by the WM’s method rule reduction scheme. Lastly, the resulting fuzzy system satisfies all the semantic properties associated with the fuzzy partition level, i.e., completeness, normalisation, distinguishability, and complementarity. Keeping the cardinality of the rule base small, and given that the fuzzy sets are distinguishable, the fuzzy system can be considered interpretable and provides a readable description of an underlying process [45].
5. Discussion
This study focuses on the development of algorithmic methods for the accurate classification of low-risk and high-risk classes, corresponding to the maximum diameter of the AAA. Four predictive methods are studied in total: the Mamdani fuzzy inference system, based on the Wang–Mendel method for rule generation; the hybrid evolutionary-optimised version of the latter; and an adaptive-network fuzzy inference system. Furthermore, we develop an ensemble of adaptive-network fuzzy inference systems, in terms of bootstrap aggregating, aimed at increasing the performance of the single model.
To assess the generalisation performance of the models, we adopt a stratified K-fold cross-validation scheme. All models achieve very high performance in classifying the two classes associated with the maximum diameter of the aortic aneurysm. Among all fuzzy models, the evolutionary-optimised hybrid version of the Wang–Mendel fuzzy classifier is superior throughout all subsets of features. This results from the optimisation procedure, which ensures optimal tuning of the fuzzy partitions for the input and output variables of the model. While automated learning techniques, such as evolutionary algorithms, can help fine-tune models, they may also compromise the interpretability of the models and extend training times.
Fuzzy classifiers represent a practical classification paradigm, especially in contexts that involve uncertainty and require interpretability. Interpretable models are integral to the medical field. Mamdani fuzzy classifiers form candidate interpretable intelligent machines for AAA. Despite the challenges related to scalability, the continuous advancements in hybrid models ensure that fuzzy classifiers will maintain an essential role in the research of intelligent systems.
It is essential to mention that this study specifically focuses on the classification of the maximum aneurysm diameter, without considering one more important parameter for decision-making, which is the evolution of the aneurysm with respect to time. The latter consideration is important, as studies indicate that approximately to of smaller abdominal aortic aneurysms are reported to rupture at diameters below the threshold [8].
In this light, future research will aim to explore methods for predicting the temporal evolution of abdominal aortic aneurysms. Moreover, evaluating the fuzzy classifiers on large abdominal aortic aneurysm data sets derived from medical image processing, such as morphological analysis of the AAA with extraction of geometric characteristics, e.g., (intraluminal thrombus—ILT) volume beyond the maximum diameter, remains a future task.
Author Contributions
Conceptualisation, P.K., A.D., C.M. and A.R.; methodology, P.K. and A.D.; software, P.K., I.T. and E.I.A.; validation, P.K., A.D., I.T., E.I.A., S.K., A.S., E.V. and I.K.K.; formal analysis, P.K. and A.D.; investigation, P.K., A.D., I.T., E.I.A., S.K., A.S., E.V. and I.K.K.; resources, K.S., K.M., A.G. and I.K.; data curation, C.M. and A.R.; writing—original draft preparation, P.K., A.D., E.I.A. and S.K.; writing—review and editing, P.K., A.D., I.T., E.I.A., S.K., A.S., E.V., A.R., K.S., K.M., A.G., I.K., C.M. and I.K.K.; visualisation, P.K., A.D. and I.T.; supervision, A.D. and I.K.K. All authors have read and agreed to the published version of the manuscript.
Funding
This research is carried out within the framework of the Action “Flagship actions in interdisciplinary scientific fields with a special focus on the productive fabric”, which is implemented through the National Recovery and Resilience Plan Greece 2.0, funded by the European Union—NextGenerationEU (Project ID: TAEDR-0535983).
Institutional Review Board Statement
The collection and secondary use of the data were approved by the Bioethics Committee of the Attikon University General Hospital (protocol no. 168/19-02-2025), by the Research Ethics Committee of the University of Thessaly (protocol no. 34/02.04.2025), and by the Research Ethics Committee of the University of West Attica, Greece: protocol ID: 17798/11-03-2024.
Informed Consent Statement
Informed consent was obtained from the subjects involved in this study for the secondary use of their anonymized medical imaging data.
Data Availability Statement
The original contributions presented in this study are included in the article. Further inquiries can be directed to the corresponding author.
Acknowledgments
The authors wish to express their sincere gratitude to Emeritus Dionisis Cavouras, in the Department of Biomedical Engineering, University of West Attica, for his valuable insights. Furthermore, the authors sincerely thank the anonymous reviewers for their constructive suggestions that contributed to improving this paper.
Conflicts of Interest
The authors declare no conflicts of interest.
References
- Alloisio, M.; Siika, A.; Roy, J.; Zerwes, S.; Hyhlik-Dürr, A.; Gasser, T.C. Data Driven Models Merging Geometric, Biomechanical, and Clinical Data to Assess the Rupture of Abdominal Aortic Aneurysms. Eur. J. Vasc. Endovasc. Surg. 2025, 70, 591–600. [Google Scholar] [CrossRef] [Scilit]
- Adam, C.; Fabre, D.; Mougin, J.; Zins, M.; Azarine, A.; Ardon, R.; d’Assignies, G.; Haulon, S. Pre-surgical and Post-surgical Aortic Aneurysm Maximum Diameter Measurement: Full Automation by Artificial Intelligence. Eur. J. Vasc. Endovasc. Surg. 2021, 62, 869–877. [Google Scholar] [CrossRef] [Scilit]
- Dua, M.M.; Dalman, R.L. Hemodynamic influences on abdominal aortic aneurysm disease: Application of biomechanics to aneurysm pathophysiology. Vascul. Pharmacol. 2010, 53, 11–21. [Google Scholar] [CrossRef] [Scilit]
- Arampatzis, D.; Athanasiadis, E.; Kontopodis, E.; Theodorakopoulos, I.; Theocharakis, I.; Kostopoulos, S.; Glotsos, D.; Asvestas, P.; Raptis, A.; Manopoulos, C.; et al. A Comparative Study of Unsupervised and Deep Learning Methods for Automatic Segmentation of Abdominal Aortic Aneurysm on CT Images: Preliminary Results. In GeNeDIS 2024; Vlamos, P., Ed.; Springer Nature: Cham, Switzerland, 2026; pp. 335–345. [Google Scholar]
- Raffort, J.; Adam, C.; Carrier, M.; Ballaith, A.; Coscas, R.; Jean-Baptiste, E.; Hassen-Khodja, R.; Chakfé, N.; Lareyre, F. Artificial intelligence in abdominal aortic aneurysm. J. Vasc. Surg. 2020, 72, 321–333.e1. [Google Scholar] [CrossRef] [Scilit]
- Abbas, G.H.; Khouri, E.; Pouwels, S. Artificial Intelligence-Based Predictive Modeling for Aortic Aneurysms. Cureus 2025, 17, e79662. [Google Scholar] [CrossRef] [Scilit]
- Kontopodis, N.; Klontzas, M.; Tzirakis, K.; Charalambous, S.; Marias, K.; Tsetis, D.; Karantanas, A.; Ioannou, C.V. Prediction of abdominal aortic aneurysm growth by artificial intelligence taking into account clinical, biologic, morphologic, and biomechanical variables. Vascular 2023, 31, 409–416. [Google Scholar] [CrossRef] [Scilit] [PubMed]
- Chung, T.K.; Gueldner, P.H.; Aloziem, O.U.; Liang, N.L.; Vorp, D.A. An artificial intelligence based abdominal aortic aneurysm prognosis classifier to predict patient outcomes. Sci. Rep. 2024, 14, 3390. [Google Scholar] [CrossRef] [Scilit]
- Guo, J.; Lareyre, F.; Lee, R.; Teraa, M.; Delingette, H.; Raffort, J. Artificial Intelligence and Machine Learning for Risk Prediction of Abdominal Aortic Aneurysm Growth and Rupture. Angiology 2025, 33197251379127. [Google Scholar] [CrossRef] [Scilit] [PubMed]
- Lee, K.; Zhu, J.; Shum, J.; Zhang, Y.; Muluk, S.C.; Chandra, A.; Eskandari, M.K.; Finol, E.A. Surface curvature as a classifier of abdominal aortic aneurysms: A comparative analysis. Ann. Biomed. Eng. 2013, 41, 562–576. [Google Scholar] [CrossRef] [Scilit]
- Parikh, S.A.; Gomez, R.; Thirugnanasambandam, M.; Chauhan, S.S.; De Oliveira, V.; Muluk, S.C.; Eskandari, M.K.; Finol, E.A. Decision Tree Based Classification of Abdominal Aortic Aneurysms Using Geometry Quantification Measures. Ann. Biomed. Eng. 2018, 46, 2135–2147. [Google Scholar] [CrossRef] [Scilit] [PubMed]
- Rengarajan, B.; Wu, W.; Wiedner, C.; Ko, D.; Muluk, S.C.; Eskandari, M.K.; Menon, P.G.; Finol, E.A. A Comparative Classification Analysis of Abdominal Aortic Aneurysms by Machine Learning Algorithms. Ann. Biomed. Eng. 2020, 48, 1419–1429. [Google Scholar] [CrossRef] [Scilit] [PubMed]
- Jalalahmadi, G.; Helguera, M.; Linte, C.A. A machine leaning approach for abdominal aortic aneurysm severity assessment using geometric, biomechanical, and patient-specific historical clinical features. Proc. SPIE Int. Soc. Opt. Eng. 2020, 11317. [Google Scholar] [CrossRef] [Scilit]
- Stoecker, J.B.; Eddinger, K.C.; Pouch, A.M.; Jackson, B.M. Image-Derived Geometric Characteristics Predict Abdominal Aortic Aneurysm Growth in a Machine Learning Model. In Functional Imaging and Modeling of the Heart; Ennis, D.B., Perotti, L.E., Wang, V.Y., Eds.; Springer International Publishing: Cham, Switzerland, 2021; pp. 35–45. [Google Scholar]
- Ramazanli, B.; Yagmur, O.; Sarioglu, E.C.; Salman, H.E. Modeling Techniques and Boundary Conditions in Abdominal Aortic Aneurysm Analysis: Latest Developments in Simulation and Integration of Machine Learning and Data-Driven Approaches. Bioengineering 2025, 12, 437. [Google Scholar] [CrossRef] [Scilit]
- Czmil, A. Comparative Study of Fuzzy Rule-Based Classifiers for Medical Applications. Sensors 2023, 23, 992. [Google Scholar] [CrossRef] [Scilit]
- Mohammadpour, R.A.; Abedi, S.M.; Bagheri, S.; Ghaemian, A. Fuzzy Rule-Based Classification System for Assessing Coronary Artery Disease. Comput. Math. Methods Med. 2015, 2015, 564867. [Google Scholar] [CrossRef] [Scilit]
- Rashed, B.M.; Popescu, N. Medical Image-Based Diagnosis Using a Hybrid Adaptive Neuro-Fuzzy Inferences System (ANFIS) Optimized by GA with a Deep Network Model for Features Extraction. Mathematics 2024, 12, 633. [Google Scholar] [CrossRef] [Scilit]
- Baek, S.; Arzani, A. Current state-of-the-art and utilities of machine learning for detection, monitoring, growth prediction, rupture risk assessment, and post-surgical management of abdominal aortic aneurysms. Appl. Eng. Sci. 2022, 10, 100097. [Google Scholar] [CrossRef] [Scilit]
- Castro, J.; Delgado, M. Fuzzy systems with defuzzification are universal approximators. IEEE Trans. Syst. Man Cybern. Part B (Cybern.) 1996, 26, 149–152. [Google Scholar] [CrossRef] [PubMed]
- Kosko, B. Fuzzy systems as universal approximators. In [1992 Proceedings] IEEE International Conference on Fuzzy Systems; IEEE: Piscataway, NJ, USA, 1992; pp. 1153–1162. [Google Scholar] [CrossRef] [Scilit]
- Zeng, X.J.; Singh, M. Approximation accuracy analysis of fuzzy systems as function approximators. IEEE Trans. Fuzzy Syst. 1996, 4, 44–63. [Google Scholar] [CrossRef] [Scilit]
- Wang, L.X. The WM method completed: A flexible fuzzy system approach to data mining. IEEE Trans. Fuzzy Syst. 2003, 11, 768–782. [Google Scholar] [CrossRef]
- Alvarez-Estevez, D.; Moret-Bonillo, V. Revisiting the Wang–Mendel algorithm for fuzzy classification. Expert Syst. 2018, 35, e12268. [Google Scholar] [CrossRef] [Scilit]
- Jang, J.S. ANFIS: Adaptive-network-based fuzzy inference system. IEEE Trans. Syst. Man Cybern. 1993, 23, 665–685. [Google Scholar] [CrossRef] [Scilit]
- The Differential Evolution Algorithm. In Differential Evolution: A Practical Approach to Global Optimization; Springer: Berlin/Heidelberg, Germany, 2005; pp. 37–134. [CrossRef] [Scilit]
- Zhou, Z.H. Ensemble Methods: Foundations and Algorithms, 1st ed.; Chapman Hall CRC: Boca Raton, FL, USA, 2012. [Google Scholar]
- Breiman, L. Bagging predictors. Mach. Learn. 1996, 24, 123–140. [Google Scholar] [CrossRef] [Scilit]
- Kim, D. Improving the fuzzy system performance by fuzzy system ensemble. Fuzzy Sets Syst. 1998, 98, 43–56. [Google Scholar] [CrossRef] [Scilit]
- Hu, X.; Pedrycz, W.; Wang, X. Random ensemble of fuzzy rule-based models. Knowl.-Based Syst. 2019, 181, 104768. [Google Scholar] [CrossRef] [Scilit]
- Korkidis, P.; Dounis, A. Intelligent Fuzzy Models: WM, ANFIS, and Patch Learning for the Competitive Forecasting of Environmental Variables. Sustainability 2023, 15, 8032. [Google Scholar] [CrossRef] [Scilit]
- Polikar, R. Ensemble Learning. In Ensemble Machine Learning: Methods and Applications; Zhang, C., Ma, Y., Eds.; Springer US: Boston, MA, USA, 2012; pp. 1–34. [Google Scholar] [CrossRef] [Scilit]
- Fedorov, A.; Beichel, R.; Kalpathy-Cramer, J.; Finet, J.; Fillion-Robin, J.C.; Pujol, S.; Bauer, C.; Jennings, D.; Fennessy, F.; Sonka, M.; et al. 3D Slicer as an image computing platform for the Quantitative Imaging Network. Magn. Reson. Imaging 2012, 30, 1323–1341, Quantitative Imaging in Cancer. [Google Scholar] [CrossRef] [Scilit]
- Mücke, S.; Heese, R.; Müller, S.; Wolter, M.; Piatkowski, N. Feature selection on quantum computers. Quantum Mach. Intell. 2023, 5, 11. [Google Scholar] [CrossRef] [Scilit]
- Peng, H.; Long, F.; Ding, C. Feature selection based on mutual information criteria of max-dependency, max-relevance, and min-redundancy. IEEE Trans. Pattern Anal. Mach. Intell. 2005, 27, 1226–1238. [Google Scholar] [CrossRef] [Scilit] [PubMed]
- Zhao, Z.; Anand, R.; Wang, M. Maximum Relevance and Minimum Redundancy Feature Selection Methods for a Marketing Machine Learning Platform. In 2019 IEEE International Conference on Data Science and Advanced Analytics (DSAA); IEEE: Piscataway, NJ, USA, 2019; pp. 442–452. [Google Scholar] [CrossRef] [Scilit]
- Ihianle, I.K.; Machado, P.; Owa, K.; Adama, D.A.; Otuka, R.; Lotfi, A. Minimising redundancy, maximising relevance: HRV feature selection for stress classification. Expert Syst. Appl. 2024, 239, 122490. [Google Scholar] [CrossRef] [Scilit]
- Li, Y.; Mansmann, U.; Du, S.; Hornung, R. Benchmark study of feature selection strategies for multi-omics data. BMC Bioinform. 2022, 23, 412. [Google Scholar] [CrossRef] [Scilit]
- Biedrzycki, R.; Arabas, J.; Jagodziński, D. Bound constraints handling in Differential Evolution: An experimental study. Swarm Evol. Comput. 2019, 50, 100453. [Google Scholar] [CrossRef] [Scilit]
- Cohen, J. A Coefficient of Agreement for Nominal Scales. Educ. Psychol. Meas. 1960, 20, 37–46. [Google Scholar] [CrossRef] [Scilit]
- Héberger, K. Sum of ranking differences compares methods or models fairly. TrAC Trends Anal. Chem. 2010, 29, 101–109. [Google Scholar] [CrossRef] [Scilit]
- Kollár-Hunek, K.; Héberger, K. Method and model comparison by sum of ranking differences in cases of repeated observations (ties). Chemom. Intell. Lab. Syst. 2013, 127, 139–146. [Google Scholar] [CrossRef] [Scilit]
- Pickering, L.; Cohen, K.; De Baets, B. A Narrative Review on the Interpretability of Fuzzy Rule-Based Models from a Modern Interpretable Machine Learning Perspective. Int. J. Fuzzy Syst. 2025. [Google Scholar] [CrossRef] [Scilit]
- Gacto, M.; Alcalá, R.; Herrera, F. Interpretability of linguistic fuzzy rule-based systems: An overview of interpretability measures. Inf. Sci. 2011, 181, 4340–4360. [Google Scholar] [CrossRef] [Scilit]
- Shihabudheen, K.; Pillai, G. Recent advances in neuro-fuzzy system: A survey. Knowl.-Based Syst. 2018, 152, 136–162. [Google Scholar] [CrossRef] [Scilit]

Disclaimer/Publisher’s Note: The statements, opinions and data contained in all publications are solely those of the individual author(s) and contributor(s) and not of MDPI and/or the editor(s). MDPI and/or the editor(s) disclaim responsibility for any injury to people or property resulting from any ideas, methods, instructions or products referred to in the content. |
© 2026 by the authors. Licensee MDPI, Basel, Switzerland. This article is an open access article distributed under the terms and conditions of the Creative Commons Attribution (CC BY) license.