


Abstract
Many real-world problems can be formulated as classification tasks in machine learning and addressed using a wide range of advanced algorithms developed for this purpose. Among these approaches, methods based on Grammatical Evolution (GE) can also be employed, such as GenClass, a technique designed to automatically construct classification rules. Although GenClass has been successfully applied to a variety of classification problems, its evolutionary search process may suffer from limitations such as entrapment in local minima of the error function and premature convergence, which can prevent the method from discovering high-quality classification rules. The present work proposes an enhanced version of GenClass through the introduction of advanced crossover techniques operating on the integer-valued chromosomes employed by the method, with the aim of improving the evolutionary search process and reducing classification error. The proposed crossover operators follow two different strategies. Some of them are purely stochastic, introducing greater diversity into the evolutionary search, whereas others exploit information already generated during the Grammatical Evolution process to perform targeted exchanges of genetic material between chromosomes. In this way, the latter operators attempt to guide the evolutionary search toward more promising regions of the search space while preserving useful information discovered during previous generations. The proposed techniques were evaluated on a diverse collection of real-world classification datasets, including several problems characterized by a large number of patterns and/or a large number of classes. The experimental results demonstrate that the Standard crossover strategy provides the most consistent improvement over the original GenClass method, reducing the average classification error from 16.13% to 13.42% across 31 classification datasets. This improvement remains statistically significant after excluding four related EEG-derived datasets and applying a correction for multiple comparisons. Among the three investigated crossover strategies, the simplest approach, Standard, achieved the lowest average classification error, whereas the more elaborate grammar-guided Targeted and TargetedWorst variants did not provide further improvements.
1. Introduction
Genetic Algorithms (GAs) are stochastic optimization methods whose foundations can be traced back to the pioneering work of Holland [1]. They constitute an important class of evolutionary computation techniques [2], drawing inspiration from the principles of natural evolution. A typical Genetic Algorithm starts with a population of candidate solutions to the optimization problem under consideration. This population is progressively improved over successive generations through evolutionary operators such as selection, crossover, and mutation [3,4,5]. These operators enable the exploration of the search space while promoting the propagation of promising solutions throughout the population. Due to their flexibility and ability to address complex optimization problems without requiring explicit gradient information, Genetic Algorithms have been successfully applied across a broad range of domains. Representative applications include network optimization [6], robotics [7,8], energy-related problems [9,10], medical applications [11], and agricultural problems [12], among many others.
Grammatical Evolution (GE) [13] is a specialized form of Genetic Algorithms that employs integer-valued chromosomes. Each chromosome consists of a sequence of integer codons that are used to select among the production rules defined by a given Backus–Naur Form (BNF) grammar [14]. Through a genotype-to-phenotype mapping process, these codons guide the derivation of syntactically valid expressions or programs. The primary objective of Grammatical Evolution is therefore to evolve programs or expressions in a target language whose syntax is specified by the underlying grammar.
During genotype-to-phenotype mapping, chromosome codons are read sequentially. When the end of the chromosome is reached before the derivation is completed, the mapping process returns to the beginning of the chromosome (wrapping). The maximum number of wrappings is set to two. If the derivation cannot be completed within this limit, the chromosome is considered invalid and is assigned a large fitness value. Mathematical expressions are evaluated using the FunctionParser library, which detects invalid mathematical operations, such as division by zero or logarithms with non-positive arguments. In such cases, an evaluation error is reported, and the corresponding chromosome is penalized with a large fitness value rather than using protected mathematical operators.
Grammatical Evolution has been successfully applied to a wide range of real-world problems across diverse scientific and engineering domains. Representative applications include data fitting [15,16], credit classification [17], network intrusion detection [18], the solution of differential equations [19], drinking water quality monitoring [20], and the automatic construction of optimization methods [21]. GE has also been employed in trigonometric problems [22], automatic music composition [23], neural network design [24,25], and computer games [26,27]. Additional applications can be found in energy demand modeling [28], combinatorial optimization [29], security and cryptography [30], automatic decision tree construction [31], analog circuit design [32], taxonomy discovery from Wikipedia [33], algorithmic trading [34], bioinformatics [35], and human glycemia modeling [36]. The diversity of these applications demonstrates the flexibility of Grammatical Evolution as a general-purpose evolutionary framework for addressing complex problems in different domains.
Despite the extensive application of Grammatical Evolution across different domains, the design of effective crossover operators remains an important research challenge. In particular, the indirect genotype-to-phenotype mapping employed by GE introduces additional considerations regarding the preservation and exchange of useful genetic material. Previous studies have investigated conventional, grammar-aware, and structure-preserving crossover mechanisms, as well as crossover-based local improvement within hybrid evolutionary algorithms. These approaches and their relationship to the methods proposed in the present study are discussed in Section 2.
Among the techniques that have been proposed based on Grammatical Evolution is a recently introduced rule construction method [37], for which a software implementation [38] is also publicly available through the application’s website https://github.com/itsoulos/GenClass/(accessed on 2 October 2026). This method automatically constructs programs for data classification using a representation that closely resembles the C programming language. Consequently, the generated classification programs are human-readable and can be easily inspected and interpreted, providing a considerable advantage in applications where model interpretability is important. The rule construction method has been successfully applied to a variety of real-world classification problems, including pollution-related applications [39] and network-related problems [40], among others.
The aforementioned method employs Grammatical Evolution to evolve classification programs that minimize the classification error on a given dataset. More specifically, the classification error can be defined as
where the corresponding training set is defined as Here, M denotes the number of patterns in the training set, represents the input feature vector of the (i)-th pattern, and denotes its corresponding target class label. The function represents the class predicted by the classification program generated through Grammatical Evolution, while () is the indicator function, which takes the value 1 when its argument is true and 0 otherwise. Therefore, expresses the percentage of training patterns that are incorrectly classified by the generated program.
Although the aforementioned technique has been evaluated on a variety of classification problems, several aspects of its evolutionary search process may still benefit from further investigation and improvement. One of the most important issues is premature convergence, where the population rapidly loses genetic diversity and converges before sufficiently exploring the search space. As a consequence, potentially useful genetic material may disappear from the population, reducing the ability of the evolutionary process to discover alternative and potentially more effective classification rules.
Another important limitation is the tendency of the evolutionary search to become trapped in local minima of the classification error function, or, more generally, to stagnate in suboptimal regions of the search space. In such cases, the evolutionary operators may fail to generate sufficiently diverse or beneficial modifications to the existing chromosomes, preventing the algorithm from escaping these regions and discovering solutions with lower classification error. These limitations become particularly important in complex classification problems characterized by large or highly irregular search spaces, where effective exploration and preservation of population diversity are essential for obtaining high-quality classification rules. Consequently, improving the search capabilities of the method and enhancing the exchange of useful genetic information among candidate solutions constitute important directions for further improving its classification performance.
In the present work, advanced crossover techniques are introduced in order to alleviate the aforementioned limitations and improve the search capabilities of the original method. These techniques are applied at each generation to a relatively small number of chromosomes selected randomly from the genetic population. Restricting their application to a subset of the population allows the proposed operators to enhance the exploration of the search space while limiting their application to a selected number of chromosomes. However, the additional crossover operations introduce computational overhead, which depends on the selected operator and the dataset, as demonstrated in the experimental analysis.
The randomly selected chromosomes are subjected to additional crossover operations designed to generate new combinations of genetic material and, consequently, potentially more effective classification programs. The introduction of such combinations can increase population diversity and provide the evolutionary process with additional opportunities to escape from suboptimal regions of the search space. This mechanism is particularly important when the population has begun to converge and the conventional evolutionary operators are no longer able to produce sufficiently diverse candidate solutions.
Furthermore, the random selection of chromosomes ensures that the additional crossover operations are not systematically restricted to a particular subset of the population. In this way, different candidate solutions can participate in the enhanced crossover process during successive generations, while the majority of the population continues to evolve according to the standard evolutionary procedure. The proposed strategy therefore attempts to achieve a balance between exploration and exploitation: it introduces additional diversity and explores new combinations of genetic material, while preserving the evolutionary information already accumulated by the population.
In the present work, three crossover strategies are considered: Standard, Targeted and TargetedWorst crossover. Standard crossover follows a purely stochastic strategy, in which the exchanged chromosome regions are selected without exploiting information obtained from the evaluation of the generated classification programs. Targeted crossover, on the other hand, makes use of information collected during the evolutionary process to identify chromosome regions where crossover may be more beneficial. TargetedWorst extends this idea by focusing the crossover operation on regions associated with poorly performing components of the corresponding classification program. Thus, the three strategies represent progressively more informed crossover mechanisms, ranging from purely random recombination to crossover operations guided by the performance of the evolved solutions. A detailed description of each strategy is provided in the following subsections.
The remainder of this article is organized as follows. Section 2 reviews previous research on crossover operators in Grammatical Evolution and discusses the relationship between the proposed techniques and hybrid evolutionary and memetic algorithms. Section 3 introduces the original GenClass rule construction method and describes the proposed crossover strategies in detail. Section 4 presents the classification datasets, experimental results, and corresponding statistical analysis. Finally, Section 5 summarizes the main findings and conclusions of the study.
2. Related Work
2.1. Crossover Operators in Grammatical Evolution
Crossover is one of the fundamental operators of evolutionary computation, enabling the exchange of genetic material between candidate solutions. In Grammatical Evolution (GE), however, crossover presents additional challenges because chromosomes are indirectly mapped to executable expressions or programs through a formal grammar. Consequently, exchanging chromosome segments may affect not only the genetic representation but also the grammatical derivation and the resulting program structure.
O’Neill et al. [41] investigated conventional and homologous crossover operators in GE, examining the effects of recombination on the genotype-to-phenotype mapping process. Their study highlighted the importance of crossover-induced disruption and demonstrated that homologous crossover does not necessarily outperform conventional one-point crossover. These findings indicate that increasing the structural sophistication of recombination does not automatically lead to improved evolutionary performance.
Harper and Blair [42] introduced grammar-informed crossover mechanisms designed to exploit information obtained during grammatical derivation. Their Matching Crossover operator identifies crossover positions associated with corresponding grammatical symbols, whereas Left Hand Side (LHS) Replacement Crossover exchanges complete expansions associated with matching non-terminal symbols. These approaches represent important developments toward grammar-aware recombination, particularly by distinguishing between matching grammatical positions and preserving complete grammatical structures.
Another relevant research direction involves the use of crossover as a local improvement mechanism rather than exclusively as a population-level reproductive operator. Tsoulos et al. [43] introduced Local Crossover for GE, employing repeated recombination and fitness-based acceptance to improve individual chromosomes. This approach demonstrates how crossover can be incorporated into an additional refinement procedure, allowing beneficial genetic modifications to accumulate during the evolutionary process.
The present study builds upon these research directions by investigating three additional crossover strategies within the GenClass rule construction framework. The Standard strategy employs repeated one-point crossover with strict fitness-based acceptance. The Targeted strategy exploits genotype-to-phenotype mapping information to identify active codons associated with compatible grammatical categories, while selecting donor chromosomes from an elite subset of the population. TargetedWorst extends this approach by incorporating class-specific classification performance to prioritize modifications associated with poorly performing classes.
Unlike crossover operators that exchange complete grammatical expansions, the proposed Targeted strategies transfer bounded codon blocks between grammatically compatible positions. Therefore, they do not guarantee the preservation of complete grammatical substructures or equivalent program behavior after remapping. Their objective is instead to investigate whether grammatical compatibility, restricted genetic exchange, and classification-performance information can improve the effectiveness of crossover- based refinement.
2.2. Hybrid Evolutionary and Memetic Algorithms
Hybrid evolutionary algorithms combine population-based evolutionary search with additional optimization mechanisms to improve search effectiveness. A particularly important category consists of memetic algorithms, in which evolutionary operators are complemented by local improvement procedures. Such approaches attempt to combine the global exploration capabilities of evolutionary algorithms with the exploitation capabilities of local search.
Local improvement is commonly associated with mutation-based neighborhood exploration or numerical optimization procedures. However, crossover can also serve as a mechanism for local refinement by generating candidate solutions through recombination with other members of the population. Lozano et al. [44] investigated crossover hill-climbing within memetic algorithms, demonstrating the relevance of recombination-based improvement procedures in hybrid evolutionary optimization.
Within GE, Local Crossover [43] provides a related example in which repeated recombination is used to refine chromosomes through fitness-based acceptance. This establishes a direct connection between grammatical evolution and memetic search strategies, since crossover is employed not only to generate offspring for subsequent generations but also to improve existing candidate solutions.
The methods investigated in the present work can be interpreted within this broader memetic framework. The original GenClass evolutionary process retains its conventional selection, crossover, and mutation operators, while an additional crossover-based refinement stage is applied to a limited number of chromosomes during each generation. Candidate modifications are accepted only when they improve the corresponding training fitness, and accepted improvements are immediately available for subsequent refinement trials.
An important distinction from approaches in which local improvement dominates the evolutionary search is that the proposed framework limits the number of chromosomes subjected to additional refinement. This design aims to supplement the population-based evolutionary process without replacing its conventional search mechanisms. Nevertheless, the additional operations introduce computational overhead, making the relationship between classification performance and computational effort an important aspect of the experimental evaluation.
From this perspective, the principal contribution of the present study is not the introduction of grammar-aware crossover or crossover-based local search as entirely new concepts. Rather, it is the systematic investigation of additional crossover refinement strategies within a grammatical-evolution-based rule construction method. In particular, the study examines whether grammatical-category matching, elite donor selection, bounded codon exchange, and class-specific performance guidance provide measurable advantages over simpler stochastic recombination.
The experimental comparison of Standard, Targeted, and TargetedWorst also provides evidence concerning the trade-off between operator complexity and practical effectiveness. This is particularly relevant to the design of hybrid and memetic evolutionary algorithms, where more informed local search mechanisms may introduce additional computational cost without necessarily producing superior solutions.
3. Materials and Methods
This section first provides a detailed description of the rule construction method and subsequently introduces the proposed crossover techniques designed to enhance its evolutionary search process.
3.1. The Rule Construction Method
The rule construction method, hereafter referred to as GenClass, generates classification rules expressed in a C-like language according to the BNF grammar presented in Algorithm 1. The grammar shown in the algorithm is an extended representation of the original BNF grammar, in which each alternative production rule associated with a non-terminal symbol is assigned a corresponding production index. These indices are subsequently used during the genotype-to-phenotype mapping process to determine the production rules selected by the integer-valued chromosomes of GenClass.
Although Algorithm 1 illustrates the grammar used to construct a binary classification rule, GenClass supports multi-class classification through an ordered sequence of rules. For a classification problem involving C classes, the chromosome is divided into C − 1 consecutive segments of equal length, each encoding a separate Boolean condition generated using the BNF grammar. These conditions are combined into an if–else-if structure, where each condition corresponds to one of the first C − 1 classes. The final class serves as the default class when none of the preceding conditions is satisfied. Since the conditions are evaluated sequentially, the first satisfied condition determines the predicted class, thereby avoiding conflicts between multiple matching rules.
The genotype-to-phenotype mapping process employed by GenClass is illustrated in Figure 1. Each chromosome consists of a sequence of integer-valued codons, which are sequentially used to select production rules from the BNF grammar. Starting from the initial non-terminal symbol , the mapping process identifies the next non-terminal to be expanded and determines the corresponding production rule according to
where denotes the current integer codon, N is the number of alternative production rules available for the corresponding non-terminal symbol, and r is the index of the selected production. The selected production is then applied and the mapping process proceeds to the next non-terminal symbol using the next chromosome codon. This procedure is repeated until no non-terminal symbols remain and a complete syntactically valid classification program is generated.
| Algorithm 1 BNF grammar employed by the GenClass method. |
| <S> ::= if (<BEXPR>) CLASS=0 else CLASS=1 (0) <BEXPR> ::= <VARIABLE><BOOLOP><EXPR> (0) | !(<BEXPR>) (1) | <VARIABLE><BOOLOP><EXPR>&<BEXPR> (2) | <VARIABLE><BOOLOP><EXPR>|<BEXPR> (3) <BOOLOP> ::= > (0) | >= (1) | < (2) | <= (3) <EXPR> ::= (<EXPR><BINARYOP><EXPR>) (0) | <FUNCTION>(<EXPR>) (1) | <TERMINAL> (2) <BINARYOP> ::= + (0) | - (1) | * (2) | / (3) <FUNCTION> ::= sin | cos | exp | log (0-3) <TERMINAL> ::= <VARIABLE> (0) | <DIGITLIST>.<DIGITLIST> (1) | (-<DIGITLIST>.<DIGITLIST>) (2) <VARIABLE> ::= x1 | x2 | ... | xD (0-D-1) <DIGITLIST> ::= <DIGIT> (0) | <DIGIT><DIGIT> (1) | <DIGIT><DIGIT><DIGIT> (2) <DIGIT> ::= 0 | 1 | 2 | 3 | 4 | 5 | 6 | 7 | 8 | 9 (0-9) |
Figure 1.
Illustration of the genotype-to-phenotype mapping process employed by GenClass. Integer-valued codons are sequentially mapped to BNF production rules using the modulo operation until a complete classification program is generated.
As an illustrative example, Figure 1 demonstrates the successive mapping of an integer chromosome to the production rules of Algorithm 1. For instance, when the non-terminal is expanded, four alternative productions are available. Therefore, for a codon value of 7, production is selected. Similarly, the remaining codons are successively consumed to expand the resulting non-terminal symbols until the final classification rule is obtained. In this way, the integer-valued genotype is transformed into an executable and human-readable C-like classification program.
The main steps of the algorithm that produces classification programs are listed subsequently.
- 1.
- Initialization step.
- (a)
- Initialize the Genetic Algorithm parameters: , the population size (number of chromosomes); , the maximum number of generations; , the selection rate; and , the mutation rate.
- (b)
- Generate the initial population of chromosomes, , where each chromosome consists of a sequence of randomly generated integer- valued codons.
- (c)
- Set , the generation counter.
- 2.
- Fitness calculation step.
- (a)
- For do
- i.
- Map each chromosome to its corresponding classification program through the genotype-to-phenotype mapping process defined by the BNF grammar presented in Algorithm 1.
- ii.
- Evaluate the generated classification program on the training set and compute its classification error. The resulting error value, denoted by , is used as the fitness value of the corresponding chromosome .
- (b)
- End For
- 3.
- Application of genetic operations.
- (a)
- Selection: Rank the chromosomes according to their fitness values in ascending order. The chromosomes with the lowest fitness values are directly transferred to the next generation without modification, while the remaining chromosomes are replaced by new offspring generated through the crossover and mutation operators.
- (b)
- Crossover: Generate pairs of offspring by applying the one-point crossover operator. For each pair of offspring, denoted as and , two parent chromosomes, and , are selected from the current population using tournament selection. A crossover point is then randomly selected along the chromosomes, and the genetic material located after this point is exchanged between the two parents. Consequently, inherits the first part of and the second part of , whereas inherits the first part of and the second part of . A graphical illustration of the one-point crossover operation is provided in Figure 2.Figure 2. An example of the one-point crossover method.
- (c)
- Mutation: For each gene of chromosome , a random number is generated. If , where denotes the mutation rate, the corresponding gene is replaced by a randomly generated integer value within the predefined range of admissible codon values. Otherwise, the gene remains unchanged.
- 4.
- Termination check step.
- (a)
- Set
- (b)
- If then go to Fitness Calculation step else terminate.
3.2. The Proposed Crossover Methods
The additional crossover procedures investigated in this work can be interpreted as crossover-based local improvement mechanisms embedded within a conventional evolutionary algorithm. Their repeated application, together with the immediate acceptance of fitness-improving modifications, follows a greedy hill-climbing strategy in which candidate neighbors are generated through recombination with other population members. Consequently, the overall framework is closely related to hybrid evolutionary and memetic algorithms, as discussed in Section 2.2.
In the present work, additional crossover techniques are introduced with the aim of improving the performance of GenClass and enhancing its ability to escape from local minima of the classification error function. These crossover operations are applied at each generation of the evolutionary process to a subset of the current population. More specifically, a number of chromosomes are randomly selected from the population and genetic material from each selected chromosome is exchanged with that of another randomly selected chromosome. In this way, new combinations of genetic material are introduced into the population, potentially increasing population diversity and allowing the evolutionary search to explore previously unvisited regions of the search space. The number of chromosomes subjected to these additional crossover operations at each generation is denoted by throughout the remainder of this work.
The proposed procedure is incorporated into the evolutionary algorithm described in Section 3.1 and is executed at each generation after the standard genetic operators of selection, crossover, and mutation have been applied. In this way, the additional crossover mechanism operates as an enhancement of the original evolutionary process without modifying its basic structure.
The proposed crossover techniques, denoted throughout this work as Standard, Targeted, and TargetedWorst, differ in the strategy employed to select and exchange genetic material between chromosomes. A detailed description of each technique is provided in the following subsections.
The Standard crossover strategy is closely related to the Local Crossover operator previously introduced by Tsoulos et al. [43]. Both methods employ repeated one-point recombination with fitness-based acceptance and sequential improvement of selected chromosomes. The differences concern the selection of chromosomes for refinement, the acceptance criterion, and the computational effort allocated to the refinement stage. Therefore, Standard is considered here as an adapted crossover-based refinement strategy rather than a fundamentally new local-search operator. It also serves as a reference for evaluating the additional grammatical and class-performance guidance introduced by Targeted and TargetedWorst.
The configurations also differ substantially in the allocation of search effort. The additional procedure performs candidate evaluations per generation, against offspring produced by the conventional operators. In the earlier study the corresponding ratio is reversed by two orders of magnitude, since the refinement stage dominates the evolutionary update. The additional crossover examined here therefore operates as a supplementary refinement within an otherwise conventional evolutionary search, rather than as its principal search mechanism.
Targeted and TargetedWorst approaches introduce grammatical-category matching, elite donor selection, bounded codon exchange and, for TargetedWorst, class-performance-guided selection of the modified region. The use of grammatical information to guide recombination is itself not new. Harper and Blair [42] introduced Matching Crossover, which aligns corresponding grammatical positions, and LHS Replacement Crossover, which exchanges complete expansions of matching non-terminals. However, unlike complete-expansion replacement, the Targeted procedures transfer bounded codon blocks beginning at grammatically matched positions and therefore do not guarantee the preservation of complete grammatical structures or of equivalent program behaviour after remapping.
3.2.1. The Standard Crossover Method
In the Standard crossover technique, for each of the selected chromosomes, denoted by , a subset of k chromosomes is randomly selected from the current population,
The chromosome is then successively combined with each chromosome , using one-point crossover. For each pair , a crossover point is randomly selected and the corresponding genetic material is exchanged to produce a candidate offspring chromosome . The fitness of is subsequently evaluated using its classification error on the training set. If achieves a lower fitness value than the current , it replaces ; otherwise, the current chromosome remains unchanged. Importantly, whenever such an improvement occurs, the updated chromosome becomes the new and is used in the subsequent crossover operation with . Therefore, the procedure performs a sequential improvement of , allowing beneficial genetic material obtained from successive crossover operations to be accumulated. After all k chromosomes in S have been examined, the final improved version of is retained in the population.
The complete procedure of the Standard crossover technique is summarized in Algorithm 2. The method follows a greedy acceptance strategy, since a newly generated chromosome replaces the current chromosome only when it achieves a lower classification error. Furthermore, each accepted chromosome is immediately used in the subsequent crossover operation, allowing improvements obtained during successive crossover trials to be accumulated.
The proposed crossover operator generates up to two candidate offspring using one-point crossover. The first offspring is constructed by combining the prefix of the selected chromosome with the suffix of a randomly selected chromosome. If this offspring improves the fitness of the selected chromosome, it is accepted and replaces the original chromosome. Otherwise, a second offspring is constructed by exchanging the corresponding chromosome segments in the opposite direction. The second offspring is accepted only if it improves the fitness of the selected chromosome. If neither offspring yields an improvement, the original chromosome remains unchanged. Thus, at most one offspring is accepted during each crossover iteration.
| Algorithm 2 Standard crossover technique. |
|
3.2.2. The Targeted Crossover Method
In the Targeted crossover technique, the exchange of genetic material is guided by information collected during the genotype-to-phenotype mapping process. More specifically, the mapping procedure records the positions of the active codons of each chromosome together with their semantic role in the generated classification program. These codons may correspond to different grammatical components, such as functions, binary operators, Boolean operators, variables, and constants.
For each selected chromosome , the Targeted technique performs k crossover trials. At each trial, an active codon position is randomly selected as the target of the crossover operation. A donor chromosome is then randomly selected from the best fraction of the current population, and the recorded mapping information is used to identify an active codon in having the same semantic type as the selected codon of . Instead of performing an unrestricted one-point crossover, the Targeted technique transfers a bounded block of genetic material between the corresponding positions. The size of this block is determined from the distances to the next active codons in the two chromosomes and is additionally restricted by a predefined maximum block size . In this way, the transferred genetic material is associated with similar grammatical components of the classification programs represented by the two chromosomes.
An active codon is defined as a chromosome position actually accessed during the genotype-to-phenotype mapping process. The proposed Targeted crossover operator records these positions together with their associated semantic categories, including functions, operators, variables, and constants. A target codon is selected from this trace, and a compatible donor codon of the same semantic category is selected from an elite chromosome. The exchanged block length is determined by the distance from each selected position to the next active codon with a greater chromosome index, subject to the maximum block size and chromosome boundaries. Consequently, when active codons occupy consecutive chromosome positions, the exchanged block consists of a single codon. The operator therefore performs semantically guided codon-level or short-block exchanges rather than guaranteeing the exchange of complete grammatical subtrees.
The resulting chromosome is subsequently mapped to its corresponding classification program and its fitness is evaluated on the training set. If
the new chromosome replaces ; otherwise, the current chromosome remains unchanged. As in the Standard technique, an accepted improvement is immediately retained and the updated chromosome is used in subsequent crossover trials. The main difference from Standard crossover is therefore that the exchange of genetic material is not determined exclusively by randomly selected crossover points. Instead, information obtained during the mapping process is exploited to perform crossover between semantically related regions of the participating chromosomes. This targeted exchange is intended to increase the probability of producing meaningful modifications to the generated classification programs while preserving useful genetic structures already discovered during the evolutionary process. The complete procedure of the Targeted crossover technique is summarized in Algorithm 3.
3.2.3. The TargetedWorst Crossover Method
The TargetedWorst crossover technique extends the Targeted approach by additionally exploiting information about the classification performance of the generated program. While Targeted crossover may select an active semantic codon from the chromosome without considering the performance of individual classes, TargetedWorst attempts to concentrate the crossover operation on the chromosome region associated with the class exhibiting the poorest classification performance. The motivation behind this strategy is to modify preferentially those parts of the generated classification program that are more likely to contribute to the observed classification errors, while leaving better-performing components less affected.
The worst-performing class is identified using the class-specific classification error computed on the training set. More specifically, for each class c, the classification error is defined as the percentage of incorrectly classified training patterns belonging to that class. The class with the highest error rate is selected as the worst-performing class. This criterion is equivalent to minimizing class-specific recall and avoids directly favoring majority classes based on their absolute number of misclassified patterns. Nevertheless, the estimated error rates of classes containing relatively few training patterns may exhibit higher variability, which represents a potential limitation of this selection strategy.
For each selected chromosome , the corresponding classification program is evaluated and the class exhibiting the worst classification performance is identified. The genotype-to-phenotype mapping information is subsequently used to determine the active codons associated with the corresponding part of the classification program. An active codon is then selected from this region and its semantic type is determined. As in the Targeted technique, a donor chromosome is selected from the elite fraction of the population, and an active codon having the same semantic type is identified in the donor chromosome. This establishes semantically compatible positions between the two chromosomes and allows genetic material from a high-quality solution to be transferred specifically to a poorly performing region of .
| Algorithm 3 Targeted crossover technique. |
|
A bounded block of genetic material is subsequently transferred from the donor chromosome to . As in Targeted crossover, the size of the transferred block is determined using the active-codon structure of the participating chromosomes and is restricted by the predefined maximum block size . The resulting chromosome is then mapped to its corresponding classification program and evaluated on the training set. If
the candidate chromosome replaces ; otherwise, the modification is discarded. Accepted improvements are immediately retained and are therefore available to subsequent crossover trials.
Consequently, TargetedWorst introduces an additional level of guidance compared with Targeted crossover. Targeted determines the exchanged genetic material according to semantic information obtained during genotype-to-phenotype mapping, whereas TargetedWorst combines this information with class-specific classification performance in order to focus the search on chromosome regions associated with poorly performing parts of the generated classifier. The complete procedure is summarized in Algorithm 4.
| Algorithm 4 TargetedWorst crossover technique. |
|
Figure 3 presents the general flowchart of the proposed method. The process starts with the generation of the initial population of integer-valued chromosomes. Each chromosome is mapped to a classification program through the BNF grammar, and the program is evaluated on the training set, which gives the fitness of the chromosome. The standard genetic operators of selection, one-point crossover and mutation are then applied to the population. After them, the additional crossover procedure is executed. A small number of chromosomes is randomly selected and, for each of them, a number of crossover trials is performed. In every trial, the technique in use, Standard, Targeted or TargetedWorst, produces a new candidate chromosome, which is mapped to a classification program through the grammar and evaluated. If the candidate achieves a lower error than the current chromosome, it replaces it, otherwise the current chromosome is kept. The process continues with the next trial until all the trials of all the selected chromosomes are completed. Finally, the termination criterion is checked. If it is not satisfied, the algorithm returns to the mapping and evaluation of the new population, otherwise it terminates and returns the best classification program.
Figure 3.
Flowchart of the proposed GenClass method with the additional crossover techniques.
4. Results
4.1. Experimental Datasets
The datasets employed in the experimental evaluation were obtained from two widely used public repositories: the UCI Machine Learning Repository [45] and the KEEL Dataset Repository [46]. Both repositories provide a broad collection of benchmark datasets commonly used for the experimental evaluation and comparison of machine learning and classification algorithms. The datasets were accessed on 3 October 2026. The used datasets are the following:
- Alcohol. This dataset contains data collected from experiments investigating patterns of alcohol consumption and is used as a classification benchmark in the present study [47].
- Appendicitis. The Appendicitis dataset is a binary classification dataset containing 106 instances and 7 numerical features, used to predict the presence or absence of acute appendicitis based on clinical measurements [48].
- The Beed dataset. The Bangalore EEG Epilepsy Dataset (BEED), presented by Banu et al. [49], is an EEG dataset developed for epileptic seizure detection and classification. The dataset contains 8000 patterns, each represented by 16 features.
- Dermatology. The Dermatology dataset [50] contains clinical and histopathological measurements used for the differential diagnosis of dermatological diseases.
- Gene. The Gene dataset, also known as the Splice-junction Gene Sequences dataset, contains 3175 DNA sequences represented by 120 binary features. The dataset is used for the classification of splice-junction boundaries into three classes: exon–intron (EI) boundaries, intron–exon (IE) boundaries, and sequences containing neither type of boundary [51].
- Hayes-Roth. The Hayes-Roth dataset is an artificial classification dataset comprising three classes and was originally designed to evaluate the behavior of prototype-based classifiers. The hobby attribute was generated randomly and therefore acts as a noise-inducing feature in the classification problem [52].
- Hepatitis. The Hepatitis dataset contains clinical information collected from patients affected by hepatitis and includes a combination of integer- and real-valued attributes describing various patient characteristics and medical measurements [53].
- HouseVotes. The House Votes dataset contains voting records of members of the U.S. House of Representatives on a set of congressional issues. The classification task aims to distinguish representatives according to their political party affiliation based on their recorded votes [54].
- Ionosphere. The Ionosphere dataset contains radar measurements collected from signals transmitted through the ionosphere. The classification task aims to distinguish between radar returns that provide evidence of structure in the ionosphere and those that do not [55,56].
- Lymphography [57], which is a dataset with four distinct classes.
- Nursery. The Nursery dataset was derived from a hierarchical decision model originally developed to rank applications for admission to nursery schools. The model was used in Ljubljana, Slovenia, during the 1980s, when high demand for nursery schools required an objective procedure for evaluating and explaining admission decisions. The corresponding classification task involves assigning nursery school applications to different priority categories based on a set of socioeconomic and family-related attributes [58].
- Optdigits. The Optical Recognition of Handwritten Digits (Optdigits) dataset contains digitized representations of handwritten numerals obtained from optical scans. The corresponding classification task aims to recognize and assign each handwritten sample to one of the ten digit classes, ranging from 0 to 9 [59].
- Penbased. The Pen-Based Recognition of Handwritten Digits dataset contains samples of handwritten digits collected from 44 writers. Each digit is represented using its coordinate information, resampled to eight points and encoded as a fixed-length feature vector of 16 attributes. The corresponding classification task aims to assign each sample to one of the ten digit classes, ranging from 0 to 9 [60].
- Phoneme. The Phoneme dataset contains acoustic measurements extracted from speech signals. The corresponding classification task aims to distinguish between nasal and oral phonemes based on their acoustic characteristics [61].
- PirVision. The PirVision dataset contains sensor measurements collected for occupancy detection. The corresponding classification task aims to determine occupancy status based on data acquired from passive infrared (PIR) sensing devices [62].
- Satimage. The Satimage dataset contains multispectral satellite image data representing different types of terrain. The corresponding classification task aims to assign image regions to different land-cover classes based on their spectral characteristics [63].
- Segment. The Segment dataset contains image regions characterized by a set of numerical features extracted from outdoor images. The corresponding classification task aims to assign each region to one of several image categories based on its visual characteristics [64].
- Shuttle. The Shuttle dataset was originally developed to derive comprehensible classification rules for determining the conditions under which automatic landing control of a spacecraft would be preferable to manual control. The corresponding classification task involves distinguishing among different operational conditions based on a set of numerical measurements [65].
- Spambase. The Spambase dataset contains features extracted from email messages, including word and character frequencies as well as information related to sequences of capital letters. The corresponding binary classification task aims to distinguish spam from non-spam emails [66].
- Spiral, The Spiral dataset is a synthetic binary classification problem consisting of 1000 two-dimensional instances equally distributed between two classes. The instances are generated using parametric equations that form two intertwined spiral patterns, resulting in a highly nonlinear classification problem [67].
- Student. The Student dataset contains educational data collected from 587 students over two consecutive academic years in ten non-university educational centers. The attributes describe factors such as academic performance, student abilities, motivation, and methodological and assessment preferences. The corresponding classification task aims to categorize students according to their educational characteristics and performance [68].
- Splice dataset, which is a biological classification benchmark consisting of 3190 DNA sequences, each represented by 60 categorical features. The task is to classify sequences into three categories: exon–intron boundaries (EI), intron–exon boundaries (IE), and non-splice junctions (N) [69].
- Texture. The Texture dataset is designed for the classification of different visual textures and comprises 11 texture classes, including grass lawn, pressed calf leather, handmade paper, raffia, and cotton canvas. Each pattern corresponds to a pixel represented by 40 numerical features obtained from the estimation of fourth-order modified moments computed at four different orientations: 0°, 45°, 90°, and 135°. The corresponding classification task aims to assign each pattern to one of the 11 texture categories [70].
- Thyroid. The Thyroid dataset contains clinical measurements related to thyroid gland function. The corresponding classification task aims to determine whether a patient exhibits normal thyroid function or suffers from hyperthyroidism or hypothyroidism, resulting in a three-class classification problem [71].
- The TwoNorm dataset is a synthetic 20-dimensional binary classification problem originally introduced by Breiman. The patterns of each class are generated from multivariate normal distributions with unit covariance matrices and symmetric mean vectors. Specifically, the two class means are and , where [72].
- Vehicle. The Vehicle dataset is designed to classify vehicle silhouettes into four different categories using a set of numerical features extracted from their shapes. The silhouettes were obtained from vehicles viewed from different angles, making the classification task dependent on distinguishing characteristic geometric properties despite variations in viewing orientation [73].
- Yeast. The Yeast dataset contains information describing proteins from Saccharomyces cerevisiae. Each protein is represented by eight numerical features derived from sequence-based measurements. The corresponding classification task aims to predict the cellular localization site of each protein among ten possible classes [74].
- EEG. The EEG dataset is a medical dataset containing electroencephalographic recordings obtained from healthy subjects and patients with epilepsy under different physiological and pathological conditions [75,76]. The original dataset consists of five subsets, denoted by Z, O, N, F, and S, corresponding to different recording conditions and brain states. From these subsets, four classification problems were constructed for the experimental evaluation: Z_F_S, ZO_NF_S, Z_O_N_F_S, and ZONF_S.
The characteristics of each dataset are outlined in Table 1.
Table 1.
The main characteristics of each dataset.
4.2. Experimental Results
The proposed method was implemented in C++. For each dataset, a 10-fold cross-validation procedure was employed using predefined training and test partitions. Each experiment was repeated 30 times independently for every fold, resulting in a total of 300 runs per dataset and method. In each run, the classification model was constructed and optimized exclusively using the training partition, while its classification error was evaluated on the corresponding held-out test partition. The final classification error reported in the experimental tables was calculated as the arithmetic mean of the 300 test classification errors. The test partitions were not used during the evolutionary optimization process. The code used in the experiments with GenClass is a modifed version of the original algorithm located in the repository https://github.com/itsoulos/QGenClass/(accessed on 24 October 2026). The values used for the experimental parameters are listed in Table 2.
Table 2.
Values for the parameters in experiments.
The notation used in Table 3 is described below:
Table 3.
Classification error (%) of the proposed method (STANDARD) and of the other classifiers on the 31 datasets. STANDARD is the GenClass method with the proposed additional crossover procedure, while CLASS is the original GenClass method without it. The last row (AVERAGE) reports the mean error over all datasets, and lower values indicate better performance.
- DATASET denotes the dataset used in the corresponding experiment.
- RBFCON: this method was presented recently [77] to construct Radial Basis Function (RBF) neural networks, with the assistance of Grammatical Evolution. The parameters used for this method are presented in Table 2.
- CART denotes the Classification and Regression Trees (CART) algorithm [78] used to construct binary decision trees by recursively partitioning the feature space. For classification tasks, the splits are typically selected using the Gini impurity criterion, while tree pruning can be employed to reduce overfitting.
- SVM: Support Vector Machines (SVMs) [79] were also used here and was implemented using the LIBSVM library [80].
- RBF denotes a Radial Basis Function (RBF) neural network [81,82] with hidden nodes.
- NEAT denotes the NeuroEvolution of Augmenting Topologies (NEAT) method [83].
- DNN denotes a deep neural network implemented using the Tiny-DNN library, publicly available at the project’s GitHub repository https://github.com/tiny-dnn/tiny-dnn (accessed on 27 October 2026). The network was trained using the AdaGrad optimization algorithm [84].
- ADAM denotes a neural network with hidden nodes trained using the Adam optimization algorithm [85].
- BFGS denotes a neural network with hidden nodes trained using Powell’s variant of the BFGS optimization method [86].
- GEN denotes a neural network with hidden nodes whose weights were optimized using a Genetic Algorithm. The Genetic Algorithm employed the same parameter settings reported in Table 2.
- CLASS denotes the original GenClass rule construction method without the additional crossover mechanism proposed in this work. The parameters used for this method are presented in Table 2.
- STANDARD denotes GenClass enhanced with the proposed Standard crossover method. The parameters used for this method are presented in Table 2.
- The row AVERAGE reports the mean classification error across all datasets for the corresponding method.
Figure 4 compares the average classification errors of the evaluated methods with the majority-class baseline. The STANDARD method achieves the lowest average classification error (13.42%), followed by TARGETED (15.08%), TARGETEDWORST (15.42%), and the original CLASS method (16.13%). In contrast, the majority-class baseline yields an average error of 56.23%. Although some competing classifiers perform worse than the majority-class baseline on individual datasets, the four GenClass variants consistently achieve lower classification errors across all 31 datasets.
Figure 4.
Average classification error (%) of the evaluated classification methods across 31 benchmark datasets. The reported values represent the unweighted mean of the dataset-level classification errors. Lower values indicate better classification performance. The majority-class classifier is included as a simple reference baseline.
To assess the influence of the additional computational effort introduced by the crossover mechanism, we performed a supplementary comparison between STANDARD and the original CLASS method under equal fitness evaluation budgets. For each corresponding experimental run, the total number of fitness evaluations performed by STANDARD was recorded and subsequently used as the maximum evaluation budget for CLASS.
The results are presented in Table 4. STANDARD achieved an average classification error of 13.71%, compared with 14.21% for CLASS. Although STANDARD retained a small numerical advantage, the difference was not statistically significant according to the Wilcoxon signed-rank test ().
Table 4.
Classification error (%) of STANDARD and CLASS under equal fitness evaluation budgets. The bold notation is used for the lowest values.
These findings suggest that the additional computational effort associated with the crossover mechanism may contribute to the improvements observed in the original generation-based comparison. Nevertheless, the proposed method maintains a slightly lower average classification error when both approaches are evaluated under equal fitness evaluation budgets.
To further examine whether the observed improvements can be attributed to the proposed crossover mechanism rather than to the increased computational budget, an additional experiment was conducted using a restart-based baseline. In this experiment, the original CLASS method was executed twice independently with different random seeds, without the additional crossover mechanism. The total fitness evaluation budget was divided between the two executions, and the best solution was selected according to its training fitness. Consequently, the restart-based baseline was allocated the same total number of fitness evaluations as STANDARD.
The results of the equal-budget comparison are summarized in Table 5. As shown in the table, STANDARD achieved the lowest average classification error (14.15%), followed by MUTATION-LS (14.22%), equal-budget CLASS (14.53%), and the restart-based baseline (14.97%). The restart-based approach outperformed STANDARD on 10 datasets, whereas STANDARD achieved lower classification errors on 18 datasets. The two methods produced identical results on one dataset. A paired Wilcoxon signed-rank test yielded p-values of 0.1271 and 0.4118 for the comparisons of the restart-based approach against STANDARD and equal-budget CLASS, respectively. Neither comparison revealed a statistically significant difference at the 0.05 significance level.
Table 5.
Comparison of the average classification errors obtained by STANDARD-EQUAL, MUTATION-LS, CLASS-EQUAL, and CLASS-RESTART under equal total fitness evaluation budgets.
An additional statistical comparison was performed between STANDARD and MUTATION-LS to investigate whether the proposed crossover mechanism provides an advantage over mutation-based local search under the same computational budget. MUTATION-LS achieved lower classification errors on 11 datasets, whereas STANDARD performed better on 16 datasets, with identical results observed on two datasets. The paired Wilcoxon signed-rank test yielded a p-value of 0.6830, indicating that the difference between the two methods was not statistically significant at the 0.05 significance level.
The results of the computational-budget-controlled experiments indicate that STANDARD achieved the lowest average classification error among the four examined methods. However, the differences between STANDARD and the restart-based baseline, as well as between STANDARD and MUTATION-LS, were not statistically significant. These findings suggest that the proposed crossover mechanism may offer a modest practical advantage under equal computational budgets, but they do not establish its statistical superiority over alternative strategies that allocate the same number of fitness evaluations. Consequently, the improvements observed in the main experimental evaluation should be interpreted in conjunction with these additional controlled comparisons.
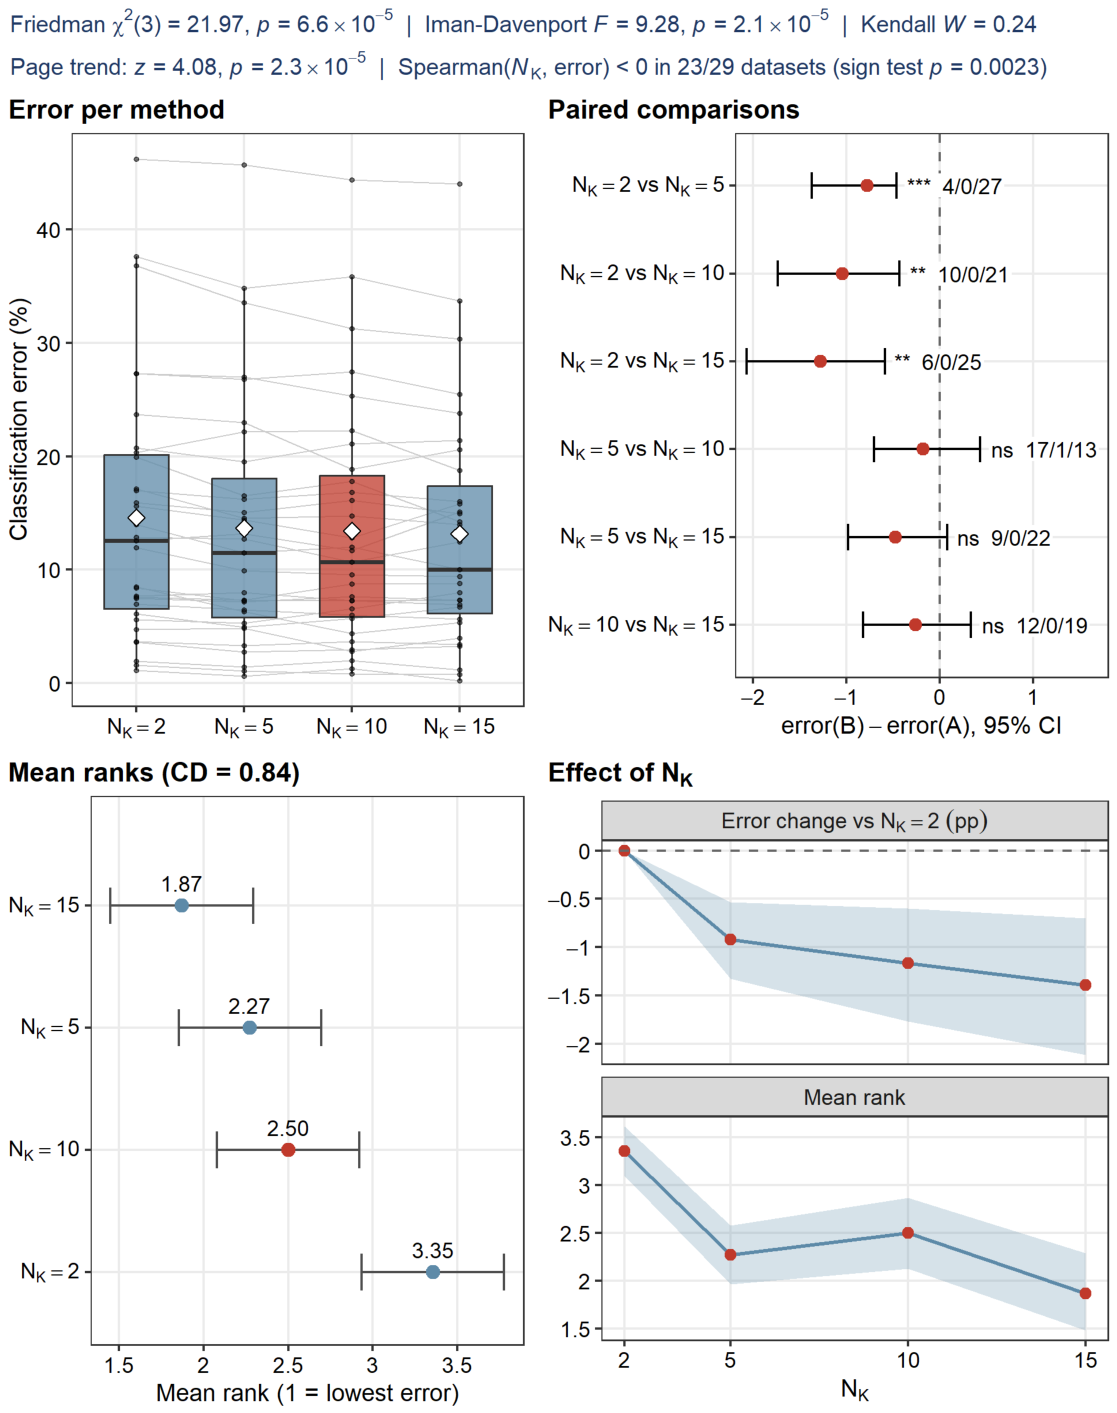
Statistical analysis. The comparison of the methods was based on the average classification error of each method on each dataset, so that every dataset provides one observation and observations are available for each method. All tests were performed at the significance level . For every table, the Friedman test was first applied in order to examine the hypothesis that all the methods of the table perform equally. For each dataset the methods are ranked from the lowest to the highest error, with ties receiving the average rank, and the test compares the mean ranks of the methods. The result is also reported with the Iman-Davenport correction, which is less conservative, and the strength of the differences is expressed by Kendall’s coefficient of concordance , where k is the number of methods. The Nemenyi test was then used to compare all the methods through their mean ranks, and two methods are considered different when their mean ranks differ by more than the critical difference . In addition, specific pairs of methods were compared with the two-sided Wilcoxon signed-rank test for paired samples, applied to the differences of the errors on the individual datasets, where zero differences are discarded and tied absolute differences receive average ranks. The p-values of the Wilcoxon tests were adjusted with the Holm method separately for each table, over the family of comparisons of that table. These are the ten comparisons of STANDARD with each of the other methods in Table 3, and all the pairs of methods in Table 6 (three comparisons) and in Table 7 (six comparisons). Finally, for Table 7, the one-sided Page trend test was used to examine whether the error decreases as increases, together with the Spearman correlation between and the error in each dataset, whose sign was summarized with a sign test.
Table 6.
Classification error (%) of the three crossover strategies.
Table 7.
Experiments with the number that participate in the crossover procedure.
Table 3 presents the classification errors obtained by STANDARD, the original GenClass method (CLASS), and the additional classification methods considered in this study across the 31 datasets. Lower values indicate better classification performance. STANDARD achieved an average classification error of 13.42%, compared with 16.13% for CLASS, corresponding to a reduction of 2.71 percentage points (approximately 16.8% relative reduction). Among the external reference methods, the lowest average errors were obtained by CART (19.42%), SVM (21.97%), and RBFCON (28.94%), while the remaining neural network methods ranged from 33.25% (GEN) to 44.04% (NEAT). STANDARD obtained the lowest error on 19 of the 31 datasets, followed by SVM (5 datasets), CART (3), GEN (2), RBF (1), and RBFCON (1), whereas CLASS did not obtain the lowest error on any dataset. These findings provide evidence of improved classification performance within the GenClass framework under the examined experimental configuration. The remaining classifiers are included as external reference methods, rather than as part of an exhaustive comparison of supervised learning algorithms.
The critical difference of the Nemenyi test is , where is the critical value of the studentized range distribution for k methods, and it therefore depends on the number of methods compared. For each pair of methods, the size of the difference was estimated with the Hodges–Lehmann estimator, which is the median of the pairwise averages of the paired differences of the errors, and its 95% confidence interval was derived from the Wilcoxon signed-rank test using the normal approximation. The effect size of each Wilcoxon test was expressed as , where Z is the standardized statistic of the test and n is the number of datasets with non-zero difference. The confidence intervals of the mean rank and of the mean change in error in Figure 7 were computed with the percentile bootstrap, using 10,000 resamples of the datasets with replacement.
Notation for Figure 5, Figure 6 and Figure 7. Each figure has four panels and a header with the Friedman test, the Iman-Davenport correction and Kendall’s W.
Figure 5.
Statistical comparison of the proposed method (STANDARD) against the other classifiers over 31 datasets. Asterisks denote the significance of the Holm-adjusted Wilcoxon signed-rank test: *** .
Figure 6.
Statistical comparison of the three crossover strategies. (STANDARD, TARGETED, TARGETEDWORST). Asterisks denote the significance of the Holm-adjusted Wilcoxon signed-rank test: ** , *** , ns: not significant ().
- Box plots (top left): The box is the interquartile range (), the thick line is the median, the whiskers extend up to , the diamond is the mean, the dots are the datasets and the grey lines join the same dataset.
- Pairs “A vs. B” (top right): A is the first method named and B the second. The dot is the Hodges-Lehmann median paired difference, error(B) − error(A), with its 95% confidence interval. Right of the dashed line, A has lower error. The label gives the significance stars of the Holm-adjusted Wilcoxon test and the wins/ties/losses of A.
- Mean ranks (bottom left): Mean Friedman rank (1 = best) , where is the Nemenyi critical difference. Non-overlapping bars differ at .
- Stars: *** , ** , * , ns = not significant (Holm-adjusted).
The statistical analysis of Table 3 is summarized in Figure 5. The Friedman test rejects the hypothesis that all eleven methods perform equally (, ), a result confirmed by the Iman-Davenport correction (, ), with a substantial effect size (Kendall’s ). STANDARD obtains the best mean rank (1.87), followed by CLASS (2.97), CART (3.90) and SVM (4.73), while all the other methods have mean ranks above 5.5. In the paired comparisons, STANDARD has lower error than every other method, with Holm-adjusted Wilcoxon signed-rank p-values between and and wins in 25 to 31 of the 31 datasets. The Hodges-Lehmann estimates of the median paired difference range from approximately 2.4 percentage points (CLASS) to 30.4 percentage points (NEAT), with 5.2 percentage points against CART and 8.0 percentage points against SVM. None of the 95% confidence intervals includes zero, and the effect sizes are large (, where values around 0.5 or above are conventionally considered large). The comparisons with CLASS and CART require a careful reading. Their bars overlap with that of STANDARD in the mean-rank panel, which means that the conservative Nemenyi test does not separate them from STANDARD, since the differences in mean rank (1.10 and 2.03) are smaller than the critical difference (2.71). The paired Wilcoxon test, which also takes into account the magnitude of the differences, nevertheless detects a consistent improvement (28 wins and 3 losses against CLASS, 26 wins and 5 losses against CART). STANDARD is worse than CLASS only on IONOSPHERE, NURSERY and SHUTTLE, and worse than CART on NURSERY, PIRVISION, SHUTTLE, Z_F_S and ZONF_S. The competitor with the most individual wins against STANDARD is SVM, which achieves lower error on six datasets (IONOSPHERE, PIRVISION, SATIMAGE, SHUTTLE, STUDENT and TWONORM), although the overall difference remains significant in favor of STANDARD (25 wins and 6 losses).
To examine the potential influence of dependent benchmark datasets, an additional statistical analysis was conducted by excluding the four EEG-derived datasets, which originate from the same underlying recordings. The Wilcoxon signed-rank test was applied to the remaining 27 datasets. The STANDARD method retained a statistically significant advantage over CLASS . In contrast, the differences between TARGETED and CLASS () and between TARGETEDWORST and CLASS () were not statistically significant after applying the Holm correction for multiple comparisons. These findings indicate that the statistically significant improvement of STANDARD over the original GenClass method persists after excluding the related EEG datasets, whereas the evidence supporting improvements from the other two crossover strategies is less conclusive.
4.3. Crossover Methods
Table 6 isolates the effect of the crossover strategy. STANDARD, in which the exchanged chromosome regions are selected purely stochastically, achieves the lowest average error (13.42%), whereas the two strategies that exploit information collected during the evolutionary process are less effective, with 15.08% for TARGETED and 15.42% for TARGETEDWORST. STANDARD obtained the lowest error in 24 of the 31 datasets, compared with 5 for TARGETED and 3 for TARGETEDWORST (a tie between the two targeted strategies in IONOSPHERE is counted for both). The average gain of STANDARD is 1.66 percentage points over TARGETED and 2.0 percentage points over TARGETEDWORST, which correspond to relative reductions of 11.0% and 13.0%, respectively. The two targeted strategies differ little from each other. Hence, in these experiments, guiding the exchange of genetic material with information from the evolutionary process did not improve upon the purely random exchange.
Figure 6 presents the statistical analysis of Table 6. The Friedman test indicates significant differences among the three strategies (, , Iman-Davenport , ), with a moderate effect size (). STANDARD has the best mean rank (1.32), against 2.27 for TARGETED and 2.40 for TARGETEDWORST. Since the critical difference is 0.60, the bar of STANDARD does not overlap with those of the other two strategies, while the bars of TARGETED and TARGETEDWORST overlap. The paired tests agree with this picture. STANDARD is significantly better than TARGETED (25 wins and 6 losses, median difference 1.62 percentage points, 95% CI , , ) and than TARGETEDWORST (27 wins and 4 losses, median difference 1.93 percentage points, 95% CI , , ). On the contrary, TARGETED and TARGETEDWORST cannot be distinguished (15 wins, 3 ties and 13 losses, median difference approximately 0.1 percentage points, 95% CI , , ).
To further assess the effectiveness of the three crossover strategies, we performed pairwise comparisons against the original CLASS method using two-sided Wilcoxon signed-rank tests. For the complete set of 31 datasets, the p-values were for STANDARD, 0.022385 for TARGETED, and 0.030285 for TARGETEDWORST. Since four EEG-derived datasets originate from the same underlying recordings, we additionally repeated the analysis after excluding these related problems. For the remaining 27 datasets, the corresponding p-values were , 0.106917, and 0.040013, respectively. After applying the Holm correction for the three comparisons, only STANDARD retained statistical significance at the 0.05 level in the analysis excluding the EEG-derived datasets. These findings indicate that STANDARD provides the most robust improvement over the original CLASS method, whereas the evidence supporting the two targeted strategies is less conclusive.
4.4. Number of Crossing Items
The value was used as the default configuration in the main experiments without performing a dataset-specific parameter optimization procedure. The experiments presented in this subsection constitute a sensitivity analysis intended to investigate the influence of the number of chromosomes participating in the crossover operation. Although achieved the lowest average classification error, the default configuration was retained for the main comparisons rather than selecting the best-performing value separately for each dataset.
Table 7 reports the results of the proposed method when = 2, 5, 10 and 15 chromosomes participate in the crossover. The column = 10 corresponds to the default value of Table 2 and coincides with the STANDARD column of Table 6. The average error decreases monotonically as increases, from 14.58% for = 2 to 13.66% for = 5, 13.42% for = 10 and 13.19% for = 15. The setting = 15 gave the lowest error in 17 of the 31 datasets, = 5 and = 10 in 7 datasets each, and = 2 in none. Increasing from 2 to 15 reduces the average error by 1.39 percentage points, whereas each of the two further increases beyond = 5 changes it by less than 0.3 percentage points.
The identical results obtained by Targeted and TargetedWorst on the Hepatitis and Phoneme datasets can be attributed to their binary classification structure. In the proposed chromosome representation, a problem with C classes contains explicit classification rules, with the remaining class handled by a default rule. Consequently, for binary classification problems, the single explicit rule spans the entire chromosome, making the class-specific crossover restriction of TargetedWorst equivalent to the unrestricted selection employed by Targeted.
For the BEED dataset, the identical classification error reported for CLASS and TargetedWorst (31.93%) should not be interpreted as algorithmic equivalence. BEED contains four classes, and TargetedWorst performs additional class-directed crossover operations that are absent from the CLASS baseline. Supplementary implementation checks confirmed that these operations were executed and produced accepted fitness improvements. However, the numerical coincidence in the original results has not been independently reproduced.
Figure 7 presents the corresponding statistical analysis. The Friedman test detects significant differences among the four settings (, , Iman-Davenport , ), although with a smaller effect size than in the previous comparisons (). The mean rank is the worst for (3.35) and the best for (1.87), with (2.27) and (2.50) in between. The one-sided Page trend test, which examines whether the error decreases as increases, confirms a significant trend (, ). In agreement, the Spearman correlation between and the error is negative in 23 of the 29 datasets where it is non-zero (median correlation , sign test ). The pairwise comparisons show, however, that this trend is mainly due to the weakness of the smallest setting. The value has significantly higher error than (), () and (), with median differences of approximately 0.8, 1.0 and 1.3 percentage points, respectively. None of the differences among , 10 and 15 is statistically significant (adjusted for 5 versus 10, 0.20 for 5 versus 15 and 0.61 for 10 versus 15), and their confidence intervals include zero. Therefore, a very small number of chromosomes in the crossover is detrimental, whereas beyond any further benefit is small and is not statistically established in these experiments, although has the best mean rank.
Figure 7.
Effect of the number of chromosomes () participating in the crossover on the proposed method. Asterisks denote the significance of the Holm-adjusted Wilcoxon signed-rank test: ** , *** , ns: not significant ().
The figure shows the average execution time of the Standard technique on the Dermatology dataset for = 2, 5, 10 and 15. The time increases with , from 104.4 s for to 302.6 s for , which is about 2.9 times higher. The increase is approximately linear up to , at about 19 s per additional chromosome, and becomes slower from to , at about 9 s per additional chromosome. The observed execution-time increase is not uniform across the examined values of . Although the increase becomes smaller between and , the available measurements do not establish the underlying cause of this behavior. Consequently, no specific explanation for the change in the slope of the execution-time curve can be confirmed from these results alone as outlined in Figure 8.
Figure 8.
Execution time of the STANDARD crossover technique on the Dermatology dataset for different values of . The baseline configuration required 81.80 s, while execution time increased to 302.60 s for . The baseline value represents a single execution, whereas the remaining values correspond to the previously reported average execution times.
For the Dermatology dataset, the default value requires 255.6 s, whereas requires 302.6 s, representing an increase of approximately 18%. This dataset is used solely to illustrate the computational cost associated with increasing and should not be considered representative of the overall classification performance. Across all 31 datasets, achieves the lowest average classification error and the best mean rank, although its advantage over and is not statistically significant after correction for multiple comparisons.
4.5. Computational Cost Analysis
To provide a more comprehensive assessment of the computational cost of the proposed crossover operators, additional experiments were conducted on three relatively large datasets: Nursery, Pirvision, and Shuttle. Both wall-clock execution time and the total number of fitness evaluations were measured for the original CLASS configuration and the STANDARD, TARGETED, and TARGETEDWORST crossover variants. All configurations were evaluated using identical experimental settings and the same random seed, with for CLASS and for the crossover variants.
Table 8 reports the measured execution times and total fitness evaluation counts. The results reveal substantial differences in computational cost among the examined approaches. STANDARD consistently exhibits the highest overhead, requiring approximately 3.49–3.93 times the execution time of CLASS. In contrast, TARGETED introduces a more moderate overhead, with execution-time ratios ranging from 1.40 to 1.67. TARGETEDWORST exhibits dataset-dependent behavior, with execution-time ratios ranging from 0.64 to 1.85.
Table 8.
Wall-clock execution time and total fitness evaluations for CLASS and the three crossover variants on Nursery, Pirvision, and Shuttle. The baseline uses , while the crossover variants use . Results correspond to one run per configuration.
The number of fitness evaluations generally follows a similar pattern, although execution time is not strictly proportional to the evaluation count. This suggests that factors beyond the number of evaluations may also influence total execution time. In particular, STANDARD introduces a substantial increase in both execution time and fitness evaluations.
An additional baseline measurement was performed on the Dermatology dataset with . The recorded execution time was 81.80 s, with 2,041,800 fitness evaluations. The previously reported time of 255.60 s at is approximately 3.12 times this baseline; this comparison is valid only if both measurements were obtained under equivalent experimental conditions.
These findings demonstrate that the computational overhead of the proposed crossover strategies depends on the operator and dataset and can be substantial, particularly for STANDARD. The additional crossover operations therefore represent a trade-off between classification performance and computational cost rather than a computationally negligible modification. Because these measurements correspond to a single execution per configuration, they are intended to characterize computational overhead rather than establish statistically significant timing differences.
4.6. Crossover Ablation Study
To examine whether the observed behavior of targeted crossover is attributable to donor selection, exchange geometry, or local grammar-based matching, we conducted a controlled ablation study. Six crossover configurations were considered:
- Standard, the original standard crossover using donors sampled from the population and tail exchange;
- Standard + Elite, which retains the standard exchange but restricts donor selection to the top 20% of the population;
- Standard + Block, which retains population-wide donor selection but limits the exchanged segment to at most 16 codons;
- Targeted, which combines elite donor selection, a maximum exchanged block length of 16 codons, and local grammar-based matching;
- Targeted + Full, which replaces elite donor selection in Targeted with population-wide sampling; and
- TargetedWorst, the corresponding targeted variant using its alternative recipient-selection strategy. These controls examine individual design choices but do not constitute a complete factorial isolation of all possible interactions.
Experiments used ten classification datasets (Dermatology, Hepatitis, Housevotes, Ionosphere, Optdigits, Segment, Spambase, Thyroid, Vehicle, and Yeast). For each dataset and configuration, 30 runs were performed using the same set of random seed values, giving 1800 runs in total. All runs were constrained to exactly 100,000 fitness evaluations, with a maximum of 1000 generations. The number of crossover items was 10; the targeted variants used 20 crossover iterations and a maximum block length of 16 codons. The results refer to one predefined training/test split per dataset, rather than a complete ten-fold cross-validation. Consequently, the conclusions are conditional on the selected splits. The recorded test classification errors are reported as mean ± sample standard deviation across the 30 runs.
Table 9 shows that no single operator is best on every dataset. Targeted+Full achieves the lowest mean classification error on five datasets, while Standard performs best on Dermatology and Standard+Block on Hepatitis. The relatively small differences between several configurations should not be interpreted as evidence of universal superiority.
Table 9.
Classification error (%, mean ± standard deviation over 30 runs) under an equal budget of 100,000 fitness evaluations per run. Lower values are better.
As shown in Table 10, the targeted configurations produce more accepted improvements per crossover fitness evaluation than the standard configurations. In particular, Targeted yields approximately 2.41 times the normalized acceptance count of Standard. However, these are not equal numbers of crossover evaluations: the fixed total evaluation budget also covers other algorithmic operations, and the crossover implementations use different numbers of trials and evaluations. The normalized ratio is therefore an operational efficiency measure, not direct proof that grammar-based matching alone causes the difference. TargetedWorst also records substantially more skipped trials, indicating that some attempted operations terminate without a crossover fitness evaluation.
Table 10.
Crossover statistics aggregated over all ten datasets and 30 runs per dataset. Accepted improvements and skipped trials are mean counts per run; the last column is the ratio of total accepted improvements to total crossover fitness evaluations, multiplied by 1000.
For a dataset-level statistical comparison, the six operators were ranked according to their mean classification error on each of the ten datasets. A Friedman test identified an overall difference (, ). The mean ranks (smaller is better) were 2.20 for Targeted + Full, 2.85 for TargetedWorst, 3.05 for Targeted, 3.50 for Standard, 3.90 for Standard + Block, and 5.50 for Standard+Elite. Five pre-specified pairwise comparisons were subsequently performed using two-sided Wilcoxon signed-rank tests on the ten paired dataset means, with Holm correction: Standard versus Targeted (), Standard versus Standard + Elite (), Standard versus Standard + Block (), Targeted versus Targeted + Full (), and Targeted versus TargetedWorst (). Only the Standard versus Standard + Elite comparison met the 0.05 threshold after correction, with Standard achieving the lower classification error on average. These tests use datasets as the paired analysis units, rather than treating all 300 runs per operator as independent datasets.
The ablations suggest that restricting donors to the elite subset is not beneficial by itself and that limiting exchange length does not guarantee improved generalization. Local grammar-based matching may increase the frequency of accepted local modifications, but the present controls cannot establish an isolated causal effect of semantic matching. Importantly, matching grammar-derived types at the exchange site is a local constraint: changing the derivation can alter how subsequent codons are consumed and interpreted, so global semantic equivalence or validity of the entire downstream derivation is not guaranteed solely by the local match. These limitations motivate interpreting the crossover mechanisms as interacting design choices rather than as independently validated sources of performance improvement.
Mechanistic interpretation of local semantic compatibility.
An important limitation of grammar-guided crossover arises from the sequential nature of genotype-to-phenotype mapping in Grammatical Evolution. Although the Targeted operator attempts to identify compatible crossover positions based on grammar-derived semantic information, such compatibility is inherently local and does not guarantee preservation of the overall derivation structure.
For example, consider a grammar containing the productions <expr> ::= <expr> <op> <expr> | <var> | <func>(<expr>). Replacing a codon that selects <var> with one selecting <expr> <op> <expr> introduces additional non-terminal symbols into the derivation. As a result, subsequent codons may be consumed in different grammatical contexts, potentially selecting different production rules and producing substantially different phenotypes.
This phenomenon implies that exchanging locally compatible codon blocks does not necessarily preserve the semantic relationships of the complete generated expression. The resulting disruption may offset the expected benefits of semantic guidance and provides a plausible explanation for the absence of consistent improvements in classification performance. Importantly, this interpretation is a mechanistic hypothesis supported by the properties of GE mapping rather than a directly measured causal effect in the present experiments.
4.7. Convergence and Population Diversity Analysis
To further investigate the evolutionary behavior of the proposed crossover operators, a convergence and population diversity analysis was conducted on four representative classification datasets: Dermatology, Ionosphere, Spambase, and Vehicle. These datasets include binary and multiclass classification problems, allowing the crossover strategies to be examined under different chromosome structures. Each configuration was evaluated over 30 independent runs using a fixed budget of 100,000 fitness evaluations.
Population diversity was quantified using the normalized average pairwise Hamming distance between chromosomes. This measure expresses the proportion of differing codon positions across pairs of individuals in the population. Higher values indicate greater genotypic diversity, whereas lower values indicate increasing population homogeneity. The convergence curves show the mean best-so-far fitness, and the diversity curves show the mean population diversity. Shaded regions indicate one standard deviation around the mean.
Figure 9 presents the convergence and diversity trajectories for all four datasets. The left column shows best-so-far fitness against the number of fitness evaluations; the right column shows normalized population diversity. Since the fixed evaluation budget may interrupt the final generation, the diversity curves are restricted to evaluation ranges with observations from all 30 runs for each operator, avoiding comparisons based on unequal sample counts.
Figure 9.
Convergence and population diversity of the Standard, Targeted, and TargetedWorst crossover operators on Dermatology, Ionosphere, Spambase, and Vehicle. The left column presents mean best-so-far fitness, while the right column presents mean normalized average pairwise Hamming distance. Results are aggregated over 30 independent runs per operator. Shaded regions represent the mean ± one standard deviation. Diversity curves are restricted to evaluation ranges with complete observations across all runs, whereas convergence curves extend to the fixed budget of 100,000 fitness evaluations.
On Dermatology, TargetedWorst exhibits relatively rapid initial fitness improvements. Both targeted variants maintain greater population diversity than Standard over substantial portions of the search. At 60,000 fitness evaluations, the diversity differences between Standard and Targeted and between Standard and TargetedWorst are statistically significant (Holm-adjusted Wilcoxon and , respectively). No statistically significant diversity difference was observed between the two targeted variants. Although TargetedWorst obtained the best mean final fitness in this experiment, pairwise tests did not identify statistically significant differences in final fitness.
On Ionosphere, Targeted achieves significantly better final fitness than Standard. The recorded convergence and diversity trajectories of Targeted and TargetedWorst coincide. On Spambase, the targeted variants maintain greater population diversity than Standard over substantial portions of the search, but the final-fitness difference between Standard and Targeted is not statistically significant. The two targeted variants again exhibit identical recorded trajectories.
Vehicle provides a multiclass case in which the targeted variants generally maintain greater genotypic diversity than Standard, while the observed final-fitness difference between Standard and Targeted is not statistically significant. Thus, increased diversity does not necessarily translate into better final optimization performance under the available evaluation budget.
An implementation-specific characteristic explains the identical behavior of Targeted and TargetedWorst observed on the binary datasets. For a problem with C classes, the chromosome contains explicit classification rules, with the remaining class represented by the default branch. TargetedWorst restricts crossover positions to the segment corresponding to the worst-performing class, except when that class is the default class, in which case the entire chromosome is considered. When , the single explicit-rule segment already spans the entire chromosome. Therefore, the class-specific restriction is ineffective for either possible worst-performing class, and TargetedWorst can select the same candidate crossover positions as Targeted. With otherwise equivalent selection and exchange operations and the same random seed, the operators can follow identical evolutionary trajectories, as observed on Ionosphere and Spambase.
Overall, Figure 9 indicates that the targeted crossover variants often preserve greater genotypic diversity, particularly on Dermatology, Spambase, and Vehicle, without consistently producing statistically significant improvements in final fitness. The effects are dataset-dependent. Furthermore, higher genotypic diversity should not be interpreted as direct evidence of improved generalization performance or a causal explanation for differences in classification accuracy.
4.8. Interpretability and Program Complexity
Interpretability was evaluated through the complexity of the final, expressed classification programs. Four complementary measures were considered:
- Program length in lexical tokens.
- The number of distinct input features referenced.
- The number of relational comparisons.
- The number of conditional statements.
These measures characterize different aspects of the readability of the generated rule systems: a program may be syntactically long without introducing additional decision branches or input features. We analyzed the final logged programs of the Standard, Targeted, and TargetedWorst crossover variants on ten datasets. For each dataset–operator combination, up to 30 independently seeded runs were available. In total, 898 programs were successfully extracted: 298 for Standard and 300 for each of Targeted and TargetedWorst. The Standard results include 29 runs forDermatology and 29 for Yeast; the remaining combinations contain 30 runs. The measurements describe the final logged best programs, not the mean complexity of the evolving populations. This information regarding rule complexity is outlined in Table 11.
Table 11.
Complexity of final evolved programs. Values are mean ± standard deviation across independent runs. Program length is measured in lexical tokens; F is the number of distinct features, C the number of relational comparisons, and I the number of conditional statements.
To assess paired differences in final program length, runs were matched by dataset and random seed and compared using the Wilcoxon signed-rank test. The Holm procedure was applied to the family of 20 length comparisons (Standard versus Targeted and Standard versus TargetedWorst for each of the ten datasets). After correction, Standard generated significantly longer programs on Optdigits, Segment, and Vehicle relative to both alternatives (Table 12). No comparison of the number of distinct features or relational comparisons remained significant after the corresponding Holm corrections. The number of conditional statements was identical across the three variants within each dataset in these extracted results. Thus, longer expressions did not necessarily entail more decision branches.
Table 12.
Holm-adjusted Wilcoxon p-values for the significant paired comparisons of final program length. The positive mean differences indicate longer Standard programs.
- Examples of evolved rules.
The following examples are taken verbatim from the final logged programsfor the Ionosphere dataset (seed 1). Both runs used a strict budget of 100,000 fitness evaluations. Standard reached a training classification error of 8.23\% and a test error of 17.14%, whereas Targeted reached 5.06% and 11.43%, respectively. The TargetedWorst program was identical to the Targeted program for this seed. These examples illustrate the form and complexity of the learned expressions, but should not be interpreted as a representative performance comparison from a single seed.
- Standard:
- if(!(x1<=cos((sin(x33)*x17))&x18>((-8.55)+(-1.2))|x2*x23>=x7&x9>x24|x5<sin(x20)&!(x19<cos(((x3*(x27*sin(x29)))-(-9.40)))))) CLASS=0.00
- else
- CLASS=1.00
- Targeted (also TargetedWorst):
- if(!(x1<=cos((sin(x33)*x9))|!(!(x5<=(x21*x16)|!(x16>=sin((-89.27))&!(x29<=cos((-9.0)))))))) CLASS=0.00
- else
- CLASS=1.00
- Program growth and bloat.
Additional illustrative evolutionary traces were examined for the original GenClass baseline and Standard on Shuttle and Pirvision over 2000 generations. In these individual runs, Standard yielded longer final programs, but program length fluctuated and sometimes decreased during optimization rather than increasing monotonically. Importantly, these traces are not controlled equal-evaluation comparisons: Standard used 6,335,527 versus 1,783,945 fitness evaluations on Shuttle and 6,776,246 versus 2,072,441 on Pirvision. Moreover, the recorded lengths refer to reported best programs, not population-wide mean genome or phenotype sizes. Accordingly, the evidence supports the narrower finding that some greedy crossover variants increase final expressed rule length; it does not establish the presence or absence of population-level genetic programming bloat. A definitive bloat study would require matched fitness-evaluation budgets, multiple independent baseline runs, and population-level complexity measurements throughout evolution.
4.9. Influence of Dataset Characteristics on Classification Performance
To investigate whether the benefit of the proposed crossover mechanism depends on dataset characteristics, we examined all 31 datasets listed in Table 1. For each dataset, the improvement was defined as , where E denotes the mean test classification error (in percentage points) reported in Table 3. Thus, positive values indicate lower error for STANDARD. Spearman’s rank correlation was used to assess associations between and the numbers of patterns, input features, and classes. Each dataset constituted one observation (); repeated runs were not treated as independent dataset-level observations.
The association between improvement and dataset size was weak (, ), as was the association with the number of features (, ). The number of classes showed a positive association (, nominal ), suggesting that larger improvements may occur in problems with more classes. However, this association did not remain statistically significant after Holm correction across the three correlations. The result should therefore be considered exploratory rather than evidence of a robust dependence on class count.
We also separated the datasets into binary () and multiclass () problems. STANDARD reduced the mean classification error relative to CLASS on 8 of the 9 binary datasets and 20 of the 22 multiclass datasets. The average improvements were 1.72 and 3.12 percentage points, respectively. Nevertheless, a two-sided Mann–Whitney U test did not identify a statistically significant difference in dataset-level improvements between these groups ().
The previously mentioned results do not reveal a clear monotonic relationship between the advantage of STANDARD and the number of patterns or features. Although the class-count analysis suggests a potentially interesting trend, the available dataset-level evidence is insufficient to establish that the proposed crossover mechanism systematically benefits more from a larger number of classes. Moreover, these observational comparisons do not isolate dataset size or class count from other differences in problem difficulty and structure.
4.10. Analysis of Accepted Crossover Improvements
To quantify the behavior of the six crossover variants, we recorded the number of accepted crossover improvements at each generation in 30 independent runs on the Dermatology dataset. All runs used the same limit of 100,000 fitness evaluations. An accepted improvement denotes an improvement accepted by the crossover mechanism; it does not necessarily indicate a new global-best individual. Table 13 reports the mean and sample standard deviation across runs. The per-generation measure was computed for each run by dividing its total number of accepted improvements by its number of completed generations, before aggregating across runs.
Table 13.
Accepted crossover improvements on the Dermatology dataset (mean ± sample standard deviation over 30 independent runs). The last column normalizes by the number of crossover evaluations, not by the total fitness-evaluation budget.
Standard produced the largest number of accepted improvements per generation (), followed by Standard + Block () and Standard + Elite (). The targeted variants produced fewer accepted improvements per generation, partly because they performed fewer crossover evaluations within each generation. Accordingly, we also report accepted improvements per 1000 crossover evaluations. By this measure, Targeted and Targeted + Full achieved approximately 27.2 accepted improvements, compared with 12.3 for Standard. This difference concerns acceptance frequency, not necessarily the magnitude of improvement or final classification accuracy.
To examine how acceptance evolves during the search, we divided the common 100,000-fitness-evaluation budget into ten intervals. For each run, the accepted improvements and crossover evaluations of a generation were assigned to the interval containing that generation’s ending cumulative fitness-evaluation count. Figure 10 shows the resulting mean counts. The Standard variants generally exhibit a reduction in the number of accepted improvements from the early to the later intervals. The targeted variants exhibit more irregular bin counts.
Figure 10.
Mean number of accepted crossover improvements in successive 10,000-fitness-evaluation intervals on Dermatology (30 runs per variant). Whole generations are assigned to the interval in which they finish; therefore, short-term fluctuations may reflect bin boundaries rather than changes in search behavior.
Figure 11 accounts for the different numbers of crossover evaluations in each interval. The Standard acceptance frequency falls from approximately 17.3 to 10.4 accepted improvements per 1000 crossover evaluations between the first and last intervals. In contrast, Targeted and Targeted + Full remain at approximately 25–29 accepted improvements per 1000 crossover evaluations across most intervals. Thus, although the targeted variants accept fewer improvements per generation, they exhibit a higher acceptance frequency per crossover evaluation.
Figure 11.
Accepted crossover improvements per 1000 crossover evaluations across the fitness-evaluation budget. Each point is the ratio of the mean accepted improvements to the mean crossover evaluations within the corresponding interval (30 runs per variant). The binning uses generation endpoints.
These findings describe the acceptance dynamics on Dermatology and should not be interpreted as evidence of superiority across all datasets. In particular, acceptance frequency alone does not establish whether a method yields better final classification performance.
5. Conclusions
This work introduced an additional crossover procedure into the GenClass method. At each generation, after the conventional genetic operators have been applied, randomly selected chromosomes undergo k crossover trials. A candidate chromosome replaces the current chromosome only when it achieves a strictly lower training classification error. Three variants, denoted Standard, Targeted, and TargetedWorst, were evaluated on 31 classification datasets. Standard applies one-point crossover using donors selected from the population. It reduced the average classification error of the original method from 16.13% to 13.42%, corresponding to a relative reduction of approximately 16.8%, and obtained the lowest error on 19 of the 31 datasets among the eleven compared methods. Its average error was also lower than those of the additional reference classifiers, including CART (19.42%) and SVM (21.97%). The improvement over the original method remained statistically significant in the sensitivity analysis that excluded four related EEG-derived datasets and applied Holm correction for multiple comparisons.
The comparison of the three variants revealed that additional grammatical and class-specific guidance did not necessarily improve classification performance. Targeted and TargetedWorst select donor chromosomes from an elite fraction of the population and exchange bounded blocks of codons at semantically compatible positions. TargetedWorst further restricts the modified region according to the worst-performing class. Nevertheless, Standard achieved a lower average classification error than both targeted variants. The respective mean errors were 13.42% for Standard, 15.08% for Targeted, and 15.42% for TargetedWorst, compared with 16.13% for the original GenClass method. In the reported pairwise comparisons, Standard outperformed both targeted variants, whereas no statistically significant difference was established between Targeted and TargetedWorst. Comparisons against the original method indicated that Standard provided the most robust improvement under the more conservative sensitivity analysis; the evidence supporting the targeted variants was less conclusive.
A possible explanation for these findings concerns the different recombination mechanisms. Standard selects donors from the entire population and exchanges chromosome segments following randomly selected crossover points, whereas the targeted variants select donors from the best 20% of the population and transfer blocks of at most codons. The additional convergence and population diversity experiments described in Section 4.7, conducted on Dermatology, Ionosphere, Spambase, and Vehicle, showed that the targeted variants often maintained greater genotypic diversity than Standard, as measured by normalized average pairwise Hamming distance. However, this higher diversity did not consistently translate into better final fitness or lower classification error. Thus, the lower average classification error achieved by Standard in the present experiments cannot be explained simply by greater preservation of genotypic diversity. Donor selection, the extent of exchanged genetic material, and the balance between exploration and exploitation are plausible contributing factors, but the present results do not establish a causal relationship between these mechanisms and generalization performance. Donor selection, the extent of exchanged genetic material, and the balance between exploration and exploitation are plausible contributing factors, but the present results do not establish a causal relationship between these mechanisms and generalization performance.
The convergence experiments also clarified an implementation-specific property of the targeted operators on binary classification problems. When the number of classes is two, the single explicitly encoded rule occupies the entire chromosome; consequently, the class-based restriction of TargetedWorst does not narrow the set of eligible crossover positions relative to Targeted. This explains the identical trajectories observed for these operators on the binary datasets considered in the convergence analysis. Their behavior can differ on multiclass problems, where the chromosome contains separate rule- encoding segments.
The number of chromosomes subjected to additional crossover also influenced performance, particularly at its smallest tested value. The setting performed significantly worse than the larger settings, whereas differences among , 10, and 15 were small and not statistically significant. Although yielded the lowest average error and the best mean rank, its advantage over the other moderate settings was not statistically established. Therefore, a moderate number of selected chromosomes appears sufficient under the examined experimental configuration.
Several limitations should be acknowledged. The additional procedure requires up to candidate fitness evaluations per generation, corresponding to 200 evaluations for the parameter configuration used in the experiments, while the conventional genetic operators generate offspring per generation. The parameters k, , and were kept fixed, and their individual effects were not systematically examined. The conclusions are therefore restricted to the evaluated datasets, parameter settings, and classification tasks. Moreover, four EEG-derived benchmark problems originate from related recordings and cannot be treated as fully independent observations. Although a sensitivity analysis excluding these problems was performed, the remaining datasets do not necessarily represent a random sample of all classification tasks.
It should also be emphasized that the objective of this study is to assess the effects of additional crossover strategies within the GenClass framework, rather than to establish GenClass as a universally superior classification method. The comparisons with other classifiers provide supplementary performance references and should not be interpreted as a comprehensive benchmark of supervised learning algorithms. Different classification methods may be more suitable for different datasets and application domains.
An additional limitation concerns the availability of run-level observations. For the main cross-validation experiments, the individual results of the 30 independent runs per fold were not retained, preventing the estimation of run-to-run standard deviations and within-dataset statistical tests from those experiments. In contrast, run-level observations were retained for the supplementary convergence and population diversity experiments reported in Section 4.7. Accordingly, small differences in average classification error should be interpreted cautiously. Furthermore, because the greedy acceptance criterion uses training classification error, the additional refinement may increase the risk of overfitting, particularly on small datasets such as Hepatitis and Appendicitis. The present diversity measurements describe genotypic variation and do not, by themselves, demonstrate improved generalization.
Future research should extend the convergence and population diversity analysis to more datasets and investigate the effects of the elite fraction , maximum block size , and alternative donor-selection policies. Hybrid operators combining random and grammatically guided exchanges could also be examined. In addition, the number of selected chromosomes and the number of crossover trials k could be adapted dynamically during evolution; values of greater than 15 merit investigation because the largest tested setting achieved the best mean rank without a statistically significant advantage. Further studies should retain run-level results across the full cross-validation protocol, assess generalization and overfitting more directly, and report computational cost alongside predictive performance. Finally, parallel implementations and applications to larger datasets, regression tasks, and other Grammatical Evolution methods would help establish the broader applicability of the proposed crossover procedure.
Author Contributions
G.G. and I.G.T. conducted the experiments, employing several datasets and provided the comparative experiments. V.C. performed the statistical analysis and prepared the manuscript. All authors have read and agreed to the published version of the manuscript.
Funding
This research has been financed by the European Union: Next Generation EU through the Program Greece 2.0 National Recovery and Resilience Plan, under the call RESEARCH—CREATE—INNOVATE, project name “iCREW: Intelligent small craft simulator for advanced crew training using Virtual Reality techniques” (project code: TAEDK-06195).
Institutional Review Board Statement
Not applicable.
Informed Consent Statement
Not applicable.
Data Availability Statement
The original contributions presented in this study are included in the article. Further inquiries can be directed to the corresponding author.
Conflicts of Interest
The authors declare no conflicts of interest.
References
- Holland, J.H. Genetic algorithms. Sci. Am. 1992, 267, 66–73. [Google Scholar] [CrossRef] [Scilit]
- Yusup, N.; Zain, A.M.; Hashim, S.Z.M. Evolutionary techniques in optimizing machining parameters: Review and recent applications (2007–2011). Expert Syst. Appl. 2012, 39, 9909–9927. [Google Scholar] [CrossRef] [Scilit]
- Stender, J. Parallel Genetic Algorithms: Theory & Applications; IOS Press: Amsterdam, The Netherlands, 1993. [Google Scholar]
- Goldberg, D. Genetic Algorithms in Search, Optimization and Machine Learning; Addison-Wesley Publishing Company: Reading, MA, USA, 1989. [Google Scholar]
- Michaelewicz, Z. Genetic Algorithms + Data Structures = Evolution Programs; Springer: Berlin/Heidelberg, Germany, 1996. [Google Scholar]
- Santana, Y.H.; Alonso, R.M.; Nieto, G.G.; Martens, L.; Joseph, W.; Plets, D. Indoor genetic algorithm-based 5G network planning using a machine learning model for path loss estimation. Appl. Sci. 2022, 12, 3923. [Google Scholar] [CrossRef] [Scilit]
- Liu, X.; Jiang, D.; Tao, B.; Jiang, G.; Sun, Y.; Kong, J.; Chen, B. Genetic algorithm-based trajectory optimization for digital twin robots. Front. Bioeng. Biotechnol. 2022, 9, 793782. [Google Scholar] [CrossRef] [Scilit] [PubMed]
- Nonoyama, K.; Liu, Z.; Fujiwara, T.; Alam, M.M.; Nishi, T. Energy-efficient robot configuration and motion planning using genetic algorithm and particle swarm optimization. Energies 2022, 15, 2074. [Google Scholar] [CrossRef] [Scilit]
- Liu, K.; Deng, B.; Shen, Q.; Yang, J.; Li, Y. Optimization based on genetic algorithms on energy conservation potential of a high speed SI engine fueled with butanol–gasoline blends. Energy Rep. 2022, 8, 69–80. [Google Scholar] [CrossRef] [Scilit]
- Zhou, G.; Zhu, S.; Luo, S. Location optimization of electric vehicle charging stations: Based on cost model and genetic algorithm. Energy 2022, 247, 123437. [Google Scholar] [CrossRef] [Scilit]
- Choudhury, S.; Rana, M.; Chakraborty, A.; Majumder, S.; Roy, S.; RoyChowdhury, A.; Datta, S. Design of patient specific basal dental implant using Finite Element method and Artificial Neural Network technique. J. Eng. Med. 2022, 236, 1375–1387. [Google Scholar] [CrossRef] [Scilit] [PubMed]
- Chen, Q.; Hu, X. Design of intelligent control system for agricultural greenhouses based on adaptive improved genetic algorithm for multi-energy supply system. Energy Rep. 2022, 8, 12126–12138. [Google Scholar] [CrossRef] [Scilit]
- O’Neill, M.; Ryan, C. Grammatical evolution. IEEE Trans. Evol. Comput. 2001, 5, 349–358. [Google Scholar] [CrossRef] [Scilit]
- Backus, J.W. The Syntax and Semantics of the Proposed International Algebraic Language of the Zurich ACM-GAMM Conference. In Proceedings of the International Conference on Information Processing, UNESCO, Paris, France, 15–20 June 1959; pp. 125–132. [Google Scholar]
- Ryan, C.; Collins, J.; O’Neill, M. Grammatical evolution: Evolving programs for an arbitrary language. In Genetic Programming, EuroGP 1998; Banzhaf, W., Poli, R., Schoenauer, M., Fogarty, T.C., Eds.; Lecture Notes in Computer Science; Springer: Berlin/Heidelberg, Germany, 1998; Volume 1391. [Google Scholar]
- O’Neill, M.; Ryan, M.C. Evolving Multi-line Compilable C Programs. In Genetic Programming, EuroGP 1999; Poli, R., Nordin, P., Langdon, W.B., Fogarty, T.C., Eds.; Lecture Notes in Computer Science; Springer: Berlin/Heidelberg, Germany, 1999; Volume 1598. [Google Scholar]
- Brabazon, A.; O’Neill, M. Credit classification using grammatical evolution. Informatica 2006, 30, 325–335. [Google Scholar]
- Şen, S.; Clark, J.A. A grammatical evolution approach to intrusion detection on mobile ad hoc networks. In Proceedings of the Second ACM Conference on Wireless Network Security, Zurich, Switzerland, 16–19 March 2009. [Google Scholar]
- Tsoulos, I.G.; Lagaris, I.E. Solving differential equations with genetic programming. Genet. Program. Evolvable Mach. 2006, 7, 33–54. [Google Scholar] [CrossRef] [Scilit]
- Chen, L.; Tan, C.H.; Kao, S.J.; Wang, T.S. Improvement of remote monitoring on water quality in a subtropical reservoir by incorporating grammatical evolution with parallel genetic algorithms into satellite imagery. Water Res. 2008, 42, 296–306. [Google Scholar] [CrossRef] [Scilit] [PubMed]
- Tavares, J.; Pereira, F.B. Automatic Design of Ant Algorithms with Grammatical Evolution. In Genetic Programming, EuroGP 2012; Moraglio, A., Silva, S., Krawiec, K., Machado, P., Cotta, C., Eds.; Lecture Notes in Computer Science; Springer: Berlin/Heidelberg, Germany, 2012; Volume 7244. [Google Scholar]
- Ryan, C.; O’Neill, M.; Collins, J.J. Grammatical evolution: Solving trigonometric identities. In Proceedings of the 4th International Mendel Conference on Genetic Algorithms, Optimisation Problems, Fuzzy Logic, Neural Networks, Rough Sets, Brno, Czech Republic, 24–26 June 1998; Volume 98. [Google Scholar]
- Puente, A.O.; Alfonso, R.S.; Moreno, M.A. Automatic composition of music by means of grammatical evolution. In Proceedings of the APL ’02: 2002 Conference on APL: Array Processing Languages: Lore, Problems, and Applications, Madrid, Spain, 22–25 July 2002; pp. 148–155. [Google Scholar]
- Campo, L.M.L.; Oliveira, R.C.L.; Roisenberg, M. Optimization of neural networks through grammatical evolution and a genetic algorithm. Expert Syst. Appl. 2016, 56, 368–384. [Google Scholar] [CrossRef] [Scilit]
- Soltanian, K.; Ebnenasir, A.; Afsharchi, M. Modular Grammatical Evolution for the Generation of Artificial Neural Networks. Evol. Comput. 2022, 30, 291–327. [Google Scholar] [CrossRef] [Scilit] [PubMed]
- Galván-López, E.; Swafford, J.M.; O’Neill, M.; Brabazon, A. Evolving a Ms. PacMan Controller Using Grammatical Evolution. In Applications of Evolutionary Computation, EvoApplications 2010; Lecture Notes in Computer Science; Springer: Berlin/Heidelberg, Germany, 2010; Volume 6024. [Google Scholar]
- Shaker, N.; Nicolau, M.; Yannakakis, G.N.; Togelius, J.; O’Neill, M. Evolving levels for Super Mario Bros using grammatical evolution. In Proceedings of the 2012 IEEE Conference on Computational Intelligence and Games (CIG), Granada, Spain, 11–14 September 2012; pp. 304–311. [Google Scholar]
- Martínez-Rodríguez, D.; Colmenar, J.M.; Hidalgo, J.I.; Micó, R.J.V.; Salcedo-Sanz, S. Particle swarm grammatical evolution for energy demand estimation. Energy Sci. Eng. 2020, 8, 1068–1079. [Google Scholar] [CrossRef] [Scilit]
- Sabar, N.R.; Ayob, M.; Kendall, G.; Qu, R. Grammatical Evolution Hyper-Heuristic for Combinatorial Optimization Problems. IEEE Trans. Evol. Comput. 2013, 17, 840–861. [Google Scholar] [CrossRef] [Scilit]
- Ryan, C.; Kshirsagar, M.; Vaidya, G.; Cunningham, A.; Sivaraman, R. Design of a cryptographically secure pseudo random number generator with grammatical evolution. Sci. Rep. 2022, 12, 8602. [Google Scholar] [CrossRef] [Scilit] [PubMed]
- Pereira, P.J.; Cortez, P.; Mendes, R. Multi-objective Grammatical Evolution of Decision Trees for Mobile Marketing user conversion prediction. Expert Syst. Appl. 2021, 168, 114287. [Google Scholar] [CrossRef] [Scilit]
- Castejón, F.; Carmona, E.J. Automatic design of analog electronic circuits using grammatical evolution. Appl. Soft Comput. 2018, 62, 1003–1018. [Google Scholar] [CrossRef] [Scilit]
- Araujo, L.; Martinez-Romo, J.; Duque, A. Discovering taxonomies in Wikipedia by means of grammatical evolution. Soft Comput. 2018, 22, 2907–2919. [Google Scholar] [CrossRef] [Scilit]
- Martín, C.; Quintana, D.; Isasi, P. Grammatical Evolution-based ensembles for algorithmic trading. Appl. Soft Comput. 2019, 84, 105713. [Google Scholar] [CrossRef] [Scilit]
- Moore, J.H.; Sipper, M. Grammatical Evolution Strategies for Bioinformatics and Systems Genomics. In Handbook of Grammatical Evolution; Ryan, C., O’Neill, M., Collins, J., Eds.; Springer: Cham, Switzerland, 2018. [Google Scholar] [CrossRef] [Scilit]
- Hidalgo, J.I.; Colmenar, J.M.; Risco-Martin, J.L.; Cuesta-Infante, A.; Maqueda, E.; Botella, M.; Rubio, J.A. Modeling glycemia in humans by means of grammatical evolution. Appl. Soft Comput. 2014, 20, 40–53. [Google Scholar] [CrossRef] [Scilit]
- Tsoulos, I.G. Creating classification rules using grammatical evolution. Int. J. Comput. Intell. Stud. 2020, 9, 161–171. [Google Scholar] [CrossRef] [Scilit]
- Anastasopoulos, N.; Tsoulos, I.G.; Tzallas, A. GenClass: A parallel tool for data classification based on Grammatical Evolution. SoftwareX 2021, 16, 100830. [Google Scholar] [CrossRef] [Scilit]
- Spyrou, E.D.; Stylios, C.; Tsoulos, I. Classification of CO Environmental Parameter for Air Pollution Monitoring with Grammatical Evolution. Algorithms 2023, 16, 300. [Google Scholar] [CrossRef] [Scilit]
- Margariti, S.V.; Tsoulos, I.G.; Kiousi, E.; Stergiou, E. Traffic Classification in Software-Defined Networking Using Genetic Programming Tools. Future Internet 2024, 16, 338. [Google Scholar] [CrossRef] [Scilit]
- O’Neill, M.; Ryan, C.; Keijzer, M.; Cattolico, M. Crossover in Grammatical Evolution. Genet. Program. Evolvable Mach. 2003, 4, 67–93. [Google Scholar] [CrossRef] [Scilit]
- Harper, R.; Blair, A. A Structure Preserving Crossover in Grammatical Evolution. In Proceedings of the 2005 IEEE Congress on Evolutionary Computation (CEC), Edinburgh, UK, 2–5 September 2005; pp. 2537–2544. [Google Scholar]
- Tsoulos, I.G.; Charilogis, V.; Tsalikakis, D. Local Crossover: A New Genetic Operator for Grammatical Evolution. Algorithms 2024, 17, 461. [Google Scholar] [CrossRef] [Scilit]
- Lozano, M.; Herrera, F.; Krasnogor, N.; Molina, D. Real-Coded Memetic Algorithms with Crossover Hill-Climbing. Evol. Comput. 2004, 12, 273–302. [Google Scholar] [CrossRef] [Scilit] [PubMed]
- Kelly, M.; Longjohn, R.; Nottingham, K. The UCI Machine Learning Repository. Available online: https://archive.ics.uci.edu (accessed on 9 November 2026).
- Alcalá-Fdez, J.; Fernandez, A.; Luengo, J.; Derrac, J.; García, S.; Sánchez, L.; Herrera, F. KEEL Data-Mining Software Tool: Data Set Repository, Integration of Algorithms and Experimental Analysis Framework. J. -Mult.-Valued Log. Soft Comput. 2011, 17, 255–287. [Google Scholar]
- Tzimourta, K.D.; Tsoulos, I.; Bilero, I.T.; Tzallas, A.T.; Tsipouras, M.G.; Giannakeas, N. Direct Assessment of Alcohol Consumption in Mental State Using Brain Computer Interfaces and Grammatical Evolution. Inventions 2018, 3, 51. [Google Scholar] [CrossRef] [Scilit]
- Weiss, S.M.; Kulikowski, C.A. Computer Systems That Learn: Classification and Prediction Methods from Statistics, Neural Nets, Machine Learning, and Expert Systems; Morgan Kaufmann Publishers Inc.: Burlington, MA, USA, 1991. [Google Scholar]
- Banu, P.K. Feature Engineering for Epileptic Seizure Classification Using SeqBoostNet. Int. J. Comput. Digit. Syst. 2024, 16, 1–14. [Google Scholar] [CrossRef] [Scilit]
- Demiroz, G.; Govenir, H.A.; Ilter, N. Learning Differential Diagnosis of Eryhemato-Squamous Diseases using Voting Feature Intervals. Artif. Intell. Med. 1998, 13, 147–165. [Google Scholar] [CrossRef] [Scilit] [PubMed]
- Prechelt, L. PROBEN1—A Set of Neural Network Benchmark Problems and Benchmarking Rules; Technical Report 21/94; Fakultät für Informatik, Universität Karlsruhe: Karlsruhe, Germany, 1994. [Google Scholar]
- Hayes-Roth, B.; Hayes-Roth, F. Concept learning and the recognition and classification of exemplars. J. Verbal Learn. Verbal Behav. 1977, 16, 321–338. [Google Scholar] [CrossRef] [Scilit]
- Hepatitis [Data Set]. UCI Machine Learning Repository. 1983. Available online: https://archive.ics.uci.edu/dataset/46/hepatitis (accessed on 9 November 2026).
- Congressional Voting Records [Data Set]. UCI Machine Learning Repository. 1987. Available online: https://archive.ics.uci.edu/dataset/105/congressional+voting+records (accessed on 9 November 2026).
- Dy, J.G.; Brodley, C.E. Feature Selection for Unsupervised Learning. J. Mach. Learn. Res. 2004, 5, 845–889. [Google Scholar]
- Perantonis, S.J.; Virvilis, V. Input Feature Extraction for Multilayered Perceptrons Using Supervised Principal Component Analysis. Neural Process. Lett. 1999, 10, 243–252. [Google Scholar] [CrossRef] [Scilit]
- Cestnik, G.; Konenenko, I.; Bratko, I. Assistant-86: A Knowledge-Elicitation Tool for Sophisticated Users. In Progress in Machine Learning; Bratko, I., Lavrac, N., Eds.; Sigma Press: Wilmslow, UK, 1987; pp. 31–45. [Google Scholar]
- Olave, M.; Rajkovic, V.; Bohanec, M. An application for admission in public school systems. Expert Syst. Public Adm. 1989, 1, 145–160. [Google Scholar]
- Kaynak, C. Methods of Combining Multiple Classifiers and Their Applications to Handwritten Digit Recognition. Unpublished Master’s Thesis, Bogazici University, Istanbul, Turkey, 1995. [Google Scholar]
- Alpaydin, E.; Alimoglu, F. Pen-Based Recognition of Handwritten Digits. UCI Machine Learning Repository. 1998. Available online: https://archive.ics.uci.edu/dataset/81/pen+based+recognition+of+handwritten+digits (accessed on 9 November 2026).
- Blayo, F.; Cheneval, Y.; Guérin-Dugué, A.; Chentouf, R.; Avilés-Cruz, C.; Madrenas, J.; Moreno, M.; Voz, J.L. Deliverable R3-B4-P—Task B4: Benchmarks; Technical Report, ELENA-Nerves II: Enhanced Learning for Evolutive Neural Architectures, ESPRIT Basic Research Project No. 6891; European Commission: Brussels, Belgium, 1995. [Google Scholar]
- Emad-Ud-Din, M.; Wang, Y. Promoting occupancy detection accuracy using on-device lifelong learning. IEEE Sens. J. 2023, 23, 9595–9606. [Google Scholar] [CrossRef] [Scilit]
- Srinivasan, A. Statlog (Landsat Satellite). UCI Machine Learning Repository. 1993. Available online: https://archive.ics.uci.edu/dataset/146/statlog+landsat+satellite (accessed on 9 November 2026).
- Dash, M.; Liu, H.; Scheuermann, P.; Tan, K.L. Fast hierarchical clustering and its validation. Data Knowl. Eng. 2003, 44, 109–138. [Google Scholar] [CrossRef] [Scilit]
- Statlog (Shuttle) [Data Set]. (n.d.). UCI Machine Learning Repository. Available online: https://archive.ics.uci.edu/dataset/148/statlog+shuttle (accessed on 9 November 2026).
- Hopkins, M.; Reeber, E.; Forman, G.; Suermondt, J. Spambase. UCI Machine Learning Repository. 1999. Available online: https://archive.ics.uci.edu/dataset/94/spambase (accessed on 9 November 2026).
- Gavrilis, D.; Tsoulos, I.G.; Dermatas, E. Selecting and constructing features using grammatical evolution. Pattern Recognit. Lett. 2008, 29, 1358–1365. [Google Scholar] [CrossRef] [Scilit]
- Cortez, P.; Silva, A.M.G. Using data mining to predict secondary school student performance. In Proceedings of the 5th FUture BUsiness TEChnology Conference (FUBUTEC 2008), EUROSIS-ETI, Porto, Portugal, 9–11 April 2008; pp. 5–12. [Google Scholar]
- Molecular Biology (Splice-Junction Gene Sequences) [Data Set]. UCI Machine Learning Repository. 1991. Available online: https://archive.ics.uci.edu/dataset/69/molecular+biology+splice+junction+gene+sequences (accessed on 9 November 2026).
- KEEL Project. (n.d.). Texture [Data Set]. University of Granada. Available online: https://sci2s.ugr.es/keel/dataset.php?cod=72 (accessed on 9 November 2026).
- Quinlan, R. Thyroid Disease. UCI Machine Learning Repository. 1986. Available online: https://archive.ics.uci.edu/dataset/102/thyroid+disease (accessed on 9 November 2026).
- Breiman, L. Bias, Variance, and Arcing Classifiers; Technical Report 460; Statistics Department, University of California, Berkeley: Berkeley, CA, USA, 1996. [Google Scholar]
- Siebert, J.P. Turing Institute Research Memorandum TIRM-87-018; Vehicle Recognition Using Rule Based Methods. Turing Institute: Glasgow, UK, 1987.
- Horton, P.; Nakai, K. A Probabilistic Classification System for Predicting the Cellular Localization Sites of Proteins. In Proceedings of the Fourth International Conference on Intelligent Systems for Molecular Biology (ISMB), St. Louis, MO, USA, 12–15 June 1996; pp. 109–115. [Google Scholar]
- Andrzejak, R.G.; Lehnertz, K.; Mormann, F.; Rieke, C.; David, P.; Elger, C.E. Indications of nonlinear deterministic and finite-dimensional structures in time series of brain electrical activity: Dependence on recording region and brain state. Phys. Rev. E 2001, 64, 061907. [Google Scholar] [CrossRef] [Scilit] [PubMed]
- Tzallas, A.T.; Tsipouras, M.G.; Fotiadis, D.I. Automatic Seizure Detection Based on Time-Frequency Analysis and Artificial Neural Networks. Comput. Intell. Neurosci. 2007, 2007, 80510. [Google Scholar] [CrossRef] [Scilit] [PubMed]
- Tsoulos, I.G.; Varvaras, I.; Charilogis, V. RbfCon: Construct radial basis function neural networks with grammatical evolution. Software 2024, 3, 549–568. [Google Scholar] [CrossRef] [Scilit]
- Breiman, L.; Friedman, J.H.; Olshen, R.A.; Stone, C.J. Classification and Regression Trees; Wadsworth International Group: Belmont, CA, USA, 1984. [Google Scholar]
- Kecman, V. Support vector machines–An introduction. In Support Vector Machines: Theory and Applications; Springer: Berlin/Heidelberg, Germany, 2005; pp. 1–47. [Google Scholar]
- Chang, C.-C.; Lin, C.-J. LIBSVM: A library for support vector machines. Acm Trans. Intell. Syst. Technol. 2011, 2, 27. [Google Scholar] [CrossRef] [Scilit]
- Park, J.; Sandberg, I.W. Universal Approximation Using Radial-Basis-Function Networks. Neural Comput. 1991, 3, 246–257. [Google Scholar] [CrossRef] [Scilit] [PubMed]
- Montazer, G.A.; Giveki, D.; Karami, M.; Rastegar, H. Radial basis function neural networks: A review. Comput. Rev. J. 2018, 1, 52–74. [Google Scholar]
- Stanley, K.O.; Miikkulainen, R. Evolving Neural Networks through Augmenting Topologies. Evol. Comput. 2002, 10, 99–127. [Google Scholar] [CrossRef] [Scilit] [PubMed]
- Ward, R.; Wu, X.; Bottou, L. Adagrad stepsizes: Sharp convergence over nonconvex landscapes. J. Mach. Learn. Res. 2020, 21, 1–30. [Google Scholar]
- Kingma, D.P.; Ba, J.L. ADAM: A method for stochastic optimization. In Proceedings of the 3rd International Conference on Learning Representations (ICLR 2015), San Diego, CA, USA, 7–9 May 2015; pp. 1–15. [Google Scholar]
- Powell, M.J.D. A Tolerant Algorithm for Linearly Constrained Optimization Calculations. Math. Program. 1989, 45, 547–566. [Google Scholar] [CrossRef] [Scilit]
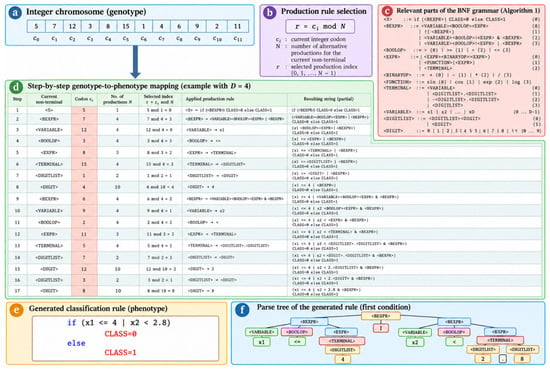
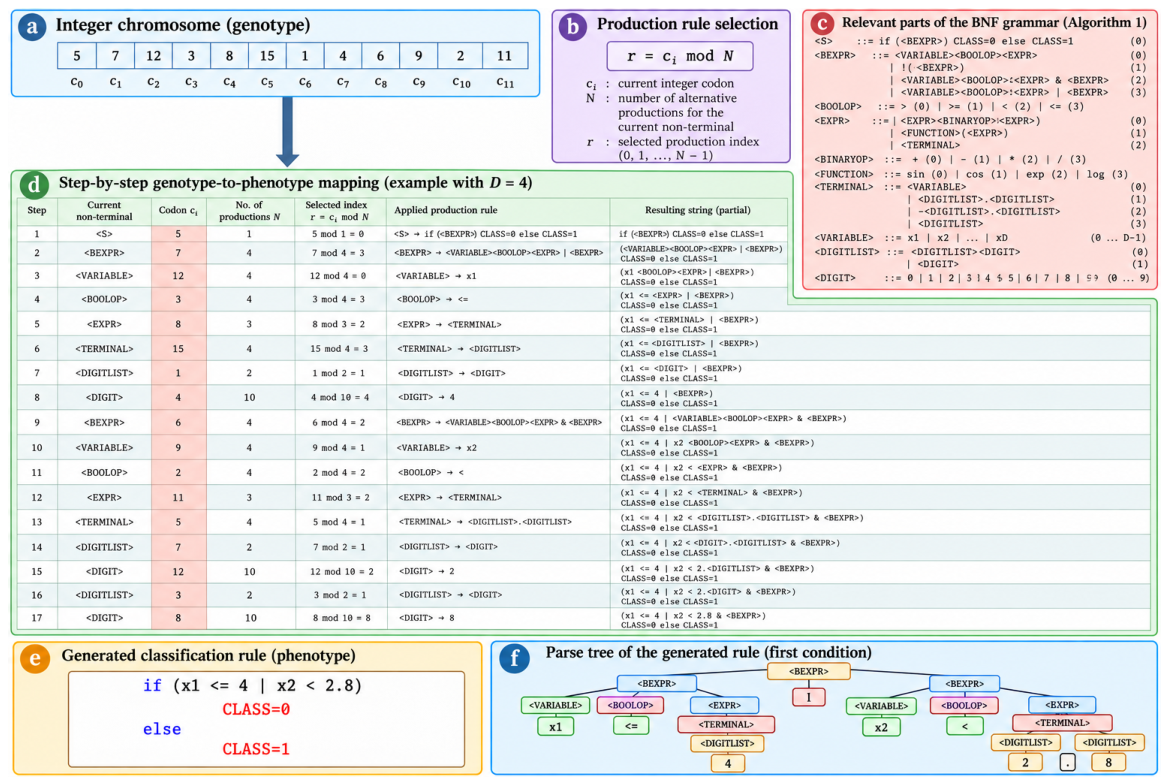
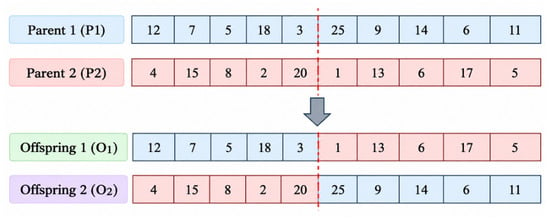
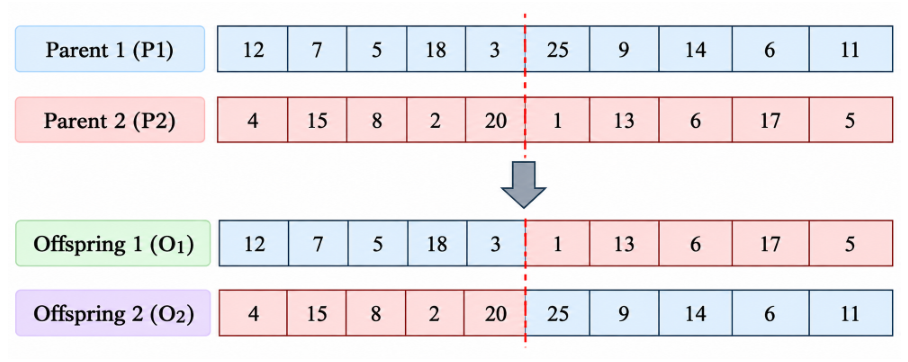
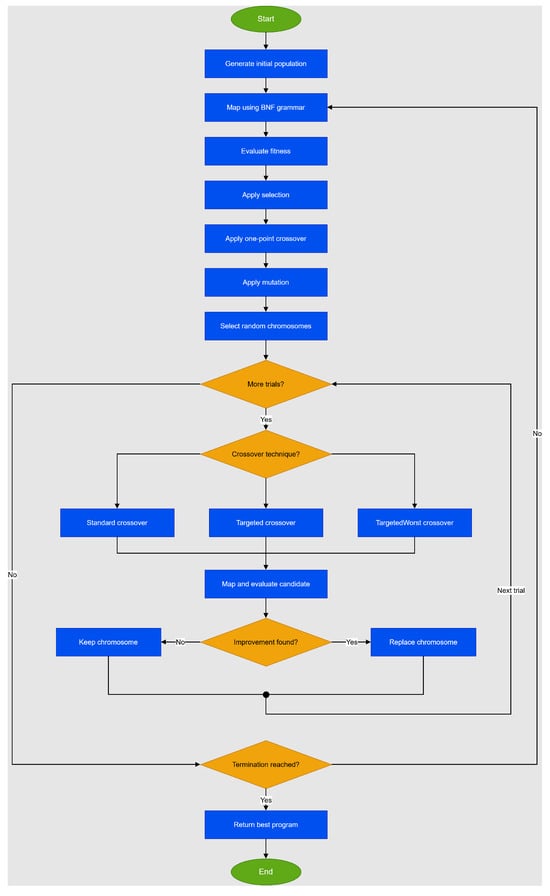
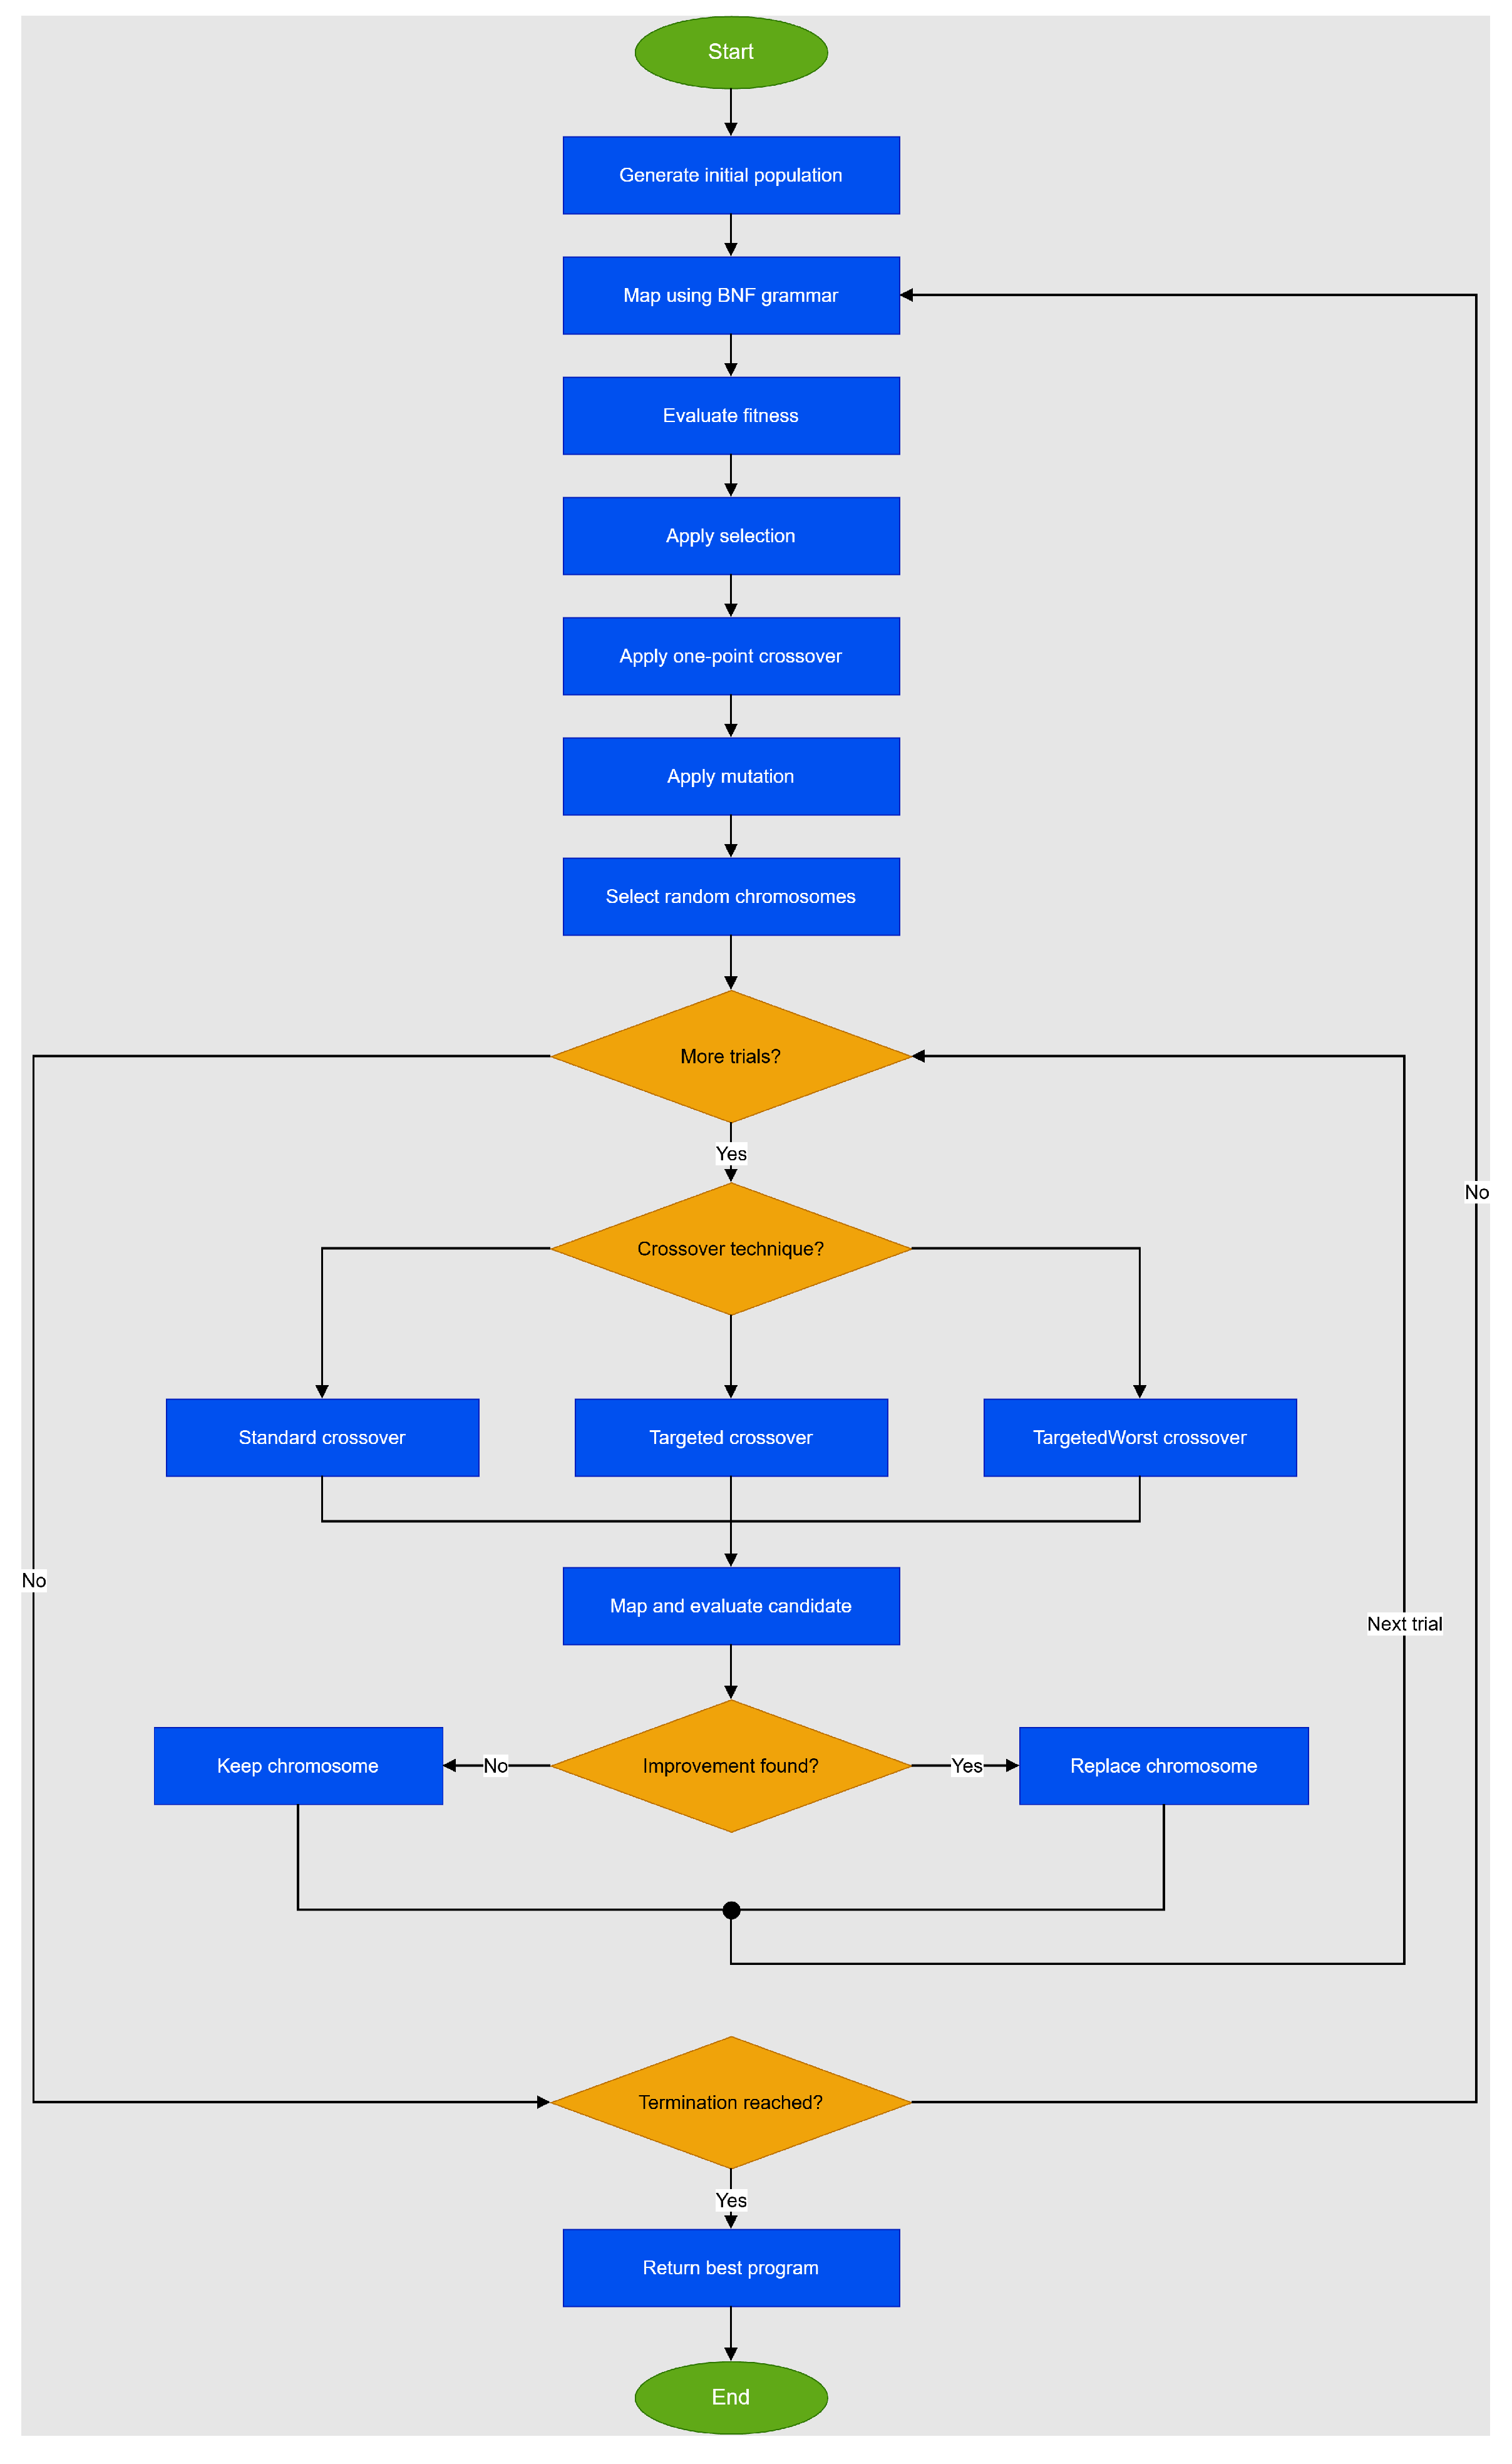
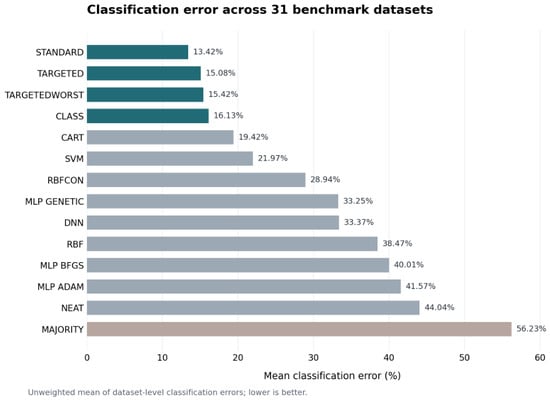
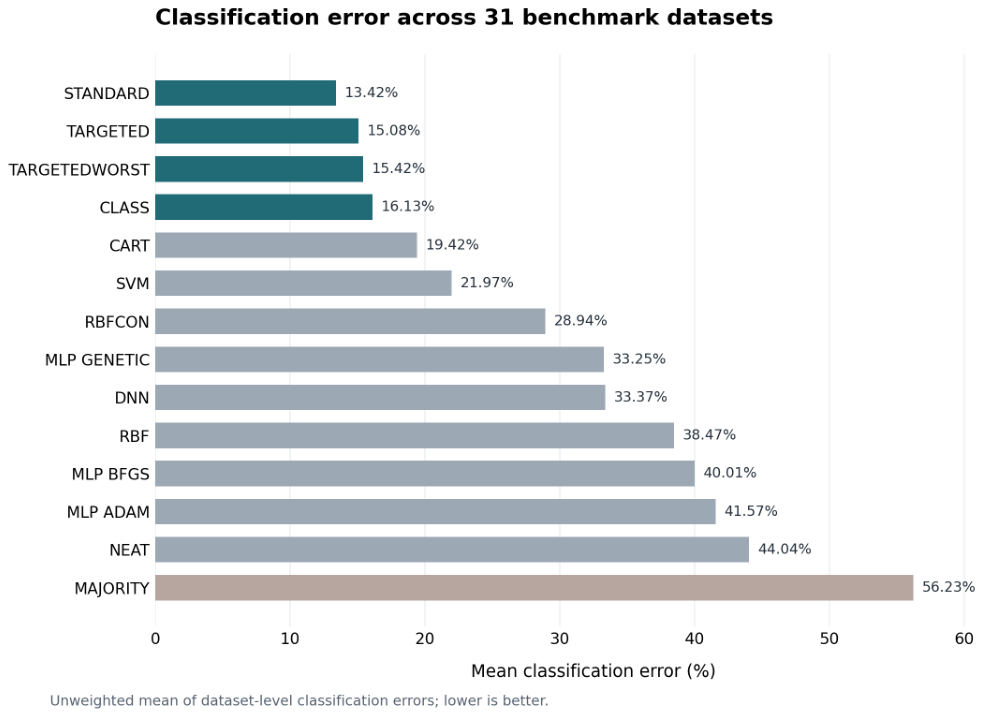
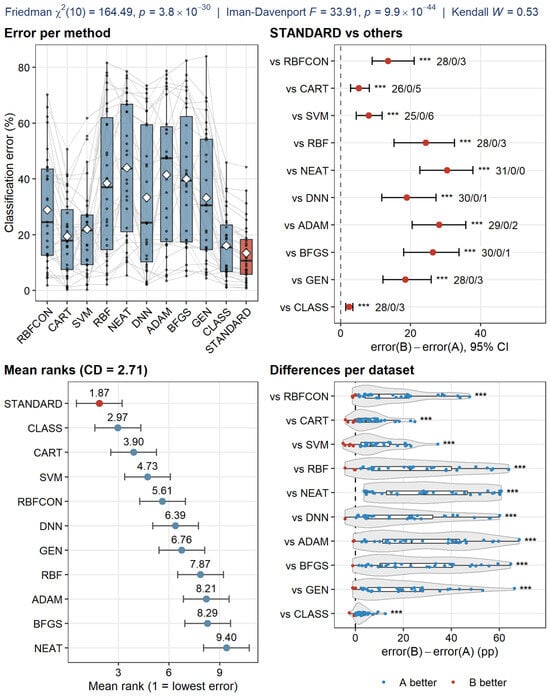
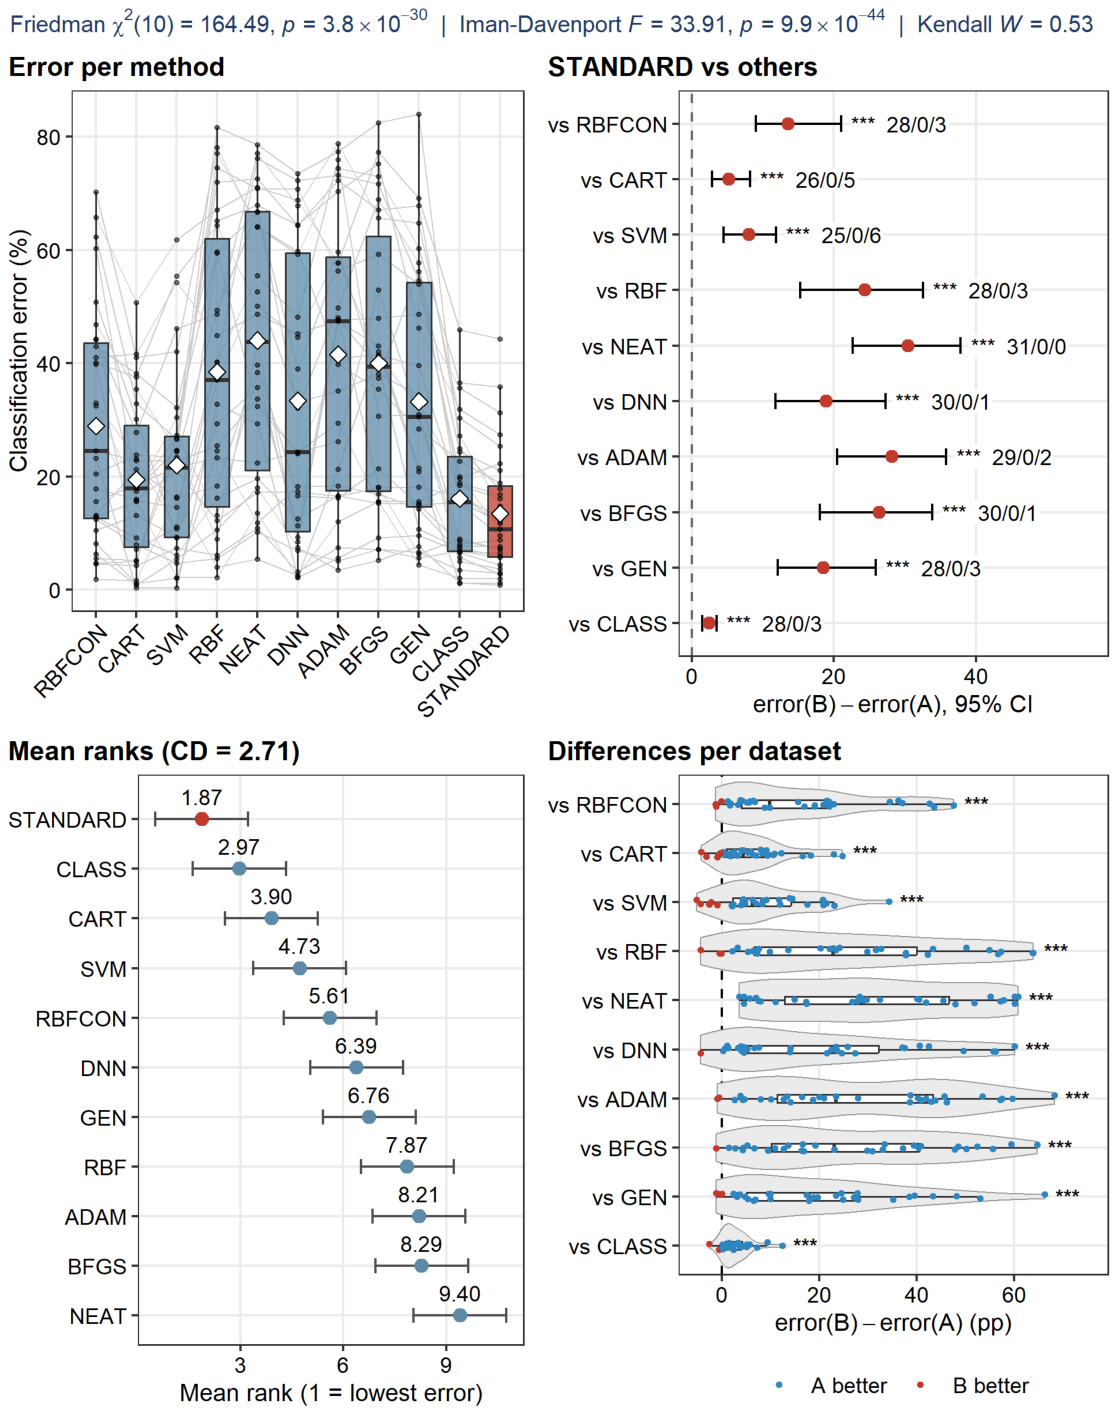
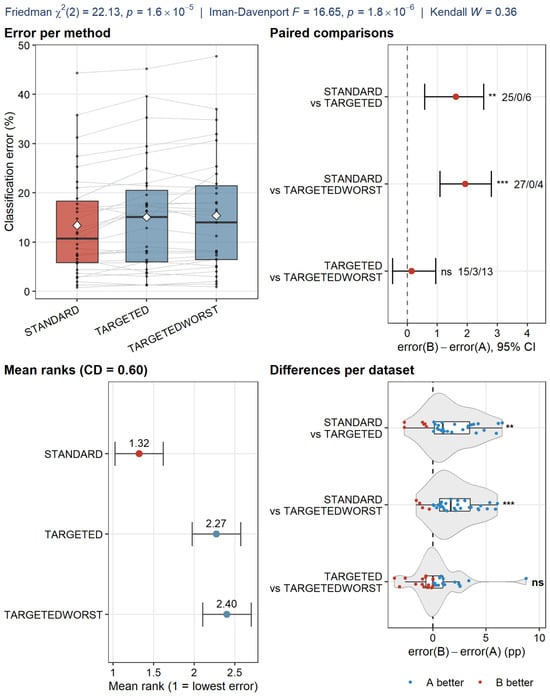
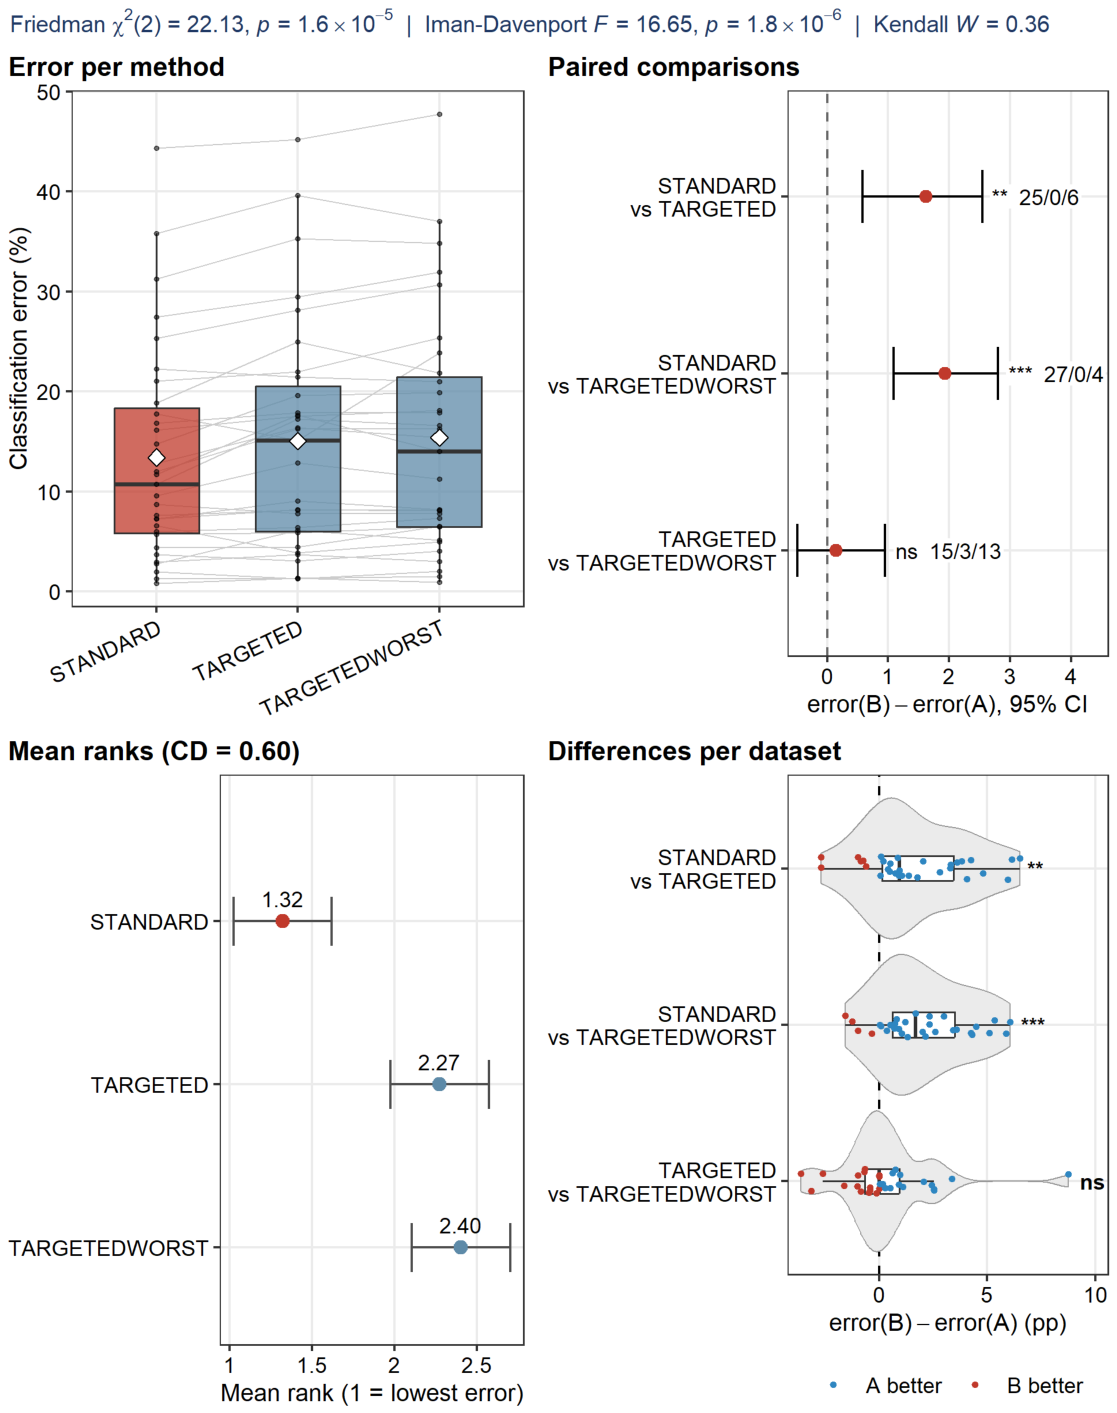
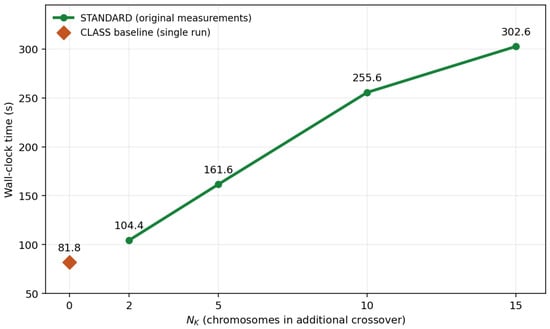
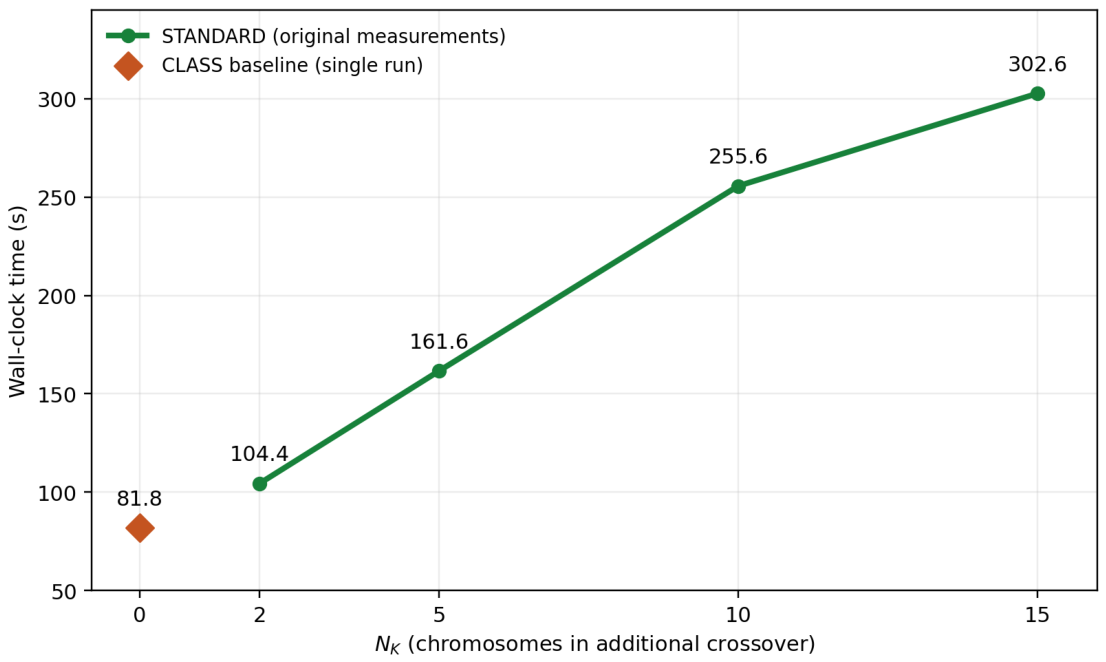
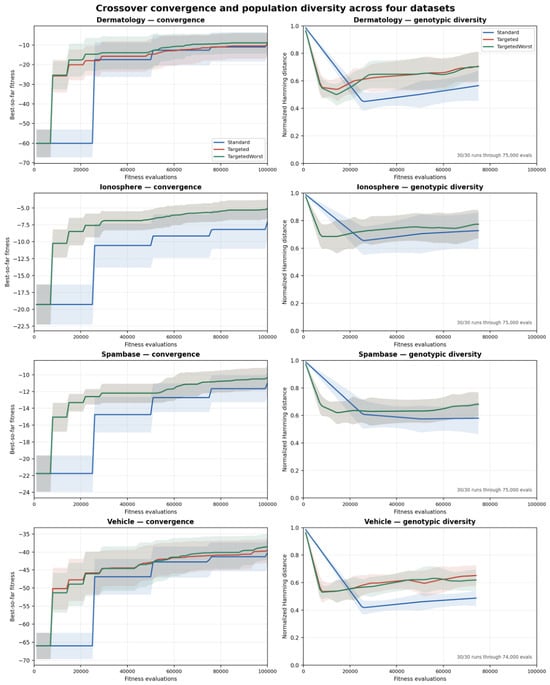
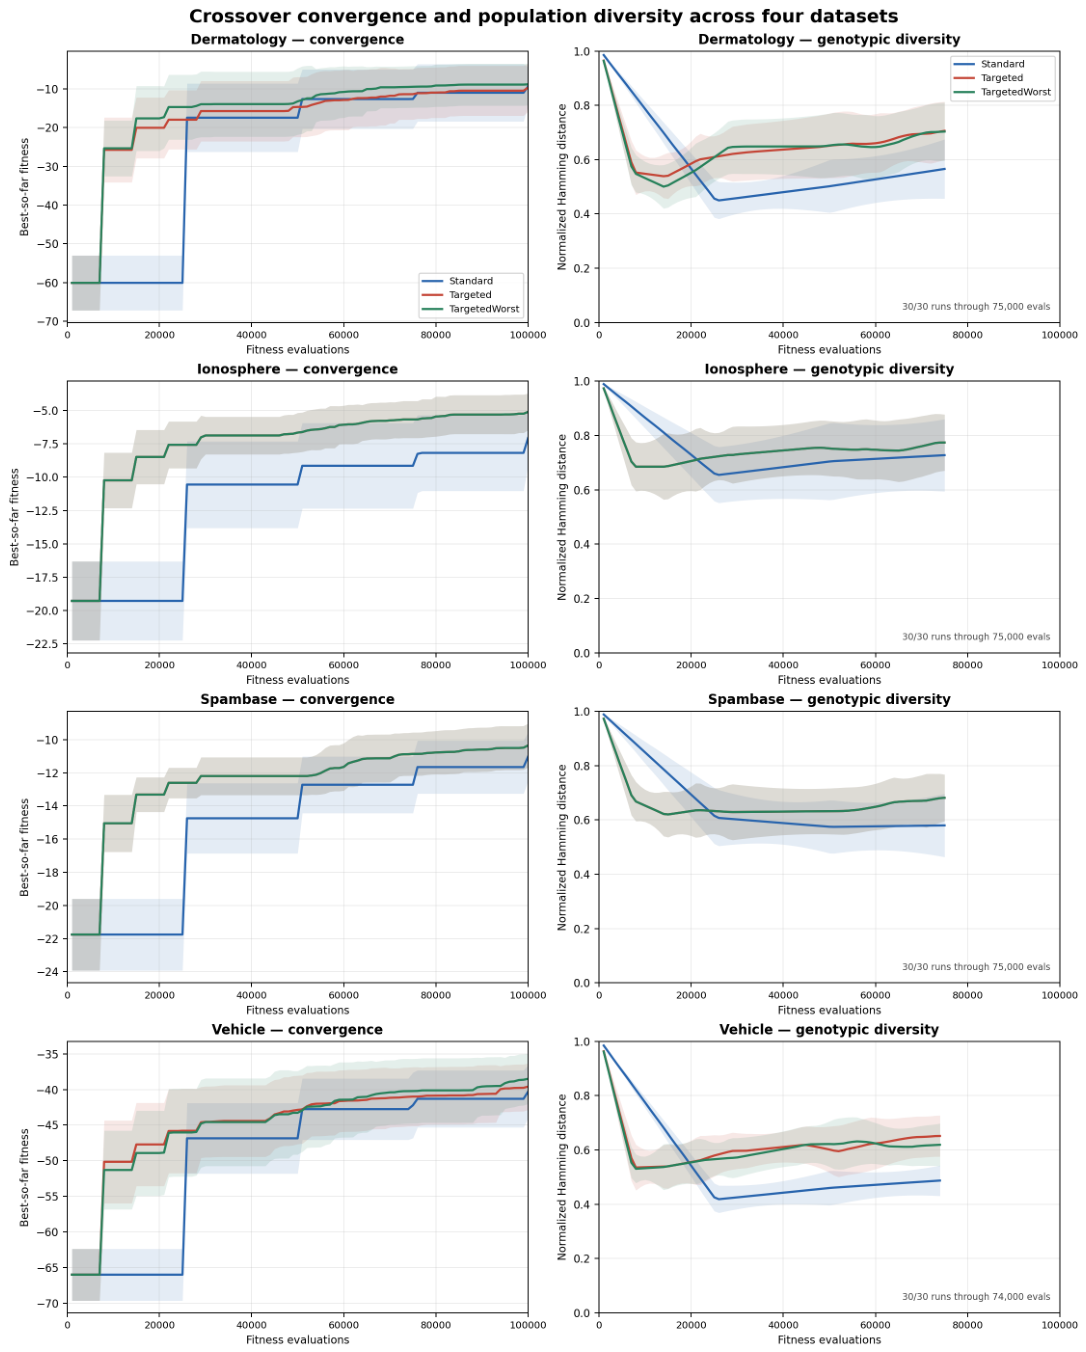
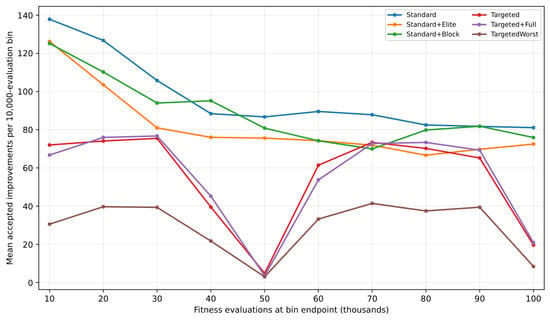
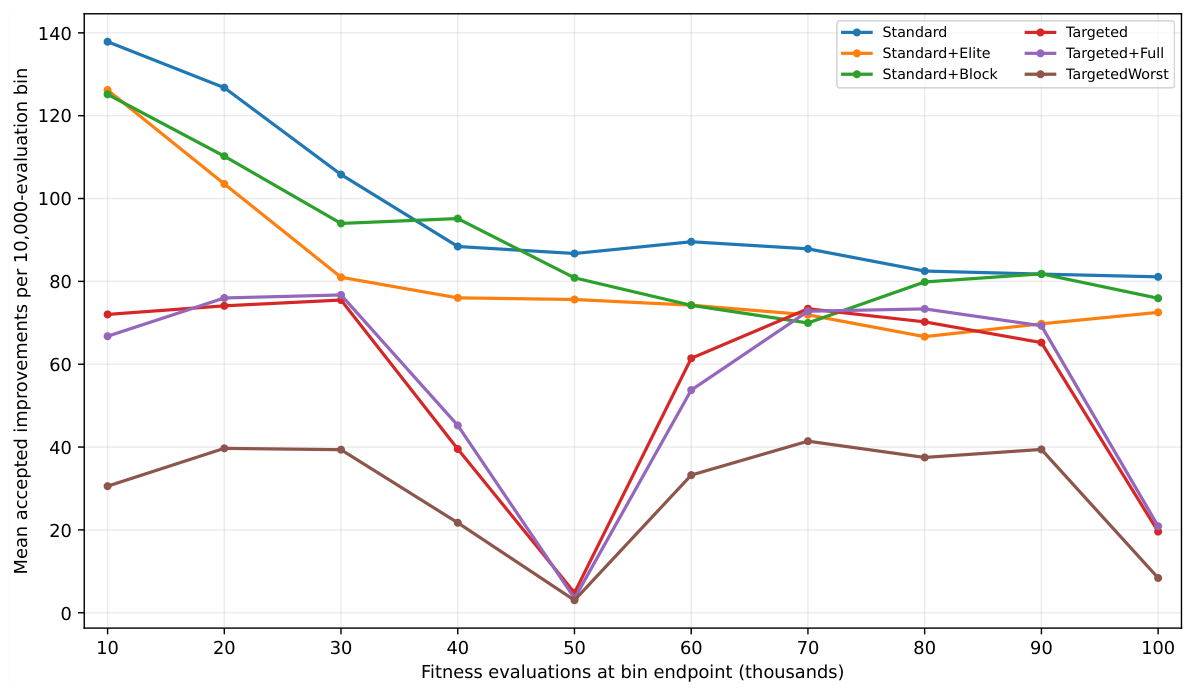
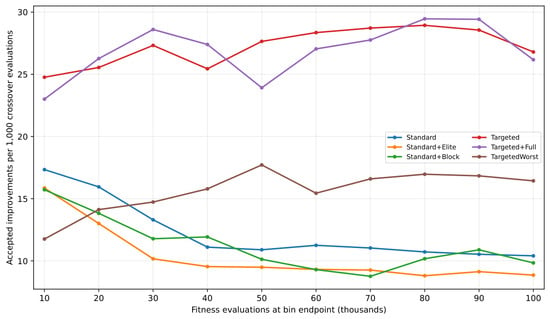
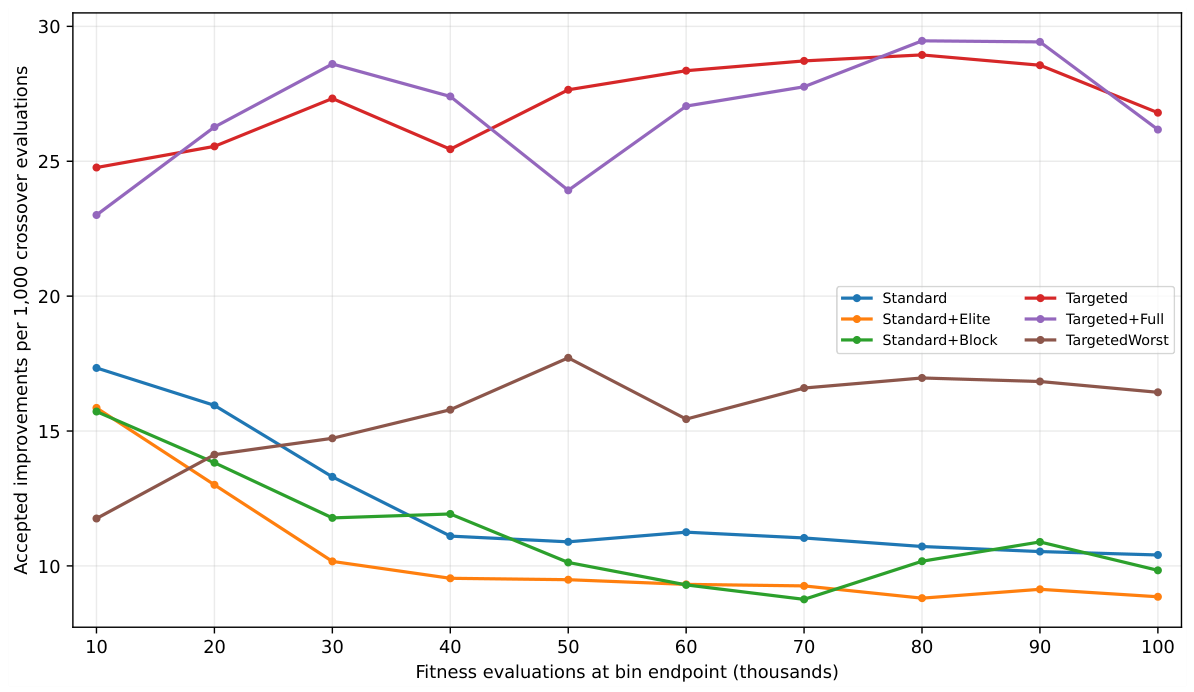

Disclaimer/Publisher’s Note: The statements, opinions and data contained in all publications are solely those of the individual author(s) and contributor(s) and not of MDPI and/or the editor(s). MDPI and/or the editor(s) disclaim responsibility for any injury to people or property resulting from any ideas, methods, instructions or products referred to in the content. |
© 2026 by the authors. Licensee MDPI, Basel, Switzerland. This article is an open access article distributed under the terms and conditions of the Creative Commons Attribution (CC BY) license.