


Abstract
Distinguishing malignant pulmonary lesions from benign nodules, infection-related abnormalities, and normal findings remains difficult because structural and metabolic imaging patterns overlap. This study presents a multi-textural feature-fusion framework for four-class classification using independent computed tomography (CT) and positron emission tomography (PET) cohorts comprising 1213 CT and 1013 PET images. Most patients contributed one representative image and some contributed two; known same-patient images were kept together when linkage was available, but complete linkage was not retained after de-identification, so the protocol is described as hybrid and partially patient-aware. Original images were complemented by DCT-based illumination-normalized representations and one-level stationary-wavelet representations, and the two transformed branches were combined through DWT-based multi-textural fusion before NNMF, multi-backbone integration, mRMR selection, and multiclass SVM classification. The best PET model achieved 0.930 accuracy, 0.885 macro F1-score, and 0.868 MCC; the corresponding CT values were 0.878, 0.781 macro F1-score, and 0.759 MCC. Benign findings remained the least stable category. Higher PET performance reflects these independent institutional cohorts and display-image inputs and should not be interpreted as intrinsic superiority of PET over CT. The study remains limited to representative two-dimensional images and internal validation.
1. Introduction
Lung cancer remains one of the leading causes of cancer death worldwide, and its burden is expected to remain substantial as populations age and tobacco-related risk persists in many regions [1,2]. Low-dose CT screening reduces lung-cancer mortality in appropriately selected high-risk populations, although its clinical value depends on accurate interpretation of screen-detected pulmonary findings [3,4]. Because screening identifies indeterminate pulmonary abnormalities rather than only proven cancers, the initial imaging problem extends beyond cancer detection alone [3,4]. Suspicious findings must be distinguished from benign nodules, infection-related abnormalities, inflammatory change, and normal anatomy before the next diagnostic or surveillance step is selected [4,5,6].
This distinction is difficult on both CT and PET because benign, inflammatory, and malignant processes can share structural or metabolic appearances [4,7,8]. Margin irregularity, attenuation change, ground-glass opacity, consolidation, and parenchymal distortion can occur across malignant and non-malignant thoracic disease [4,5,6,9]. Increased fluorodeoxyglucose uptake is likewise not specific to cancer because active infection and inflammation may also be metabolically avoided [7,8]. Misclassification can delay definitive cancer management or expose patients without malignancy to avoidable biopsy, surgery, or prolonged surveillance [3,4].
Computer-aided diagnosis research has addressed pulmonary nodule detection, malignancy assessment, subtype classification, staging, and outcome prediction [5,6,9,10,11,12]. Public resources such as LIDC-IDRI and LUNA16 established reproducible CT benchmarks for pulmonary nodule analysis [10,11]. Multi-scale convolutional networks, transfer-learning pipelines, and transformer-based models subsequently improved representation learning for lung nodules and cancer-related tasks [5,6,9,12]. Many of these systems use binary labels, lesion-centered crops, or cancer-specific categories rather than a broad differential diagnosis [5,6,9,12]. Consequently, benign disease and infection-related mimics of malignancy are often not preserved as separate targets [5,6,9].
PET and paired PET/CT studies have examined histologic subtype, occult nodal metastasis, pulmonary nodule malignancy, hypermetabolic lesion assessment, and treatment response [13,14,15,16,17]. Quantitative PET radiomics has also been evaluated for visceral pleural invasion and response to neoadjuvant therapy [18,19]. These approaches commonly rely on paired examinations, registered volumes, lesion masks, or standardized uptake measurements [13,14,15,16,17,18,19]. Such studies demonstrate the value of anatomical-metabolic integration but also depend on data structures that are not available in every retrospective archive [13,14,15,16,17]. In the present archive, reliable patient-level linkage between CT and PET examinations and native SUV-normalized PET volumes were not available, so CT and PET were analyzed as independent modality-specific cohorts rather than as a paired multimodal model [13,14,15].
The transform branches were selected from established texture-analysis methods that describe complementary frequency and multiresolution image structure [20,21,22,23,24]. The proposed pipeline uses a block-wise DCT procedure that performs local illumination and contrast normalization, together with a one-level stationary-wavelet representation that retains spatial alignment across multiscale approximation and directional detail subbands [20,21,22,23,24]. The DCT- and SWT-derived branches are each passed through the three CNN backbones; the resulting pooled DCT- and SWT-branch feature vectors are concatenated and fused through a one-level Haar DWT before multi-backbone integration. Inception-v3, ResNet101, and DenseNet201 provide complementary multi-scale, residual, and densely connected representations [25,26,27], after which NNMF reduces the fused feature space and mRMR ranks variables according to relevance and redundancy [28].
Recent deep-learning studies further illustrate the breadth of successful medical-imaging applications [29,30,31,32,33]. Vision Transformer models have been used for accurate and explainable brain-tumor MRI classification [29]. Large-scale YOLO comparisons have evaluated ischemic-stroke lesion localization on diffusion-weighted imaging [30]. Attention-gated hybrid networks have also been developed for precise ischemic-stroke segmentation [31]. Real-time YOLO-based systems have been investigated for colorectal-polyp detection across independent colonoscopy datasets [32]. In thoracic imaging, robust artificial-intelligence frameworks have been reported for lung-cancer subtyping and malignancy detection on CT [33].
The study addresses four questions. First, can a shared four-class structure separate benign, infectious, malignant, and normal findings in independent CT and PET cohorts? Second, do DCT and SWT add information beyond original-image CNN features? Third, does staged multi-backbone fusion with NNMF and mRMR improve compact representations? Fourth, how does performance change between CT morphology and PET display-image appearance under the documented hybrid, partially patient-aware partitioning protocol? The analysis is limited to representative two-dimensional images and is not presented as volumetric diagnosis, quantitative PET radiomics, or paired PET/CT fusion.
2. Related Work
2.1. CT-Based Lung Imaging Models
CT has been the main source of lung CAD research because it depicts lesion morphology, internal density, surrounding parenchyma, and anatomical context at high spatial resolution. LIDC-IDRI established a widely used reference database for pulmonary nodules, and LUNA16 provided a common framework for comparing detection algorithms [10,11]. Multi-scale CNNs subsequently showed that combining receptive fields of different sizes could improve nodule classification [12]. These studies shaped current lung CT pipelines, but their labels and evaluation units are usually lesion-centered rather than based on a four-class clinical differential.
Recent work has explored several architectural directions. Memory-efficient attention has been investigated for resource-constrained nodule classification, while Gabor-enhanced deep belief networks have combined learned and handcrafted texture descriptors [34,35]. Explainable transfer learning, SE-ResNeXt variants, vision transformers, and other optimized CNN designs have reported strong results for lung cancer classification [5,6,9,36]. Broader comparative studies have examined deep classifiers across lung cancer and pulmonary disease datasets, including models optimized for screening efficiency and compact feature learning [37,38,39]. Direct comparison across these reports remains difficult because public image collections, lesion crops, class balance, data augmentation, and validation procedures differ.
The disease spectrum also affects the difficulty of the task. CT models trained only to separate cancer from normal tissue do not encounter the same ambiguity as systems that include benign nodules and infection-related findings. Chronic pulmonary aspergillosis, for example, can produce CT appearances that overlap with malignancy and has required dedicated subtype classification models [40]. Multi-disease chest imaging studies similarly show that consolidation, nodules, atelectatic change, and other thoracic findings often coexist or share visual features [41,42,43]. Although chest radiography and CT are not interchangeable, this literature supports the use of clinically distinct non-malignant classes rather than treating every abnormal image as a single category.
2.2. PET, PET/CT, and Multimodal Pulmonary Assessment
PET contributes metabolic information that can complement CT morphology, but increased uptake is not specific to malignancy. Systematic reviews of FDG PET radiomics show continued interest in histologic subtype classification, while peritumoral and nodal features have been studied for invasion and treatment-response prediction [7,8,18,19]. Deep learning has also been used to reduce noise in ultra-fast lung PET, illustrating that PET-oriented AI encompasses reconstruction and acquisition as well as classification [44].
True multimodal models generally assume paired CT and PET data. Pixel-level fusion has been investigated for lung-cancer-oriented classification, and cross-modal signatures have been developed for occult nodal metastasis [14,45]. One-shot neural architecture search and intermediate-fusion networks have also been applied to lung nodule or non-small-cell lung cancer subtype classification using multimodal inputs [13,15]. Other studies have addressed solitary pulmonary nodule malignancy, spread through air spaces, nodal metastasis, hypermetabolic pulmonary lesion diagnosis, thoracic staging, intratumoral heterogeneity, and treatment response [16,17,46,47,48,49,50].
These studies address different problems from the proposed framework. Paired PET/CT systems can learn anatomical-metabolic correspondence, whereas the present study contains independent CT and PET cohorts. Quantitative PET studies operate on native reconstructed data and standardized uptake values; the present PET branch operates on archived color-mapped display images. Its results therefore describe classification from institutional display appearance, not quantitative metabolic modeling.
2.3. Texture Representations and Hybrid Feature Fusion
Texture analysis remains relevant because pulmonary lesions differ not only in shape but also in internal heterogeneity, edge organization, and multiscale spatial structure. SWT preserves image dimensions while separating approximation and directional detail information and has been used in medical image fusion and signal denoising [20,21]. DCT can represent an image through spatial-frequency coefficients, though in the present implementation only the DC coefficient was modified for local illumination normalization; DCT-based approaches have been applied to medical image classification and automated texture analysis more broadly [22,23,24]. Neither transform is novel in isolation. In the proposed framework, these transforms provide complementary inputs before deep feature extraction rather than serving as standalone classifiers.
The three selected CNNs encode different inductive biases. Inception-v3 combines parallel filters at several scales, ResNet101 stabilizes deep optimization through residual connections, and DenseNet201 promotes feature reuse through dense connectivity [25,26,27]. Concatenating their outputs produces a high-dimensional representation that can contain correlated or weakly informative variables. NNMF supplies an additive low-dimensional embedding, after which mRMR ranks features by relevance to the class label and redundancy with previously selected variables [28].
Validation design is particularly important in retrospective medical imaging. Random image-level division can produce optimistic estimates when several samples from one patient enter different subsets [51]. In the present archive, most patients contributed one representative image and a smaller number contributed two. When de-identified linkage was available, known same-patient images were kept together; however, complete linkage was not retained for the entire archive. The partitioning strategy is therefore hybrid and partially patient-aware and cannot be claimed to be rigorously patient-disjoint.
2.4. Algorithmic Position
The proposed framework occupies a narrower position than paired PET/CT fusion systems and a broader diagnostic position than binary nodule classifiers. It applies the same benign, infectious, malignant, and normal label structure to two independent modalities, combines original and transformed image representations, and evaluates the feature-processing stages under a hybrid, partially patient-aware partitioning protocol. The design permits a within-study comparison of CT and PET display-image behavior, but it does not claim volumetric lesion detection, quantitative SUV analysis, cross-modal registration, prospective clinical deployment, or a controlled proof that one modality is intrinsically superior to the other.
From an algorithmic perspective, the technical contribution is the staged integration of deterministic texture transformations with complementary convolutional encoders, constrained low-rank fusion, supervised feature selection, and internal cross-validation. The modular design makes the effect of each representation and fusion stage observable, which is useful when the available cohorts are not large enough to support unrestricted end-to-end multimodal training.
3. Materials and Methods
3.1. Study Design, Cohort Construction, and Reference Standard
This retrospective study used thoracic CT and PET images obtained at a single tertiary academic medical center. The analytical unit was a representative two-dimensional image selected from an eligible examination; complete volumetric studies were not available for model development. The institutional archive was screened retrospectively, and all images were anonymized before computational analysis. Most patients contributed one representative image and a smaller number contributed two. When de-identified linkage was available, known same-patient images were kept together during partitioning; however, complete patient linkage was not retained for every image. The study received institutional ethics approval, and informed consent was waived because the analysis used retrospective anonymized data.
Eligible examinations had to include a thoracic CT or PET study of adequate image quality, a final clinical diagnosis, the corresponding radiology or nuclear medicine report, and sufficient documentation to assign the examination to one of four categories: benign, infectious, malignant, or normal. Examinations were excluded when they were incomplete or non-diagnostic, contained severe motion or metal artifacts, had inconsistent clinical documentation, remained diagnostically indeterminate after record review, or could not be assigned reliably to one of the four categories. When identifiable, repeated examinations from the same diagnostic episode were excluded. Contrast-enhanced CT examinations were retained when the pulmonary parenchyma and the target finding remained assessable; contrast status was not supplied to the classifier.
Labels were established at the examination level from a composite clinical reference standard. Histopathology was used when available, particularly for malignant and benign lesions. For examinations without tissue confirmation, the final diagnosis was determined from the specialist report, clinical assessment, treatment course, and follow-up information available in the medical record. The malignant class comprised primary lung malignancies confirmed histologically or accepted by the treating oncology team after complete clinical assessment. The benign class included non-neoplastic nodules and masses. The infectious class included pulmonary findings supported by clinical, laboratory, therapeutic, and imaging evidence of infection or inflammation. The normal class included examinations without an active pulmonary abnormality documented at the index assessment. A uniform 12-month cancer-free follow-up criterion was not required for the normal category; therefore, the designation does not guarantee longitudinal exclusion of occult or subsequently diagnosed malignancy.
Representative images were selected before computational processing by clinical staff using the available imaging study and corresponding clinical report. For malignant and benign lesions, the selected axial image generally contained the largest or most representative visible lesion cross-section. For infection-related findings, the image with the most representative consolidation, ground-glass opacity, or inflammatory pattern was retained. A diagnostically assessable mid-thoracic image was selected for normal examinations. Selection was informed by the clinical report and was not blinded to the final diagnosis. The archive does not retain a complete reader log or a formal inter- or intra-reader repeat-selection study. The framework therefore evaluates classification after diagnosis-informed representative-image selection rather than automatic lesion detection, slice selection, or examination-level interpretation.
Cohort composition. The analytical unit was the selected representative image. Most patients contributed one image and some contributed two. Known same-patient images were grouped when linkage was available, but complete patient linkage was not retained; therefore, reliable unique-patient counts and a claim of fully patient-disjoint partitioning cannot be provided. Table 1 shows the image distribution among classes of both CT and PET datasets.
Table 1.
Image distribution among classes of CT and PET datasets.
Representative examples are shown in Figure 1. CT and PET images belonged to independent cohorts and were not registered or paired at the patient level.
Figure 1.
Representative thoracic CT and PET images from the benign, infectious, malignant, and normal categories. CT and PET examples were obtained from independent modality-specific cohorts and are not paired examinations from the same patients.
3.2. Imaging Inputs and Task Definition
CT inputs were grayscale axial images derived from the institutional DICOM archive. PET inputs were archived color-mapped clinical display exports generated under a fixed institutional viewing protocol. Native PET DICOM volumes, voxel-level standardized uptake values, metabolic tumor volume, total lesion glycolysis, and scanner-level reconstruction harmonization were not available. The PET experiments consequently measure classification from display-image appearance rather than quantitative PET radiomics.
Because patient linkage was incomplete after de-identification, the validation unit was the selected representative image. Known same-patient images were kept together whenever linkage was available, but strict patient-disjointness cannot be guaranteed for all samples. The resulting estimates therefore characterize the documented hybrid, partially patient-aware selected-image protocol and should not be interpreted as strictly patient-disjoint examination-level performance.
where is a selected image and is its benign, infectious, malignant, or normal label. CT and PET were modeled separately. No cross-modal registration, feature exchange, paired-sample loss, or shared patient representation was used. The overall computational workflow is summarized in Figure 2.
Figure 2.
Experimental hierarchy of MuTe-CAD. Original-image features are retained as a separate branch, DCT-enhanced and SWT-enhanced images are each processed by the three backbones; the resulting pooled feature vectors are concatenated and combined through a one-level Haar DWT (approximation coefficients retained), backbone-specific fused vectors are reduced with NNMF, the three backbone embeddings are integrated, mRMR selects the final feature subset, and ECOC-SVM performs four-class classification.
3.3. Texture-Enriched Image Generation
Each representative CT or PET image generated two texture-derived views: a block-wise DCT procedure that performed local illumination and contrast normalization and a one-level stationary-wavelet representation that preserved multiscale spatial structure. These representations were evaluated individually and were also combined in the multi-textural fusion condition. The Haar mother wavelet and the DCT parameters reported below were confirmed from retained portions of the original transform-generation code.
For the wavelet branch, a one-level stationary wavelet transform (SWT) was applied without decimation so that the coefficient maps remained spatially aligned with the input. With , the decomposition at level was written as
where denotes the approximation coefficients and , , and denote the horizontal, vertical, and diagonal detail coefficients at level . The complete one-level coefficient set was used to generate the SWT-enriched representation through a fixed reconstruction procedure applied identically to all images,
A single-level stationary wavelet transform (SWT) using the Haar mother wavelet was applied to each image. The decomposition produced one approximation component and three directional detail components (horizontal, vertical, and diagonal). Examples of SWT enhanced PET and CT images are shown in Figure 3. Note that the samples represent the approximation component.
Figure 3.
Examples of original and one-level SWT-enriched representative images used in the experiments. CT and PET examples are not paired samples from the same patients.
DCT-based enrichment was applied as a block-wise local contrast and illumination normalization step rather than a global frequency-domain reweighting. Each PET display image was converted from RGB to YCbCr, and each CT image was replicated across three channels before the same processing sequence; the luminance (Y) channel was partitioned into non-overlapping 4 × 4 blocks. For each block, the two-dimensional DCT was computed and normalized by the block size
Only the DC coefficient , corresponding to the block’s mean intensity, was adjusted. Local background illumination was estimated relative to the image-wide maximum intensity ,
and local contrast was preserved by rescaling the original DC coefficient proportionally,
The AC coefficients, which encode within-block spatial frequency and edge information, were left unmodified. Each block was then inverse-transformed and reassembled, the chrominance channels were reintroduced, and the image was converted back to RGB (for PET) or to grayscale (for CT). Because only the DC term was modified, this step functioned as a local illumination-normalization procedure rather than a frequency-band-selective feature extractor. Examples of the DCT emhanced CT and PET images are shown in Figure 4.
Figure 4.
Examples of original and DCT-enriched representative images used in the experiments. The DCT branch performs local illumination and contrast normalization and was applied consistently within each modality.
3.4. DCT–SWT Multi-Textural Fusion
A distinct fused condition was evaluated for both PET and CT. In this stage, the backbone-specific feature vectors extracted from the DCT-enhanced and SWT-enhanced images, after global average pooling, were first concatenated and then combined through a one-level discrete wavelet transform (DWT) using the Haar mother wavelet. Let and denote the pooled backbone-specific feature vectors obtained from the two transformed views after global pooling and let denote their concatenation. A one-level Haar DWT was then applied to , and only the approximation coefficients were retained as the fused representation; the detail coefficients were discarded. The pooled fused texture vector was therefore
where denotes the level-1 approximation coefficients of the Haar DWT. This fixed fusion routine was applied consistently across all three backbones and both modalities and produced the ‘Fused’ conditions; alternative wavelets, levels, or coefficient-combination rules (e.g., retaining the detail coefficients) were not evaluated.
Accordingly, the four representations examined across the experimental hierarchy were
where denotes the set of pooled backbone-specific feature vectors examined across the experimental hierarchy; are the pooled feature vectors extracted from the original, DCT-enhanced, and SWT-enhanced images, respectively, and is the fused feature vector obtained in Equation (7).
3.5. Two-Stage Training and Validation Protocol
The computational workflow comprised two functionally distinct stages with separate partitioning purposes. These stages did not constitute nested cross-validation. In Stage 1, ResNet101, Inception-v3, and DenseNet201 were fine-tuned as class-aware feature extractors. Approximately 70% of each modality-specific image cohort was used for CNN fine-tuning and the remaining 30% was held out to verify representation learning. Most patients contributed one representative image and some contributed two; when same-patient linkage was available, known images from the same patient were kept within the same Stage-1 partition. Because complete patient linkage was not retained after de-identification, this split cannot be described as rigorously patient-disjoint. The 30% subset was used to verify CNN representation learning and was not preserved as a separate downstream test set.
Training-time augmentation was generated on the fly after partitioning and consisted of in-plane rotation within , scaling from 0.90 to 1.10, limited translation, and horizontal reflection. Horizontal reflection was restricted to the Stage-1 training data and was considered acceptable because the four target labels were not defined by anatomical laterality; no reflection was applied to held-out images. Each CNN was trained for 50 epochs with a mini-batch size of 5 using stochastic gradient descent with momentum. The learning rate remained constant at throughout training because MATLAB LearnRateSchedule was set to “none”; momentum was 0.9. Input dimensions were 299 299 3 for Inception-v3 and 224 224 3 for ResNet101 and DenseNet201. ImageNet normalization was applied after resizing and channel conversion. Once fine-tuning was complete, the CNN parameters were frozen and were not updated during feature fusion or SVM training.
In Stage 2, frozen CNNs were used to generate deep features for the available representative images, and the feature-processing/classification pipeline was evaluated using stratified five-fold cross-validation. The CNN backbones were not retrained inside the five Stage-2 folds. When patient linkage was known, associated images were kept together; because linkage was incomplete, strict patient-disjointness cannot be guaranteed for every fold. For fold ,
where and are the Stage-2 feature-level training and held-out subsets. NNMF fitting, mRMR ranking, feature-subset selection, and SVM optimization were performed using only the training portion of the corresponding Stage-2 fold before evaluation on its held-out portion. The workflow is therefore a sequential two-stage internal validation design, not a fully nested end-to-end experiment and not a strictly patient-disjoint final test.
3.6. CNN Fine-Tuning and Deep Feature Extraction
Inception-v3, ResNet101, and DenseNet201 were selected because their architectures encode different representational biases: parallel multi-scale convolution, residual hierarchical learning, and dense feature reuse, respectively [25,26,27]. The ImageNet classification layer was replaced by a four-node layer. For backbone , fine-tuning minimized cross-entropy on the Stage-1 training subset,
The softmax output was used only during supervised fine-tuning. For the original, DCT, and SWT branches, backbone feature maps were denoted by with . The corresponding pooled vectors were
The native pooled feature lengths were 2048 for Inception-v3, 2048 for ResNet101, and 1920 for DenseNet201. The DCT + SWT fused texture vector was obtained from Equations (7) and (8). For PET, the verified unreduced matrices are consistent with direct concatenation of the original and fused-texture pooled vectors,
The dimensions after DWT fusion of SWT and DCT enhanced images and the original spatial images gives 3072 dimensions for ResNet101 and Inception-v3 and 2880 dimensions for DenseNet201. For CT, the verified archived pre-NNMF matrices contain 3072, 3072, and 2880 columns for ResNet101, Inception-v3, and DenseNet201, respectively. Rather than retain an undefined operator, we use the verified archived CT vectors directly and report their observed dimensions explicitly. These unreduced reference conditions are the “Full” rows shown in Table 5 and Table 12.
3.7. NNMF-Based Feature Integration and Dimensionality Reduction
NNMF was applied to each backbone-specific pre-NNMF matrix to obtain a lower-dimensional non-negative representation. For modality and backbone , the Stage-2 training matrix was
NNMF estimates and by
so that
MATLAB R2022b’s nnmf implementation with alternating least squares and random initialization was used. The candidate component counts were
together with the unreduced “Full” representation. Each candidate was repeated with five independent random initializations. PET standard deviations were generally around or below one percentage point, although isolated higher-variability configurations were observed; most of the PET gain was reached by approximately –150, followed by a broad plateau. CT showed modest variability, typically about 0.4–1.5 percentage points, but a narrower optimum around –200 followed by decline for several configurations. Detailed mean SD results for every tested , backbone, and SVM configuration are reported in Table 5 and Table 12.
For a held-out vector, the training basis was kept fixed and the non-negative embedding was obtained by
NNMF is non-convex and can converge to different local solutions. It is used here as an empirical integration/compression stage; the latent components are not interpreted as biological factors. The repeated-initialization analysis quantifies downstream sensitivity to this non-uniqueness.
3.8. Multi-Backbone Feature Integration
After backbone-specific NNMF embedding, the three reduced representations were concatenated to form the multi-backbone feature vector,
This stage integrates the complementary residual, multi-scale, and densely connected representations after each branch has undergone the same modality-specific texture-fusion and NNMF processing. The resulting vector is the input to mRMR selection.
3.9. mRMR Feature Selection
Minimum-redundancy maximum-relevance (mRMR) selection was applied after multi-backbone fusion [28]. Let I(a;b) denote mutual information:
For candidate subset S, relevance to the class label and within-subset redundancy were defined as:
The PET experiments evaluated subsets of 50 to 500 ranked features in increments of 50. The CT experiments evaluated 50 to 550 features in the same increments. Ranking and subset selection were restricted to the Stage-2 training portion of each fold. The best reported operating point used 500 selected features for both modalities. With approximately 810 PET images and 970 CT images in a typical four-fold Stage-2 training portion, the image-to-selected-feature ratios were approximately 1.62:1 and 1.94:1, respectively. No formal minimum sample-size-to-feature rule such as 5:1 was imposed; this high-dimensional operating point is therefore treated as a residual overfitting risk rather than as evidence that overfitting has been excluded.
3.10. Multiclass SVM Classification and Hyperparameter Selection
Five support vector machine (SVM) configurations were compared: linear, quadratic, cubic, medium Gaussian, and coarse Gaussian. For a binary learner, the soft-margin objective is:
where C is the box constraint and is the kernel-induced mapping. The evaluated kernels were:
Multiclass classification used one-vs-one error-correcting output codes. With K = 4 classes, six pairwise learners were required:
SVM training was performed in MATLAB R2022b. Bayesian optimization was used to tune the box constraint and kernel scale using only the Stage-2 training data associated with the corresponding held-out fold. However, backbone choice, texture representation, NNMF rank, feature-count comparisons, and overall configuration comparisons were explored within the same retrospective Stage-2 cross-validation framework rather than against a separate locked final test cohort. Accordingly, component-level comparisons are interpreted as internal model-selection evidence and not as an independent estimate of final generalization.
3.11. Performance Measures and Implementation Environment
Performance was summarized with accuracy, macro-averaged recall (sensitivity), macro-averaged specificity, macro-averaged precision, macro-averaged F1-score, Matthews correlation coefficient (MCC), and one-vs-rest area under the receiver operating characteristic curve. For class , precision and recall were defined separately as
For completeness, class-wise specificity was
For the four-class problem, the reported macro-averaged recall (sensitivity), specificity, precision, and F1-score were obtained by averaging the corresponding one-vs-rest class-wise quantities across the four diagnostic classes. Accuracy and MCC were computed from the multiclass predictions, and ROC analysis was performed in a one-vs-rest manner for each class. Patient-clustered confidence intervals were not estimated because complete patient linkage was unavailable for valid cluster-level resampling. NNMF initialization uncertainty is instead reported through the five-seed stability experiments. All experiments were conducted in MATLAB R2022b on a 64-bit Windows workstation with an Intel Core i7-10750H processor and 6 GB NVIDIA GeForce GTX 1660 graphics memory.
4. Results
This section presents the performance of MuTe-CAD on the independent PET and CT cohorts. Because the datasets were not paired at the patient or examination level, the results should be interpreted as modality-specific classification outcomes rather than as evidence from a true multimodal PET/CT fusion model. All accuracy and metric values reported in this section derive from the Stage-2 five-fold cross-validation described in Section 3.5; because the CNN feature extractors were fine-tuned prior to this analysis and the protocol is sequential rather than nested, these values should be interpreted as internal estimates of the documented hybrid protocol rather than as independent end-to-end performance on completely unseen patients. The analysis first evaluates PET-based classification using original images, texture-enriched representations, feature fusion, NNMF, and mRMR feature selection. The same sequence of experiments is then repeated for CT. Finally, CT and PET performance are compared to assess how each modality contributes to the four-class diagnostic task under a shared computational framework.
4.1. PET-Based Classification
4.1.1. PET-Based Classification with Single CNN Features
We begin with the simplest setting in MuTe-CAD, where PET scans are fed directly to a single convolutional backbone and features are extracted from the global pooling layer. These deep features are then classified with SVM using different kernels. This configuration isolates the contribution of each backbone and provides a reference point for later texture enrichment and fusion steps. Table 2 reports the classification accuracy for original PET features from ResNet101, Inception, and DenseNet201 combined with linear, quadratic, cubic, multi-kernel, and coarse Gaussian SVM classifiers. DenseNet201 yields the most informative PET representation among the three backbones, particularly when paired with polynomial kernels. With Q SVM, it reaches 89.5 percent accuracy, and with C SVM 89.4 percent. Inception follows closely with accuracy around 87 percent, while ResNet101 performs slightly lower but is still above 85 percent for the best kernels. Across all backbones, L SVM and MG SVM deliver competitive performance, whereas CG SVM is systematically weaker. The consistent underperformance of CG SVM suggests that a coarse radial basis function does not capture the fine structure of the high-dimensional PET feature space, which likely exhibits complex decision boundaries shaped by metabolic heterogeneity.
Table 2.
Accuracy (%) for pooled features extracted from original PET images using ResNet101, Inception and DenseNet201 with five SVM classifiers.
4.1.2. Effect of Texture-Enriched PET Representations
PET images encode metabolic activity, but their visual appearance includes noise, partial volume effects, and heterogeneous uptake within and around lesions. To evaluate whether texture descriptors complement standard deep features, two types of texture-enhanced PET images were generated. The first is obtained via a block-wise DCT procedure that normalizes local illumination and contrast while leaving the AC, texture-related, coefficients unmodified. The second uses a SWT that decomposes the image into multi-scale, location-preserving subbands. Table 3 presents classification accuracies for DCT-based PET images.
Table 3.
Accuracy (%) for pooled features extracted from DCT-based PET images using ResNet101, Inception, and DenseNet201 with five SVM classifiers.
The DCT representation preserves the performance of the original PET features. As shown in Table 3 for DenseNet201, Q SVM attains 88.6 percent accuracy, which is less than one percentage point below the original PET configuration. Inception and ResNet101 show similar behavior. These results indicate that DCT does not introduce harmful distortions and that the illumination-normalized representation captures much of the discriminative content already present in standard intensity images. At the same time, DCT alone does not unlock a new performance regime, which suggests that its main role may emerge when combined with complementary descriptors. The situation changes when we consider SWT-based PET images. On the other hand, Table 4 shows that for SWT features, accuracies drop across backbones and kernels. DenseNet201, which previously approached 90 percent accuracy, now remains around 82 percent. ResNet101 shows a similar decrease, and only Inception with Q SVM recovers part of the lost performance. SWT emphasizes local high-frequency patterns and boundaries while attenuating global uptake trends. When used in isolation, the resulting representation appears too fragmented to retain the strong class-specific intensity patterns observed in the original PET images. Nevertheless, it likely captures heterogeneity and perilesional structure, which may become beneficial when integrated with other feature streams. To exploit potential complementarity between DCT and SWT, we applied a one-level Haar discrete wavelet transform to the concatenated DCT- and SWT-branch feature vectors after global pooling, retaining the approximation coefficients as the fused representation. This fusion aims to combine the robustness of DCT with the fine-scale sensitivity of SWT.
Table 4.
Accuracy (%) for pooled features extracted from SWT-based PET images using ResNet101, Inception and DenseNet201 with five SVM classifiers.
Table 5 shows the classification accuracy that was achieved utilizing three deep learning backbones and five SVM variants on features taken from SWT-based, DCT-based, and merged SWT + DCT features obtained from enhanced DCT and SWT PET scans. According to Table 5, clear performance differences are observed among SWT-based features, DCT-based features, and their combined use for PET classification within the MuTe-CAD framework. The consistency with which the combined use of SWT and DCT features created the highest accuracy across all three backbone networks—ResNet101, Inception and DenseNet201—suggests there are advantages when integrating complementary sources of textural information. The enhancements shown for all SVM classifiers are a clear indication that utilising both illumination-normalized (DCT) and multi-resolution wavelet-based (SWT) textures provides a more meaningful, and therefore more discriminative feature space, than that created by either method alone. Although DCT features generally performed better than SWT features in PET, their fusion further improved classification accuracy, supporting the complementary contribution of the two transformed representations. For DenseNet201 with Q-SVM, DCT reached 88.6% whereas SWT reached 82.4%; the fused representation remained competitive across classifiers, indicating that the two transforms provide non-identical information to the downstream classifier.
Table 5.
Accuracy (%) for pooled features extracted from fused SWT and DCT-based PET images using discrete wavelet transform, for ResNet101, Inception, and DenseNet201 with five SVM classifiers.
Across the three backbones, texture fusion improved PET accuracy relative to the corresponding single-transform conditions. ResNet101 reached the highest fused PET value in Table 5, with 90.1% accuracy using C-SVM. Inception produced fused accuracies of 89.2–89.7% across the strongest kernels, while DenseNet201 reached up to 89.6%. Q-SVM and C-SVM were generally the strongest classifiers for the fused representations, whereas CG-SVM produced the lowest accuracy across the three backbones.
4.1.3. PET Feature Fusion Through NNMF and Then mRMR Feature Selection
To assess sensitivity to NNMF’s random initialization, the factorization was repeated with five random seeds at each candidate component count, and results were averaged across the five stratified, partially patient-aware cross-validation folds. Table 6 summarises the classification accuracy obtained for different NNMF dimensionalities for each backbone and SVM variant. The repeated-initialization results, averaged across the five folds, indicate that the non-uniqueness of the NNMF solution generally had a modest effect on downstream classification. Standard deviations were generally around or below one percentage point, although isolated higher-variability configurations were observed, including the Inception/Q-SVM setting at in Table 6. The overall component-count trend is therefore interpreted together with the seed-dependent variability rather than from a single factorization run.
Table 6.
Sensitivity of PET single-backbone NNMF-based accuracy (%) to random initialization. Values are mean (SD) over five random NNMF initializations, averaged across the five cross-validation folds.
The trend across component counts proved more informative than the variability surrounding it. Accuracy increased consistently from k = 10 to approximately k = 100–150 across all three backbones, with these gains exceeding the corresponding seed-to-seed standard deviation at each value of k, indicating a genuine effect of representational capacity rather than initialization noise. Beyond k 150, differences between successive component counts were generally within the magnitude of this variability, consistent with a performance plateau rather than continued improvement. These findings indicate a more precisely characterized stable range of approximately k = 100–300, within which the majority of the achievable gain is realized by k 150.
Among the three backbones, DenseNet201 reached this plateau earliest and at the highest accuracy, attaining approximately 90–91% with Q-SVM and C-SVM by k = 100. This is consistent with DenseNet201 providing the strongest original-image PET baseline reported in Section 4.1, suggesting that its densely connected architecture yields a representation that NNMF compresses efficiently while preserving class-relevant structure.
For Inception and DenseNet201, reduced NNMF representations retained performance close to the unreduced reference conditions. Inception achieved 90.14% with C-SVM at , compared with 90.24% for the full 3072-dimensional representation. DenseNet201 achieved 90.76% with C-SVM at , compared with 91.22% for the full 2880-dimensional representation. These findings indicate that substantial dimensionality reduction can preserve most of the discriminative performance while reducing feature dimensionality.
Table 7 shows how accurate the mRMR-selected PET feature subsets were from all the combined NNMF-derived features of three CNN backbones. The accuracy trend clearly shows that increasing the number of selected PET features from 50 to 400 (50–400) yields more useful, distinguishable information in the mRMR subsets, indicating a more robust feature set selection. The lowest level of accurate prediction is with the 50 PET features (82.7–84.0% accuracy) due to the selection not covering a sufficient portion of the original feature space. Additional features included in the subset enabled improved accuracy, and ultimately, maximum accuracy occurred when selecting between 400 and 500 PET features, with most achieving greater than 92% accuracy.
Table 7.
Accuracy (%) for mRMR-selected PET feature subsets after fusing all NNMF features from the three CNNs, using five SVM classifiers.
As the number of selected features increases, accuracy improves and eventually stabilises between 400 and 500 features. Q-SVM and C-SVM achieved the highest PET accuracies in the mRMR-selected feature space, reaching approximately 0.93 depending on the selected feature subset. L-SVM and MG-SVM plateau around 92 percent. This indicates that the fused PET representation still contains many informative variables and that careful selection is needed to exploit the available predictive information. The macro-averaged metrics for the final PET models are summarised in Table 8. Q-SVM and C-SVM show almost similar overall performance, with accuracy around 0.93, F1-score around 0.89, precision around 0.92, and MCC around 0.86. Sensitivity ranges from approximately 0.83 to 0.87 across the four stronger classifiers, and specificity is near 0.98. L-SVM and MG-SVM demonstrate lower performance, with accuracies of 0.9177 and 0.9187, sensitivities of 0.8480 and 0.8285, specificities of 0.9749 and 0.9769, precisions of 0.9072 and 0.9154, F1-scores of 0.8635 and 0.8434, and MCC values of 0.8458 and 0.8345, respectively. The CG-SVM has the lowest overall performance among the evaluated classifiers, with sensitivity of 0.7317 and precision of 0.6636.
Table 8.
Macro-averaged performance metrics for the highest-performing PET models (four-class problem) after the mRMR feature selection process.
The confusion matrices for the best-performing models after the mRMR process are shown in Figure 5. The confusion matrices from the SVM classifiers trained on the selected mRMR features show a high level of ability to differentiate between the 4 classes of PET images, that of Benign, infectious, Malignant and Normal, across all 4 PET image classes. All four SVM models demonstrate a very high sensitivity (>96 percent) to the Normal and Malignant classes, indicating that the selected features provide a very high degree of discriminatory ability in distinguishing between the Normal/Malignant categories. Also, the infectious category achieved a very high level of accurate classification (>94 percent) across all SVM models. However, the Benign class had the highest level of confusion among the four classes and therefore was the least accurately classified across all SVM models. The reason for this confusion between the infectious and Benign cases can most likely be explained by the fact that there is often an overlap in the textural and metabolic signatures obtained from the PET images of both categories, which can cause difficulty in clinically interpreting the data. Based on the data collected from all four SVM models, both the C SVM and Q SVMs performed relatively better compared to the other SVM models in that they had the highest true positive rates for the Benign class and maintained good levels of sensitivity toward detecting the Normal, Malignant, and infectious classes.
Figure 5.
Confusion Matrix for the highest-performing PET models after mRMR selection (four-class problem) after the mRMR feature selection process.
The ROC curves for the best performing models after the mRMR process are shown in Figure 6. The performance of the SVM classifiers assessed in this research based on the ROC curves shows similarly strong performance for all four-classifiers. After applying the mRMR feature selection method to the underlying PET images, all were able to achieve AUC scores greater than 0.95 across classes, meaning that the remaining features are representative of highly informative and nonredundant discriminative features capable of differentiating between the classes of Benign, infectious, Malignant and Normal case types. The Malignant and Normal classifications achieved the highest levels of AUC after applying the mRMR feature selection method (0.997–0.999), suggesting that they can nearly perfectly separate from one another according to the definition of sensitivity and specificity shown within the confusion matrices. The infectious subclass shows very solid performance across all four SVM classifier models with an average AUC value of approximately 0.97–0.98, indicating that the classifiers will reliably detect cases of infectious if they are not otherwise confused with benign inflammatory patterns. The Benign subclass shows slightly lower AUC scores than the other three classes (approximately 0.95–0.96), which corresponds to earlier trends regarding misclassification within the Benign class. Of the four-classifiers, the Cubic and Medium Gaussian classifiers performed marginally better than the Linear and Quadratic classifiers, as indicated by a more smoothly shaped ROC curve with higher operating points across the classes.
Figure 6.
ROC for the highest-performing PET models (four-class problem) after the mRMR feature selection process.
4.2. CT-Based Classification
4.2.1. CT-Based Classification with Original and Texture-Enriched Features
We then evaluated the same pipeline on the CT dataset. In contrast to PET, CT provides detailed structural information but no direct measure of metabolic activity. This difference is reflected in the difficulty of distinguishing inflammatory from malignant lesions and benign from normal tissue on purely morphological grounds. Table 9 shows the classification performance when deep features are extracted from original CT images and classified with the five SVM variants. The best CT accuracies are in the low 80 percent range, clearly lower than PET. Inception and DenseNet201 are slightly better than ResNet101, but the differences are modest.
Table 9.
Accuracy (%) for pooled features extracted from original CT images using ResNet101, Inception and DenseNet201 with five SVM classifiers.
Texture enrichment can help capture subtle parenchymal patterns that may not be evident in global intensity distributions. Table 10 and Table 11 present the effect of applying DCT and SWT to CT images. The results in Table 10 show that most of the SVM classifiers used for classification performed at a moderate level of performance, with accuracies ranging from about 74% to 81% across three different sets of SVM classifiers. The results also show that DenseNet201 achieved the highest classification accuracy of the three backbone networks, achieving its highest overall classification accuracy of 81.0% when using the Q SVM. The Inception backbone network had similar performance, with the ResNet101 backbone network across all classifiers consistently performing slightly worse than DenseNet201 and Inception, indicating that DCT features only provide some discriminative power for CT lung disease classification. For each classifier, quadratics, C SVMs provided better classification accuracy compared to all other kernels, while CG SVM provided the lowest classification accuracy of all the kernels evaluated. The results also indicated the need for greater flexibility in decision boundaries when classifying CT illumination-normalized representations.
Table 10.
Accuracy (%) for pooled features extracted from DCT-based CT images using ResNet101, Inception and DenseNet201 with five SVM classifiers.
Table 11.
Accuracy (%) for pooled features extracted from SWT-based CT images using ResNet101, Inception and DenseNet201 with five SVM classifiers.
SWT-based feature extraction was evident in the improved image classification accuracies in Table 11. Accuracies increased for all backbone architectures and classifiers using SWT features compared to those with DCT features. The DenseNet201 backbone produced the highest classification accuracy of 85.1% when using the C SVM, while both Inception and ResNet101 exhibited clear increases in classification accuracy. The results indicate that SWT effectively captures the distinct multi-resolution and shift-invariance characteristics of textures found in CT images; thus, SWT texture extraction better represents the complex structure of CT imaging. The classification results using Q SVM and C SVM remain consistent with the results shown in Table 10 and produced the highest classification accuracy for CT images; however, the CG SVM was the least accurate for classification.
Table 10 demonstrates that DCT improves ResNet101 and DenseNet201 by one to two percentage points but leaves Inception essentially unchanged. While Table 11 indicates that DSWT has a stronger impact, especially for Inception and DenseNet201, where Q SVM and C SVM reach mid eighty percent accuracies. These improvements indicate that multi-scale structural patterns, such as spiculation, cavitation or textural changes in adjacent parenchyma, are informative for CT-based classification when explicitly encoded through wavelet transforms. To combine illumination-normalized and multi-scales descriptors, we fused DCT and SWT CT features using DWT-based fusion and their results are shown in Table 12. Table 12 indicates that the fused CT textures consistently outperform their single transform counterparts. The results listed in Table 12 show that using both SWT and DCT methods together has improved accuracy on every combination of backbone network and SVM classifier by 1 to 3%. With both fusion methods, ResNet101 reached its highest accuracy (82.8%) when using Q SVMs, while Inception achieved 85.8% accuracy when using fused features versus SWT and DCT results. DenseNet201 consistently produced the best performance among all three networks and combined features produced an overall accuracy of 86.4% when using Q SVMs and similar results with C SVMs. The results illustrate how features derived from SWT and DCT support one another’s functionality; SWT provides multi-scale structural information and DCT provides local illumination-normalized intensity patterns, both of which create a more robust representation of CT data than either feature individually. Similar to the results in previous tables, Q SVMs are more effective than C SVMs when modeling the nonlinear structure of fused CT features.
Table 12.
Accuracy (%) for pooled features extracted from fused SWT and DCT-based CT images using discrete wavelet transform, for ResNet101, Inception and DenseNet201 with five SVM classifiers.
4.2.2. CT Feature Fusion Through NNMF and mRMR Feature Selection
To bring CT analysis in line with the PET pipeline, the verified pre-NNMF CT feature vector for each backbone combined the original-image branch with the DCT–SWT fused texture contribution described in Section 3.6; NNMF was then evaluated at different component counts. The results are shown below in Table 13. The repeated-initialization results for CT, averaged across the five folds, again show that NNMF’s non-unique solutions have a modest effect on downstream classification, with standard deviations mostly in the range of 0.4–1.5 percentage points across the three backbones. However, unlike PET, the CT results do not support a stable plateau across k = 50–300.
Table 13.
Sensitivity of CT single-backbone NNMF-based accuracy (%) to random initialization. Values are mean (SD) over five random NNMF initializations, averaged across the five cross-validation folds (continued).
Across all three backbones (ResNet101, Inception, and DenseNet201), accuracy rose from k = 10 to a peak around k = 100–200, after which it declined rather than stabilized. This decline was most pronounced for CG-SVM, which fell steadily and substantially from its early peak through k = 300 (ResNet101: 78.62% at k = 100 to 72.84% at k = 300; Inception-v3: 82.34% at k = 50 to 75.82% at k = 300; DenseNet201: 81.90% at k = 100 to 77.16% at k = 300), well beyond the magnitude of seed-to-seed variability. This indicates that, for CT, higher-dimensional NNMF embeddings did not simply plateau but progressively discarded information relevant to certain SVM kernels, most visibly the coarse Gaussian configuration.
As with PET, we then fused NNMF features from the three CT backbones and applied mRMR selection. Results after mRMR feature selection are shown in Table 14. The data in Table 14 show the results of measuring how accurately mRMR, a method for selecting CT-derived features, performed with NNMF’s feature set from each of the three CNN backbone architectures combined. Table 14 shows that as the number of mRMR-selected features increases from 50 to approximately 400–500, accuracy generally increases. When only a small number of mRMR-selected features (e.g., 50–100), modest accuracy (i.e., 76–82%) is achieved; therefore, more features must be selected in order to account for the complex structural and textural features that are inherent to CT imaging. However, after reaching 150 mRMR-selected features, accuracy improved further as the selected subset retained additional relevant information while filtering redundant variables.
Table 14.
Accuracy (%) for mRMR-selected CT feature subsets after fusing NNMF features of the three CNNs, using five SVM classifiers.
Performance generally improved as the selected feature count increased, with the strongest results observed between approximately 350 and 550 features. The relative ranking of L-SVM, Q-SVM, C-SVM, and MG-SVM varied across feature-subset sizes, whereas CG-SVM was consistently weaker at the higher-dimensional operating points. L-SVM reached the overall maximum of 87.8% at 500 selected features. The small difference between the best-performing subset and the 550-feature condition indicates that most of the useful discrimination was already captured by the highest-ranked features.
The results in Table 14 show that mRMR selection preserves strong CT classification performance at lower dimensionalities than the unreduced fused representation. Non-linear SVM and subsets of features from 300–500 provide the highest classification accuracies—close to 88%—and thus represent the best combination of the ability to reduce model dimensionalities while also providing an optimal discriminative power ratio for the CT part of the MuTe-CAD system.
The macro-averaged metrics for CT are listed in Table 15. These results show several clear performance trends after mRMR feature selection. C SVM provided the strongest balance between macro F1-score and MCC, whereas L SVM achieved the highest overall accuracy. The C SVM produced an F1-score of 0.7977, an MCC value of 0.7644, and a competitive accuracy of 0.8735, all of which indicate that it performed very well on all four classes of CT data. Also, the performance of the L SVM, Q SVM, and MG SVM demonstrated strong performance; all three produced accuracy values near 0.87, specificity values of approximately 0.96, and reasonably strong MCCs (between 0.74 and 0.76). These results further support the conclusion that once the mRMR feature selection method has been applied, the CT feature sets provide a higher level of separation among the four classes, particularly for the negative classes, because the four models demonstrate consistently high specificity rates. The performance of the CG SVM classifier throughout nearly all evaluation criteria is lower than the other classifiers, including: sensitivity of 0.6914 and precision of 0.6314, alongside an F1 Score of 0.6594. This low sensitivity and F1 scores indicate that CG SVM has difficulty identifying the minority and/or more complex classes in this 4-class problem. This pattern is consistent with the weaker CG-SVM results observed across the CT experiments in this study. Among the better-performing classifiers, specificities of 0.958–0.962 indicate relatively few false-positive assignments in the one-vs-rest summaries, whereas the lower sensitivity values (ranging from approximately 0.75 to 0.79 across the four stronger classifiers) reflect the difficulty of separating benign, infectious, and malignant CT patterns, even though the corresponding precision values remain higher (0.82–0.87).
Table 15.
Macro-averaged performance metrics for the highest-performing CT models after mRMR selection (four-class problem).
The SVM classifiers’ confusion matrices show very varied levels of class-based performance for the CT modality after performing mRMR feature selection as shown in Figure 7. The Normal class receives the highest classification accuracies for all SVM classifier models tested, with true positive rates of 97–99%. This demonstrates that the CT-based features selected by mRMR can be used to identify the normal lung structures with a high degree of accuracy. The Malignant class performs similarly based on all SVM versions tested, with a true positive rate > 91% in every case. The results of this analysis indicate that mRMR preserves malignant-related textural characteristics in the reduced state of the feature space. In comparison, performance for the infectious and benign groups is lower than for the Normal and Malignant categories and shows substantial misclassification between these two categories. The difficulty in separating inflammation-related CT characteristics from benign lesions is reflected in the confusion between the Benign and infectious classes observed in the L SVM and Gaussian SVM classifiers, which misclassify a substantial proportion of the Benign cases as infectious. Although the Q SVM and C SVM classifiers have somewhat improved classification accuracy, they still exhibit similar trends. In summary, the CT-based features selected using mRMR will support the accurate detection of normal and malignant cases but the overlapping patterns present in the infectious and benign groups will reduce separability. Therefore, the differentiation of these conditions with CT imaging alone is subject to many inherent difficulties.
Figure 7.
Confusion matrix of the highest-performing CT-based MuTe-CAD model after NNMF fusion and mRMR feature selection.
As shown in Figure 8, the ROC curves of the four SVM classifiers applied to the CT modality post-mRMR feature selection showed class-dependent discriminability, with clear variation across classes. Normal and Malignant classes, the SVM models exhibited excellent class separability, with all SVM classifiers having ROC AUC values near or above 0.99, indicating that the feature sets of reduced CT data still contained the most informative structural cues for these categories. The infectious class demonstrated very good ROC AUC values of 0.95–0.96 across all classifiers. Therefore, SVM classifiers were able to maintain a strong classification performance for infectious class, however, the ROC curves for infectious classifiers also demonstrated more variability than the Normal and Malignant classes due to the larger spread between detection thresholds for the infectious class. The Benign class had the lowest ROC AUC values. The AUC values of Benign class generally ranged from 0.89–0.93. This result highlights the difficulty of differentiating between benign lesions and infection-related abnormalities in CT images. Among the SVM classifiers, the Quadratic and Cubic variants displayed a more uniform and smooth ROC profile across all classes, indicating a greater correlation with the non-linear CT feature space. In conclusion, these ROC results provide evidence supporting the utility of mRMR to improve the overall diagnostic power of the MuTe-CAD framework for CT image analysis, especially in identifying Normal and Malignant patterns in CT images, while further confirming that Benign lesion classification is still a very difficult problem for all SVM classifiers.
Figure 8.
ROC curves of the highest-performing CT-based MuTe-CAD model after NNMF fusion and mRMR feature selection.
4.3. Comparison of PET and CT Performance
Comparing Table 8 and Table 15 highlights the relative contribution of PET and CT within MuTe-CAD. PET-based models, after multi-textural enrichment, fusion and feature selection, achieve accuracy of 0.9296 and macro F1 of 0.8851 with Q SVM, compared to 0.8776 and 0.7812 for the best CT model. MCC increases from about 0.76 for CT to 0.87 for PET. PET and CT achieve broadly comparable sensitivity for their best-performing classifiers (0.87 for PET Q-SVM versus 0.87 for CT MG-SVM), while PET yields higher specificity and precision overall, which means fewer false alarms in benign and normal lungs for PET relative to CT. As noted above, these values reflect the documented hybrid, non-nested evaluation protocol and should not be read as independent end-to-end estimates on fully unseen patients.
Confusion matrices and ROC curves for PET-based classifiers are shown in Figure 5 and Figure 6, while Figure 7 and Figure 8 show the similar outputs associated with CT-based classification. The performance of PET- and CT-based classifiers can be differentiated clearly. In this dataset, PET-based models produced higher aggregate classification performance and larger AUC values for most classes than the CT-based models. PET-based models classify Normal and Malignant cases exceptionally well, having almost perfect sensitivity and specificity (often greater than 99%), and the AUC of the ROC curves is nearly one. The infectious class also demonstrates good performance on this imaging modality due to its high sensitivity and low rate of misclassifications between classes. The Benign category is the most difficult for PET-based classifiers, although even in this case, misclassifications are low and primarily misidentified as the infectious class.
In the present cohorts, PET-based models achieved higher overall performance than CT-based models. In contrast, CT-based models showed greater confusion between benign and infectious cases, which is consistent with the morphological overlap between inflammatory and nonmalignant pulmonary findings on CT. CT-based imaging susceptibility to this type of confusion is well-documented because of the physiologic similarities between Benign and infectious lesions (particularly in association with inflammatory changes). Although CT-based models show high discriminative ability for the Normal and Malignant classes (AUC values approaching 0.98 to 0.99), the Benign category remains more difficult, with lower sensitivity and greater variation across classifiers. This reflects the overall performance of CT-based models when viewed on the basis of ROC curves, where Benign AUC values remain lower than the corresponding PET AUC values. Additionally, the CT SVM variants showed greater performance variation across classifiers than the PET models in this dataset.
From a methodological perspective, these results support the staged MuTe-CAD design within the present cohorts. Multi-texture enrichment, NNMF-based fusion, and mRMR selection increased performance relative to simpler internal configurations in both modalities. The relative gains differed between PET and CT, reinforcing the need to interpret each modality within its own cohort rather than as a controlled modality comparison. The Discussion relates these observations to prior CT- and PET-based CAD studies and considers the requirements for future clinical validation.
4.4. Methodological Positioning Relative to Related Methods
To position MuTe-CAD within the recent lung-imaging literature, Table 16 summarizes representative CT, PET, and PET/CT studies according to modality, diagnostic task, dataset type, and methodological design. The table is intended primarily as a methodological positioning summary rather than a numerical ranking. Where a directly comparable published performance value was not retained in the present comparison record, the entry is reported as NR rather than replaced by an approximate or non-equivalent metric. Cross-study performance values should therefore not be interpreted as head-to-head evidence because dataset source, number of classes, imaging protocol, validation strategy, and clinical objective differ substantially.
Table 16.
Methodological positioning of MuTe-CAD relative to representative lung-imaging CAD studies. (continued).
Table 16 shows that the selected studies address substantially different diagnostic settings, including binary malignancy discrimination, subtype classification, and broader multi-class thoracic disease recognition. These settings are not directly equivalent to the present four-class study. Many existing methods address benign versus malignant discrimination, lung cancer detection, or histological subtype classification, whereas MuTe-CAD was designed for a clinically broader four-class setting involving benign, infectious, malignant, and normal cases. This distinction is important because infectious and inflammatory abnormalities may resemble malignancy on both CT morphology and PET metabolic activity, making them a major source of diagnostic ambiguity in routine lung imaging.
The PET and PET/CT literature also differs from the current work in several important respects. Some studies use paired PET/CT examinations, handcrafted radiomics descriptors, segmentation masks, clinical variables, dynamic PET parameters, or prognosis-related endpoints. In contrast, the present study evaluates independent CT and PET cohorts and uses the same four diagnostic categories in both modalities. Therefore, the comparison in Table 16 provides contextual evidence rather than a fully controlled numerical comparison. A direct claim of superiority over all previously published methods would not be scientifically justified unless the competing methods were evaluated on the same dataset under the same preprocessing, splitting, feature extraction, optimization, and validation protocol.
A full reimplementation of all literature methods on the present dataset was not feasible for several reasons. Many published studies rely on nonpublic datasets, unavailable source code, paired PET/CT input data, segmentation annotations, radiomics pipelines, dynamic imaging parameters, or clinical variables that were not available in our retrospective imaging cohorts. Conversely, applying MuTe-CAD to many previously used datasets is constrained by the limited public availability of multiclass lung PET/CT datasets with benign, infectious, malignant, and normal labels. For this reason, we avoided unsupported claims of direct superiority and instead present MuTe-CAD as a competitive and methodologically distinct framework evaluated under a clinically demanding four-class setting. Future work should include external validation on publicly available multiclass PET/CT cohorts when such datasets become available, as well as prospective benchmarking against radiomics-based models and radiologist interpretation under a unified evaluation protocol.
4.5. Component-Level Contribution of MuTe-CAD
To provide a more controlled demonstration of efficacy, we performed an internal component-level comparison using the same institutional CT and PET datasets, the same four diagnostic labels, and the same validation strategy. This comparison is summarized in Table 17 and is based on the experimental results reported throughout Section 4.1 and Section 4.2. The comparison includes single-backbone CNN features extracted from original images, DCT and SWT-based texture representations, fused texture features, NNMF-based feature integration, and the final mRMR-selected MuTe-CAD representation.
Table 17.
Internal component-level comparison of the MuTe-CAD framework configurations using the same institutional dataset and validation strategy. Accuracy values are rounded to one decimal place; full-precision of accuracy values for the final PET and CT configurations are reported in Section 4.3.
The internal comparison in Table 17 shows that the performance gain of MuTe-CAD is not attributable to a single CNN backbone, a single texture transform, or a single classifier. In PET, original CNN features already provide strong performance, with DenseNet201 reaching approximately 89.5% accuracy. However, the staged integration of texture-enriched representations, NNMF-based fusion, and mRMR-based redundancy reduction increases the best PET accuracy to approximately 93.0% (the exact accuracy is 92.96% as in Section 4.3). This improvement suggests that PET classification benefits from combining metabolic intensity patterns with complementary texture and backbone-specific feature representations.
For CT, the original image baselines achieve lower performance than PET, which is expected because CT captures structural and morphological information but does not directly encode metabolic activity. The best original CT features remain close to 81.0% accuracy, whereas the final MuTe-CAD configuration reaches 87.8% accuracy. The larger relative improvement observed in CT indicates that texture modeling and feature selection are particularly useful for separating morphologically overlapping lung abnormalities, especially benign, infectious, and malignant patterns.
Table 2, Table 3, Table 4, Table 5, Table 6, Table 7, Table 9, Table 10, Table 11, Table 12, Table 13 and Table 14 provide the component-level evidence summarized in Table 17. Because these entries are the best observed results across related configurations rather than a strictly matched sequential ablation in which only one factor changes at a time, the differences are interpreted descriptively rather than causally. For PET, the best observed accuracy increased from 89.5% (DenseNet201, Q-SVM, 1920 original features) to 90.1% for the DCT–SWT fused representation (ResNet101, C-SVM, 2048 features), 91.0% after NNMF-based integration (DenseNet201, C-SVM, k = 300 components), and 92.96% which is approximately 93.0% after the final mRMR-selected configuration (500 features). For CT, the corresponding best observed accuracies were 81.0% (Inception-v3, 2048 original features), 86.4% (DenseNet201, Q-SVM, 1920 fused features), 85.2% after NNMF-based integration (DenseNet201, Q-SVM, k = 100 components), and 87.8% after the final mRMR-selected configuration (500 features), respectively. These values show the progressive performance pattern across the evaluated configurations without attributing each difference to an isolated module effect. As throughout this section, these comparisons were conducted within the Stage-2 cross-validation framework on CNN features that had already been fine-tuned in Stage 1, and should be interpreted accordingly as internal, non-nested evidence.
5. Discussion
The internal experiments indicate that multi-textural feature fusion improved modality-specific selected-image classification within this retrospective cohort, in line with prior medical imaging work in which transformed representations and CNN-derived features provided complementary information [20,24]. PET produced higher internal selected-image performance than CT in this cohort. The PET advantage requires cautious interpretation. The PET inputs were exported clinical display images, not native DICOM SUV volumes, and the CT and PET cohorts were independent and differed in size and class composition. Their appearance may also be affected by institutional color mapping, intensity scaling, reconstruction workflow, and workstation display conventions. The higher PET performance is therefore a dataset- and display-image observation under the documented hybrid protocol, not evidence that quantitative PET is inherently superior to CT for this task.
The CT findings point to a different pattern of model behavior. CT performance improved substantially after the DCT and one-level SWT representations were combined through the DWT-based multi-textural fusion stage. The experiments therefore support a benefit from combining illumination-normalized DCT information with multiresolution SWT structure, but they do not isolate the contribution of individual DCT bands, SWT levels, or directional wavelet components. CT remained weaker than PET, especially for benign and infectious cases. This is consistent with the overlap among benign nodules, inflammation-related opacities, and malignant lesions on single axial slices. A volumetric model using adjacent slices, lesion extent, and perilesional context may reduce this limitation.
The four-class design preserves a clinically relevant distinction that binary malignant-benign or abnormal-normal formulations typically remove: infection-related mimics of malignancy. The confusion patterns show why that distinction matters. The benign class was the least stable in both modalities and often overlapped with infectious patterns. Reporting this class-level behavior alongside aggregate accuracy provides a more faithful account of the remaining diagnostic difficulty.
The hybrid CNN-SVM design is defensible within a moderate-sized retrospective imaging dataset, particularly when high-dimensional features require explicit dimensionality reduction and feature selection before classification [28,51]. CNN backbones were used to learn class-aware representations, while SVMs operated on fused and selected feature vectors. This differs from fully end-to-end deep learning. The explicit stages allow the contribution of image transformation, encoder diversity, low-rank integration, and feature selection to be examined separately. However, the selected 500-feature operating point yields a low image-to-feature ratio, and model/configuration comparisons were made within the same internal Stage-2 cross-validation framework. The component results should therefore be interpreted as exploratory internal evidence rather than as a definitive estimate of external generalization.
These results are internal methodological results and do not constitute clinical validation. The framework was trained and evaluated after a representative image had already been selected from each examination. It did not localize lesions in complete volumes, select the most informative slice automatically, aggregate information across multiple slices, or generate examination-level predictions. A formal inter- or intra-reader slice-selection agreement study was not available. These limitations restrict interpretation to retrospective selected-image classification rather than clinically validated diagnostic use.
Compared with paired PET/CT deep learning models, the proposed framework addresses a distinct problem. It evaluates independent CT and PET cohorts under a shared four-class label structure. The present findings show that the implemented transformed representations and multi-backbone feature fusion improved selected-image classification within this single-center dataset. They do not provide evidence of cross-modal PET/CT fusion, quantitative PET radiomics, or validated examination-level diagnosis.
Limitations
First, CT and PET cohorts were independent and not paired at the patient level. The framework therefore does not perform paired PET/CT fusion, spatial registration, or cross-modal anatomical-metabolic learning. Evaluation on paired PET/CT examinations with lesion-level or voxel-level correspondence is required to study true anatomical-metabolic fusion.
Second, the analysis used selected two-dimensional representative images rather than complete volumetric examinations. This design evaluates classification after slice selection, not the full clinical workflow of lesion localization and examination-level diagnosis. A 2.5D or 3D extension using adjacent slices, lesion context, and examination-level aggregation would address this limitation.
Third, complete de-identified patient linkage was not retained. Most patients contributed one representative image, and some contributed two; known same-patient images were grouped when linkage was available, but strict patient-disjointness cannot be guaranteed for every sample. Stage 1 and Stage 2 were sequential rather than nested, and the Stage-1 30% hold-out was used only to verify CNN representation learning rather than as a separate downstream test set. Because the CNN feature extractors were fine-tuned in Stage 1 prior to the Stage-2 five-fold cross-validation reported throughout Section 4, the reported estimates should be interpreted as internal performance of a sequential, non-nested, hybrid, partially patient-aware protocol, not as independent end-to-end performance on fully unseen patients.
Fourth, representative-image selection was informed by the clinical report and final diagnosis. The archive does not retain a complete reader log, and no formal inter-observer or intra-observer repeat-selection study was performed. Performance is therefore conditional on diagnosis-informed representative-image curation. Future prospective work should use predefined selection rules with independent readers or eliminate manual selection through automated volumetric modeling.
Fifth, the normal category was defined from the contemporaneous imaging report and clinical information available at the index assessment. A uniform 12-month cancer-free follow-up criterion was not imposed. Consequently, the present design cannot completely exclude occult disease that was not apparent on the selected axial image or malignancy diagnosed subsequently.
Sixth, PET inputs were display images rather than quantitative SUV-normalized DICOM volumes. Cross-institutional reproducibility has not been established because display settings and workstation export protocols may differ across centers. DICOM-native PET processing is necessary for quantitative and cross-institutional evaluation.
Seventh, the reference standard was composite and retrospective. Not all benign, infectious, or normal cases had histopathological confirmation. Prospective data collection with structured adjudication and explicit longitudinal follow-up criteria would reduce residual label uncertainty.
Eighth, the final mRMR operating point remained high-dimensional; 500 features for both PET and CT modalities, respectively. The approximate image-to-feature ratios in a typical Stage-2 training portion were about 1.62:1 for PET and 1.94:1 for CT, below a commonly used 5:1 heuristic. No formal minimum ratio was imposed, so residual overfitting remains possible despite NNMF and mRMR.
Ninth, NNMF is non-convex. Five-seed experiments showed modest downstream variability, but the factorization is not unique. The observed k dependence was also modality-specific: PET showed a broad plateau after approximately k = 100–150, whereas CT often peaked around k = 100–200 and declined thereafter.
Tenth, the experiments used one-level SWT representation, a DCT-derived representation. The experiments also did not perform an isolated ablation of individual SWT levels or directional subbands, individual DCT block-wise illumination adjustments, or alternative DWT coefficient-combination rules. The reported gains therefore apply to the complete transformed representations and their fusion rather than to a single frequency or directional component. A dedicated band-, level-, and coefficient-rule ablation remains future work.
Finally, the study lacks external multicenter validation, a fully patient-disjoint test cohort, patient-clustered uncertainty intervals, calibration analysis, paired statistical testing, and reader-study evidence. Complete patient linkage would be required to construct valid patient-clustered bootstrap confidence intervals. These analyses remain necessary before clinical decision-support claims can be made.
6. Conclusions
The proposed framework integrates original images, DCT-based illumination-normalized representations, one-level SWT representation, DWT-based multi-textural fusion, complementary deep encoders, NNMF-based feature integration, supervised feature selection, and multiclass SVM classification for four-class analysis of independent CT and PET cohorts. Within the retrospective hybrid, partially patient-aware protocol, the complete pipeline improved performance over simpler internal configurations. PET display images achieved higher aggregate performance in this dataset, whereas CT showed a clearer gain from the transformed representations; because the cohorts were independent and differed in composition, this difference should not be interpreted as intrinsic superiority of PET over CT. Benign findings remained the least stable category in both modalities and frequently overlapped with infection-related abnormalities. The results justify further testing of explicit multi-textural fusion in moderate-sized imaging cohorts, but they do not establish strictly patient-disjoint, volumetric, external, or clinical validity. Future work should preserve patient identifiers prospectively, use fully patient-disjoint multicenter cohorts, standardized longitudinal adjudication, reader-independent or automated slice selection, native quantitative PET data, and volumetric or paired PET/CT models.
Author Contributions
O.A. and I.P. conceived the study, developed the methodology, and designed the computational framework. O.A. and I.P. implemented the software and performed the formal computational analyses, and O.A. prepared the visualizations and the original manuscript draft. A.M. provided clinical resources, curated the imaging data, and contributed to the clinical investigation and validation of the study design. O.A., A.M. and I.P. reviewed the experimental procedure, validated the reported results, and contributed to their interpretation. A.M. and I.P. reviewed and edited the manuscript, while I.P. supervised the study and shared project administration with O.A. All authors have read and agreed to the published version of the manuscript.
Funding
This research received no external funding.
Institutional Review Board Statement
The study was conducted in accordance with the Declaration of Helsinki and approved by the Ethics Committee of Atatürk University Faculty of Medicine (approval number 2025/33423).
Informed Consent Statement
The requirement for informed consent was waived by the Ethics Committee because the study was retrospective and used anonymized medical images and clinical records. No identifying participant information is reported in this article. Not applicable. The manuscript contains anonymized medical images and no information that could identify an individual participant.
Data Availability Statement
The CT and PET datasets contain retrospective patient-derived medical images and are not publicly available because of institutional, ethical, and privacy restrictions. Anonymized data may be made available by the corresponding author upon reasonable request, subject to institutional approval and applicable regulations. Code used for CNN fine-tuning, NNMF-based fusion, mRMR feature selection, and SVM classification is available from the corresponding author upon reasonable request. The routines implementing the one-level Haar SWT decomposition, the block-wise DCT illumination-normalization procedure, and the Haar-DWT-based feature-vector fusion stage are retained and available from the corresponding author upon reasonable request.
Conflicts of Interest
The authors declare no conflicts of interest.
Abbreviations
| CT | Computed tomography |
| PET | Positron emission tomography |
| DCT | Discrete cosine transform |
| SWT | Stationary wavelet transform |
| CNN | Convolutional neural network |
| NNMF | Non-negative matrix factorization |
| mRMR | Minimum redundancy–maximum relevance |
| SVM | Support vector machine |
| MCC | Matthews correlation coefficient |
| AUC | Area under the receiver operating characteristic curve |
References
- Siegel, R.L.; Kratzer, T.B.; Giaquinto, A.N.; Sung, H.; Jemal, A. Cancer statistics, 2025. CA Cancer J. Clin. 2025, 75, 10–45. [Google Scholar] [CrossRef] [Scilit]
- Leiter, A.; Veluswamy, R.R.; Wisnivesky, J.P. The global burden of lung cancer: Current status and future trends. Nat. Rev. Clin. Oncol. 2023, 20, 624–639. [Google Scholar] [CrossRef] [Scilit]
- de Koning, H.J.; van der Aalst, C.M.; de Jong, P.A.; Scholten, E.T.; Nackaerts, K.; Heuvelmans, M.A.; Lammers, J.-W.J.; Weenink, C.; Yousaf-Khan, U.; Horeweg, N.; et al. Reduced lung-cancer mortality with volume CT screening in a randomized trial. N. Engl. J. Med. 2020, 382, 503–513. [Google Scholar] [CrossRef] [Scilit]
- Adams, S.J.; Stone, E.; Baldwin, D.R.; Vliegenthart, R.; Lee, P.; Fintelmann, F.J. Lung cancer screening. Lancet 2023, 401, 390–408. [Google Scholar] [CrossRef] [Scilit]
- Noman, M.Z.I.; Sati, K.; Yousuf, M.A.; Aloteibi, S.; Moni, M.A. LungCT-NET: An explainable transfer learning-based robust ensemble model for lung cancer diagnosis. Knowl. Based Syst. 2025, 324, 113854. [Google Scholar] [CrossRef] [Scilit]
- Priya, A.; Bharathi, P.S. SE-ResNeXt-50-CNN: A deep learning model for lung cancer classification. Appl. Soft Comput. 2025, 171, 112696. [Google Scholar] [CrossRef] [Scilit]
- Dwivedi, P.; Barage, S.; Jha, A.; Agrawal, A.; Singh, R.; Choudhury, S.; Rangarajan, V. Artificial intelligence assisted 18F-FDG PET radiomics in classifying histological subtypes of lung cancer: Systematic review and meta-analysis. Nucl. Med. Mol. Imaging 2026, 60, 79–92. [Google Scholar] [CrossRef] [Scilit]
- Zhang, J.; Zhang, X.; Zhong, Y.; Wang, J.; Zhong, C.; Xiao, M.; Chen, Y.; Zhang, H. PET radiomics for histologic subtype classification of non-small cell lung cancer: A systematic review and meta-analysis. Eur. J. Nucl. Med. Mol. Imaging 2025, 52, 2212–2224. [Google Scholar] [CrossRef] [Scilit]
- Mannepalli, D.; Kuan Tak, T.; Bala Krishnan, S.; Sreenivas, V. gSC-DViT: A vision transformer based deep learning model for lung cancer classification in CT images. Biomed. Signal Process. Control 2025, 103, 107371. [Google Scholar] [CrossRef] [Scilit]
- Armato, S.G., III; McLennan, G.; Bidaut, L.; McNitt-Gray, M.F.; Meyer, C.R.; Reeves, A.P.; Zhao, B.; Aberle, D.R.; Henschke, C.I.; Hoffman, E.A.; et al. The Lung Image Database Consortium and Image Database Resource Initiative: A completed reference database of lung nodules on CT scans. Med. Phys. 2011, 38, 915–931. [Google Scholar] [CrossRef] [Scilit]
- Setio, A.A.A.; Traverso, A.; de Bel, T.; Berens, M.S.; Bogaard, C.v.D.; Cerello, P.; Chen, H.; Dou, Q.; Fantacci, M.E.; Geurts, B.; et al. Validation, comparison, and combination of algorithms for automatic detection of pulmonary nodules in computed tomography images: The LUNA16 challenge. Med. Image Anal. 2017, 42, 1–13. [Google Scholar] [CrossRef] [Scilit]
- Shen, W.; Zhou, M.; Yang, F.; Yang, C.; Tian, J. Multi-scale convolutional neural networks for lung nodule classification. In Proceedings of IPMI; Springer: Cham, Switzerland, 2015; pp. 588–599. [Google Scholar] [CrossRef] [Scilit]
- Yu, J.; Li, T.; Shi, X.; Zhao, Z.; Chen, M.; Zhang, Y.; Wang, J.; Yao, Z.; Fang, L.; Hu, B. ETMO-NAS: An efficient two-step multimodal one-shot NAS for lung nodules classification. Biomed. Signal Process. Control 2025, 104, 107479. [Google Scholar] [CrossRef] [Scilit]
- Zhong, Y.; Cai, C.; Chen, T.; Gui, H.; Deng, J.; Yang, M.; Yu, B.; Song, Y.; Wang, T.; Sun, X.; et al. PET/CT-based cross-modal deep learning signature to predict occult nodal metastasis in lung cancer. Nat. Commun. 2023, 14, 7513. [Google Scholar] [CrossRef] [Scilit]
- Aksu, F.; Gelardi, F.; Chiti, A.; Soda, P. Multi-stage intermediate fusion for multimodal learning to classify non-small cell lung cancer subtypes from CT and PET. Pattern Recognit. Lett. 2025, 193, 86–93. [Google Scholar] [CrossRef] [Scilit]
- Hu, J.; Cheng, R.; Quan, M.; Peng, Y.; Yang, Z.; Zhang, Q.; Ji, F.; Chen, Y.; Li, B.; Wen, N. Hypermetabolic pulmonary lesions detection and diagnosis based on PET/CT imaging and deep learning models. Eur. J. Nucl. Med. Mol. Imaging 2025, 52, 3792–3806. [Google Scholar] [CrossRef] [Scilit]
- Guzman Gomez, R.; Lopez Lopez, G.; Alvarado, V.M.; Lopez, F.L.; Cisneros, E.E.; Moreno, H.L. Deep learning approaches for automated prediction of treatment response in non-small-cell lung cancer patients based on CT and PET imaging. Tomography 2025, 11, 78. [Google Scholar] [CrossRef] [Scilit]
- Xue, B.; Lan, J.; Chen, S.; Wang, L.; Xin, E.; Xie, J.; Zheng, X.; Wang, L.G.; Tang, K. Explainable PET-based intratumoral and peritumoral machine learning model for predicting visceral pleural invasion in clinical-stage IA non-small cell lung cancer: A two-center study. Clin. Radiol. 2025, 85, 106903. [Google Scholar] [CrossRef] [Scilit]
- Liu, X.; Ji, Z.; Zhang, L.; Li, L.; Xu, W.; Su, Q. Prediction of pathological complete response to neoadjuvant chemoimmunotherapy in non-small cell lung cancer using 18F-FDG PET radiomics features of primary tumour and lymph nodes. BMC Cancer 2025, 25, 520. [Google Scholar] [CrossRef] [Scilit]
- Attallah, O. Acute Lymphocytic Leukemia Detection and Subtype Classification via Extended Wavelet Pooling Based-CNNs and Statistical-Texture Features. Image Vis. Comput. 2024, 147, 105064. [Google Scholar] [CrossRef] [Scilit]
- Liu, L.; Jiang, J. Using stationary wavelet transformation for signal denoising. In Proceedings of the 8th International Conference on Fuzzy Systems and Knowledge Discovery; IEEE: Piscataway, NJ, USA, 2011; pp. 2203–2207. [Google Scholar] [CrossRef] [Scilit]
- Attallah, O. A Hybrid Trio-Deep Feature Fusion Model for Improved Skin Cancer Classification: Merging Dermoscopic and DCT Images. Technologies 2024, 12, 190. [Google Scholar] [CrossRef] [Scilit]
- Benhassine, N.E.; Boukaache, A.; Boudjehem, D. Medical image classification using the discriminant power analysis of discrete cosine transform coefficients. In Real Perspective of Fourier Transforms and Current Developments in Superconductivity; IntechOpen: London, UK, 2020. [Google Scholar] [CrossRef] [Scilit]
- Sharkas, M.; Attallah, O. Color-CADx: A Deep Learning Approach for Colorectal Cancer Classification Through Triple Convolutional Neural Networks and Discrete Cosine Transform. Sci. Rep. 2024, 14, 6914. [Google Scholar] [CrossRef] [Scilit]
- Szegedy, C.; Vanhoucke, V.; Ioffe, S.; Shlens, J.; Wojna, Z. Rethinking the Inception architecture for computer vision. In Proceedings of CVPR; IEEE: Piscataway, NJ, USA, 2016; pp. 2818–2826. [Google Scholar] [CrossRef] [Scilit]
- He, K.; Zhang, X.; Ren, S.; Sun, J. Deep residual learning for image recognition. In Proceedings of CVPR; IEEE: Piscataway, NJ, USA, 2016; pp. 770–778. [Google Scholar] [CrossRef] [Scilit]
- Huang, G.; Liu, Z.; van der Maaten, L.; Weinberger, K.Q. Densely connected convolutional networks. In Proceedings of CVPR; IEEE: Piscataway, NJ, USA, 2017; pp. 2261–2269. [Google Scholar] [CrossRef] [Scilit]
- Peng, H.; Long, F.; Ding, C. Feature selection based on mutual information: Criteria of max-dependency, max-relevance, and min-redundancy. IEEE Trans. Pattern Anal. Mach. Intell. 2005, 27, 1226–1238. [Google Scholar] [CrossRef] [Scilit]
- Pacal, I. Modern Vision Transformer Models for Accurate and Explainable Brain Tumor MRI Classification. OBM Neurobiol. 2026, 10, 352. [Google Scholar] [CrossRef] [Scilit]
- Ince, S.; Bayram, B.; Turkmen, H.; Pacal, I. A large-scale comparative study of YOLO-based detectors for ischemic stroke lesion localization on diffusion-weighted imaging. Neuroscience 2026, 612, 134–151. [Google Scholar] [CrossRef] [Scilit]
- Pacal, I.; Algarni, A.; Bayram, B.; Ince, S. FA-UNet: A FasterNet and attention-gated hybrid network for precise ischemic stroke segmentation. J. Integr. Neurosci. 2025, 24, 40100. [Google Scholar] [CrossRef] [Scilit]
- Pacal, I. Real-time You Only Look Once-based colorectal polyp detection for cancer screening across independent colonoscopy datasets. Eurasian J. Med. Oncol. 2026, 026220238. [Google Scholar] [CrossRef] [Scilit]
- Yilmaz, M.T.; Algul, E.; Pacal, I. Robust artificial intelligence frameworks for lung cancer subtyping and malignancy detection on thoracic CT. Sci. Rep. 2026, 16, 27223. [Google Scholar] [CrossRef] [Scilit]
- Qiao, L.; Chuprat, S. MEAA-Net: Memory-efficient asymmetric attention for resource-constrained lung nodule classification. IEEE Access 2026, 14, 18099–18114. [Google Scholar] [CrossRef] [Scilit]
- Siddiqui, E.A.; Chaurasia, V.; Shandilya, M. Detection and classification of lung cancer computed tomography images using a novel improved deep belief network with Gabor filters. Chemom. Intell. Lab. Syst. 2023, 235, 104763. [Google Scholar] [CrossRef] [Scilit]
- Shatnawi, M.Q.; Abuein, Q.; Al-Quraan, R. Deep learning-based approach to diagnose lung cancer using CT-scan images. Intell. Based Med. 2025, 11, 100188. [Google Scholar] [CrossRef] [Scilit]
- Chaddad, A.; Peng, J.; Wu, Y. Classification based deep learning models for lung cancer and disease using medical images. IEEE Trans. Radiat. Plasma Med. Sci. 2026, 10, 371–379. [Google Scholar] [CrossRef] [Scilit]
- Tawfeek, M.A.; Alrashdi, I.; Alruwaili, M.; Shaban, W.M.; Talaat, F.M. Enhancing the efficiency of lung cancer screening: Predictive models utilizing deep learning from CT scans. Neural Comput. Appl. 2025, 37, 11459–11477. [Google Scholar] [CrossRef] [Scilit]
- Sewatkar, R.M.; Y, A.V.P. MeVs-Deep CNN: Optimized deep learning model for efficient lung cancer classification. Multimed. Tools Appl. 2025, 84, 27517–27548. [Google Scholar] [CrossRef] [Scilit]
- Wei, J.; Zhou, L.; Zhang, D.; Guo, G.; Li, Z.; Fang, J.; Yan, X.; Li, Y.; Zhang, X.; Huang, C.; et al. Deep learning model for diagnosing and classifying subtypes of chronic pulmonary aspergillosis in chest CT. Mycoses 2025, 68, e70061. [Google Scholar] [CrossRef] [Scilit]
- Chen, Y.; Wan, Y.; Pan, F. Enhancing multi-disease diagnosis of chest X-rays with advanced deep-learning networks in real-world data. J. Digit. Imaging 2023, 36, 1332–1347. [Google Scholar] [CrossRef] [Scilit]
- Baltruschat, I.; Nickisch, H.; Grass, M.; Knopp, T.; Saalbach, A. Comparison of deep learning approaches for multi-label chest X-ray classification. Sci. Rep. 2019, 9, 6381. [Google Scholar] [CrossRef] [Scilit]
- Wang, X.; Peng, Y.; Lu, L.; Lu, Z.; Bagheri, M.; Summers, R.M. ChestX-ray8: Hospital-scale chest X-ray database and benchmarks on weakly-supervised classification and localization of common thorax diseases. In Proceedings of CVPR; IEEE: Piscataway, NJ, USA, 2017; pp. 3462–3471. [Google Scholar] [CrossRef] [Scilit]
- Wang, J.; Zhang, X.; Miao, Y.; Xue, S.; Zhang, Y.; Shi, K.; Guo, R.; Li, B.; Zheng, G. Data-efficient generalization of AI transformers for noise reduction in ultra-fast lung PET scans. Eur. J. Nucl. Med. Mol. Imaging 2025, 52, 3036–3050. [Google Scholar] [CrossRef] [Scilit]
- Nair, L.V.; Jerome, S.A. Optimized pixel level image fusion for lung cancer detection over MRI and PET image. Multimed. Tools Appl. 2025, 84, 1489–1511. [Google Scholar] [CrossRef] [Scilit]
- Apostolopoulos, I.D.; Papathanasiou, N.D.; Apostolopoulos, D.J.; Papageorgiou, E.I.; Papandrianos, N. A machine learning approach for determining solitary pulmonary nodule malignancy in patients undergoing PET/CT examination. Multimed. Tools Appl. 2025, 84, 39905–39924. [Google Scholar] [CrossRef] [Scilit]
- Zheng, C.; Cai, Y.; Miao, J.; Zheng, B.; Gao, Y.; Shen, C.; Bao, S.; Tan, Z.; Sun, C. A PET/CT-based 3D deep learning model for predicting spread through air spaces in stage I lung adenocarcinoma. Clin. Transl. Oncol. 2025, 27, 3364–3374. [Google Scholar] [CrossRef] [Scilit]
- Oh, J.E.; Chung, H.S.; Gwon, H.R.; Park, E.Y.; Kim, H.Y.; Lee, G.K.; Kim, T.; Hwangbo, B. Prediction of lymph node metastasis in lung cancer using deep learning of endobronchial ultrasound images with size on CT and PET-CT findings. Respirology 2025, 30, 515–522. [Google Scholar] [CrossRef] [Scilit]
- Trabelsi, M.; Romdhane, H.; Ben-Sellem, D. Thoracic staging of lung cancers by 18FDG-PET/CT: Impact of artificial intelligence on the detection of associated pulmonary nodules. Phys. Eng. Sci. Med. 2025, 48, 1095–1105. [Google Scholar] [CrossRef] [Scilit]
- Zuo, Z.; Zeng, Y.; Deng, J.; Lin, S.; Qi, W.; Fan, X.; Feng, Y. Intratumoral heterogeneity score enhances invasiveness prediction in pulmonary ground-glass nodules via stacking ensemble machine learning. Insights Imaging 2025, 16, 209. [Google Scholar] [CrossRef] [Scilit]
- Bradshaw, T.J.; Huemann, Z.; Hu, J.; Rahmim, A. A guide to cross-validation for artificial intelligence in medical imaging. Radiol. Artif. Intell. 2023, 5, e220232. [Google Scholar] [CrossRef] [Scilit]
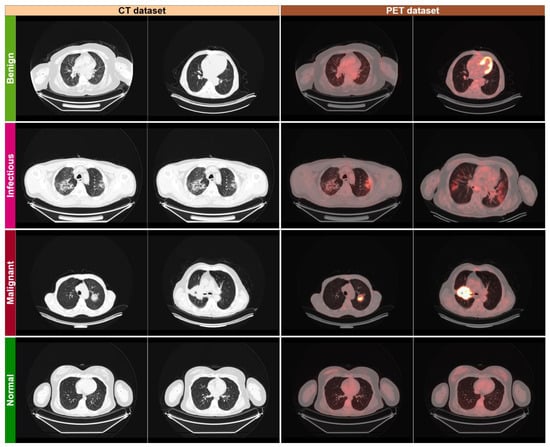
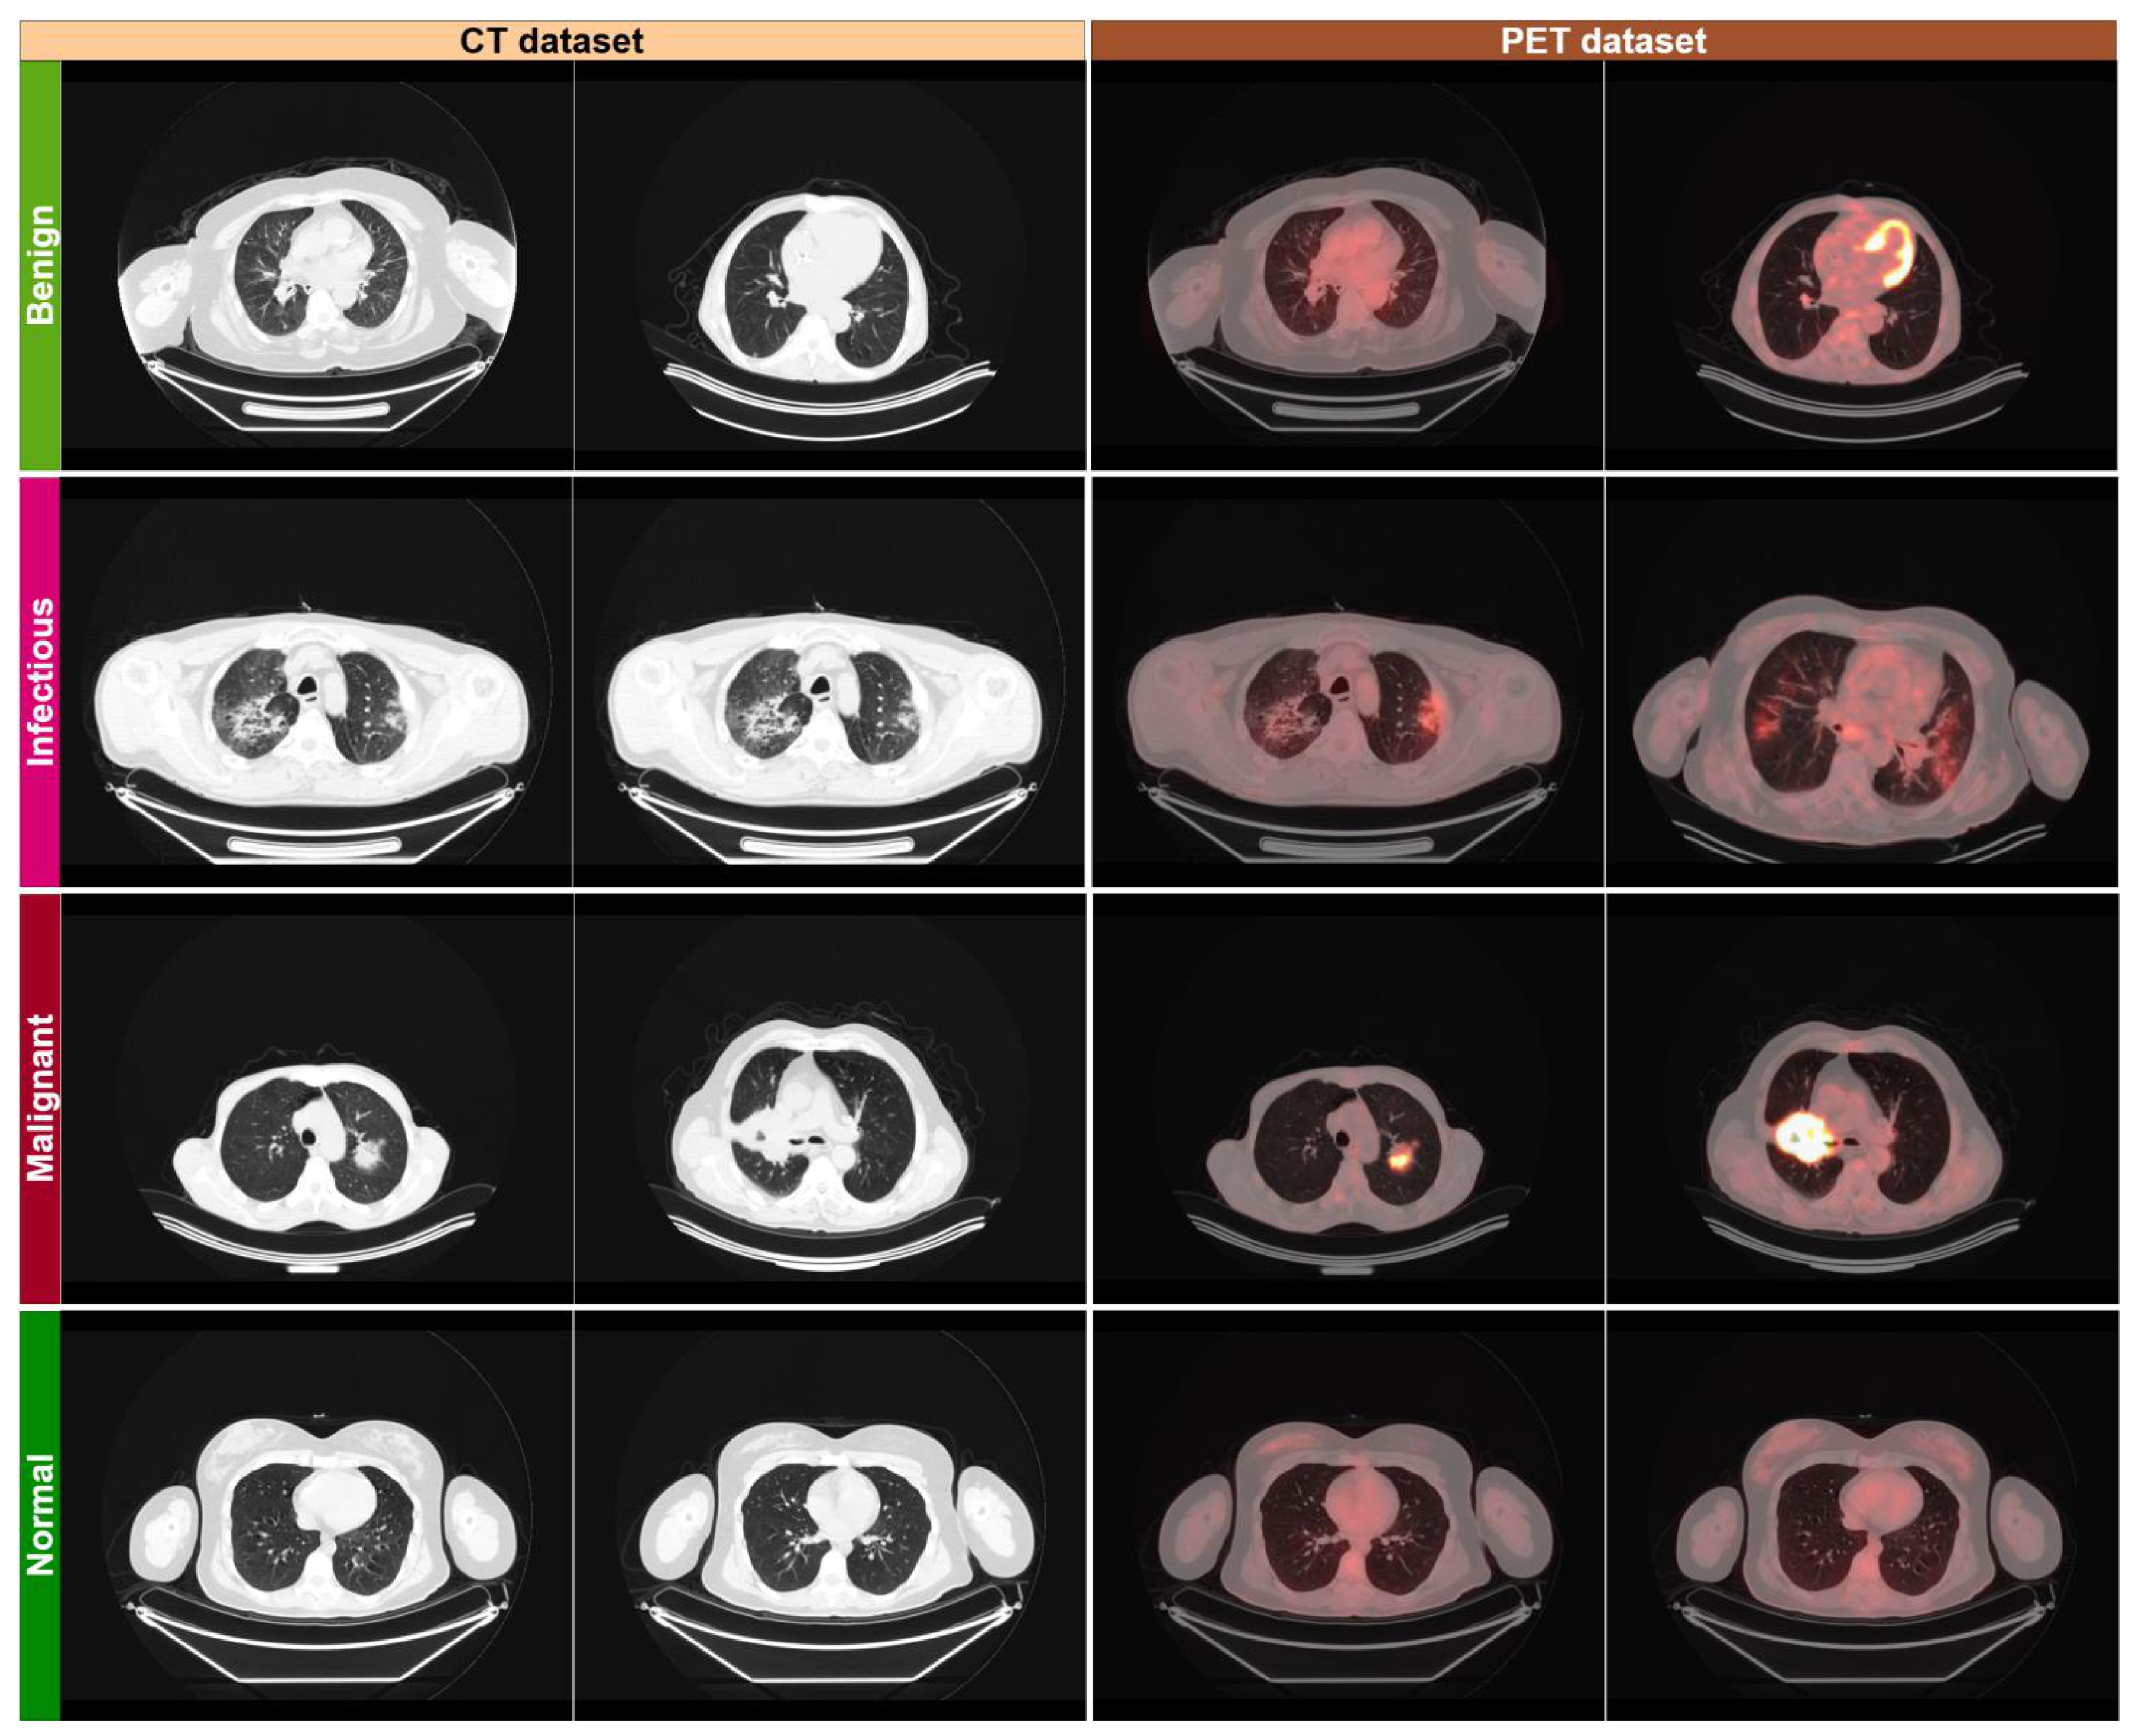
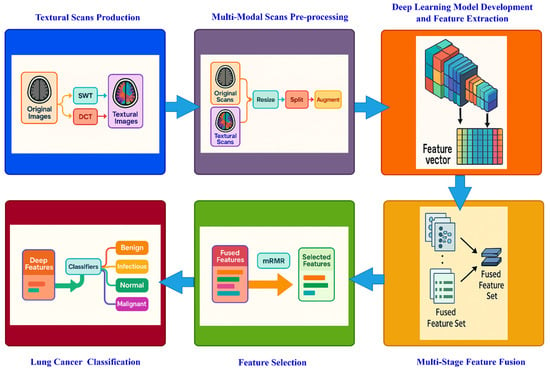
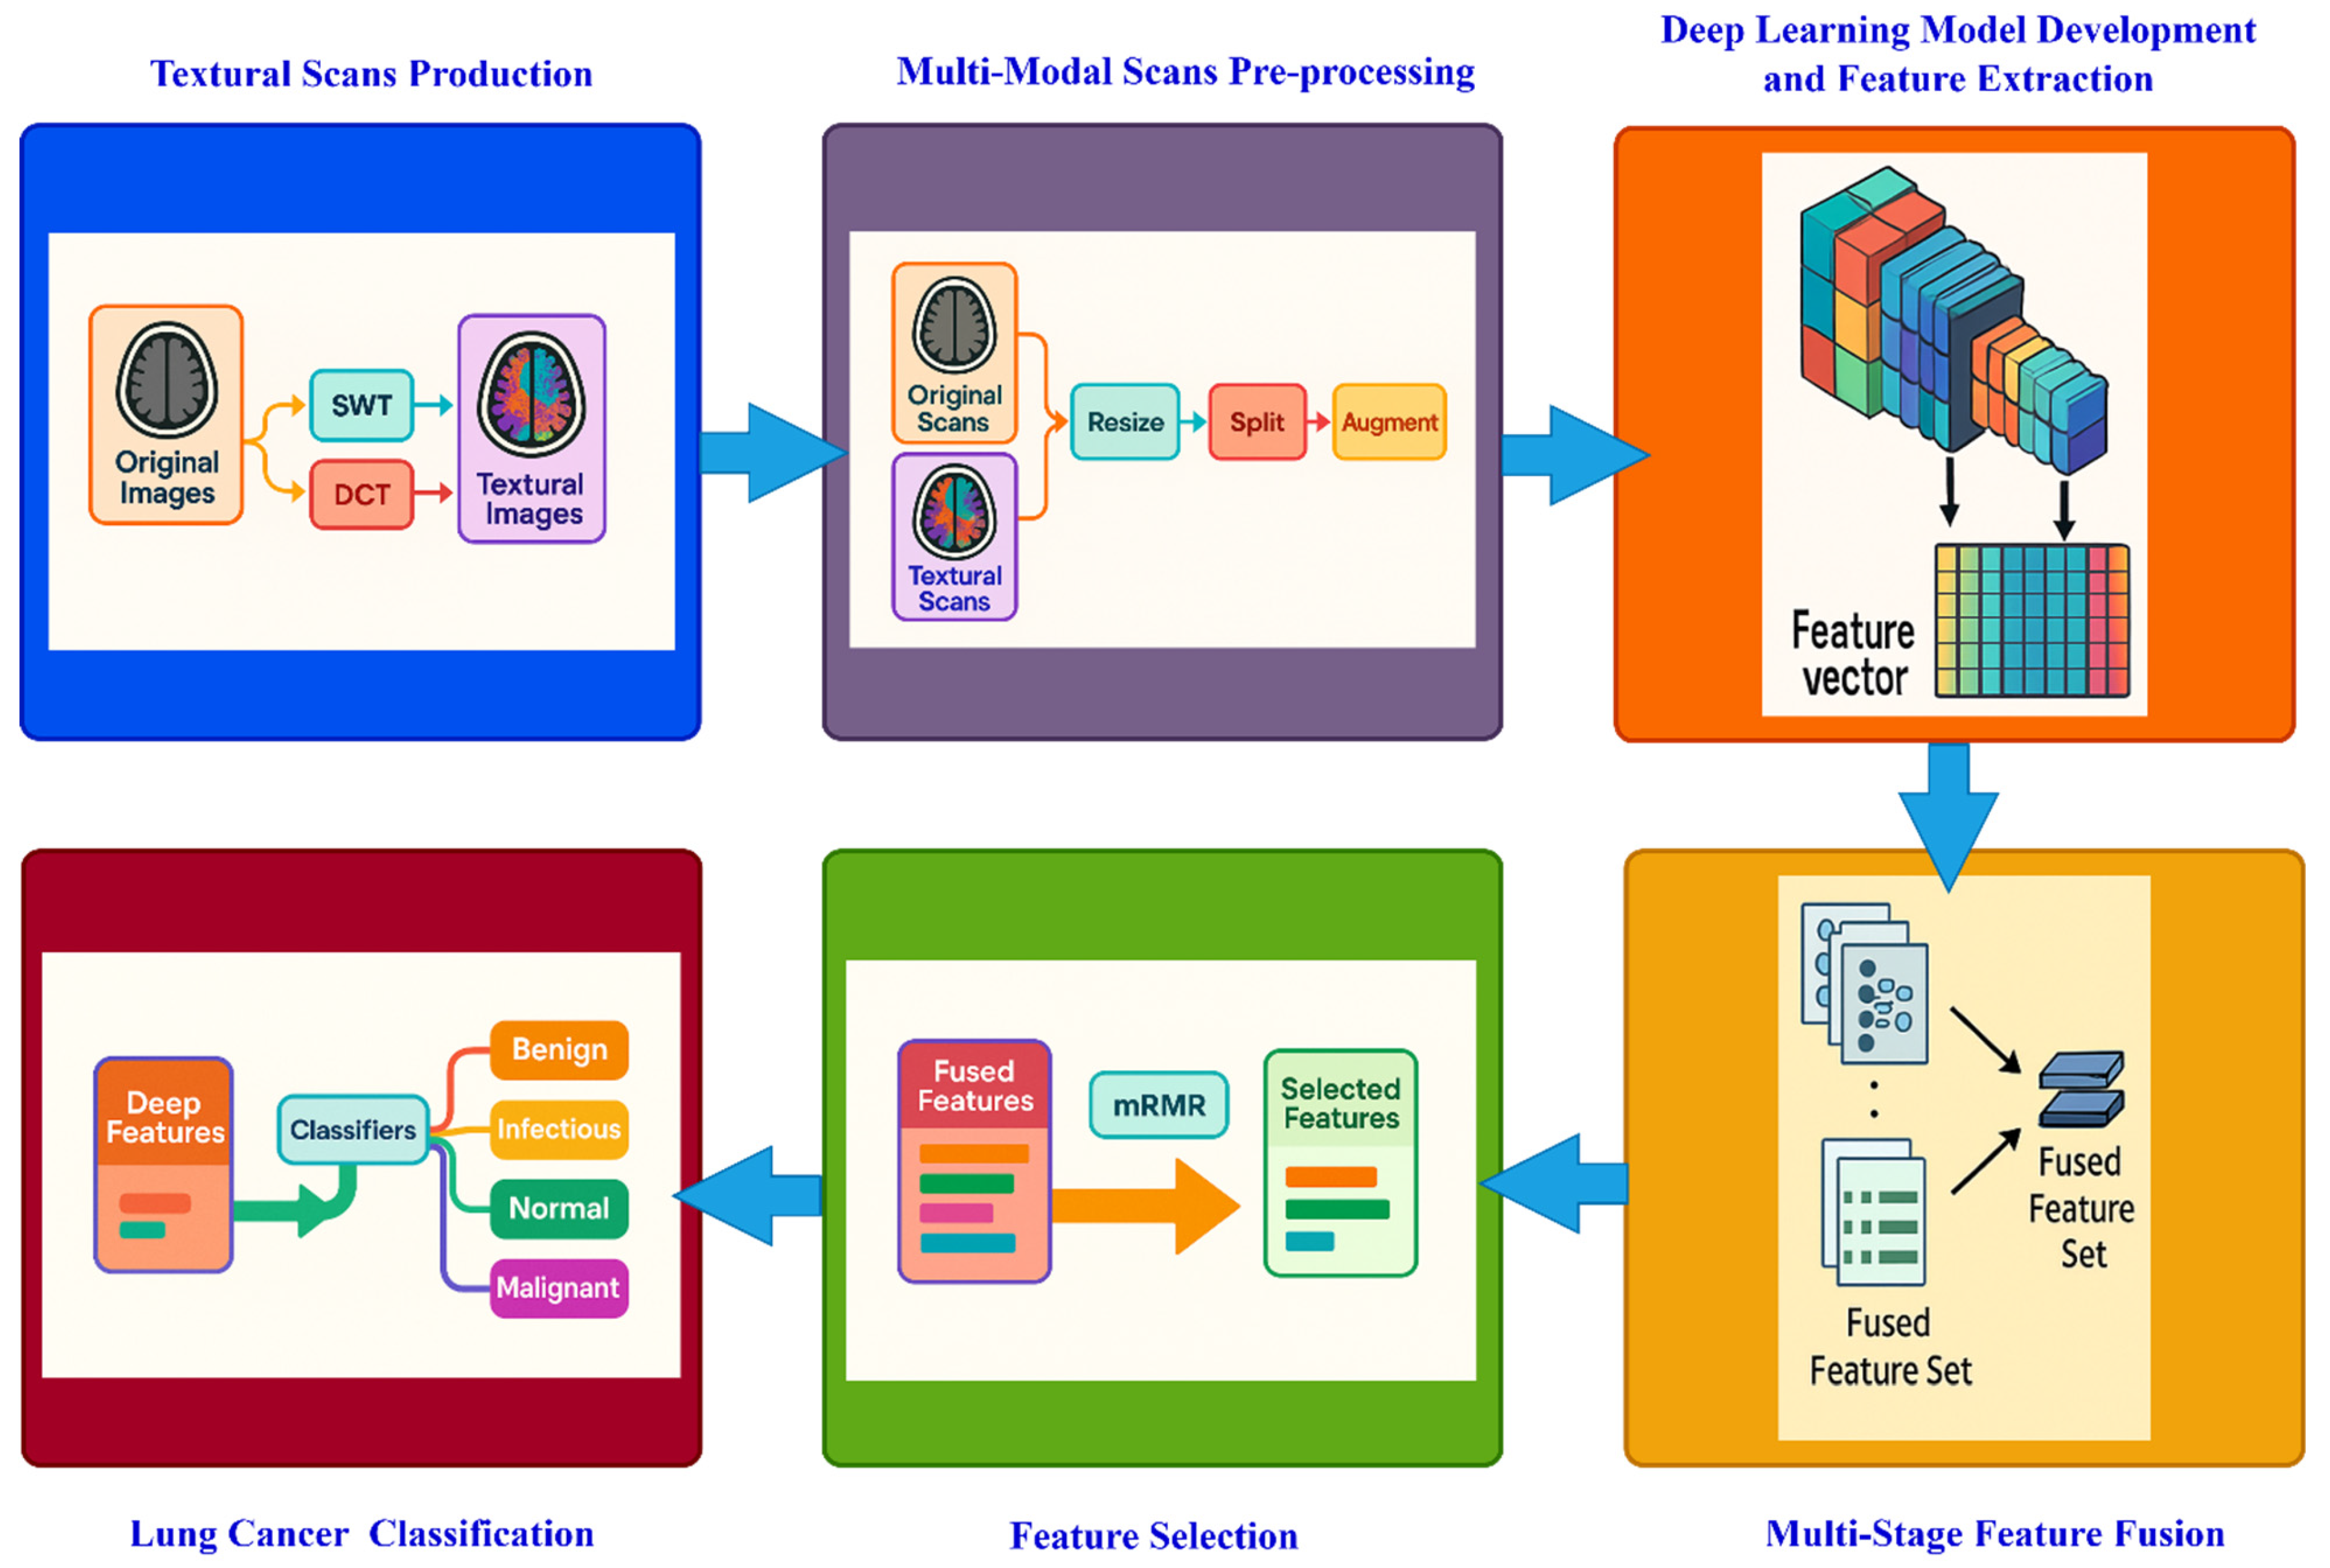
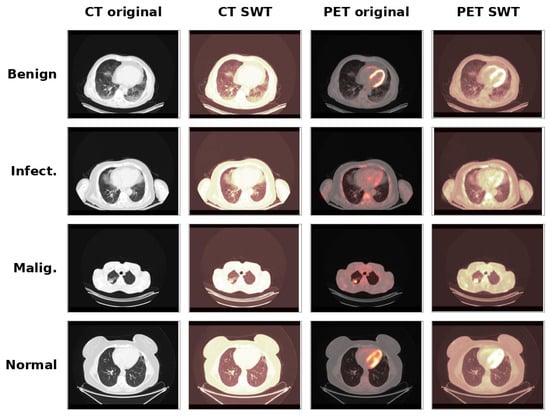
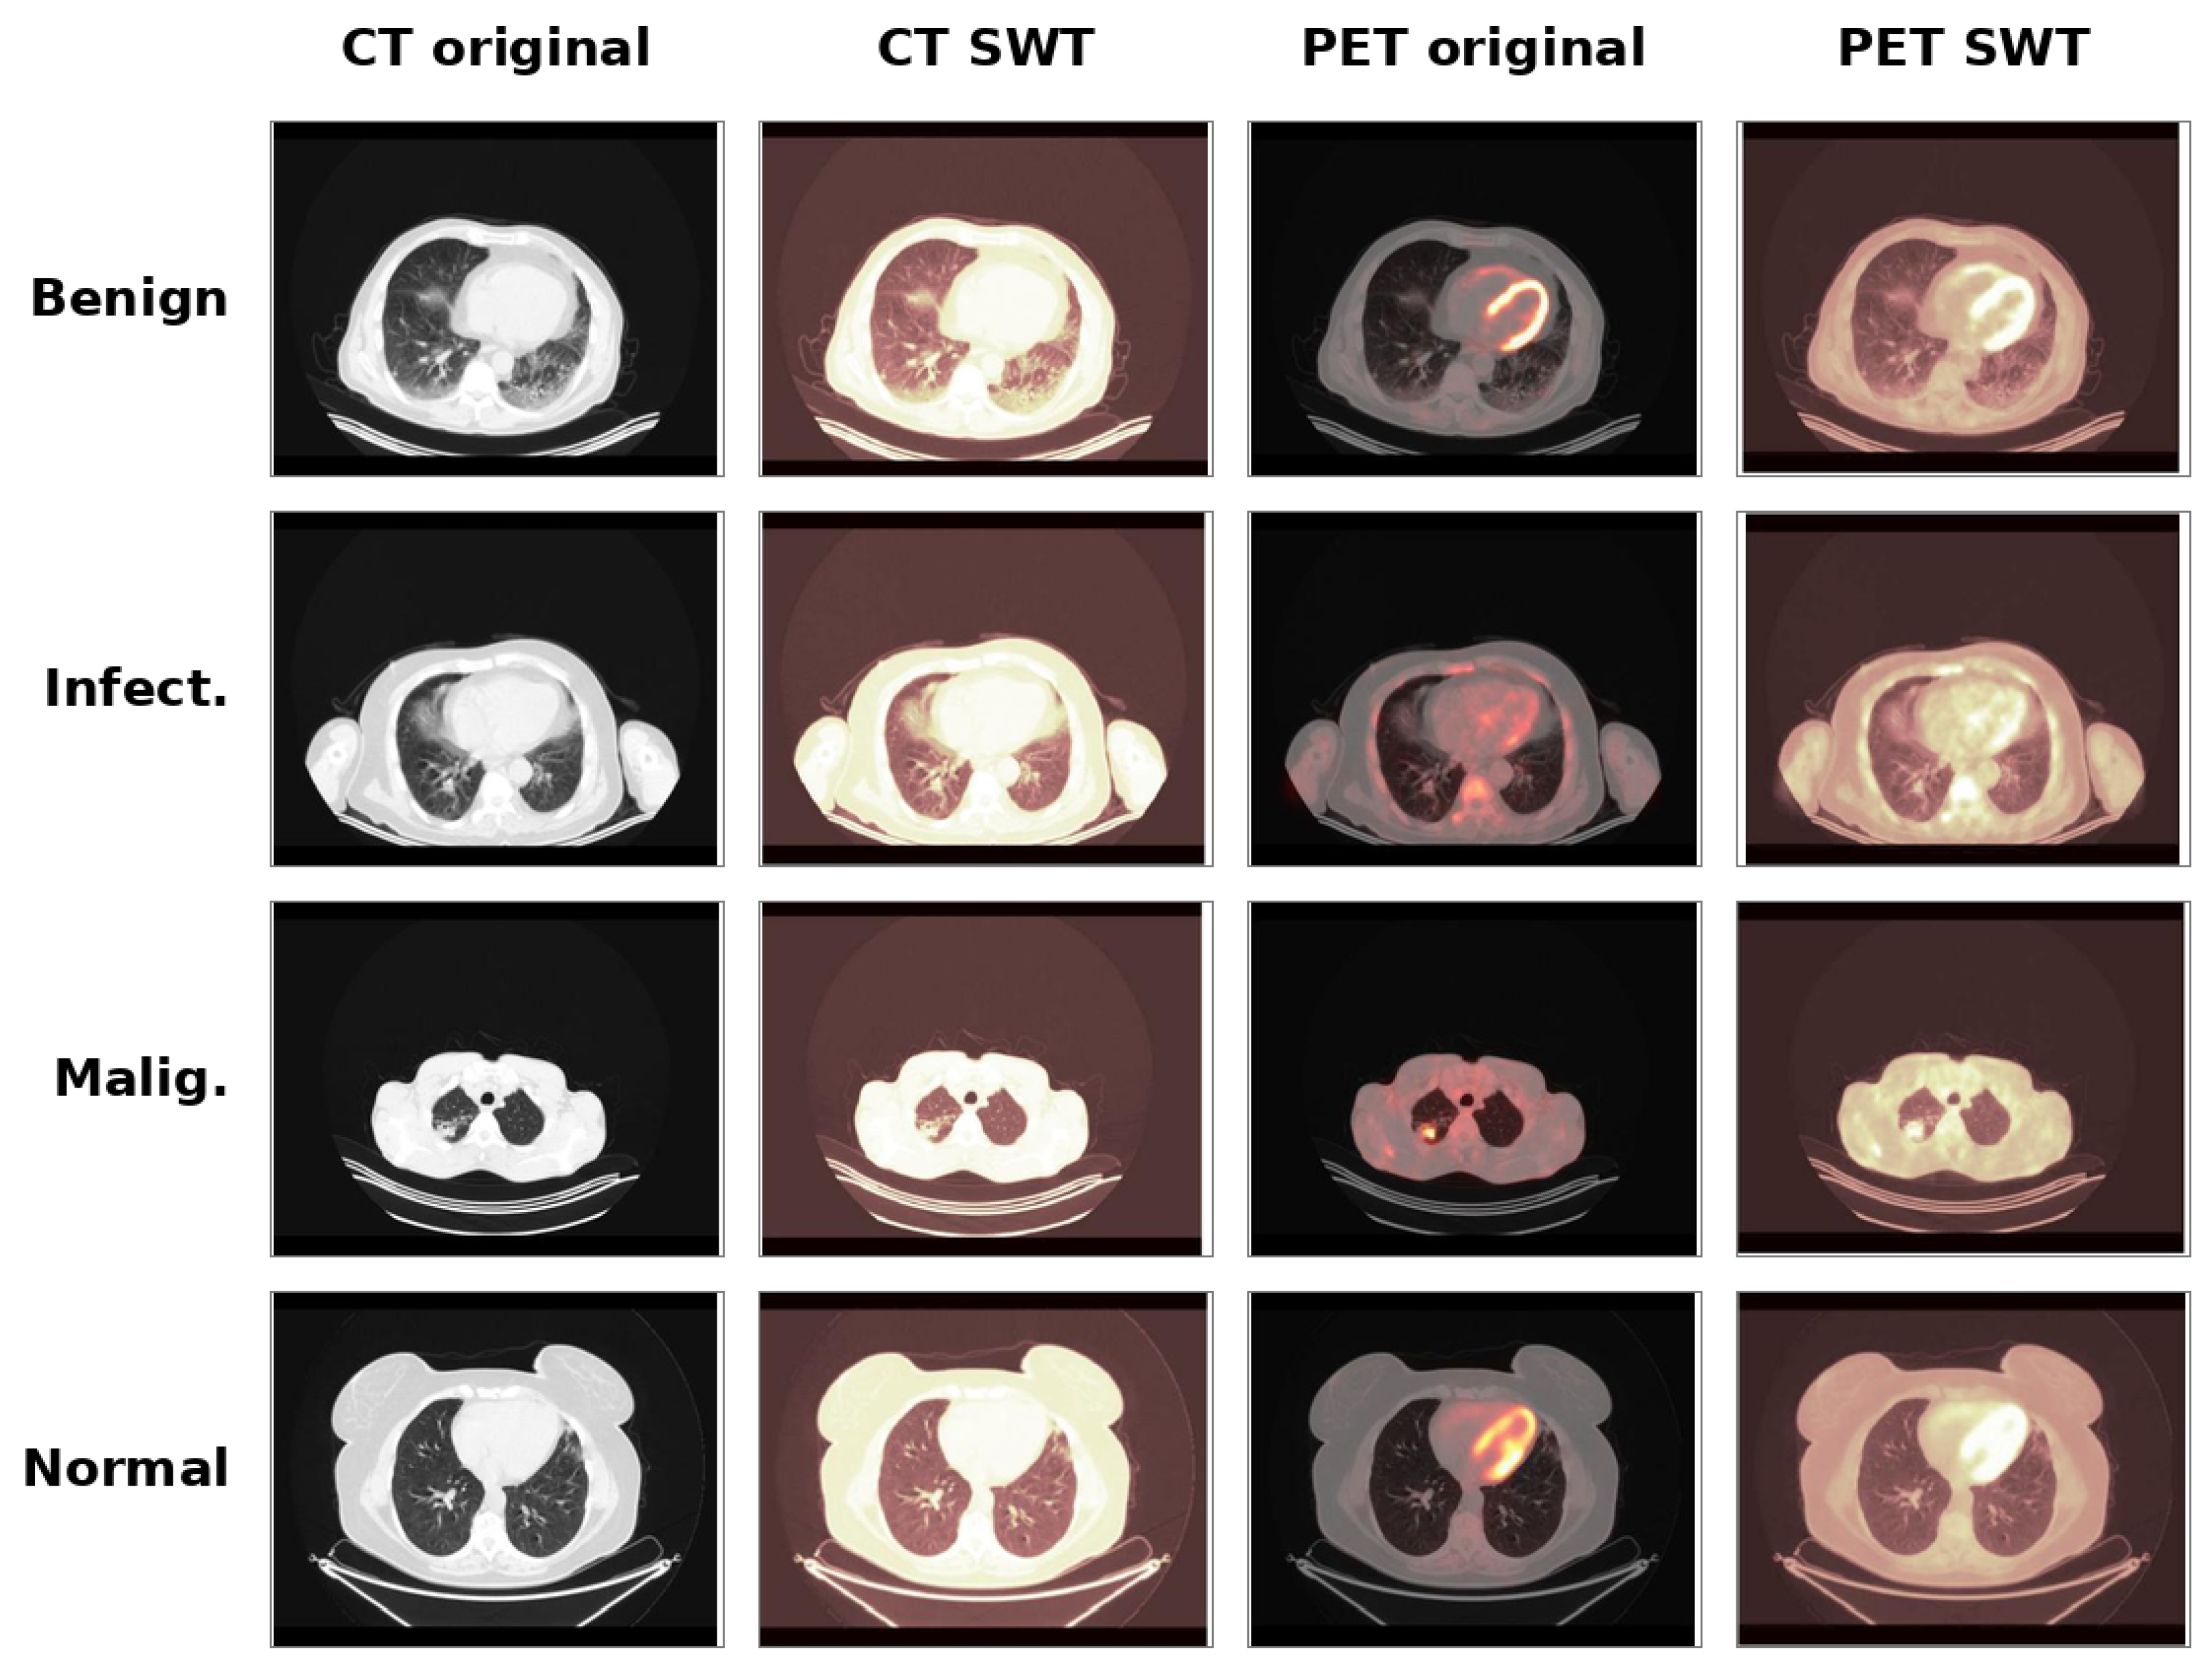
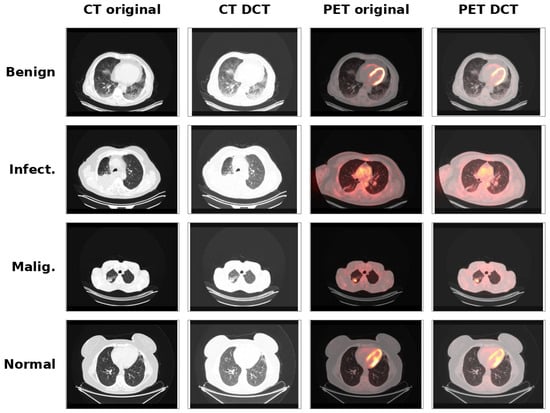
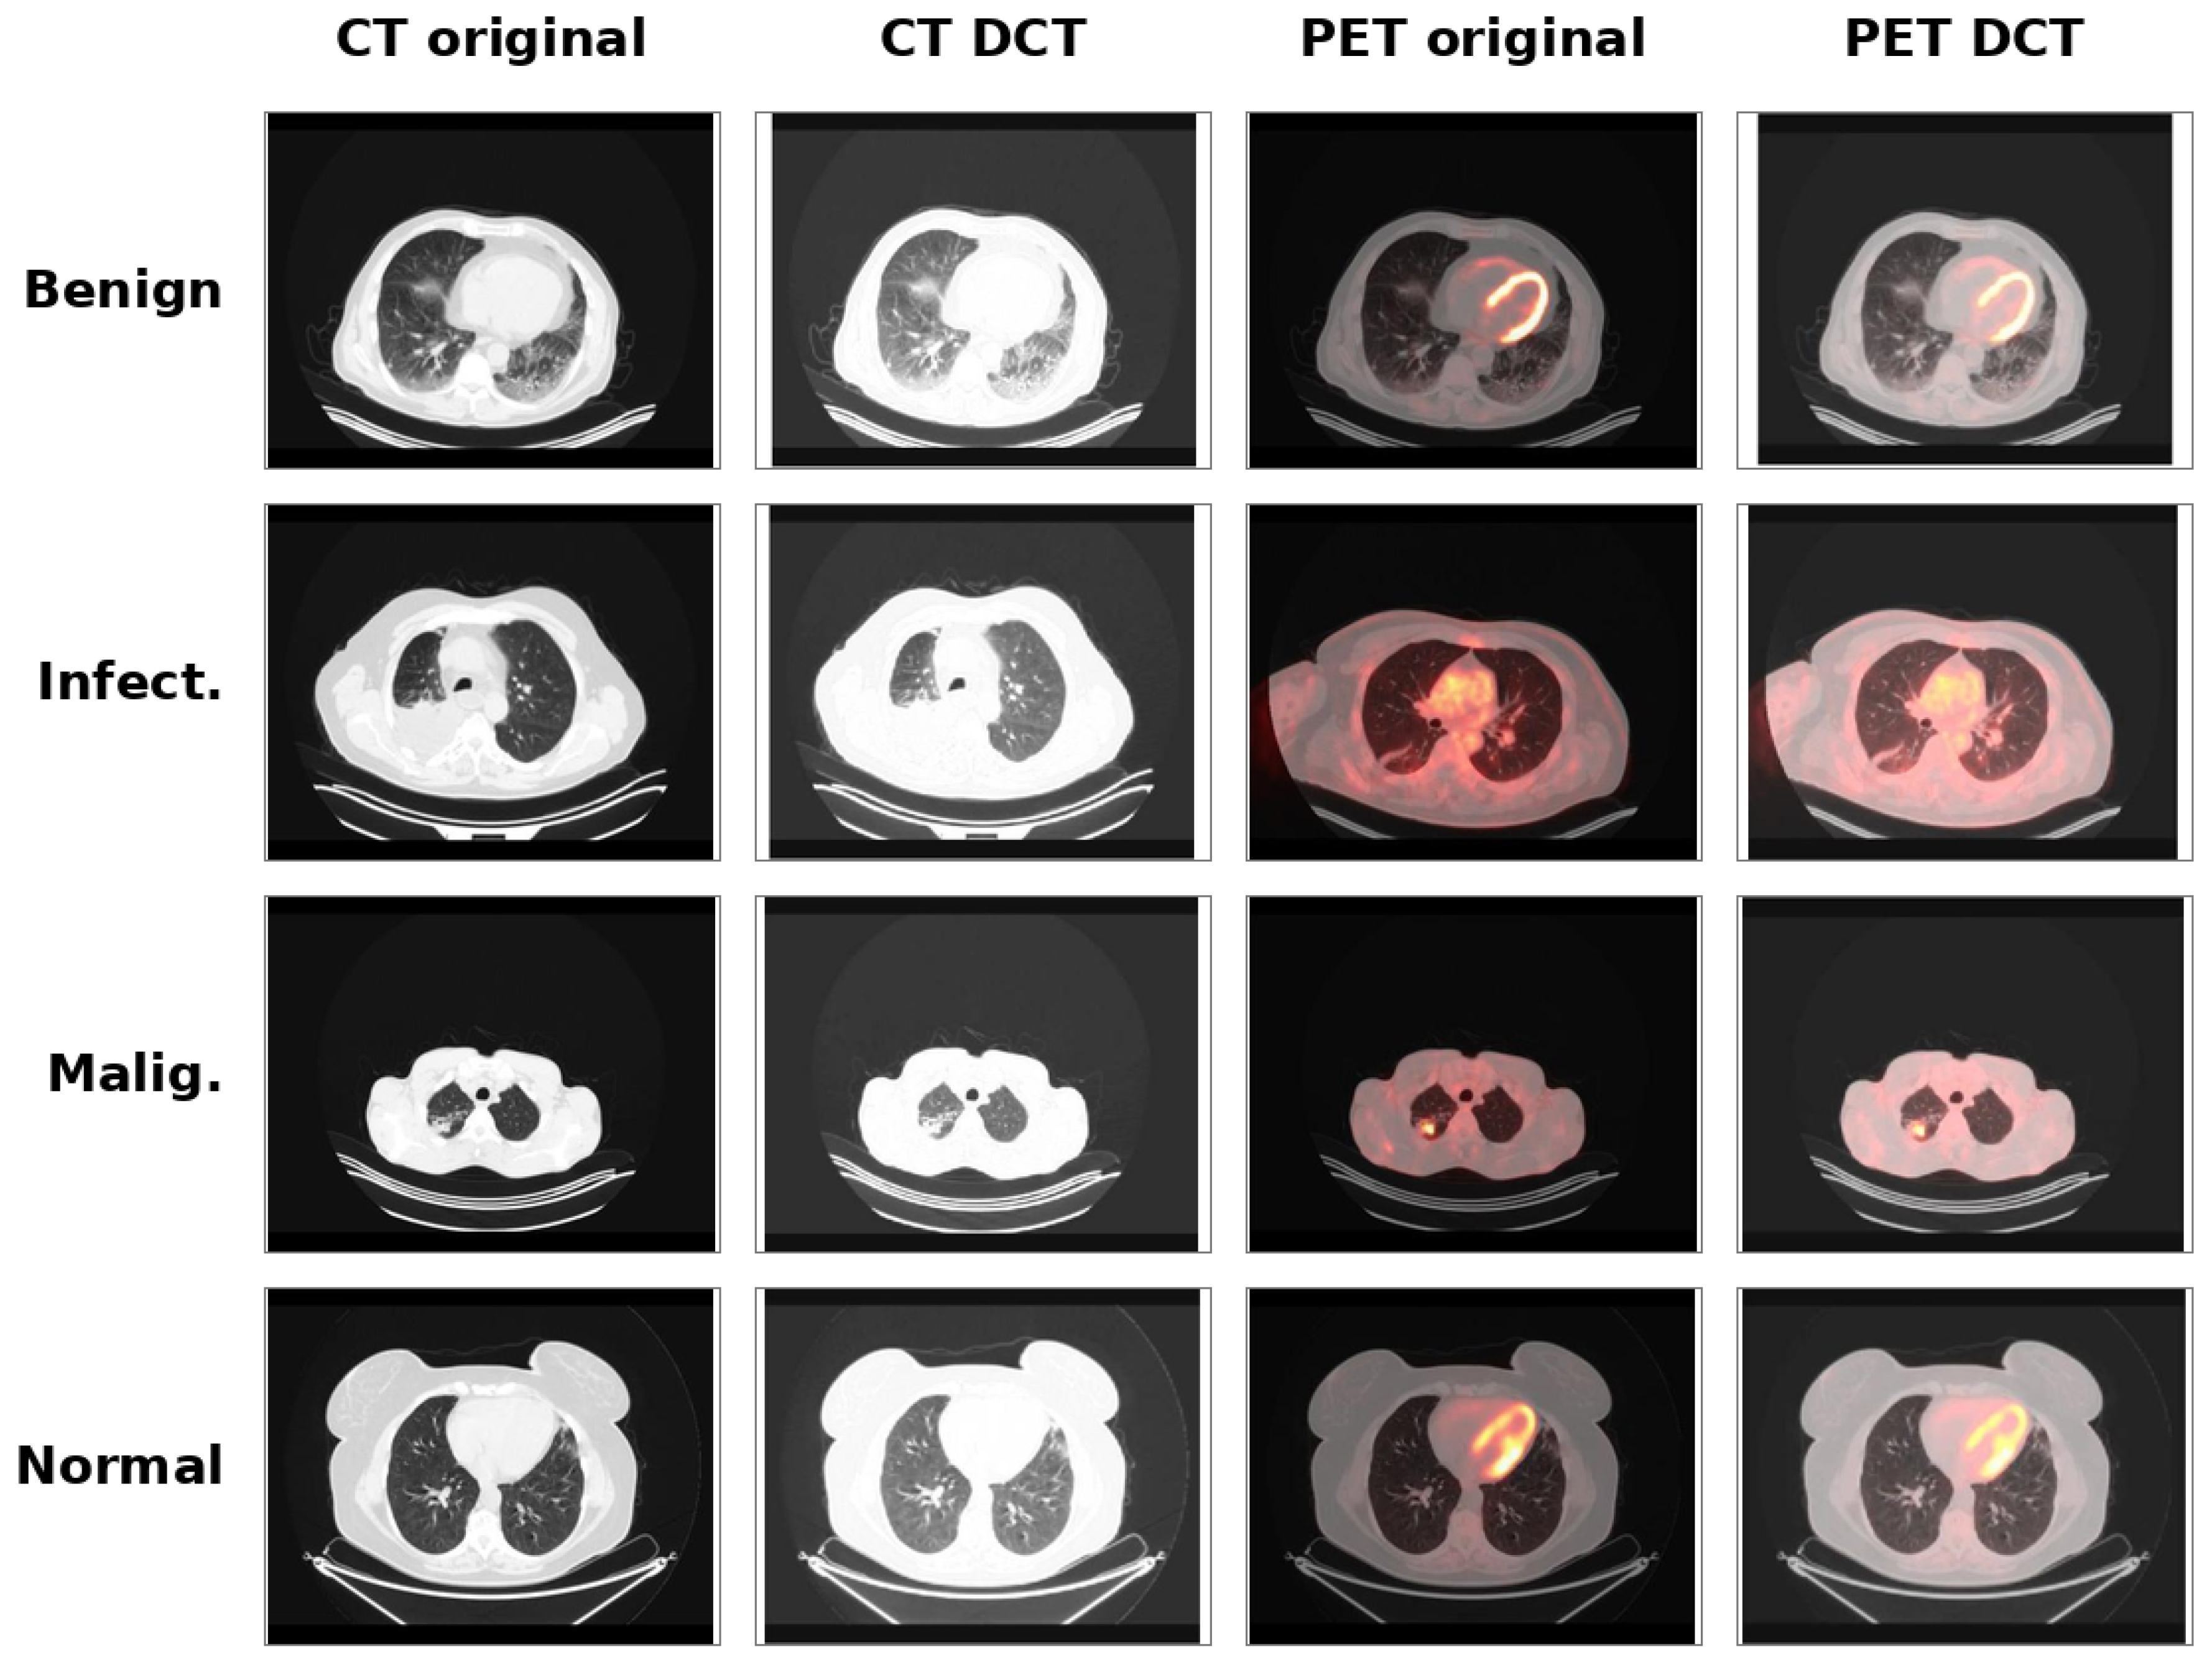
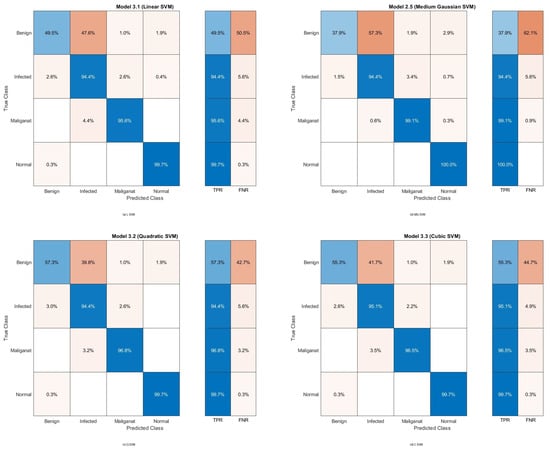
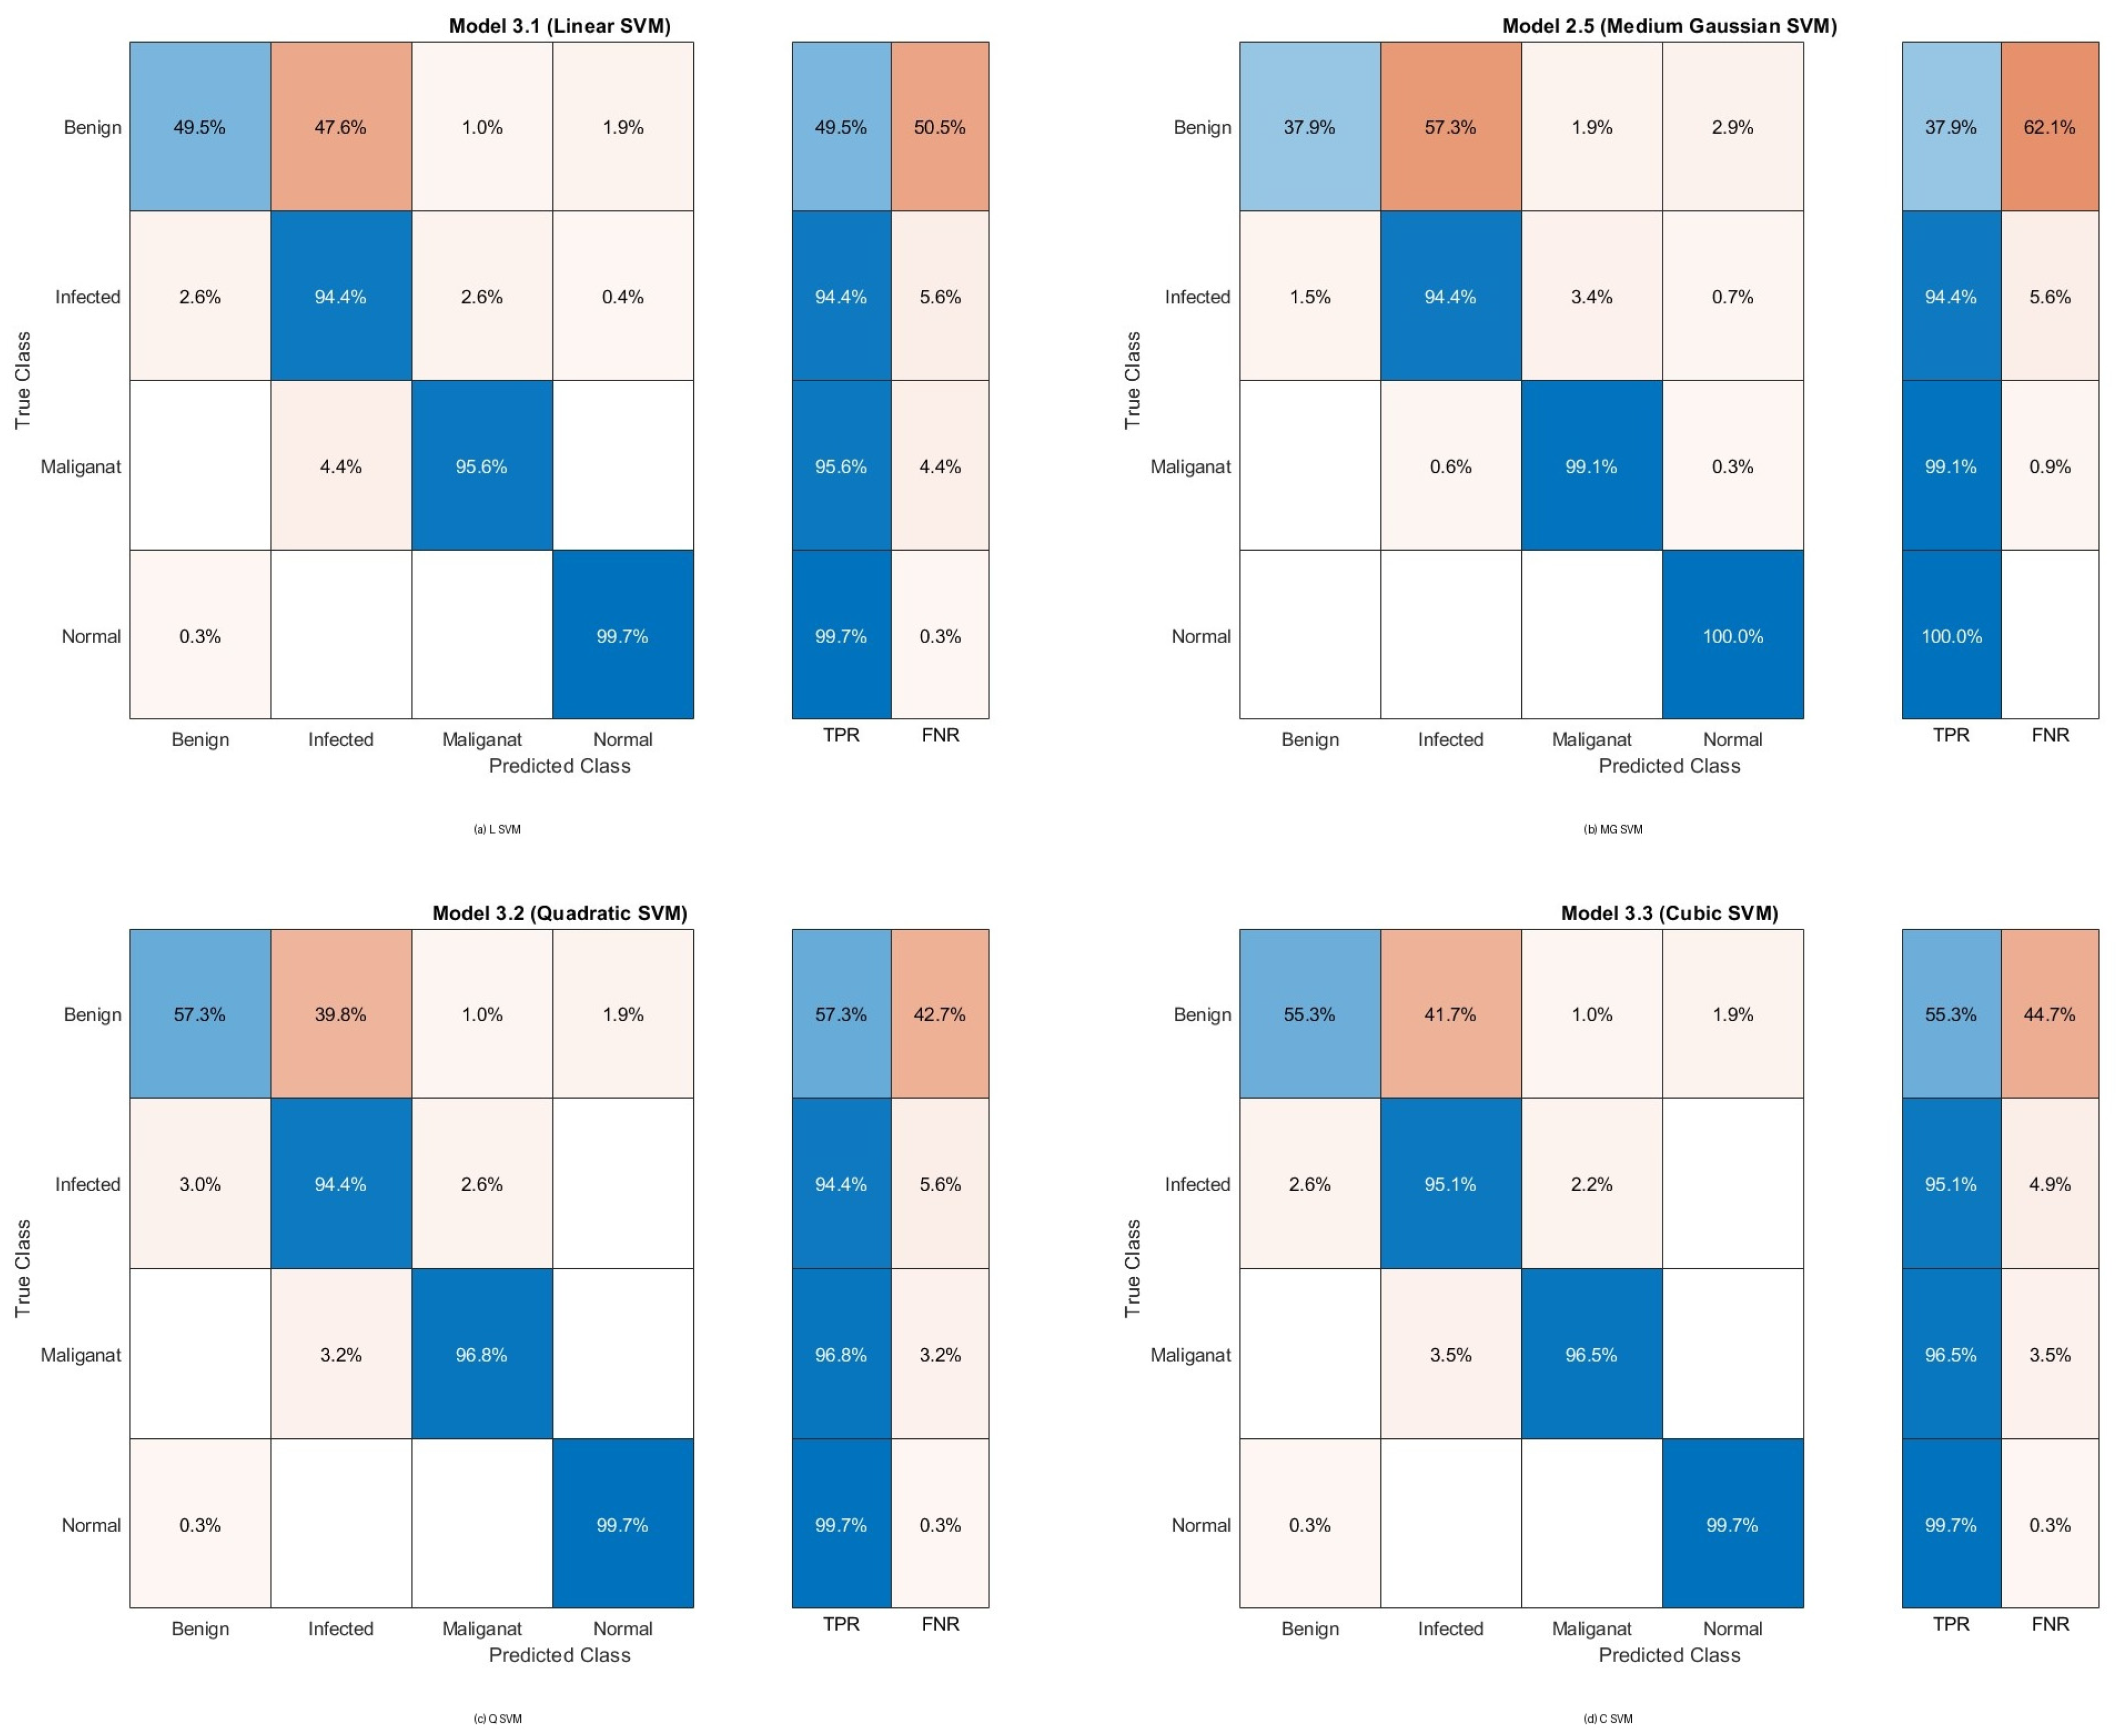
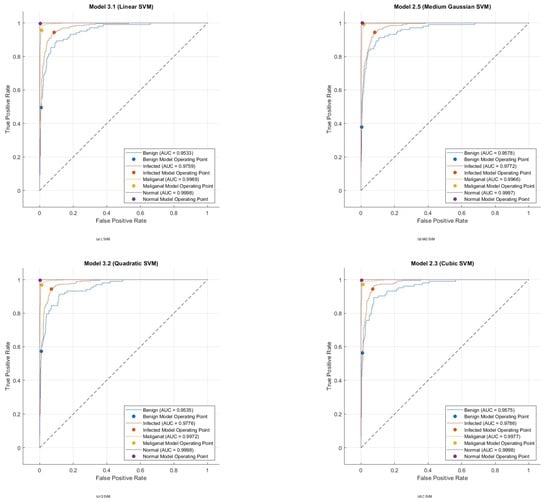
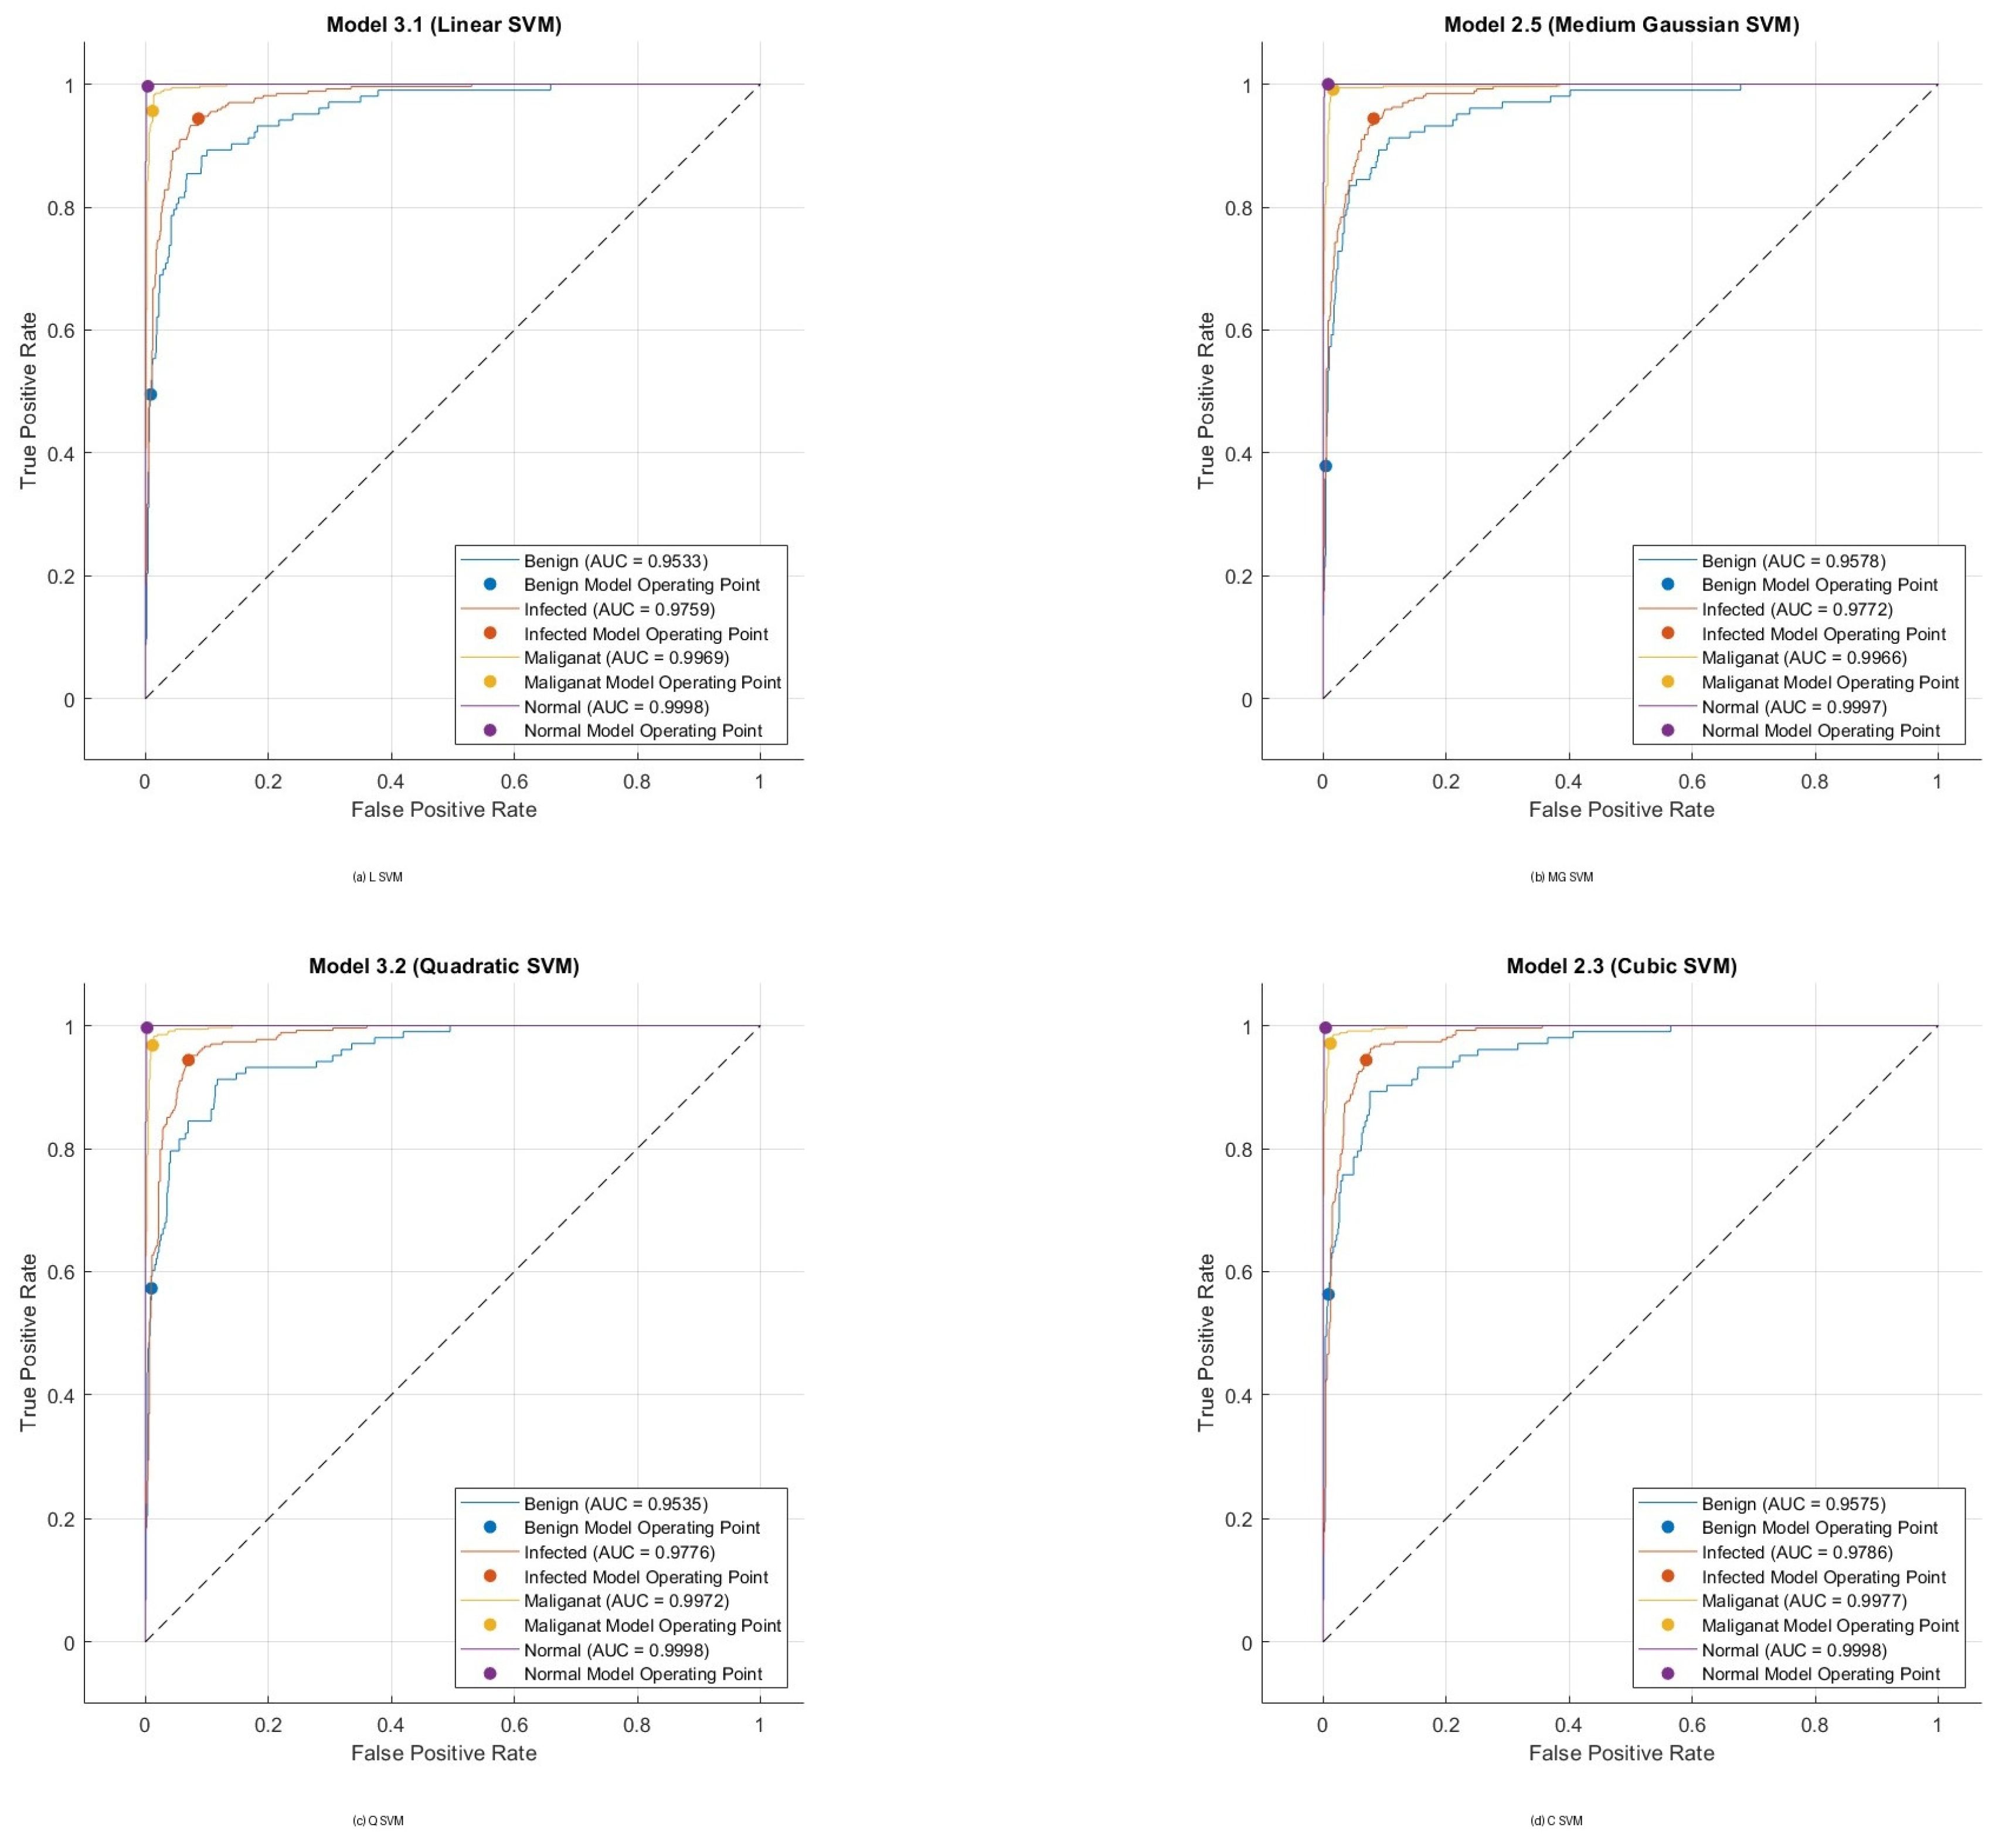
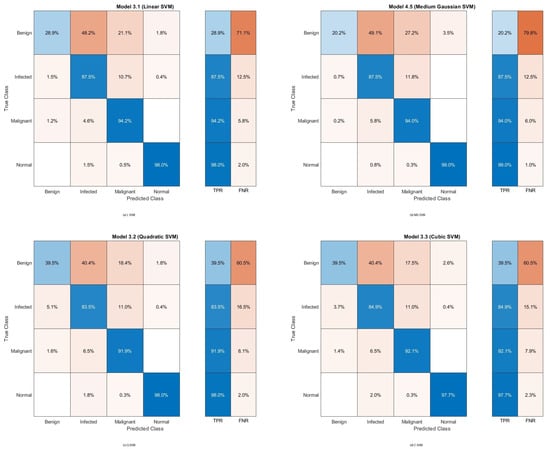
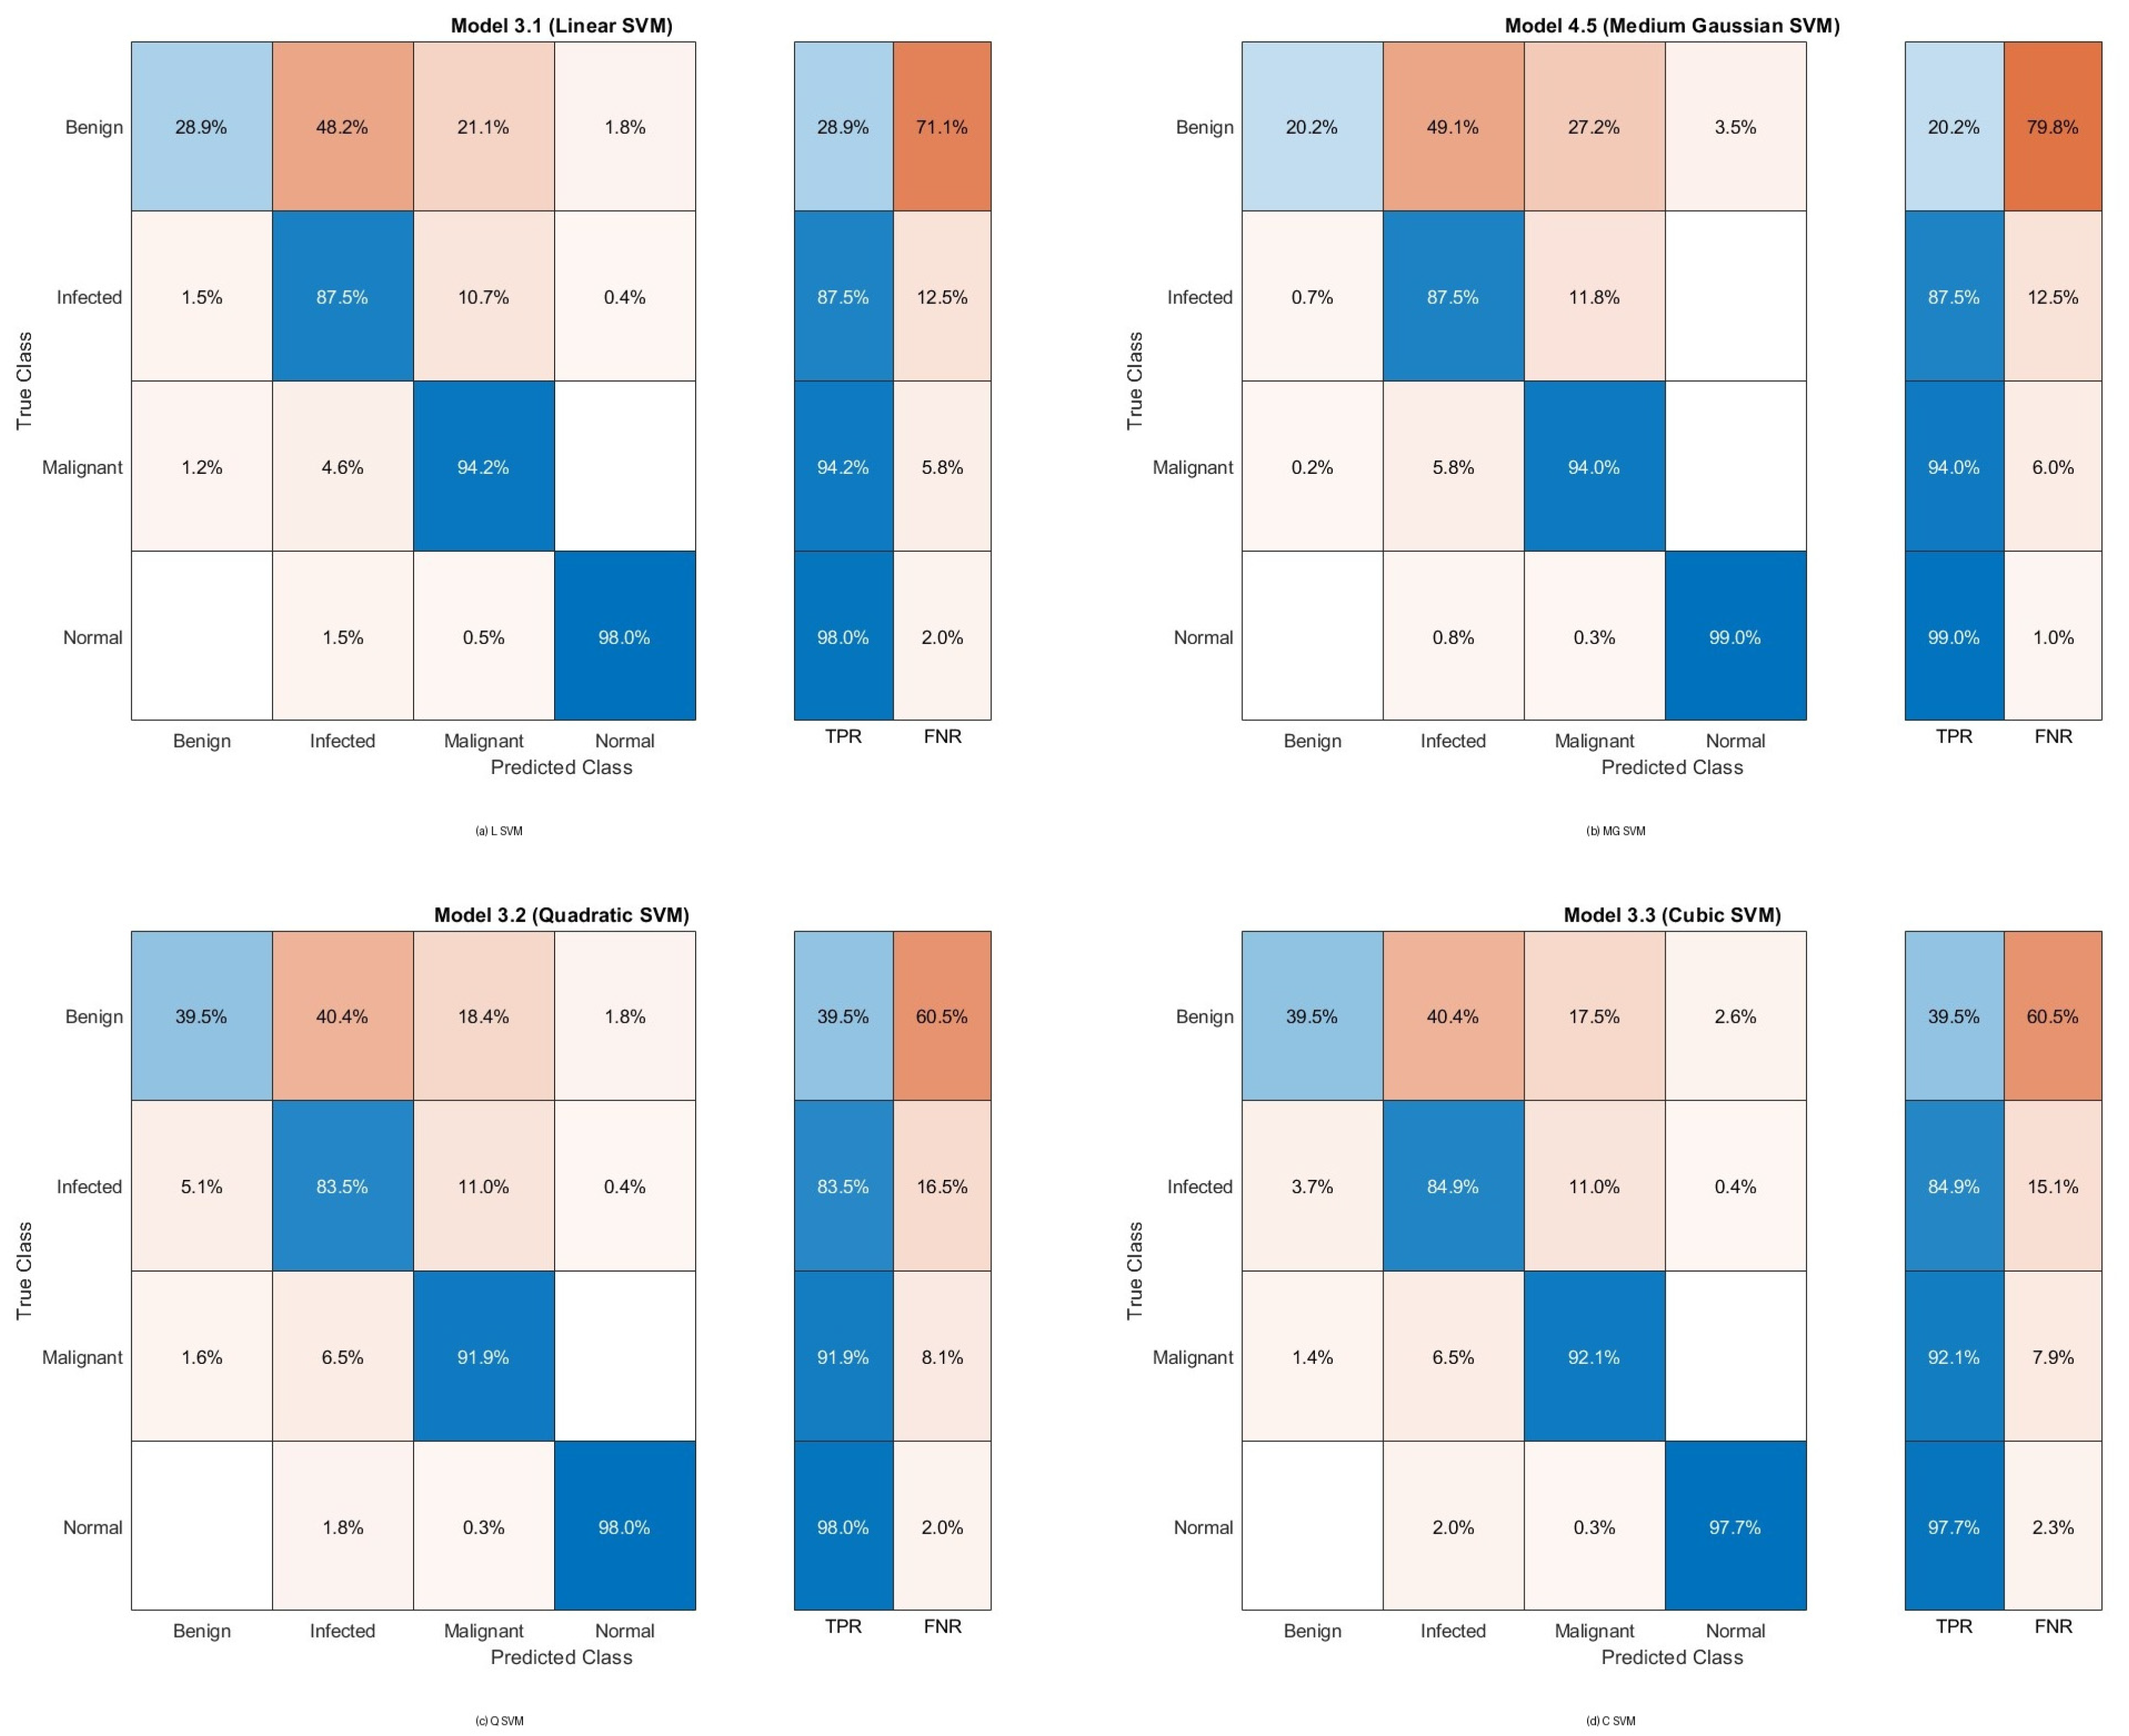
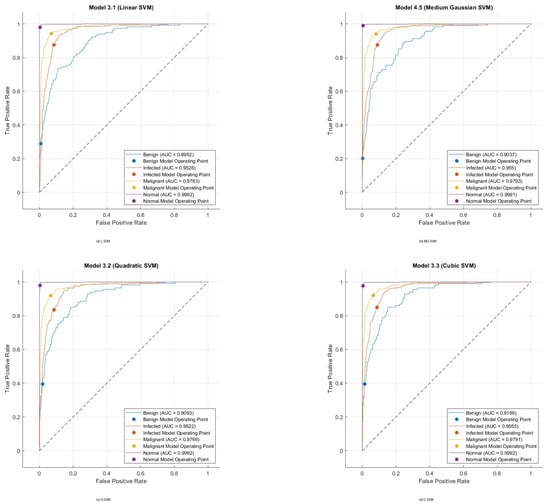
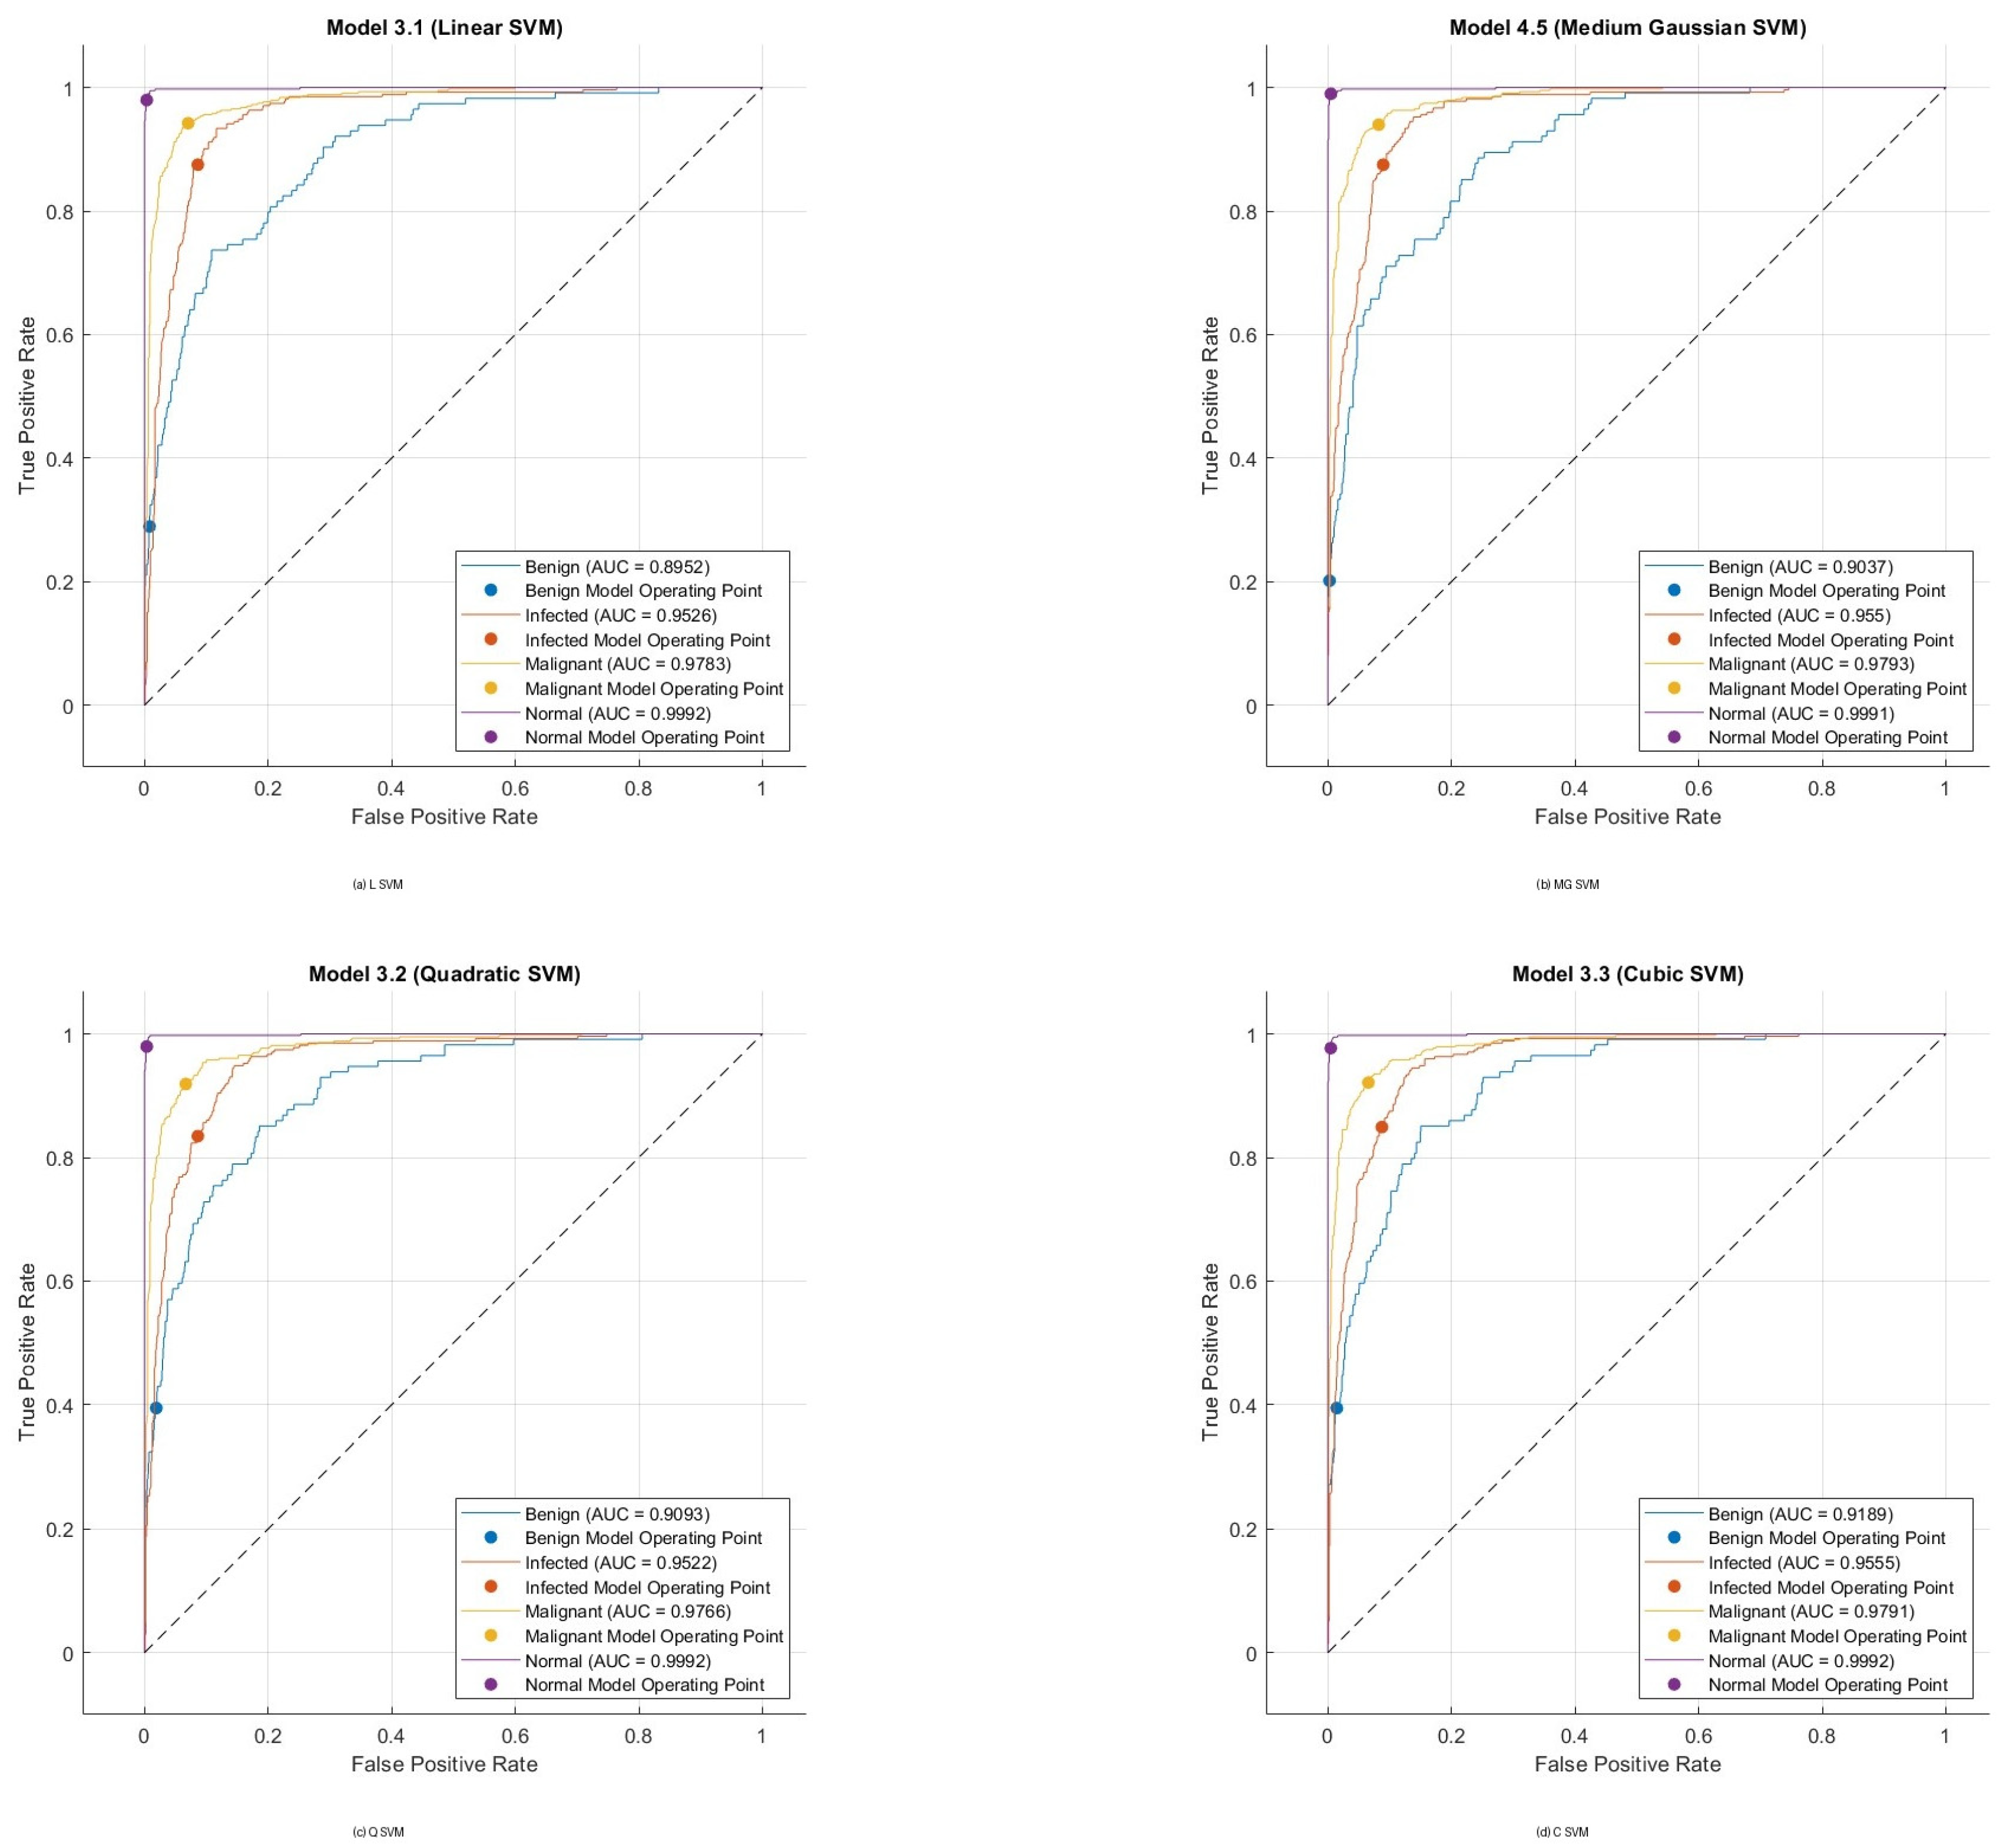

Disclaimer/Publisher’s Note: The statements, opinions and data contained in all publications are solely those of the individual author(s) and contributor(s) and not of MDPI and/or the editor(s). MDPI and/or the editor(s) disclaim responsibility for any injury to people or property resulting from any ideas, methods, instructions or products referred to in the content. |
© 2026 by the authors. Licensee MDPI, Basel, Switzerland. This article is an open access article distributed under the terms and conditions of the Creative Commons Attribution (CC BY) license.