


Abstract
This study develops a safety-aware supervisory framework for industrial fed-batch bioreactors by integrating an adaptive digital twin, fuzzy multi-objective optimization, Agentic LLM reasoning, and an independent Safety Governor within a closed-loop architecture. The digital twin continuously reconstructs process states and updates sensitive parameters, while α-cut fuzzy intervals preserve biological and operational uncertainty throughout prediction and optimization. The Agentic LLM coordinates prediction, optimization, process knowledge, and candidate evaluation, and supports context-dependent reevaluation and replanning as operating conditions evolve. The framework was evaluated using data from 12 industrial 72 h fed-batch runs, together with 600 uncertainty-aware simulated trajectories. Across three fully independent validation batches, the digital twin achieved an average NRMSE of 4.7%, MAPE of 4.4%, and R2 of 0.985. Closed-loop operation achieved a volumetric productivity of 0.347 g/L·h while maintaining a positive minimum dissolved-oxygen margin of 5 percentage points and zero hard-constraint violations. Across nominal and stressed scenarios, the Safety Governor preserved feasible operation with no residual hard-constraint violations, while the Agentic LLM successfully activated reevaluation and replanning following changes in process conditions. The ablation results further showed that the complete architecture provided the strongest overall balance among productivity, biological risk, robustness, and disturbance recovery. These findings demonstrate the value of combining adaptive process representation, uncertainty-aware optimization, agentic supervisory reasoning, and independent safety validation for reliable intelligent bioprocess operation.
1. Introduction
Fed-batch processes play an important role in the industrial production of bioproducts, as they allow for the gradual adjustment of feed, control of cell growth, and management of metabolic conditions over time. However, the performance of these processes depends on the complex interplay between growth kinetics, substrate consumption, product and side metabolite formation, oxygen transport, and equipment limitations [1]. The biological variability and time dependence of these variables mean that an operating policy that is appropriate at the beginning of a batch may not necessarily be optimal at later stages. Therefore, moving from fixed setpoint-based control to adaptive, predictive, and real-time decision-making has become a key requirement for advanced biomanufacturing [2].
The digital twin is one of the most important infrastructures in this transformation. In biological applications, a digital twin can integrate measured data with mechanistic or hybrid models, reconstruct process states, and predict system responses to operational decisions [1,2]. The development of Process Analytical Technology, online sensors, and data connectivity architectures has also enhanced the possibility of continuously updating such models [3]. In the broader perspective of Bioprocessing 4.0, the value of a digital twin lies not only in creating a virtual version of the equipment, but also in transforming sparse data into information that can be used for prediction, optimization, and operational decision-making [4]. However, for a decision-oriented use of a digital twin, the model must be able to track the changing biological and operational conditions during the batch and reflect the uncertainty in the parameters in subsequent decisions.
This becomes even more important when several conflicting objectives are at stake. In an industrial bioreactor, increasing productivity may require higher feed rates, increased agitation intensity, or the use of more enriched oxygen—decisions that may increase energy consumption, operating costs, or the risk of approaching biological limits. Multi-objective optimization for fed-batch processes has shown that the use of the Pareto front can reveal such conflicts and, rather than imposing a single solution, generate a set of selectable operating policies [5]. However, if parameters such as specific growth rate, biomass yield, substrate saturation constant, or oxygen-transfer capacity are represented by fixed values, the resulting decision may not adequately reflect the true variability in the process. Therefore, it is essential to incorporate uncertainty into the optimization model in a structured manner to achieve decisions that are reliable even under changing conditions [6].
At the same time, the development of large language models has opened up new opportunities for creating intelligent layers in Process System Engineering. Recent studies have shown that Generative AI can play a role in organizing engineering knowledge, interacting with computational tools, decomposing tasks, and supporting design and optimization processes [7]. The development of Agentic AI has taken this capability a step further, introducing the possibility of combining reasoning, tooling, and executing multi-step sequences in process engineering problems [8]. Despite this capacity, placing an LLM in the direct control path of a sensitive biological system is not defensible from an engineering standpoint because numerical decision-making, feasibility assessment, and safety-constraint assurance must still be performed by evaluable computational models and mechanisms. This creates a significant gap between the reasoning capabilities of linguistic models and the reliability requirements of process decision-making. The present study addresses this gap by developing a Safety-Aware Agentic LLM–Digital Twin framework for multi-objective control of a fed-batch bioreactor under fuzzy uncertainty. The innovation of the framework lies not in the juxtaposition of technologies, but in the definition of a clear boundary of responsibility between them. The adaptive digital twin estimates the process states and updates selected parameters based on new data; the optimization model simultaneously considers four objectives of productivity, energy consumption, operating cost, and biological risk; and the uncertainty of key parameters is preserved in the model with triangular fuzzy numbers and α-cut, without being removed by early defuzzification. At the supervisory level, the Agentic LLM functions as the reasoning and orchestration core that connects the synchronized digital twin, uncertainty representation, optimization solver, and process knowledge base within a unified decision cycle. It integrates the evolving process state, uncertainty information, operational priorities, policy knowledge, and recent decision history to determine which computational capabilities should be activated, updated, or revisited at each stage. The agent evaluates the completeness and consistency of the available evidence, interprets the current operating context, coordinates prediction, optimization, knowledge retrieval, and candidate evaluation, and initiates reevaluation or replanning whenever the process state or decision context changes. In this way, the Agentic LLM provides the adaptive supervisory intelligence that transforms the outputs of individual computational modules into a coherent, context-aware, and continuously updated decision process.
The most important distinction of the framework is the complete separation of reasoning from execution authority. Each decision proposed by Agentic LLM is checked by an independent Safety Governor before being implemented. This layer evaluates the predicted path against the substrate, side metabolite, dissolved oxygen, volume, and input constraints, and if the decision is invalid, determines the closest safe command via repair. If an acceptable correction cannot be obtained, a fallback policy is activated. In this way, the LLM plays the role of a context-aware supervisory agent, while the numerical accuracy, feasibility, and safety of the decision execution remain under the control of explicit mathematical mechanisms. This architecture also allows for re-optimization in response to changing digital twin states and changing uncertainty levels, making decision-making a closed-loop, adaptive, and traceable process.
After reviewing the literature and explaining the research gap, this paper presents the problem and mathematical model of the bioreactor, the digital twin, the fuzzy multi-objective model, the Agentic LLM framework, and the Safety Governor mechanism. Then, the integrated architecture and solution methods are described and the performance of the framework is evaluated using operational data, uncertainty scenarios, robustness and ablation studies. Finally, managerial implications, limitations, and future research directions are presented.
2. Literature Review
The application of a digital twin in bioprocesses has moved from mere process representation to the use of dynamic models for prediction, optimization, and decision support in recent years. The use of a digital twin together with model-based design of experiments has shown that the virtual model can search the operating space with fewer experiments and identify suitable production conditions [9]. Continuing this path, hybrid modeling was proposed as one of the important infrastructures of a digital twin in biopharmaceutical manufacturing because it allows for the combination of mechanistic knowledge with data-derived information [10]. Studies related to the structure of hybrid models have also shown that the selection of data-driven components, parameter estimation, and generalizability assessment directly affect the practical usability of the model [11]. The use of transfer learning alongside hybrid models has also shown the possibility of transferring knowledge between different biological conditions and accelerating the development of digital twin [12]. More recent reviews have identified online monitoring, synchronization, prediction, and model-to-control and optimization as key elements of digital twin in bioprocessing.
In the field of bioreactor control, a significant portion of research has focused on the use of dynamic models in predictive structures. Nonlinear predictive control models based on dynamic flux balance modeling for regulating fed-batch fermentation have shown that feedback and state updates can provide more stable performance than open-loop policies [13]. In another approach, metabolic-genetic models have been used in the MPC framework to determine feed and regulate metabolism to increase productivity [14]. Also, predictive control based on critical quality attributes in fed-batch cell cultures has been able to directly incorporate the goal of increasing the final product into the decision function in addition to tracking process variables [15]. This stream of research shows that the use of model prediction in closed-loop has created a good background for the transition of bioreactor control from reactive regulation to predictive decision-making.
Multi-objective optimization has been widely adopted for complex engineering problems in which several conflicting objectives must be considered simultaneously [16]. Evolutionary and swarm-based approaches such as NSGA-II, MOPSO, and MOGWO have become established alternatives for generating well-distributed non-dominated solution sets in nonlinear and constrained search spaces [17,18]. Their applicability has also been demonstrated beyond benchmark problems in energy and engineering design; for example, MOGWO has recently been employed to balance thermoelectric performance and exhaust backpressure in automobile waste-heat recovery systems [19]. In fed-batch bioprocess optimization, multi-objective formulations have similarly been used to represent trade-offs among productivity, yield, and operating time without collapsing them into a single objective [20]. These developments support the use of complementary multi-objective search paradigms for dynamic bioprocess problems, where nonlinear process behavior, time-dependent decisions, and competing production, resource, and biological objectives create complex Pareto trade-offs.
In addition to the multiplicity of objectives, biological uncertainty has also been a concern in fermentation optimization for a long time. Fuzzy goal attainment has been used to simultaneously determine feed rate, feed concentration, and fermentation time in ethanol production and has shown that uncertain preferences and constraints can be directly incorporated into the decision problem [21]. Fuzzy decision-making has also been applied to a multi-objective optimal control problem in fed-batch fermentation and has used membership functions to generate a consistent solution among the objectives [22]. In another direction, fuzzy ARTMAP has been developed in conjunction with neuro-dynamic programming to derive an adaptive feeding policy in a fed-batch bioreactor [23]. Overall, these studies have demonstrated the importance of uncertainty and decision flexibility, but the fuzzy representation in most of this literature has been limited to goal satisfaction or final decision structures, and the explicit publication of the uncertainty range in dynamic prediction, goals, and constraints has received less attention.
The increasing level of automation has made safety an independent component of the decision architecture. The safety-critical control literature has shown that it is possible to separate the desired performance of the controller from the requirement to maintain a safe set of states, and to place a safety filter based on explicit constraints between the proposed decision and the physical system [24]. This principle is of particular importance for bioreactors, because the desirability of a command in terms of production does not necessarily mean that the future trajectory of substrate, dissolved oxygen, volume, or side metabolites is appropriate. The digital twin literature of biological systems also raises the accuracy of representation, continuous updating, and model reliability as requirements for the decision-oriented use of twins [25]. These two streams provide a good theoretical basis for separating “decision generation” from “decision execution”.
The growth of large language models has added a new dimension to Process System Engineering. Engineering reviews show that LLMs have significant potential for knowledge retrieval and organization, technical text analysis, and support for engineering problems [26]. The recent literature on Agentic AI has extended this capability to architectures that can schedule tasks, invoke external tools, evaluate their output, and revise decisions when needed [27]. The development of a specialized LLM for chemical engineering has also shown that domain specialization can increase the power of the model across a wide range of specialized tasks [28]. In Process System Engineering, Generative AI has also been proposed as a potential tool for design, optimization, monitoring, and control, while trust, evaluation, and safety remain key requirements for its engineering use [29].
Existing bioreactor-control approaches have progressively advanced from fixed operating policies toward model-based predictive and adaptive decision structures. Predictive-control studies have demonstrated the value of dynamic state prediction and feedback for regulating fed-batch operation, while fuzzy and multi-objective formulations have extended decision-making to uncertainty and competing process objectives. However, these capabilities are generally addressed as separate methodological layers. The present framework brings state adaptation, uncertainty-aware multi-objective optimization, supervisory reasoning, and independent safety validation into a unified closed-loop architecture, allowing the operating policy to be continuously reconsidered as process conditions, uncertainty, and safety margins evolve.
The literature reveals a distinct gap. Digital twin, multi-objective optimization, fuzzy decision-making, LLM-based reasoning, and safety-critical control have each followed an independent research path, but for fed-batch bioreactors, an integrated architecture that combines these capabilities into a single decision loop with a defined responsibility boundary has not yet been systematically developed. The present study addresses this gap through an adaptive digital twin for state estimation and parameter updating, fuzzy multi-objective optimization based on triangular fuzzy numbers and α-cut without early defuzzification, and a policy-constrained Agentic LLM that serves as the supervisory reasoning and orchestration core of the decision architecture. By integrating the evolving process state, uncertainty information, operational context, policy knowledge, and recent decision history, the agent coordinates prediction, optimization, knowledge retrieval, and candidate evaluation within a continuous decision cycle, determines when additional evidence or renewed computation is required, and enables context-dependent reevaluation and replanning as process conditions evolve. The agent’s decision is not executed directly, but an independent Safety Governor monitors feasibility and safety margins and activates repair or fallback if necessary. Thus, the main innovation is in creating a closed chain of sensing–twinning–optimization–reasoning–safety–execution–re-optimization that separates linguistic reasoning from numerical computation and command execution.
3. Problem Description
Industrial fed-batch bioreactors are complex biological systems whose performance is influenced by the simultaneous interaction of biological phenomena, mass transfer, and operating conditions. During a batch, cell or biomass growth, substrate consumption, product formation, the production of side metabolites, oxygen demand, and the volume of culture medium are continuously changing. As a result, the relationship between operational decisions and process response is not constant, and a suitable operation policy at one stage of cultivation may cause a decrease in production, increase resource consumption, or create unfavorable biological conditions at another stage. Therefore, effective operation of a fed-batch bioreactor is dynamic in nature and requires decision-making appropriate to the actual and changing process situation.
The system under study is an industrial fed-batch bioreactor that consists of a feeding unit, a stirring system, air and oxygen supply, temperature and pH control equipment, and a set of sensors and process monitoring tools. Variables such as dissolved oxygen, pH, temperature, gas flow rate, agitation speed and some process parameters can be measured online. However, the complete biological state of the bioreactor is not directly observable. The actual cell density or biomass, metabolic activity, growth rate, product formation status and some metabolites affecting the process performance may only be available in a limited, delayed or estimated manner. Therefore, the measured data only show a part of the actual process state and decision making based solely on instantaneous sensor values cannot provide a complete picture of the current and future behavior of the system.
At the operational level, variables such as feed rate, agitation intensity, air flow and oxygen enrichment play a major role in guiding the process. Changing any of these variables can have several different consequences at the same time. Increasing feed rates may enhance growth or product formation, but if metabolic capacity or oxygen transport is limited, it can lead to substrate accumulation and increased levels of undesirable metabolites. Increasing agitation and aeration can also improve oxygen transport, but it increases energy consumption and operating costs and, in some processes, introduces mechanical or biological limitations. Therefore, the appropriate operational decision cannot be determined solely on the basis of maximizing production or adjusting a single variable.
Figure 1 shows the physical environment and decision-making of the bioreactor under study. In this structure, the bioreactor is located at the center of the process and is connected to the feeding, mixing, aeration, oxygen supply, and monitoring equipment. Data from sensors and PAT instruments provide observable information about the current state of the process, while the actual behavior of the system is influenced by the biological state, operating conditions, and internal and external disturbances. Supervisory level decisions determine the main operating settings such as the feeding profile, agitation intensity, and oxygen supply conditions, and low-level controllers are responsible for the stable implementation of these settings in the physical equipment. The bioreactor response is remeasured and fed back to the decision-making environment; as a result, the decision-making process is closed-loop in nature and dependent on the time evolution of the system.
Figure 1.
Industrial fed-batch bioreactor and supervisory decision environment.
One of the main challenges of this environment is the presence of uncertainty in the bioreactor behavior. Kinetic and metabolic parameters are not necessarily constant throughout the culture, and differences between batches, changes in the physiological conditions of the cells, fluctuations in feed composition, changes in oxygen transport capacity, sensor errors or noise, and model mismatches to the actual process can all cause the system response to deviate from the nominal conditions. For this reason, a decision that is evaluated based on appropriate, definitive nominal values does not necessarily perform similarly under actual conditions. This is especially important in industrial bioreactors, because the effects of inappropriate decisions may appear cumulatively during the batch, and once the process enters an unfavorable zone, it may be difficult or costly to restore optimal conditions.
At the same time, bioreactor operation is faced with several conflicting objectives. Increasing product titer or yield is one of the main production goals, but achieving higher yields can lead to increased energy consumption, higher feed and oxygen utilization, and consequently higher operating costs. On the other hand, severely restricting operating conditions to reduce biological risk may reduce production capacity or increase batch duration. In addition, conditions such as excessive dissolved oxygen depletion, substrate or by-product accumulation, and prolonged exposure of cells to stress conditions can affect process performance and quality. Therefore, decision-making in this environment requires a trade-off between production performance, energy consumption, operating costs, and biological and quality risks.
The distinction between improving performance and maintaining safety is also of fundamental importance in defining the problem. A low-risk state from the perspective of the objective function is not necessarily equivalent to a safe state. Some constraints, such as the allowable limits of dissolved oxygen, reactor capacity, equipment operating range, allowable feed rates, and control variable variation limits, are mandatory in nature and should not be violated in exchange for improving any economic or production goals. Therefore, any control decision must not only be optimal in terms of multi-objective performance, but also maintain its physical and operational feasibility under uncertain conditions.
Accordingly, the main research problem is to dynamically determine the operational decisions of a fed-batch industrial bioreactor at the control level, in such a way that, in the presence of biological and operational uncertainties, an appropriate balance is achieved between production performance, energy consumption, cost and process risk while simultaneously respecting all strict physical and safety constraints. Such a problem requires making decisions based on the actual and evolving state of the process, assessing the possible consequences of decisions before applying them, maintaining uncertainty in the evaluation process and choosing among several acceptable operational options. In this definition, the goal is not simply to find an optimum point, but to achieve a feasible decision, consistent with the current state of the bioreactor and reliable against the inherent variability in the biological process.
4. Mathematical Modeling of the Fed-Batch Bioreactor
In this study, the dynamic behavior of a fed-batch bioreactor was modeled using a lumped parameter mechanistic model based on mass balance, cell growth kinetics, product formation, and oxygen transport. The model included six main state variables, namely biomass concentration X, substrate concentration S, product concentration P, side metabolite concentration B, dissolved oxygen CO2, and reactor working volume V. The liquid phase was represented as completely mixed, consistent with the lumped-parameter formulation and the continuous agitation used during industrial operation. No major liquid effluent was present during the fed-batch cycle, and evaporation was considered negligible relative to the feed-driven change in working volume. pH and temperature were maintained within their prescribed operating ranges by independent regulatory control loops and were therefore treated as controlled operating conditions rather than additional dynamic states. These assumptions provide a reduced-order representation that is appropriate for supervisory modeling while retaining the dominant biological, mass-transfer, and operational dynamics of the fed-batch process.
4.1. Volume Dynamics and Dilution
Due to the fed-batch nature of the process and the absence of a liquid outlet flow, the reactor working volume change was only driven by the feed flow:
The effective dilution rate due to volume increase was also defined as follows:
where F(t) is the feed rate and V(t) is the working volume of the bioreactor.
4.2. Biomass Growth Dynamics
The biomass balance, taking into account cell growth, cell death or inactivation, and the dilution effect due to volume increase, was written as follows:
where kd is the cell death constant and μ(t) is the specific growth rate. To simultaneously represent the effect of substrate availability, oxygen limitation, and inhibitory metabolite accumulation, the specific growth rate was defined based on modified Monod kinetics as follows:
where μmax is the maximum specific growth rate, Ks is the substrate half-saturation constant, KO is the oxygen half-saturation constant, and KI,B is the inhibitory constant of the side metabolite. Thus, cell growth was simultaneously dependent on nutrient availability, oxygenation status, and the intensity of inhibitory metabolite accumulation.
4.3. Substrate Dynamics
Substrate concentration changes were defined based on its entry from the feed stream, dilution in increasing volume, and bioavailability:
where Sf(t) is the substrate concentration in the feed stream and qS(t) is the specific substrate consumption rate. Substrate consumption was separated into three components: biomass growth, product formation, and cell maintenance:
where is the biomass yield to substrate, is the product yield to substrate, and mS is the maintenance consumption factor.
4.4. Product Formation Dynamics
The product balance, assuming no product in the feed stream, was expressed as follows:
To separate the contribution of growth-dependent and growth-independent product formation, the specific product production rate was defined using the Luedeking–Piret relationship:
where αP is the growth-dependent production coefficient and βP is the growth-independent production coefficient.
qP(t) = αPμ(t) + βP
4.5. Side Metabolite Dynamics
To reflect the effect of the accumulation of a dominant side metabolite on the biological behavior of the system, its equilibrium was entered into the model as follows:
The specific rate of side metabolite formation was also defined as a combination of growth-dependent and growth-independent components:
where αB and βB are the growth-dependent and growth-independent side metabolite formation coefficients, respectively.
qB(t) = αBμ(t) + βB
4.6. Dissolved Oxygen Dynamics and Mass Transfer
The dissolved oxygen balance was defined as the difference between the rate of oxygen transfer from the gas to the liquid phase and the rate of oxygen consumption by the biomass:
where is the oxygen saturation concentration, is the dissolved oxygen concentration in the feed stream, kLa(t) is the volumetric oxygen-transfer coefficient, and qO(t) is the specific oxygen consumption rate.
The specific oxygen consumption rate was expressed based on the requirement associated with cell growth and maintenance:
where is the biomass yield relative to oxygen consumption and mO is the oxygen consumption maintenance factor.
To relate the agitation intensity to oxygen transfer, the impeller input mechanical power was calculated as follows:
where NP is the power number, ρ is the density of the liquid phase, N(t) is the stirring speed, and dI is the impeller diameter.
The superficial gas velocity was also determined from the following equation:
where AR is the reactor cross-sectional area and Qg(t) is the total gas flow rate. Then, the volumetric oxygen-transfer coefficient was calculated using the empirical relationship related to the specific power and superficial gas velocity:
where KLa, α and b are the empirical mass-transfer coefficients.
The total gas flow was composed of the sum of the air and enriched oxygen flows:
And the oxygen mole fraction in the inlet gas stream was calculated as follows:
Accordingly, the oxygen saturation concentration was determined using the Henry equation as follows:
where is the oxygen solubility coefficient at the operating temperature and Pg is the total gas phase pressure. In this way, the simultaneous effect of stirring speed, aeration rate and oxygen enrichment was directly introduced into the mass-transfer behavior and dissolved oxygen concentration.
4.7. Integrated Representation of the Dynamic Model
The system state vector was defined as follows:
And the vector of controllable operational variables was considered as follows:
Therefore, the complete dynamic model of the bioreactor was expressed in a compact form as follows:
where θ includes kinetic parameters, efficiency coefficients, retention coefficients, and mass-transfer parameters. In the final model structure, the feed rate directly affected the volume, dilution, and substrate availability; the agitation rate and air and oxygen flows determined the oxygen-transport capacity; and substrate and oxygen variations affected biomass, product formation, and side metabolite production through specific growth rates. Thus, all major decision variables had a clear and explicit path of action in the system dynamic equations.
5. Digital Twin Development
In this study, a digital twin of a bioreactor was developed as a synchronous dynamic representation of the physical process. The computational core of this twin is based on the mechanistic model of Equations (1) to (21), with the difference that the internal state of the system and some of the sensitive parameters of the model are updated during operation using real bioreactor data. In this way, the twin does not only play the role of a simulator, but also performs the estimation of the current state of the process, the gradual modification in the sensitive parameters, and the prediction of the future response of the system in an integrated manner.
To connect the continuous model with the sensor and PAT data streams, the dynamic model with the sampling interval Δt is converted to a discrete form:
where xk is the state vector defined in Equation (19), uk is the vector of operational variables of Equation (20), θk is the set of model parameters, and ΦΔt (⋅) is the numerical integration operator of the dynamic equations. The term wk represents the limited mismatch between the model and the actual process and was modeled with the covariance Qx.
xk+1 = ΦΔt(xk,uk,θk) + wk
The actual bioreactor data were connected to the twin via the following measurement model:
where yk is the at-line measurement vector, h(⋅) is the mapping of model states to measurable variables, and R is the covariance in the measurement error. Data such as dissolved oxygen and, if available, biomass, substrate, product, and side metabolites were used in the synchronization process. pH and temperature, according to the physical model, were under independent regulatory control and were not added as new states to the twin model.
To prevent the increase in model error during the batch, the online adaptation was limited to only those parameters that had a direct and significant effect on the dynamic behavior of the system. The adaptive parameter vector was defined as follows:
The first three parameters are directly present in the growth and substrate consumption equations and KLa is the empirical coefficient of the mass-transfer relationship in Equation (15). KLa is different from the instantaneous value KLa(t) because KLa(t) was calculated from the stirring conditions, gas flow rate, and the updated value of KLa.
The initial adaptive-parameter values were obtained from offline calibration using the nine batches assigned to model development. The process and measurement covariance matrices were determined from the variability in model residuals and measurement signals in the calibration data, while the parameter covariance was selected to represent the comparatively slow variation in the adaptive parameters. Physical bounds were defined from the calibrated operating ranges and admissible process values. Parameter identifiability was examined through sensitivity and parameter-correlation analysis, and parameters with weak sensitivity or strong mutual dependence were excluded from online adaptation.
The slow changes in the adaptive parameters were represented by a random-walk model:
And to avoid creating unrealistic values, their estimates were limited to a specific physical range:
The simultaneous estimation of process states and adaptive parameters was performed using the Unscented Kalman Filter. For this purpose, an augmented state vector was formed:
and the process uncertainty covariance is as follows:
In each sampling cycle, the UKF first predicted the additive state and its covariance using the nonlinear bioreactor model at a later time:
where Uf (⋅) denotes the Unscented transformation applied to the augmented dynamic model. After the new measurement was introduced, the difference between the actual output and the twin predicted output was calculated as innovation and used to refine the estimate:
where Kk+1 is the UKF gain. As a result, each new measurement led to a simultaneous modification in the internal state of the bioreactor and the sensitive parameters of the model, and the discrepancy between the actual and model behavior during operation was reduced.
Qz = blkdiag(Qx,Qθ)
The posterior parameter estimates and their associated uncertainty obtained from the UKF were subsequently used to update the fuzzy representation employed by the optimization layer. For each adaptive parameter, the current UKF estimate was used as the modal value of the corresponding triangular fuzzy number, while the uncertainty spread was adjusted according to the posterior estimation uncertainty and constrained within the physically admissible parameter range. Consequently, the fuzzy representation was updated from cycle to cycle together with the digital twin rather than remaining fixed throughout the batch. For the feed substrate concentration, which was not included in the adaptive UKF parameter vector, the modal value was obtained from the current feed specification and its fuzzy range reflected the observed variability in feed composition.
After each synchronization step, the last modified estimate was used as the initial conditions of the prediction engine. For each candidate sequence of operational variables, the future path of the system in the Np-step horizon was obtained from the following relation:
where contains the latest values of the adaptive parameters along with the calibrated fixed parameters of the model. Accordingly, the digital twin produced three quantitative outputs in each cycle: the current synchronized state of the bioreactor, the updated values of the sensitive parameters, and the predicted trajectory of the variables X, S, P, B, and V in the future horizon. In this way, the digital representation was continuously modified during operation with the actual behavior of the bioreactor and the decision-making was based on the updated and predicted state of the process.
6. Fuzzy Multi-Objective Optimization Model
The operation of a fed-batch bioreactor is accompanied by a set of operational, economic and biological objectives that are naturally in conflict with each other. Increasing product production or productivity may require increasing the feed rate, agitation intensity and oxygen supply, thereby increasing energy consumption and operating costs. Conversely, limiting the operating intensity can reduce process cost and risk, but may compromise production performance. Furthermore, operating decisions must be made in such a way that undesirable conditions such as oxygen limitation, accumulation of substrate or side metabolites and increased biological stress are not created. Accordingly, the decision-making problem was formulated as a multi-objective optimization model that simultaneously considers four main dimensions of production performance, energy consumption, operating cost and biological and quality risk.
The biological nature of the process and the variability in operating conditions mean that some parameters affecting the model cannot be considered as exact and constant values throughout the entire operation period. Therefore, the uncertainty of the selected parameters was directly maintained in the structure of the optimization model so that the resulting solutions do not depend only on a nominal state. The decision space included the main controllable variables of the bioreactor, and all candidate solutions were required to comply with the dynamic, operational, and safety constraints of the system in addition to simultaneously evaluating the objectives. In this way, the model output was not a single response, but rather a set of non-dominated solutions that represent different trade-offs between objectives under uncertain process conditions.
Sets and Indices:
K: set of discrete decision periods, indexed by k.
J: set of prediction steps within the optimization horizon, indexed by j.
Deterministic Parameters
Δt: length of each discrete decision interval.
Np: number of prediction steps in the optimization horizon.
X0: initial biomass or viable cell concentration.
S0: initial substrate concentration.
P0: initial product concentration.
B0: initial by-product or inhibitory metabolite concentration.
: initial dissolved oxygen concentration.
V0: initial working volume of the bioreactor.
KO: oxygen half-saturation constant.
KI,B: by-product inhibition constant.
kd: biomass or cell death-rate constant.
YP/S: product yield coefficient with respect to substrate.
YX/O: biomass yield coefficient with respect to oxygen.
mS: substrate maintenance coefficient.
mO: oxygen maintenance coefficient.
αP: growth-associated product-formation coefficient.
βP: non-growth-associated product-formation coefficient.
αB: growth-associated by-product-formation coefficient.
βB: non-growth-associated by-product-formation coefficient.
: dissolved oxygen concentration in the feed stream.
NP: impeller power number.
ρ: density of the liquid phase.
dI: impeller diameter.
AR: cross-sectional area of the bioreactor.
a: exponent of specific agitation power in the oxygen-transfer correlation.
b: exponent of superficial gas velocity in the oxygen-transfer correlation.
: oxygen solubility coefficient at the operating temperature.
Pg: total pressure of the inlet gas phase.
Fmin: minimum allowable feed rate.
Fmax: maximum allowable feed rate.
Nmin: minimum allowable agitation speed.
Nmax: maximum allowable agitation speed.
: minimum allowable airflow rate.
: maximum allowable airflow rate.
: minimum allowable oxygen-enrichment flow rate.
: maximum allowable oxygen-enrichment flow rate.
Vmax: maximum allowable working volume.
Smax: maximum allowable substrate concentration.
Bmax: maximum allowable by-product concentration.
: minimum allowable dissolved oxygen concentration.
ΔFmax: maximum allowable change in feed rate between consecutive decision periods.
ΔNmax: maximum allowable change in agitation speed between consecutive decision periods.
: maximum allowable change in airflow rate between consecutive decision periods.
: maximum allowable change in oxygen-enrichment flow rate between consecutive decision periods.
cF: unit cost of feed consumption.
cE: unit cost of electrical energy.
: unit cost of supplied oxygen.
eair: specific energy requirement of compressed-air supply.
: specific energy requirement of oxygen supply.
ηag: effective efficiency of the agitation system.
wS: weight associated with substrate-accumulation risk.
wB: weight associated with by-product-accumulation risk.
wO: weight associated with oxygen-limitation risk.
Fuzzy Parameters
: fuzzy maximum specific growth rate at decision period k.
: fuzzy substrate half-saturation constant at decision period k.
: fuzzy biomass yield coefficient with respect to substrate at decision period k.
: fuzzy empirical coefficient of the volumetric oxygen-transfer correlation at decision period k.
: fuzzy substrate concentration in the feed stream at decision period k.
: vector of fuzzy bioprocess parameters used in uncertainty-aware prediction at decision period k.
Decision Variables
Fk+j: feed rate applied at prediction step k + j.
Nk+j: agitation speed applied at prediction step k + j.
Qair,k+j: airflow rate applied at prediction step k + j.
: oxygen-enrichment flow rate applied at prediction step k + j.
State Variables
Xk: biomass or viable cell concentration at decision period k.
Sk: substrate concentration at decision period k.
Pk: product concentration at decision period k.
Bk: by-product or inhibitory metabolite concentration at decision period k.
: dissolved oxygen concentration at decision period k.
Vk: working volume of the bioreactor at decision period k.
Predicted State Variables
: predicted biomass or viable cell concentration at future step k + j based on information available at period k.
: predicted substrate concentration at future step k + j based on information available at period k.
: predicted product concentration at future step k + j based on information available at period k.
: predicted by-product concentration at future step k + j based on information available at period k.
: predicted dissolved oxygen concentration at future step k + j based on information available at period k.
: predicted working volume at future step k + j based on information available at period k.
Auxiliary Variables
Dk: effective dilution rate at decision period k.
μk: specific growth rate at decision period k.
qS,k: specific substrate-consumption rate at decision period k.
qP,k: specific product-formation rate at decision period k.
qB,k: specific by-product-formation rate at decision period k.
qO,k: specific oxygen-consumption rate at decision period k.
Pag,k: mechanical agitation power at decision period k.
ug,k: superficial gas velocity at decision period k.
kLak: volumetric oxygen-transfer coefficient at decision period k.
Qg,k: total inlet gas-flow rate at decision period k.
: oxygen mole fraction in the inlet gas at decision period k.
: saturation dissolved oxygen concentration at decision period k.
Objective Functions:
S.t:
Fmin ≤ Fk+j ≤ Fmax, j = 0, …, Np − 1
Nmin ≤ Nk+j ≤ Nmax, j = 0, …, Np − 1
|Fk+j − Fk+j−1| ≤ ΔFmax, j = 0, …, Np − 1
|Nk+j − Nk+j−1| ≤ ΔNmax, j = 0, …, Np − 1
Objective function (32) represents the average volumetric product-formation rate over the prediction horizon. Product concentration P describes the amount of product per unit liquid volume, whereas the product PV represents the total product amount in the bioreactor. The difference between the terminal and current values of PV therefore measures the net product formed during the prediction horizon. Dividing this quantity by the terminal working volume and the horizon duration yields the volumetric productivity in g/L·h. This distinction is particularly relevant in fed-batch operation because the working volume changes continuously with feed addition, and final product concentration alone does not fully represent the amount of product generated. The objective function (33) minimizes the total energy consumption during the decision horizon. This function includes three main sources of energy consumption, including the power required for stirring, the energy associated with the supply of compressed air, and the energy required for the supply of oxygen. Thus, the algorithm cannot improve the process performance simply by increasing the intensity of agitation, aeration, or oxygen enrichment without considering the energy cost of such a decision in the solution evaluation. This function is calculated directly from the controllable operating variables and is deterministic in nature. The objective function (34) minimizes the cumulative operating cost and considers the three main components of feed cost, energy cost, and direct cost of oxygen supply. Separating this function from the energy function is necessary because two operating policies with the same energy consumption may generate different economic costs due to differences in feed rate or oxygen consumption. In this structure, the energy cost uses the value calculated in the energy objective function, while the direct cost of oxygen supply is considered separately in the economic evaluation. The objective function (35) minimizes the biological and qualitative risk of the process. This risk is evaluated using three main factors: substrate accumulation, increased side metabolites, and decreased dissolved oxygen levels. Each of these factors is normalized to its respective operating limit so that the difference in the scale of the variables does not artificially dominate one component over the others. The use of a nonlinear penalty also causes a sharp approach to unfavorable conditions to have a greater effect on the value of the objective function. This function is fuzzy in nature, since the biological variables and dissolved oxygen are obtained from predicted paths that are influenced by the fuzzy parameters of the model. However, this function does not replace the strict safety constraints and simply evaluates the degree of biological suitability of the allowed solutions. The normalization by the prediction-horizon duration converts the accumulated penalty into a dimensionless average biological-risk index.
Constraint (36) ensures the dynamic compatibility of the predicted path with the bioreactor model. According to this constraint, each future state must be calculated by the dynamic model based on the state of the previous stage and the operational decisions of the same period. Fuzzy parameters of growth, yield, mass transfer and feed composition are also included in this relationship; Therefore, future trajectories are not generated independently of the physical model, and any optimization solution must necessarily be consistent with the dynamic behavior of the bioreactor.
Constraint (37) determines the initial conditions of the prediction horizon. At the beginning of each decision cycle, the initial state of the optimization model is set to the last synchronized state of the digital twin. In this way, each optimization problem starts from the actual and updated state of the bioreactor and does not use a nominal or predetermined state independent of the current data.
Constraint (38) imposes a lower and upper limit on the feed rate. This constraint prevents the selection of values outside the operational capacity of the feed pump and prevents the creation of unfeasible feed rates. Also, the minimum allowable rate keeps the bioreactor behavior within the defined operating range in cases where complete feed shutdown would be undesirable from a process perspective.
Constraint (39) determines the allowable range of the stirring speed. The agitation speed has a direct effect on mixing, oxygen transfer and power consumption, but cannot be increased or decreased indefinitely due to the mechanical capacity of the equipment and the biological conditions. This constraint ensures that all proposed solutions remain within the feasible range of the agitation system.
Constraint (40) specifies the minimum and maximum air flow rates. This constraint, while maintaining the aeration capability of the process, prevents the selection of rates that are outside the capacity of the compressor, gas transmission lines or gas distribution system, and provides a realistic operating range for aeration control.
Constraint (41) defines the allowable range of enriched oxygen flow. The use of pure or enriched oxygen can increase the oxygen-transfer capacity, but it depends on the equipment limitations, economic considerations and operating conditions. Therefore, the oxygen enrichment level can only be selected within the technically allowable range.
Constraint (42) limits the rate of change in feed between two consecutive decisions. This constraint prevents sudden changes in the feed profile that could be undesirable in terms of pump performance or metabolic response of the cells. In the first step of the horizon, the new decision is also compared with the last actual value applied to the system, preventing sudden jumps in the feed command.
Constraint (43) determines the maximum permissible change in the stirring speed between two consecutive periods. Abrupt changes in the stirring speed can cause fluctuations in mixing, oxygen transfer, and power consumption, and are also mechanically undesirable. Applying this constraint creates smoother and more industrially feasible control paths.
Constraint (44) limits the change in the aeration rate between consecutive periods. This constraint prevents rapid and unrealistic changes in the air flow and makes the algorithm’s proposed response consistent with the real dynamics of the aeration equipment.
Constraint (45) specifies the maximum allowable change in the enriched oxygen flow. The purpose of this constraint is to prevent drastic changes in the oxygen input and sudden responses in the mass transfer. As a result, the oxygen enrichment path changes gradually and within the feasible range of the equipment.
Constraint (46) limits the bioreactor working volume to its allowable capacity. Since, in fed-batch operation, the reactor volume increases continuously with the feed input, this constraint prevents the algorithm from choosing a feed profile to increase production that would cause the volume to exceed the bioreactor’s allowable capacity later in the horizon.
Constraint (47) imposes the maximum allowable substrate concentration. Excessive substrate accumulation can cause metabolic pathways to be altered, increase by-product formation, or create inhibitory conditions. Therefore, the predicted substrate path must remain below the specified limit throughout the decision horizon. This constraint is also evaluated under process uncertainty due to the dependence of substrate prediction on phase parameters.
Constraint (48) maintains the level of the side metabolite within an acceptable range. The accumulation of this metabolite can affect cell growth, product formation, or process quality. Therefore, solutions that cause the side metabolite concentration to exceed the specified limit are not considered acceptable solutions, even if they perform well for other purposes.
Constraint (49) ensures the minimum allowable dissolved oxygen concentration. Dissolved oxygen is one of the critical variables in the process, and its reduction below a certain level can disrupt the growth and metabolic activity of cells. This constraint ensures that the proposed operating paths do not lead the bioreactor to a critical oxygen deficiency condition, even under phase parameter variations.
Constraint (50) limits the predicted dissolved oxygen concentration to the physical saturation value corresponding to the operating conditions. This relationship prevents unrealistic predictions where dissolved oxygen exceeds the equilibrium capacity of the liquid and gas phases and maintains the physical consistency of the mass-transfer model.
Finally, constraint (51) imposes the condition that the main process variables and decision variables are nonnegative. The biomass, substrate, product, side metabolite concentrations, dissolved oxygen, and reactor volume cannot physically have negative values. Similarly, the feed rate, stirring rate, air flow, and oxygen flow are defined as continuous, nonnegative variables in the current model structure. The present model lacks binary variables because no on/off decisions or discrete choices are considered at the main control level.
To represent the uncertainty in the biological behavior and operating conditions of the bioreactor, selected model parameters were considered as triangular fuzzy numbers. Fuzzification was limited to parameters that are both sensitive to process variations and whose uncertainty can directly affect the digital twin prediction and optimization results. Accordingly, the maximum specific growth rate due to the variability in the biological activity of the cells, the substrate half-saturation constant due to the uncertainty in the growth response to substrate availability, the biomass-to-substrate efficiency coefficient due to the variations in the bioconversion efficiency, the empirical oxygen-transfer coefficient due to the variability in the mixing and mass-transfer conditions, and the substrate concentration in the feed due to possible changes in the feed composition were defined as fuzzy. Other parameters and operating and safety limits were maintained as deterministic.
The triangular representation was selected because the uncertainty associated with the adaptive bioprocess parameters can be characterized naturally by a lower bound, a most plausible value, and an upper bound while remaining computationally efficient for repeated closed-loop optimization. This structure is also consistent with the digital twin update, where the current parameter estimate provides the central value and the associated estimation uncertainty defines its admissible spread. Compared with more elaborate uncertainty representations, the triangular form requires fewer assumptions and less auxiliary information while preserving the plausible variation range of the parameters. This makes it suitable for dynamic bioprocess optimization, where uncertainty must be updated repeatedly and propagated through prediction and decision-making without imposing excessive computational burden.
Each fuzzy parameter was represented by three values: low, probable, and high:
where ξL, ξM and ξU are the lower bound, the probable value and the upper bound of the parameter, respectively. To convert this fuzzy representation into intervals usable in calculations, the α-cut approach was used. At the confidence level α, the lower bound of the parameter was obtained from the following relationship:
And its upper bound was calculated as follows:
Therefore, each fuzzy parameter at each α level was entered into the calculations with the interval . Smaller values of α cover a wider range of uncertainty, while as α approaches unity, the interval approaches the probable value of the parameter. In this study, defuzzification was not used and the uncertainty of the parameters was preserved through these α-cut intervals in predicting states, evaluating fuzzy objective functions, and examining process-dependent constraints.
The α-cut intervals were propagated through the nonlinear bioreactor model over the complete prediction horizon so that parameter uncertainty was consistently reflected in the predicted process trajectories. For each candidate control sequence, the range of admissible parameter values at the selected α level was carried through the dynamic model to obtain conservative lower and upper bounds for the relevant state variables. These bounds were then used consistently in objective evaluation and constraint assessment. In particular, production performance was evaluated using its conservative lower bound, biological risk using its upper bound, and process constraints using the corresponding adverse state bounds, including the upper bounds of substrate and by-product concentration and the lower bound of dissolved oxygen. In this way, the same uncertainty representation was preserved from the digital twin update through prediction, optimization, and safety assessment without intermediate defuzzification.
Unless otherwise stated, the main closed-loop, Pareto, robustness, safety, and ablation analyses were performed using α = 0.50, which provides a moderately conservative uncertainty interval while retaining sufficient operating flexibility. The full range from α = 0 to α = 1 was examined separately in the sensitivity analysis to evaluate the influence of uncertainty width on performance, safety margin, and reoptimization behavior.
7. Agentic LLM Decision Framework
In this study, the large language model is implemented as a tool-based supervisory agent that integrates process state, uncertainty information, operational context, policy knowledge, and recent decision history into a unified reasoning cycle. At each decision stage, the agent interprets the evolving condition of the bioreactor, determines which computational evidence is required, coordinates the invocation of the digital twin, optimization solver, knowledge base, and candidate evaluation tools, and assesses whether the resulting evidence is sufficient and consistent with the current operating context. It also maintains continuity across consecutive decision cycles, allowing it to distinguish between routine continuation of an existing policy and conditions that require reevaluation, tool recall, or replanning. This enables the supervisory decision process to adapt not only to changes in the process state, but also to changes in uncertainty, information completeness, and operational priorities. The resulting Agentic LLM therefore serves as the reasoning and orchestration core of the supervisory layer, while the Safety Governor provides an independent execution safeguard for the final proposed action.
At each decision time k, the information used by the agent was organized in the following decision state:
where is the latest synchronized state of the digital twin, is the fuzzy parameter intervals resulting from the α-cut, Pk is the Pareto solution set, ρk is the operational state and current batch stage, and hk is the short history of decisions and tool calls. Thus, the agent’s decision is based on the actual and updated state of the process and not on a fixed prompt or qualitative description of the bioreactor.
The agent had access to four specific tools: the digital twin tool for estimation and prediction, the fuzzy multi-objective optimization solver for generating the Pareto set, the process knowledge base for retrieving operating rules and policies, and the candidate evaluation tool for numerically comparing existing solutions. The sequence of tool invocations in each cycle followed the logic of Observe–Plan–Call–Evaluate–Replan–Propose. If the required data or result was not available, the agent was required to re-invoke the relevant tool and was not allowed to proceed directly to the decision proposal stage.
The supervisory reasoning layer was implemented using OpenAI GPT-4.1 with a temperature of 0.1 and a fixed system prompt that defined the process-engineering role of the agent, the structure of the decision state, the available computational tools, the admissible operational profiles, and the expected reasoning sequence. Tool interaction was organized through structured function calls with predefined input and output schemas for the digital twin, fuzzy multi-objective optimizer, process knowledge base, and candidate-evaluation module. At each supervisory cycle, the agent combined the synchronized process state, uncertainty information, Pareto solutions, operational context, and recent decision history to determine the required tool sequence, evaluate the returned evidence, and decide whether the current information was sufficient or additional reevaluation or replanning was required. The final candidate assessment followed the predefined operational profile and the numerical Achievement Scalarizing Function, while admissibility and safety margins were evaluated independently before execution. A fixed prompt template, identical tool schemas, constant decoding settings, and structured logging of tool calls and decision states were maintained throughout the experiments. Throughout the experiments, the prompt template, tool schemas, decoding settings, operational profiles, and numerical candidate-evaluation procedure were kept fixed, while tool calls and decision states were systematically logged to support reproducibility and traceability of the supervisory process.
Agentic behavior in this framework emerges from the continuous management of evidence, computational actions, and decision context across successive supervisory cycles. Using the current decision state and the recent history of decisions and tool interactions, the agent relates newly synchronized process information to previously generated evidence, determines whether the available prediction and optimization results remain appropriate for the evolving operating condition, and selectively revisits the required computational capabilities when the decision basis changes. This stateful reasoning preserves continuity when the process remains stable while enabling targeted reevaluation and replanning when new measurements, changes in uncertainty, or shifts in operational conditions alter the decision context. The supervisory proposal therefore represents the synthesized outcome of an adaptive multi-step reasoning cycle.
Figure 2 illustrates the information flow and conditional interaction between the Agentic LLM and the computational capabilities available within the supervisory layer. Each cycle begins with the synchronized bioreactor state and the corresponding uncertainty information. The agent interprets this evolving context together with process knowledge and recent decision history, determines which information must be updated or reassessed, and coordinates the digital twin, fuzzy multi-objective optimization, knowledge retrieval, and candidate evaluation functions accordingly. The outputs returned by these tools are progressively integrated into the agent’s decision state, allowing the reasoning process to evolve as new evidence becomes available. Through this interaction, the Agentic LLM maintains continuity across decision cycles, recognizes when the existing decision basis is no longer sufficient, and organizes reevaluation or replanning before forming a context-aware supervisory proposal. The resulting proposal is subsequently evaluated by the Safety Governor as part of the integrated closed-loop architecture.
Figure 2.
Agentic LLM decision and tool-orchestration framework for the fed-batch bioreactor.
At time k, the set of solutions that can be considered by the agent was defined as follows:
where Ur,k is the sequence of candidate control variables r and Fr,k are the corresponding values of the four objective functions. Since the two objective functions of production and risk are subject to fuzzy uncertainty, a conservative evaluation of each candidate was performed using the lower bound of production performance and the upper bound of risk at the level α:
The negative sign of the first component was used only to convert the production maximization criterion to the common minimization direction in the comparison step. This conversion does not change the basic structure of the Pareto problem.
Due to the scale differences between production, energy, cost, and risk, the four criteria were normalized before the background evaluation:
where ε is a small positive value to avoid division by zero. This normalization was used only to select among the members of the Pareto set and did not play a role in generating the Pareto front.
To prevent the LLM from generating arbitrary preferences, the decision weights were not freely generated. A limited set of predefined preference profiles was maintained in the knowledge base, each profile corresponding to a specific state of the batch, such as the growth phase, the production phase, or conditions close to oxygen limitation. The agent was only allowed to select one of these valid profiles. The weights corresponding to the selected profile satisfied the following conditions:
To select the solution consistent with current preferences, an Achievement Scalarizing function was used so that the final choice does not depend solely on a simple weighted sum:
where am,k is the aspiration level corresponding to the chosen operational profile and ρA is a small positive coefficient to separate solutions that have the same maximum component value. Thus, instead of constructing an arbitrary criterion, the agent evaluates Pareto solutions against a pre-validated operational policy.
In order to avoid that solutions close to the critical boundaries are preferred even if they perform well in the objective functions, the operational margin of each candidate was also calculated independently:
For substrate and side metabolite, the upper bound of the prediction and for dissolved oxygen, the lower bound were used to conservatively calculate the distance from undesirable boundaries. Candidates with non-positive margins were eliminated from the agent selection stage:
This filter is not yet a substitute for independent safety validation; it prevents the agent from choosing between solutions that are actually at the boundary or outside the operational range in the fuzzy forecast.
Before issuing a recommendation, the completeness of the required information was also checked. The logical variable Ek was set to one only if the twin state, fuzzy intervals, Pareto set, candidate forecast, and valid operational profile were all available in the same cycle:
If Ek = 0, the agent was not allowed to select the candidate and had to re-invoke the tool associated with the incomplete component.
After completing the information and eliminating unsuitable candidates, the option with the lowest value of the contextual decision function was selected:
And only the first control move from the selected sequence was extracted as the agent’s supervisory suggestion:
After each new measurement becomes available, the synchronized process state, uncertainty information, and recent decision history are incorporated into the next supervisory reasoning cycle. The digital twin provides the evolving state and predictive evidence, the fuzzy multi-objective model updates the uncertainty-aware decision space, the knowledge base supplies process- and phase-specific operational knowledge, and the candidate-evaluation tool structures the numerical evidence associated with the available alternatives. The Agentic LLM integrates these heterogeneous information streams, maintains the continuity of the decision context, determines when the existing evidence should be refreshed, and coordinates reevaluation or replanning in response to meaningful process changes. This interaction makes the agent the adaptive supervisory layer that connects sensing, prediction, optimization, knowledge, and operational policy into a coherent decision process. The resulting supervisory proposal is then transferred to the Safety Governor for independent execution validation.
8. Safety-Aware Decision and Control Mechanism
To prevent the direct application of the agent layer output to the bioreactor, an independent Safety Governor was placed between the LLM decision proposal and the low-level controllers. This layer does not rely on linguistic reasoning and evaluates the validity of each decision based solely on the dynamic model, the digital twin prediction, the equipment operating limits, and the hard process constraints. Therefore, in Equation (65) is only a supervisory proposal and its execution is subject to the explicit approval of the safety layer.
To evaluate the selected decision, the control sequence corresponding to the selected candidate within a safety horizon Ns was applied to the digital twin. Considering the fuzzy uncertainty, the constraint evaluation was performed based on the most conservative bounds obtained from the α-cut. The set of safe paths was defined as follows:
In this regard, the upper bound of the prediction was used for the substrate and the side metabolite and the lower bound for the dissolved oxygen. In addition, the limits of the control variables and the limits of their successive changes according to constraints (38) to (45) must be maintained throughout the safety horizon.
To integrate the constraint assessment, the safety violation index was defined as the highest normalized value of the violation among all critical limits:
Therefore, if , none of the main safety limits have been violated in the forecast horizon. The acceptance status of the proposed decision was determined from the following relationship:
If the proposed decision does not satisfy the safety conditions, instead of applying it directly, the closest feasible decision in the safe zone is calculated:
where is the set of decisions that, after being re-simulated in the digital twin, satisfy the safety constraints and operational limits at horizon Ns. The matrix Ws also specifies the relative importance of changing each of the control variables in the decision modification process. As a result, the repair step is not simply a numerical cut on the original command, but each modified decision is re-validated in terms of its dynamic consequence.
The final command sent to the lower-level controllers was determined as follows:
where is a pre-validated fallback command and can include the last safe setpoint or a conservative policy from the base controller. Only the first confirmed control move is applied, and after receiving new measurements, the digital twin state is resynchronized and the decision cycle is repeated.
In this way, agent selection, optimization evaluation, and command execution authorization remain three independent tasks. The LLM can propose an operational option, but the final authority to pass the command to the physical system lies with the Safety Governor; as a result, even an invalid or uncertain proposal at the agent layer cannot be applied to the bioreactor without passing through the numerical and predictive safety control.
9. Integrated Architecture
The integrated research architecture was designed as a closed-loop, hierarchical system in which the physical bioreactor, digital twin, fuzzy uncertainty model, multi-objective optimization, LLM agent, Safety Governor, and low-level controllers operate in harmony. The architecture is organized around complementary functional layers that interact continuously while preserving clear responsibilities. The digital twin provides state reconstruction and prediction, the fuzzy optimization layer generates an uncertainty-aware decision space, the Agentic LLM provides supervisory reasoning, evidence integration, tool orchestration, and context-dependent replanning, the Safety Governor performs independent safety validation, and the regulatory layer implements the validated supervisory actions. This organization allows the agent to serve as the adaptive intelligence of the supervisory layer while maintaining a structured and traceable path from process observation to safe execution. The system is implemented on two time scales. The regulatory controllers operate on a short time interval Tr, while the supervisory decision-making cycle runs on a larger time interval Ts:
Ts = nrTr, nr ∈ ℕ+
This temporal separation allows the fast control of physical variables to be delegated to the regulatory layer, and the more computationally intensive components, including the digital twin, optimization, and LLM agent, operate only at the monitoring level. In the computational experiments, the supervisory interval Ts was set to 5 min, consistent with the synchronized data-update interval used by the digital twin.
At the beginning of each monitoring cycle k, new sensor and PAT measurements, along with the history of actually applied commands, were used to synchronize the digital twin. The updated state of the bioreactor was obtained in a compact form from the following relation:
where D(.) represents the process of estimating the state and adapting the parameters of the digital twin. Therefore, each decision cycle starts from the last estimated state of the process and does not rely on a fixed or nominal initial condition.
Digital twin adaptation is driven by the new process measurements and the history of the control actions actually applied to the physical bioreactor. The optimization outputs do not directly modify the UKF parameter estimates; their influence enters the next estimation cycle only through the applied action, the resulting physical process response, and the subsequent measurements.
After twin synchronization, the uncertainties of the selected parameters in the α level were converted into computable intervals and entered into the multi-objective solver along with the current state. The set of non-dominated solutions was generated as follows:
where is the set of fuzzy intervals in the α level, Np is the prediction horizon, and O(.) is the solution mapping of the multi-objective optimization problem. Each member of Pk contains a feasible control sequence and the corresponding values of the four objective functions.
The Agentic LLM uses the updated process state, fuzzy uncertainty information, current operating context, and the available non-dominated solutions to formulate the supervisory decision for the current cycle. This context-dependent decision process is represented as follows:
where (.) represents the Agentic LLM supervisory decision logic and rk represents the current operational context. Through this mapping, the agent interprets the updated process condition together with uncertainty and optimization information to determine a context-appropriate supervisory action.
The proposed decision is then entered into the Safety Governor and is only allowed to pass after a predictive evaluation of the hard constraints:
where (.) includes the acceptance, repair or fallback mechanism. Therefore, is the only command that is architecturally allowed to enter the execution layer.
The confirmed command is sent as a supervisory setpoint to the lower-level controllers. These controllers generate the actual equipment command in faster substeps based on the setpoint and the current measurement:
where LL(.) is the regulatory control layer and is the actual command applied to the feed pump, stirring system, aeration and oxygen enrichment. The resulting physical response is re-measured and returned to the beginning of the cycle.
Figure 3 shows the complete information, reasoning, and command flow of the integrated architecture. Process measurements are first synchronized with the digital twin to reconstruct the current state and update predictive information. The uncertainty representation and multi-objective optimization layers then provide uncertainty-aware trajectories and non-dominated operational alternatives. At the supervisory level, the Agentic LLM integrates these outputs with process knowledge, operational policies, current context, and recent decision history. Based on this evolving evidence, the agent coordinates any required prediction update, re-optimization, knowledge retrieval, or candidate reevaluation and forms a context-aware supervisory proposal. The Safety Governor subsequently evaluates the proposed action before it enters the regulatory control layer, completing the closed-loop connection between adaptive reasoning and safe execution.
Figure 3.
Integrated closed-loop architecture of the safety-aware agentic LLM–digital twin framework.
The architecture has two distinct feedback loops. The fast loop between the bioreactor and the low-level controllers keeps track of and maintains the stability of the execution variables. The slower monitoring loop recalculates the twin state, uncertainty, Pareto front, and agent decision upon receiving new data. As a result, only the first confirmed command of each horizon is executed, and the entire decision chain is updated in the next cycle based on the new state of the process. This structure allows optimization, agent reasoning, and safety to operate in a common loop, without blurring the boundaries of responsibility between them.
10. Solution Approaches and Computational Settings
Due to the nonlinear nature of the bioreactor model, the existence of four conflicting objective functions, the dependence of state variables on the time course of decisions, and the presence of fuzzy uncertainty, the search space of the problem is continuous, multidimensional, and nonconvex. Therefore, three multi-objective metaheuristic algorithms NSGA-II, MOPSO, and MOGWO were used to extract the set of non-dominated solutions. These three algorithms were selected with the aim of covering three different search mechanisms; NSGA-II is an evolutionary method based on non-dominated sorting, MOPSO is a swarm method based on memory and particle movement, and MOGWO is a population-based method based on hierarchical leadership of leaders. The simultaneous use of these methods allowed us to examine the stability of the Pareto front and prevent the results from depending on the behavior of a specific algorithm.
In NSGA-II, solutions were sorted in each generation based on Pareto dominance rank, and crowding distance was used to maintain the dispersion of solutions in the non-dominated front. A new generation was produced by tournament selection, simulated binary crossover, and polynomial mutation. This algorithm was used as a reference evolutionary method due to its known ability to balance convergence and diversity [16].
In MOPSO, each particle represented a complete sequence of operational decisions including feeding, stirring speed, air flow, and oxygen enrichment over the prediction horizon. Particle positions were updated based on individual memory and leaders selected from an external archive. Inertia weights were gradually reduced, and an adaptive grid was used to select leaders from sparse regions of the archive to reduce premature concentration of particles in a limited part of the Pareto space [17].
In MOGWO, the search was guided by three leader solutions α, β and δ; selected from the archive of non-dominated solutions. The control parameter a was reduced from 2 to zero to allow for a broader search in the early stages and more precise exploitation of promising regions in the later stages. This choice provided a leader-driven search mechanism with a limited number of tuning parameters compared to the other two methods [30].
To maintain comparability, the population size in all three algorithms was set to 100 and the number of iterations was set to 250. Each algorithm was evaluated in 30 independent runs with different seeds. The dynamic model, α-cut values, decision variable bounds, objective functions and constraints were the same for all three methods. The feasibility dominance principle was also applied to deal with constraints so that the feasible solution had priority over the infeasible solution, and if both solutions were infeasible, the option with the lower normalized constraint violation value was preferred.
Figure 4 shows the computational flow of solving the problem. The process begins by receiving the synchronized state from the digital twin and forming fuzzy intervals of the parameters. Then, an initial population of solutions is generated and each candidate is evaluated by running the bioreactor model over the entire prediction horizon. The values of the four objective functions and the degree of constraint compliance are calculated and the non-dominated solutions are kept in the archive. Next, according to the selected algorithm, the NSGA-II evolutionary operation, MOPSO swarm update or MOGWO leader guidance mechanism is executed. This cycle continues until the maximum number of iterations is reached, and the final Pareto front is sent to the agent layer as a set of decision candidates. Therefore, the task of metaheuristic algorithms is simply to generate a non-dominated decision space, and the supervisory decision selection and safety validation are performed outside the optimization loop. Table 1 shows the parameter settings of the algorithms for the problem under study.
Figure 4.
Computational flowchart of the multi-objective solution process.
Table 1.
Parameter settings of the multi-objective algorithms.
For all three algorithms, each solution represents a complete operational trajectory over the prediction horizon, including feed rate, agitation speed, airflow rate, and oxygen-enrichment flow. The search process therefore evolves alternative operating trajectories simultaneously and retains the non-dominated combinations that satisfy the dynamic and operational constraints. At termination, each algorithm provides a Pareto archive containing multiple feasible operating strategies with different trade-offs among productivity, energy consumption, operating cost, and biological risk.
To quantify performance preservation across changing operating conditions, a composite robustness index was defined using productivity, energy consumption, operating cost, and safety performance. For each scenario and configuration, these measures were evaluated over the corresponding independent trajectories and mapped onto a common benefit-oriented scale between zero and one. Productivity and safety were treated as benefit-type measures, whereas energy consumption and operating cost were treated as cost-type measures. The normalized performance measure was calculated as follows:
where is the mean value of performance measure m for configuration c under scenario s, and are the minimum and maximum values of that measure within the evaluated scenario–configuration set, contains the benefit-type measures, and contains the cost-type measures. Equal importance was assigned to the four performance dimensions and to the six operational scenarios. The overall robustness index was therefore defined as follows:
Accordingly, Rc is dimensionless and bounded between zero and one, with larger values indicating stronger preservation of balanced production, resource-efficiency, economic, and safety performance across nominal and stressed operating conditions.
The computational implementation was done with Python 3.12.8. The main libraries included NumPy 2.2.2 for vector and matrix calculations, SciPy 1.15.1 for numerical calculations, pandas 2.2.3 for data management, pymoo 0.6.1.5 for NSGA-II structure and multi-objective operations, and Matplotlib 3.10 for graphical output generation. MOPSO and MOGWO were custom-implemented and integrated with the same evaluation, constraint, and non-dominated archive functions. All experiments were run on a 64-bit system with Intel Core i7-13700H, 32 GB RAM, and Windows 11, and the calculations were performed CPU-based.
The average computational times of the digital twin update, multi-objective optimization, Agentic LLM decision, and Safety Governor evaluation were approximately 0.24 s, 64–73 s, 2.9 s, and 0.43 s per supervisory cycle, respectively. Thus, the complete decision cycle remained well within the 5 min supervisory interval under the reported hardware.
11. Results’ Analysis and Discussion
The actual data used were obtained from the operational records of fed-batch processes of an agri-biotech company and covered 12 independent batches with an operating time of 72 h for each batch. The online data included feed rate, agitation speed, air flow rate, enriched oxygen flow, dissolved oxygen, pH, temperature, working volume and off-gas signals, which were recorded with an initial interval of approximately one minute, generating a total of approximately 51,840 time records. Biological variables including biomass, substrate, product and side metabolite concentrations were obtained from at-line or laboratory samplings at four-hour intervals; thus, 19 biological sampling points were available for each batch. Preprocessing included removing duplicate records, checking physical boundaries, correcting short-term gaps, temporal alignment, and resampling the online data on a five-minute grid, ultimately generating 10,368 synchronized time points. To prevent information leakage between calibration and evaluation, data were split at the batch level; 9 batches were used for initial model calibration and digital twin tuning, and 3 independent batches were used to evaluate the reconstruction and prediction power. A strict batch-level validation strategy was adopted to ensure a genuinely independent assessment of the digital twin. Three complete fed-batch runs were reserved exclusively for validation, with none of their measurements used during model calibration or digital twin tuning. This design preserves the full temporal and biological dynamics of each batch and provides a more rigorous evaluation of predictive performance under realistic batch-to-batch variability. pH and temperature were recorded as controlled operating conditions and were not entered into the dynamic model as independent state variables.
Data entry into the computational framework was performed based on the role of each variable. Actual feed, agitation, aeration, and oxygen enrichment profiles were used as operational inputs to the model, while dissolved oxygen and volume measurements as well as periodic biomass, substrate, product, and by-product data were used to synchronize and refine the digital twin. In addition to the actual data, 600 simulated trajectories were generated using the calibrated mechanistic model; each trajectory covered a 72 h cycle with a five-minute time resolution, generating a total of 518,400 simulated time points. These data were used to extend the coverage of operating conditions and to investigate system behavior in areas less frequently observed in historical data, and did not replace the actual data in the validation phase. The simulation domain was determined based on calibrated values from Agri-biotech data, and uncertainties in the parameters related to maximum specific growth rate, substrate half-saturation constant, biomass yield to substrate, empirical oxygen-transfer coefficient and substrate concentration in the feed were taken into account in generating the simulated data. In this way, the synthetic dataset remained directly compatible with the fuzzy model structure, digital twin and multi-objective optimization problem. Six operational scenarios were defined to evaluate the performance of the framework under nominal and stressed conditions, and 100 independent trajectories were generated for each scenario. Scenario S1 represented the nominal situation based on calibrated values and normal operating conditions. S2 simulated higher substrate loading conditions with a 15% increase in substrate concentration in the feed and a maximum 10% increase in the feed rate. S3 considered the drop in oxygen-transfer performance with a 20% decrease in the empirical oxygen-transfer coefficient. S4 represented biological and parametric variability through a 15% reduction in maximum specific growth rate and a 10% reduction in biomass yield to substrate, complementing the gradual parameter variation already represented by the random-walk adaptation of the digital twin. S5 examined uncertainty in substrate availability and uptake with a 25% increase in half-saturation constant and a maximum 10% change in substrate concentration in the feed. S6, as a combined high-stress scenario, simultaneously included a 15% reduction in specific growth rate, a 20% reduction in oxygen transport capacity, a 15% increase in substrate concentration in the feed, and limited fluctuations in operational inputs. All optimization algorithms, digital twins, and safety mechanisms were run on the same set of scenarios to compare the performance of the methods under completely identical data and operational conditions. Measurement uncertainty was handled separately at the estimation level through the stochastic observation model and its calibrated measurement-error covariance.
The validity of the digital twin was assessed using three independent batches that were not used in the model calibration process. The variables biomass, substrate, product, side metabolite, and dissolved oxygen were monitored for the entire 72 h horizon. Figure 5 shows the temporal behavior of a representative batch; the solid lines represent the digital twin response and the hollow markers represent the real measurements. The values in the figure were normalized to allow for simultaneous display of variables with different scales.
Figure 5.
Digital twin tracking performance against real measurements for a representative fed-batch run.
The digital twin was able to reconstruct the stages of biomass growth, gradual substrate consumption, product and side metabolite accumulation, and dynamic changes in dissolved oxygen with good agreement. The limited differences observed occurred mainly in the faster fluctuating variables, especially dissolved oxygen, and no significant systematic deviation was observed during the batch. This behavior indicates that the state synchronization and parameter adaptation mechanism were able to maintain the accuracy of the model during the dynamic evolution of the process.
Table 2 shows the stability of the model accuracy in three independent real runs. The average NRMSE was 4.7% and the average absolute percentage error was 4.4%, while the average coefficient of determination was 0.985. The final product error also remained in the range of 3.4–4.1%, and the MAE of dissolved oxygen did not exceed 2.03% saturation. The close agreement of the validation metrics across the three fully independent batches confirms stable and reproducible digital twin performance across distinct fed-batch runs and demonstrates robustness to the inherent batch-to-batch biological variability observed in the industrial process. This consistency provides a strong empirical basis for using the digital twin in short-term prediction, supervisory decision evaluation, multi-objective optimization, and safety assessment under realistic operating conditions.
Table 2.
Batch-level validation performance of the digital twin.
The performance of the complete framework was investigated in a 72 h fed-batch operation to determine how the digital twin, optimization decisions, agent layer, and safety control interact during the process. Figure 6 shows the time course of five key variables, including biomass, product, feed rate, agitation speed, and dissolved oxygen. Since these variables have different units and ranges, the values were normalized for simultaneous display in the figure only; performance calculations were performed based on the original physical values.
Figure 6.
Dynamic closed-loop response of the integrated framework during a representative fed-batch operation.
The results show that the increase in biomass and product formation was accompanied by continuous adjustment of the control inputs. The feed rate remained limited in the initial stages and gradually increased with increasing biological activity, while the agitation speed was adjusted in proportion to the increasing mass-transfer requirement. The dissolved oxygen drops during the periods of increased metabolic demand were compensated by changing the control response and the DO trajectory returned to the operating range without unstable oscillations. Also, the command changes remained continuous and no sudden jumps in the main inputs were observed.
Table 3 provides a quantitative picture of the quality of the closed-loop control performance and shows that the proposed framework was able to maintain production efficiency within safety limits and smoothness of control changes. The average volumetric productivity of 0.347 g/L·h with a cumulative supply of 18.33 L of feed indicates a gradual and controlled feeding policy. The minimum oxygen margin remained at 5 percentage points relative to the safety hard limit and no hard-constraint violation was recorded. Also, the values of cumulative changes and maximum feed and agitation rate of change indicate that the supervisory decisions are transferred to the downstream control layer without generating severe or discontinuous commands. The set of these results shows the stable and feasible behavior of the integrated framework under closed-loop control conditions.
Table 3.
Derived closed-loop performance indicators for the representative run.
The multi-objective nature of the problem was assessed by examining five non-dominated solutions representative of different parts of the Pareto front. The four criteria were production efficiency, energy consumption, operating cost, and biological risk, with their optimal directions being maximum, minimum, minimum, and minimum, respectively. To compare the objectives with different units simultaneously, the values were normalized for graphical display only, and the main calculations were performed based on the actual values. Figure 7 shows that no solution is superior in all objectives simultaneously; P1 offers the most conservative behavior in terms of risk, P3 has the lowest energy consumption, P7 is the least expensive option, and P9 provides the highest efficiency. In contrast, P5 is located in the middle region of the decision space and provides a better balance between the four objectives without being at extreme points.
Figure 7.
Multi-objective trade-off profiles of representative Pareto solutions.
The difference between non-dominated solutions is also visible at the level of operational decisions. Lower-risk solutions are mainly associated with higher mass-transfer intensity and higher oxygen margin maintenance, while energy- and cost-oriented options use lower levels of agitation, aeration, and oxygen enrichment. In contrast, moving towards higher productivity requires increasing feed rates and operational intensity, gradually reducing the oxygen safety margin. This behavior confirms that the observed trade-off is due to the real structure of the process decisions and not simply the result of scaling the objective functions.
Table 4 shows that solution P5, with an average feed rate of 0.220 L/h, an average agitation speed of 575 rpm, an air flow of 1.93 L/min, and a minimum DO margin of 9.3 percentage points, achieves a balanced policy without excessive use of control inputs. In contrast, P9 requires the highest levels of feed, agitation, aeration, and oxygen enrichment to achieve maximum efficiency, and its DO margin is reduced to 5.1 percentage points. Thus, the Pareto set allows for the selection of an operating policy that is appropriate for production, energy, cost, or safety priorities without imposing a pre-determined preference.
Table 4.
Operating characteristics of selected Pareto solutions.
The robustness of the proposed framework was investigated under six operational scenarios with different levels of uncertainty and process stress. Scenario S1 represents the nominal conditions, while S2 to S5 examine the effects of higher substrate loading, oxygen transport capacity loss, biological variability, and substrate uncertainty, respectively; S6 incorporates the simultaneous combination of multiple stress sources. Normalized productivity, energy, cost, and safety indices were calculated to directly compare performance across scenarios.
The trends in Figure 8 show that the framework has limited and non-sudden performance degradation against single disturbances. In S2, increasing substrate loading resulted in a small increase in productivity, but at the same time, energy, cost, and safety indices decreased. S3 had the largest impact on energy and safety sustainability among the single scenarios, which is consistent with the nature of oxygen transport limitation. In S4, despite the biological changes, a relative recovery of energy and cost indices is observed, and S5 also provides an intermediate performance between nominal and severe stress conditions. S6 shows the weakest response in all dimensions; however, the overall robustness index decrease is limited to about 0.77 and the system does not enter the operational failure zone.
Figure 8.
Robustness of the integrated framework under operational scenarios S1–S6.
Table 5 shows that the increase in uncertainty intensity is accompanied by an increase in substrate and side metabolite accumulation and a decrease in oxygen margin. In S6, the maximum substrate reached 11.7 g/L and the side metabolite reached 3.76 g/L, and the minimum DO margin decreased to 2.1 percentage points. Under the same conditions, the Safety Governor made five corrective interventions and one fallback activation was recorded. Despite the gradual intensification of conditions from S1 to S6, no hard-constraint violations were observed. This shows that the framework was able to control performance degradation while maintaining process safety limits under uncertain and stressful conditions.
Table 5.
Operational and safety outcomes under robustness scenarios.
To assess the effect of the uncertainty modeling approach, the response of the proposed framework was examined at different α-cut levels from 0 to 1. Decreasing α means a wider uncertainty range and consequently more conservative decisions are made, while as α approaches 1, the uncertainty range becomes narrower and a more aggressive exploitation policy can be applied. Figure 9 shows the simultaneous changes in the productivity index, energy efficiency, digital twin tracking stability, safety margin, and the need for re-optimization at different α-cut levels.
Figure 9.
Sensitivity of the integrated framework to α-cut levels and adaptive re-optimization behavior.
The pattern of results shows that with increasing α, the productivity index and energy efficiency gradually improve, as the digital twin and the decision-making layer face a tighter uncertainty region and there is less need to apply conservative policies. At the same time, the stability of the twin tracking is also enhanced up to medium and high levels of α, indicating that the model adaptation mechanism is able to maintain a more accurate synchronization with the physical process under lower uncertainty conditions. In contrast, the safety margin decreases with increasing α, because the narrowing of the fuzzy intervals leads to decisions that are executed with a smaller margin of caution. The reoptimization behavior also shows a complementary trend. At low levels of α, the larger range of uncertainty increases the frequency of the need for decision revision and reoptimization, while at higher α this need is noticeably reduced. This result indicates that the role of reoptimization in the present framework is not merely a correction mechanism, but is directly related to the severity of the fuzzy uncertainty and the quality of the digital twin synchronization. Overall, the intermediate region α = 0.50 to α = 0.75 shows the most balanced behavior; in this range, improvements in production and energy performance are achieved without a sharp drop in safety margin and without imposing high reoptimization demands.
The performance of the Safety Governor was evaluated based on its ability to identify potentially unsafe decisions, to modify invalid commands to a minimum, and to maintain strict process constraints. The main criterion was the predicted safety margin relative to the critical limits; a positive value of this index indicates that the path remains within the permissible region, and a negative value indicates that at least one of the strict constraints is likely to be violated. Figure 10 shows the time behavior of a stressed execution of the agent. The raw decision margin of the agent crosses the zero boundary at several time intervals, while after the Safety Governor is applied, the execution command margin remains positive throughout the entire horizon. The margins related to substrate, side metabolite, and volume also do not enter the unpermitted region, despite a gradual decrease in the final stages of the batch.
Figure 10.
Dynamic safety-margin response before and after Safety Governor intervention.
The main drops in the raw margin occur at approximately 22, 48, and 62 h, corresponding to the increase in metabolic pressure and the system approaching the operational limits. At these points, the repair mechanism causes the applied decision to return to the feasible region without a drastic change in the original policy. The gap between the raw decision curve and the response after the Governor also shows that the intervention intensity changes proportionally to the degree of approaching the safety limits and unnecessary command corrections are avoided under normal conditions.
Safety margins are represented in two complementary forms. For direct operational interpretation, the dissolved-oxygen margin is expressed in percentage points as the distance between the predicted DO level and the prescribed minimum DO limit; positive values indicate remaining safety headroom, whereas negative values indicate a boundary excursion. Within the Safety Governor, the corresponding constraint distances are normalized by their respective limits to provide dimensionless margins that can be evaluated consistently across different safety variables.
Table 6 shows that with increasing uncertainty intensity, the share of direct acceptance decreases from 96.0% in S1 to 78.4% in S6, while the share of modified decisions increases. The fallback rate is only 1.8% even in the combined S6 scenario, indicating that the repair step is sufficient in most cases. The increase in the mean correction norm from 0.021 to 0.085 also indicates that the severity of the corrections has increased in proportion to the severity of the conditions. Despite the reduction in the safety margin to 0.038 in the most severe scenario, no residual hard-constraint violations remain after the Governor is applied; therefore, the safety layer has been able to independently maintain the safe execution boundary without replacing the main decision-making logic.
Table 6.
Safety Governor performance across operational scenarios.
The performance of the Agentic LLM layer was evaluated based on the quality of supervisory decision making during 12 consecutive cycles. The evaluation focused on five indicators: completeness of input evidence, selection of admissible candidates, compliance of the decision with the active policy profile, stability of the selection between consecutive cycles, and the need for replanning. These indicators are directly related to the Observe–Plan–Call–Evaluate–Replan–Propose logic and assess the agent’s performance independently of the Safety Governor. Figure 11 shows that under steady-state conditions, completeness of evidence increased from 0.88 in the first cycle to 0.98 by the fifth cycle, while the selection rate of admissible candidates increased from 0.90 to 0.97. Compliance with the policy profile also remained in the range of 0.95 to 0.98 during the same period.
Figure 11.
Dynamic performance of the Agentic LLM during supervisory decision cycles.
An abrupt change in process conditions around the sixth cycle caused a temporary drop in several indicators; Evidence completeness decreased to 0.84, admissible candidate selection to 0.76, and decision stability to 0.79, while replanning demand increased from 0.18 to 0.61. This behavior is important because the agent, when faced with inconsistent or insufficient information, did not continue the previous decision without revision and activated the tool recall and reevaluation cycle. The indices were then recovered over two to three cycles, and at the end of the horizon, evidence completeness reached 1.00, policy conformity to 0.99, and decision stability to 0.97; in contrast, replanning demand decreased to 0.15.
The response around the sixth cycle also reveals the adaptive role of the Agentic LLM beyond the terminal decision outcome. When the process context changed, the agent reorganized the supervisory reasoning sequence by recalling computational tools, reassessing the available evidence, and increasing replanning activity until the decision context became sufficiently coherent again. The subsequent recovery of evidence completeness, policy conformity, and decision stability indicates that the agent was able to reconstruct a consistent decision basis after the disturbance rather than simply continuing the previous supervisory trajectory. This behavior provides direct evidence of state-dependent orchestration and adaptive replanning within the closed-loop decision architecture.
To isolate the contribution of each component of the framework and provide a conventional predictive-control reference, the full version was compared with five reduced configurations and a deterministic MPC baseline under the same data, scenarios, and initial conditions. In the Fixed-control baseline, adaptive monitoring decisions were eliminated. The deterministic MPC baseline used the same mechanistic process model and receding-horizon structure, but relied on nominal parameter values, deterministic state predictions, and a fixed numerical decision criterion without fuzzy uncertainty representation or Agentic LLM supervision. In No-DT adaptation, the process model was used without online parameter updates; in No-Fuzzy, parameter uncertainty was considered as deterministic; in No-LLM, agentic reasoning, tool orchestration, and context-dependent replanning were removed, and the available Pareto candidates were handled using a fixed decision rule; and in No-Safety, the output of the agent layer was transferred to the control layer without passing through the Safety Governor. For each configuration, the robustness index was obtained by aggregating the normalized productivity, energy-efficiency, operating-cost, and safety-performance indices across scenarios S1–S6. All four components were expressed on a common benefit-oriented scale and assigned equal importance so that the resulting index reflected the overall ability of the framework to preserve balanced performance under both nominal and stressed operating conditions. Values closer to unity therefore indicate stronger simultaneous preservation of production performance, resource efficiency, cost effectiveness, and safety. Recovery cycles indicate the number of supervisory cycles required for the process response to return to the stable operating range after a significant disturbance.
All configuration-level productivity values were evaluated over the same 72 h batch horizon and under matched initial and scenario conditions. Because working volume evolves during fed-batch operation, productivity was expressed on a volumetric basis while retaining the corresponding dynamic working-volume trajectory in the product calculation. The reported values therefore represent product formation per unit volume and time rather than absolute product accumulation, allowing for consistent comparison across the evaluated configurations.
Table 7 shows that the deterministic MPC baseline improved both production and energy performance relative to fixed operation, increasing productivity from 0.286 to 0.321 g/L·h while reducing energy demand from 19.9 to 18.1 kWh/batch. Its robustness index of 0.812 and minimum DO margin of 2.9 percentage points nevertheless remained below those obtained with the uncertainty-aware and adaptive configurations. The No-DT configuration further illustrates the role of online model adaptation, as removing parameter updating reduced the robustness of the closed-loop response and increased the recovery time. Treating parameter uncertainty deterministically in the No-Fuzzy configuration primarily affected performance under uncertain conditions and reduced the robustness index from 0.893 to 0.836. The No-LLM configuration retained digital twin adaptation and multi-objective optimization but removed agentic reasoning, tool orchestration, and context-dependent replanning; consequently, the recovery time increased from two to four supervisory cycles and the robustness index decreased from 0.893 to 0.858. These differences indicate that predictive control, uncertainty representation, model adaptation, and supervisory reasoning contribute at distinct levels to the overall closed-loop performance. The No-Safety configuration produced 0.355 g/L·h with an energy demand of 16.5 kWh/batch, whereas the full framework achieved 0.347 g/L·h at 16.8 kWh/batch. Although the No-Safety case appears slightly more efficient from a purely productivity–energy perspective, its operating performance was accompanied by a higher biological risk of 0.137, a lower robustness index of 0.821, and a negative minimum DO margin of −1.4 percentage points. In the corresponding safety trajectory, three principal boundary excursions occurred during periods of elevated metabolic and oxygen-transfer demand. These events were transient rather than sustained, but the deepest excursion reduced the DO margin to approximately −1.4 percentage points, confirming that the apparent performance advantage was accompanied by measurable operation beyond the prescribed oxygen-safety boundary. By comparison, the full framework reduced biological risk to 0.091, increased robustness to 0.893, and maintained a positive DO margin of +5.0 percentage points. The intervention statistics indicate that these safety gains were achieved through targeted corrections rather than broad suppression of operating intensity, since most admissible decisions passed without modification and corrective action increased primarily as trajectories approached critical limits. This balance preserves high process performance while maintaining a more robust and physiologically safer operating envelope. This comparison shows that the final performance is not the result of the effect of a single component, and the main advantage of the framework comes from the interaction between the adaptive digital twin, fuzzy modeling, agent-based decision-making, and the independent safety layer.
Table 7.
Ablation study and comparison of reduced framework configurations.
The performance of the three algorithms was compared based on their convergence behavior in 30 independent runs. For this purpose, the mean-normalized hypervolume was followed during 250 iterations to determine, in addition to the final quality of the Pareto front, the speed at which each method approached the stable region. Figure 12 shows that all three algorithms have a uniform convergence trend, but MOGWO maintains a higher level of hypervolume from the middle stages onwards. MOPSO also has a close behavior, while NSGA-II reaches the stable region with a slower slope.
Figure 12.
Convergence comparison of NSGA-II, MOPSO, and MOGWO based on mean-normalized hypervolume.
At the end of 250 iterations, the mean-normalized hypervolume for NSGA-II, MOPSO, and MOGWO was 0.909, 0.928, and 0.941, respectively. Also, reaching 95% achievable improvement over the initial value occurred at around iterations 191, 159, and 149, respectively. Therefore, the main difference between the three methods is observed more in the convergence speed and the final quality of the Pareto front coverage than in the ability to find feasible solutions. Despite the relative superiority of MOGWO in this indicator, the performance gap of the three algorithms remains limited. This shows that the main results of this research do not depend on the behavior of a single algorithm and that all three methods were able to produce non-dominated sets of acceptable quality.
The stability of the results of NSGA-II, MOPSO, and MOGWO was evaluated based on 30 independent runs and four indices HV, IGD, GD, and Spacing. The Friedman test was used to examine the overall difference between the three algorithms, and if the difference was significant, pairwise comparisons were performed using the Wilcoxon signed-rank test and Holm correction. The significance level was set at 0.05, and in Friedman’s ranking, a lower value indicates better performance.
The results of Table 8 show that the difference between the three algorithms is statistically significant for all four indices. MOGWO obtained the lowest average rank in all criteria, followed by MOPSO. Pairwise comparisons also confirm the difference between MOGWO and NSGA-II in all indices. The difference between MOGWO and MOPSO remains significant for HV, IGD, and GD, but the corrected p-value for the Spacing criterion is 0.070; therefore, the difference in the dispersion of the solutions of these two algorithms is not significant at the 0.05 level. This result suggests that the observed advantage for MOGWO is mainly related to the convergence and quality of the non-dominated front, while MOPSO performed closer in terms of preserving the distribution of solutions.
Table 8.
Statistical comparison of NSGA-II, MOPSO, and MOGWO over 30 independent runs.
Along with the results obtained from the digital twin validation, trade-off analysis, robustness check, Safety Governor evaluation and the performance of the Agentic LLM layer, the managerial implications of the framework can be interpreted at the operational decision-making level. The results show that the production manager does not have to make operating decisions based on a single criterion; the decision-maker can choose between policies with different levels of productivity, energy consumption, cost and biological risk. This capability is particularly important for fed-batch processes where biological behavior and mass-transfer constraints change during the batch since increasing production is not the best management option in all conditions. The use of Pareto sets, uncertainty scenarios and safety margins allows managers to adjust the operating policy according to the process stage, equipment capacity, energy constraints and acceptable risk level. Also, separating the proposed decision from its implementation authorization via the Safety Governor creates a clearer structure for assigning responsibility between the operator, process engineer and production manager.
At the operational governance level, the integration of digital twin and Agentic LLM enables the recording and review of decision logic and moves decision-making from reactive management to predictive decision-making. Changes in process status, increased uncertainty or reduced safety margins can be identified before serious deviations occur and managed in the form of re-optimization, repair or fallback. Such information can be used to revise SOPs, capacity planning, energy consumption management, setting permissible operating limits and training operators. The use of pre-approved policy profiles also enables the Agentic LLM to translate organizational priorities related to production, cost, quality, and safety into context-dependent supervisory reasoning while preserving consistency with established operating policies. This provides a structured mechanism through which managerial priorities can dynamically influence the supervisory decision process as process conditions evolve.
12. Conclusions
This research presented an integrated framework for control and decision-making in industrial fed-batch bioreactors, in which adaptive digital twin, fuzzy multi-objective optimization, Agentic LLM and independent Safety Governor were connected in a closed-loop and hierarchical structure. The framework was structured around complementary functional capabilities in which state estimation and prediction, uncertainty management, non-dominated solution generation, supervisory reasoning, tool orchestration, context-dependent replanning, and safety validation operate as an integrated closed-loop decision process. Within this architecture, the Agentic LLM serves as the adaptive supervisory intelligence that integrates process evidence, operational context, policy knowledge, and decision history, while the Safety Governor complements this reasoning layer by independently validating the proposed action before execution. The use of real data from 12 industrial batches, together with simulated data based on the calibrated model, allowed the framework to be evaluated over a wide range of nominal and stressed conditions.
The validation results showed that the digital twin has a good ability to reproduce the dynamic behavior of the process. The average NRMSE was 4.7%, MAPE was 4.4%, and the average coefficient of determination was 0.985 in three independent batches. This level of agreement provided a reliable basis for using twin predictions in supervisory decision-making and safety assessment. In closed-loop operation, the framework was also able to provide a volumetric productivity of 0.347 g/L·h with smooth changes in control commands, maintaining a positive dissolved oxygen margin. The multi-objective structure of the model showed that increased production does not come without operational or safety costs, and Pareto solutions provide the decision-maker with a realistic range of production-oriented, energy-oriented, cost-oriented, and risk-averse policies.
The stability of the framework under uncertainty was another main result of this research. Even in the high-stress composite scenario, performance degradation occurred gradually, and safety interventions prevented potentially invalid decisions from turning into severe process violations. Fuzzy sensitivity analysis also showed that the level of α directly affects the trade-off between efficiency, conservatism and the need for reoptimization, with the intermediate range of 0.50 to 0.75 producing a more balanced behavior. The Safety Governor corrected a larger proportion of decisions in the most severe conditions, but no remaining severe violations were recorded after the intervention. On the other hand, the Agentic LLM enabled replanning in the face of a change in the situation, rather than mechanically continuing the previous decision, and after the perturbation, the quality of evidence and the stability of the decision were recovered. The ablation study also showed that the final performance is not the result of a single component, and that the removal of the digital twin adaptation, the fuzzy model, the agent layer or the Safety Governor each undermines a different part of robustness, decision quality or safety.
Despite these results, several limitations remain noteworthy. The experimental scope of this study is limited to an industrial environment and a specific fed-batch structure, and the transferability of the framework to biological strains, reactor scales, and different equipment requires a broader evaluation. Also, the uncertainty representation is based on triangular fuzzy numbers and a limited number of key parameters; in more complex processes, the dependence between parameters, non-stationary changes, and multi-source uncertainties may require a richer representation. The computational cost of multi-objective reoptimization and the dependence of the agent layer on the quality, completeness, and consistency of the available tools, policy profiles, and process information should also be considered in very fast applications or larger-scale implementations. Potential LLM-related failure modes may arise from incomplete interpretation of available evidence, inconsistent tool-use sequences, or unstable candidate selection; these risks are mitigated through evidence-completeness checks, admissibility filtering, repeated tool invocation when required, and independent numerical validation by the Safety Governor before execution.
Future directions could focus on multi-site and multi-scale validation, long-term adaptive learning of parameters, development of more advanced uncertainty models, the use of surrogate models to reduce computation time, and combining fault diagnosis with a digital twin. The development of formal verification methods for Safety Governor, human-in-the-loop evaluation, explainability analysis of Agentic LLM decisions, and hardware-in-the-loop implementation can also bridge the gap between computational framework and industrial deployment. Overall, the proposed architecture demonstrates that the combination of adaptive digital twin, multi-objective optimization under uncertainty, agent reasoning, and independent safety control can provide a practical basis for the next generation of decision-support systems and intelligent control in industrial bioprocesses.
Author Contributions
Conceptualization, H.N. and Z.Y.; Methodology, H.N. and Z.Y.; Software, H.N.; Validation, H.N.; Formal analysis, H.N. and Z.Y.; Investigation, H.N. and Z.Y.; Resources, H.N.; Data curation, H.N.; Writing—original draft, H.N. and Z.Y.; Writing—review & editing, H.N. and Z.Y.; Visualization, H.N.; Supervision, Z.Y.; Project administration, Z.Y.; Funding acquisition, Z.Y. All authors have read and agreed to the published version of the manuscript.
Funding
This study was financially supported by the UNWE Research Program.
Institutional Review Board Statement
Not applicable.
Informed Consent Statement
Not applicable.
Data Availability Statement
The data presented in this study are available on reasonable request from the corresponding author due to confidentiality restrictions.
Acknowledgments
Generative AI was used solely for the creation of the bioreactor schematic presented in Figure 1 and for limited grammatical checking of this manuscript. Specifically, ChatGPT (GPT-5.6 Sol, OpenAI) was used to assist in generating the graphical schematic and to identify and correct grammatical issues. It was not used to generate, develop, interpret, or revise the scientific content, methodology, analyses, results, discussions, or conclusions of this manuscript. All scientific content and intellectual contributions were independently developed, written, reviewed, and verified by the authors, who take full responsibility for the accuracy, integrity, and originality of this manuscript.
Conflicts of Interest
The authors declare no conflicts of interest.
References
- Chen, Y.; Yang, O.; Sampat, C.; Bhalode, P.; Ramachandran, R.; Ierapetritou, M. Digital twins in pharmaceutical and biopharmaceutical manufacturing: A literature review. Processes 2020, 8, 1088. [Google Scholar] [CrossRef] [Scilit]
- Park, S.Y.; Park, C.H.; Choi, D.H.; Hong, J.K.; Lee, D.Y. Bioprocess digital twins of mammalian cell culture for advanced biomanufacturing. Curr. Opin. Chem. Eng. 2021, 33, 100702. [Google Scholar] [CrossRef] [Scilit]
- Schmidt, A.; Helgers, H.; Lohmann, L.J.; Vetter, F.; Juckers, A.; Mouellef, M.; Zobel-Roos, S.; Strube, J. Process analytical technology as key-enabler for digital twins in continuous biomanufacturing. J. Chem. Technol. Biotechnol. 2022, 97, 2336–2346. [Google Scholar] [CrossRef] [Scilit]
- Isoko, K.; Cordiner, J.L.; Kis, Z.; Moghadam, P.Z. Bioprocessing 4.0: A pragmatic review and future perspectives. Digit. Discov. 2024, 3, 1662–1681. [Google Scholar] [CrossRef] [Scilit]
- Patel, N.; Padhiyar, N. Multi-objective dynamic optimization study of fed-batch bio-reactor. Chem. Eng. Res. Des. 2017, 119, 160–170. [Google Scholar] [CrossRef] [Scilit]
- Kumar, D.; Gangwar, N.; Rathore, A.S.; Ramteke, M. Multi-objective optimization of monoclonal antibody production in bioreactor. Chem. Eng. Process.-Process Intensif. 2022, 180, 108720. [Google Scholar] [CrossRef] [Scilit]
- Decardi-Nelson, B.; Alshehri, A.S.; Ajagekar, A.; You, F. Generative AI and process systems engineering: The next frontier. Comput. Chem. Eng. 2024, 187, 108723. [Google Scholar] [CrossRef] [Scilit]
- Schäfer, P.; Krinke, L.J.; Wlotzka, M.; Asprion, N. Context is all you need: Toward autonomous model-based process design using agentic AI in flowsheet simulations. AIChE J. 2026, 72, e70488. [Google Scholar] [CrossRef] [Scilit]
- Bayer, B.; Dalmau Diaz, R.; Melcher, M.; Striedner, G.; Duerkop, M. Digital twin application for model-based DoE to rapidly identify ideal process conditions for space-time yield optimization. Processes 2021, 9, 1109. [Google Scholar] [CrossRef] [Scilit]
- Sokolov, M.; von Stosch, M.; Narayanan, H.; Feidl, F.; Butté, A. Hybrid modeling—A key enabler towards realizing digital twins in biopharma? Curr. Opin. Chem. Eng. 2021, 34, 100715. [Google Scholar] [CrossRef] [Scilit]
- Mahanty, B. Hybrid modeling in bioprocess dynamics: Structural variabilities, implementation strategies, and practical challenges. Biotechnol. Bioeng. 2023, 120, 2072–2091. [Google Scholar] [CrossRef] [Scilit] [PubMed]
- Riezzo, L.; Kay, H.; Feng, Y.; Jing, K.; Zhang, D. Accelerating bioprocess digital twin development by integrating hybrid modelling with transfer learning. Chem. Eng. J. 2025, 511, 162018. [Google Scholar] [CrossRef] [Scilit]
- Chang, L.; Liu, X.; Henson, M.A. Nonlinear model predictive control of fed-batch fermentations using dynamic flux balance models. J. Process Control 2016, 42, 137–149. [Google Scholar] [CrossRef] [Scilit]
- Jabarivelisdeh, B.; Findeisen, R.; Waldherr, S. Model predictive control of a fed-batch bioreactor based on dynamic metabolic-genetic network models. IFAC-PapersOnLine 2018, 51, 34–37. [Google Scholar] [CrossRef] [Scilit]
- Rashid, M.M.; Jackson, R.; Parulekar, S.J.; Cinar, A. Critical quality predictive control of fed-batch mammalian cell bioreactors. IFAC-PapersOnLine 2021, 54, 330–335. [Google Scholar] [CrossRef] [Scilit]
- Deb, K.; Pratap, A.; Agarwal, S.; Meyarivan, T. A fast and elitist multiobjective genetic algorithm: NSGA-II. IEEE Trans. Evol. Comput. 2002, 6, 182–197. [Google Scholar] [CrossRef] [Scilit]
- Coello Coello, C.A.; Pulido, G.T.; Lechuga, M.S. Handling multiple objectives with particle swarm optimization. IEEE Trans. Evol. Comput. 2004, 8, 256–279. [Google Scholar] [CrossRef] [Scilit]
- Ye, Q.; Wang, W.; Wang, Z. Survey of multi-objective particle swarm optimization algorithms and their applications. J. Zhejiang Univ. (Eng. Sci.) 2024, 58, 1107–1120. [Google Scholar] [CrossRef]
- Mirjalili, S.; Saremi, S.; Mirjalili, S.M.; Coelho, L.d.S. Multi-objective grey wolf optimizer: A novel algorithm for multi-criterion optimization. Expert Syst. With Appl. 2016, 47, 106–119. [Google Scholar] [CrossRef] [Scilit]
- Quan, R.; Wang, J.; Li, T. Compatibility optimization of a polyhedral-shape thermoelectric generator for automobile exhaust recovery considering backpressure effects. Heliyon 2022, 8, e12348. [Google Scholar] [CrossRef] [Scilit] [PubMed]
- Chen, Y.-F.; Wang, F.-S. Crisp and fuzzy optimization of a fed-batch fermentation for ethanol production. Ind. Eng. Chem. Res. 2003, 42, 6843–6850. [Google Scholar] [CrossRef] [Scilit]
- Wang, F.-S.; Jing, C.-H.; Tsao, G.T. Fuzzy-decision-making problems of fuel ethanol production using a genetically engineered yeast. Ind. Eng. Chem. Res. 1998, 37, 3434–3443. [Google Scholar] [CrossRef] [Scilit]
- Valencia, C.; Espinosa, G.; Giralt, J.; Giralt, F. Optimization of invertase production in a fed-batch bioreactor using simulation based dynamic programming coupled with a neural classifier. Comput. Chem. Eng. 2007, 31, 1131–1140. [Google Scholar] [CrossRef] [Scilit]
- Ames, A.D.; Xu, X.; Grizzle, J.W.; Tabuada, P. Control barrier function based quadratic programs for safety critical systems. IEEE Trans. Autom. Control 2017, 62, 3861–3876. [Google Scholar] [CrossRef] [Scilit]
- Nozari, H.; Yordanova, Z. Hierarchical Digital Twin Orchestration Across Edge and Cloud for Scalable Composting System Intelligence. Algorithms 2026, 19, 450. [Google Scholar] [CrossRef] [Scilit]
- Khoo, T.L.; Lee, T.S.; Bee, S.-T.; Ma, C.; Zhang, Y.-Y. A comparative review of large language models in engineering with emphasis on chemical engineering applications. Processes 2025, 13, 2680. [Google Scholar] [CrossRef] [Scilit]
- Alviz-Meza, A.; Valencia-Arias, A.; Rojas-Flores, S.; Díaz, F. Agentic artificial intelligence in chemical engineering, process systems engineering, and process control: A systematic review of emerging perspectives and challenges. Processes 2026, 14, 2917. [Google Scholar] [CrossRef] [Scilit]
- Zhou, J.; Xu, F.; Chang, Z.; Liu, D.; Li, L.; Cui, J.; Li, Y.; Li, X.; Qian, L.; Zhang, Z.; et al. From lab to fab: A large language model for chemical engineering. Chin. J. Catal. 2025, 73, 159–173. [Google Scholar] [CrossRef] [Scilit]
- Shariatifar, M.; Salimian Rizi, M.; Sotudeh-Gharebagh, R.; Zarghami, R.; Mostoufi, N. On digital twins in bioprocessing: Opportunities and limitations. Process Biochem. 2025, 156, 274–299. [Google Scholar] [CrossRef] [Scilit]
- Qiu, Y.; Yang, X.; Chen, S. An improved gray wolf optimization algorithm solving to functional optimization and engineering design problems. Sci. Rep. 2024, 14, 14190. [Google Scholar] [CrossRef] [Scilit] [PubMed]
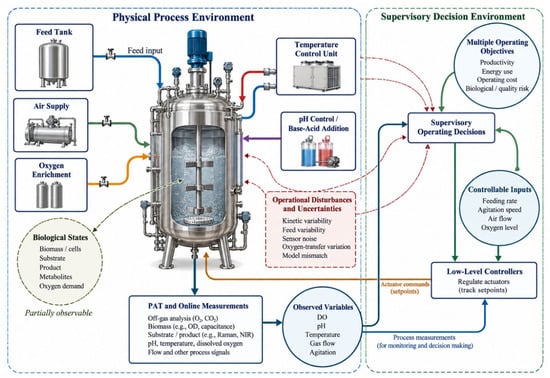
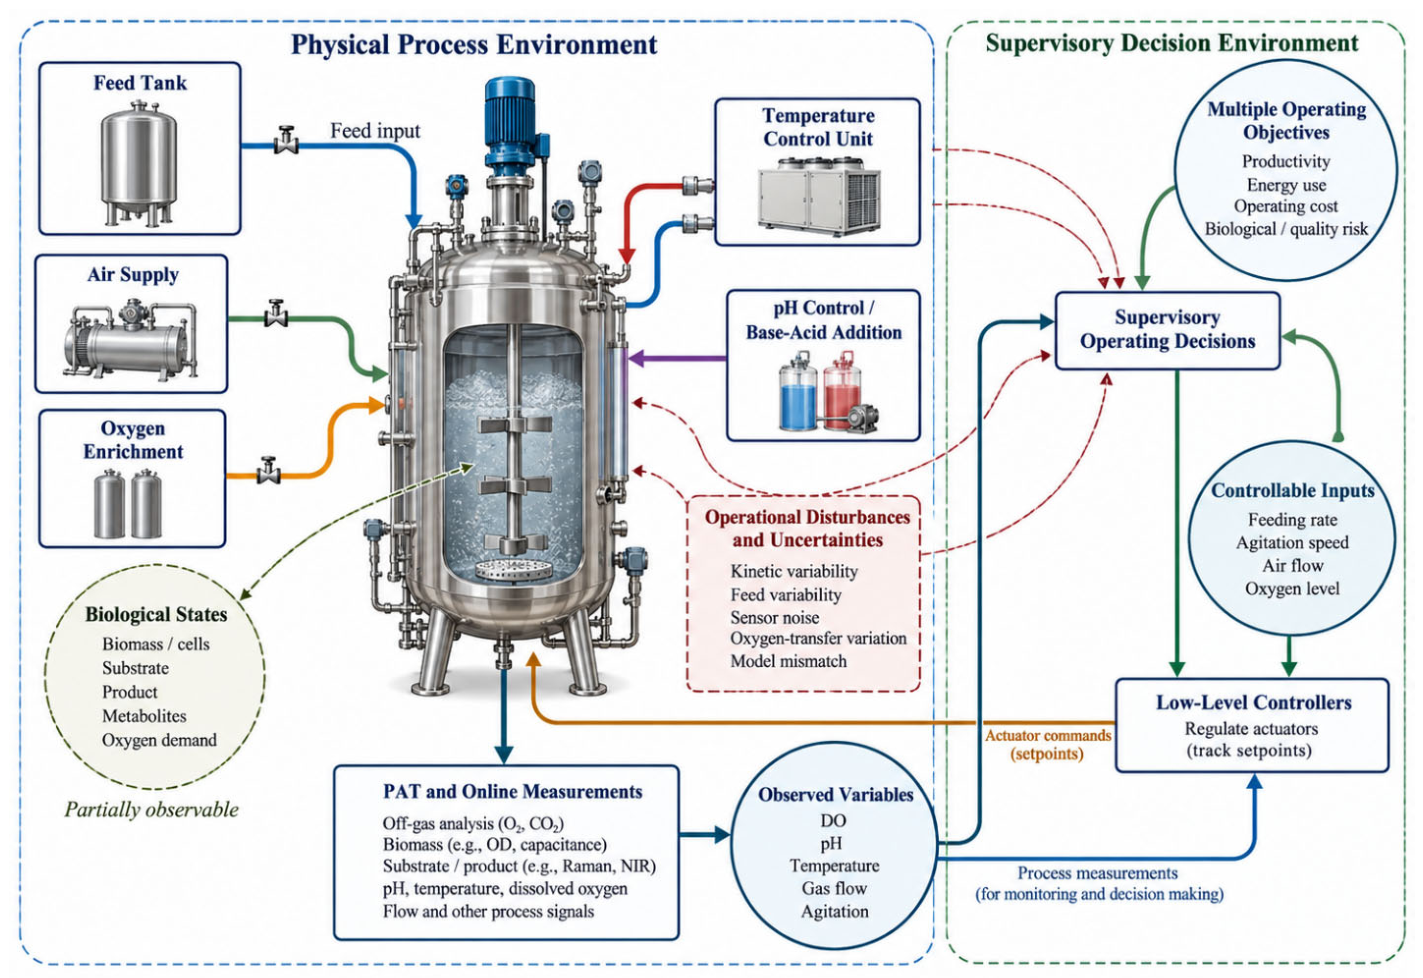
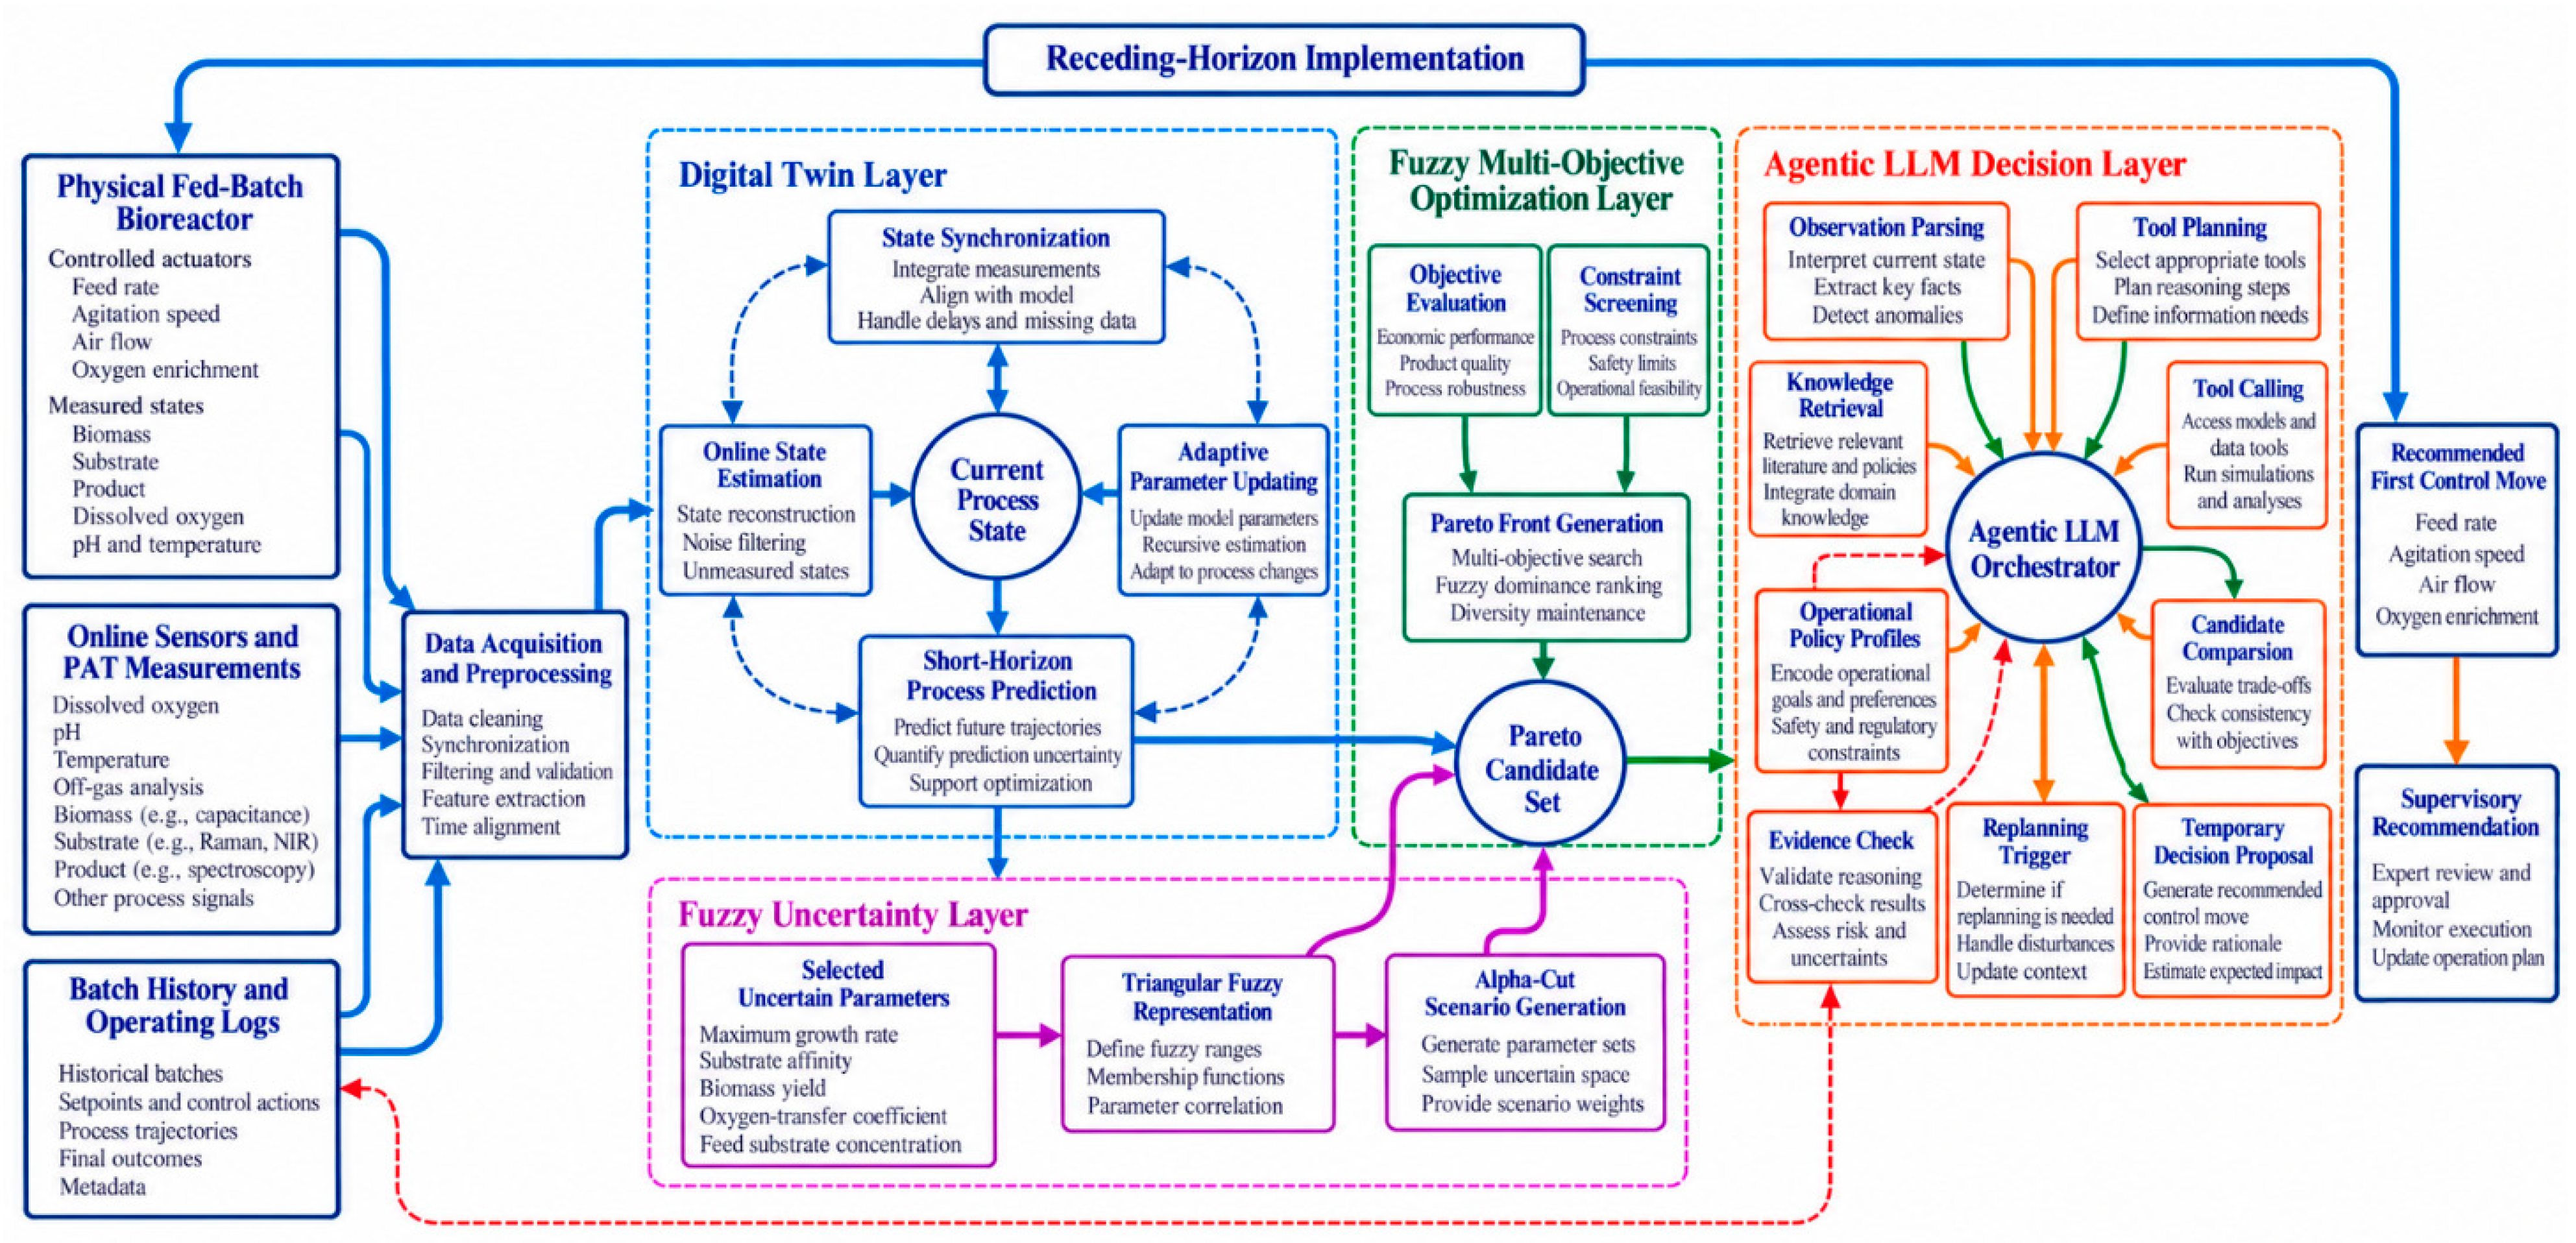
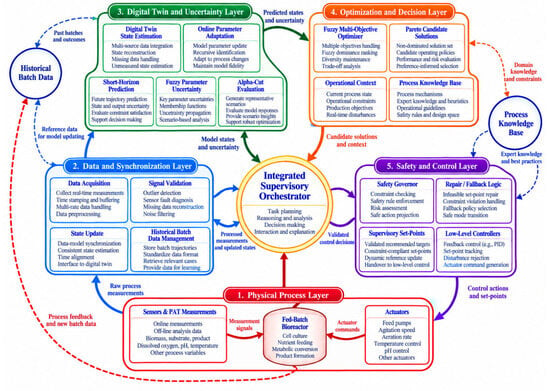
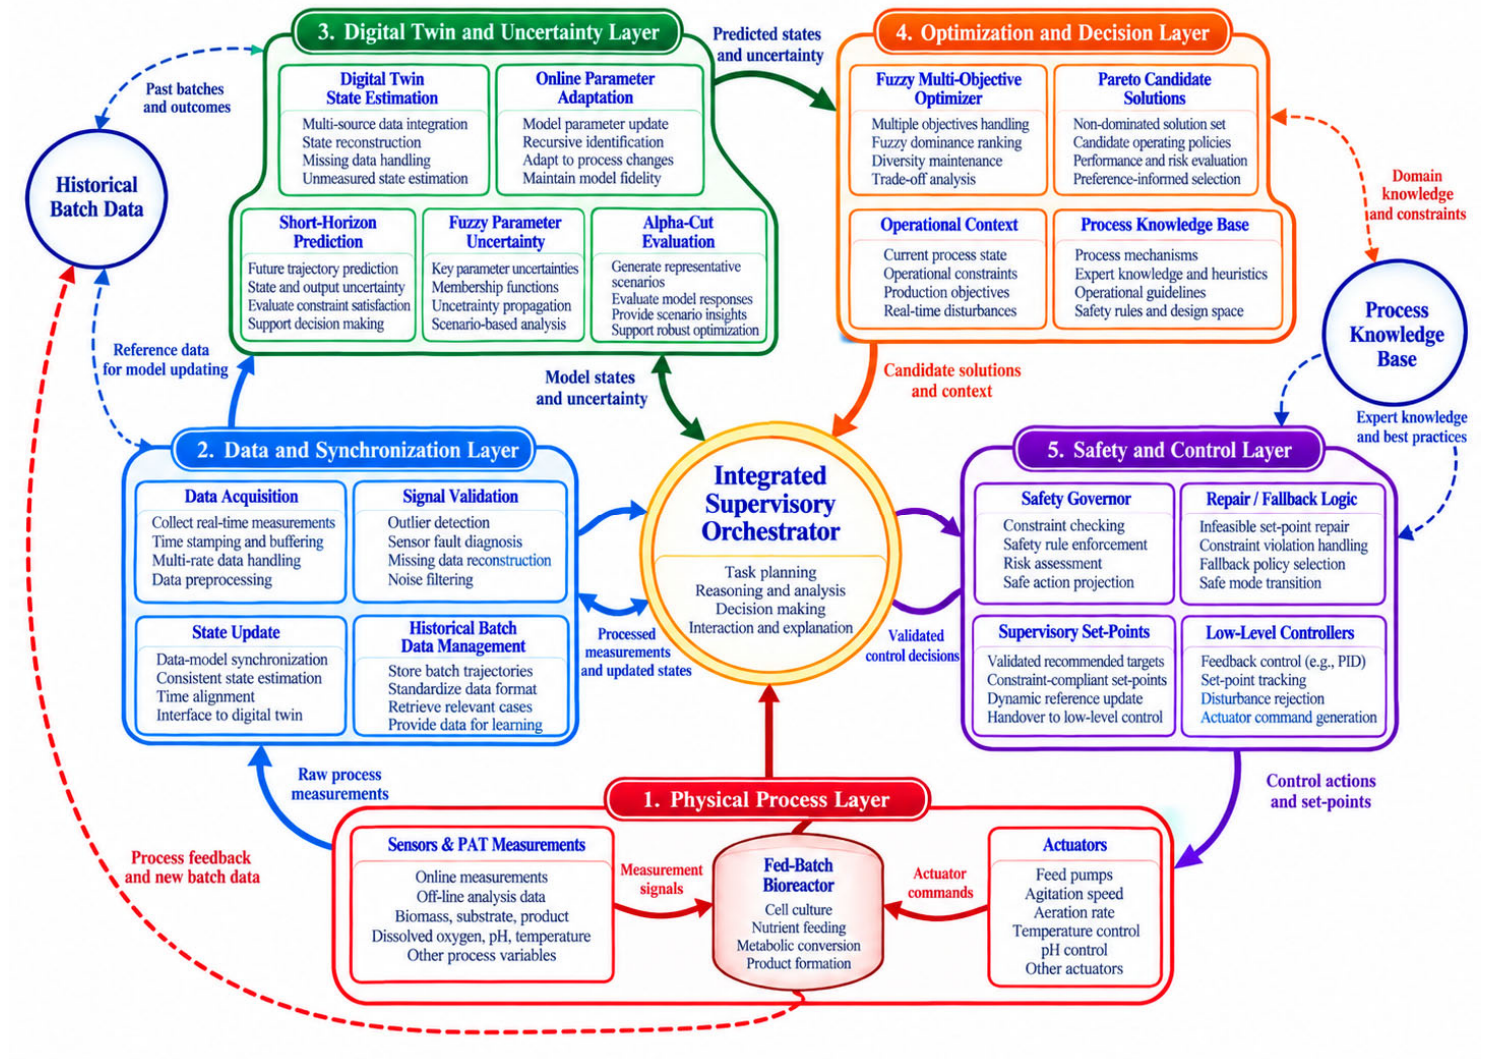
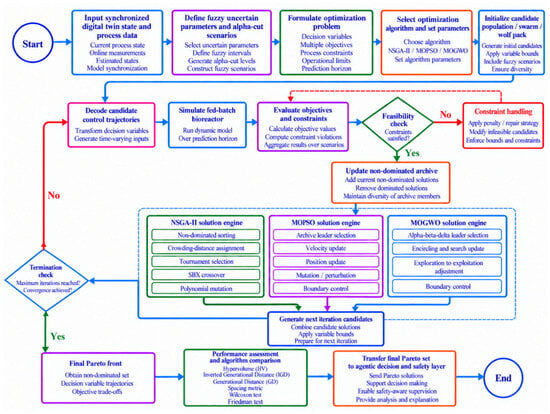
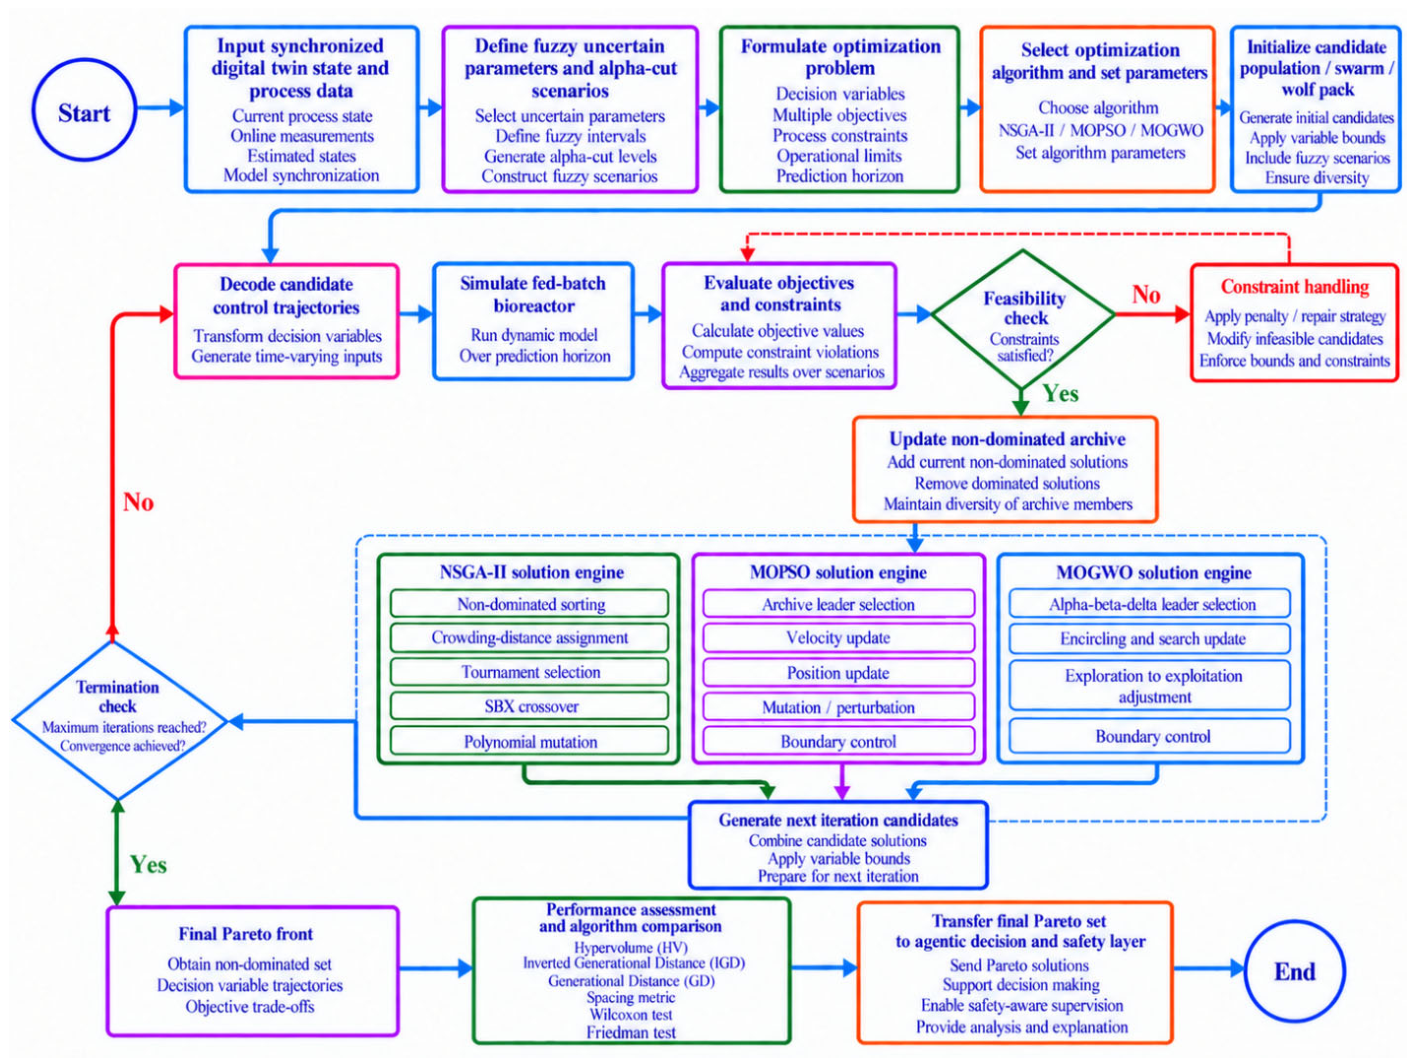
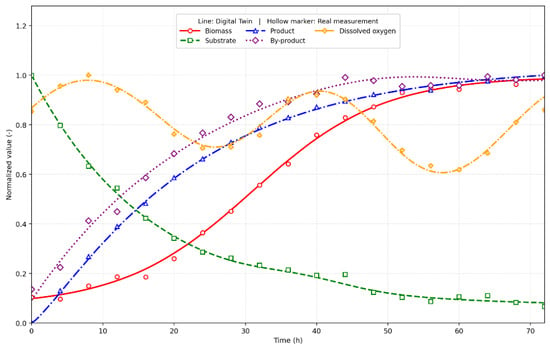
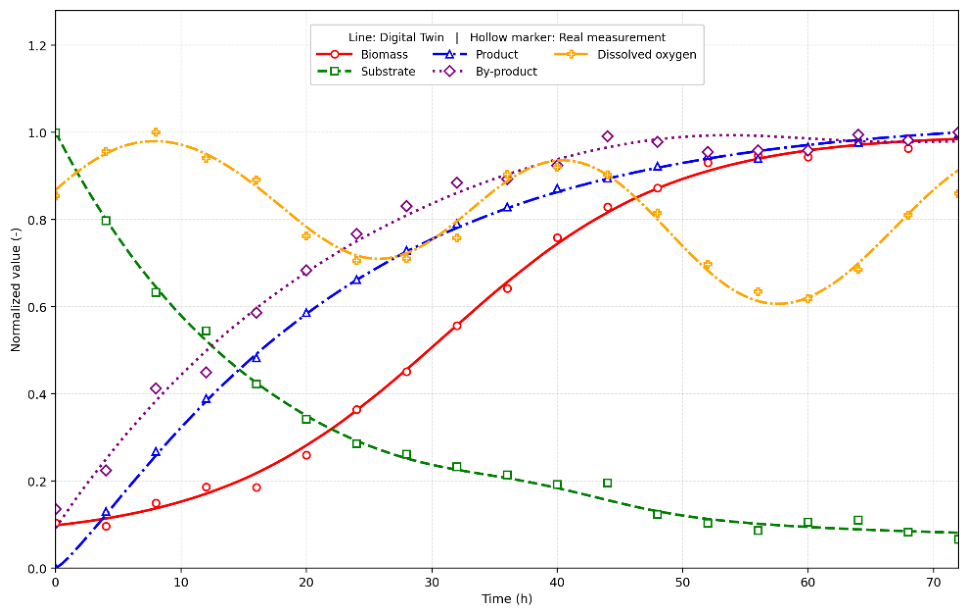
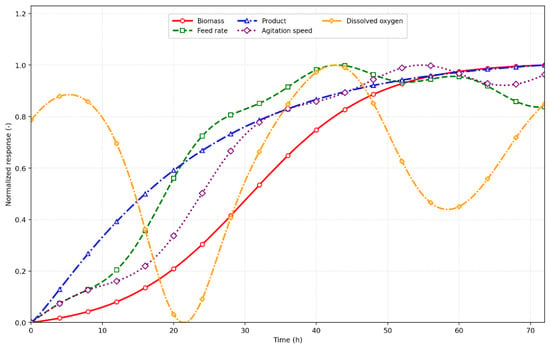
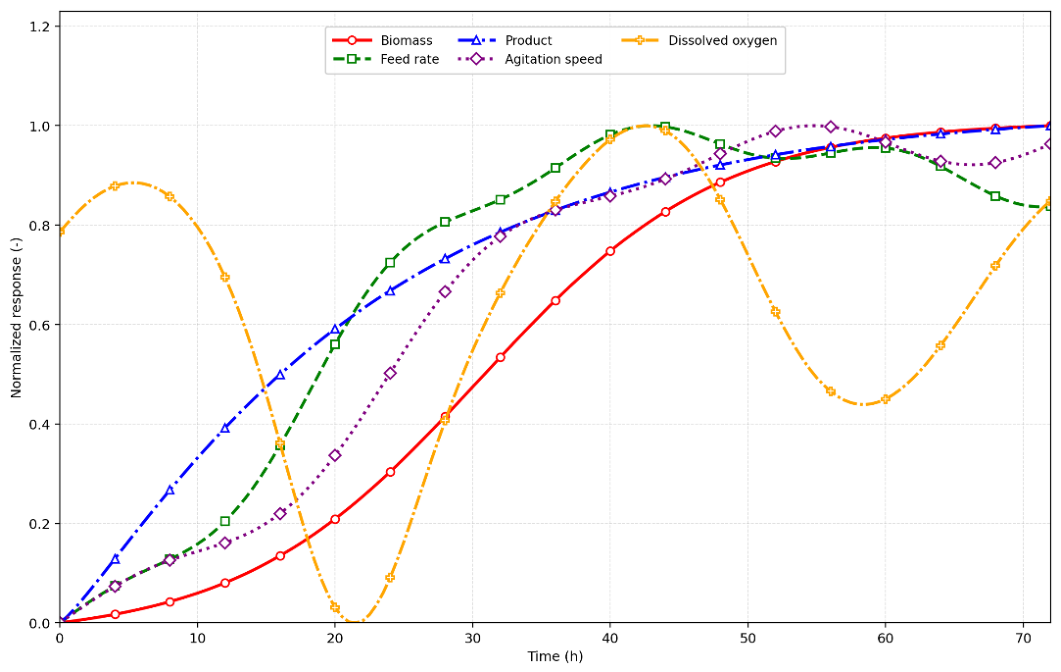
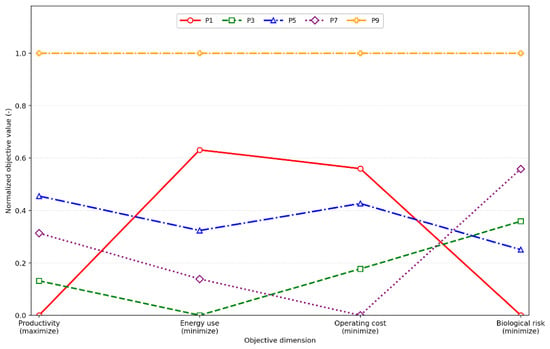
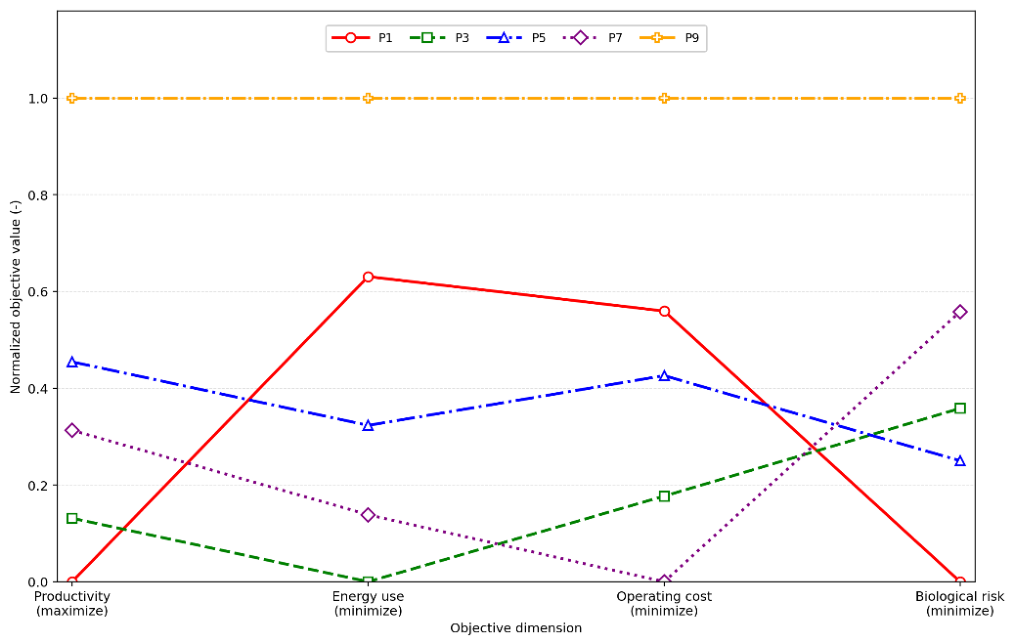
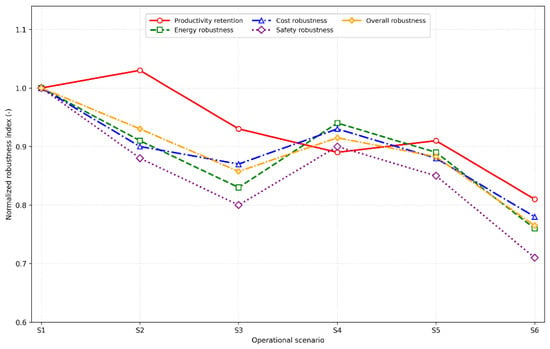
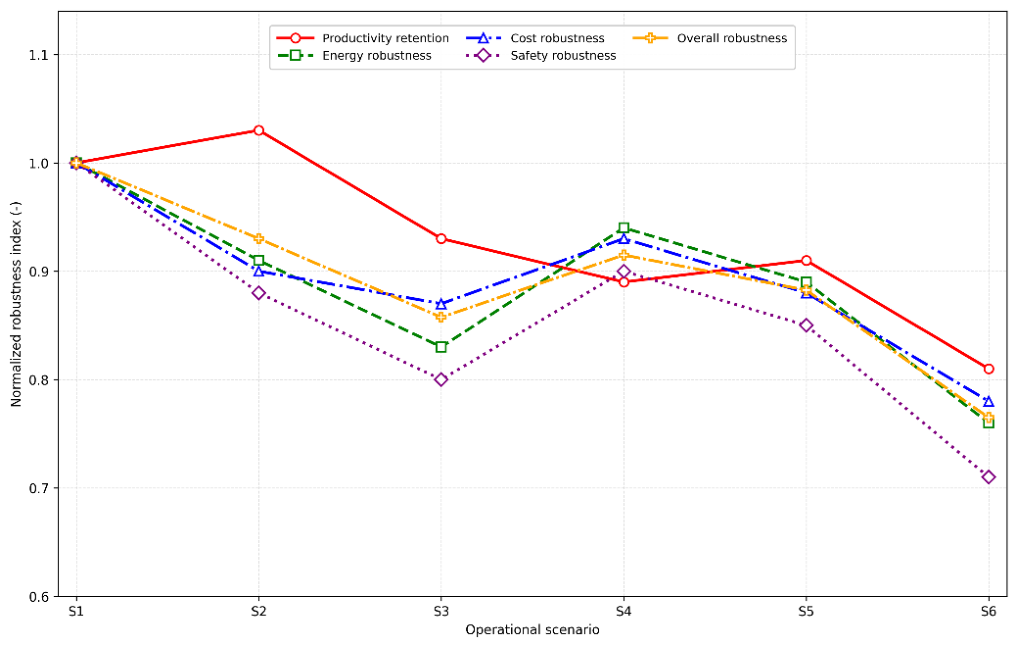
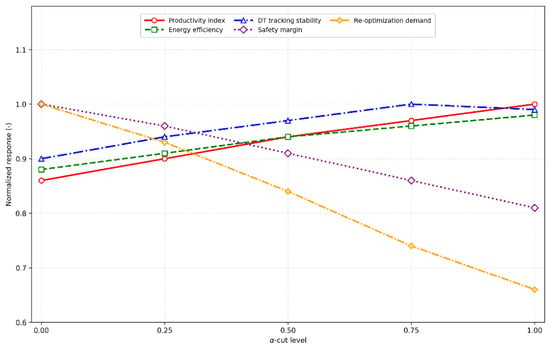
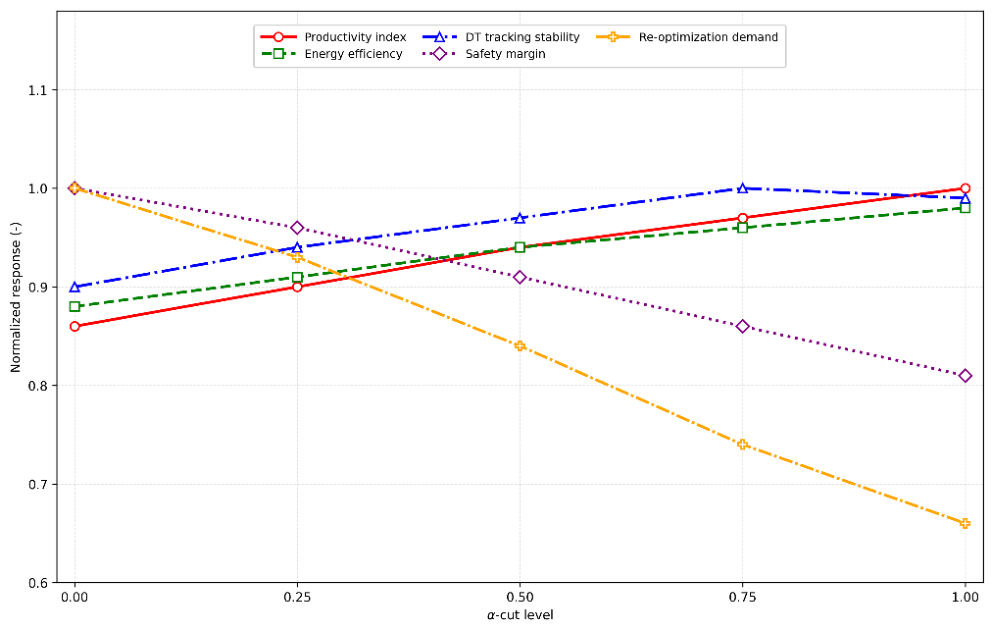
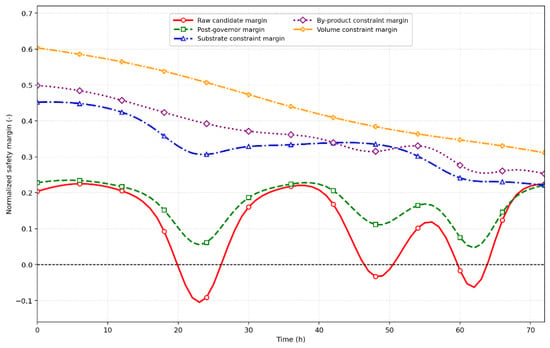
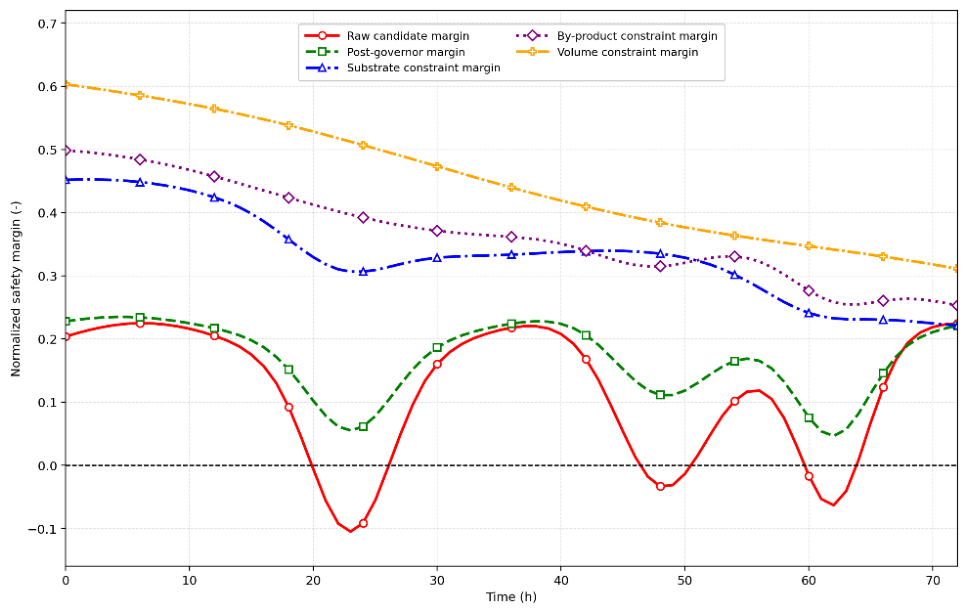
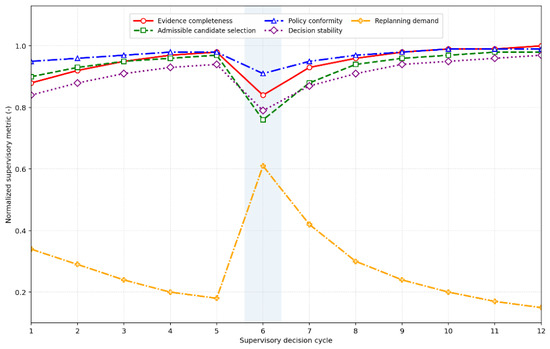
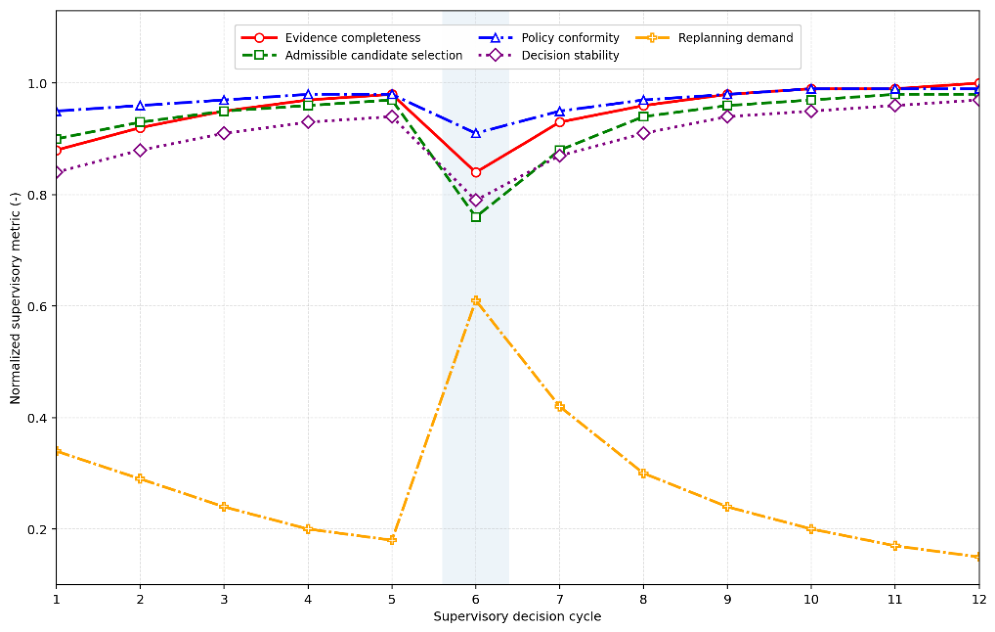
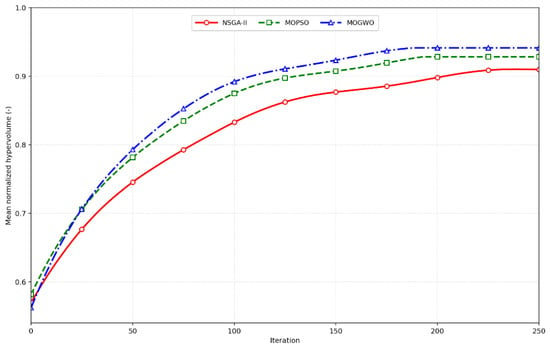
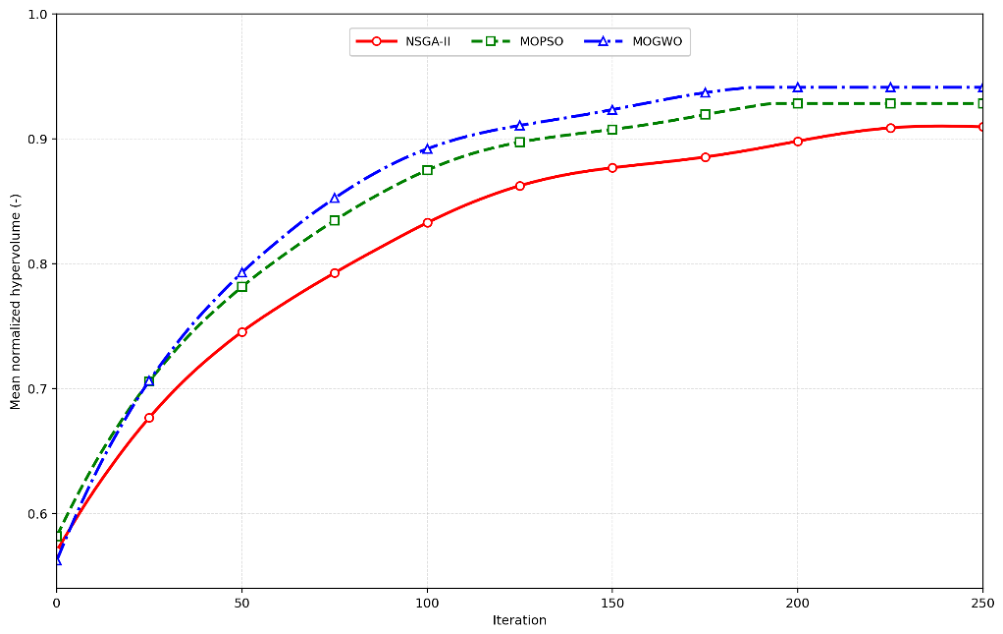

Disclaimer/Publisher’s Note: The statements, opinions and data contained in all publications are solely those of the individual author(s) and contributor(s) and not of MDPI and/or the editor(s). MDPI and/or the editor(s) disclaim responsibility for any injury to people or property resulting from any ideas, methods, instructions or products referred to in the content. |
© 2026 by the authors. Licensee MDPI, Basel, Switzerland. This article is an open access article distributed under the terms and conditions of the Creative Commons Attribution (CC BY) license.