


Abstract
Hot tearing limits the yield of Al–Zn–Mg billets produced by direct-chill casting. Its governing factors span composition, cooling conditions and the state of the partially solidified metal, and they interact; several quantities required by physics-based criteria cannot be measured during casting, and the factors are seldom observed together at plant scale. Machine learning was therefore used to establish, from variables that are recorded in production, which factors govern hot tearing when composition and process conditions vary simultaneously. Hot tearing was assessed in 108 pilot-scale billets covering several variants, and models were trained on alloy composition, casting parameters and calculated solidification characteristics. Evaluation used nested cross-validation with whole composition clusters held out, so that performance reflects unseen variants; the selected model attained a pooled out-of-fold average precision of 0.63 against a no-skill level of 0.51. Shapley additive explanations identified Si, Mn, Zn and steady-state casting speed as the dominant variables; the effect of Si depended on Fe content and that of Mg was non-monotonic. The contribution of Mn has not been documented systematically in this system. Attribution of the model yielded relations consistent with previously reported experimental findings, and these relations rest on variables obtainable in production, providing a basis for optimizing alloy design and casting processes.
1. Introduction
Al–Zn–Mg alloys offer an outstanding combination of high specific strength, fracture toughness, and weldability, and are widely used for structural components in aircraft [1] and in automotive applications [2]. Direct-chill (DC) casting is the dominant industrial process for producing large-diameter billets and rolling ingots of these alloys. In this process, molten metal is continuously solidified within a water-cooled mould as the partially solidified billet is withdrawn at a controlled speed; casting typically begins with a transient start-up period, during which casting speed and cooling conditions are gradually increased, before reaching a steady-state condition maintained for the remainder of the process. However, hot tearing—a solidification defect that occurs preferentially in these alloys during DC casting—remains a persistent challenge in industrial production [3]. Hot tearing reduces billet yield and may compromise the structural integrity of downstream products, representing a critical challenge in the production of high-quality billets.
Hot tearing is a form of solidification cracking that arises from insufficient liquid feeding in the mushy zone (the region where solid and liquid coexist during solidification) during the terminal stage of solidification [4]. As solidification proceeds, the network of dendrites—tree-like crystalline structures that form during cooling—becomes increasingly interconnected, progressively restricting the flow of the remaining liquid between them [5]. In the terminal stages of solidification, this flow becomes extremely restricted, and when liquid feeding becomes insufficient to compensate for solidification shrinkage and thermal contraction, cavities nucleate and coalesce along grain boundaries (the interfaces between adjacent solid crystals). These cavities act as stress concentrators, and when the resulting tensile stress exceeds the strength of the semi-solid material, cracks initiate and propagate, leading to hot tearing. The distribution of liquid films at grain boundaries and the timing of grain coalescence (the process by which adjacent solid grains merge into a continuous solid network) also play important roles in this process [6]. In Al–Zn–Mg alloys, the wide solidification range and pronounced solute segregation of Zn, Mg, and Cu stabilize low-melting-point eutectic films (thin liquid layers with a composition different from the surrounding solid) at grain boundaries and further weaken the semi-solid structure, resulting in higher hot-tearing susceptibility compared with most other commercial aluminum alloy systems [7,8].
The compositional dependence of hot-tearing susceptibility in the Al–Zn–Mg system does not follow the simple lambda-type relationship observed in Al–Cu and Al–Mg systems—a composition-susceptibility curve characterized by a single maximum at intermediate solute contents [4]—but instead exhibits more complex behaviour. Li et al. [7,8] conducted systematic investigation of grain-refined Al–xZn–2Mg–2Cu alloys and demonstrated a non-monotonic relationship between Zn content and hot-tearing susceptibility. Under grain-refined conditions, susceptibility reaches a maximum at approximately 9 wt% Zn, whereas under non-grain-refined conditions the maximum shifts to approximately 12 wt% Zn. This difference in the peak position is attributed to the interplay between thermal stress development and liquid feeding capability [7,8]. Mg addition was found to reduce susceptibility while Cu addition increased it; however, these tendencies are not intrinsic properties of the individual elements but depend on the interplay among thermal stress development, liquid feeding capability, and the amount of eutectic liquid remaining at the terminal stage of solidification [7,8], and the compositional dependence in Al–Zn–Mg alloys remains incompletely characterized [7]. The hot-tearing susceptibility ranking of commercial alloys—AA7022 exhibits the lowest susceptibility, followed in ascending order by AA7050, AA7085, and AA7055—is qualitatively consistent with these compositional trends [7,9], though the extent to which these relationships generalize across different alloy variants and casting conditions is not fully established [7]. For AA7075, no clear relationship was observed between Fe content and hot-tearing susceptibility, which has been attributed to the early formation of Fe-based intermetallic compounds during solidification and their consequently limited influence on the terminal stage at which hot tearing occurs [10], whereas higher Si contents were found to increase susceptibility through the formation of low-melting-point S(Al2CuMg) and Al7Cu2Fe phases [10].
With respect to process parameters, casting speed is widely recognized as the most critical factor governing hot-tearing susceptibility in DC casting, with higher speeds deepening the sump—the pool of molten metal that remains within the solidifying billet—and increasing tensile stresses and strains in the billet centre, as observed experimentally [11] and reproduced by numerical simulation [12]. The start-up stage, during which the sump depth evolves transiently before reaching a steady state, is particularly susceptible to hot tearing, and the ramping of casting speed during this period significantly influences cracking behaviour [13]. Melt temperature also affects the solidification field and thereby influences hot-tearing susceptibility [5], although the nature of this relationship in DC casting is not straightforward and quantitative data under industrial casting conditions remain limited [14]. Cooling water flow rate exerts a significant influence on the solidification field primarily during the start-up stage [15]; in the steady-state stage, its effect becomes negligible because heat transfer within the billet itself, rather than at its surface, dominates the overall cooling process [16]. A fundamental challenge is that the governing variables of hot tearing span alloy composition, sump geometry, residual stress, strain rate, mushy-zone permeability (the ease with which liquid can flow through the mushy zone), the amount of eutectic liquid, and local cooling conditions—quantities that are rarely measured simultaneously under plant-scale conditions in Al–Zn–Mg billet casting [4]. This breadth of governing variables is a fundamental reason why quantitative prediction remains difficult when composition and process conditions vary simultaneously [3].
Numerous criteria have been proposed to quantify hot-tearing susceptibility, ranging from models based on stress, strain, and strain rate to more advanced formulations that combine thermal, mechanical, and fracture-related factors [4,17]. As demonstrated by the systematic evaluation of Suyitno et al. [18], many of these criteria successfully predict compositional trends but fail to provide quantitative predictions of crack occurrence under actual operating conditions, and most do not adequately capture the effect of start-up ramping. Predictions of the effects of alloying elements such as Mg and Cu have also been shown to be inconsistent across criteria including Feurer, Clyne–Davies, Katgerman, and SKK [19], highlighting the difficulty of achieving broad applicability. Although the amount and distribution of eutectic liquid, porosity, grain structure, and the ability of the material to accommodate strain are known to strongly influence hot-tearing behaviour, microstructure-resolved prediction remains limited [20]. While multi-scale DC casting simulations of crack initiation and propagation have been attempted in other aluminum alloy systems, ranging from two-phase continuum formulations [21,22] to granular models that resolve individual grains [23,24], their integration and validation for hot tearing in Al–Zn–Mg alloys have not been demonstrated [25]. Furthermore, key input parameters—including mushy-zone permeability, semi-solid mechanical properties, and grain-boundary liquid coverage (the extent to which grain boundaries remain covered by liquid)—are difficult or impossible to measure directly in an industrial production environment [4], representing a persistent barrier to practical application.
Machine learning (ML) offers a data-driven alternative that does not require explicit parameterization of physical mechanisms. By learning directly from process data, ML models can capture complex interactions among alloy composition, casting parameters, and solidification characteristics that are difficult to represent analytically. Recent studies have demonstrated its potential in aluminum casting. Mechanical properties have been predicted from composition and process variables: Lan et al. [26] related the Fe/Mn ratio, Sr content, cooling rate and porosity to tensile strength and elongation, and Yang et al. [27] predicted the properties of die-cast parts from compositional descriptors and process parameters. Closest to the present problem, Guo et al. [28] addressed DC casting itself: they performed 102 finite-element simulations of a 7050 flat ingot and fitted a multiple linear regression relating pouring temperature, casting speed, primary cooling intensity and secondary cooling water flow rate to sump profile, grain structure and solidification kinetics. The alloy composition was held fixed and each casting parameter was varied in turn. Li et al. [3] explicitly advocated the construction of a comprehensive hot-tearing database and its analysis using ML as a future direction for the field.
However, a model that predicts well is not yet an explanation, and the step from prediction to metallurgical interpretation is the critical one in a study of this kind. Methods that show how much each input variable contributed to a prediction serve two purposes: knowledge can be drawn from the model, and the model itself can be examined, since a model whose contributions contradict established understanding is unlikely to be sound [29]. Such methods have been reviewed for materials science [30]. The importance values reported as standard by tree-ensemble models give one number per variable, and they depend on how many distinct values a variable takes, so that variables set to only a few levels are disadvantaged relative to those that vary almost continuously [31]. Nor do they show whether a variable raised or lowered the susceptibility of a particular sample. Local interpretable model-agnostic explanations (LIMEs) [32] provide a value for each sample, but the value is obtained by generating artificial cases around that sample. Shapley additive explanations (SHAPs) [33] also give a value for each sample, taken from the prediction itself rather than from artificial cases, and the values for all variables add up to that prediction. The direction of an effect, and whether it changes with the other variables, can therefore both be examined. SHAP has known limits. The contributions describe the model and not the casting process, so on their own they do not show cause and effect [34]. They depend on how variables that move together are treated, and the difference is largest when those variables are strongly correlated [35]. Explanations of this kind have been found to vary considerably between neighbouring inputs when the model is complex [36]. Variables are commonly ranked by the average size of their contributions, but the rules behind SHAP concern how a single prediction is divided among the variables, not how the variables should be ordered [37]. The order obtained can change when the model is trained on different data [38]. How these points are handled therefore decides whether the contributions can be read as metallurgy.
This study aims to identify the factors governing hot-tearing susceptibility in Al–Zn–Mg alloys under DC casting conditions, using variables available in industrial production, and to provide insights that contribute to the optimization of alloy design and casting processes. As outlined above, the compositional dependence of hot-tearing susceptibility in these alloys remains incompletely mapped [7]; existing criteria do not provide quantitative predictions of crack occurrence under industrial operating conditions [18] and give inconsistent predictions of compositional effects [19]; and no data-driven analysis has yet covered a broad compositional space together with a wide range of production-based process conditions for this system [28]. Three questions follow from this gap: (i) whether hot-tearing susceptibility can be predicted from variables available in industrial production when composition and process conditions vary together; (ii) which of these variables dominate, and in what manner they act; and (iii) what the resulting relations imply for alloy design and casting practice.
To address these questions, a dataset of 108 pilot-scale DC-cast billets spanning multiple commercial Al–Zn–Mg alloy variants is employed. All input variables—alloy compositions, casting process control settings, and solidification characteristics calculated using JMatPro (Sente Software Ltd., Guildford, UK)—are readily obtainable in an industrial production environment. Four ML algorithms are compared under a group-aware nested cross-validation scheme in which the groups are defined by unsupervised clustering of alloy compositions, which prevents optimistic bias arising from compositionally similar billets appearing in both training and test sets. One of these models is then interpreted using SHAP to identify the governing factors and the manner in which they act, the model being chosen with regard both to its predictive performance and to its capacity to represent non-linear effects and interactions among the input variables.
Section 2 sets out how the data were obtained—the casting trials, the variables recorded for each of the 108 billets and the solidification characteristics calculated from their compositions—and defines the modelling framework: the four algorithms, the group-aware nested cross-validation scheme in which whole composition clusters are withheld from training, the metrics and their no-skill baselines, and the attribution method. Section 3 reports what predictive value the models retain on compositions they have not seen, and which variables the selected model relies on. Section 4 examines these relations against experimental and thermodynamic evidence for this alloy system, and considers what they indicate for alloy design and for the choice of casting parameters. Because the relations are expressed in variables that are already recorded in production, they can inform the selection of compositions and casting conditions without additional measurement.
2. Materials and Methods
This section establishes the material on which the analysis rests: how the occurrence of cracking was determined for each billet, which variables were available to describe it, how those variables were turned into a predictive model and evaluated, and how the cracked material was examined to provide evidence independent of the model.
2.1. Experimental Procedure
Billets were produced by DC casting using commercially pure aluminum (99.7% Al) and alloying elements melted in a 100 kg electric resistance furnace at 810 °C. Alloy compositions were adjusted to target values based on optical emission spectrometry (OES; ARL iSpark 8860, Thermo Fisher Scientific, Waltham, MA, USA). The melt was then treated in a rotary-impeller degassing unit (Shizunami, Fukuoka Alumi Industry Co., Ltd., Fukuoka, Japan) by purging argon at 120 cm3/s for 1200 s, followed by dross removal and a settling period of 5400 s. The melt was subsequently held at 770 °C in the furnace prior to casting.
DC casting was performed on an in-house pilot-scale facility using a φ204-mm mould to produce billets of 500 mm in length, which is shorter than the several-metre billets produced in full-scale operation. Casting speed and cooling-water flow were each controlled using a ramping schedule consisting of three stages: an initial value maintained for a defined holding period, a linear ramp to the steady-state value, and a constant steady-state phase. An Al–5Ti–1B (wt%) grain-refiner rod (AA-H2252, AMG Aluminum, Wayne, PA, USA) was added to the melt in the furnace immediately before casting at a rate of 100 g per 100 kg of melt. This rate, corresponding to additions of 0.005 wt% Ti and 0.001 wt% B, was held constant for all billets and was controlled on a gram basis. Figure 1a shows the mould setup prior to casting and the casting process in progress.
Figure 1.
Photographs of (a) the mould setup and the DC casting process in progress, and (b) a representative internal crack.
After casting, each billet was inspected for hot tearing using an ultrasonic flaw detector (Krautkramer USM Go+, Waygate Technologies, Hürth, Germany) operated with a probe delay of 0.300 μs, a sound velocity of 5790 m/s, and a gain of 62.2 dB. Figure 1b shows a representative internal crack on a transverse section cut from the product portion of a cracked billet. Cracks detected within the first 250 mm from the start of casting were excluded from evaluation. In production practice for φ204-mm Al–Zn–Mg billets, this head portion is not counted as product, because the initial part of the cast contains a higher level of inclusions and the casting conditions have not yet stabilized. The target variable therefore corresponds to cracking in the portion of the billet that is delivered as product. A billet was classified as cracked only when cracking was detected beyond this length. In the cracked billets, the cracking detected beyond 250 mm was continuous with cracking originating within the start-up region, and no billet exhibited cracking confined to the first 250 mm; the exclusion criterion therefore did not alter the classification of any billet.
2.2. Dataset Construction
A dataset of 108 DC-cast billets was compiled for machine learning analysis. For each billet, three categories of input features were collected: alloy compositions, casting process parameters, and solidification properties. The binary outcome of the ultrasonic inspection—cracked (1) or sound (0)—served as the target variable. Of the 108 billets, 55 were classified as cracked and 53 as sound, resulting in an approximately balanced class distribution.
Alloy compositions were measured by OES and included nine elements commonly present in commercial Al–Zn–Mg alloys: Si, Fe, Cu, Mn, Mg, Cr, Zn, Ti, and Zr. The dataset covers a broad range of commercially relevant alloy variants, including AA7022, AA7050, AA7085, and AA7055.
Casting process parameters were obtained from the control settings of the DC casting equipment. For both casting speed and cooling-water flow, four parameters were recorded: the initial value, the holding time at the initial value, the steady-state value, and the ramping rate. Additional variables measured directly during casting included the melt temperature immediately upstream of the mould, the molten metal height in the mould, and the initial position of the starting block. This quantity, denoted MeltTemp, is distinct from the furnace holding temperature given in Section 2.1; the difference reflects heat loss during transfer from the furnace to the mould.
Solidification properties were calculated from the measured alloy compositions using JMatPro v15.1 (Sente Software Ltd., Guildford, UK) with the aluminum alloy database, under the Scheil–Gulliver model, which assumes complete mixing in the liquid and no diffusion in the solid. The liquidus temperature, solidus temperature, and freezing range—defined as the difference between the two—were obtained for each billet. These parameters reflect the extent of the mushy zone and the associated feeding and mechanical coherency conditions, which are known to govern hot-tearing susceptibility during DC casting. In total, 23 input features were used in the analysis. A summary of all input features, including their abbreviations and statistical distributions, is provided in Table 1.
Table 1.
Statistical summary of input features used in the ML analysis. Features are categorized into alloy compositions, casting parameters, and solidification properties. IQR denotes the interquartile range, calculated as the difference between the 75th and 25th percentiles.
2.3. Machine Learning Framework
The framework serves two purposes: to compare the algorithms without allowing compositionally similar billets to appear in both the training and the test sets, and to obtain from the resulting model a contribution of its predictions to individual variables.
2.3.1. Feature Screening
Prior to model construction, redundant variables were identified and removed using a two-step procedure. First, Pearson correlation coefficients () were computed for all input variables; pairs exhibiting were flagged as strongly collinear. For each such pair, the variable retained was chosen on the basis of its physical relevance to hot-tearing susceptibility rather than by a purely statistical criterion, and the redundant counterpart was removed. Variance inflation factors (VIFs) [39] were then computed for the reduced feature set as a final diagnostic to confirm that no severe residual multicollinearity remained. The VIF for feature is defined as:
where is the coefficient of determination obtained by regressing feature on all remaining features; higher VIF values indicate stronger multicollinearity, and a value above 10 is conventionally taken to indicate problematic collinearity. VIFs were used here as a confirmatory diagnostic rather than as a screening criterion: no variable was removed on the basis of its VIF, and the reported values serve to verify that the correlation-based removal described above left no severe residual multicollinearity.
2.3.2. Composition-Based Grouping
To prevent data leakage arising from compositionally similar alloys appearing in both training and test sets, the dataset was partitioned into composition-based groups prior to cross-validation. Hierarchical clustering [40] was applied to the alloy composition variables to construct these groups. In hierarchical clustering, samples are successively merged into clusters based on inter-sample distances until all samples belong to a single cluster. Ward’s linkage method [41] was adopted as the merging criterion, as it minimizes the increase in within-cluster variance at each merging step and tends to produce groups of comparable size.
The number of clusters was selected to maximize cluster separation while maintaining an acceptable balance in cluster sizes. Cluster separation was quantified using the silhouette score [42,43]. The silhouette value for sample is defined as:
where is the mean distance between sample and all other samples in the same cluster, and is the mean distance between sample and all samples in the nearest neighbouring cluster. The overall silhouette score is the mean of across all samples:
with values closer to 1 indicating better-defined clusters. Because the silhouette score alone tends to favour partitions with severe size imbalance, the cluster-size ratio—defined as the ratio of the largest to the smallest cluster size—was evaluated jointly. The number of clusters was chosen as the largest value that achieved a high silhouette score while keeping the cluster-size ratio within an acceptable range. All samples within the same cluster were subsequently assigned to the same fold in cross-validation.
2.3.3. Classification Models
Four supervised classification algorithms were evaluated: logistic regression [44], support vector machine (SVM) [45], random forest [46], and eXtreme Gradient Boosting (XGBoost) [47]. These models were selected to cover the major methodological families commonly used in engineering classification tasks: a linear model, a margin-based kernel method, and two ensemble tree-based algorithms. Logistic regression served as a linear baseline with directly interpretable coefficients. SVM was implemented with a radial basis function (RBF) kernel. Random forest and XGBoost were included as ensemble tree-based models capable of capturing nonlinear interactions among input features.
2.3.4. Cross-Validation and Hyperparameter Optimization
Model performance was evaluated using a nested group-aware cross-validation scheme, as illustrated in Figure 2. In the outer loop, k-fold cross-validation was applied with composition-based cluster labels used as group identifiers, such that all samples belonging to the same cluster were assigned to the same fold, ensuring that samples from the same composition cluster were never simultaneously included in the training and test sets. In each outer fold, one subset of clusters was held out as the test set while the remaining clusters formed the training set. The number of outer folds was determined by distributing the resulting composition-based clusters across folds so as to balance the number of samples in each test set.
Figure 2.
Schematic of the nested group-aware cross-validation scheme.
Hyperparameter optimization was performed within each outer fold using Bayesian optimization implemented via Optuna [48], with the tree-structured Parzen estimator as the sampler and a fixed random seed. The optimization was formulated as a maximization problem in which the decision variables were the hyperparameters of each model and the objective was the average precision (AP) [49,50] on the inner folds, averaged over those folds. The inner loop applied k-fold cross-validation exclusively to the outer training data, with the same group-based assignment maintained, preserving group-based separation during tuning. The number of inner folds was determined by the number of composition groups available in the outer training set, with the constraint that group-based separation was maintained in each inner fold. The hyperparameter search space for each model is summarized in Table 2.
Table 2.
Hyperparameter search spaces for each classification model.
Hyperparameter optimization was carried out independently within each outer fold, so five optimized configurations were obtained for each model. These were reduced to a single configuration by taking, for each hyperparameter separately, the median of its five optimized values. This avoids selecting one fold’s configuration arbitrarily and limits the influence of any individual fold. The resulting configuration was used to retrain each model on all 108 samples. This model, referred to below as the interpretation model, was used only for SHAP-based interpretation and never for performance evaluation, which rests entirely on the nested cross-validation described above.
2.3.5. Performance Metrics
Three metrics were used to evaluate classification performance. Let TP, FP, FN, and TN denote the numbers of true positives, false positives, false negatives, and true negatives, respectively. Precision (), recall (), and false positive rate (FPR) are defined as:
AP provides a threshold-independent assessment of the precision–recall trade-off, with particular sensitivity to the identification of the positive class. It is defined as the mean of the precision values attained at successive decision thresholds, each weighted by the gain in recall it produces:
where and denote the precision and recall at the -th threshold. AP served as the primary metric for model comparison.
The area under the receiver operating characteristic curve (ROC-AUC) [51] quantifies overall discriminative ability:
where denotes the true positive rate, which is equivalent to recall as defined in Equation (5).
The Brier score [52,53] assesses the calibration and overall probabilistic accuracy of predicted probabilities:
where is the predicted probability for sample , is the true binary label, and is the total number of samples. A lower Brier score indicates better calibration and overall probabilistic accuracy. Because the composition-based grouping produced outer folds with substantially different class distributions, the Brier score was interpreted relative to a fold-specific no-skill baseline. For each outer fold, this baseline was defined as the Brier score obtained by a constant predictor that outputs the cracking rate of the corresponding training set, representing the best prediction available in the absence of any information from the input features.
Performance was aggregated across the outer folds by pooling (Figure 2). The out-of-fold predictions of all 108 samples, each produced by the model trained without its own composition cluster, were collected into a single set on which each metric was computed once. The no-skill baselines were obtained on the same pooled set. For AP this baseline is the overall cracking rate, and for ROC-AUC it is 0.5. For the Brier score, the same constant predictor was applied to every sample, so that Equation (9) is evaluated with the model prediction replaced by , the cracking rate of the training set from which the prediction for sample was obtained:
A confidence interval (CI) was obtained by a nonparametric bootstrap: the 108 pooled out-of-fold predictions were resampled with replacement 5000 times, every metric was recomputed on each resample, and the interval reported is the 2.5th to 97.5th percentile range of the resulting distribution. Because a resample has its own class balance, the no-skill baselines were recomputed on each resample as well, and any difference reported below—of a metric from its baseline, or between two models—was formed within each resample and its interval taken from the distribution of those differences.
2.3.6. Model Interpretation
The model to be interpreted was selected on the basis of predictive performance. Where models could not be distinguished on that basis, preference was given to one able to represent non-monotonic effects and interactions among the input variables, both of which are reported for this alloy system [7,8,10]. SHAP [33] was applied to the interpretation model of the selected algorithm (Section 2.3.4). SHAP values quantify the contribution of each input feature to individual predictions relative to a baseline output. These values were computed for all 108 samples and aggregated to assess the relative importance of each feature across the dataset.
The stability of the feature ranking was examined by leave-one-cluster-out retraining. The interpretation model, defined in Section 2.3.4 as the model trained on all 108 samples, was refitted with one composition cluster removed, and SHAP values were computed for all 108 samples. Each cluster was removed in turn, so that the rankings obtained differ only through the composition of the training data.
Partial dependence plots (PDPs) were constructed from the interpretation model for pairs of compositional variables. The two features were varied over their range in the dataset in steps of 0.01 wt% while the remaining features were held at their dataset medians, and the predicted probability of hot tearing was computed on the resulting grid.
2.3.7. Software and Implementation
All analyses were performed in Python (v3.9.12). Pearson correlation coefficients and VIFs were computed using pandas (v1.4.3) and statsmodels (v0.14.4), respectively. Hierarchical clustering and silhouette scores were calculated using SciPy (v1.8.1) and scikit-learn (v1.1.1). Classification models were implemented using scikit-learn and XGBoost (v2.0.0), with hyperparameter optimization performed via Optuna (v4.0.0). SHAP values were computed using the shap package (v0.39.0). Figure 3, Figure 4, Figure 5c, Figure 6 and Figure 7 were produced with matplotlib (v3.9.2); Figure 5a,b were produced with the plotting functions of the shap package.
Figure 3.
Pearson correlation matrix for all input features prior to feature screening.
Figure 4.
Pooled out-of-fold performance of the four models: (a) average precision, (b) ROC-AUC, and (c) Brier score.
Figure 5.
SHAP analysis of the interpretation model (XGBoost): (a) feature importance, (b) beeswarm plot, and (c) rank stability.
Figure 6.
Partial dependence of the predicted hot-tearing probability on Si and Fe contents.
Figure 7.
Partial dependence of the predicted hot-tearing probability on Mg and Cu contents at 6 wt% Zn.
2.4. Microstructural Observations
Specimens were sectioned from regions containing visible hot tears, mounted in resin, and mechanically polished through 320 and 1000 grit SiC papers, followed by 6 μm and 3 μm diamond paste, and finished with a magnesium oxide suspension to a mirror-like surface. No etching was applied. Specimens were attached to the SEM stub using conductive tape prior to observation.
Microstructural observation and elemental analysis were performed using a scanning electron microscope (SEM; JSM-6010PLUS/LA, JEOL Ltd., Tokyo, Japan) equipped with an integrated energy-dispersive X-ray spectrometer (EDS) at an accelerating voltage of 15 kV. EDS analysis was used to identify the elemental composition at the fracture surface.
3. Results
The results are presented so that the basis of the analysis is established before its output is interpreted: which variables entered the models, how the validation groups were formed, what predictive value the models attained on compositions they had not seen, and which variables the selected model relies on.
3.1. Screened Input Features
The correlation matrix for all input features is shown in Figure 3, where colour intensity indicates the magnitude of the correlation coefficient, red and blue denote positive and negative correlations, and cells exceeding the screening threshold are outlined with thick borders; feature abbreviations follow Table 1. Three pairs of variables exhibited correlations exceeding : TempSol and FRange, InitWaterFlow and SteadyWaterFlow, and Mg and TempLiq. Within each pair, the variable more directly relevant to hot-tearing susceptibility was retained. FRange was retained as the physically most relevant solidification descriptor for hot-tearing susceptibility [4], and TempSol was removed; likewise, TempLiq was removed in favour of the compositional variable Mg. For the water-flow parameters, InitWaterFlow was retained and SteadyWaterFlow was removed, because the initial cooling condition is more directly relevant to hot tearing during the start-up stage of DC casting [15,16].
VIF values were then computed for the reduced feature set to confirm that no severe residual multicollinearity remained. Following the removal of TempSol, TempLiq, and SteadyWaterFlow, all remaining variables exhibited VIF values below 5, that is, well below the conventional threshold of 10. Consequently, 20 of the 23 input features were retained for model construction.
3.2. Composition-Based Clustering
The silhouette score and cluster-size ratio were evaluated for candidate cluster numbers ranging from two to ten; the results are summarized in Table 3. The silhouette score varied non-monotonically with the number of clusters: it decreased from 0.29 at two clusters to 0.24 at three clusters, then increased progressively to 0.33 at eight clusters and reached a maximum of 0.35 at nine clusters, before decreasing to 0.32 at ten clusters. However, the cluster-size ratio remained moderate up to eight clusters (6.86) but increased sharply to 24.0 at nine clusters, indicating a severely imbalanced partition in which the smallest cluster contained only two samples. Eight clusters were therefore selected, as this partition provided a high silhouette score while maintaining an acceptable size balance suitable for group-aware cross-validation; it also offered finer compositional resolution, more consistent with the diversity of alloy variants present in the dataset, than the coarser low-cluster solutions. Cluster sizes ranged from 7 to 48 samples. The mean composition of each alloying element across the eight clusters is summarized in Table 4, confirming distinct compositional differences among the clusters. The assignment of the eight clusters to the five outer cross-validation folds is summarized in Table 5. For hyperparameter optimization, the composition groups within each outer training set were further divided into three inner folds.
Table 3.
Silhouette scores and cluster-size ratios for candidate cluster numbers evaluated during hierarchical clustering of alloy compositions.
Table 4.
Mean composition (wt%) of each alloying element across the eight composition-based clusters.
Table 5.
Summary of outer cross-validation fold assignments, including cluster allocation, sample sizes, and class distributions for training and test sets.
3.3. Model Performance Comparison
The predictive performance of the four classification models is summarized in Figure 4. Higher values indicate better performance for AP and ROC-AUC, and lower values for the Brier score; the dashed line in each panel is the corresponding no-skill baseline. Evaluated on the pooled out-of-fold predictions of all 108 samples, XGBoost and logistic regression were the only models to exceed the no-skill level. XGBoost attained an AP of 0.63 and a ROC-AUC of 0.60, and logistic regression an AP of 0.67 and a ROC-AUC of 0.64; the excess of AP over the pooled no-skill baseline was 0.12 (95% CI 0.033 to 0.221) and 0.16 (95% CI 0.063 to 0.271), respectively. Random forest (AP 0.54, ROC-AUC 0.49) and SVM (AP 0.54, ROC-AUC 0.50) were not distinguishable from the no-skill level on either metric. Confidence intervals throughout this section are the bootstrap intervals defined in Section 2.3.5. The representative configuration of each model, obtained as the median of its fold-wise optimized values (Section 2.3.4), is listed in Table 6.
Table 6.
Representative hyperparameter configuration of each model, obtained as the median of its fold-wise optimized values (Section 2.3.4).
XGBoost and logistic regression could not be distinguished from each other: the paired difference in AP was −0.037 in favour of logistic regression, with a 95% CI of −0.148 to 0.070. The two models nevertheless answer different questions. Logistic regression was implemented without interaction or polynomial terms, so its log-odds are linear in every input; a non-monotonic effect of a single element, or a dependence of one element’s effect on the level of another, cannot be represented by such a model and would therefore not be recovered from it. Among the three models able to represent these effects, only XGBoost exceeded the no-skill level. XGBoost was therefore selected for subsequent interpretation and retrained on the full dataset for SHAP-based analysis of feature contributions.
The fold-wise performance of XGBoost is summarized in Table 7. Two features of the fold structure require comment. Outer fold 3 contained only 10 test samples, of which 2 were cracked; AP and ROC-AUC both reached unity on this fold, but with two positive samples, these values are unstable and carry little information about model quality. Performance was lowest on outer fold 1 (AP 0.60, ROC-AUC 0.55), for which the largest composition cluster (C3, 48 samples) was held out, and the training set was correspondingly the smallest. These two folds illustrate why the fold-wise values are not averaged: fold 3 contributes 2% of the positive–negative sample pairs on which AP and ROC-AUC are defined, and fold 1 contributes 74%, yet an unweighted average would give them equal weight. The fold-averaged AP of XGBoost, 0.84, is accordingly higher than the pooled value of 0.63, and the latter is used throughout as the primary estimate.
Table 7.
Fold-wise performance of the XGBoost model in the outer cross-validation loop, shown with the corresponding no-skill baselines. Prevalence denotes the test-set cracking rate, which is the no-skill baseline for AP; the no-skill Brier score is that obtained by a constant predictor set to the cracking rate of the corresponding training set.
The no-skill baseline for the Brier score, defined in Section 2.3.5, was 0.263 on the pooled predictions, consistent with the fold-wise values of 0.251 to 0.276 listed in Table 7. The Brier score of XGBoost, 0.249, was the lowest of the four models and 0.014 below this baseline, but the 95% CI of that difference (−0.007 to 0.036) includes zero; the improvement in calibration should therefore be regarded as modest. Random forest (0.279) and SVM (0.282) were above the baseline. Across the 108 pooled out-of-fold predictions, the smallest and largest probabilities returned by XGBoost were 0.18 and 0.68, against 0.02 and 0.98 for logistic regression. XGBoost therefore never assigns a sample a probability far from the overall cracking rate, which is consistent with a Brier score close to that of a constant predictor. The model output is accordingly interpreted throughout as a relative ranking of casting conditions rather than as an absolute probability of cracking.
3.4. Model Interpretation Using SHAP
Figure 5 presents the SHAP analysis of the interpretation model (XGBoost). Figure 5a ranks the input features by their mean absolute SHAP value, and Figure 5b shows the distribution and direction of the individual contributions, each point representing one sample and the colour indicating the value of that feature (red: high, blue: low).
SteadySpeed, Si, Mn, Zn, and MeltTemp showed the largest mean absolute SHAP values and collectively accounted for the dominant share of the model output. Cr, InitSpeed, Mg, Fe, InitWaterFlowHold, FRange, Cu, Zr, and InitWaterFlow exhibited clearly non-zero but smaller SHAP values. The remaining features—InitSpeedHold, BlockPos, WaterRampRate, Ti, SpeedRampRate, and MoltenLevel—were associated with relatively small SHAP values.
Figure 5c shows how this ranking responds to the removal of each composition cluster from the training data of the interpretation model. Individual features shift by several places, and some cross into an adjacent group. No feature crosses more than one group: none of the first group falls into the last, and none of the last rises into the first. Within each group, the order of the features varies.
4. Discussion
This section examines how far the contributions can be understood in metallurgical terms. Each is compared with experimental findings reported for the Al–Zn–Mg system and with the solidification behaviour of the alloy, which shows the extent to which the model agrees with established observations, and the relations so obtained are used to indicate directions for alloy design and process optimization. Because the contributions describe the model rather than the casting process [34], each is treated here as a hypothesis to be checked against independent evidence—reported experiments, thermodynamic calculation and fractography—rather than as a causal statement.
4.1. Alloying Effects on Hot-Tearing Susceptibility
The SHAP analysis of the interpretation model, shown in Figure 5, identified heterogeneous influences of alloying elements on hot-tearing susceptibility, differing in both magnitude and directional tendency. Increases in Si, Mn, Zn, Cr, and Mg were associated with higher hot-tearing susceptibility, while Fe tended to reduce hot-tearing risk. Cu and Zr did not show clear monotonic trends in the global analysis. Each of these tendencies is examined below against experimental findings reported for this alloy system.
4.1.1. Si and Fe
The SHAP analysis identified Si as one of the strongest positive contributors to hot-tearing susceptibility, while Fe showed an overall tendency toward reduced risk at higher contents. The positive contribution of Si is consistent with prior experimental studies on AA7075, in which higher Si contents promote the formation of Al7Cu2Fe, a low-melting Fe-containing phase that stabilizes liquid films at grain boundaries together with S(Al2CuMg), impeding interdendritic feeding [10]. In the absence of Fe, by contrast, Si has been shown to reduce hot-tearing susceptibility by promoting grain coalescence and earlier grain bridging, as Al7Cu2Fe is not formed under these conditions [3].
Figure 6 shows a PDP in which the predicted hot-tearing probability is mapped as a function of Si and Fe contents. Hot-tearing risk changes sharply at a Si content of approximately 0.15 wt%, remaining low across the investigated Fe range at Si contents below this threshold. Within this low-Si region, higher Fe contents are associated with lower risk, with the lowest hot-tearing probability observed at high Fe and low Si. At high Si contents, the highest hot-tearing probability is observed under high-Fe conditions, which may be attributable to the promotion of Al7Cu2Fe formation. Under low-Fe conditions at high Si contents, the risk remains elevated but is lower than at high Fe, which may reflect the suppression of Al7Cu2Fe formation under these conditions.
The global SHAP finding of an overall negative association between Fe content and hot-tearing risk should therefore be interpreted in the context of the PDP results. The PDP indicates that the effect of Fe on hot-tearing susceptibility is not monotonic but depends on Si content: at high Si contents, higher Fe is associated with increased risk, whereas at low Si contents, higher Fe is associated with reduced risk. The overall negative association of Fe observed in the global SHAP analysis is thus likely to reflect the predominantly low-Si composition space of the present dataset, as shown in Table 1, rather than an intrinsic beneficial effect of Fe independent of Si content. The Si-dependent nature of the Fe effect identified here warrants further experimental investigation across a wider range of Si and Fe contents.
4.1.2. Zn
The SHAP analysis showed a monotonic increase in hot-tearing susceptibility with increasing Zn content within the investigated composition range. Previous studies on Al–xZn–2Mg–2Cu alloys have demonstrated that hot-tearing susceptibility exhibits a non-linear relationship with Zn content, reaching a maximum at approximately 9 wt% Zn [7,8]. Since the Zn content in the present dataset is predominantly at or below this critical value, as shown in Table 1 (median: 6.66 wt%, maximum: 9.22 wt%), the monotonic increase observed in the SHAP analysis corresponds to the ascending branch of this relationship and is consistent with prior experimental findings.
4.1.3. Mg and Cu
Previous experimental studies on Al–Zn–Mg–Cu alloys have reported that increasing Mg content reduces hot-tearing susceptibility, while increasing Cu content increases susceptibility [7,8]. The global SHAP analysis, however, does not directly reflect these tendencies: Mg showed an overall positive contribution to hot-tearing susceptibility, and Cu exhibited no clear monotonic trend.
In the Al–Zn–Mg–Cu system, Zn, Mg, and Cu are the principal constituents of the terminal eutectic liquid and collectively govern liquid feeding capability during the terminal stage of solidification [7,8]. To examine the individual effects of Mg and Cu, a PDP was constructed in which the predicted hot-tearing probability is mapped as a function of Mg and Cu contents at a fixed Zn content of 6 wt%, close to the median of the dataset (6.66 wt%, Table 1), as shown in Figure 7.
At Zn = 6 wt%, Cu showed a broadly monotonic positive contribution, consistent with prior experimental observations [7,8]. Mg exhibited a non-linear relationship: hot-tearing probability increased up to approximately 2 wt% and decreased at higher contents.
This non-monotonic dependence accounts for the apparent inconsistency in the global SHAP analysis. The median Mg content of the dataset is 1.64 wt%, and only two of the eight composition clusters have a mean Mg content above 2 wt% (Table 1 and Table 4), so most of the billets lie on the ascending branch of the relationship, where increasing Mg raises the predicted susceptibility. The reduction in susceptibility reported previously [7,8] was obtained for Al–xZn–2Mg–2Cu alloys, that is, on the descending branch. The positive global SHAP contribution of Mg and the negative effect reported experimentally are therefore not in conflict, but correspond to different regions of the same non-monotonic relationship—the same reasoning applied to Zn in Section 4.1.2. For Cu, the median content is 0.28 wt% with an interquartile range of 0.35 wt% (Table 1), and only three clusters have a mean Cu content above 1 wt% (Table 4); the limited variation across most of the dataset accounts for the weak and unstructured global SHAP contribution of Cu, despite the monotonic positive effect indicated by the PDP.
4.1.4. Mn, Cr, and Zr
The SHAP analysis identified Mn and Cr as important contributors to hot-tearing susceptibility, with Mn in particular exhibiting a strong positive contribution. In Al–Mg–Si alloys, Sweet et al. reported that hot-tearing susceptibility increases with Mn content above approximately 0.04 wt% and attributed this to changes in the fraction of α- and β-AlFeSi phases that alter grain bridging and intergranular liquid flow [54]. Systematic investigations of Mn and Cr in Al–Zn–Mg alloys, however, are scarce. More generally, prior studies in other aluminum alloy systems have suggested that intermetallic compounds forming at the early stages of solidification may promote solid bridging between dendrites, accelerate the development of a rigid solid network, and impede interdendritic liquid feeding, thereby increasing hot-tearing risk [55,56].
Figure 8 presents phase fraction diagrams calculated using JMatPro under the conditions described in Section 2.2 for a representative alloy composition in the present dataset, showing the effect of Mn content at 0.00, 0.22, and 0.50 wt% (Figure 8a–c), as well as the effect of Cr addition at 0.20 wt% (Figure 8d). The representative composition used in Figure 8a–c was Al–0.05Si–0.15Fe–0.24Cu–0.02Ti–1.64Mg–6.66Zn–0.19Zr (wt%); the Cr-containing composition in Figure 8d was Al–0.05Si–0.15Fe–0.24Cu–0.02Ti–0.22Mn–1.64Mg–0.20Cr–6.66Zn–0.19Zr (wt%). Al6Mn is shown to form at an early stage of solidification, with its phase fraction increasing with Mn content. Similarly, Al7Cr is shown to form under analogous conditions in Cr-containing compositions. Figure 9 shows SEM and EDS analyses of a cracked billet of a representative Mn-containing alloy in the dataset (Al–0.05Si–0.15Fe–0.24Cu–0.02Ti–0.22Mn–1.64Mg–6.66Zn–0.19Zr, wt%), in which Mn-rich regions are identified on the fracture surface. The presence of Mn-rich phases on the fracture surface suggests that Al6Mn was involved in the hot-tearing process. These observations, together with the positive contribution of Mn and Cr to hot-tearing susceptibility identified by the SHAP analysis, suggest that early-forming Mn- and Cr-containing intermetallic compounds may contribute to hot-tearing susceptibility through mechanisms analogous to those reported in other aluminum alloy systems [55,56].
Figure 8.
Calculated phase fraction diagrams at (a) 0.00, (b) 0.22 and (c) 0.50 wt% Mn, and (d) 0.20 wt% Cr.
Figure 9.
SEM image and EDS analysis of the fracture surface of a cracked billet.
The effect of Mn and Cr in Al–Zn–Mg alloys cannot, however, be apportioned between these mechanisms on the present data. Those data show that Mn- and Cr-bearing phases form early in solidification and are present on the fracture surfaces of cracked billets, but they do not resolve whether the increase in susceptibility arises principally from impeded interdendritic feeding or from the earlier development of a rigid solid network; the two are in any case coupled, since earlier bridging itself restricts liquid flow. Measurements in the semi-solid state would be required to separate them.
The SHAP analysis also suggests a non-monotonic relationship between Zr content and hot-tearing susceptibility. However, the variation in Zr content within the present dataset is limited, and a definitive interpretation of its physical role is not possible from the available data.
Overall, the SHAP-based interpretation of alloying effects is largely consistent with established metallurgical knowledge, supporting the physical validity of the trained model. Beyond this validation, the analysis suggests one finding that may extend beyond prior experimental knowledge—the possible roles of Mn and Cr as contributors to hot-tearing susceptibility in Al–Zn–Mg alloys—and provides a consistent explanation, based on the non-monotonic dependence on Mg content, for the apparent discrepancy between the present data-driven results and previously reported compositional effects.
4.2. Effects of Process and Solidification Parameters
In addition to alloy composition, the SHAP analysis identified several process and solidification parameters as influential contributors to hot-tearing susceptibility. Their effects are interpreted below in terms of sump geometry, mushy-zone development, and feeding conditions during DC casting.
4.2.1. Casting Speed
The SHAP analysis showed that steady-state casting speed exhibited the highest importance among all process parameters, with hot-tearing risk increasing monotonically with speed. Higher casting speeds deepen the sump and expand the mushy zone, reducing the effectiveness of interdendritic feeding during the terminal stage of solidification [11,12]. This monotonic relationship is consistent with the established understanding of DC casting behaviour.
Initial casting speed also showed a positive relationship with hot-tearing susceptibility in the SHAP analysis. Although the first 250 mm was excluded from evaluation, the cracks detected in the evaluated region were continuous with cracking that originated during the start-up stage (Section 2.1), so the start-up parameters directly influence the classified outcome. A higher initial casting speed affects the transient evolution of the sump and solid shell during the start-up stage. Due to thermal inertia, the solidification field does not respond instantaneously to changes in casting speed, and transient conditions unfavourable for feeding may persist into later stages [13]. The importance of both steady-state and initial casting speeds is consistent with hot-tearing susceptibility being influenced by a combination of quasi-steady and transient solidification conditions, highlighting the relevance of the full casting schedule rather than steady-state operating conditions alone.
4.2.2. Melt Temperature
The SHAP analysis showed that melt temperature had a monotonic positive relationship with hot-tearing susceptibility, with higher melt temperatures associated with increased risk. This trend is consistent both with the behaviour reported for shape casting—where a higher superheat promotes coarser grains and columnar structures and thereby increases hot-tearing susceptibility [4,5]—and with the common industrial practice of lowering the melt temperature to mitigate hot tearing. Direct data on the effect of melt temperature in DC casting are, however, scarce [3]: Eskin et al. reported a lower hot-tearing susceptibility at higher melt temperature for Al–2.8 wt% Cu billets over a furnace-temperature range of 700–760 °C, which they attributed to a larger amount of eutectic liquid, improved interdendritic feeding, and pre-shrinkage expansion associated with gas evolution [14]. The positive contribution identified in the present study—obtained over a melt-temperature range of 686–733 °C measured upstream of the mould, across multiple Al–Zn–Mg variants—is consistent with conventional practice but differs from that single-alloy DC result. It should be noted that the values reported by Eskin et al. refer to the furnace, whereas MeltTemp in the present study was measured immediately upstream of the mould, so the two temperature ranges are not directly comparable in absolute terms.
4.2.3. Holding Time at Initial Cooling Water Flow
The SHAP analysis showed that the holding time at the initial cooling water flow exhibited an inverse relationship with hot-tearing susceptibility, with longer holding times being associated with reduced risk. The initial water flow is lower than the steady-state value, so this variable determines how long the reduced cooling intensity of the start-up practice is maintained before the flow is ramped up. Cooling intensity is deliberately reduced during start-up in order to limit the thermal gradients and the contraction they drive [5], and since hot tearing is governed by the strain rate imposed on the semi-solid material [4,17], a longer hold delays the increase in heat extraction until the start-up region, where the cracks evaluated here are located, has passed. This result underscores the importance of the early-stage thermal history in determining hot-tearing susceptibility and suggests that the timing of the start-up cooling schedule may be a useful—though limited—lever for mitigating hot-tearing risk, consistent with reports that the influence of the water flow rate is confined mainly to the start-up stage and is otherwise small [15,16].
4.2.4. Freezing Range
The SHAP analysis showed a non-monotonic relationship between freezing range and hot-tearing susceptibility. In general, a wider freezing range prolongs the vulnerable semi-solid interval and increases the amount of linear solidification contraction, both of which tend to increase hot-tearing risk [4]. At the same time, a wider freezing range is generally associated with a larger amount of terminal eutectic liquid, which may enhance interdendritic feeding capability and thereby reduce hot-tearing susceptibility. The non-monotonic relationship observed in the SHAP analysis may reflect the competing influences of these two opposing effects. However, since the freezing range is calculated from alloy composition, its apparent effect may partly reflect compositional interactions rather than an independent influence of the solidification interval itself, and a definitive interpretation requires further investigation.
Overall, the identified process and solidification parameters collectively indicate that hot-tearing susceptibility in DC casting is governed by an interplay between steady-state operating conditions, transient start-up behaviour, and intrinsic solidification characteristics. Notably, the influence of start-up-related parameters—initial casting speed and holding time at initial cooling water flow—highlights the importance of the transient casting stage, which is often difficult to address using conventional steady-state criteria.
4.3. Implications for Process Optimization and Industrial Application
The present analysis demonstrates that hot-tearing susceptibility in Al–Zn–Mg alloys under DC casting conditions is governed by the simultaneous influence of multiple compositional and process variables. No single variable dominates; rather, the effects of individual elements and process parameters are modulated by their interactions, as illustrated by the Si-dependent reversal of the Fe effect. This multivariate character is consistent with the difficulty that physics-based criteria, which typically rely on a limited number of physical quantities [4], have had in achieving broad applicability across different alloy compositions [19] and casting conditions [18].
From a practical standpoint, all input variables used in the present analysis—alloy compositions, casting process parameters, and solidification characteristics—are readily obtainable in an industrial production environment, without requiring measurements of parameters such as mushy-zone permeability or semi-solid mechanical properties that are unavailable in production settings [4]. The identification of initial casting speed and holding time at initial cooling water flow as influential factors further suggests that the transient start-up stage warrants attention in process optimization.
These results indicate where the greatest scope for reducing hot-tearing risk lies. At the alloy design stage, Si and Mn are the most influential compositional variables identified, and both act to increase susceptibility, so keeping them towards the low end of the specification range offers the largest scope, subject to the constraints imposed by the required mechanical properties. Among the process variables, steady-state casting speed is the most influential, and a longer holding time at the initial cooling water flow acts in the opposite direction. As a concrete example, an alloy specified towards the upper end of the Zn range, where susceptibility is elevated (Section 4.1.2), would be expected to require a lower steady-state casting speed and a longer holding time at initial cooling water flow than an alloy at the lower end of the range in order to maintain a comparable level of risk. Because the predicted probabilities are not calibrated in absolute terms, such guidance should be applied as a relative ranking of candidate conditions rather than as a quantitative prediction of cracking probability.
4.4. Limitations and Future Work
Several limitations of the present study should be acknowledged. The first is the limited size of the dataset: 20 features were retained for 108 samples, a low sample-to-feature ratio. At this scale the analysis identifies which variables the model relies on and the general form of their effect, which can inform the design of the casting process, but it does not yield calibrated probabilities (Figure 4c) or a reliable order among the most influential variables (Figure 5c). Because compositionally similar billets are not divided between the training and test sets, the test sets contain between 10 and 48 samples (Table 5), which accounts for the spread in performance between folds (Table 7). These limitations would not be removed simply by casting more billets of the alloys already in the dataset: a denser coverage of the composition space is needed, obtained by casting deliberately at compositions between the existing alloys.
The lack of calibration determines how the model can be used at present. On-line risk assessment at the plant is a longer-term goal, and the model is not yet suitable for it. Calibration alone would not change this, because it does not improve the separation between cracked and sound billets. Once the coverage described above is available, the predicted probabilities could be calibrated and the result verified on billets held out from training.
The present dataset cannot distinguish crack initiation from propagation. In every cracked billet, the cracking observed beyond the first 250 mm was continuous with cracking that originated within the start-up region (Section 2.1). The outcome is nevertheless a single binary observation and carries no information about the stage at which the responsible conditions acted, so it cannot be established whether the start-up process conditions influence initiation, propagation, or both. Because a crack cannot propagate without first initiating, suppressing initiation during start-up remains an effective route to a sound billet irrespective of this ambiguity. Distinguishing the two stages would require fractographic examination, since hot tearing and solid-state fracture produce distinct fracture-surface morphologies.
Grain size was not measured. The grain-refiner addition was held constant (Section 2.1), but as-cast grain size is expected to vary with alloy composition and cooling conditions, so variation between billets cannot be excluded, and grain refinement alters the relationship between composition and hot-tearing susceptibility in Al–Zn–Mg alloys [9]. The dataset likewise does not include time-resolved thermal histories, spatial variations within the billet, or stress–strain information [4,5]. Measuring these quantities, and integrating the present data-driven approach with physics-based simulations such as coupled thermo-mechanical finite-element models, are left to future work.
5. Conclusions
Hot tearing was examined in 108 pilot-scale Al–Zn–Mg billets in which composition and casting conditions varied together, using only variables recorded in production. Four algorithms were compared under group-aware nested cross-validation with composition clusters as groups, and XGBoost was interpreted using SHAP. The following conclusions are drawn.
- On composition clusters withheld from training, XGBoost attained a pooled out-of-fold average precision of 0.63 against a no-skill value of 0.51, showing that the variables recorded in production carry information on the occurrence of hot tearing.
- Si, Mn and Zn contributed most strongly among the compositional variables. The effect of Si depended on Fe content, with the highest susceptibility occurring at high Si together with high Fe.
- Early formation of Al6Mn and Al7Cr was indicated by thermodynamic calculations, and Mn-rich phases were identified on the fracture surfaces of cracked billets, suggesting that these intermetallic compounds contribute to hot-tearing susceptibility.
- The effect of Mg was non-monotonic, with a maximum at approximately 2 wt%. Because most billets in the dataset contained less than this amount, the positive Mg contribution identified by SHAP is consistent with, rather than contrary to, previously reported experimental trends.
- Steady-state casting speed was identified as the most influential process parameter, showing a monotonic positive relationship with hot-tearing susceptibility. Initial casting speed, melt temperature, and holding time at initial cooling water flow were also influential, indicating that both steady-state and transient start-up conditions govern hot-tearing susceptibility.
These relations rest on variables already available in production and agree with reported experimental findings. Because composition and process conditions act together, an alloy specified towards the high-susceptibility end of its range calls for more conservative casting conditions. The dataset comprises one record per billet from a single pilot-scale facility; larger datasets, across plants and alloy systems, are required for further progress.
Author Contributions
Conceptualization, Y.H. and K.S.; methodology, Y.H.; software, Y.H. and M.O.; validation, Y.H., K.S. and M.O.; formal analysis, Y.H.; investigation, Y.H. and M.O.; resources, Y.H. and M.O.; data curation, Y.H. and M.O.; writing—original draft preparation, Y.H.; writing—review and editing, K.S.; visualization, Y.H.; supervision, K.S. and G.S.; project administration, K.S. and G.S. All authors have read and agreed to the published version of the manuscript.
Funding
This research received no external funding.
Data Availability Statement
The data presented in this study are available on request from the corresponding author. The data are not publicly available due to confidentiality restrictions associated with the casting data used in this study.
Acknowledgments
The authors gratefully acknowledge Sankyo Tateyama, Inc. (Imizu, Toyama, Japan) for providing the casting data used in this study.
Conflicts of Interest
Y.H. and M.O. are employed by Sankyo Tateyama, Inc., which provided the casting data used in this study. The company had no role in the design of the study, in the analyses or interpretation of the data, or in the decision to publish the results. The remaining authors declare no conflicts of interest.
Abbreviations
The following abbreviations are used in this manuscript:
| DC | Direct-Chill |
| ML | Machine Learning |
| LIME | Local Interpretable Model-agnostic Explanations |
| SHAP | Shapley Additive Explanations |
| OES | Optical Emission Spectrometry |
| IQR | Interquartile Range |
| VIF | Variance Inflation Factor |
| SVM | Support Vector Machine |
| XGBoost | eXtreme Gradient Boosting |
| RBF | Radial Basis Function |
| TP | True Positive |
| FP | False Positive |
| FN | False Negative |
| TN | True Negative |
| AP | Average Precision |
| ROC-AUC | Area Under the Receiver Operating Characteristic Curve |
| TPR | True Positive Rate |
| FPR | False Positive Rate |
| CI | Confidence Interval |
| SEM | Scanning Electron Microscopy |
| EDS | Energy-Dispersive X-ray Spectroscopy |
| PDP | Partial Dependence Plot |
References
- Dursun, T.; Soutis, C. Recent Developments in Advanced Aircraft Aluminium Alloys. Mater. Des. 2014, 56, 862–871. [Google Scholar] [CrossRef] [Scilit]
- Hirsch, J. Recent Development in Aluminium for Automotive Applications. Trans. Nonferrous Met. Soc. China 2014, 24, 1995–2002. [Google Scholar] [CrossRef] [Scilit]
- Li, Y.; Li, H.; Katgerman, L.; Du, Q.; Zhang, J.; Zhuang, L. Recent Advances in Hot Tearing during Casting of Aluminium Alloys. Prog. Mater. Sci. 2021, 117, 100741. [Google Scholar] [CrossRef] [Scilit]
- Eskin, D.G.; Suyitno; Katgerman, L. Mechanical Properties in the Semi-Solid State and Hot Tearing of Aluminium Alloys. Prog. Mater. Sci. 2004, 49, 629–711. [Google Scholar] [CrossRef] [Scilit]
- Eskin, D.G. Physical Metallurgy of Direct Chill Casting of Aluminum Alloys; CRC Press: Boca Raton, FL, USA, 2008; ISBN 978-1-4200-6281-6. [Google Scholar]
- Jarry, P.; Rappaz, M. Recent Advances in the Metallurgy of Aluminium Alloys. Part I: Solidification and Casting. Comptes Rendus Phys. 2018, 19, 672–687. [Google Scholar] [CrossRef] [Scilit]
- Li, Y.; Zhang, Z.R.; Zhao, Z.Y.; Li, H.X.; Katgerman, L.; Zhang, J.S.; Zhuang, L.Z. Effect of Main Elements (Zn, Mg, and Cu) on Hot Tearing Susceptibility During Direct-Chill Casting of 7xxx Aluminum Alloys. Met. Mater. Trans. A 2019, 50, 3603–3616. [Google Scholar] [CrossRef] [Scilit]
- Li, Y.; Gao, X.; Zhang, Z.R.; Xiao, W.L.; Li, H.X.; Du, Q.; Katgerman, L.; Zhang, J.S.; Zhuang, L.Z. Experimental and Theoretical Studies of the Hot Tearing Behavior of Al-xZn-2Mg-2Cu Alloys. Metall. Mater. Trans. A 2017, 48, 4744–4754. [Google Scholar] [CrossRef] [Scilit]
- Bai, Q.L.; Li, Y.; Li, H.X.; Du, Q.; Zhang, J.S.; Zhuang, L.Z. Roles of Alloy Composition and Grain Refinement on Hot Tearing Susceptibility of 7××× Aluminum Alloys. Metall. Mater. Trans. A 2016, 47, 4080–4091. [Google Scholar] [CrossRef] [Scilit]
- Ellingsen, K.; Du, Q.; M’Hamdi, M.; Gihleengen, B.E.; Ledal, R.; Tveito, K.O.; Håkonsen, A. Experimental Study and Numerical Analysis of Cracking During DC Casting of Large Dimension 7075 Aluminium Billets. In Proceedings of the Light Metals 2018; Martin, O., Ed.; Springer International Publishing: Cham, Switzerland, 2018; pp. 895–900. [Google Scholar]
- Suyitno; Savran, V.I.; Katgerman, L.; Eskin, D.G. Effects of Alloy Composition and Casting Speed on Structure Formation and Hot Tearing during Direct-Chill Casting of Al-Cu Alloys. Metall. Mater. Trans. A 2004, 35, 3551–3561. [Google Scholar] [CrossRef] [Scilit]
- Suyitno; Kool, W.H.; Katgerman, L. Finite Element Method Simulation of Mushy Zone Behavior during Direct-Chill Casting of an Al-4.5 Pct Cu Alloy. Metall. Mater. Trans. A-Phys. Metall. Mater. Sci. 2004, 35A, 2917–2926. [Google Scholar] [CrossRef] [Scilit]
- Suyitno; Kool, W.H.; Katgerman, L. Integrated Approach for Prediction of Hot Tearing. Metall. Mater. Trans. A 2009, 40, 2388–2400. [Google Scholar] [CrossRef] [Scilit]
- Eskin, D.G.; Savran, V.I.; Katgerman, L. Effects of Melt Temperature and Casting Speed on the Structure and Defect Formation during Direct-Chill Casting of an Al-Cu Alloy. Metall. Mater. Trans. A 2005, 36, 1965–1976. [Google Scholar] [CrossRef] [Scilit]
- Eskin, D.G.; Zuidema, J.; Savran, V.I.; Katgerman, L. Structure Formation and Macrosegregation under Different Process Conditions during DC Casting. Mater. Sci. Eng. A 2004, 384, 232–244. [Google Scholar] [CrossRef] [Scilit]
- Caron, E.; Wells, M.A. Film Boiling and Water Film Ejection in the Secondary Cooling Zone of the Direct-Chill Casting Process. Metall. Mater. Trans. B-Proc. Metall. Mater. Proc. Sci. 2012, 43, 155–162. [Google Scholar] [CrossRef] [Scilit]
- Eskin, D.G.; Katgerman, L. A Quest for a New Hot Tearing Criterion. Metall. Mater. Trans. A 2007, 38, 1511–1519. [Google Scholar] [CrossRef] [Scilit]
- Suyitno; Kool, W.H.; Katgerman, L. Hot Tearing Criteria Evaluation for Direct-Chill Casting of an Al-4.5 Pct Cu Alloy. Metall. Mater. Trans. A 2005, 36, 1537–1546. [Google Scholar] [CrossRef] [Scilit]
- Pujiyulianto, E.; Suyitno; Rajagukguk, K.; Arifvianto, B.; Katgerman, L.; Paundra, F.; Yudistira, H.T.; Nurullah, F.P.; Muhyi, A.; Arif, M.F. Effect of Chemical Composition on Hot Cracking Susceptibility (HCS) Using Various Hot Cracking Criteria. Eng. Fail. Anal. 2023, 152, 107501. [Google Scholar] [CrossRef] [Scilit]
- Gildemeister, D. Effects of Microstructure on Hot Cracking Behavior in Al–Zn–Mg–Cu Alloys. In Proceedings of the Light Metals 2018; Martin, O., Ed.; Springer International Publishing: Cham, Switzerland, 2018; pp. 1097–1104. [Google Scholar]
- Mathier, V.; Vernede, S.; Jarry, P.; Rappaz, M. Two-Phase Modeling of Hot Tearing in Aluminum Alloys: Applications of a Semicoupled Method. Metall. Mater. Trans. A-Phys. Metall. Mater. Sci. 2009, 40A, 943–957. [Google Scholar] [CrossRef] [Scilit]
- M’Hamdi, M.; Mo, A.; Fjær, H.G. TearSim: A Two-Phase Model Addressing Hot Tearing Formation during Aluminum Direct Chill Casting. Metall. Mater. Trans. A 2006, 37, 3069–3083. [Google Scholar] [CrossRef] [Scilit]
- Sistaninia, M.; Phillion, A.B.; Drezet, J.-M.; Rappaz, M. Simulation of Semi-Solid Material Mechanical Behavior Using a Combined Discrete/Finite Element Method. Metall. Mater. Trans. A-Phys. Metall. Mater. Sci. 2011, 42A, 239–248. [Google Scholar] [CrossRef] [Scilit]
- Sistaninia, M.; Phillion, A.B.; Drezet, J.-M.; Rappaz, M. A 3-D Coupled Hydromechanical Granular Model for Simulating the Constitutive Behavior of Metallic Alloys during Solidification. Acta Mater. 2012, 60, 6793–6803. [Google Scholar] [CrossRef] [Scilit]
- Khodaei, N.; Phillion, A.B. A Study on Hot Tearing in Direct Chill Casting of Al-Mn-Mg Alloys Using a Multi-Scale Approach. Met. Mater. Trans. B 2021, 52, 1424–1435. [Google Scholar] [CrossRef] [Scilit]
- Lan, Q.; Wang, X.; Sun, J.; Chang, Z.; Deng, Q.; Sun, Q.; Liu, Z.; Yuan, L.; Wang, J.; Wu, Y.; et al. Artificial Neural Network Approach for Mechanical Properties Prediction of As-Cast A380 Aluminum Alloy. Mater. Today Commun. 2022, 31, 103301. [Google Scholar] [CrossRef] [Scilit]
- Yang, J.; Liu, B.; Huang, H. Research on Composition-Process-Property Prediction of Die Casting Al Alloys via Combining Feature Creation and Attention Mechanisms. J. Mater. Res. Technol.-JMRT 2024, 28, 335–346. [Google Scholar] [CrossRef] [Scilit]
- Guo, G.; Yao, T.; Liu, W.; Tang, S.; Xiao, D.; Huang, L.; Wu, L.; Feng, Z.; Gao, X. Numerical Simulation and Machine Learning Prediction of the Direct Chill Casting Process of Large-Scale Aluminum Ingots. Materials 2024, 17, 1409. [Google Scholar] [CrossRef] [Scilit] [PubMed]
- Roscher, R.; Bohn, B.; Duarte, M.F.; Garcke, J. Explainable Machine Learning for Scientific Insights and Discoveries. IEEE Access 2020, 8, 42200–42216. [Google Scholar] [CrossRef] [Scilit]
- Oviedo, F.; Ferres, J.L.; Buonassisi, T.; Butler, K.T. Interpretable and Explainable Machine Learning for Materials Science and Chemistry. Acc. Mater. Res. 2022, 3, 597–607. [Google Scholar] [CrossRef] [Scilit]
- Strobl, C.; Boulesteix, A.-L.; Zeileis, A.; Hothorn, T. Bias in Random Forest Variable Importance Measures: Illustrations, Sources and a Solution. BMC Bioinform. 2007, 8, 25. [Google Scholar] [CrossRef] [Scilit] [PubMed]
- Ribeiro, M.T.; Singh, S.; Guestrin, C. “Why Should I Trust You?”: Explaining the Predictions of Any Classifier. In Proceedings of the 22nd ACM SIGKDD International Conference on Knowledge Discovery and Data Mining; Association for Computing Machinery: New York, NY, USA, 2016; pp. 1135–1144. [Google Scholar]
- Lundberg, S.M.; Lee, S.-I. A Unified Approach to Interpreting Model Predictions. Adv. Neural Inf. Process. Syst. 2017, 30, 4765–4774. [Google Scholar]
- Janzing, D.; Minorics, L.; Bloebaum, P. Feature Relevance Quantification in Explainable AI: A Causal Problem. In Proceedings of the Twenty Third International Conference on Artificial Intelligence and Statistics; PMLR: New York, NY, USA, 2020; pp. 2907–2916. [Google Scholar]
- Aas, K.; Jullum, M.; Løland, A. Explaining Individual Predictions When Features Are Dependent: More Accurate Approximations to Shapley Values. Artif. Intell. 2021, 298, 103502. [Google Scholar] [CrossRef] [Scilit]
- Alvarez-Melis, D.; Jaakkola, T.S. On the Robustness of Interpretability Methods. arXiv 2018, arXiv:1806.08049. [Google Scholar]
- Kumar, I.E.; Venkatasubramanian, S.; Scheidegger, C.; Friedler, S.A. Problems with Shapley-Value-Based Explanations as Feature Importance Measures. In Proceedings of the 37th International Conference on Machine Learning; JMLR.org: Cambridge, MA, USA, 2020; Volume 119, pp. 5491–5500. [Google Scholar]
- Molnar, C.; König, G.; Herbinger, J.; Freiesleben, T.; Dandl, S.; Scholbeck, C.A.; Casalicchio, G.; Grosse-Wentrup, M.; Bischl, B. General Pitfalls of Model-Agnostic Interpretation Methods for Machine Learning Models. In xxAI-Beyond Explainable AI: International Workshop, Held in Conjunction with ICML 2020, July 18, 2020, Vienna, Austria, Revised and Extended Papers; Holzinger, A., Goebel, R., Fong, R., Moon, T., Müller, K.-R., Samek, W., Eds.; Springer International Publishing: Cham, Switzerland, 2022; pp. 39–68. ISBN 978-3-031-04083-2. [Google Scholar]
- Akinwande, M.O.; Dikko, H.G.; Samson, A. Variance Inflation Factor: As a Condition for the Inclusion of Suppressor Variable(s) in Regression Analysis. Open J. Stat. 2015, 5, 754–767. [Google Scholar] [CrossRef]
- Johnson, S. Hierarchical Clustering Schemes. Psychometrika 1967, 32, 241–254. [Google Scholar] [CrossRef] [Scilit] [PubMed]
- Ward, J.H., Jr. Hierarchical Grouping to Optimize an Objective Function. J. Am. Stat. Assoc. 1963, 58, 236–244. [Google Scholar] [CrossRef]
- Rousseeuw, P.J. Silhouettes: A Graphical Aid to the Interpretation and Validation of Cluster Analysis. J. Comput. Appl. Math. 1987, 20, 53–65. [Google Scholar] [CrossRef] [Scilit]
- Shahapure, K.R.; Nicholas, C. Cluster Quality Analysis Using Silhouette Score. In Proceedings of the 2020 IEEE 7th International Conference on Data Science and Advanced Analytics (DSAA), Virtual, 6–9 October 2020; pp. 747–748. [Google Scholar]
- Hosmer, D.W., Jr.; Lemeshow, S.; Sturdivant, R.X. Applied Logistic Regression, 3rd ed.; John Wiley & Sons: Hoboken, NJ, USA, 2013; ISBN 978-0-470-58247-3. [Google Scholar]
- Cortes, C.; Vapnik, V. Support-Vector Networks. Mach. Learn. 1995, 20, 273–297. [Google Scholar] [CrossRef] [Scilit]
- Breiman, L. Random Forests. Mach. Learn. 2001, 45, 5–32. [Google Scholar] [CrossRef] [Scilit]
- Chen, T.; Guestrin, C. XGBoost: A Scalable Tree Boosting System. In Proceedings of the 22nd ACM SIGKDD International Conference on Knowledge Discovery and Data Mining, San Francisco, CA, USA, 13–17 August 2016; pp. 785–794. [Google Scholar]
- Akiba, T.; Sano, S.; Yanase, T.; Ohta, T.; Koyama, M. Optuna: A Next-Generation Hyperparameter Optimization Framework. In Proceedings of the 25th ACM SIGKDD International Conference on Knowledge Discovery and Data Mining, Anchorage, AK, USA, 4–8 August 2019; pp. 2623–2631. [Google Scholar]
- Manning, C.D.; Raghavan, P.; Schütze, H. Introduction to Information Retrieval, 1st ed.; Cambridge University Press: Cambridge, UK, 2008; ISBN 0-521-86571-9. [Google Scholar]
- Saito, T.; Rehmsmeier, M. The Precision-Recall Plot Is More Informative than the ROC Plot When Evaluating Binary Classifiers on Imbalanced Datasets. PLoS ONE 2015, 10, e0118432. [Google Scholar] [CrossRef] [Scilit] [PubMed]
- Fawcett, T. An Introduction to ROC Analysis. Pattern Recognit. Lett. 2006, 27, 861–874. [Google Scholar] [CrossRef] [Scilit]
- Brier, G.W. Verification of Forecasts Expressed in Terms of Probability. Mon. Weather Rev. 1950, 78, 1–3. [Google Scholar]
- Gneiting, T.; Raftery, A.E. Strictly Proper Scoring Rules, Prediction, and Estimation. J. Am. Stat. Assoc. 2007, 102, 359–378. [Google Scholar] [CrossRef] [Scilit]
- Sweet, L.; Taylor, J.A.; Couper, M.J.; Easton, M.A. Hot Tearing in Al-Mg-Si Alloys with Minor Additions of Cu or Mn. Mater. Sci. Forum 2011, 693, 217–223. [Google Scholar] [CrossRef] [Scilit]
- Sweet, L.; Easton, M.A.; Taylor, J.A.; Grandfield, J.F.; Davidson, C.J.; Lu, L.; Couper, M.J.; Stjohn, D.H. Hot Tear Susceptibility of Al-Mg-Si-Fe Alloys with Varying Iron Contents. Metall. Mater. Trans. A-Phys. Metall. Mater. Sci. 2013, 44A, 5396–5407. [Google Scholar] [CrossRef] [Scilit]
- Nagaumi, H.; Suzuki, S.; Okane, T.; Umeda, T. Effect of Iron Content on Hot Tearing of High-Strength Al-Mg-Si Alloy. Mater. Trans. 2006, 47, 2821–2827. [Google Scholar] [CrossRef] [Scilit]
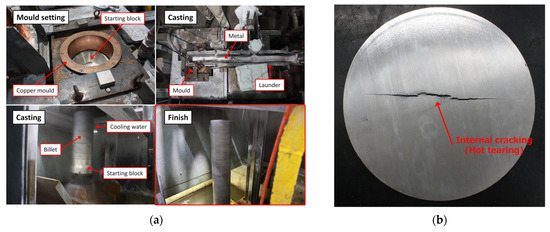
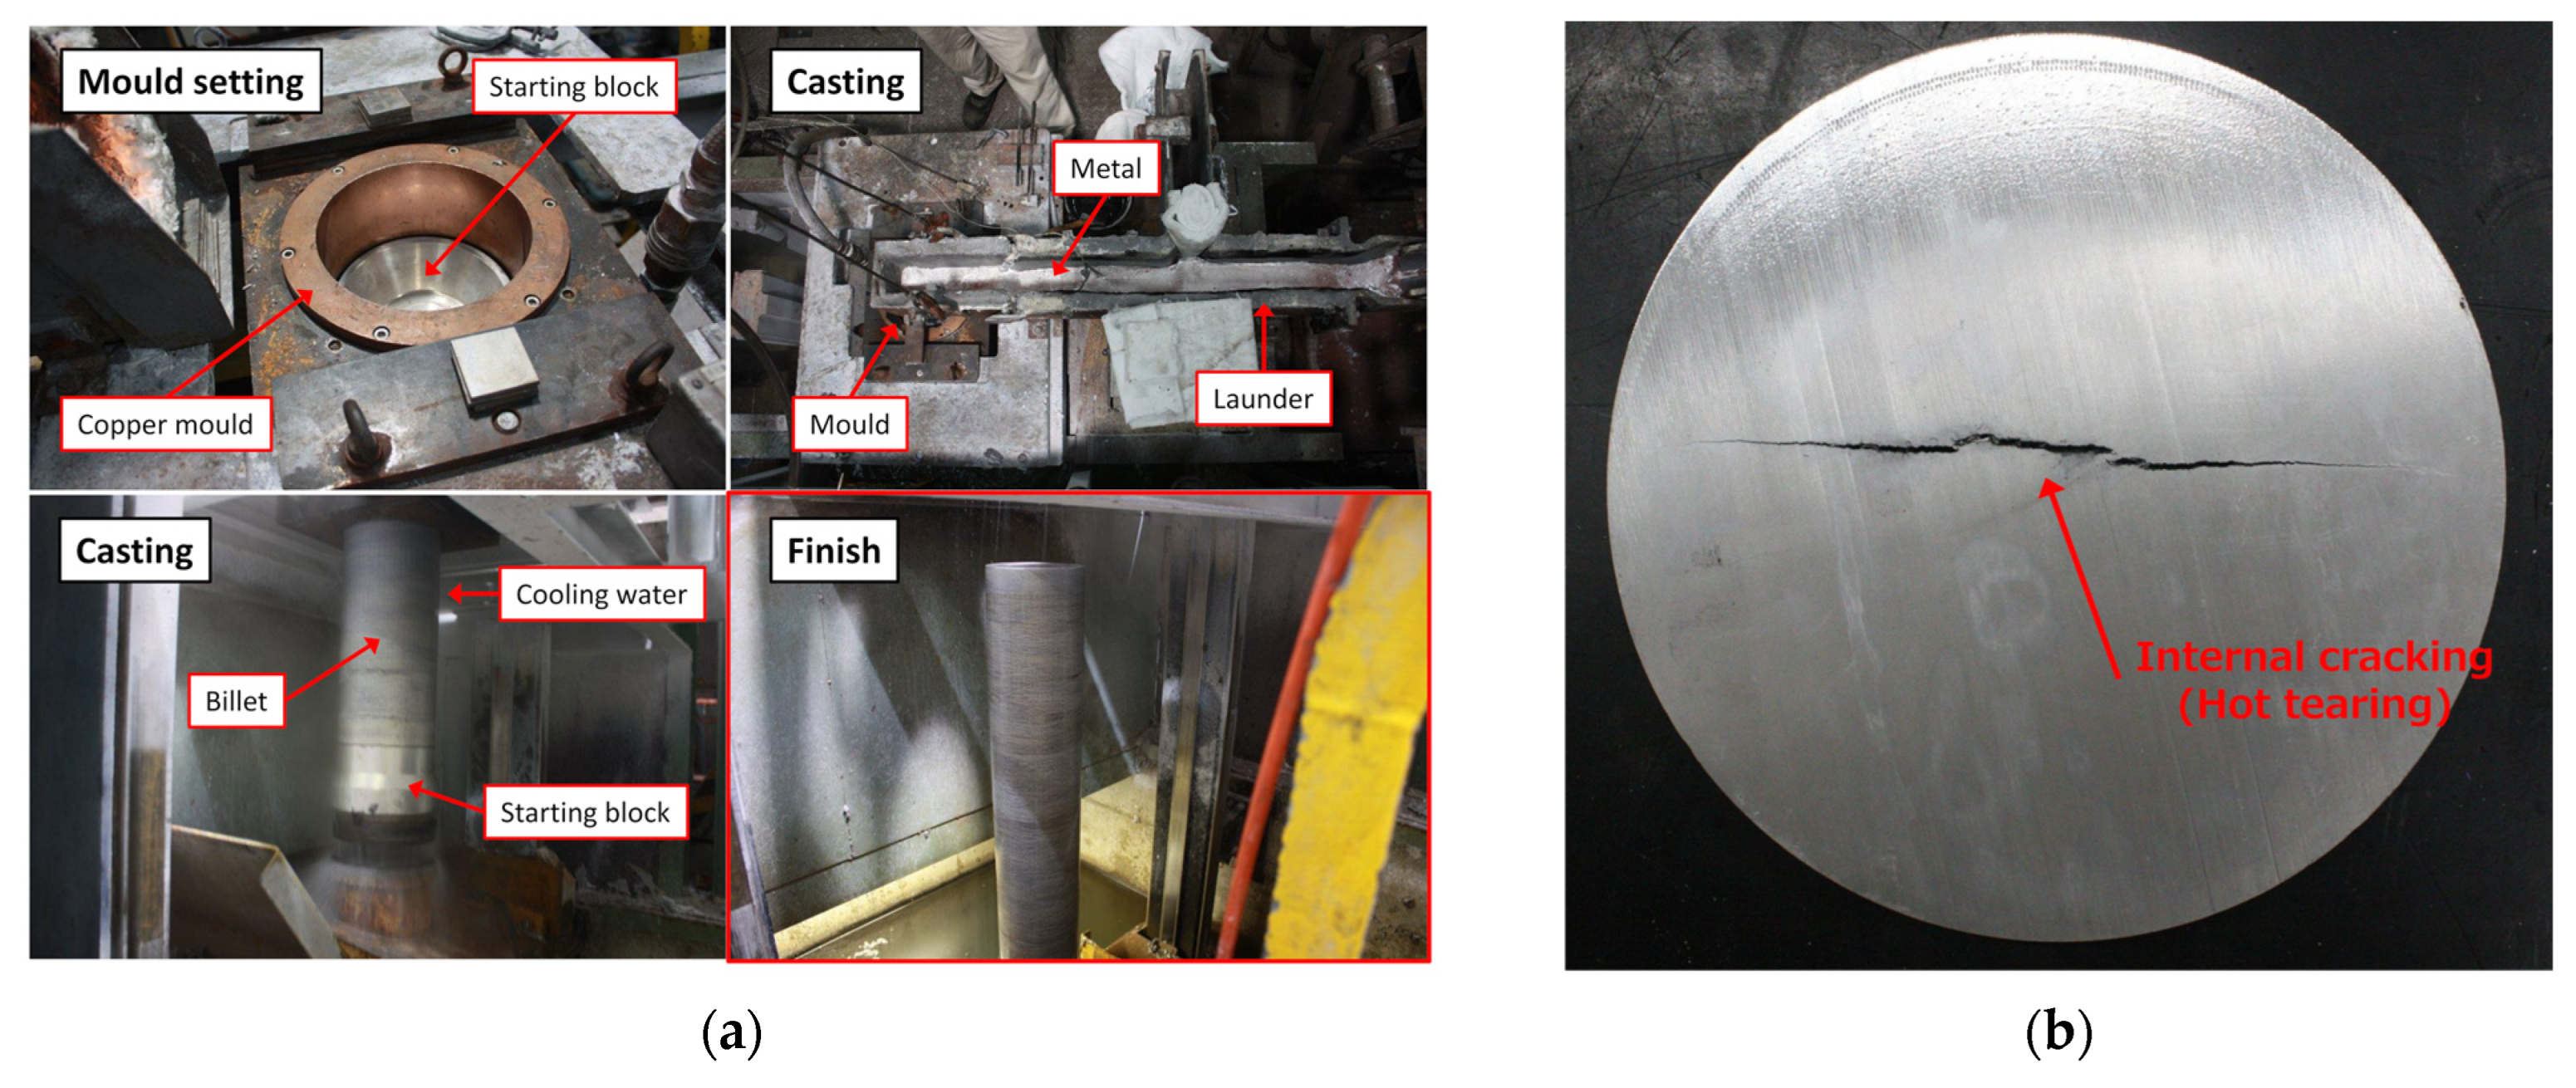
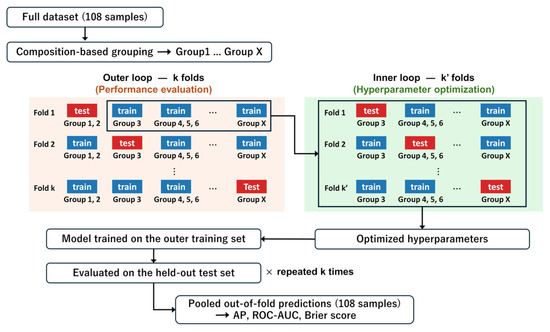
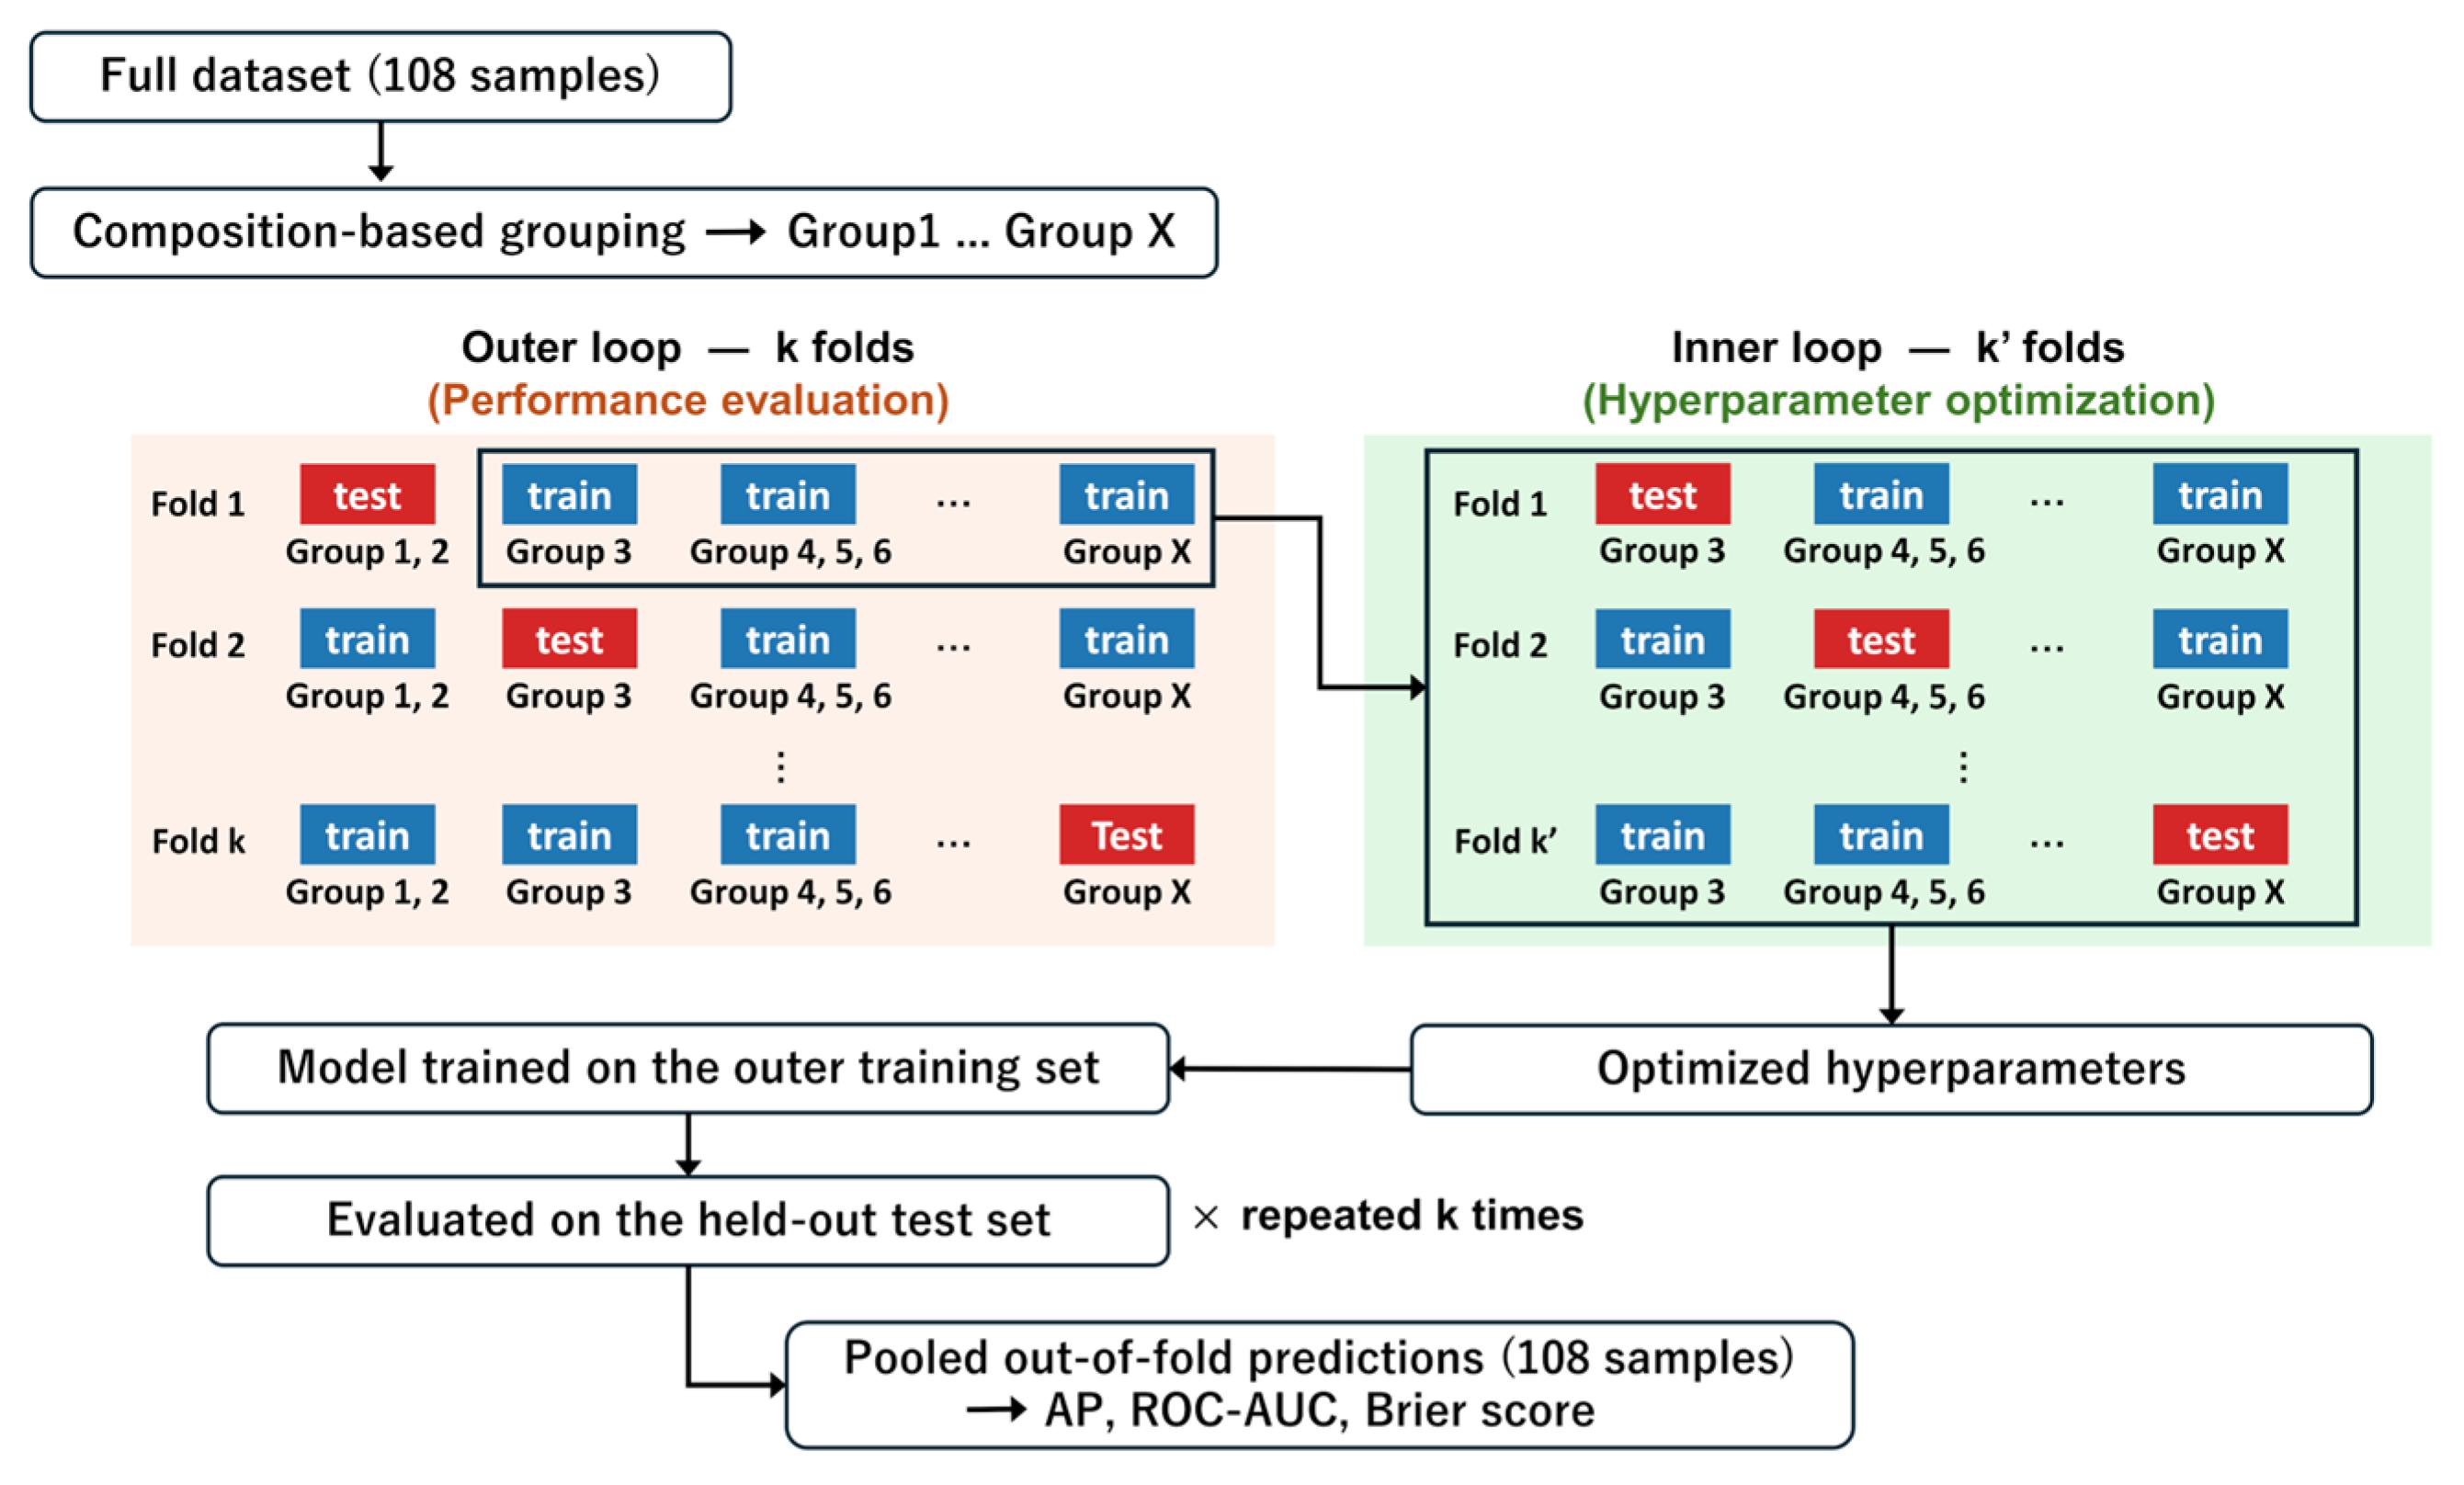
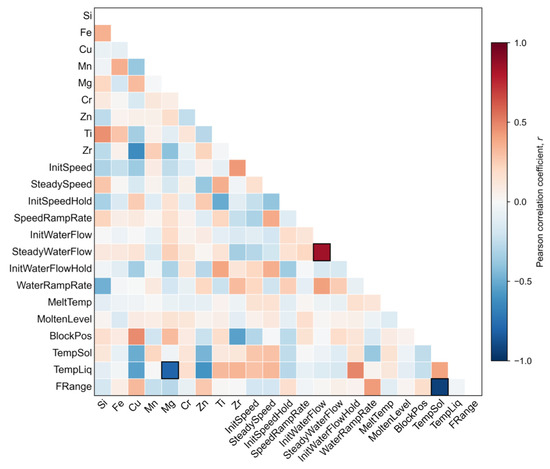
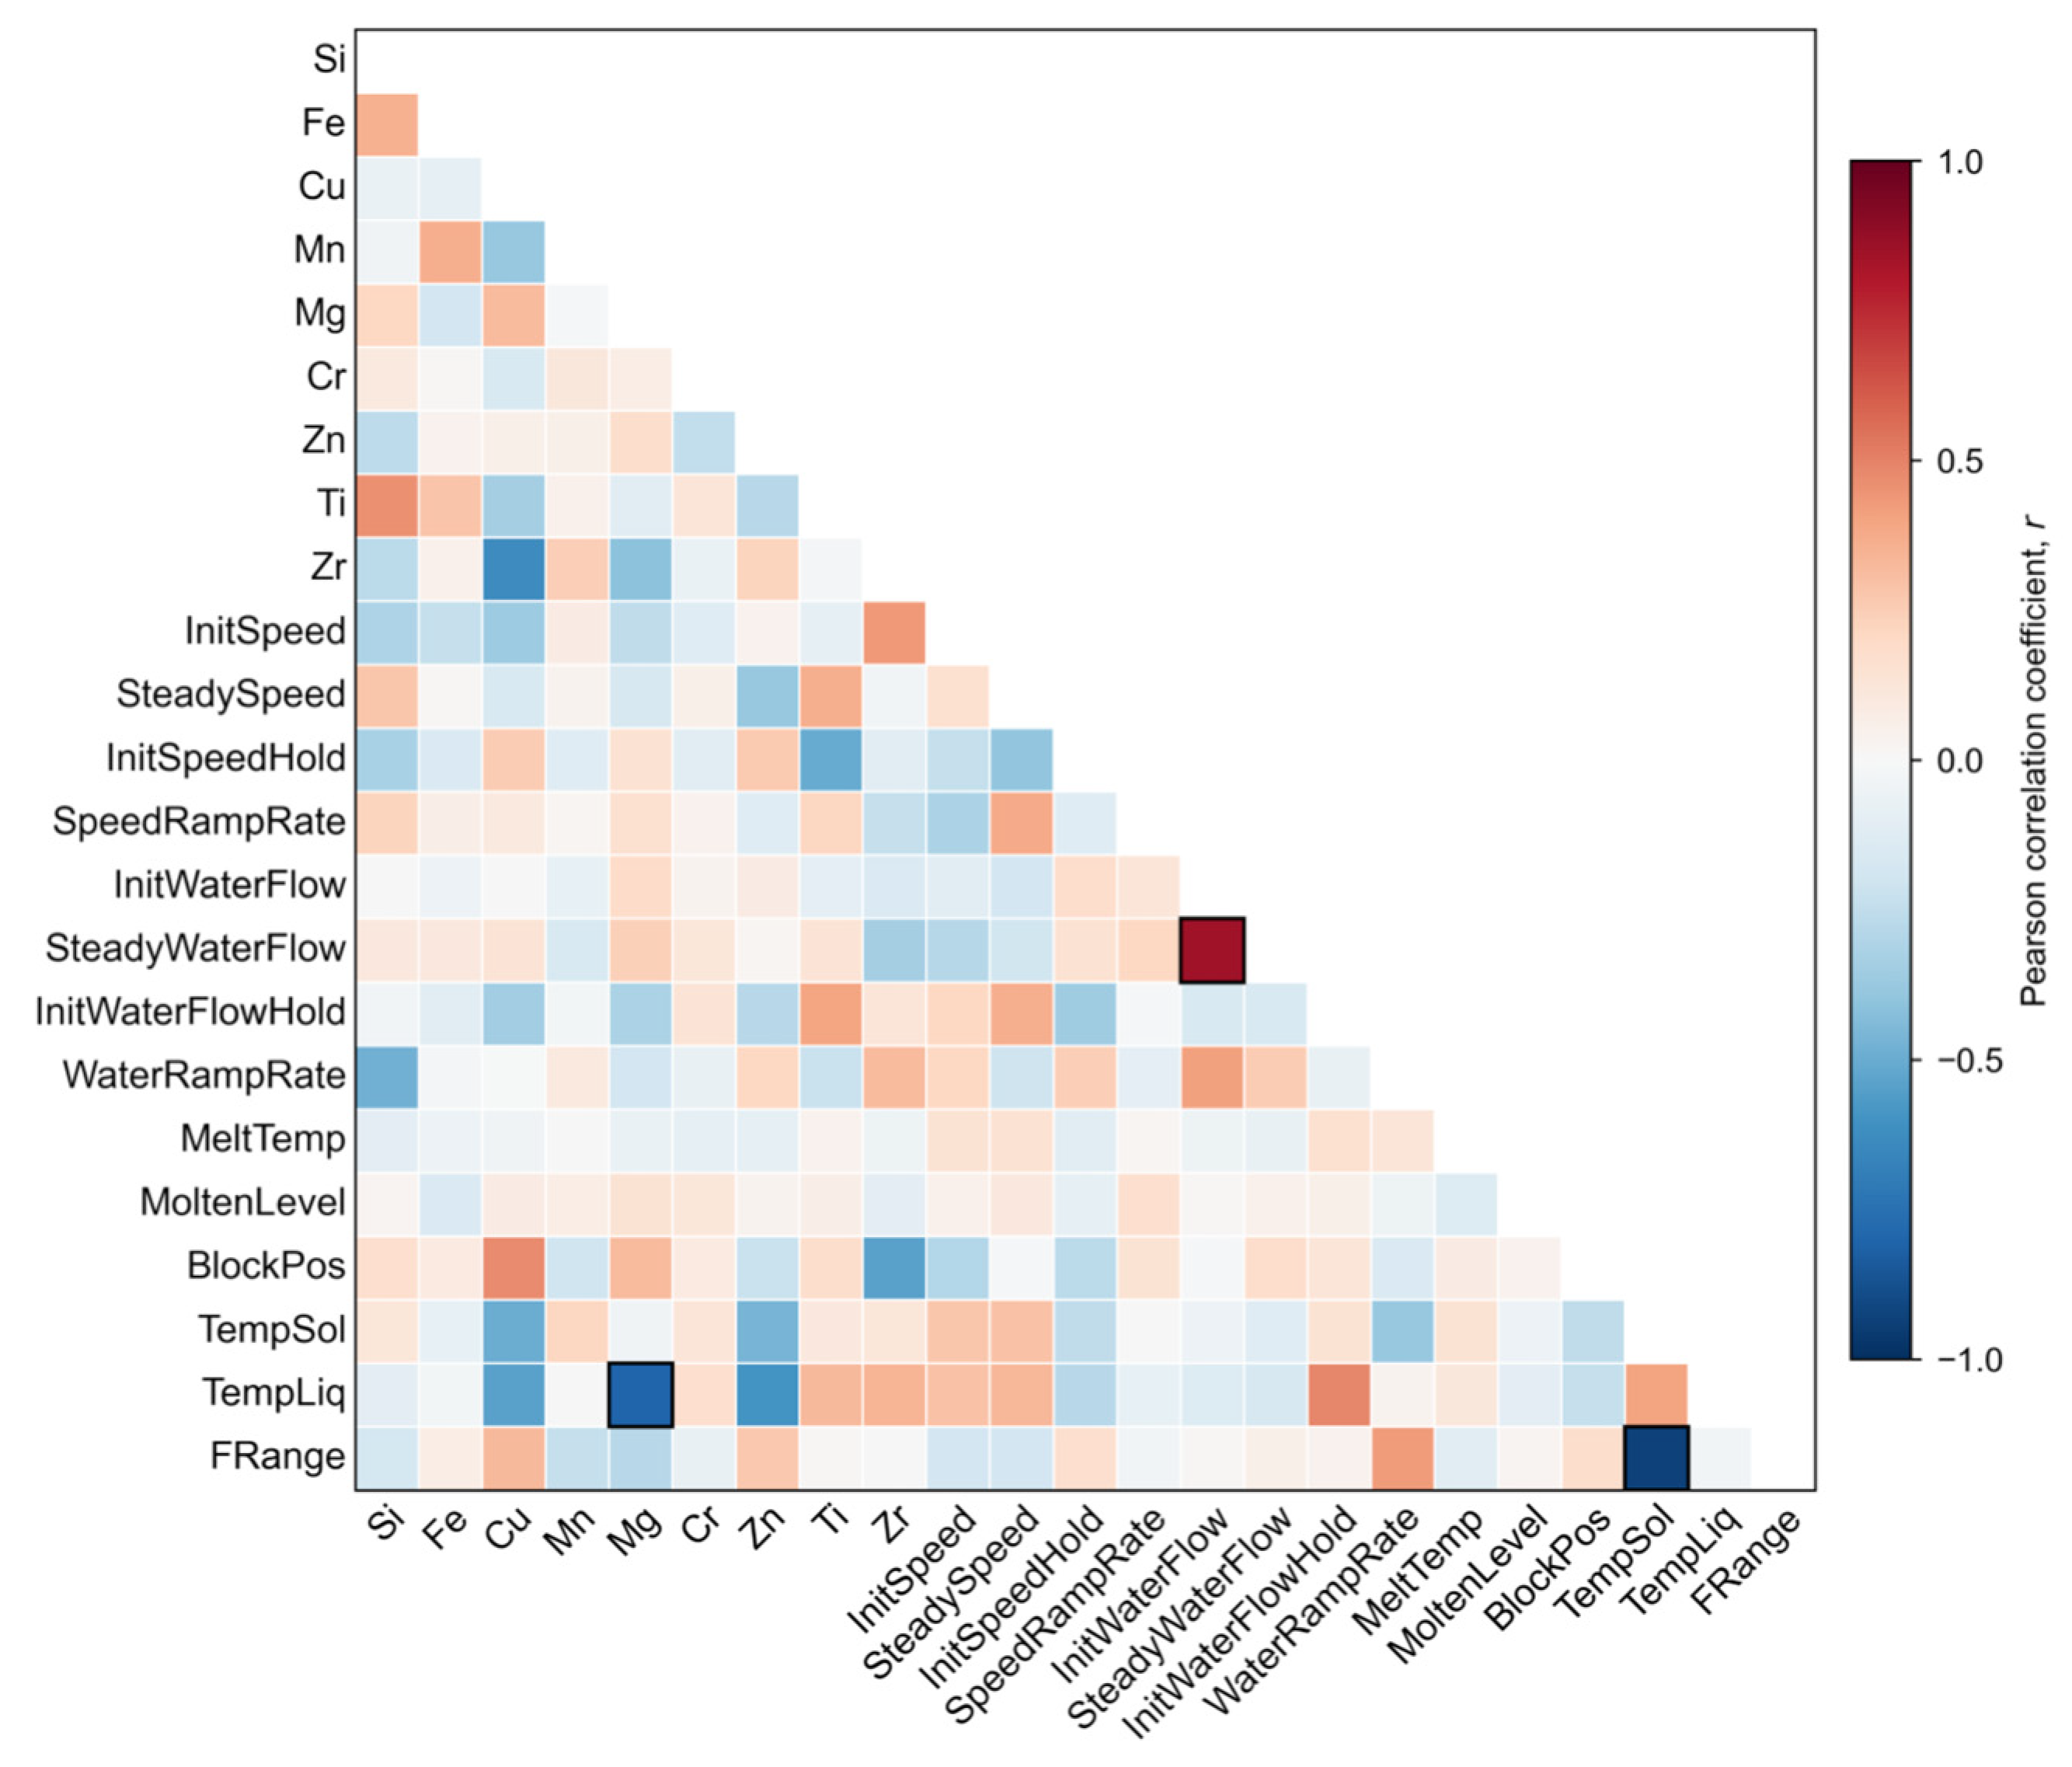
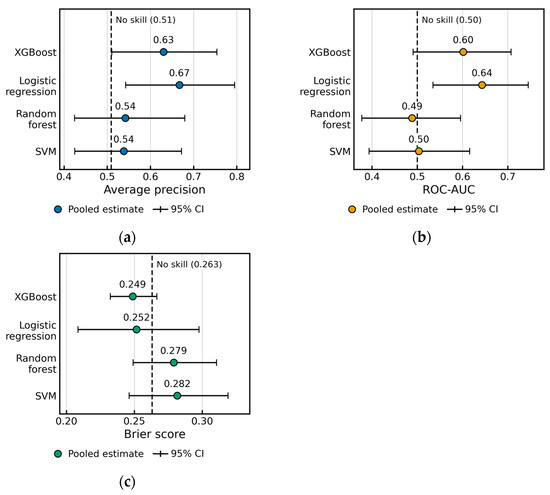
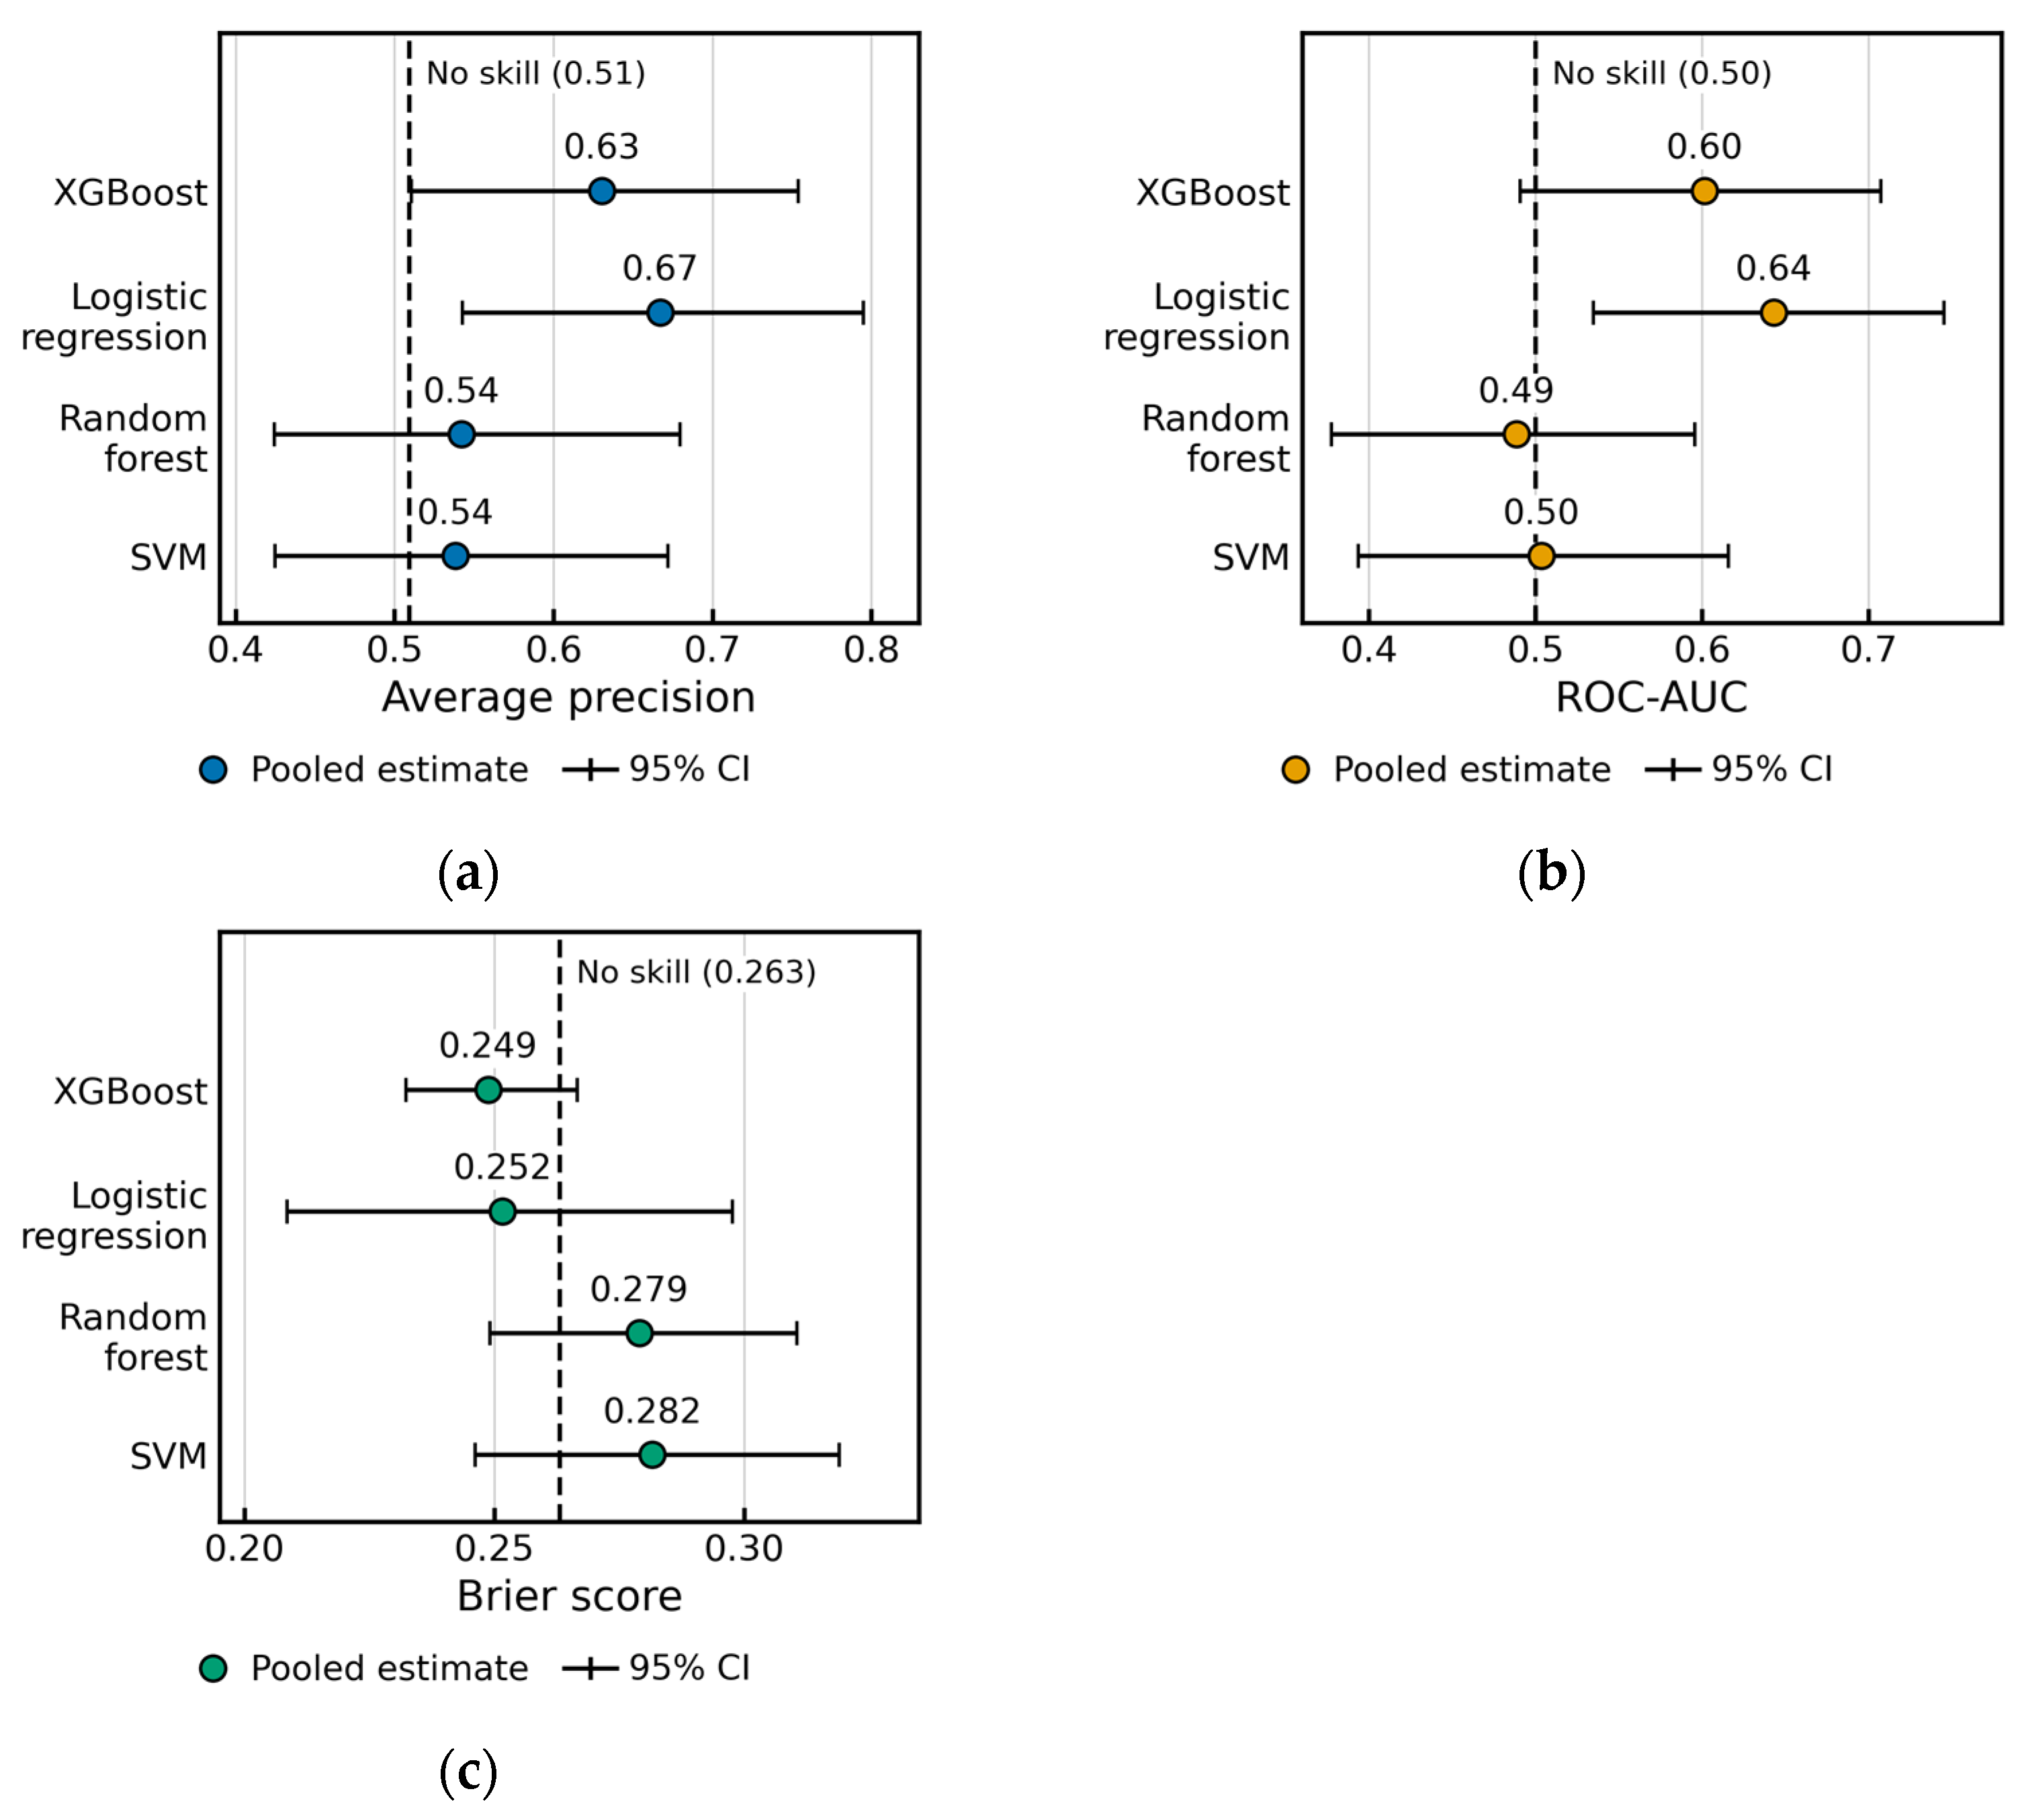
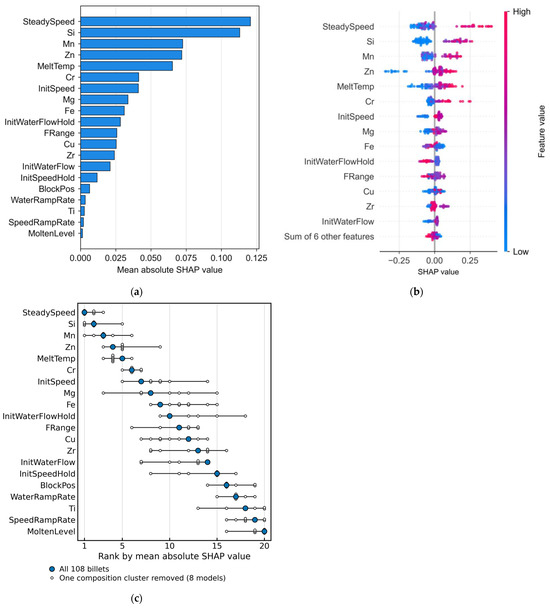
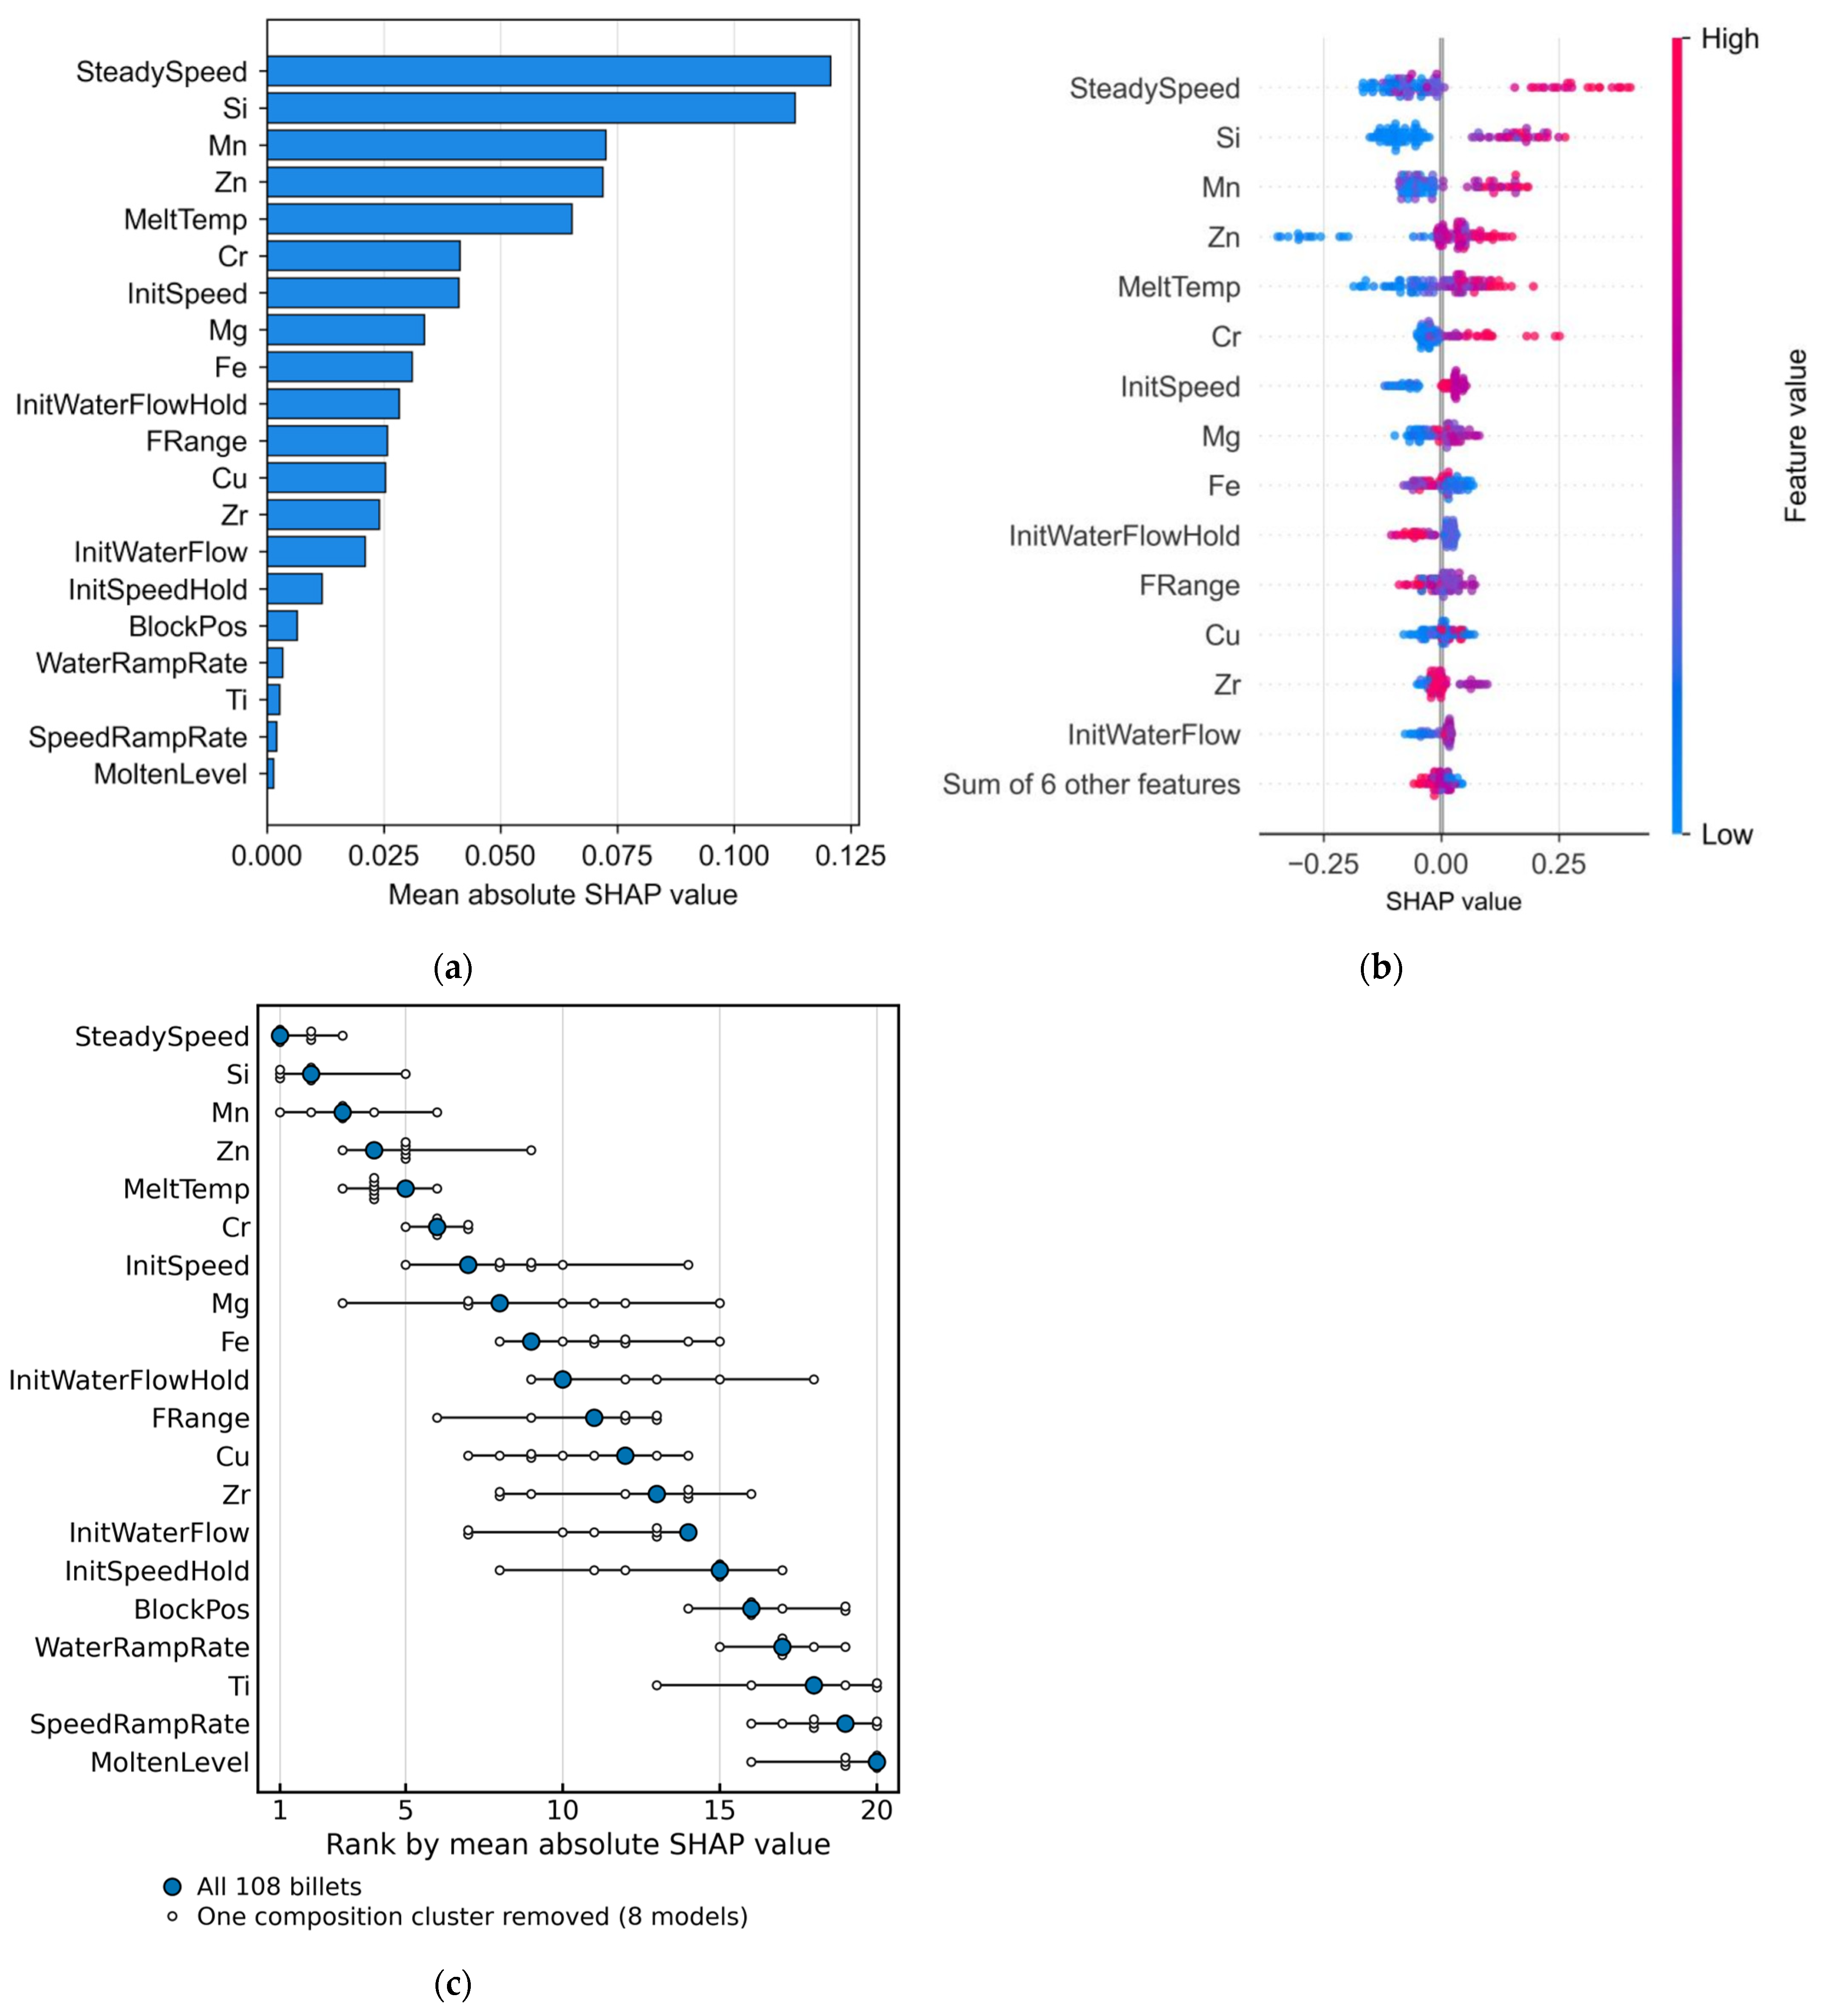
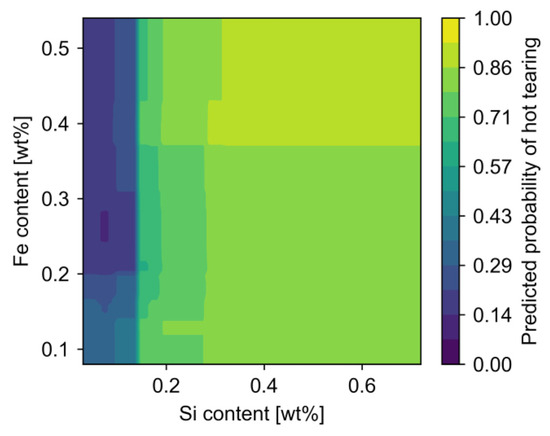
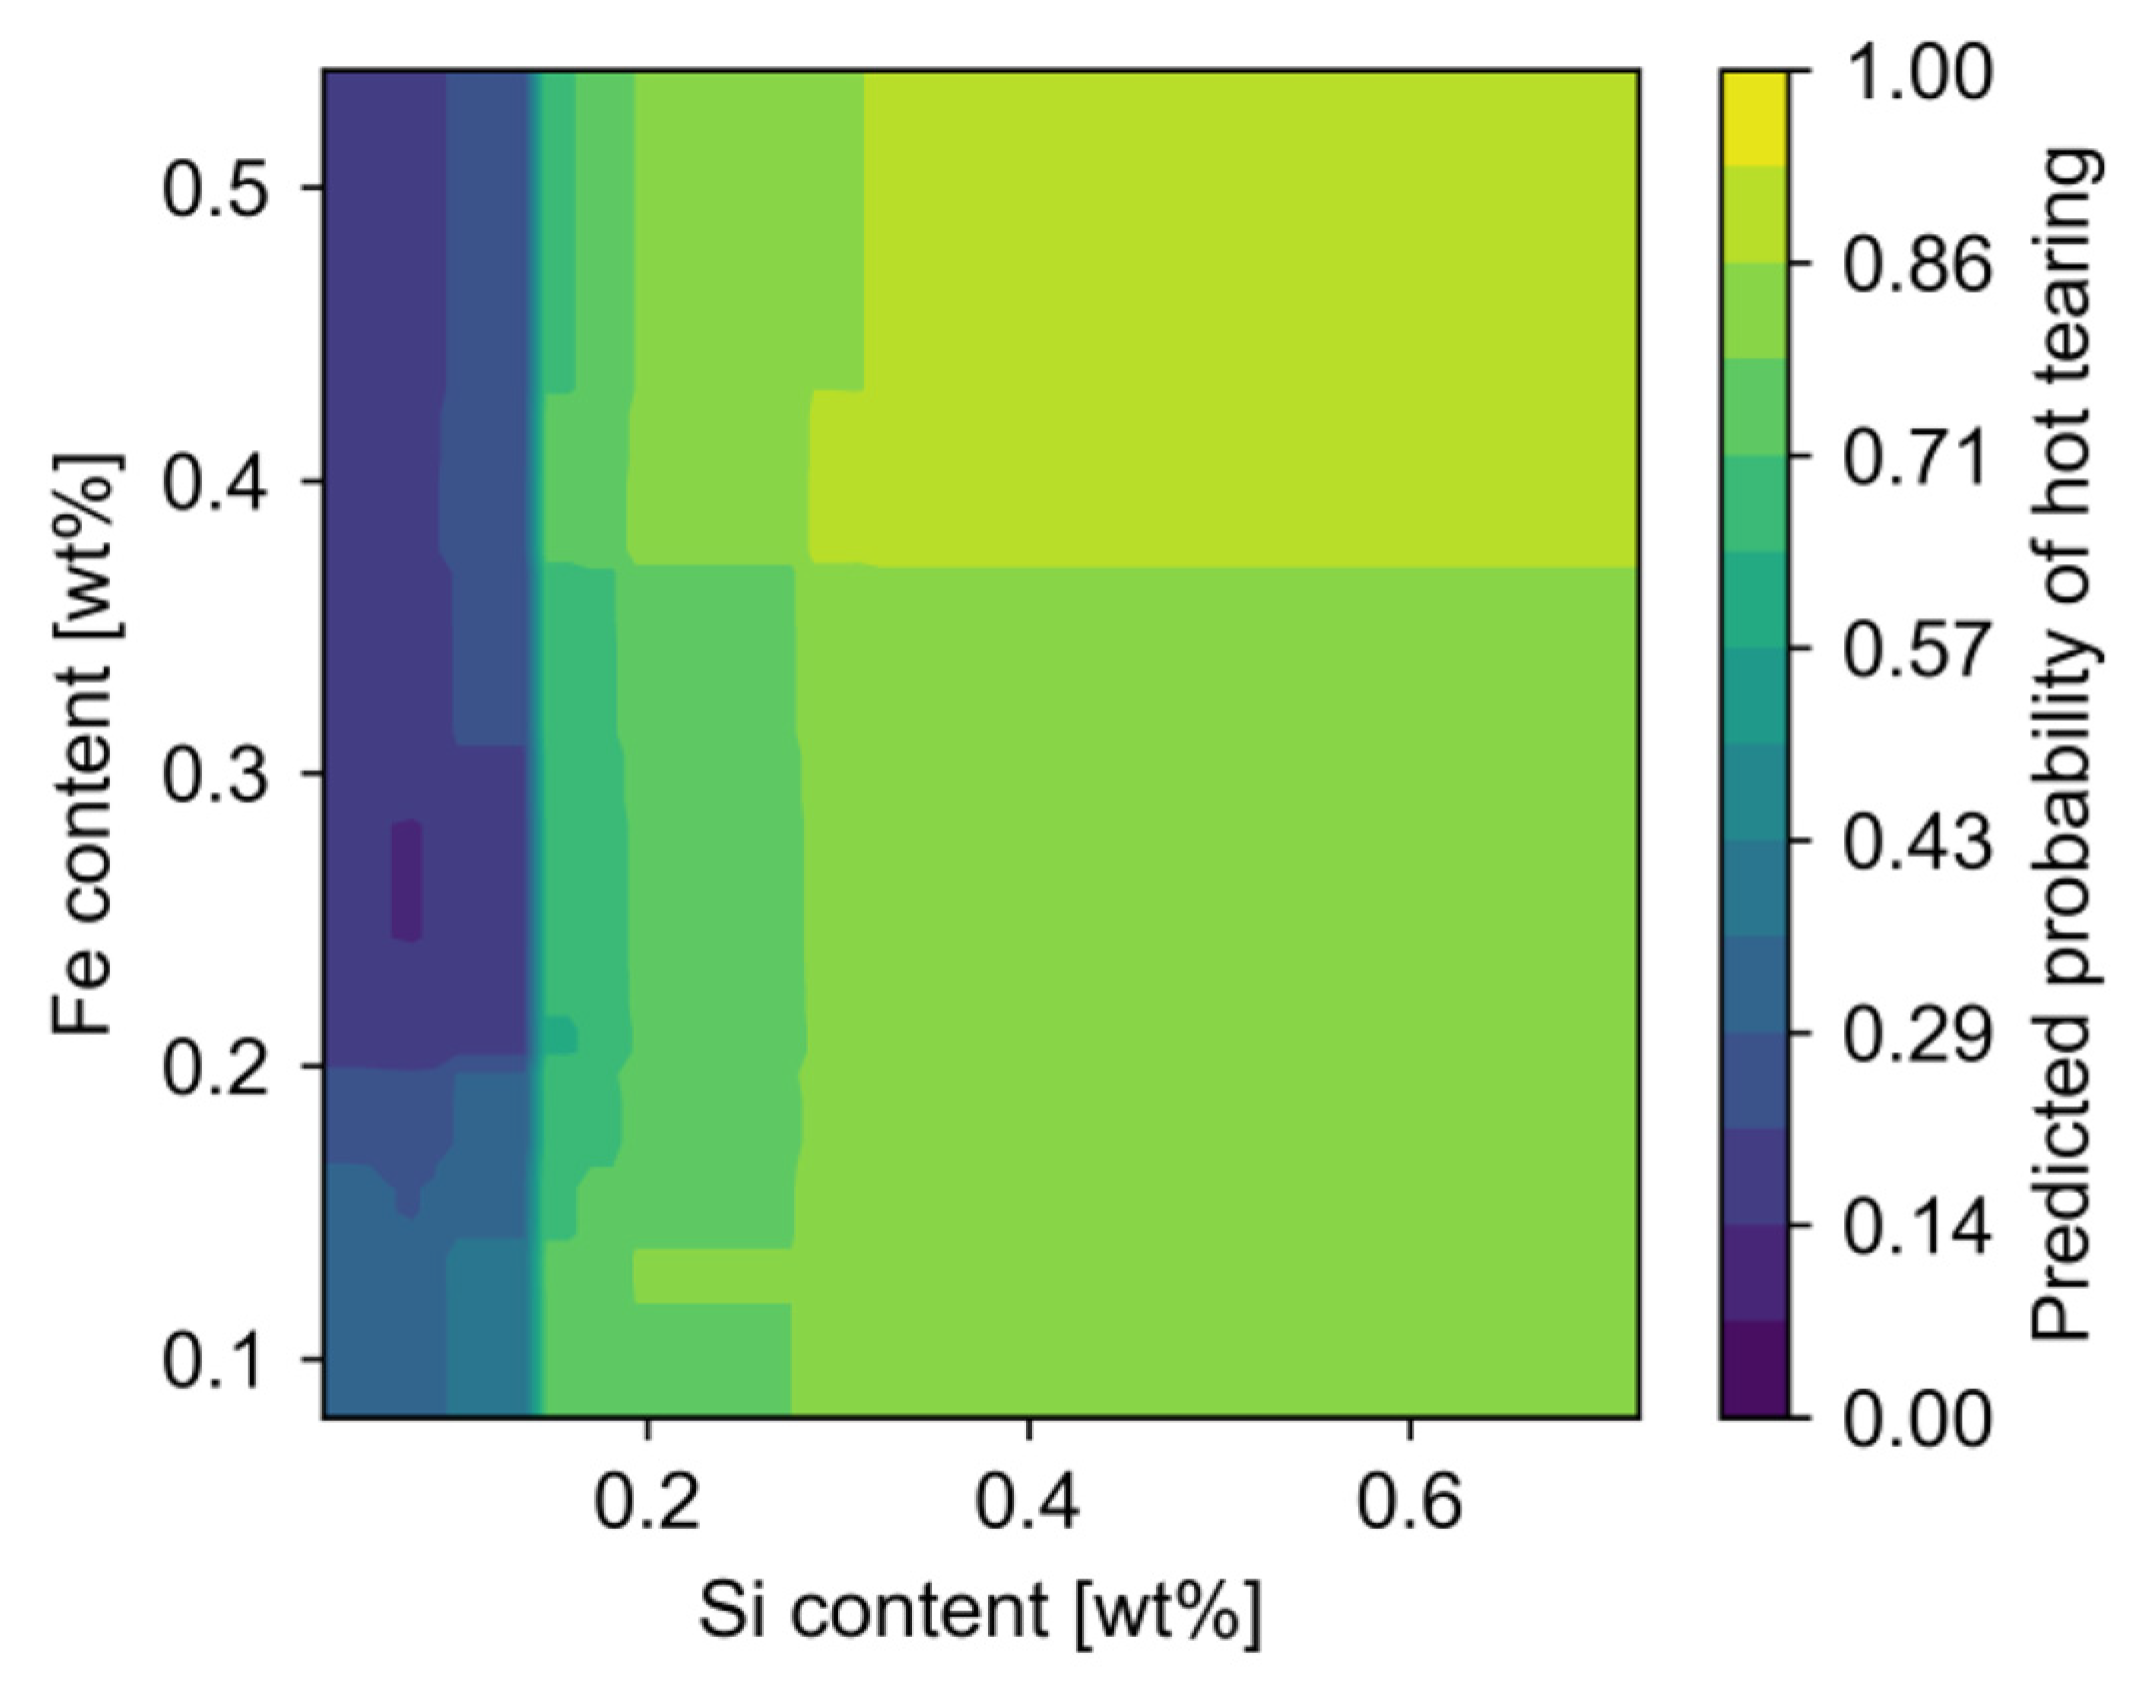
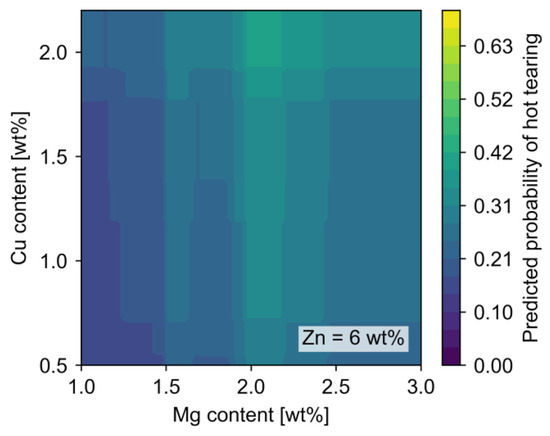
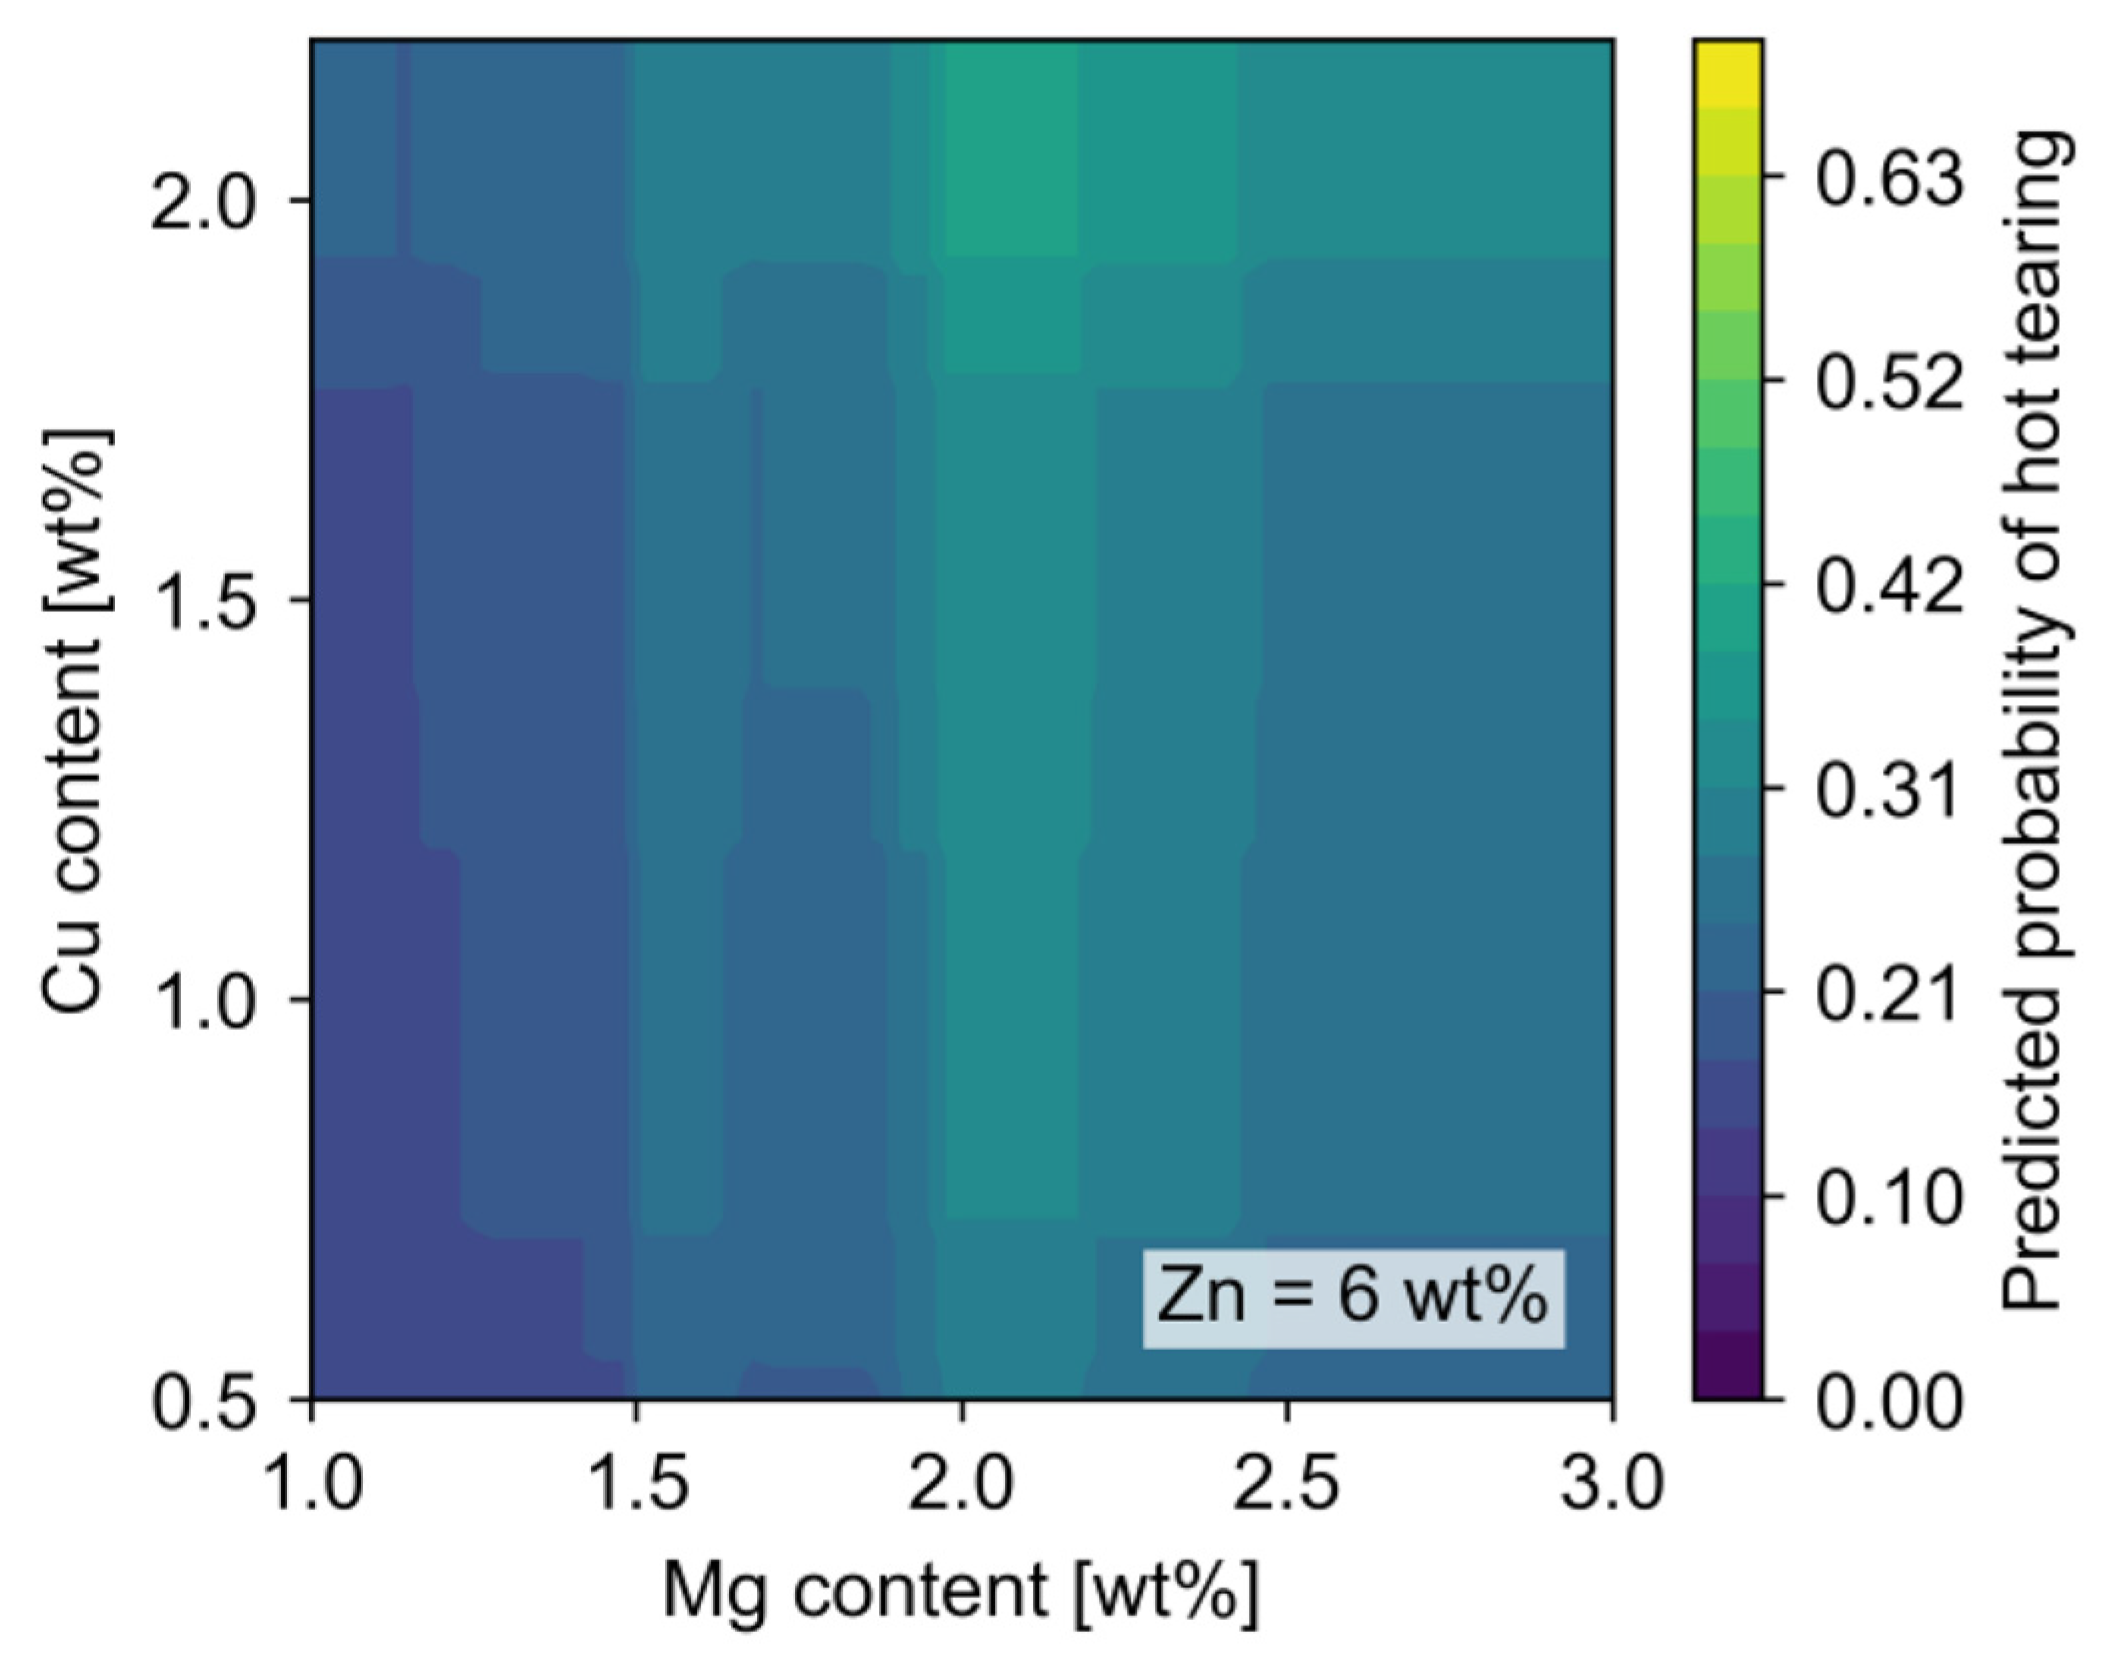
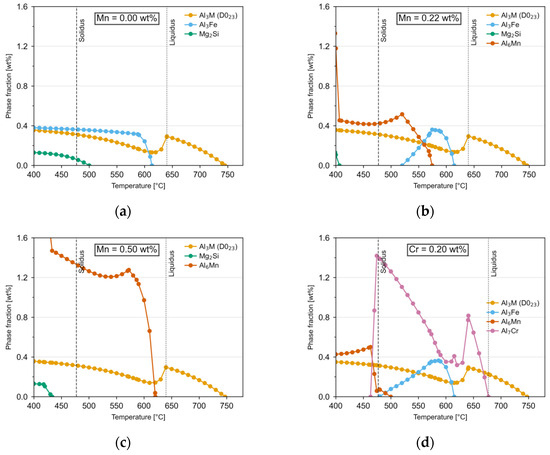
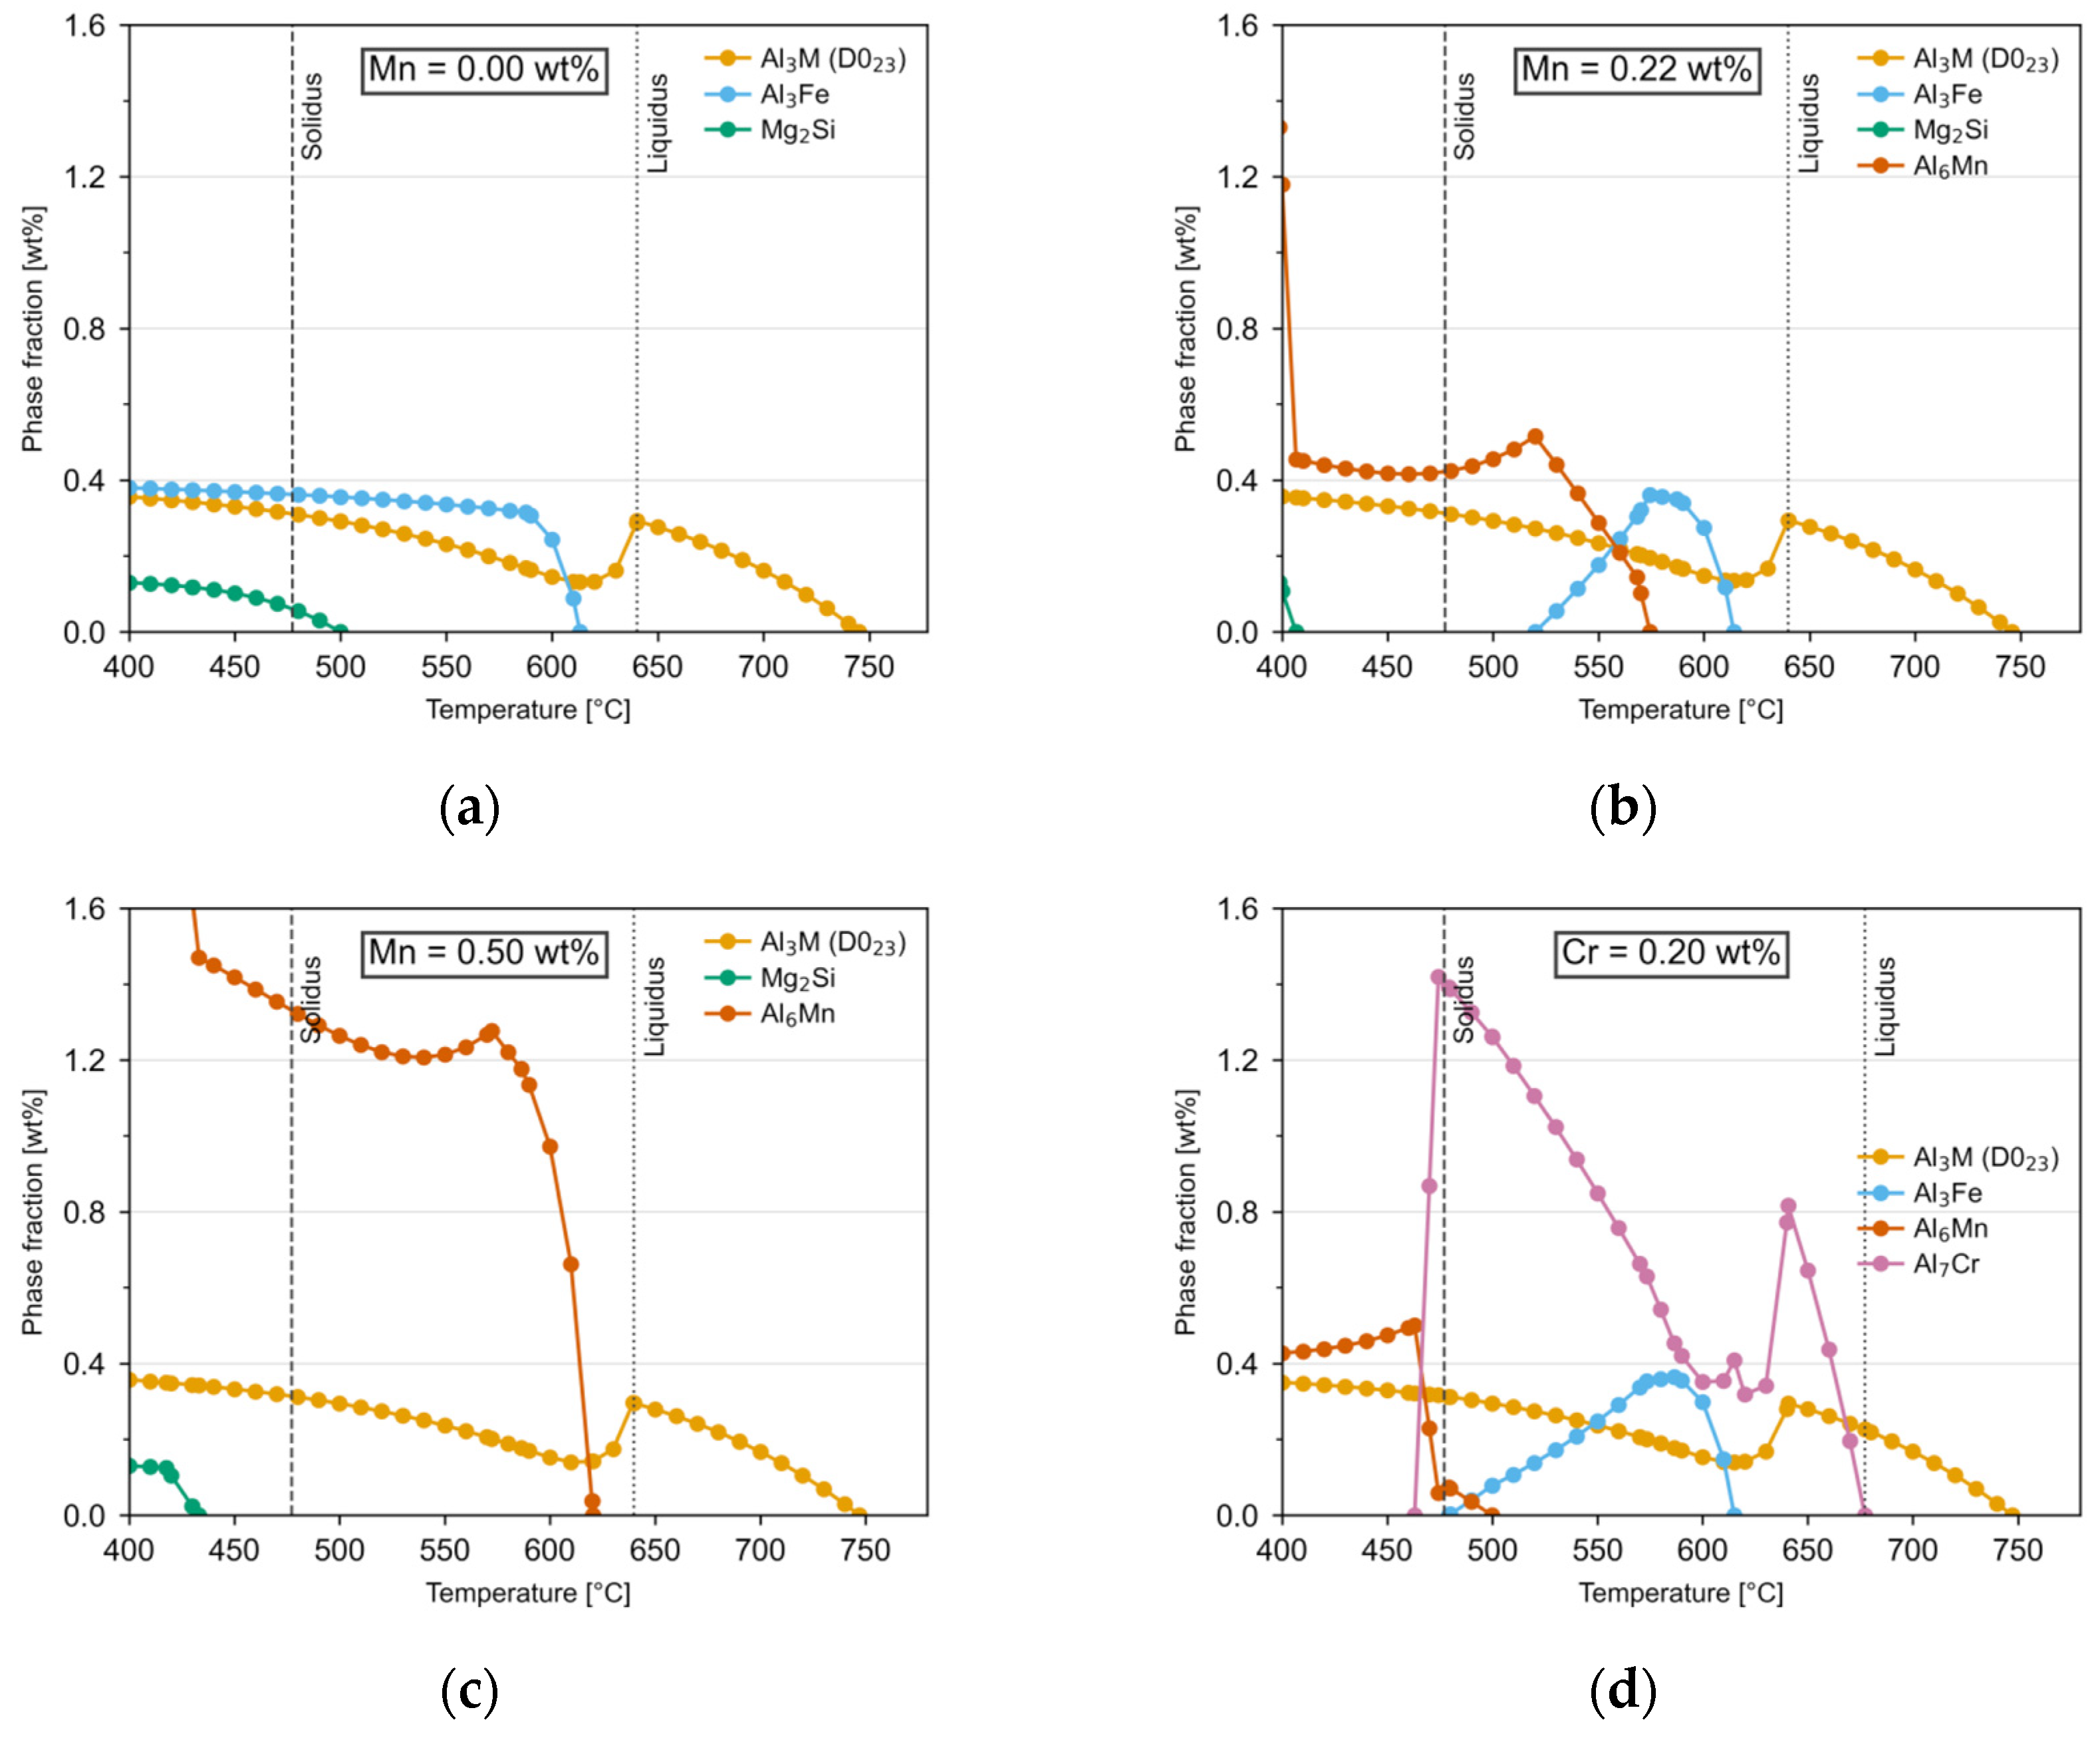
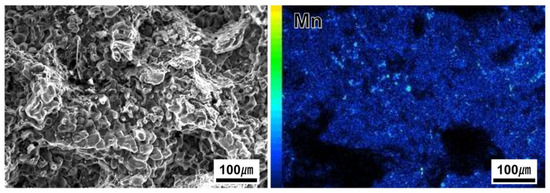
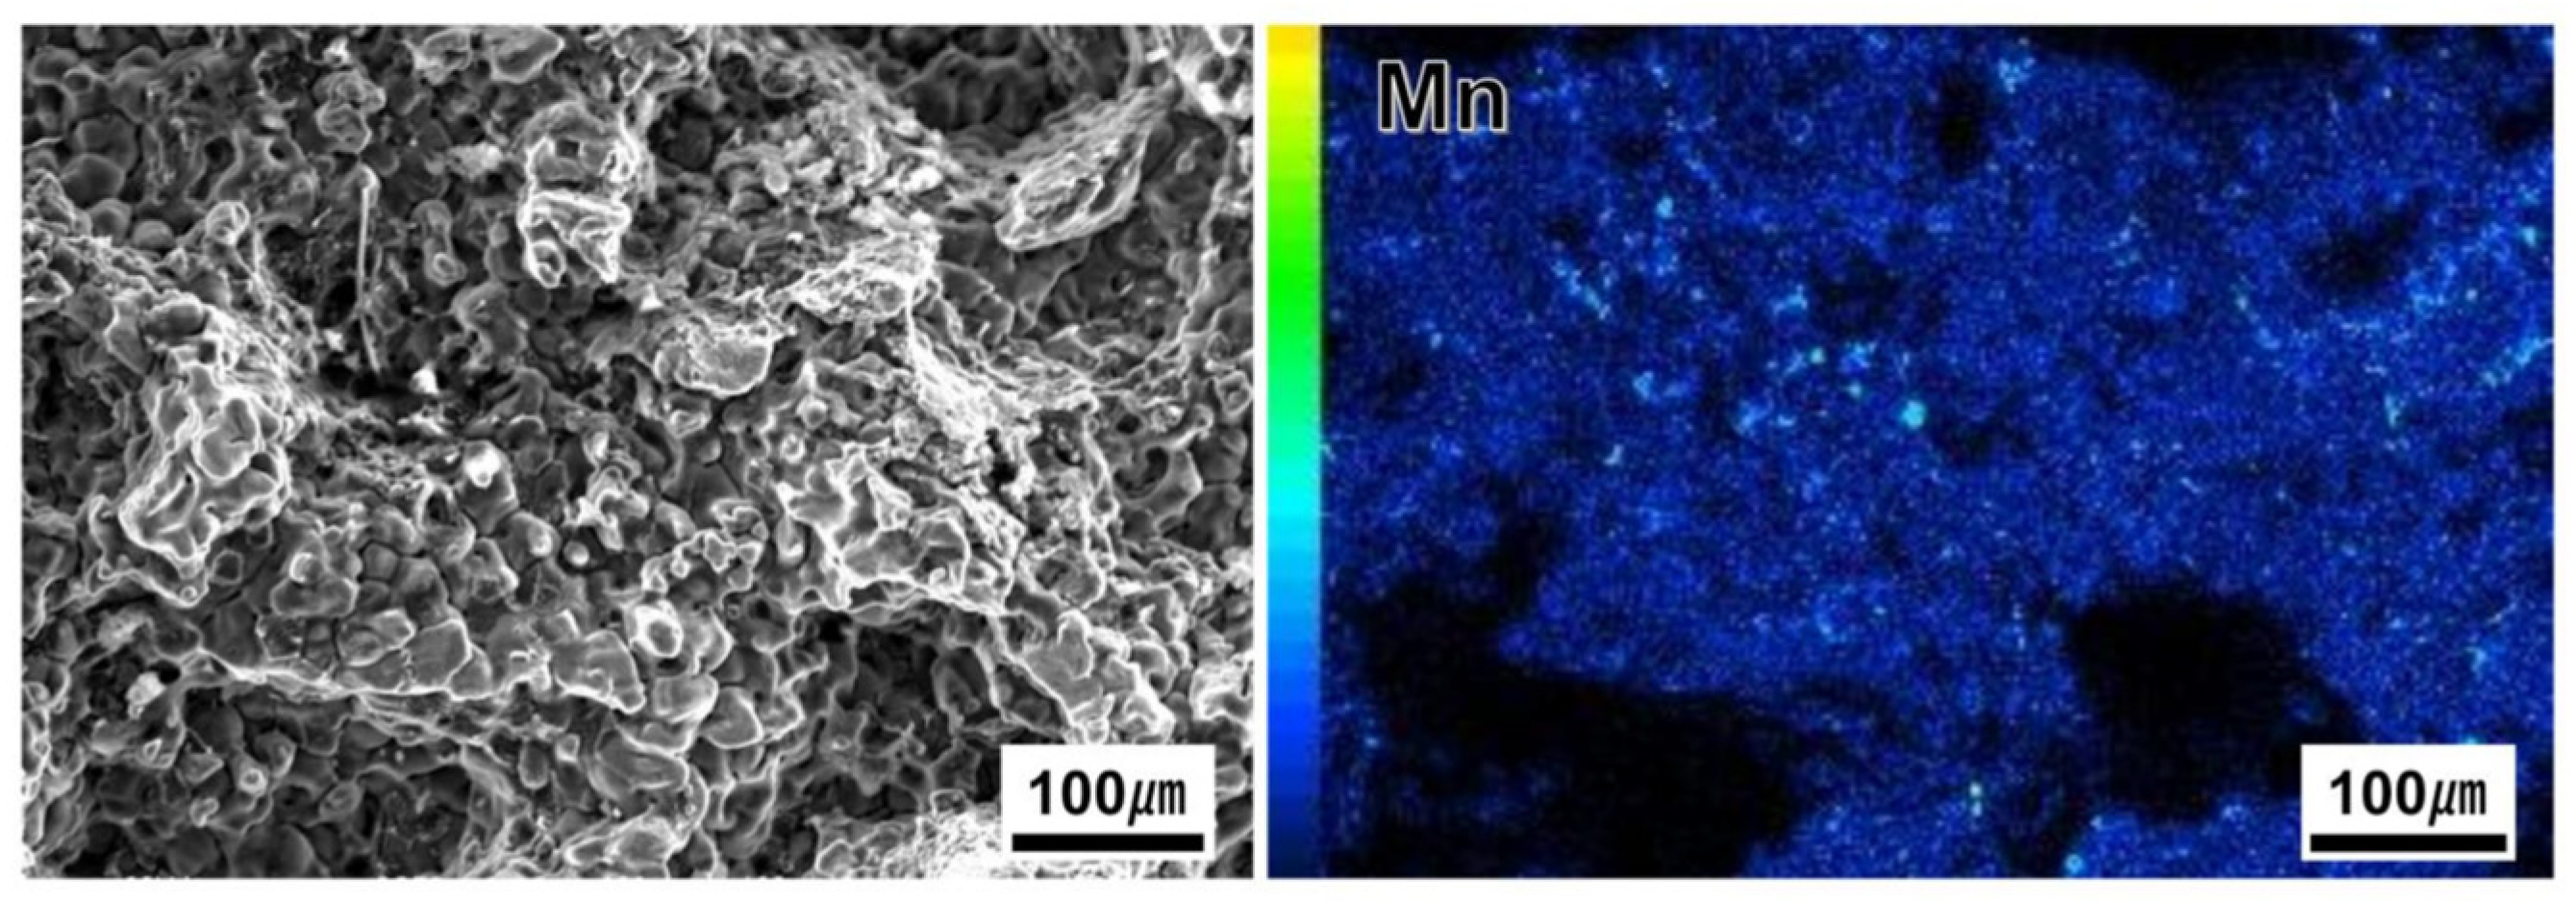

Disclaimer/Publisher’s Note: The statements, opinions and data contained in all publications are solely those of the individual author(s) and contributor(s) and not of MDPI and/or the editor(s). MDPI and/or the editor(s) disclaim responsibility for any injury to people or property resulting from any ideas, methods, instructions or products referred to in the content. |
© 2026 by the authors. Licensee MDPI, Basel, Switzerland. This article is an open access article distributed under the terms and conditions of the Creative Commons Attribution (CC BY) license.