


Abstract
This paper presents work on the green synthesis of the graphene quantum dots (GQDs) and carbon dots (CDs) from leaves of Erythrina caffra (E. caffra) using a simple technique to facilitate the carbonization process, from methanol and water extracts of E. caffra leaf, and their evaluation as potential antiviral agents against SARS-CoV-2. Phytochemical profiling of E. caffra leaf extracts exhibited the presence of phenols, alkaloids, steroids/terpenoids, tannins, and flavonoids. FTIR analysis confirmed the incorporation of oxygenated functional groups inherited from the phytochemicals. UV-Vis indicated the presence of secondary metabolites in both extracts and CDs. X-ray diffraction spectra confirmed the amorphous and crystalline nature of synthesized CDs (2.51 nm) from water extracts and GQDs (0.08 nm) from methanol extracts. The CDs and GQDs exhibited respective sizes of 5.5 and 4.0 nm, with a dot-like morphology, and respective zeta potential of +200.0 and −12.6 mV. The results revealed that all extracts and carbon dot formulations exhibited high cell viability (>90%), indicating excellent biocompatibility and minimal cytotoxicity at the tested concentration of 100 mg/mL per sample. The SARS-CoV-2 experiments demonstrated that extracts (MeOH, H2O) and nanomaterials (CDs-H2O, GQDs-MeOH) exhibited a virus suppression efficacy of 87.86 ± 4.75%, 87.95 ± 0.77%, 87.95 ± 3.08%, and 94.84 ± 0.94%, respectively. All examined samples demonstrated viral inhibition over 88%. Both extracts and their respective nanomaterials showed that a minimum of 5 μg was required to achieve 50% antioxidant species per sample. The study highlights E. caffra as a sustainable precursor for eco-friendly carbon dot synthesis as potential antiviral and antioxidant candidates.
1. Introduction
Severe Acute Respiratory Syndrome Coronavirus 2 (SARS-CoV-2) continues to cause significant morbidity, mortality, and socioeconomic disruption, thus representing a major global health concern [1,2]. The long-term efficacy of current Coronavirus Disease 2019 (COVID-19) treatment options remains limited by the emergence of resistant viral variants and adverse drug reactions, despite the availability of various antiviral agents and vaccines [3,4,5]. The SARS-CoV-2 virion is composed of four main structural proteins: Spike (S), membrane (M), envelope (E), and nucleocapsid (N) proteins [3,4,5,6]. Each of the proteins plays a significant role in viral replication [6]. The M protein is regarded as the organizer of the coronavirus assembly [7]. The key role of this M protein is to coordinate the assembly of the virus and determine the overall shape of the viral envelope by interacting with other structural proteins, such as S, E, and N protease [3].
The viral assembly and budding are mediated by the E protein [4,8], while the N protein is a phosphoprotein that protects the viral genome and is involved in viral RNA transcription, replication, and packaging the genome into new virions [5]. The S protein is a heavily glycosylated homotrimer that is conformationally flexible and plays the role of receptor-binding domain when infecting the host [5], via the S1 subunit by attaching to the host cells, which is an integral type I transmembrane protein with monocarboxypeptidase activity (ACE2) receptor, and the S2 subunit mediates fusion of the viral and cellular membrane, further enabling viral entry. Consequently, the search for alternative therapeutic strategies has intensified, with nanotechnology-based approaches showing considerable promise [9,10].
Graphene quantum dots (GQDs) [11] are a type of carbon dot (CD). They are distinguished by their ordered, graphene-like atomic structure, number of layers, and planar morphology, leading to quantum confinement effects stemming directly from their graphene lattice and their attractive properties for various applications, including high water solubility, low toxicity, photoluminescent properties, and ease of surface modification [12,13,14,15,16,17]. Carbon nanodots (CDs) are amorphous with diverse morphologies, possessing a carbon backbone with various functional groups attached to sp2/sp3 hybridized carbon atoms. The fluorescence can be attributed to either quantum confinement effects or surface defects [12,18,19]. Graphene quantum dots (GQDs), on the other hand, consist of islands of graphene-like structure, discoidal, or sheet-like morphology, and are composed of aromatic carbon, and their fluorescence is attributed to the lateral confinement within the graphene lattice [12,14,19,20]. High-surface-area and functional groups in carbon dots and GQDs improve reactivity, mechanical, and thermal robustness [12,19]. Their structure essentially determines their electrical, mechanical, optical, and chemical properties, opening a wide range of uses in nanotechnology, medicine, and energy [9,15,16,17].
Based on these qualities, they are good candidates for biological uses such as direct viral inhibition, biosensing, and antiviral medication administration [15]. A growing body of research has shown that GQDs and CDs made from natural plant sources can interact with viral proteins, inhibit replication, and strengthen host defenses [9,15,16,21]. Green synthesis techniques, which make use of renewable and ecologically friendly precursors, are known as sustainable methods for creating nanomaterials [15]. Plants provide excellent carbon sources, due to their profusion of bioactive substances, such as phenolics, flavonoids, and alkaloids, which can support the functionalization and biological activity of the resultant CDs [15]. As previously mentioned, carbon dots are prepared in this study by using leaves of E. caffra, a medicinal plant from South Africa. E. caffra is particularly chosen as no previous study has reported on this plant with respect to green synthesis of carbon dots. E. caffra is a native species in southern Africa that is known for its antibacterial and anti-inflammatory properties [22].
The aim of the study was to synthesize carbon dots (CDs) from E. caffra extracts using a heating method to induce the carbonization process and evaluate their antiviral properties against the SARS-CoV-2 papain-like protease (PLpro) [23].
2. Materials and Methods
2.1. Materials
Distilled water (Lasec purite select fusion, Serial No 33386), methanol (RLS Chemicals 99.5% AR, Lot No RLS-23137, and CAS No 67-56-1), ethanol (RLS Chemicals 99.9% AR, Lot No RLS EE0065/23, and CAS No 64-17-5), and quinine sulfate (Sigma Aldrich, Johannesburg, SA) (W/W) ≥90–≤ 100%, and CAS No 207671-44-1) were used. E. caffra leaves were sampled from the garden located at Sefako Makgatho Health Science University, PTA, SA. The BPS Bioscience kit (#79995-1), California, USA includes Recombinant Papain-like protease (2 µg, store −80 °C), PLPro Substrate (5 mM, 25 µL, −80 °C), PLPro Assay Buffer (25 mL, −20 °C), 10 mM GRL0617 (20 µL, stored at −80 °C), 0.5 M DTT (200 µL, −20 °C), black low-binding plate, and sealer. The HepG2 cells used in this study were obtained from the ATCC (American Type Culture Collection, Rockville, MD, USA). Cells were cultured in T75 cm2 tissue culture flasks using Dulbecco’s Modified Eagle Medium (DHEM) (ThermoFisher Scientific, Waltham, MA, USA) supplemented with 5% fetal Calf Serum (FCS) (Sigma-Aldrich, St. Louis, MO, USA) and 1% antibiotics (amphotericin/penicillin/streptomycin) (Sigma Aldrich, St. Louis, MO, USA). These cells were cultured and maintained in sterile culture flasks at 37 °C with 5% CO2 in a Forma Scientific water-jacketed incubator (ThermoFisher Scientific, Waltham, MA, USA), which provided a humidified atmosphere. Once the cells reached confluence, they were rinsed with PBS (ThermoFisher Scientific, Watham, MA, USA), treated with TrypLE Express solution (ThermoFisher Scientific, Watham, MA, USA), and subsequently added. A total of 0.1% trypan blue (ThermoFisher Scientific, Waltham, MA, USA) and a hemocytometer (Neubauer chamber) (ThermoFisher Scientific, Waltham, MA, USA) was used to count viable cells.
2.2. Equipment
The UV-visible (UV-vis) spectra were obtained from an Agilent Cary 60 (Agilent Technologies, California, USA) spectrophotometer equipped with an Xe lamp as a light source and a silicon diode detector. The UV-vis transmittance spectra were obtained in the spectral region of 200–800 nm. The spectra were obtained by dissolving 1 mg (extracts or nanomaterials) in 2 mL of dimethyl sulfoxide (DMSO) solvent. The pure DMSO was used as a reference spectrum in order to perform 100% transmittance correction. To operate the spectrophotometer and process data, the Cary WinUV software version 5 was used. The absorbance (A) was obtained from transmittance (T) using the A = log(1/T) expression.
The fluorescence spectra were obtained from a FluoroMax-4 (Horiba Scientific, New Jersey, USA) spectrofluorometer. The Xe arc lamp was used as an excitation source. The excitation wavelength was 325 nm. The detector was a Photomultiplier Tube (PMT). The fluorescence spectra were obtained in 90° geometry. The slit width was 5 nm. To operate the spectrofluorometer, the FluoroEssence V3.3 software was used.
The IR absorbance spectra were obtained from an FTIR spectrometer Agilent Carry 630 (Agilent Technologies, California, USA) equipped with a deuterated triglycine sulfate (DTGS) detector and an attenuated total reflectance (ATR) accessory. To operate the spectrophotometer and process data, Agilent MicroLab Software version 5.8 were used. The ATR crystal was diamond. Spectra were obtained in the 650–4000 cm−1 spectral region with 2 cm−1 resolution.
The size distribution, poly-dispersive index (PDI), surface charge, and zeta potentials were investigated using the Dynamic Light Scattering (DLS) technique with the particle size analyzer Nanotrac wave II (Microtrac MRB, Microtrac FLEX 11 Software, Osaka, Japan). The samples were dissolved in H2O with a refractive index of 1.333 at a temperature of 25 °C.
The structure of the samples was studied using powder X-ray diffraction techniques with a diffractometer D2 phaser (Bruker, California, USA) equipped with a SSD160_2 (ID mode) detector, with the radiation source of Cu-Kα (λ = 1.5405 Å). The X-rays’ accelerating voltage was 30 kV with 10 mA current. The diffraction was analyzed within the 5–100° 2θ region. The data acquision and processing was conducted with Bruker DIFFRAC.SUITE and DIFFRAC.EVA software version 6.
Morphology and size of samples were determined with Transmission Electron Microscopy (TEM) JEOL JEM-2100F (Japan Electron Optics Laboratory Ltd., Tokyo, Japan). The accelerating electron voltage was 200 kV with a beam valve emission current of 149 µA. Particle diameters were measured from TEM microphotographs using Image J software version 1.5×. In each case, more than 50 particles per sample were measured.
The GloMax Explorer (Promega, Madison, USA) was used to measure bioluminescence and chemiluminescence in SARS-CoV-2. GloMax Explorer System Software version 4.2 to operate and analyze data, typically running on an integrated Windows-based tablet. The excitation wavelength was 365 nm. The emission was detected in the range of 415–445 nm using a PMT detector operating in the spectral range of 300–600 nm. Fluorescence for the resazurin assay was detected using an automated FLUOstar OPTIMA plate reader (BMG Technologies, Offenburg, Germany) with excitation of 544 nm and emission of 590 nm.
2.3. Extraction
The dry leaves of the E. caffra were milled to obtain 50 g of fine powder that was sequentially extracted for 24 h using 1 L each of both methanol and water to afford MeOH and H2O filtrates, respectively. The filtrates were then filtered using a funnel and Whatman filter paper to yield MeOH and H2O filtrates. The water filtrate was then frozen and freeze-dried to remove all the water and obtain the H2O (4 g, 7%) extract [24]. The methanol filtrate was evaporated under reduced pressure using a rotary evaporator to afford the MeOH (16 g, 32%) extract [24]. The two extracts were stored at 4 °C until further use.
2.4. Phytochemical Screening
The phytochemical screening of the various leaf extracts produced from E. caffra was conducted using conventional qualitative procedures derived from the literature [25,26,27,28,29,30]. For each test, 1 mg of dried plant extract was weighed and placed into six independent test tubes. In each test tube, 1 mL of either methanol or water solvent was added relative to the extract. The solutions were agitated thoroughly to ensure complete dissolution, and appropriate phytochemical reagents were added. The method was repeated three times for each phytochemical test.
2.4.1. Alkaloids Detection
Two common tests, Mayer’s test and Wagner’s test, were employed to detect the presence of alkaloids in a crude extract.
- Mayer’s Test:To perform Mayer’s test, 1 mL of Mayer’s solution (prepared with 1.36 g mercuric acid and 5 g potassium iodide in 100 mL of distilled water) was added to test tubes containing the crude extract and solvent. The absence of a creamy white precipitate indicated that no alkaloids were detected by this method [25].
- Wagner’s Test:For Wagner’s test, Wagner’s solution was prepared by dissolving 2 g of iodine and 6 g of potassium iodide in 100 mL of distilled water. This solution was then added to each test tube. The appearance of a reddish-brown precipitate confirmed the presence of alkaloids using Wagner’s test [25,26].
2.4.2. Detection of Tannins
The presence of tannins in plant extracts was determined using a ferric chloride test. This involved adding 1 mL of a 10% ferric chloride solution to test tubes containing the extracts. A positive result, indicating the presence of tannins, was observed as a change in coloration to either blue-black or brownish-green upon the addition of ferric chloride (FeCl3) [27,28].
2.4.3. Detection of Phenols
To detect phenol compounds, the ferric chloride test was employed. The test involved adding a few drops of a neutral 5% ferric chloride solution to 1 mL of the crude extract in a test tube. The appearance of a dark green color served as an indicator of the presence of phenol compounds [27,28].
2.4.4. Detection of Flavonoids
According to Bankole et al., a pink-red or red coloration upon addition of magnesium and hydrochloric acid to the extract indicates a positive result for flavonoids [29]. Shinoda test: Pieces of magnesium crystals were added to each test tube, followed by 1 mL of concentrated hydrochloric acid, and color change was observed.
2.4.5. Detection of Steroids/Terpenoids
Salkowski’s test was performed to identify the presence of steroids or terpenoids. The procedure involved adding 1 mL of chloroform to a sample and mixing it thoroughly. Subsequently, 1 mL of concentrated sulfuric acid (H2SO4) was carefully introduced down the side of the test tube [30,31]. A reddish-brown color at the interface between the two liquid layers confirmed the presence of steroids/terpenoids [32].
2.5. Synthesis of Carbon Nanomaterials
Carbon nanomaterials (GQDs, CDs) were synthesized with slight modification using a reported method in the literature [33,34,35]. Briefly, 50 mg of the methanol crude plant extract was melted on a hot plate with continuous stirring at 200 °C for 30 min. This was followed by continuous addition of 1 mL of MeOH or H2O for 30 min to the respective plant extracts [33,34,35]. Thereafter, 30 mL of methanol or water was added to their respective vials and then transferred to centrifuge vials for 15 min at 40 rpm to remove all the plant extracts that did not form GQDs or CDs.
2.6. Physicochemical Characteristics
2.6.1. Fluorescence Quantum Yields ()
Fluorescence quantum yields for the green quantum dots were assessed in both water and methanol through comparative techniques outlined in previous studies [36,37]. Quinine sulfate, with a of 0.546, served as the standard when excited at the absorption wavelength of GQDs. The refractive indices of the solvents were accounted for using the following Equation (1):
where and represent the refractive indices for GQDs and the standards, respectively. and denote the areas under the fluorescence curves for both the sample and standard. Meanwhile, and refer to the fluorescence quantum yields of the sample and standard, respectively [37]. Lastly, and are the absorbance values for both the sample (GQDs and CDs) and standard at their respective excitation wavelengths 275 and 410 nm.
2.6.2. Powder X-Ray Diffraction
The chemical and molecular structure of both the extracts and their corresponding nanomaterials was analyzed. X-ray diffraction patterns were recorded across an angular range of 5 to 90 degrees. The system employed a Cu/Ka radiation source with a wavelength of 0.154 nm, operating at 10 mA with an accelerating voltage of 30 kV. The principal diffraction peaks were integrated, and these were used to determine the crystalline index (CI%) of the samples, calculated using Equation (2):
where Ic (a.u.) and Ia (a.u.) represent the integrated intensities of crystalline and amorphous regions, respectively.
The Scherrer equation was used to calculate the crystal size, D (nm) at (200) plane for both CDs and GQDs using Equation (3), following previous studies [18]:
where D is the crystal size, K is the correction factor assigned a value of 0.9, λ is the radiation wavelength, is the diffraction angle in radians, and is the corrected angular width at the half maximum intensity in radians.
Bragg’s equation was used to calculate interlayer spacing using Equation (4) at the highest peak intensity of CDs and GQDs [38,39]:
where is the order of diffraction, which is a positive integer. Wavelength (λ) of the incident Cu Kα X-ray radiation of approximately 1.54184 Å, the interlayer spacing (d spacing), represents the distance between successive parallel planes of atoms in the crystal lattice, and θ is the angle of incidence [39]. Theoretical fit was processed with the GaussAmp function, as shown in Supplementary Data S1(a,b).
2.7. Pharmacological Characteristics
2.7.1. Antioxidant
The DPPH (2,2-diphenyl-1-picrylhydrazyl) antioxidant assay was used to evaluate the free radical scavenging activity of samples following a previous method [40,41], quantified by measuring the decrease in absorbance [42,43,44,45]. Briefly, reagents were prepared by making a stock solution of DPPH (1 mg) in DMSO (50 mL). Sample solutions were prepared by dissolving 1 mg of the test samples in 1 mL DMSO. A mixture composed of a 1:1 ratio of DPPH and test sample solution was monitored with a UV-Vis spectrometer at 517 nm for a duration of 5 min per sample at 1 min interval [43,46].
The percentage of DPPH scavenging activity was calculated using Equation (5):
where is the absorbance of the DPPH solution without the sample, and is the absorbance of the DPPH solution with the test sample [46]. The percentage of DPPH radical scavenging activity is calculated using Equation (5), following previous studies [46,47]. The IC50 value, representing the concentration of the sample required to scavenge 50% of the DPPH radicals, can be determined from the dose–response curve [47].
2.7.2. Toxicity
Human liver hepatocellular carcinoma (HepG2) cell lines were chosen to evaluate the toxicological effects of extracts and nanoparticles on cells. Cell viability was determined using the Alamar Blue (resazurin) assay with minor modifications [48]. Cells were treated with 10 µL of the respective samples and incubated for 24 h at 37 °C in a humidified atmosphere containing 5% CO2 in a Forma Scientific water-jacketed incubator (ThermoFisher Scientific, Waltham, MA, USA). After incubation, 11.1 µL of 2% resazurin solution was added to both treated and control wells, and the plates were further incubated for 3 h. Following incubation, fluorescence was measured using an automated FLUOstar OPTIMA plate reader (BMG Technologies, Offenburg, Germany) at an excitation of 544 nm and emission of 590 nm [48].
The percentage cell viability was calculated using the following Equation (6):
2.7.3. SARS-CoV-2 Papain-like Protease (PLpro) Enzyme Assay
Papain-like protease assay using fluorescence resonance energy transfer (FRET) was used to measure the ability of plant extracts and respective QDs to inhibit the SARS-CoV-2 PLpro as previously described [49,50,51,52]. Briefly, 1 mM dithiothreitol (DTT) was prepared by adding 20 µL of 0.5 M DTT stock solution to 10 mL of PLpro assay buffer. The PLpro enzyme (0.7 ng) was diluted in 1 mM DTT solution, and 30 µL was transferred to 96-well plates for test samples, positive and inhibitor controls; with the exception three wells, in which 30 µL of 1 mM assay buffer was added and referred to as the blank. A positive control (500 µM) was prepared from 10 µL of a known PLpro inhibitor (GRL0617). The FRET-based protease assay was initiated by first incubating the 96-well plate for 30 min at 37 °C after combining a buffer with PLpro (9 ng). Meanwhile, 125 μM PLPro fluorogenic substrate was prepared from a 1:40 ratio of 5 mM PLpro substrate in 1 mM PLpro buffer solution. The 96-well plate was removed from the incubator, 10 µL of the PLpro substrate was added onto the plate, and it was further returned to the incubator for an additional 60 min. Protease percentage inhibition is calculated according to Equation (7):
where RFUsample is the average fluorescence of inhibitor-treated wells, and RFUnegative control is from enzyme-only wells without inhibitor [49]. This is determined following blank subtraction from triplicates for analysis [49].
3. Results and Discussion
3.1. Phytochemical Screening
Phytochemical screening was conducted on methanol (MeOH) and water (H2O) extracts derived from the E. caffra plant, utilizing various tests outlined in Table 1. For each test, controls were prepared using the respective extracts dissolved in their corresponding MeOH and H2O solvents. E. caffra extract of MeOH and H2O tested positive for alkaloids, flavonoids, tannins, steroids/terpenoids, and phenols. However, the H2O extract tested negative for flavonoids. Flavonoids are a diverse group of plant secondary metabolites, and they are more soluble in methanol than in water due to their chemical structure and the differing polarities of these solvents [53,54].
Table 1.
Phytochemical screening, observation, and images of MeOH and H2O E. caffra plant extracts.
Flavonoids generally exhibit low solubility in water because they have a limited capacity to form hydrogen bonds with the surrounding water molecules [53]. Many flavonoids possess hydrophobic ring structures, which inherently limit their solubility in highly aqueous (water-based) solutions [54]. The hydrophobic ring structures in flavonoids limit their solubility in highly aqueous (water-based) solutions [54]. Hence, the absence of flavonoids in the H2O extract.
3.2. UV-Vis Absorbance Spectroscopy
Figure 1 shows absorption bands at 250 nm, (280–300) nm, and 670 nm for the H2O extract and at 250 nm, 420 nm, 450 nm, and 670 nm for the E. caffra MeOH extract. The 670 nm absorption bands in Figure 1a,b show the E. caffra methanol extract and its corresponding GQDs. Nevertheless, there was no absorption in the same area for the water extract and the corresponding CDs in Figure 1c,d. Chlorophylls, which are insoluble in water and usually absorb in the 650–700 nm range [55], are characterized by this peak. Chlorophyll, along with other phytochemicals such as tannins, flavonoids, and phenols, was found in the methanol extract, which added to the absorbance profile required for green nanomaterial fabrication. Other plant extracts, such as Erythrina sacleuxii, have shown distinct absorption maxima at 262 and 290 nm, which is characteristic of phenolic and flavonoid skeletons [56]. Tannins and chlorophylls have been reported to absorb around 640 and 650–700 nm [55]. A broad absorption peak at 530 nm was reported in Erythrina crista-galli and attributed to anthocyanins [55,57,58,59]. Clear alterations in absorption patterns are visible in the UV-Vis spectra of E. caffra extracts and carbon nanomaterials. Nanomaterials: these shifts correspond to the establishment of surface functional states and the change in molecular composition during carbonization. The MeOH extract in Figure 1b shows considerable absorption, a characteristic of π–π* transitions from conjugated aromatic systems, mainly in the UV area below ~300 nm. Increased absorbance at ~280–320 nm appears upon conversion to GQDs, which is compatible with additional n–π* transitions that are caused by carbonyl (C=O) or imine (C=N) groups on the surface. Strong deep-UV absorption bands (~220–260 nm) with tails into higher UV are also visible in the H2O extracts, as shown in Figure 1c, indicating the presence of many phenolic/flavonoid moieties. Prominent features and shoulders below 300 nm in Figure 1d with a broad absorption suggest novel surface states and functional groups from carbonization. In other studies, on plant-derived CDs, the formation of π-π* transitions (~250–300 nm) and n-π* transitions (usually ~320–350 nm) has been attributed to aromatic/sp2 domains and surface groups that contain either nitrogen or oxygen, respectively (e.g., in edible mushroom CDs showing peaks around 280 and 320 nm) [60]. Hence, the peak broadening observed in the UV spectra is associated with aromatic structures of CDs.
Figure 1.
Absorption spectrum of extracts from (200–700) nm for: (a) MeOH, (b) GQDs-MeOH, (c) extract H2O, and (d) CDs-H2O.
3.3. Fluorescence
When excited at 325 nm, both carbon nanomaterials exhibited emissions that varied in color, as illustrated in the inserted images of Figure 2. Specifically, a red emission color was observed for GQDs-methanol (GQDs-MeOH) in Figure 2a, while Carbon Dots-water (CDs-H2O) displayed a pale yellow emission in Figure 2b. Upon excitation of these carbon nanomaterials at their respective absorption maxima, emission was detected at 486 nm for GQDs-MeOH and 473 nm for CDs-H2O. The red emission color correlates with the presence of chlorophyll a pigment according to the UV-Vis absorbance spectroscopy (see Figure 1a,b). The red emission originates from chlorophyll moieties that become integrated into the carbogenic core during synthesis [61]. The calculated emission efficiencies for these nanomaterials were 19% and 7%, respectively. The red emission color correlates with the presence of the chlorophyll a pigment according to the UV-Vis absorbance spectroscopy (see Figure 1a,b). Green carbon-based quantum dots of different fluorescent quantum yields have been previously reported from various plant leaves, such as Aloe vera, pineapple, and orange [62]. However, these nanomaterials are synthesized for the first time in this study using E. caffra leaf extracts, and the MeOH extracts generated more photostable GQDs with high fluorescence efficiencies compared to CDs from the H2O extract. Fluorescence efficiencies in GQDs have been reported to be higher than those of CDs because both carbon-based nanomaterials have different structural characteristics [9,12,14,18,19]. Hence, the fluorescence quantum yields in GQDs are due to the lateral confinement within the graphene lattice, compared to surface defect quantum confinement in CDs.
Figure 2.
Fluorescent image of GQDs when excited at 410 and 275 nm: (a) GQDs-MeOH and (b) CDs-H2O.
3.4. Fourier Transform Infrared Spectroscopy (FTIR)
Figure 3a–d show the absorption bands for the H2O extract, CDs-H2O, MeOH extract, and GQDs-MeOH. Functional groups of corresponding nanoparticles and extracts at FTIR frequencies (C–N) 1052.56 cm−1, (C–O) 1234.61 cm−1, (C=O) 1737.87 cm−1, and (C–H) 2919.68 cm−1 are shown in Figure 3. Peak broadening and shifting of C=C at 1594,94 cm−1 in H2O extracts compared to a narrow, split (C=C; 1631.54, 1529.26 cm−1), and enhanced (C–N, 1234.61 cm−1) CDs-H2O are shown in Figure 3a,b. However, Figure 3c,d show that GQDs-MeOH exhibit comparable peak increase (C=O, 1737.87 cm−1), shift (C=C, 1607.14 cm−1), split (C–C, 1453.25, 1355.66 cm−1), and broadening (C–O, 1052.56 cm−1) as the corresponding MeOH extracts; this further confirms the chemical alteration.
Figure 3.
FTIR spectra of (a) H2O extract, (b) CDs-H2O, (c) MeOH extract, and (d) GQDs-MeOH.
The absence of peak shift may result from functional group inheritance, effective surface passivation, and a steady chemical environment. This study validates that the synthesized CDs and GQDs “inherited” their surface chemistry directly from the phytochemicals found in the E. caffra leaves. In the process of heating, the plant metabolites (phenolics, alkaloids, and terpenoids) serve as both the carbon precursor and the agents that cap and stabilize the carbon. The plant metabolites stay on the surface of the nanoparticles as a passivation layer, and they keep the same vibrational frequencies that they had in the original extract [63,64].
The continuity of these peaks signifies that the chemical environment of the functional groups did not experience substantial structural alterations after carbonization C–H (2919.68 cm−1): The aliphatic chain lengths from terpenoids are predominantly unaffected by core carbonization, indicating their presence on the outside shell of the nanoparticles [65]. In the green synthesis of nanoparticles from plant extracts such as E. caffra, the preservation of aliphatic chain lengths from terpenoids is a critical indicator of the material’s core–shell structure [66]. During the carbonization process, the phytochemicals experience selective change, with reactive functional groups forming the core and stable aliphatic segments remaining on the surface [62]. The consistency of the carbonyl peak at C=O (1737.87 cm−1) verifies the presence of oxygenated moieties (such as esters or ketones), which are crucial for the elevated water solubility and biocompatibility of CDs–H2O [63]. The absence of a change in the C–N bond suggests that nitrogen-containing groups from the alkaloids were effectively integrated into the nanoparticle surface without substantial alteration of bond length [65]. In green synthesis, precursor molecules typically envelop the resultant carbon core via non-covalent interactions or slight structural modifications. This produces “common functional groups” between the extract and the nanoparticles, resulting in nearly identical FTIR fingerprints [58]. Comparable findings have been shown in other green synthesis investigations, wherein the peaks for hydroxyl, carbonyl, and aromatic groups in the plant matrix closely correspond to those on the surface of the resultant quantum dots [63,65]. The continuity of these peaks signifies that the chemical environment of the functional groups did not experience substantial structural alterations after carbonization.
In the context of green synthesis, the emergence, disappearance, or shifting of FTIR peaks between plant extracts and their corresponding nanoparticles (CDs–H2O and GQDs–MeOH) provides direct evidence of the biochemical transformation and surface functionalization occurring during synthesis. Significant shifts in the absorption bands of extracts and respective nanomaterials shown in Table 2 are a diagnostic indicator that the phytochemicals in the plant extract were actively involved in the reduction and stabilization of the nanoparticles [65].
Table 2.
Functional group, FTIR frequency, vibration, and phytochemical characteristics per sample.
A shift indicates a change in the chemical environment or bond energy of the functional group. In green synthesis, this typically signifies that the phytochemicals (like phenolics) are binding to the nanoparticle surface to act as capping agents, which prevents particle aggregation and ensures colloidal stability [65]. Disappearance of specific peaks from the E. caffra extract indicates that those functional groups were consumed or chemically modified during the reaction process [65]. For example, the loss of certain O–H or specific C–O signals may reflect the dehydration or oxidation of plant metabolites, as they provide the electrons necessary to reduce metal ions or as they undergo thermal decomposition to form the carbon core [65].
The appearance of new peaks—specifically related to C=C and C–C groups—indicates that these functional groups were formed during the synthesis and were not present in the original plant material [65]. The emergence of aromatic C=C stretching is a hallmark of successful carbonization, signifying the development of the sp2 hybridized carbon network that constitutes the core of CDs and GQDs [63]. Emergent peaks can also represent new surface functionalities created during the microwave-assisted or thermal process, which contribute to the nanoparticles’ unique optical and biological properties [65]. Therefore, peak shift indicates reduction and surface capping [65]. Meanwhile, peak disappearance can be associated with the consumption or decomposition of precursor metabolites [65]. Peak emergence is associated with the formation of the graphitic carbon core and new chemical bonds [63,65]. Thus, spectroscopic changes confirm that the synthesis process successfully restructured the E. caffra metabolites into functionalized nanomaterials that retain specific “inherited” groups while developing new structural characteristics essential for their intended applications.
The water extract in Table 2 shows that functional groups (C–N, C–H, and O–H) indicate a rich diversity of alkaloids, terpenoids, and phenolics [65,67]. These groups are essential for the biochemical properties of the extract, as they provide the necessary surface chemistry for potential interactions with biological targets or the stabilization of synthesized nanomaterials [65,68]. The peak assignment is supported by the identification of aromatic material. The C–N groups at 1392.25 cm−1 in the H2O extract originate from alkaloids that contain secondary metabolites often present in Erythrina species and other medicinal plant extracts used for nanoparticle stabilization [65].
The 1619 cm−1 peak reflects a complex mixture of aromatic metabolites (alkaloids/phenols) via C=C ring stretching [68]. These nitrogen- and oxygen-containing functional groups are essential for the biological activity of the extract and serve as the chemical interface for subsequent green synthesis applications [65].
Absorption bands in the 1200–1250 cm−1 range are characteristic of C–O stretching vibrations in esters, ethers, and carboxylic acids [69,70]. This aligns with phytochemical findings of phenols and tannins in the [69] E. caffra matrix. This wavenumber also corresponds to the in-plane bending of O–H groups [71]. Given that Erythrina species are rich in polyphenols, this peak reflects the high concentration of hydroxylated aromatic rings. In medicinal plant extracts, this region is frequently assigned to C–N stretching from aliphatic amines [69,70]. This supports the presence of alkaloids, which were positively identified in our phytochemical screening for both water and methanol extracts.
The persistence of these peaks indicates that the chemical environment of the functional groups did not undergo fundamental structural changes during carbonization. The C–H (2919.68 cm−1) is an aliphatic stretch from terpenoids that remain largely unaffected by the core carbonization, suggesting they reside on the outer shell of the nanoparticles [65]. The stability of this carbonyl peak C=O (1737.87 cm−1) confirms the retention of oxygenated moieties (like esters or ketones), which are essential for the high water solubility and biocompatibility of our CDs–H2O [63,72].
3.5. Powder X-Ray Diffraction (PXRD)
Crystallographic peaks in Figure 4a–d were observed at (22, 24, 29, 41, 51)°, (22, 24)°, (22, 24, 29, 41, 51)°, and (22, 24, 29, 41, 51)° and were assigned Miller indices of (002), (002), (100), and (102) for extract H2O, GQDs H2O, extract MeOH, and GQDs MeOH. The H2O extract showed 100% amorphous nature in Table 3, with only 5% of the defects in the MeOH extract. The CDs and GQDs are both types of fluorescent carbon nanomaterials, but they possess distinct structural and optical characteristics. The primary differences arise from their structural makeup, which influences their size, crystallinity, interlayer spacing, and fluorescence quantum yield [12,13,14]. The CDs-H2O sample retained the 100% amorphous nature of its parent extract, exhibiting no crystallinity. Sharp, narrow peaks in the PXRD pattern illustrated in Figure 4a contradict the 100% amorphous crystallinity percentage presented in Table 3. This discrepancy typically originates from the characteristics of the sample. In green synthesis utilizing E. caffra, a composite material comprising nanoparticles embedded within a polymeric protein–phytochemical matrix is created [73]. Crystalline impurities are characterized by “sharp, narrow peaks” derived from the minerals in plant extract [74], since they constitute a minimal mass fraction relative to the bulk amorphous plant extract matrix [75]. However, the GQDs-MeOH sample achieved 100% crystallinity. This indicates that the phytoconstituents in the MeOH extract acted as superior carbon precursors, facilitating a synthesis pathway that favored the assembly of a highly ordered, crystalline nanomaterial. A more pronounced sharp peak around 22° 2θ was observed for GQDs compared to both extracts (illustrated with a blue vertical line). The increased peak intensities at 22° in both CDs H2O and GQDs MeOH can be associated with the presence of interlayered amorphous carbon. Consistent with its amorphous nature shown in Table 2, the CDs-H2O presented a broad peak from around 20°, while the GQDs-MeOH did not exhibit such broadening. The slight contraction observed in the synthesized GQDs is a common phenomenon in such nanomaterials and is frequently attributed to the introduction of oxygen-functional groups and lattice strain [76,77]. The interlayer spacing (d-spacing) of CDs (4.07 nm) and GQDs (4.06 nm) is higher than the typical graphitic interlayer spacing of 0.335 nm. Depending on the specific precursor and synthesis conditions, the interlayer spacing of GQDs and CDs synthesized from plant extract precursors typically ranges from 0.32 nm to 0.40 nm [14,78]. This value is typically marginally greater than the d-spacing of bulk graphite (0.335 nm), which is frequently attributed to the presence of oxygen-containing functional groups and a lower degree of crystallinity [12,78]. The higher values of d spacing in both nanoparticles result from the intercalation of oxygen-functional groups (confirmed by FTIR in Figure 3) and other structural defects between the graphitic interlayers.
Figure 4.
PXRD results for (a) H2O extract, (b) CDs-H2O, (c) MeOH extract, and (d) GQDs-MeOH.
Table 3.
Characteristics of E. caffra’s H2O and MeOH extracts and green carbon nanomaterials.
Crystal sizes were calculated using Equation (3) of the diffraction peak (002) to yield 80.9 and 80.7 nm for GQDs and CDs.
3.6. Morphology and Size
The TEM microphotographs in Figure 5a show that the E. caffra H2O-derived carbon dots are uniformly distributed, spherical, and well-dispersed without signs of aggregation. The corresponding size distribution (Figure 5a) indicates a particle diameter of 4.0 ± 1.2 nm range. Figure 5b illustrates that the MeOH extract-derived GQDs are also mostly spherical and well-dispersed, but they exhibit larger sizes of 5.5 ± 1.5 nm with a PDI of 0.2, as shown in Table 2. Lattice fringes with d spacing of 0.08 nm on an insert in Figure 5c for GQDs-MeOH are indicative of the facet of graphite [79]. Both newly synthesized nanomaterials demonstrated relatively narrow, Gaussian-like size distributions, indicating good uniformity. The Shapiro–Wilk test was conducted on a nanoparticle population that is above 50 (n > 50) at 95% confidence interval; see attached Supplementary Data S2(a,b). The distribution of nanoparticles is statistically normal: p > 0.05. These observations are consistent with the literature stating that CDs derived from biomass or plant extracts typically display dot-like morphologies, good dispersibility, and sizes ranging from a few nanometers up to several tens of nanometers, depending on the precursor and the synthesis method [15,16,33,80,81,82]. Larger sizes observed in DLS measurements for CDs and GQDs are primarily due to the inclusion of the hydrodynamic layer (hydration shell) and the high sensitivity of DLS to particle aggregation [83,84,85]. In contrast, the projected size measured by TEM represents individual nanoparticles deposited on dried grids under vacuum [86,87]. Size variations from PXRD compared to TEM are attributed to the average value of a bulk sample representing a large population of crystallites, while TEM gives a direct image of an individual particle [88,89,90].
Figure 5.
(a): CDs-H2O; (b) GQDs-MeOH with size distributions; and (c) insert of GQDs-MeOH with d spacing.
3.7. Zeta Potential and Surface Charge
The zeta potential analysis in this study revealed contrasting surface charges among the E. caffra extracts and respective nanomaterials, highlighting the influence of solvent and carbonization on colloidal stability. Table 2 shows that the H2O extract exhibited a strongly negative charge of −63.6 mV, consistent with the presence of abundant anionic functional groups, whereas the methanol extract showed a positive surface charge (+49.8 mV), reflecting stabilization by cationic phytochemicals. The H2O-derived CDs displayed a remarkably high positive zeta potential of +200.0 mV, indicating substantial surface modification during carbonization, likely due to protonated nitrogen-containing groups, while the methanol-derived GQDs maintained a moderately positive charge.
Comparatively, these results indicate that carbonization significantly reduces particle size and alters surface charge, enhancing colloidal stability, while solvent choice during extraction influences both the initial zeta potential and particle size distribution. Overall, most samples exceeded the ±30 mV threshold for stability, demonstrating their potential for applications in biomedical fields [91,92], except for GQDs-MeOH with +12.6 mV. GQDs are generally considered to have low cytotoxicity but excellent biocompatibility [93,94]. A positive correlation between increased zeta potential and high toxicity has been reported in some CDs, but it is not a universal rule [95]. Negatively charged zeta potentials ranging from −44.1 to −9.7 mV were reported to have low toxicity [95]. And some positively charged CDs, ranging from +11.4 to +41.4 mV, reported high toxicity [95]. Negatively charged GQDs with zeta potentials of −15 ± 1.5 and −32 ± 4 mV have been reported to be very stable [96,97]. The most stable positively charged GQDs were reported at +26 ± 5 mV.
3.8. Quantitative Antioxidant: DPPH Scavenger Assay
Inserts in Figure 6(a1–d1) show that decreasing absorbance occurs as the DPPH radical reacts with antioxidants in the test sample. This decrease in DPPH over time could occur through two possible routes: hydrogen atom transfer or single electron transfer [98]. In a hydrogen transfer (dominant mechanism), the hydrogen atom from the test sample is donated to the DPPH radical, resulting in a reduced DPPH-H molecule and an antioxidant radical [99,100]. Meanwhile, in a single electron transfer, antioxidants donate a single electron to the DPPH radical to form a DPPH anion [99,100]. This anion then undergoes protonation from the solvent or another available species to form DPPH-H [43,100]. Furthermore, IC50 was calculated for the respective samples shown in Figure 6a–d with a change in percentage activity at concentrations (0.05, 1, 10, 100, and 1000) µg L−1. Both extracts and nanomaterials showed that a minimum concentration of 0.05 µg L−1 test samples is required to yield the respective 50% antioxidant activity.
Figure 6.
Antioxidant assay and absorbance inserts of (a) MeOH extract, (b) GQDs-MeOH, (c) H2O extract, and (d) GQDs-H2O. The red line is necessary to show the concentration that generates 50% antioxidant species.
3.9. Biosensing Applications: In Vitro Assays
3.9.1. Toxicity: Human Hepatoma: Resazurin Assay
The resazurin assay, often used with HepG2 cells (Human hepatoma), is a well-established method for evaluating cell viability, metabolic activity, and cytotoxicity of living cells [101]. Resazurin is a blue non-fluorescent dye that is actively taken up by metabolically active cells and reduced to resorufin, which is pink and highly fluorescent, as shown in Figure 7. Controls used in the assay are negative control (Uc): PBS, vehicle control 1: PBS: DMSO 0.01%, vehicle control 2: PBS: HCl: MeOH 0.01%, and positive control (Pc): 1% Triton X. The highest activity was observed with a color change to blue when Pc, compared to other controls, was applied to the cell lines. The tested samples are extract H2O, CDs H2O, extract MeOH, and GQDs-MeOH. The reduction in the dye acts as a biological sensor, with the color change or fluorescence intensity indicating the viability and metabolic state of the cell [102]. The cyto-sensors use living biological cells as sensing elements to detect changes caused by external stimuli, such as toxins [103]. Thus, providing insights into the physiological effects of analytes and serving as valuable tools for drug evaluation and toxicity detection, as shown in Figure 7.
Figure 7.
Resazurin assay on samples (extracts (A6, B6, C6, A7, B7, C7) and respective nanomaterials (A4, B4, C4, A5, B5, C5) and controls (Pc (C1–C3); Uc (A1, B1); DMSO (A1, B1); HCl (A1, B1)).
The resazurin assay on HepG2 cell lines in Figure 8 shows minimal toxicity, with percentages that are more than 90% for all the tested samples when compared to the blank control, which showed 100%. However, MeOH extract, H2O extract, MeOH GQDs, and CDs-H2O showed respective cell viabilities of 92.80, 97.78, 94.82, and 91.43% in HepG2 cell lines. However, Pc, extract MeOH, extract H2O, GQDs MeOH, and CDs-H2O showed respective cell viabilities of 3.39, 92.80, 97.78, 94.82, and 91.43% in HepG2 cell lines. The percentage cell viability of different treatments compared to controls in Figure 8 shows that DMSO (0.1%) maintained viability at ~100.78%, confirming the non-toxic effect of the solvent. HCl (0.01%) reduced viability to ~92.35%, indicating minimal toxicity, while both CDs-H2O (91.43%) and GQDs-MeOH (94.81%) also showed reductions in cell viability that were less than 5%, suggesting the low toxicity of these nanomaterials. The extracts of H2O and MeOH showed respective cell viabilities of 97.78 and 92.79%, implying good biocompatibility, and are typically considered acceptable for non-toxic classification [11]. All tested samples retained high cell viability (>90%), indicating that they are largely biocompatible with only minor differences in cytotoxicity across treatments. These findings align with previous studies reporting low cytotoxicity of GQDs and plant extracts at moderate concentrations, supporting their potential biomedical applications [104,105].
Figure 8.
Toxicity results of E. caffra synthesized nanoparticles and their extracts from water and methanol.
3.9.2. Viral Cytotoxicity: SARS-CoV-2 Papain-like Protease Assay
The RFU-based fluorescence protease assays in Figure 9 show enzyme inhibition percentages of more than 80% for all the tested inhibitors when compared to the positive control RFU-based fluorescence protease assays, which showed 100% inhibition. Test samples, such as extract MeOH, extract H2O, and CDs-H2O, respectively, showed percentage inhibitions of 87.86 ± 4.75, 87.95 ± 0.77, and 87.95 ± 3.08% relative to GQDs MeOH (94.84 ± 0.94%).
Figure 9.
Percentage inhibition of E. caffra-synthesized nanoparticles and their extracts from H2O and MeOH.
The papain-like protease (PLPro) in SARS-CoV-2 is an enzyme whose specific enzymatic activity is detected by biosensors. Protease cleaves polyprotein precursors at specific sites, resulting in functional viral proteins [106]. The use of a substrate in biosensing occurs by cleavage of the protease at a specific peptide sequence within a substrate, resulting in a measurable signal, such as fluorescence or luminescence, to enable screening of viable antiviral inhibitors [18,107]. The known inhibitor, used as a positive control, demonstrated superior inhibitory effects when compared to the experimental inhibitor samples. The reduced fluorescence occurs when the protease binds to the inhibitor (Figure 9) and reduces its ability to cleave the substrate due to fewer fluorophores separating from the quencher. Plant extracts have been reported to prevent viral replication, inhibiting the RNA-dependent RNA polymerase (RdRp) protein complex (specifically the non-structural proteins (NSP)12, NSP7, and NSP8 subunits), which is a critical enzyme required for the replication and transcription of the viral RNA genome [108]. An in silico study on Erythrina species previously reported that flavonoid phytochemicals are potential SARS-CoV-2 3CL pro inhibitors [109].
In this study, the absence of flavonoids in the H2O extract of E. caffra when compared to the MeOH extract did not show a significant inhibition difference. However, GQDs showed twice as much improvement in inhibition relative to both extracts and CDs synthesized from the H2O extract. Some CDs have been reported to target viral enzymes like 3CLpro [109]. However, GQDs have been reported to inhibit viral entry and replication by interfering with the binding of the virus to host cell receptors [110,111]. The top part (membrane (M), envelope (E), and interior of the spike protein in the receptor-binding domain) maintains a positive charge over a broad range of pH [112,113]. The negative charge predominates on the surface exposed to the ACE2 receptor, patches of the viral envelope, and some areas on the S protein stalk [112,114]. In this study, CDs showed the highest zeta potential compared to GQDs. However, GQDs showed the most antiviral characteristics and lower toxicity compared to CDs. Thus, GQDs with high colloidal stability in complex biological environments, where interactions with proteins and ions can alter surface charge, can be used in biomedical applications [97]. This increased viral inhibition in GQDs compared to CDs is attributed to a combination of electrostatic surface interactions, physicochemical characteristics of the test inhibitor between the nanomaterials (or test sample) and the coronavirus, and the characteristics of the test inhibitor. This study has shown E. caffra extracts and respective nanomaterials (especially GQDs-MeOH) as potential SARS-CoV-2 antiviral agents.
4. Conclusions
This study successfully demonstrated the green synthesis of CDs and GQDs from E. caffra plant extraction in H2O and MeOH solvents. Both extracts showed the presence of multiple phytochemicals. However, flavonoid was absent in the H2O extract compared to MeOH. The synthesis of CDs and GQDs from respective extracts resulted in nanomaterials with enhanced or modified physicochemical and biological potential. Phytochemical profiling of E. caffra leaf extracts showed five classes of secondary metabolites. These phytochemical studies revealed that this plant can be a potential starting material for green synthesis of the carbon dots and treatment of SARS-CoV-2 papain-like protease (PLpro). Both the extracts and synthesized nanomaterials possess antioxidant characteristics. Spectroscopic and TEM characterization confirmed that the green synthesized nanoparticles are well-dispersed, colloidally stable, and dot-like, with diameters in the (~4–6 nm) range. The surface charges and zeta potential indicate that the synthesized nanoparticles were colloidally stable. The presence of functional groups and structural characteristics of nanomaterials confirmed GQDs to be highly crystalline compared to CDs and both extracts. Water-derived samples exhibited higher surface oxidation and exceptional colloidal stability, while methanol-derived samples displayed more hydrocarbon functionalities but relatively lower stability after synthesis. Both extracts and respective nanomaterials had minimal toxicities against HePG2. Importantly, GQDs demonstrated superior antiviral activity against the SARS-CoV-2 main protease, supporting their potential as inexpensive, plant-based nanomaterials for therapeutic development. Overall, these findings provide valuable evidence that E. caffra can serve as a sustainable precursor for functional nanomaterials with biomedical relevance.
Supplementary Materials
The following supporting information can be downloaded at: https://www.mdpi.com/article/10.3390/ma19091841/s1.
Author Contributions
Conceptualization, D.M.; methodology, D.M. and R.M.; software, C.E.M., S.A.N. and X.S.N.; validation, R.M.; formal analysis, C.E.M., S.A.N., N.S., T.M. and R.M.; investigation, B.M.B., N.S.M., B.S.N., L.A.R., N.V. and R.M.; resources, C.E.M., R.M., S.A.N. and X.S.N.; software and data curation, R.M.; writing—original draft preparation, B.M.B., N.S.M., B.S.N., L.A.R., N.V., R.M. and X.S.N.; writing—review and editing, R.M., B.M.B., N.S.M., B.S.N., L.A.R., N.V., T.M., C.E.M., D.M., N.S. and X.S.N.; visualization, R.M.; supervision, R.M., D.M. and X.S.N.; project administration, R.M. All authors have read and agreed to the published version of the manuscript.
Funding
Prof Xavier Siwe Noundou wishes to express gratitude for the financial support received from several sources. These include a National Research Foundation Competitive Support for Unrated Researchers grant (Number: SRUG2203291031) and a grant from the 5th BRICS STI Framework Programme (BRICS JAF # 2021/305). Additionally, the research presented was made possible by funding from the South African Medical Research Council through its Research Capacity Development Initiative Programme, which was awarded to Xavier Siwe Noundou. It is important to note that the interpretations, views, and conclusions presented in this work are solely those of the researcher and do not necessarily reflect the official stance or opinions of the SAMRC. Appreciation is also extended to Sefako Makgatho Health Sciences University for providing open access funding.
Data Availability Statement
The original contributions presented in this study are included in the article/Supplementary Material. Further inquiries can be directed to the corresponding authors.
Acknowledgments
The National Research Foundation (NRF), BRICS STI Framework Programme, and the South African Medical Research Council (SAMRC) through its Division of Research Capacity Development under the Research Capacity Development Initiative (RCDI) are acknowledged for funding support.
Conflicts of Interest
Author Daniel Makanyane was employed by SMU at the time the study was conducted and is now employed by South African Nuclear Energy Corporation Ltd. The remaining authors declare that the research was carried out in the absence of any commercial or financial relationships that could be construed as a potential conflict of interest.
References
- Basson, C.; Serem, J.C.; Hlophe, Y.N.; Bipath, P. An in vitro investigation of L-kynurenine, quinolinic acid, and kynurenic acid on B16 F10 melanoma cell cytotoxicity and morphology. Cell Biochem. Funct. 2023, 41, 912–922. [Google Scholar] [CrossRef] [Scilit] [PubMed]
- McGowan, V.J.; Bambra, C. COVID-19 mortality and deprivation: Pandemic, syndemic, and endemic health inequalities. Lancet Public Health 2022, 7, e966–e975. [Google Scholar] [CrossRef] [Scilit]
- Belmehdi, O.; Hakkour, M.; El Omari, N.; Balahbib, A.; Guaouguaou, F.; Benali, T.; El Baaboua, A.; Lahmoud, M.; Elmenyiy, N.; Bouyahya, A. Molecular structure, pathophysiology, and diagnosis of COVID-19. Biointerface Res. Appl. Chem. 2021, 11, 10215–10237. [Google Scholar]
- Sharma, S.; Maheshwari, S. Protein structure and function prediction of SARS-CoV 2: Prospective antivirus active drug binding sites. In IOP Conference Series: Materials Science and Engineering; IOP Publishing: Bristol, UK, 2021. [Google Scholar]
- Zhu, C.; Sun, B.; Zhang, X.; Zhang, B. Research progress of genetic structure, pathogenic mechanism, clinical characteristics, and potential treatments of coronavirus disease 2019. Front. Pharmacol. 2020, 11, 1327. [Google Scholar] [CrossRef] [Scilit]
- Wabalo, E.K.; Dubiwak, A.D.; Gizaw, T.S.; Kotu, U.G. Role of structural and functional proteins of SARS-CoV-2. GSC Biol. Pharm. Sci. 2020, 12, 117–129. [Google Scholar] [CrossRef] [Scilit]
- Zhang, Z.; Nomura, N.; Muramoto, Y.; Ekimoto, T.; Uemura, T.; Liu, K.; Yui, M.; Kono, N.; Aoki, J.; Ikeguchi, M.; et al. Structure of SARS-CoV-2 membrane protein essential for virus assembly. Nat. Commun. 2022, 13, 4399. [Google Scholar] [CrossRef] [Scilit] [PubMed]
- Subramanian, G.; Hage, A.; Feldmann, F.; Chiramel, A.I.; McNally, K.L.; Sturdevant, G.L.; Beare, P.A.; Best, S.M. AP3B1 has type I interferon-independent antiviral function against SARS-CoV-2. Viruses 2024, 16, 1377. [Google Scholar] [CrossRef] [Scilit]
- Raja, R.K.; Nguyen-Tri, P.; Balasubramani, G.; Alagarsamy, A.; Hazir, S.; Ladhari, S.; Saidi, A.; Pugazhendhi, A.; Samy, A.A. SARS-CoV-2 and its new variants: A comprehensive review on nanotechnological application insights into potential approaches. Appl. Nanosci. 2023, 13, 65–93. [Google Scholar] [CrossRef] [Scilit] [PubMed]
- Rahman, M.M.; Ahmed, M.; Islam, M.T.; Khan, R.; Sultana, S.; Maeesa, S.K.; Hasan, S.; Hossain, A.; Ferdous, K.S.; Mathew, B.; et al. Nanotechnology-based approaches and investigational therapeutics against COVID-19. Curr. Pharm. Des. 2022, 28, 948–968. [Google Scholar] [CrossRef] [Scilit]
- ISO 10993-5:2009; Biological Evaluation of Medical Devices—Part 5: Tests for In Vitro Cytotoxicity. ISO: Geneva, Switzerland, 2009.
- Abbas, A.; Mariana, L.T.; Phan, A.N. Biomass-waste derived graphene quantum dots and their applications. Carbon 2018, 140, 77–99. [Google Scholar] [CrossRef] [Scilit]
- Sheikh Mohd Ghazali, S.A.I.; Fatimah, I.; Zamil, Z.N.; Zulkifli, N.N.; Adam, N. Graphene quantum dots: A comprehensive overview. Open Chem. 2023, 21, 20220285. [Google Scholar] [CrossRef] [Scilit]
- Li, M.; Chen, T.; Gooding, J.J.; Liu, J. Review of carbon and graphene quantum dots for sensing. ACS Sens. 2019, 4, 1732–1748. [Google Scholar] [CrossRef] [Scilit]
- Gedda, G.; Sankaranarayanan, S.A.; Putta, C.L.; Gudimella, K.K.; Rengan, A.K.; Girma, W.M. Green synthesis of multi-functional carbon dots from medicinal plant leaves for antimicrobial, antioxidant, and bioimaging applications. Sci. Rep. 2023, 13, 6371. [Google Scholar] [CrossRef] [Scilit]
- Wang, X.; Wu, T.; Yang, Y.; Zhou, L.; Wang, S.; Liu, J.; Zhao, Y.; Zhang, M.; Zhao, Y.; Qu, H.; et al. Ultrasmall and highly biocompatible carbon dots derived from natural plant with amelioration against acute kidney injury. J. Nanobiotechnol. 2023, 21, 63. [Google Scholar] [CrossRef] [Scilit]
- Gedda, G.; Putta, C.L.; Verma, A.; Ramesh, S.S.R.; Girma, W.M.; Park, Y.; Rengan, A.K.; Pang, M. Carbon dots: A promising tool for viral infection treatment. Mater. Today Bio 2025, 33, 102091. [Google Scholar] [CrossRef] [Scilit]
- Hussien, H.; Ghatass, Z.; Hassan, M.S.; Soliman, M.; Ebrahim, S. Effect of carbon quantum dots and Zn2+ ion on perovskite solar cells. J. Mater. Sci. Mater. Electron. 2023, 34, 1596. [Google Scholar] [CrossRef] [Scilit]
- Zhao, Q.; Song, W.; Zhao, B.; Yang, B. Spectroscopic studies of the optical properties of carbon dots: Recent advances and future prospects. Mater. Chem. Front. 2020, 4, 472–488. [Google Scholar] [CrossRef] [Scilit]
- Lagonegro, P.; Giovanella, U.; Pasini, M. Carbon dots as a sustainable new platform for organic light emitting diode. Coatings 2020, 11, 5. [Google Scholar] [CrossRef] [Scilit]
- Osorio, H.M.; Castillo-Solís, F.; Barragán, S.Y.; Rodríguez-Pólit, C.; Gonzalez-Pastor, R. Graphene quantum dots from natural carbon sources for drug and gene delivery in cancer treatment. Int. J. Mol. Sci. 2024, 25, 10539. [Google Scholar] [CrossRef] [Scilit]
- Wintola, O.A.; Olajuyigbeb, A.A.; Afolayana, A.J.; Coopoosamy, R.M.; Olajuyigbe, O.O. Chemical composition, antioxidant activities and antibacterial activities of essential oil from Erythrina caffra Thunb. growing in South Africa. Heliyon 2021, 70, e07244. [Google Scholar] [CrossRef] [Scilit] [PubMed]
- Mushebenge, A.G.-A.; Ugbaja, S.C.; Magwaza, N.N.; Mbatha, N.A.; Muzumbukilwa, T.W.; Kadima, M.G.; Tata, F.Y.; Nxumalo, M.B.; Manimani, R.G.; Ndage, N.; et al. Mechanistic Insights into the Mutational Landscape of the Main Protease/3CLPro and Its Impact on Long-Term COVID-19/SARS-CoV-2 Management. Future Pharmacol. 2024, 4, 825–852. [Google Scholar] [CrossRef] [Scilit]
- Singh, M.; Thrimawithana, T.; Shukla, R.; Adhikari, B. Extraction and characterization of polyphenolic compounds and potassium hydroxycitrate from Hibiscus sabdariffa. Future Foods 2021, 4, 100087. [Google Scholar] [CrossRef] [Scilit]
- Khade, O.S.; Sruthi, K.; Sonkar, R.M.; Gade, P.S.; Bhatt, P. Plant secondary metabolites: Extraction, screening, analysis and their bioactivity. Int. J. Herb. Med. 2023, 11, 1–17. [Google Scholar] [CrossRef] [Scilit]
- Shafodino, F.S.; Lusilao, J.M.; Mwapagha, L.M. Preparation of medicinally active extracts and phytochemical characterisation of phytoconstituents from medicinal plants. Nat. Prod. Res. 2024, 38, 3508–3518. [Google Scholar] [CrossRef] [Scilit]
- Pradana, F.J.P.; Putri, D.S.; Maerisa, C.; Salsabila, M.; Abimanyu, S.; Pangsibidang, R.C.A. Icopmap Special Edition Isolation, characterisation, and determination of capsaicin compound levels in red chili fruit (Capsicum annum fructus) in IPB CH3 and carvi agrihorti varieties. Pharm. Educ. 2025, 25, 154–167. [Google Scholar] [CrossRef] [Scilit]
- Oumar, D.A.; Abakar, T.I.; Cissé, H.; Betoloum, S.M.; Sawadogo, A.; Nzambe, M.J.-U.; Mbayngone, E.; Tidjani, A.; Savadogo, A. Ethnobotanical and Phytochemical Study of Medicinal Plants Sold in the Markets of the City of N’Djamena. Adv. Biol. Chem. 2024, 14, 121–144. [Google Scholar] [CrossRef]
- Bankole, A.E.; Adekunle, A.A.; Sowemimo, A.A.; Umebese, C.E.; Abiodun, O.; Gbotosho, G.O. Phytochemical screening and in vivo antimalarial activity of extracts from three medicinal plants used in malaria treatment in Nigeria. Parasitol. Res. 2016, 115, 299–305. [Google Scholar] [CrossRef] [Scilit] [PubMed]
- Danbature, W.L.; Shehu, Z.; Adam, M.M.; Bello, A.M. Phytochemical screening and Larvicidal evaluation of phyto-synthesized silver nanoparticles using Palmyra palm sprout extract. Biog. J. Ilm. Biol. 2020, 8, 126. [Google Scholar] [CrossRef] [Scilit]
- Yau, D.; Ahmad, T.Y.; Baba, K.I.; Lado, A.U.; Musbahu, L.; Umar, A.U.; Nura, T. Phytochemical composition of desert date kernel (Balanites aegyptiaca) and the physical and chemical characteristics of its oil. GSC Biol. Pharm. Sci. 2020, 11, 197–207. [Google Scholar] [CrossRef] [Scilit]
- Kudamba, A.; Kasolo, J.N.; Bbosa, G.S.; Lugaajju, A.; Wabinga, H.; Niyonzima, N.; Ocan, M.; Damani, A.M.; Kafeero, H.M.; Ssenku, J.E.; et al. Phytocphytochemical Profiles of Rhoicissus Tridentata Harvested from the Slopes of Mountain Elgon, Uganda; Research Square: Durham, NC, USA, 2023. [Google Scholar] [CrossRef] [Scilit]
- Jing, H.H.; Kasolo, J.N.; Bbosa, G.S.; Lugaajju, A.; Wabinga, H.; Niyonzima, N.; Ocan, M.; Damani, A.M.; Kafeero, H.M.; Ssenku, J.E.; et al. Green Carbon Dots: Synthesis, Characterization, Properties and Biomedical Applications. J. Funct. Biomater. 2023, 14, 27. [Google Scholar] [CrossRef] [Scilit]
- Kadyan, P.; Arasu, P.T.; Kataria, S.K. Graphene quantum dots: Green synthesis, characterization, and antioxidant and antimicrobial potential. Int. J. Biomater. 2024, 2024, 2626006. [Google Scholar] [CrossRef] [Scilit]
- Chahal, S.; Macairan, J.-R.; Yousefi, N.; Tufenkji, N.; Naccache, R. Green synthesis of carbon dots and their applications. RSC Adv. 2021, 11, 25354–25363. [Google Scholar] [CrossRef] [Scilit]
- Fery-Forgues, S.; Lavabre, D. Are fluorescence quantum yields so tricky to measure? A demonstration using familiar stationery products. J. Chem. Educ. 1999, 76, 1260. [Google Scholar] [CrossRef] [Scilit]
- Ogunsipe, A.; Chen, J.-Y.; Nyokong, T. Photophysical and photochemical studies of zinc (II) phthalocyanine derivatives—Effects of substituents and solvents. New J. Chem. 2004, 28, 822–827. [Google Scholar] [CrossRef] [Scilit]
- Ouyang, Z.; Lei, Y.; Luo, L.; Jiang, Z.; Hu, J.; Lin, Y. S, N co-doped graphene quantum dots decorated CdSe for enhanced photoelectric properties. Nanotechnology 2020, 31, 095710. [Google Scholar] [CrossRef] [Scilit] [PubMed]
- Bragg, W.H.; Bragg, W.L. The reflection of X-rays by crystals. Proc. R. Soc. Lond. Ser. A Contain. Pap. Math. Phys. Character 1913, 88, 428–438. [Google Scholar]
- Pyrzynska, K.; Pękal, A. Application of free radical diphenylpicrylhydrazyl (DPPH) to estimate the antioxidant capacity of food samples. Anal. Methods 2013, 5, 4288–4295. [Google Scholar] [CrossRef] [Scilit]
- Rubab, M.; Chelliah, R.; Oh, D.-H. Screening for antioxidant activity: Diphenylpicrylhydrazine (DPPH) assay. In Methods in Actinobacteriology; Springer: Berlin, Germany, 2022; pp. 453–454. [Google Scholar]
- Garg, S.; Garg, A.; Shukla, A.; Dev, S.K.; Bishnoi, R.S.; Kumar, M. Review on antioxidant evaluation methods: And models In-vitro in-vivo. Asian J. Pharm. Pharmacol. 2018, 4, 147–154. [Google Scholar] [CrossRef] [Scilit]
- Salhi, A.; Zannagui, C.; Elyoussfi, A.; Ahari, M.; Mourabit, F.; Amhamdi, H.; Akichouh, E.H.; Barkany, S.E. Exploring the Antioxidant Activity of Selected Aromatic and Medicinal Plants. In Medicinal Plants-Harnessing the Healing Power of Plants; IntechOpen: London, UK, 2024. [Google Scholar]
- Tourabi, M.; Metouekel, A.; ghouizi, A.E.L.; Jeddi, M.; Nouioura, G.; Laaroussi, H.; Hosen, E.; Benbrahim, K.F.; Bourhia, M.; Salamatullah, A.M.; et al. Efficacy of Various Extracting Solvents on Phytochemical Composition, Antioxidant Potential, Total Phenolic Content, and Antibacterial Properties, of Moroccan Mentha longifolia L. Leaf Extracts against Multidrug-Resistant Pathogenic Bacteria. Sci. Rep. 2023, 13, 18028. [Google Scholar] [CrossRef] [Scilit]
- Asogwa, I.; Ibrahim, A.; Eze, J. The influence of cooking methods on the antioxidant status of Tetrapleura tetrapetra. Afr. J. Food Agric. Nutr. Dev. 2022, 22, 18574–18592. [Google Scholar] [CrossRef] [Scilit]
- Thakur, M.; Khushboo; Yadav, A.; Dubey, K.K.; Dakal, T.C.; Yadav, V. Antimicrobial Activity against Antibiotic-resistant Pathogens and Antioxidant Activity and LCMS/MS Phytochemical Content Analysis of Selected Medicinal Plants. J. Pure Appl. Microbiol. 2024, 18, 722–738. [Google Scholar] [CrossRef] [Scilit]
- Peerapornpisal, Y.; Amornledpison, D.; Rujjanawate, C.; Ruangrita, K.; Kanjanapoth, D. Two endemic species of macroalgae in Nan River, northern Thailand, as therapeutic agents. Sci. Asia 2006, 32, 71–76. [Google Scholar] [CrossRef]
- Tajuddeen, N.; Swart, T.; Hoppe, H.C.; van Heerden, F.R. Antiplasmodial and cytotoxic flavonoids from Pappea capensis (Eckl. & Zeyh.) leaves. Molecules 2021, 26, 3875. [Google Scholar] [CrossRef] [Scilit]
- Węglarz-Tomczak, E.; Tomczak, J.M.; Talma, M.; Brul, S. Ebselen as a highly active inhibitor of PLProCoV2. BioRxiv 2020. [Google Scholar] [CrossRef] [Scilit]
- Wang, X.; Wang, J.; Liu, J.; Yang, J.; Lv, Z.; Liu, A.; Li, Y.; Li, Y.; Lan, H.; Liu, G.; et al. Establishment of a transient transfection system for Babesia sp. Xinjiang using homologous promoters. Parasitol. Res. 2021, 120, 3625–3630. [Google Scholar] [CrossRef] [Scilit]
- Suzuki, N.; Yoshida, T.; Takeuchi, H.; Sakuma, R.; Sukegawa, S.; Yamaoka, S. Robust enhancement of lentivirus production by promoter activation. Sci. Rep. 2018, 8, 15036. [Google Scholar] [CrossRef] [Scilit]
- Zhou, J.; Zhang, N.; Zhang, W.; Lu, C.; Xu, F. The YAP/HIF-1α/miR-182/EGR2 axis is implicated in asthma severity through the control of Th17 cell differentiation. Cell Biosci. 2021, 11, 84. [Google Scholar] [CrossRef] [Scilit]
- de Camargo, M.H.M.; da Costa, V.P.V.; Santos, C.D. Optimizing the solvent mixture for extracting phenolic compounds with antioxidant and phytotoxicity activity from Myrcia fallax leaves using the I-optimal design. Res. Soc. Dev. 2025, 14, e9114949574. [Google Scholar] [CrossRef] [Scilit]
- Kim, J.-S. Study of flavonoid/hydroxypropyl-β-cyclodextrin inclusion complexes by UV-Vis, FT-IR, DSC, and X-Ray diffraction analysis. Prev. Nutr. Food Sci. 2020, 25, 449. [Google Scholar] [CrossRef] [Scilit] [PubMed]
- Santhosh, P.; Nirmalram, J.S.; Chinnaraja, D.; Varma, M.S.; Manikandan, R.; Anburaj, G.; Kuma, R.S. Phytochemical characterization, antioxidant potential, and cytotoxic activity of Erythrina variegata leaf extract an integrated spectroscopic and bioassay approach. J. Pharmacogn. Phytochem. 2025, 14, 222–228. [Google Scholar] [CrossRef] [Scilit]
- Ombito, J.O.; Bojase, G.; Majinda, R.R.T.; Masesane, I.B.; Schüffler, A.; Opatz, T. Erysacleuxins C and D, new isoflavones from the twigs of Erythrina sacleuxii Hua and their cytotoxic activity. Arab. J. Chem. 2020, 13, 4019–4023. [Google Scholar] [CrossRef] [Scilit]
- Enciso, P.; Decoppet, J.-D.; Grätzel, M.; Wörner, M.; Cabrerizo, F.M.; Cerdá, M.F. A cockspur for the DSS cells: Erythrina crista-galli sensitizers. Spectrochim. Acta Part A Mol. Biomol. Spectrosc. 2017, 176, 91–98. [Google Scholar] [CrossRef] [Scilit]
- Desta, Z.Y.; Sewald, N.; Majinda, R.R. Cytotoxic flavonoids from Erythrina caffra Thunb. Bull. Chem. Soc. Ethiop. 2016, 30, 427–435. [Google Scholar] [CrossRef] [Scilit]
- Mera, I.F.G.; Hernández, O.D.L.; Córdova, V.M. Phytochemical screening and in vitro anti-inflammatory activity of ethanolic extract of Epidendrum coryophorum leaves. Bionatura 2020, 5, 1387–1393. [Google Scholar] [CrossRef] [Scilit]
- Klongklaw, K.; Phiromkaewa, B.; Kiatsuksria, P.; Kankitb, B.; Anantachaisilp, S.; Wechakorn, K. Green one-step synthesis of mushroom-derived carbon dots as fluorescent sensors for Fe 3+ detection. RSC Adv. 2023, 13, 30869–30875. [Google Scholar] [CrossRef] [Scilit] [PubMed]
- Nguyen, D.-K.; Le, T.-S.; Le, Q.T.; Mai, X.-D. The roles of intermediate fluorophores on the optical properties of bottom-up synthesized carbon nanodots. HPU2 J. Sci. Nat. Sci. Technol. 2023, 2, 68–82. [Google Scholar] [CrossRef] [Scilit]
- Omran, B.A.; Whitehead, K.A.; Baek, K.-H. One-pot bioinspired synthesis of fluorescent metal chalcogenide and carbon quantum dots: Applications and potential biotoxicity. Colloids Surf. B Biointerfaces 2021, 200, 111578. [Google Scholar] [CrossRef] [Scilit]
- Yalshetti, S.; Thokchom, B.; Bhavi, S.M.; Singh, S.R.; Patil, S.R.; Harini, B.P.; Sillanpää, M.; Manjunatha, J.G.; Srinath, B.S.; Yarajarla, R.B. Microwave-assisted synthesis, characterization and in vitro biomedical applications of Hibiscus rosa-sinensis Linn.-mediated carbon quantum dots. Sci. Rep. 2024, 14, 9915. [Google Scholar] [CrossRef] [Scilit]
- Cárdenas-Alcaide, M.F.; González-González, B.R.; Villalba-Rodríguez, A.M.; López-Pachecod, I.Y.; Parra-Saldívare, R.; Iqba, H.M.N. Nanofabrication and characterization of green-emitting N-doped carbon dots derived from pulp-free lemon juice extract. Nanofabrication 2023, 8, 1–8. [Google Scholar] [CrossRef] [Scilit]
- Ts’itso, S. Evaluation of Silver Nanoparticles Synthesised from Gnidia Burchellii Leaf and Flower Extracts for Cytotoxicity, Antimicrobial and Antioxidant Activities, in Department of Biology. Master’s Thesis, National University of Lesotho, Roma, Lesotho, 2023; p. 119. [Google Scholar]
- Olawale, F.; Bodede, O.; Ariatti, M.; Singh, M. Isolation, Characterization, Antioxidant and Anticancer Activities of Compounds from Erythrina caffra Stem Bark Extract. Antioxidants 2025, 14, 1035. [Google Scholar] [CrossRef] [Scilit]
- Sahoo, M.R.; Umashankara, M.S. FTIR based metabolomics profiling and fingerprinting of some medicinal plants: An attempt to develop an approach for quality control and standardization of herbal materials. Pharmacogn. Res. 2022, 15, 163–167. [Google Scholar] [CrossRef] [Scilit]
- Nnorom, O.O.; Onuegbu, G.C. Authentication of Rothmannia whitfieldii Dye Extract with FTIR Spectroscopy. J. Text. Sci. Technol. 2019, 5, 38–47. [Google Scholar] [CrossRef]
- Rohman, A.; Ikhtiarini, A.; Setyaningsih, W.; Rafi, M. The use of chemometrics for classification of Sidaguri (Sida rhombifolia) based on FTIR spectra and antiradical activities. Indones. J. Chem. 2021, 21, 1568–1576. [Google Scholar] [CrossRef] [Scilit]
- Rajiv, P.; Deepa, A.; Vanathi, P.; Vidhya, D. Screening for phytochemicals and FTIR analysis of Myristica dactyloids fruit extracts. Int. J. Pharm. Pharm. Sci. 2017, 9, 315–318. [Google Scholar] [CrossRef] [Scilit]
- Anjuwon, T.M.; Ehinmidu, J.O.; Anigo, K.M.; James, D.B. In vitro antimalarial susceptibility of Plasmodium Falciparum and Plasmodium Berghei isolates to selected antimalarial agents, column chromatographic subfractions of Glyphaea Brevis leaves extract and FTIR and GCMS of SF8. Trop. Life Sci. Res. 2023, 34, 279. [Google Scholar] [PubMed]
- Dager, A.; Baliyan, A.; Kurosu, S.; Maekawa, T.; Tachibana, M. Ultrafast synthesis of carbon quantum dots from fenugreek seeds using microwave plasma enhanced decomposition: Application of C-QDs to grow fluorescent protein crystals. Sci. Rep. 2020, 10, 12333. [Google Scholar] [CrossRef] [Scilit]
- Mohanta, Y.K.; Panda, S.K.; Jayabalan, R.; Sharma, N.; Bastia, A.; Mohanta, T.K. Antimicrobial, Antioxidant and Cytotoxic Activity of Silver Nanoparticles Synthesized by Leaf Extract of Erythrina suberosa (Roxb.). Front. Mol. Biosci. 2017, 4, 14. [Google Scholar] [CrossRef] [Scilit]
- Gallo, L.; Verónica Ramírez-Rigo, M.V.; Piña, J.; Bucalá, V. A comparative study of spray-dried medicinal plant aqueous extracts. Drying performance and product quality. Chem. Eng. Res. Des. 2015, 104, 681–694. [Google Scholar] [CrossRef] [Scilit]
- Tan, S.-P. Anticancer Efficacy of Silver Nanoparticles Synthesized from Erythrina variegata L. Leaves Extract against A549 Lung Cancer Cell Line. Sains Malays. 2025, 54, 2227–2242. [Google Scholar] [CrossRef] [Scilit]
- Elvati, P.; Baumeister, E.; Violi, A. Graphene quantum dots: Effect of size, composition and curvature on their assembly. RSC Adv. 2017, 7, 17704–17710. [Google Scholar] [CrossRef] [Scilit]
- Zheng, P.; Wu, N. Fluorescence and sensing applications of graphene oxide and graphene quantum dots: A review. Chem. Asian J. 2017, 12, 2343–2353. [Google Scholar] [CrossRef] [Scilit] [PubMed]
- Amjad, M.; Iqbal, M.; Faisal, A.; Junju, A.M.; Hussain, I.; Hussain, S.Z.; Ghramh, H.A.; Khan, K.A.; Janjua, H.A. Hydrothermal synthesis of carbon nanodots from bovine gelatin and PHM3 microalgae strain for anticancer and bioimaging applications. Nanoscale Adv. 2019, 1, 2924–2936. [Google Scholar] [CrossRef] [Scilit] [PubMed]
- Liu, Q.; Li, D.; Zhu, Z.; Yu, S.; Zhang, Y.; Yu, D.; Jiang, J. N-doped carbon dots from phenol derivatives for excellent colour rendering WLEDs. RSC Adv. 2018, 8, 4850–4856. [Google Scholar] [CrossRef] [Scilit] [PubMed]
- Meng, W.; Bai, X.; Wang, B.; Liu, Z.; Lu, S.; Yang, B. Biomass-Derived Carbon Dots and Their Applications. Energy Environ. Mater. 2019, 2, 172–192. [Google Scholar] [CrossRef] [Scilit]
- Kanwal, A.; Bibi, N.; Hyder, S.; Muhammad, A.; Ren, H.; Liu, J.; Lei, Z. Recent advances in green carbon dots (2015–2022): Synthesis, metal ion sensing, and biological applications. Beilstein J. Nanotechnol. 2022, 13, 1068–1107. [Google Scholar] [CrossRef] [Scilit]
- Omar, N.A.S.; Fen, Y.P.; Irmawati, R.; Hashim, H.S.; Ramdzan, N.S.; Fauzi, N.I.M. A Review on Carbon Dots: Synthesis, Characterization and Its Application in Optical Sensor for Environmental Monitoring. Nanomaterials 2022, 12, 2365. [Google Scholar] [CrossRef] [Scilit]
- Rilievo, G.; Magro, M.; Tonolo, F.; Cecconello, A.; Rutigliano, L.; Cencini, A.; Molinari, S.; Paolo, M.L.D.; Fiorucci, C.; Rossi, M.N.; et al. Spermine Oxidase–Substrate Electrostatic Interactions: The Modulation of Enzyme Function by Neighboring Colloidal ɣ-Fe2O3. Biomolecules 2023, 13, 1800. [Google Scholar] [CrossRef] [Scilit]
- Mansfield, E.D.; Pandya, Y.; Mun, E.A.; Rogers, S.E.; Abutbul-Ionit, I.; Danino, D.; Williams, A.C.; Khutoryanskiy, V.V. Structure and characterisation of hydroxyethylcellulose–silica nanoparticles. RSC Adv. 2018, 8, 6471–6478. [Google Scholar] [CrossRef] [Scilit]
- Takahashi, K.; Kramar, J.A.; Farkas, N.; Takahata, K.; Misumi, I.; Sugawara, K.; Gonda, S.; Ehara, K. Interlaboratory comparison of nanoparticle size measurements between NMIJ and NIST using two different types of dynamic light scattering instruments. Metrologia 2019, 56, 055002. [Google Scholar] [CrossRef] [Scilit]
- Michen, B.; Geers, C.; Vanhecke, D.; Endes, C.; Rothen-Rutishauser, B.; Balog, S.; Petri-Fink, A. Avoiding drying-artifacts in transmission electron microscopy: Characterizing the size and colloidal state of nanoparticles. Sci. Rep. 2015, 5, 9793. [Google Scholar] [CrossRef] [Scilit]
- Shang, J.; Gao, X. Nanoparticle counting: Towards accurate determination of the molar concentration. Chem. Soc. Rev. 2014, 43, 7267–7278. [Google Scholar] [CrossRef] [Scilit]
- Sudheer, N.; Rouchon, V.; Ihiawakrim, D.; Lefebvre, C.; Levitz, P.; Lecolier, E.; Rabu, P.; Ersen, O. Investigating the crystallite morphologies and aggregation in boehmite powders: A combined analysis of two-and three-dimensional electron microscopy with X-ray diffraction. Sci. Technol. Energy Transit. 2024, 79, 84. [Google Scholar] [CrossRef] [Scilit]
- Bobyl, A.; Kasatkin, I. Anisotropic crystallite size distributions in LiFePO 4 powders. RSC Adv. 2021, 11, 13799–13805. [Google Scholar] [CrossRef] [Scilit] [PubMed]
- Uvarov, V.; Popov, I. Metrological characterization of X-ray diffraction methods at different acquisition geometries for determination of crystallite size in nano-scale materials. Mater. Charact. 2013, 85, 111–123. [Google Scholar] [CrossRef] [Scilit]
- Kong, J.; Wei, Y.; Zhou, F.; Shi, L.; Zhao, S.; Wan, M.; Zhang, X. Carbon Quantum Dots: Properties, Preparation, and Applications. Molecules 2024, 29, 2002. [Google Scholar] [CrossRef] [Scilit]
- Joudeh, N.; Linke, D. Nanoparticle classification, physicochemical properties, characterization, and applications: A comprehensive review for biologists. J. Nanobiotechnol. 2022, 20, 262. [Google Scholar] [CrossRef] [Scilit]
- Yuan, X.; Wei, Y.; Zhou, F.; Shi, L.; Zhao, S.; Wan, M.; Zhang, X. Cellular distribution and cytotoxicity of graphene quantum dots with different functional groups. Nanoscale Res. Lett. 2014, 9, 108. [Google Scholar] [CrossRef] [Scilit] [PubMed]
- Panda, S.; Devi, K.S.S.; Tsujimura, S.; Kumar, S.; Jakmunee, J.; Prakash, J. Recent advances in graphene quantum dots: Chemistry of synthesis, surface modifications, and improved properties for biomedical applications. TrAC Trends Anal. Chem. 2025, 191, 118293. [Google Scholar] [CrossRef] [Scilit]
- Fan, J. Evaluation of the Safety and Drug Delivery Efficacy of Carbon Dots in In Vitro and In Vivo Models. Ph.D. Thesis, Université de Strasbourg, Strasbourg, France, 2018. [Google Scholar]
- Ramana, L.N.; Dinh, L.N.; Agarwal, V. Influence of surface charge of graphene quantum dots on their uptake and clearance in melanoma cells. Nanoscale Adv. 2021, 3, 3513–3521. [Google Scholar] [CrossRef] [Scilit]
- Lin, Y.; Chapman, R.; Stevens, M.M. Integrative self-assembly of graphene quantum dots and biopolymers into a versatile biosensing toolkit. Adv. Funct. Mater. 2015, 25, 3183–3192. [Google Scholar] [CrossRef] [Scilit]
- Prieto, M.; Prieto, M.A.; Curran, T.P.; Gowen, A.; Vázquez, J.A. An efficient methodology for quantification of synergy and antagonism in single electron transfer antioxidant assays. Food Res. Int. 2015, 67, 284–298. [Google Scholar] [CrossRef] [Scilit]
- Chen, Z.; Liu, Q.; Zhao, Z.; Bai, B.; Sun, Z.; Cai, L.; Fu, Y.; Ma, Y.; Wang, Q.; Xi, G. Effect of hydroxyl on antioxidant properties of 2, 3-dihydro-3, 5-dihydroxy-6-methyl-4 H-pyran-4-one to scavenge free radicals. RSC Adv. 2021, 11, 34456–34461. [Google Scholar] [CrossRef] [Scilit] [PubMed]
- Gulcin, İ.; Alwasel, S.H. DPPH radical scavenging assay. Processes 2023, 11, 2248. [Google Scholar] [CrossRef] [Scilit]
- Abdelghani, G.M.; Ahmed, A.B.; Al-Zubaidi, A.B. Synthesis, characterization, and the influence of energy of irradiation on optical properties of ZnO nanostructures. Sci. Rep. 2022, 12, 20016. [Google Scholar] [CrossRef] [Scilit]
- Aslantürk, Ö.S. In vitro cytotoxicity and cell viability assays: Principles, advantages, and disadvantages. In Genotoxicity—A Predictable Risk to Our Actual World; IntechOpen: London, UK, 2018; Volume 2, pp. 64–80. [Google Scholar]
- Asphahani, F.; Zhang, M. Cellular impedance biosensors for drug screening and toxin detection. Analyst 2007, 132, 835–841. [Google Scholar] [CrossRef] [Scilit] [PubMed]
- Su, W.; Wu, H.; Xu, H.; Zhang, Y.; Li, Y.; Li, X.; Fan, L. Carbon dots: A booming material for biomedical applications. Mater. Chem. Front. 2020, 4, 821–836. [Google Scholar] [CrossRef] [Scilit]
- Zhang, X.; Zhang, J.; Chen, N.; Qu, L. Graphene quantum dots: An emerging material for biological applications. Mater. Sci. Eng. C 2012, 32, 1023–1030. [Google Scholar]
- Yilmaz, N.K.; Swanstrom, R.; Schiffer, C.A. Improving viral protease inhibitors to counter drug resistance. Trends Microbiol. 2016, 24, 547–557. [Google Scholar] [CrossRef] [Scilit]
- Arachea, B.T.; Wiener, M.C. Acquisition of accurate data from intramolecular quenched fluorescence protease assays. Anal. Biochem. 2017, 522, 30–36. [Google Scholar] [CrossRef] [Scilit] [PubMed]
- Raekiansyah, M.; Tun, M.M.N.; Ang, A.; Lee, A.; Macalino, J.S.; Billones, J.; Takamatsu, Y.; Urano, T.; Murao, L.A.E.; Quiming, N.; et al. Antiviral Activity of Medicinal Plant Extracts Vitex negundo and Macaranga tanarius Against SARS-CoV-2. Pathogens 2025, 14, 820. [Google Scholar] [CrossRef] [Scilit]
- Nishinarizki, V.; Hardianto, A.; Gaffar, S.; Muchtaridi, M.; Herlina, T. Virtual screening campaigns and ADMET evaluation to unlock the potency of flavonoids from Erythrina as 3CLpro SARS-CoV-2 inhibitors. J. Appl. Pharm. Sci. 2023, 13, 78–88. [Google Scholar] [CrossRef] [Scilit]
- Gharpure, S.; Ankamwar, B. Use of nanotechnology in combating coronavirus. 3 Biotech 2021, 11, 358. [Google Scholar] [CrossRef] [Scilit] [PubMed]
- Adhikari, A.; Mandal, D.; Rana, D.; Nath, J.; Bose, A.; Sonika; Orasugh, J.T.; De, S.; Chattopadhyay, D. COVID-19 mitigation: Nanotechnological intervention, perspective, and future scope. Mater. Adv. 2023, 4, 52–78. [Google Scholar] [CrossRef] [Scilit]
- Fedorov, V.; Kholina, E.; Khruschev, S.; Kovalenko, I.; Rubin, A.; Strakhovskaya, M. Electrostatic map of the SARS-CoV-2 virion specifies binding sites of the antiviral cationic photosensitizer. Int. J. Mol. Sci. 2022, 23, 7304. [Google Scholar] [CrossRef] [Scilit]
- Adamczyk, Z.; Batys, P.; Barbasz, J. SARS-CoV-2 virion physicochemical characteristics pertinent to abiotic substrate attachment. Curr. Opin. Colloid Interface Sci. 2021, 55, 101466. [Google Scholar] [CrossRef] [Scilit]
- Latyshev, O. Coronavirus COVID-19 surface properties: Electrical charges status. Int. J. 2021, 2766, 3264. [Google Scholar]
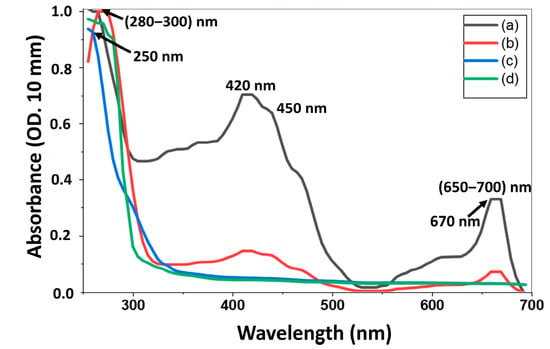
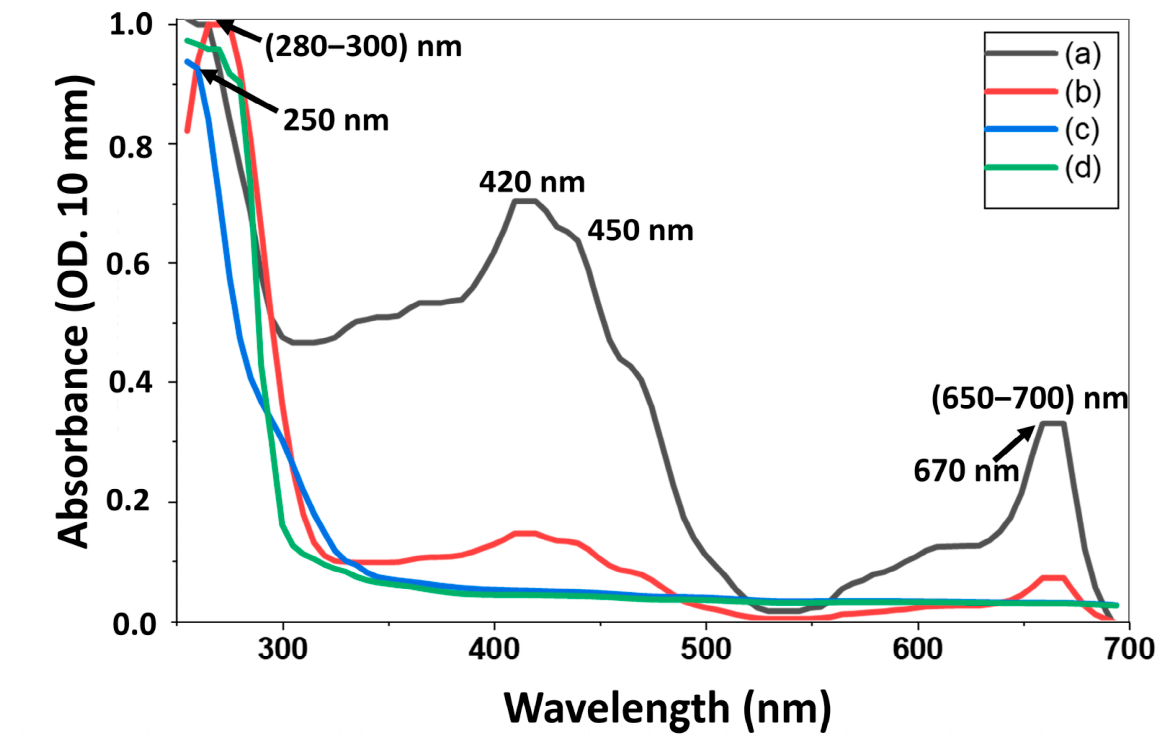
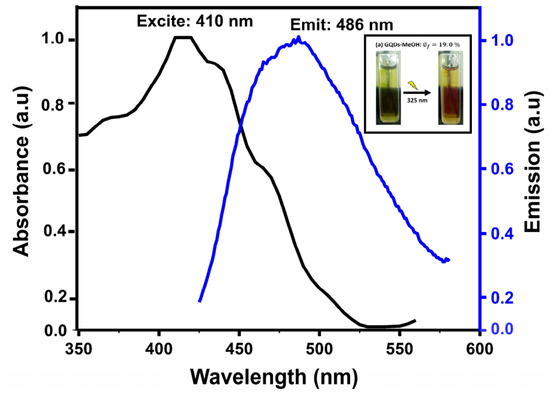
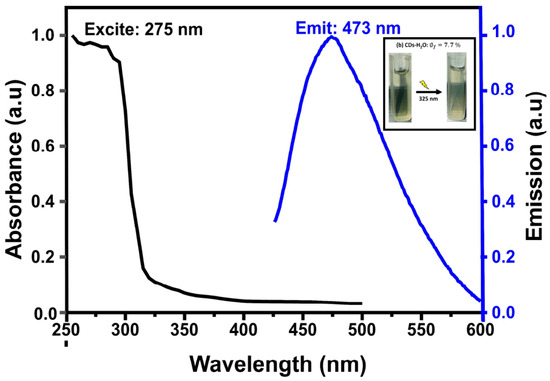
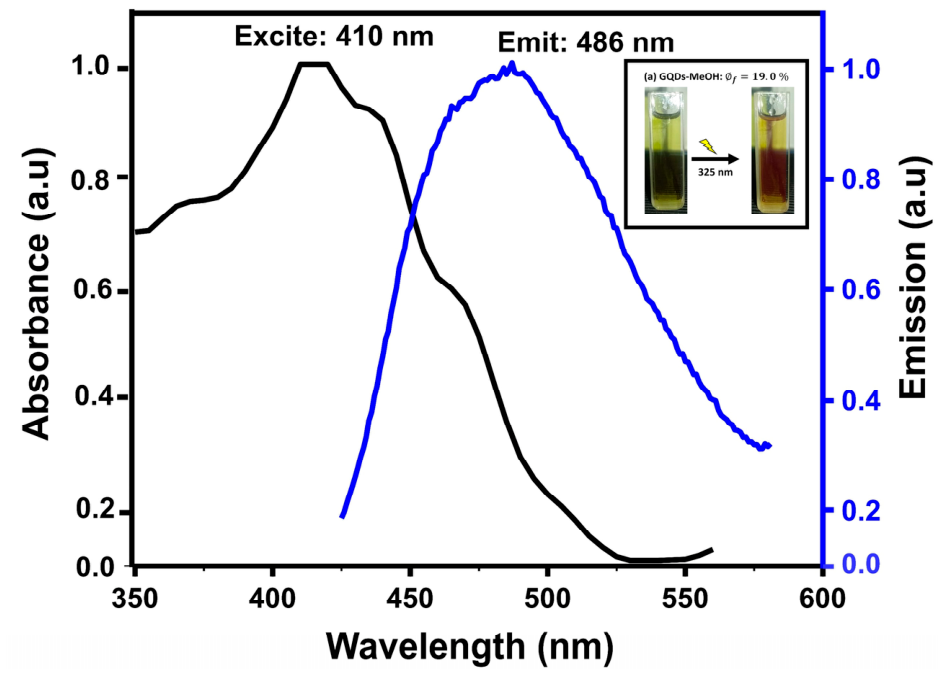
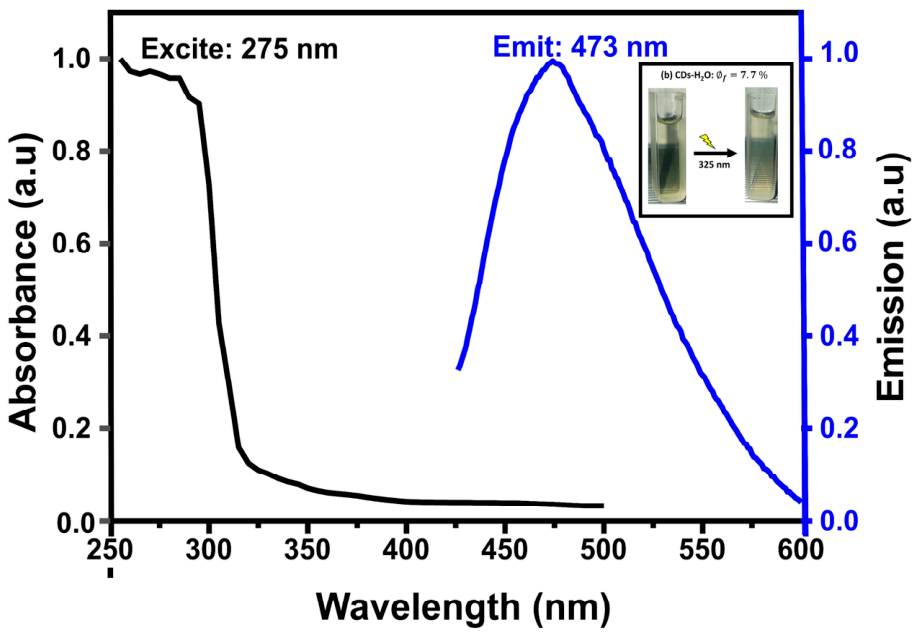
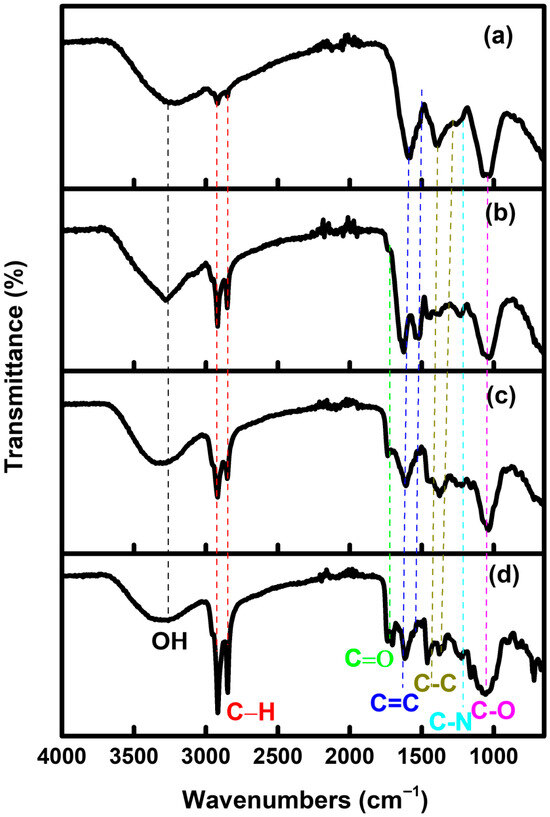
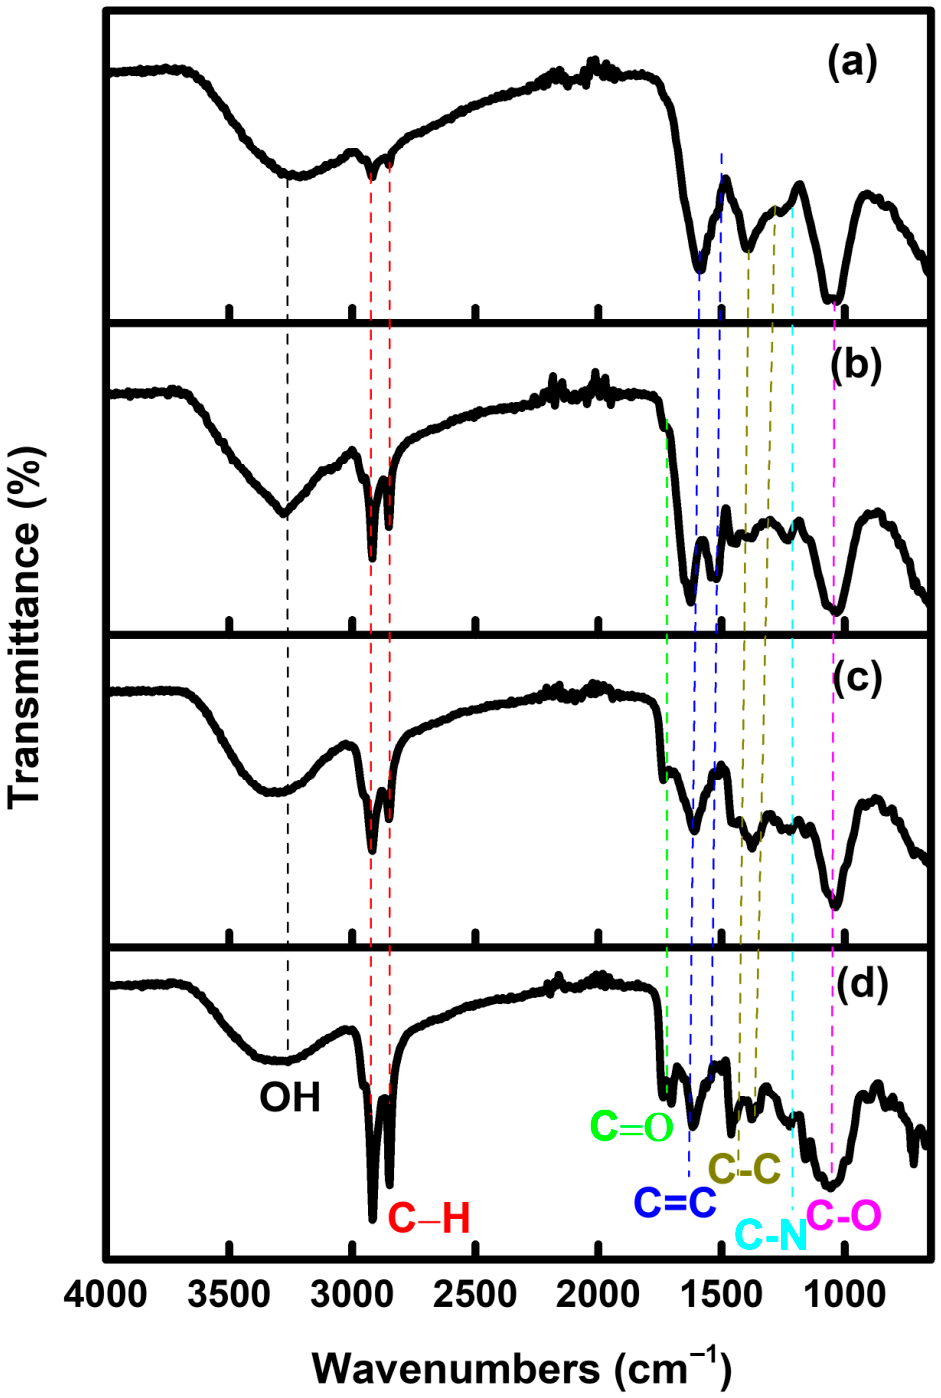
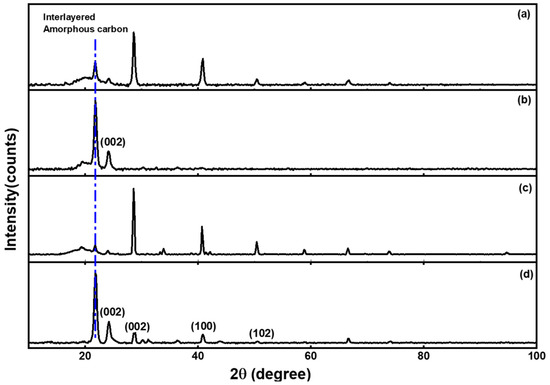
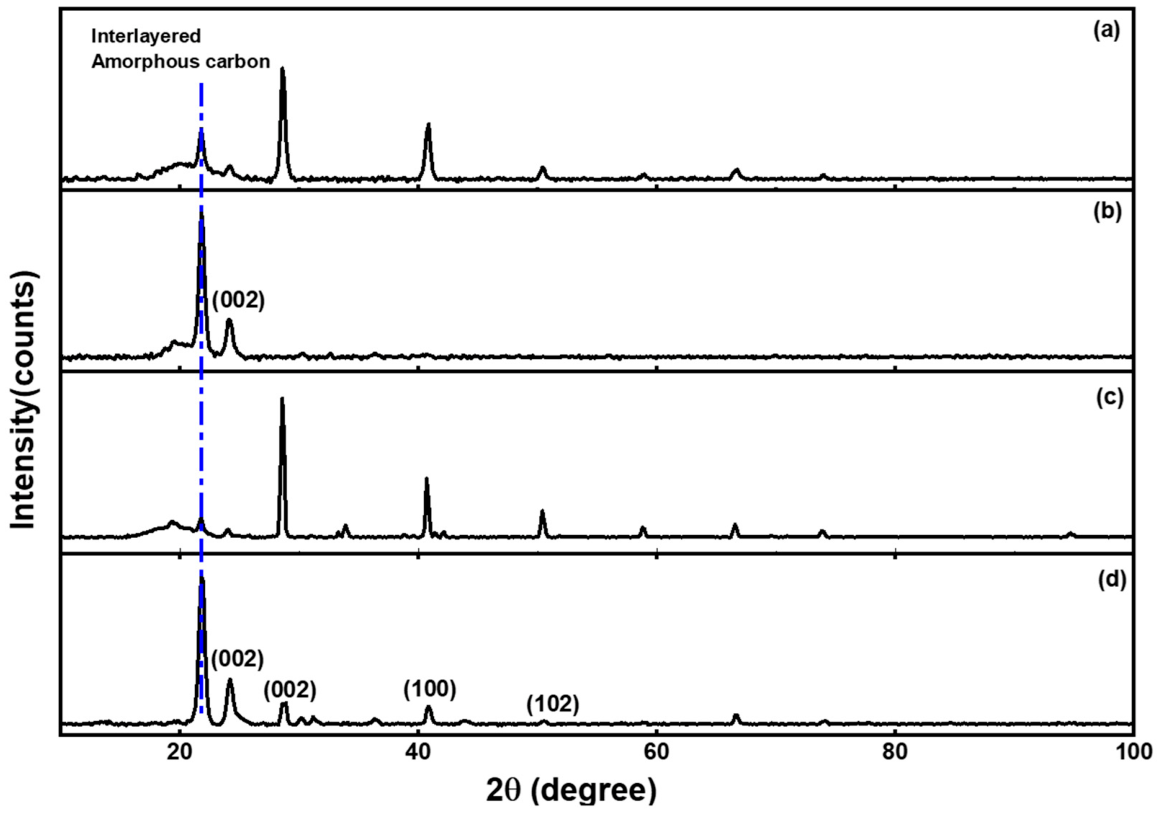
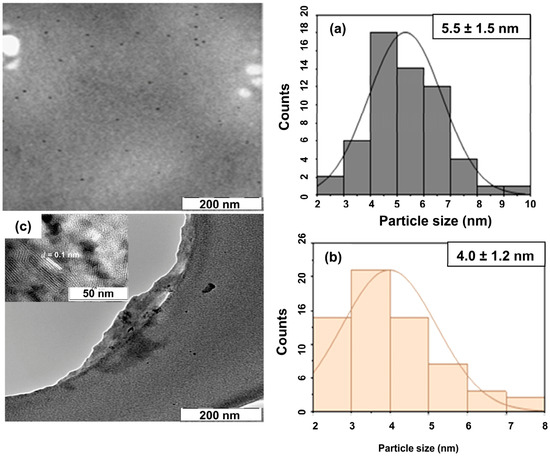
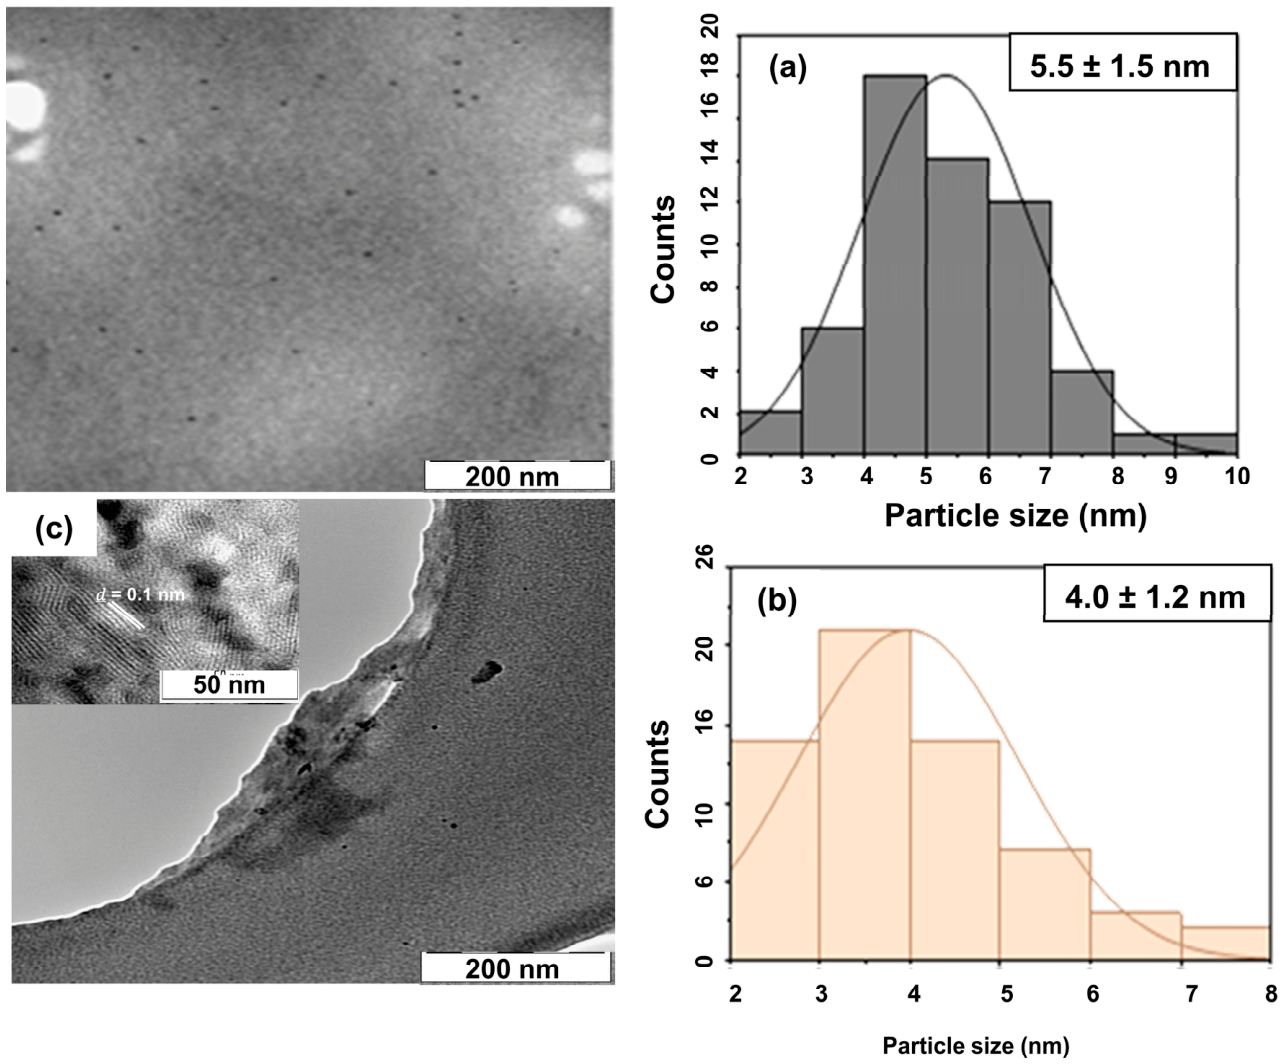
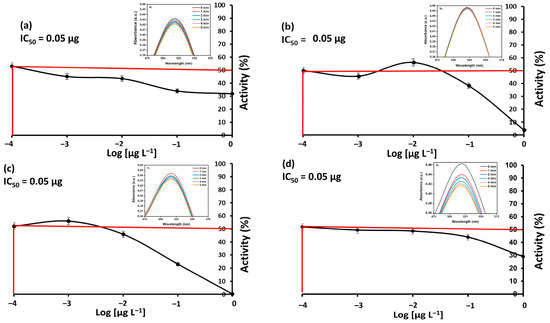
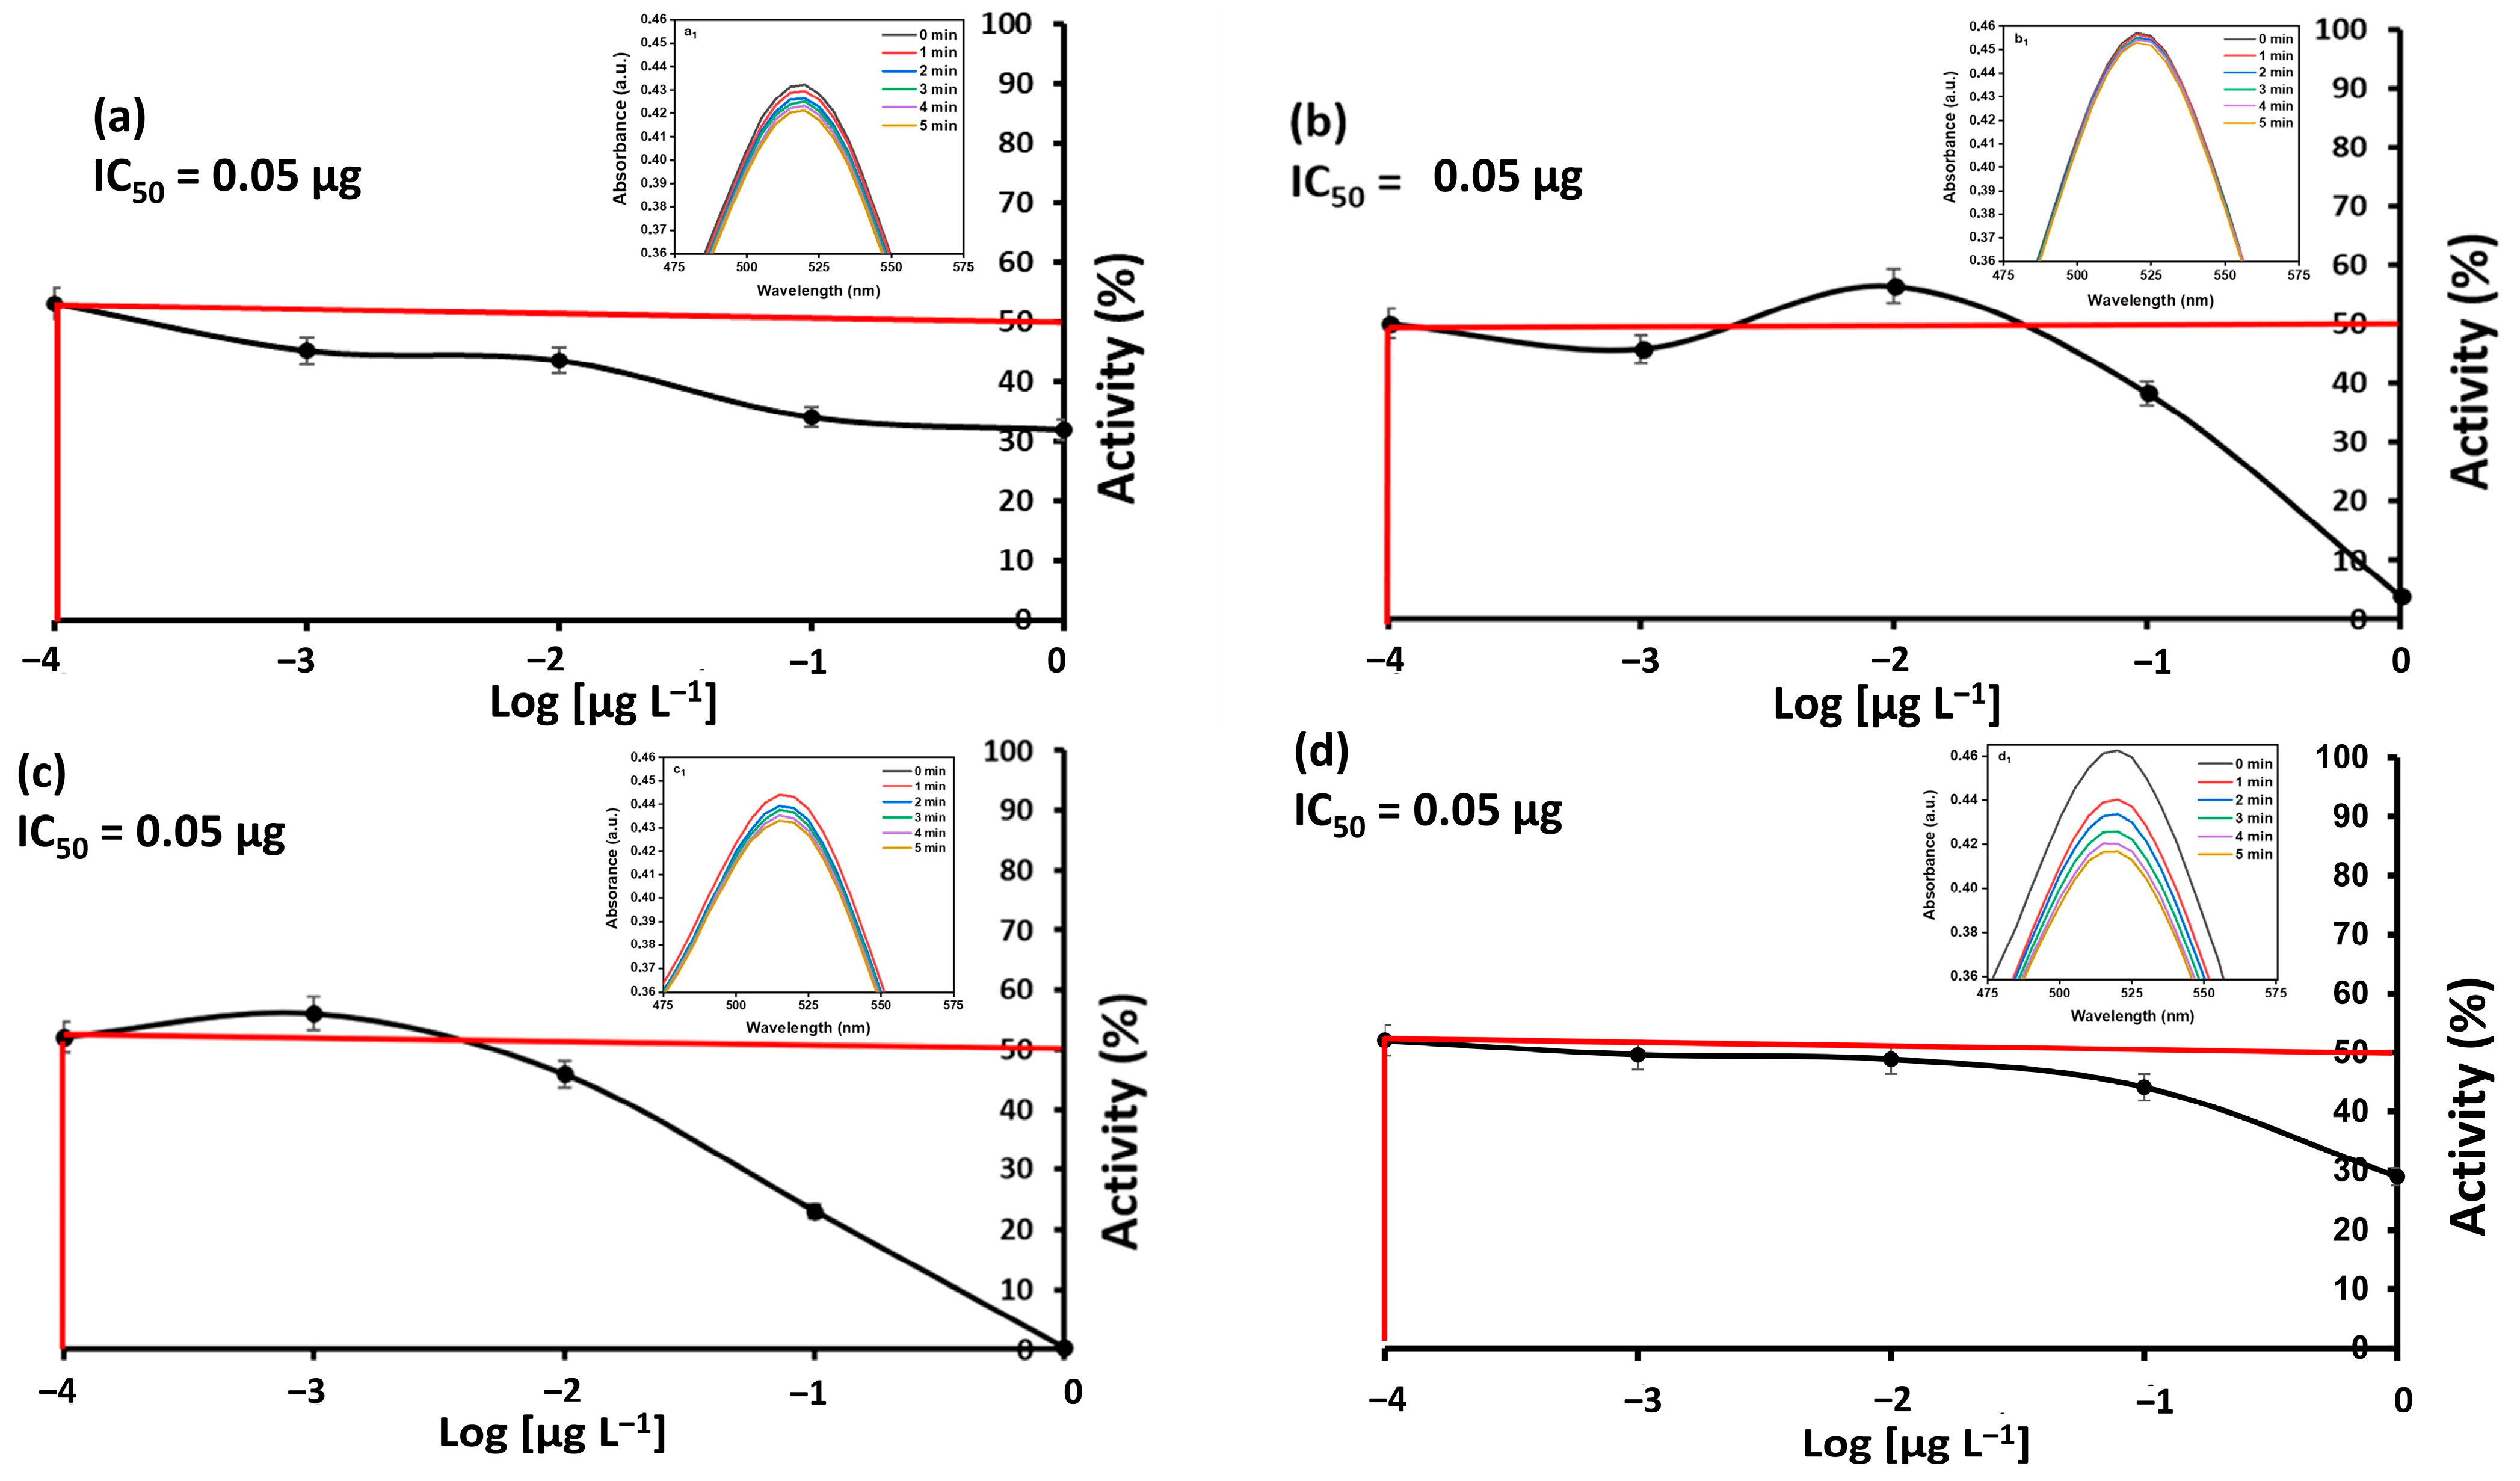
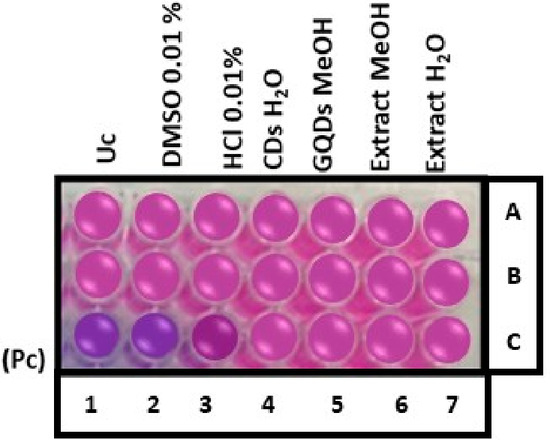
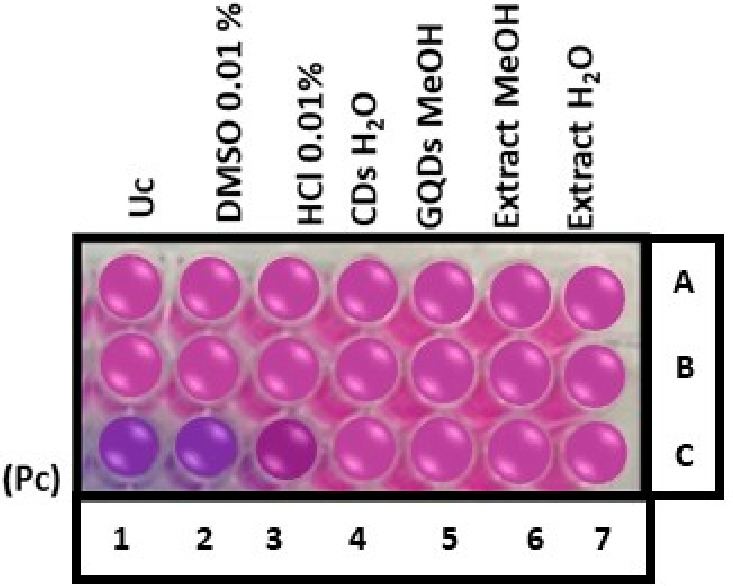
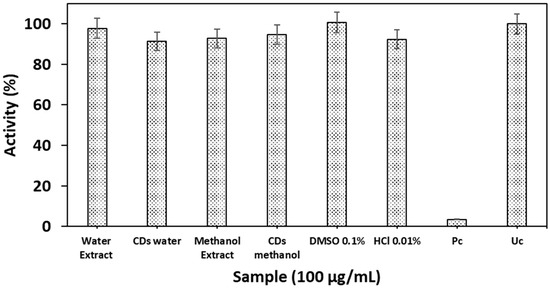
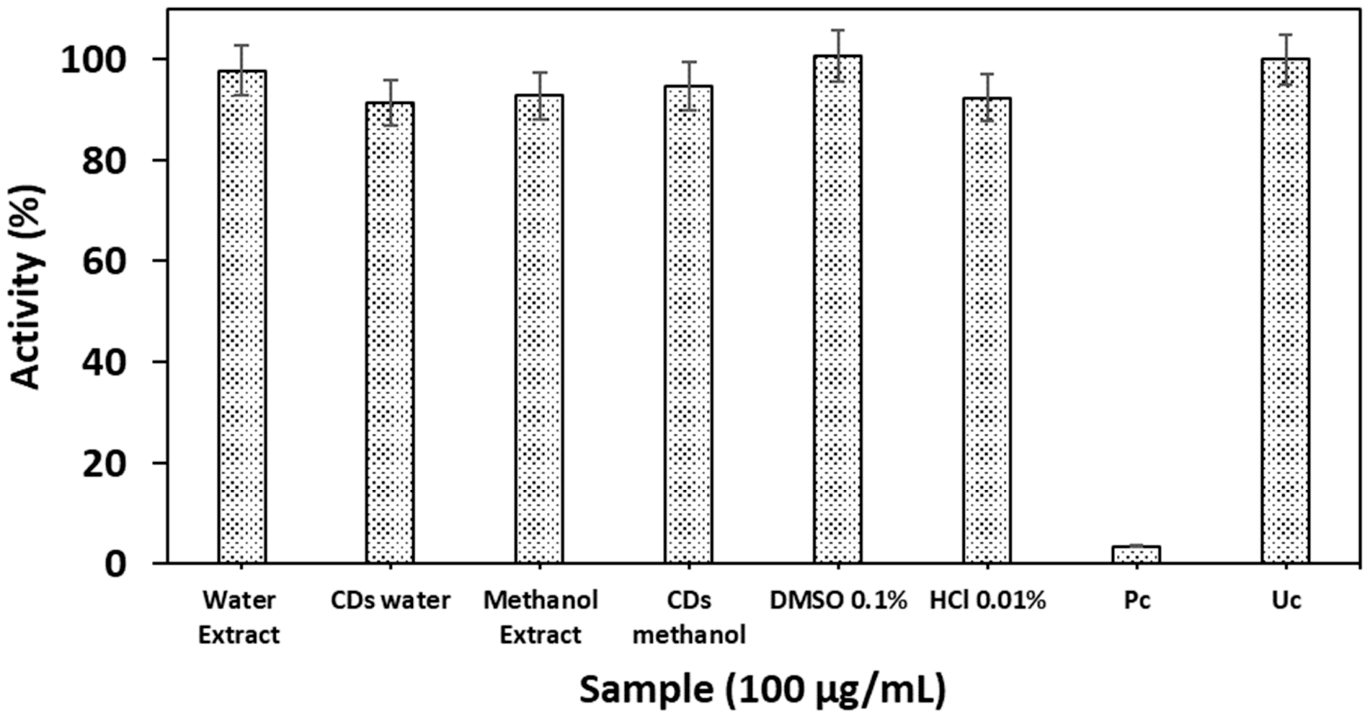
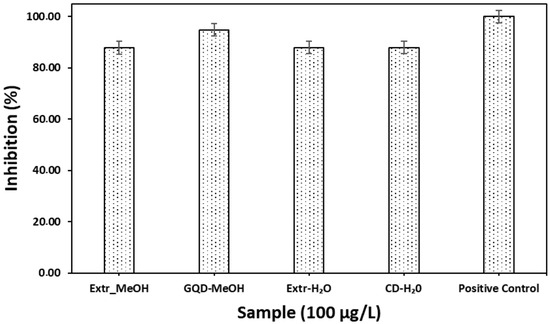
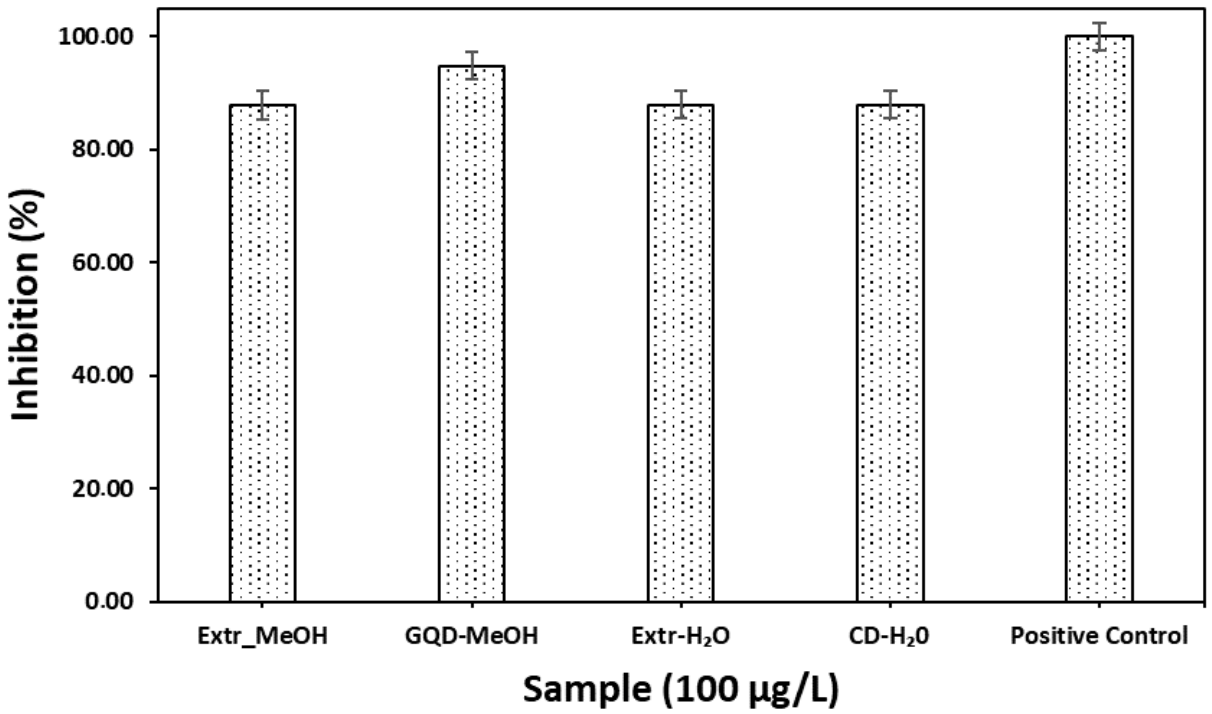



Disclaimer/Publisher’s Note: The statements, opinions and data contained in all publications are solely those of the individual author(s) and contributor(s) and not of MDPI and/or the editor(s). MDPI and/or the editor(s) disclaim responsibility for any injury to people or property resulting from any ideas, methods, instructions or products referred to in the content. |
© 2026 by the authors. Licensee MDPI, Basel, Switzerland. This article is an open access article distributed under the terms and conditions of the Creative Commons Attribution (CC BY) license.