


Abstract
This study compared strength retention and subsequent drying shrinkage of cement-stabilized aeolian sand–aggregate bases under four environmental exposures. Four mixtures combined total binder contents of 6% and 7% with aeolian sand contents of 32% and 41%. After 28 d of standard curing, separate specimen groups underwent low-temperature exposure, hot–dry exposure, thermal cycling, or sulfate freeze–thaw cycling. Strength was evaluated after 7 and 28 d of additional exposure; independent groups underwent 7 d of pre-exposure followed by 15 d of drying measurements. Relative to age-matched controls, hot–dry strength was numerically 4.1% higher at 7 d but 24.7% lower at 28 d, averaged across mixtures. Day-15 shrinkage after hot–dry pre-exposure was 20.3% higher. Sulfate freeze–thaw cycling produced the lowest average strength retention at 7 d (79.3%), whereas thermal cycling produced the lowest retention at 28 d (65.7%). Higher binder content corresponded to greater 28 d strength retention and greater drying shrinkage. Lower aeolian sand content corresponded to greater residual strength and lower shrinkage. These descriptive comparisons indicate that mixture assessment should consider exposure duration, absolute performance, and relative changes.
1. Introduction
Stable performance under extreme environmental conditions is a key requirement for road base materials in desert regions. Hot, dry conditions, sustained low temperatures, and large temperature fluctuations expose these materials to conditions that differ from standard curing. Where saline water is present, freezing and salt action may further affect load-bearing capacity and volume stability. Incorporating locally available aeolian sand into cement-stabilized aggregate bases offers an opportunity to use local resources. Previous studies have established a basis for mixture design and pavement performance assessment [1,2,3,4,5]. However, the ability of these materials to retain their performance after initial strength development depends on the environment and exposure duration. Their strength evolution and deformation under extreme environmental conditions therefore require further examination.
Low temperatures and freezing affect the performance of cemented aeolian sand materials. Li et al. used triaxial tests to investigate strength deterioration in cement-improved aeolian sand subjected to repeated freeze–thaw cycles [6]. Xu and Ruan examined the freeze–thaw response of fiber-reinforced cement-improved aeolian sand using nuclear magnetic resonance, providing evidence of internal structural changes [7]. In saline environments, contact with salt solutions may act together with changes in temperature and moisture. Dong et al. investigated aeolian sand concrete under sulfate wetting–drying cycles and related structural changes to performance deterioration [8]. These studies show that low-temperature and salt-related responses must be interpreted in the context of the exposure regime. Sustained low temperatures, temperature cycling, and sulfate freeze–thaw cycling differ in their thermal histories and moisture and salt conditions. Their effects on base materials should therefore be evaluated separately.
Evidence from related base materials helps place these responses in context. Li et al. associated freeze–thaw strength deterioration in cement–silt-modified aeolian sand with changes in pore geometry [9]. Jumassultan et al. examined strength and durability losses in calcium sulfoaluminate cement-treated sand [10], and Xiao et al. evaluated freeze–thaw damage in skeleton-dense cement-stabilized crushed stone using mechanical and acoustic measurements [11]. These systems differ in binder composition and aggregate structure, so their results provide comparative evidence rather than direct validation of the present mixtures.
Performance changes under hot, dry conditions also merit attention. Yan et al. examined the unconfined compressive strength of cement-improved aeolian sand at different curing temperatures [12]. Ruan et al. further investigated its compressive behavior under high-temperature curing [13]. These findings suggest that temperature effects depend on material composition and curing conditions. For base materials that have completed initial curing, high-temperature exposure also changes the moisture conditions. The short-term response may therefore differ from that under continued exposure. Thermal cycling involves repeated heating and cooling and should be distinguished from constant low-temperature or hot–dry exposure. Evaluations of extreme temperature effects need to account for both the exposure regime and its duration. In particular, they should establish whether early strength changes persist and whether the most adverse environment changes over time.
Environmental effects may persist during drying after exposure ends. Wassermann et al. showed that wetting–drying degradation of cement-treated sand depended on cement dosage and cycle intensity [14]. Although repeated cycling differs from the subsequent drying considered here, it demonstrates why moisture history must be specified. Different thermal and saline histories may alter the initial moisture state, particle bonding, and internal defects at the start of drying. These changes may affect subsequent water loss and shrinkage. Studies of cement-stabilized aggregate and aeolian sand mixtures have examined shrinkage and cracking resistance, providing a basis for assessing volume stability [15,16]. Liu et al. modeled shrinkage and microcracking in cement paste at high relative humidity and related drying deformation to moisture changes and restraint [17]. For aeolian sand base materials previously exposed to extreme conditions, it remains necessary to determine whether the exposure history changes subsequent shrinkage and whether water loss and shrinkage follow similar temporal patterns. Including these responses in the assessment helps characterize the effects that persist after exposure.
Previous studies have clarified aspects of temperature, freeze–thaw, and salt effects on cemented aeolian sand materials. Two questions remain for cement-stabilized aeolian sand bases exposed to extreme conditions in desert regions. First, sustained low temperatures, hot–dry exposure, thermal cycling, and sulfate freeze–thaw cycling impose different stresses, and their adverse effects may change with exposure duration. Findings from different material systems and exposure regimes do not directly establish the relative sensitivity of the same base material to these environments. They also do not establish whether short-term strength behavior represents the response to continued exposure. Second, environmental effects may persist into the subsequent drying period. Strength measurements during exposure alone cannot establish how the prior exposure history affects water loss and shrinkage. Comparisons within a common material system and under the same initial curing conditions are therefore needed. Combining strength evolution with subsequent drying behavior allows environmental suitability to be assessed in terms of both load-bearing capacity and volume stability. Wang et al. [18] studied high-temperature curing and freeze–thaw cycling in water and sodium sulfate solution for cement–fly-ash-stabilized aeolian sand gravel. The present study focuses on exposure after 28 d of initial curing and combines strength measurements at two additional exposure durations with subsequent drying measurements on independent specimen groups.
This study investigated aeolian sand–aggregate base materials stabilized with a cement–fly ash–silica fume binder. Four mixtures with different binder and aeolian sand contents were subjected to low-temperature exposure, hot–dry exposure, thermal cycling, and sulfate freeze–thaw cycling. After 28 d of standard curing, specimens underwent an additional 7 or 28 d of environmental exposure. Their unconfined compressive strengths were compared with those of age-matched controls that remained under standard curing. Separate specimen groups underwent 7 d of pre-exposure followed by 15 d of water-loss and drying-shrinkage measurements. Strength retention and the stages of water loss and shrinkage were then used to compare the environmental responses of the mixtures. Possible mechanisms were discussed on the basis of the macroscopic results. The findings provide experimental evidence for selecting aeolian sand base mixtures and assessing their suitability for extreme environmental conditions in desert regions.
2. Materials and Methods
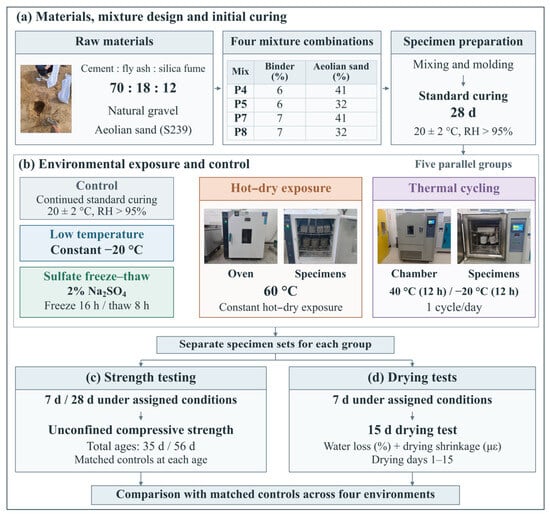
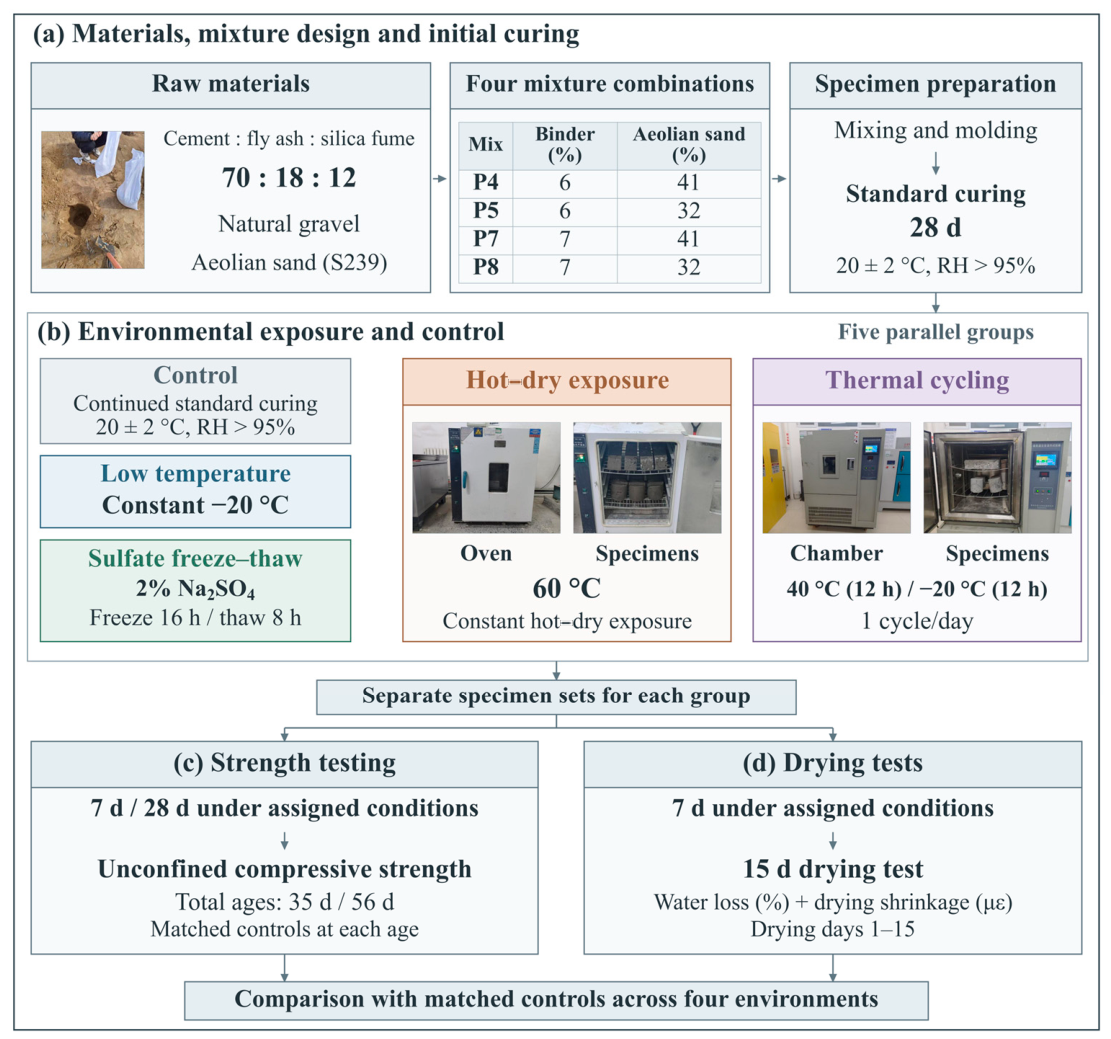
The experimental program comprised material selection and mixture design, initial curing, environmental exposure, and separate specimen groups for strength testing and drying measurements. Figure 1 summarizes the program.
Figure 1.
Experimental program: (a) materials, mixtures, and 28 d initial curing; (b) matched control and four independent exposures; (c) strength testing after 7 and 28 d of additional exposure (total ages of 35 and 56 d); (d) separate drying specimens monitored for 15 d after 7 d of pre-exposure or matched standard curing.
2.1. Raw Materials and Mixture Design
2.1.1. Raw Materials and Their Properties
The binder consisted of ordinary Portland cement (P·O 42.5), fly ash, and silica fume. Table 1 and Table 2 present the chemical composition and properties of the cement, respectively. Table 3 lists the properties of the natural sand and gravel by size fraction. The fly ash was Grade II, Class F fly ash produced in Xinjiang, with a SiO2 content of 58.8%, a loss on ignition of 6.31%, and a 28 d activity index of 71%. The silica fume was also sourced from Xinjiang. Its SiO2 content was 94.78%, its specific surface area was 16,350 m2/kg, and its 28 d activity index was 108%. The aeolian sand was collected from the Gurbantunggut Desert along the Wucaiwan–Jimusar County section of the S239 highway reconstruction and expansion project. Its apparent density and chemical composition are given in Table 4 and Table 5, respectively. The SiO2 content was 76.28%. In Table 4, “far” and “near” describe the relative distance of the sampling locations from the traffic lane, while “windward” and “leeward” describe the slope orientation. Aggregate sieve and crushing-value test procedures were based on JTG 3432—2024 [19]. Table 3 presents measured properties of the source fractions.
Table 1.
Cement chemical composition.
Table 2.
Cement properties.
Table 3.
Natural aggregate properties.
Table 4.
Aeolian sand apparent density.
Table 5.
Aeolian sand chemical composition.
The initial moisture content of the aeolian sand was 0.46%. Sieve analysis and moisture-content testing of the source sand followed JTG 3432—2024 [19]; the sieve analysis used three parallel determinations. The source sand was predominantly fine, with particles mainly in the 0.075–0.30 mm range. Before mixture preparation, the sand was washed to reduce clay impurities and dried to control its initial moisture condition. The source-sand grading should be distinguished from the final combined grading after substitution.
2.1.2. Aggregate Gradation and Mixture Design
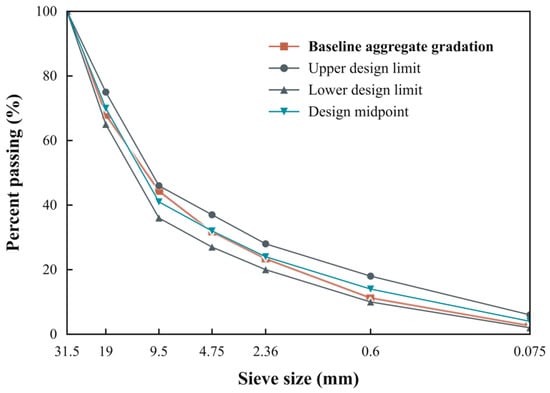
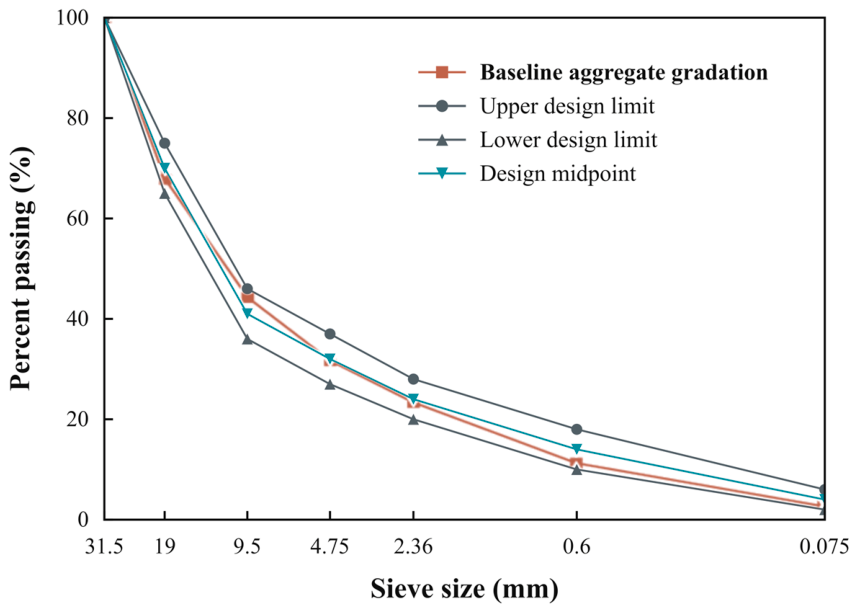
A dense gradation with a strongly interlocking aggregate skeleton was used as the baseline for aggregate substitution. The design aimed to form a load-bearing skeleton of coarse aggregate, with fines and binder paste filling the voids. Table 6 gives the sieve-passing limits for this baseline gradation. Natural aggregate sieve-test results were used to select the proportions of five size fractions, D1–D5, in the mass ratio 30:29:9:8:24. Table 7 lists their nominal size ranges and proportions, and Figure 2 shows the combined baseline gradation. Part of the natural aggregate was then replaced with aeolian sand. The size classes in Table 3 characterize the source aggregate, whereas D1–D5 in Table 7 are the nominal batching fractions used for recombination. These two classifications serve different purposes and are not interchangeable sieve limits.
Table 6.
Baseline gradation limits.
Table 7.
Baseline aggregate fractions and proportions.
Figure 2.
Baseline aggregate gradation before substitution. The upper and lower design limits and their midpoint are shown.
The environmental program used four mixtures, P4, P5, P7, and P8, combining total binder contents of 6% and 7% with aeolian sand contents of 32% and 41% (Table 8). These two binder levels provide a one-percentage-point dosage comparison at a fixed binder composition, while the two sand levels allow comparison of the tested aggregate-substitution schemes. They define the experimental comparison range rather than a minimum required dosage or a continuous optimum. Total binder comprised cement, fly ash, and silica fume and was dosed at 6% or 7% of the combined dry mass of aeolian sand and natural aggregate, equivalent to 6 or 7 kg per 100 kg of dry aggregate. Aeolian sand contents of 32% and 41% were based on the same aggregate mass. At 32%, fractions D4 and D5 were replaced completely, retaining D1, D2, and D3 at 30%, 29%, and 9%, respectively. At 41%, fractions D3, D4, and D5 were replaced completely, retaining D1 and D2 at 30% and 29%. The cement:fly ash:silica fume mass ratio was 70:18:12 within the binder.
Table 8.
Mixture proportions.
2.2. Specimen Preparation and Environmental Exposure
2.2.1. Specimen Preparation and Initial Curing
Specimens were prepared using the mixtures in Table 8 and initially cured for 28 d at 20 ± 2 °C and a relative humidity (RH) above 95% (Figure 1a). The specimens for unconfined compressive strength testing were cylinders 150 mm in diameter and 150 mm in height. After initial curing, the specimens were assigned to groups according to the exposure condition and test type. Separate groups were used for strength testing and drying measurements, with the same mixtures and initial curing conditions. Six specimens were used for each experimental condition (n = 6). The applicable loading and drying measurement procedures were based on JTG 3441—2024 [20]. Six-specimen groups and the curing and exposure schedule were study-specific features of the comparative environmental program.
2.2.2. Exposure Groups and Conditions
A standard-cured control and four environmental exposure groups were established (Figure 1b). The control continued to cure at 20 ± 2 °C and RH > 95%. Low-temperature exposure was conducted at a constant −20 °C. Hot–dry exposure was conducted in a forced-air oven at 60 °C and RH < 10%. Thermal cycling alternated between 40 °C for 12 h and −20 °C for 12 h, with one cycle per day. For sulfate freeze–thaw exposure, specimens were immersed in a 2% Na2SO4 solution and subjected to daily freezing at −20 °C for 16 h and thawing at 20 °C for 8 h. The four exposures were applied independently; the 60 °C oven was used only for hot–dry exposure.
For strength testing, the additional environmental exposure periods were 7 and 28 d. The controls continued under standard curing for the same periods, giving total ages of 35 and 56 d, respectively. For the drying measurements, specimens underwent only 7 d of environmental pre-exposure, while the controls received a further 7 d of standard curing. All groups then underwent 15 d of drying measurements. Hereafter, environmental exposure time is measured from the end of the initial 28 d curing period, and drying time is measured from the end of the 7 d pre-exposure period.
2.3. Test Methods and Evaluation Metrics
2.3.1. Unconfined Compressive Strength
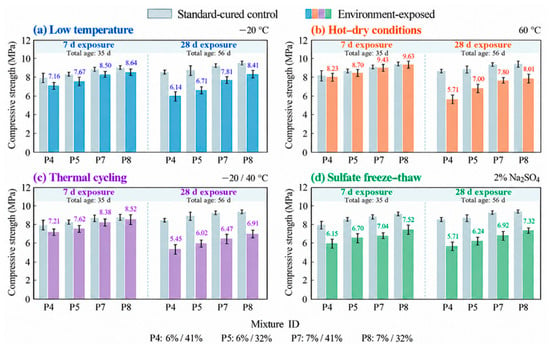
The unconfined compression loading procedure was based on T0805—2024 of JTG 3441—2024 [20], using a displacement rate of 1 mm/min. Individual strength was calculated as the maximum applied load divided by the specimen cross-sectional area, A = πD2/4, where D is the cylinder diameter. Six specimens were tested for each mixture–exposure–age combination (n = 6). The strengths in Figure 3 and Supplementary Table S1 are representative condition-level values. Each exposed group was compared with the standard-cured control of the same mixture and total age. The curing and environmental histories were those specified in Section 2.2. Comparisons are descriptive, without claims of statistical significance.
Figure 3.
Compressive strength under environmental exposure: (a) low temperature; (b) hot–dry conditions; (c) thermal cycling; (d) sulfate freeze–thaw. Exposure durations of 7 and 28 d follow 28 d initial curing, giving total ages of 35 and 56 d. Gray bars show matched controls; colored bars and labels show exposed-group representative strengths. Each condition comprised six specimens (n = 6), and error bars indicate experimental variability.
2.3.2. Water Loss and Drying Shrinkage Strain
After 7 d of environmental pre-exposure or matched standard curing, drying measurements were conducted using a procedure based on T0854—2024 of JTG 3441—2024 [20]. The drying environment was maintained at 20 ± 0.5 °C and 60 ± 5% RH. Water loss, W, and shrinkage strain, ε, were recorded on drying days 1, 2, 3, 4, 5, 6, 7, 9, 11, 13, and 15. Six specimens were prepared for each mixture–pre-exposure condition in the drying program. The 28 d initial curing, 7 d pre-exposure, and 15 d observation period were study-specific modifications to the conditioning history and measurement schedule.
Cumulative water loss was calculated as W(t) = 100[m0 − m(t)]/md, where m0 is the mass at the start of drying observation, m(t) is the mass at drying time t, and md is the oven-dry constant mass determined after the observation period. Cumulative shrinkage strain was calculated as ε(t) = 106ΔL(t)/L0, where ΔL(t) is accumulated shortening and L0 is the measured initial specimen length. W is expressed in percent and ε in microstrain (με). Supplementary Tables S2 and S3 provide the corresponding condition-level time series. Day 15 is the observation endpoint rather than an equilibrium or ultimate value.
2.3.3. Stage Characteristics and Relative Performance Metrics
The drying period was divided into three intervals for descriptive comparison: days 1–4, 4–7, and 7–15. Measurement days 4 and 7 served as common boundaries. The average rate of change in a metric X over an interval was calculated as
where X denotes W or ε, and ta and tb are the start and end of the interval, respectively, expressed as drying time in days. When X is W expressed as a percentage, rW is expressed in percentage points per day. When X is ε, rε is expressed in με/d. The cumulative value at day 7 as a percentage of the measured day 15 value was calculated as
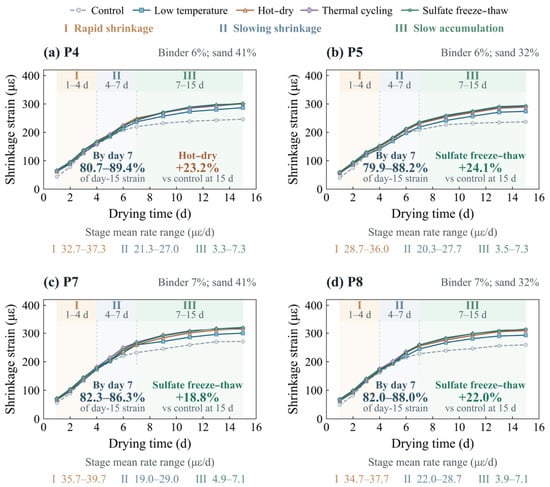
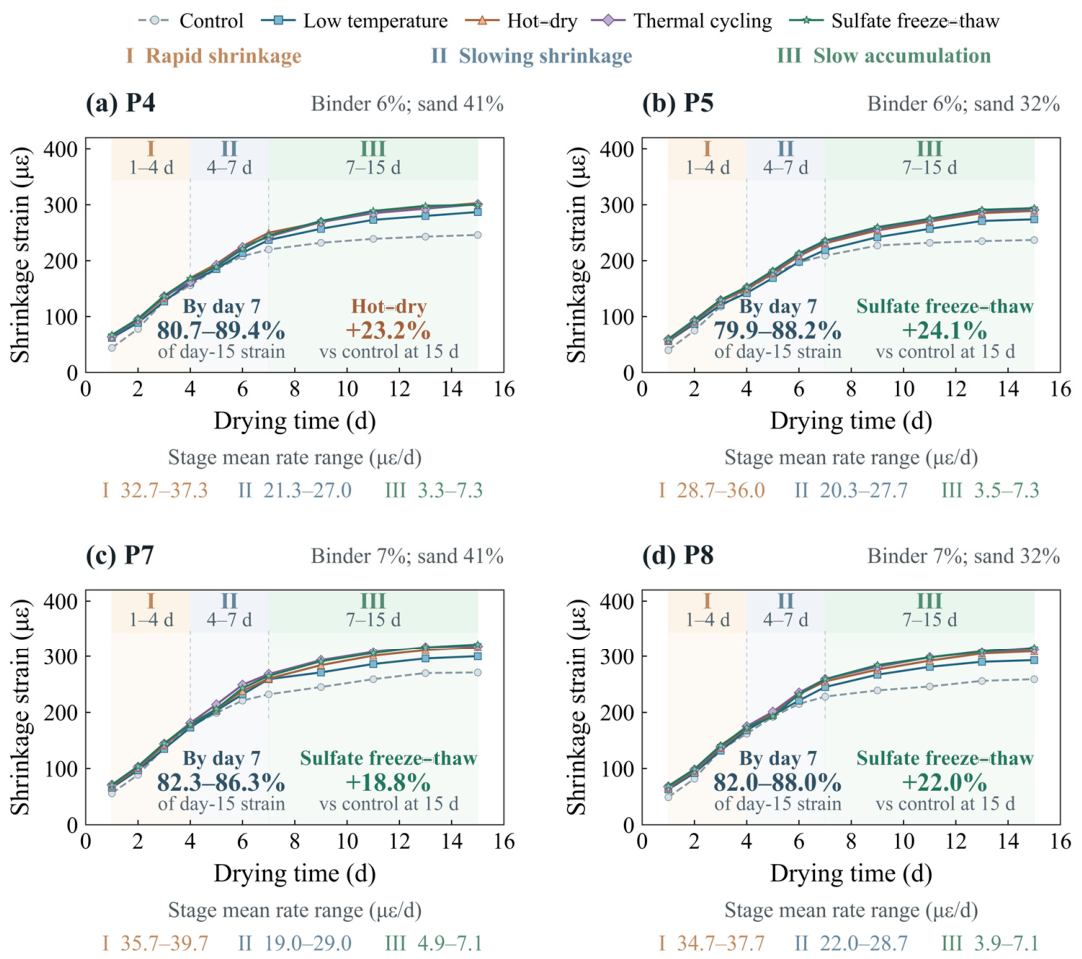
where FX,7 is expressed as a percentage, and 7 and 15 denote drying times in days. Equations (1) and (2) were used to obtain the stage rates and cumulative percentages in Figure 4 and Figure 5. The reported ranges span the five curves for each mixture: the matched control and the four exposure conditions. They do not describe variability among replicate specimens. The three intervals provide a common basis for describing the process. They are not interpreted as uniquely fitted change points or boundaries between moisture states.
Figure 4.
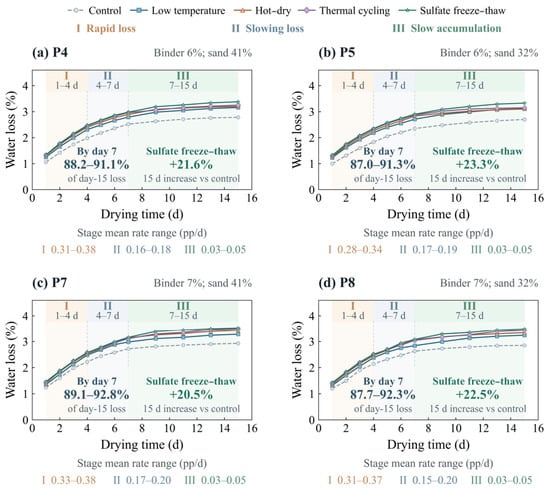
Water loss after environmental pre-exposure: (a) P4; (b) P5; (c) P7; (d) P8. Pre-exposure lasted 7 d. Stages I–III cover drying days 1–4, 4–7, and 7–15. Rate and day-7 fraction ranges span the five conditions in each panel, rather than replicate variability. Six specimens were prepared per mixture–pre-exposure condition in the drying program.
Figure 5.
Drying shrinkage after environmental pre-exposure: (a) P4; (b) P5; (c) P7; (d) P8. The 7 d pre-exposure and stage intervals match Figure 4. Rate and day-7 fraction ranges span the five conditions in each panel; fractions refer to day-15 values. Highlighted increases identify the largest day-15 change relative to the matched control. All groups underwent the same subsequent drying conditions. Six specimens were prepared per mixture–pre-exposure condition in the drying program.
Strength retention relative to the matched control at the same total age was calculated as
where fE,t and fC,t are the representative compressive strengths of the exposed group and its matched standard-cured control, respectively, in MPa. E denotes the exposure condition, and C denotes the standard-cured control of the same mixture. The exposure time t is 7 or 28 d after initial curing. Rf,t is expressed as a percentage and is used in Figure 6a,b. The water loss ratio and drying shrinkage strain ratio on drying day 15 were calculated as
where WE(15) and WC(15) denote water loss on drying day 15 in the pre-exposed group and the control, respectively; εE(15) and εC(15) denote the corresponding drying shrinkage strains. The ratios calculated using Equations (4) and (5) are expressed as percentages and are used in Figure 6c,d. The environmental pre-exposure period was 7 d in all cases. Relative increase and strength loss were calculated as
Figure 6.
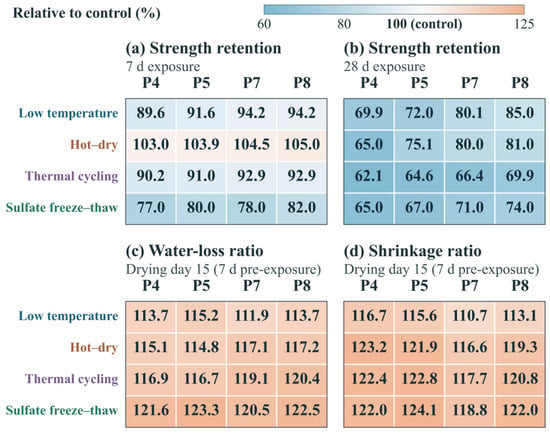
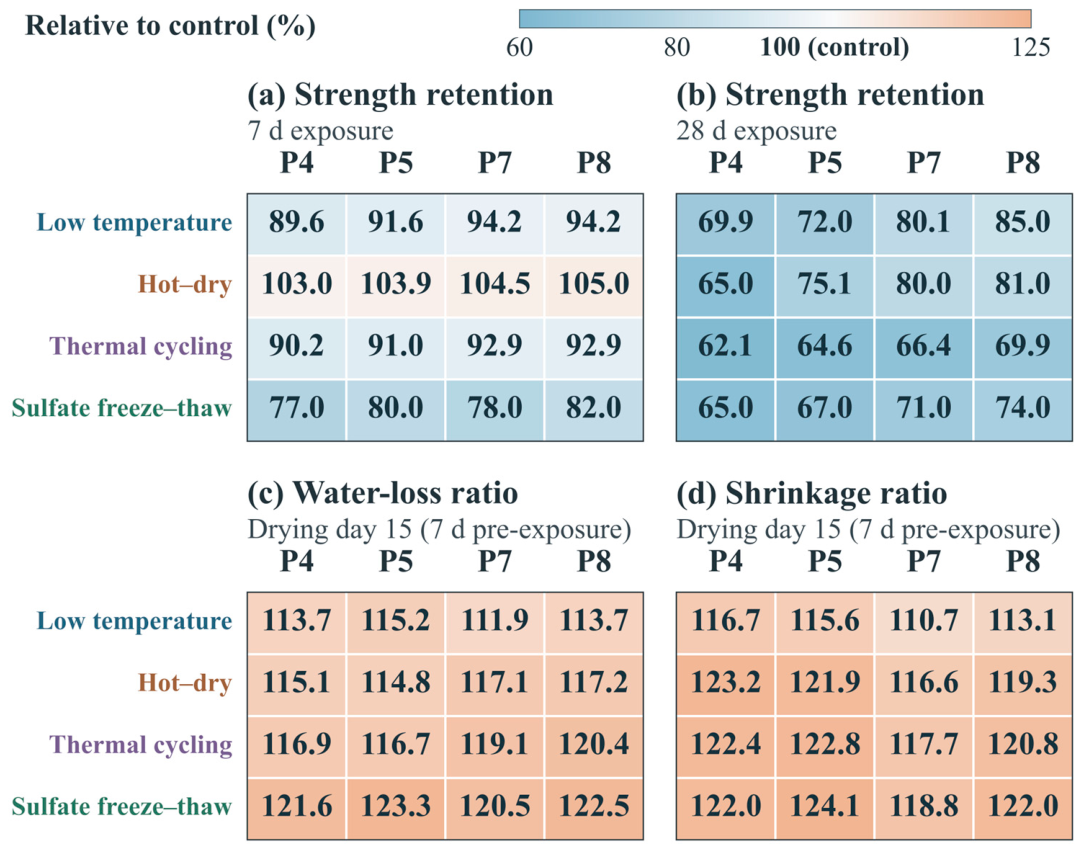
Normalized performance: (a,b) strength retention after 7 and 28 d exposure; (c,d) day-15 water-loss and shrinkage ratios after 7 d pre-exposure. Ratios equal exposed-group values divided by matched-control values × 100%. The control reference is 100%. Colors show descriptive point estimates.
In Equation (6), XE and XC are the values of W or ε for the same mixture at the same drying time. Equation (7) uses the time and control definitions in Equation (3); a negative loss indicates a relative increase in strength. The late-stage contribution was calculated by subtracting the percentage in Equation (2) from 100%. It represents the increment from day 7 to day 15 as a percentage of the day 15 value. All relative metrics were calculated from measured performance values. For each environment, a matched ratio was first calculated for each of the four mixtures. The unrounded ratios were then averaged, and the result was rounded. This average is taken across mixtures, not replicate specimens. In Figure 6, higher strength retention indicates better preservation of load-bearing capacity, whereas lower water loss and drying shrinkage strain ratios indicate smaller relative increases. The three metrics are interpreted separately.
3. Results
3.1. Compressive Strength Under Extreme Environmental Exposure
Figure 3 compares the representative compressive strengths after 7 and 28 d of additional exposure to the four environments. The controls gained strength with continued standard curing: their strength range increased from 7.99–9.17 MPa at a total age of 35 d to 8.78–9.89 MPa at 56 d. In every exposure group, the 28 d strength was lower than the corresponding 7 d value. The decrease in strength retention therefore reflects both the strength reduction in the exposed specimens and the continued strength gain in the controls.
3.1.1. Low-Temperature Exposure
After 7 d of low-temperature exposure, all four mixtures had lower strengths than their matched controls. Strength losses ranged from 5.8% to 10.4%, averaging 7.6%. After 28 d, the losses increased to 15.0–30.1%, with an average of 23.2% [Figure 3a]. At 28 d, increasing the binder content or decreasing the aeolian sand content improved both residual strength and strength retention. P8 reached 8.41 MPa with 85.0% retention, compared with 6.14 MPa and 69.9% for P4. The adverse effect of low-temperature exposure was greater at the longer of the two durations examined, although strength retention varied among mixtures.
3.1.2. Hot–Dry Exposure
Hot–dry exposure was the only condition under which all four mixtures had numerically higher strengths than their matched controls at 7 d. The numerical increases ranged from 3.0% to 5.0%, averaging 4.1% [Figure 3b]. After 28 d, all four mixtures had lower strengths than their controls of the same total age, with an average loss of 24.7%. For P4, strength decreased from 8.23 MPa at 7 d to 5.71 MPa at 28 d, corresponding to a 28 d loss of 35.0%. For P8, strength decreased from 9.63 to 8.01 MPa, with a 28 d loss of 19.0%. The initial gain and subsequent reduction occurred under the same exposure regime. Thus, the 7 d strength gain did not persist with prolonged exposure.
3.1.3. Thermal Cycling
After 7 d of thermal cycling, the average strength loss was 8.2%, close to that under low-temperature exposure. It increased to 34.3% at 28 d, the largest average loss among the four environments at this time [Figure 3c]. The 28 d strengths ranged from 5.45 to 6.91 MPa and were lower than those of the corresponding sulfate freeze–thaw groups for every mixture. P8 retained the highest residual strength, but its strength loss still reached 30.1%. Within the range tested, changes in mixture composition therefore mitigated, but did not prevent, the adverse effect of the prescribed cycling regime.
3.1.4. Sulfate Freeze–Thaw Cycling
After 7 d of sulfate freeze–thaw cycling, strength losses ranged from 18.0% to 23.0%, averaging 20.7%, making this the most adverse environment for strength at this time. The average loss increased to 30.8% at 28 d but remained below the 34.3% loss under thermal cycling [Figure 3d]. The strengths of the sulfate freeze–thaw groups decreased by only 0.12–0.46 MPa between the two times. Their further decline in strength retention also reflected continued strength gain in the controls. At 7 d, P7 had a higher absolute strength than P5, whereas their strength retentions were 78.0% and 80.0%, respectively. A higher absolute strength therefore did not necessarily indicate a smaller relative loss.
3.2. Water Loss After Environmental Pre-Exposure
3.2.1. Cumulative Water Loss and Stage-Average Rates
Figure 4a–d show the water-loss curves for P4, P5, P7, and P8, respectively. Water loss increased with drying time in all 20 curves. The stage-average rates decreased successively over days 1–4, 4–7, and 7–15, with respective ranges of 0.277–0.380, 0.153–0.203, and 0.026–0.054 percentage points/d. By day 7, cumulative water loss had reached 87.0–92.8% of the day-15 value. Most of the water loss observed during the test therefore occurred within the first 7 d, followed by slower accumulation.
3.2.2. Effects of Exposure Environment and Mixture Composition on Water Loss
On day 15, water loss after each of the four pre-exposure conditions exceeded that of the matched control. The controls ranged from 2.70% to 2.93%, whereas the sulfate freeze–thaw groups ranged from 3.33% to 3.53% and had the highest day-15 values for every mixture. The ordering of the other environments varied among mixtures. For P5, for example, water loss after low-temperature pre-exposure was 3.11%, slightly above the 3.10% after hot–dry pre-exposure. The ordering at day 15 also differed from that at earlier times. For P7, water loss after hot–dry pre-exposure exceeded that after thermal cycling on day 7 but was lower on day 15 [Figure 4c].
At a fixed binder content, reducing the aeolian sand content from 41% to 32% decreased the day-15 water loss by 0.04–0.10 percentage points across all five conditions. At a fixed aeolian sand content, increasing the binder content from 6% to 7% increased it by 0.12–0.28 percentage points. P5 had the lowest absolute day-15 water loss under every condition, and P7 had the highest.
3.3. Drying Shrinkage After Environmental Pre-Exposure
3.3.1. Drying Shrinkage Strain and Stage-Average Rates
Figure 5a–d show the drying shrinkage curves for P4, P5, P7, and P8, respectively. Strain increased throughout the observation period in all 20 curves. The stage-average rates decreased across the three descriptive intervals, with respective ranges of 28.7–39.7, 19.0–29.0, and 3.3–7.3 με/d. The day-7 strain accounted for 79.9–89.4% of the day-15 value.
Expressed as fractions of the respective day-15 values, the increments over days 7–15 ranged from 10.6% to 20.1% for shrinkage strain and from 7.2% to 13.0% for water loss. The late-stage shrinkage fraction exceeded the corresponding water-loss fraction in 19 of the 20 mixture–condition combinations, including all 16 environmental pre-exposure combinations. The P5 control was the only exception: its late-stage shrinkage fraction was 11.8%, below the water-loss fraction of 13.0%. Thus, in most combinations, a larger fraction of the observed shrinkage than of the observed water loss accumulated during the later interval.
For P4, the strain increment over days 7–15 was 53 με after hot–dry pre-exposure, compared with 26 με for the control. Accumulation during this later interval therefore contributed appreciably to the difference between their day-15 shrinkage strains.
3.3.2. Effects of Exposure Environment and Mixture Composition on Drying Shrinkage
On day 15, the control strains ranged from 237 to 271 με, and each environmental pre-exposure group exceeded its matched control. The highest strains for P5, P7, and P8 occurred after sulfate freeze–thaw pre-exposure and were 294, 322, and 316 με, respectively. For P4, hot–dry pre-exposure produced the highest value, 303 με, slightly above the 301 με after thermal cycling and 300 με after sulfate freeze–thaw cycling. These small differences establish numerical rankings only; they do not demonstrate statistical significance.
At a fixed binder content, reducing the aeolian sand content from 41% to 32% decreased the day-15 strain by 6–14 με across all five conditions. At a fixed aeolian sand content, increasing the binder content from 6% to 7% increased it by 13–25 με. P5 had the lowest absolute day-15 strain, and P7 the highest. These patterns apply to the end of the observation period; some curves crossed earlier. For example, the P5 low-temperature group had a lower strain than its control on day 4 but a higher strain on day 15 [Figure 5b].
3.4. Relative Performance Across Exposure Environments
3.4.1. Strength Retention and Its Dependence on Exposure Duration
Based on the mean strength retention across the four mixtures, the environments ranked from lowest to highest at 7 d as sulfate freeze–thaw cycling, thermal cycling, low-temperature exposure, and hot–dry exposure. At 28 d, the order was thermal cycling, sulfate freeze–thaw cycling, hot–dry exposure, and low-temperature exposure [Figure 6a,b]. The most adverse environment shifted from sulfate freeze–thaw cycling at 7 d, with a mean retention of 79.3%, to thermal cycling at 28 d, with 65.7%. The same shift occurred in all four mixtures, indicating that the responses to the prescribed exposure regimes developed differently with time.
P8 had the highest 28 d strength retention in all four environments, ranging from 69.9% to 85.0%, compared with 62.1–69.9% for P4. At 7 d, however, the mixture rankings varied among environments. The relative advantage of a mixture in strength retention therefore also depended on exposure duration.
3.4.2. Water-Loss and Shrinkage Strain Ratios
The day-15 water-loss and shrinkage strain ratios in Figure 6c,d all exceeded 100%. The mean increases in water loss were 13.6%, 16.0%, 18.3%, and 22.0% after low-temperature, hot–dry, thermal cycling, and sulfate freeze–thaw pre-exposure, respectively. The corresponding mean increases in shrinkage strain were 14.0%, 20.3%, 20.9%, and 21.7%. Thus, the strength gain after 7 d of hot–dry exposure coexisted with greater subsequent shrinkage after the same pre-exposure. Sulfate freeze–thaw pre-exposure produced the largest mean increases in both drying indicators, whereas thermal cycling gave the lowest strength retention at 28 d. The most adverse environment therefore depended on the response being assessed.
A smaller relative increase did not necessarily mean less absolute shrinkage. After sulfate freeze–thaw pre-exposure, the shrinkage strain ratio was 118.8% for P7, below the 124.1% for P5. Their absolute strains, however, were 322 and 294 με, respectively, giving the opposite ranking because the P7 control strain was higher than that of P5. Normalized indicators describe changes relative to each mixture’s own control. Mixture evaluation therefore also needs to account for absolute deformation. For P5, the strain increase was 57 με, from 237 to 294 με, while P7 increased by 51 με, from 271 to 322 με. The P5 water-loss increase was 0.63 percentage points, from 2.70% to 3.33%, corresponding to a relative increase of 23.3%. These examples show why relative increases should be considered together with control baselines and absolute values. Changes in grading, moisture distribution, pore connectivity, and residual salt may contribute to the response, but these factors were not measured separately in this environmental program.
4. Discussion
4.1. Possible Damage Mechanisms Under Different Exposures
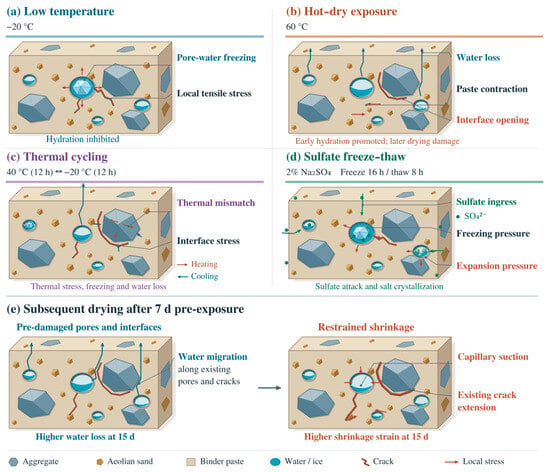
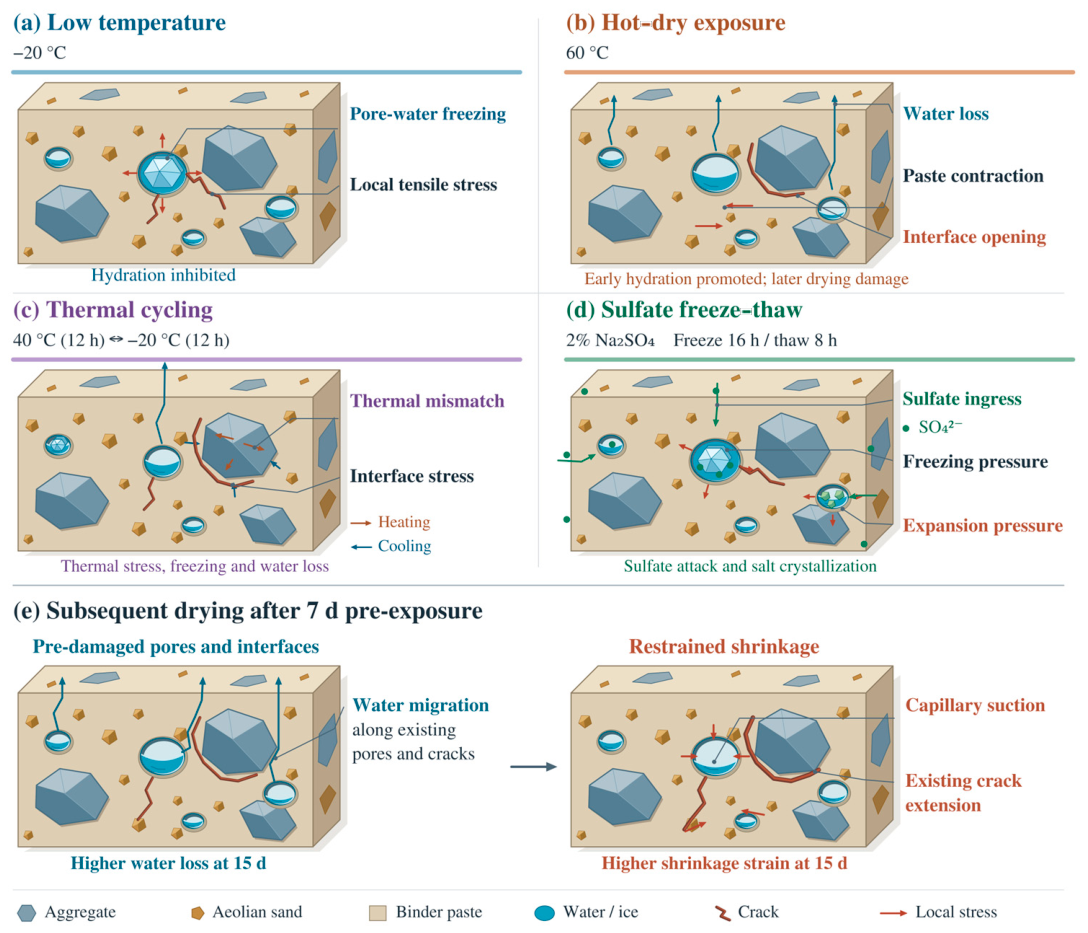
Figure 7 summarizes possible mechanisms based on the observed macroscopic performance and relevant literature. The pores, interfaces, cracks, and deposits shown are conceptual illustrations. The following interpretations are not based on direct microstructural observations or identification of reaction products in this study.
Figure 7.
Conceptual damage and shrinkage mechanisms: (a) low temperature; (b) hot–dry conditions; (c) thermal cycling; (d) sulfate freeze–thaw; (e) subsequent drying. Pore, interface, crack, and deposit features are conceptual interpretations rather than direct microstructural observations.
4.1.1. Mechanisms Under Low-Temperature and Hot–Dry Exposure
Under low-temperature exposure, strength loss increased with exposure duration, and the strength of the exposed specimens also decreased. These changes may reflect suppressed subsequent binder reactions and localized disturbance caused by freezing [Figure 7a]. A constant temperature of −20 °C restricts water and ion transport, while freezing of some pore water may alter local stresses in the paste and at interfaces. Poroelastic descriptions of freezing in cementitious materials provide a physical basis for such stresses [21], although the present study did not measure pore pressure. Li et al. [6] observed changes in strength and structure during freeze–thaw testing of cement-improved aeolian sand, providing related evidence that freezing can affect cementation. In the present constant-temperature exposure, the relative strength loss also reflects the continued strength gain of the control.
The strength gain at 7 d and loss at 28 d under hot–dry exposure may reflect competition between temperature-accelerated reactions and sustained water loss [Figure 7b]. Water initially remains available for reaction, and the elevated temperature may promote reactions of the unreacted binder. Temperature-dependent changes in cement hydration and microstructure have been documented for Portland cement pastes [22]. Gallucci et al. further examined temperature-dependent C–S–H microstructure under isothermal curing [23]. These curing studies provide context rather than direct verification of changes caused by the present post-curing hot–dry exposure. Continued drying subsequently limits these reactions and increases the mismatch between paste shrinkage and restraint from the aggregate skeleton. Moisture conditions at testing may also affect short-term strength. Ruan et al. [13] reported reduced strength in cement-improved aeolian sand of a specific composition cured at 70 °C, showing that temperature effects depend on both the material and curing conditions. The increased drying shrinkage strain in the independent specimens after 7 d of the same pre-exposure further indicates that a short-term gain in load-bearing capacity does not necessarily imply improved volume stability.
4.1.2. Mechanisms Under Thermal Cycling and Sulfate Freeze–Thaw Cycling
Strength loss was greater under sulfate freeze–thaw cycling than under thermal cycling at 7 d, but the ranking reversed at 28 d. This reversal indicates different time-dependent strength responses to the two exposure regimes. During thermal cycling, differential thermal deformation of the paste and particles, freezing at low temperature, and water loss during heating repeatedly affect the interfaces [Figure 7c]. The resulting local disturbances may accumulate, consistent with the greater strength reduction at 28 d. Changes in cementation and structure with repeated cycling reported in freeze–thaw research [6] also support this possible explanation. Kong et al. linked freeze–thaw deterioration in cement-stabilized weathered sand to progressive pore enlargement and weakening of interparticle cementation [24]. This provides related microstructural evidence, although the material and cycling regime differ from those tested here.
The relatively large early strength loss under sulfate freeze–thaw cycling may partly reflect changes in moisture conditions during contact with the solution. Freezing, solute concentration, reactions, or crystallization may also induce stresses on pore walls [Figure 7d]. Dong et al. [8] observed changes in pores and products of sulfate attack in aeolian sand concrete under sulfate wetting–drying cycles. Liu et al. [25] reported pore filling and retained performance in cement- and fly-ash-stabilized aeolian sand gravel. Santhanam et al. observed staged expansion and internal cracking in Portland cement mortars immersed in sodium sulfate solution [26]. Such immersion evidence provides context for chemical deterioration but does not isolate its contribution during the present freeze–thaw exposure. Salt crystallization in porous materials can generate stress under suitable supersaturation conditions [27], but no salt phases were identified here. The balance between filling and damage depends on the material and cycling regime. Thus, the greater early adverse response to sulfate freeze–thaw cycling does not imply that this exposure remains the most detrimental over longer periods.
4.2. Effects of Environmental Pre-Exposure and Mixture Composition
4.2.1. Amplification of Subsequent Water Loss and Drying Shrinkage by Environmental Pre-Exposure
The day-15 values of water loss and drying shrinkage strain were higher than those of the matched control after each of the four pre-exposure conditions. After hot–dry pre-exposure, the mean increase in drying shrinkage strain was 20.3%, exceeding the 16.0% increase in water loss. The two increases were similar after sulfate freeze–thaw pre-exposure. Across all mixture–pre-exposure combinations, the late-stage increment in drying shrinkage strain accounted for a larger proportion of its own day-15 value than did the corresponding increment in water loss. Deformation therefore continued to accumulate as water loss slowed, and the two measures did not change proportionally.
Pre-exposure may alter pores, interfaces, and the initial moisture distribution at the start of drying, thereby affecting subsequent water migration. When the aggregate skeleton restrains paste shrinkage, local stresses may promote the extension of existing defects [Figure 7e]. The cement paste model developed by Liu et al. [17] for high relative humidity links capillary pore water evaporation to shrinkage and restraint and was evaluated using free-shrinkage tests. It provides a basis for understanding the relationship between moisture changes and deformation, although its applicability is limited by the assumed initial saturation and humidity conditions.
The hydration-pressure model of Maruyama relates drying deformation to adsorbed-water interactions and material history [28]. Multiscale modeling by Pinson et al. connects sorption and shrinkage hysteresis to water in different pore domains [29], while first-drying experiments show that moisture loss can modify cement-paste pore structure and mechanical properties [30]. These studies support considering moisture history, but the corresponding pore-scale changes were not measured in the present mixtures.
4.2.2. Mixture Design Trade-Offs Between Strength Retention and Shrinkage Control
Increasing binder content from 6% to 7% improved both absolute strength and strength retention at 28 d under all four exposures. However, it increased the day-15 drying shrinkage strain in the independent drying tests. A higher binder content may strengthen particle bonding and load transfer while increasing the amount of binder phase that contributes to drying deformation. This is consistent with the observed trade-off between load-bearing capacity and shrinkage control. These responses should be assessed separately; higher strength alone does not establish improved volume stability.
At a given binder content, reducing aeolian sand content from 41% to 32% both increased residual strength at 28 d and reduced the day-15 drying shrinkage strain. These changes may be related to altered load transfer and restraint within the skeleton as the size fractions and proportions of the remaining natural aggregate change. Water demand during mixing and the degree of compaction may also contribute. Qamhia et al. associated higher relative density with better freeze–thaw and wet–dry durability in field-extracted, chemically stabilized quarry by-products [31]. Liu et al. [25] found that increasing the aeolian sand proportion reduced strength in cement- and fly-ash-stabilized aeolian sand gravel, indicating the importance of particle composition to load-bearing performance. Because aeolian sand replaced size fractions of the baseline aggregate, sand content and aggregate composition changed together. The observed trends therefore describe the tested substitution schemes rather than an isolated effect of sand content at an unchanged grading.
P8 had the highest strength retention at 28 d. P5 had the lowest absolute day-15 water loss and drying shrinkage strain under the control condition and all four pre-exposure conditions. P7 showed a smaller relative increase in drying shrinkage strain but the highest absolute strain, illustrating the influence of the control baseline on normalized comparisons. Mixture selection should therefore consider absolute strength and shrinkage first, followed by performance retention after exposure. The present results support comparisons among the four tested mixtures; identifying an optimum over a continuous range of compositions requires additional mixture compositions.
These environmental comparisons are limited to the temperature, humidity, and solution conditions used in this study. The measurements at 7 and 28 d describe performance differences under the specified regimes. Separating the chemical and freezing contributions to sulfate freeze–thaw effects requires matched controls subjected to freeze–thaw cycling in pure water and to sulfate immersion without freezing. Moisture conditions at the start of drying may also affect subsequent water loss and deformation. Interpretations involving changes in pores, interfaces, and reaction products require further validation by direct microstructural measurements. The representative strengths and condition-level drying responses support descriptive comparisons. Small numerical differences and mixture rankings are not interpreted as statistically established differences.
5. Conclusions
- (1)
- Under hot–dry exposure, a numerical short-term strength increase coexisted with an increased tendency for subsequent shrinkage. The four mixture-specific strength ratios, calculated from representative exposed and matched-control strengths, averaged 104.1% after 7 d of additional exposure and 75.3% after 28 d. In independent specimens subjected to 7 d of the same pre-exposure, the day-15 values of water loss and drying shrinkage strain increased by an average of 16.0% and 20.3%, respectively. These results indicate distinct responses in strength retention and subsequent volume stability.
- (2)
- Under the specified exposure regimes, the environment associated with the lowest strength retention changed with exposure duration. Sulfate freeze–thaw cycling produced the lowest mean strength retention at 7 d, at 79.3%, whereas thermal cycling produced the lowest value at 28 d, at 65.7%. This change occurred in all four mixtures. Assessments of environmental performance should therefore consider both the exposure regime and its duration.
- (3)
- All four environmental pre-exposures increased the day-15 values of water loss and drying shrinkage strain. Sulfate freeze–thaw pre-exposure produced the largest mean increases, at 22.0% and 21.7%, respectively. The mean rates of water loss and drying shrinkage decreased across successive stages. For all 16 mixture–pre-exposure combinations, the increments over days 7–15 were compared as fractions of their respective day-15 values. The shrinkage fraction exceeded the water-loss fraction in every case. The two measures therefore differed in their relative late-stage accumulation.
- (4)
- Within the tested mixture range, increasing binder content from 6% to 7% corresponded to greater residual strength and strength retention at 28 d but increased the day-15 drying shrinkage strain. Reducing aeolian sand content from 41% to 32% corresponded to both greater residual strength at 28 d and lower day-15 drying shrinkage strain. P8 (7% binder and 32% aeolian sand) had the highest strength retention at 28 d, whereas P5 (6% binder and 32% aeolian sand) had the lowest absolute day-15 values of water loss and drying shrinkage strain. These differences illustrate the mixture design trade-off between strength retention and shrinkage control.
Supplementary Materials
The following supporting information can be downloaded at: https://www.mdpi.com/article/10.3390/ma19224875/s1, Table S1, representative compressive strengths; Table S2, water-loss time series; and Table S3, drying-shrinkage time series.
Author Contributions
Conceptualization, X.J.; methodology, X.J.; investigation, J.W. and Y.L.; data curation, J.W.; formal analysis, X.F.; writing—original draft preparation, X.F.; writing—review and editing, X.J. and Y.L.; resources, W.S. and X.W.; project administration, W.S. and X.W.; supervision, X.J. All authors have read and agreed to the published version of the manuscript.
Funding
This study was funded by the scientific research and development project of Xinjiang Communications Investment (Group) Co., Ltd. (ZKX-FWCG-202412-0809), and the Tianshan Talent Training Program (Grant No. 2024TSYCCY0002).
Data Availability Statement
The original contributions presented in this study are included in the article/Supplementary Materials. Further inquiries can be directed to the corresponding author.
Acknowledgments
During the preparation of this manuscript, the authors used Codex (OpenAI, GPT-6) and OpenAI’s image-generation tool for language polishing. The authors have reviewed and edited the output and take full responsibility for the content of this publication.
Conflicts of Interest
Authors Xiao Fu, Wenjie Shang, and Xuekui Wang were employed by the company Xinjiang Academy of Transportation Sciences Co., Ltd. This study received funding from Xinjiang Communications Investment (Group) Co., Ltd. The funding sponsor had no role in the design of the study; in the collection, analysis, or interpretation of data; in the writing of the manuscript; or in the decision to publish the results. The remaining authors declare no conflicts of interest.
References
- Ma, S.B.; Chang, J.Y.; Wei, L.Y.; Wu, Y. Orthogonal experimental study of cement-stabilized aeolian sand and crushed stone for pavement bases. J. Chongqing Jiaotong Inst. 2004, 23, 48–51. (In Chinese) [Google Scholar]
- Guo, G.S.; Zhang, F. Mix design of cement-stabilized crushed stone and aeolian sand for pavement bases based on unconfined compressive strength. Sci. Technol. Eng. 2018, 18, 326–331. (In Chinese) [Google Scholar]
- Guo, G.S.; Zhang, Y.; Du, S.M. Experimental study of the shear strength of cement-stabilized aeolian sand base materials. Sci. Technol. Eng. 2017, 17, 322–326. (In Chinese) [Google Scholar]
- Song, L.R.; Li, B.Y. Effects of aeolian sand content on the mechanical properties and durability of cement-stabilized graded crushed stone. Bull. Chin. Ceram. Soc. 2020, 39, 1421–1429. (In Chinese) [Google Scholar]
- Kong, Y.K. Road performance of cement- and fly-ash-stabilized aeolian sand. North. Commun. 2007, 84–86. (In Chinese) [Google Scholar]
- Li, J.; Wang, F.; Yi, F.; Wu, F.; Liu, J.; Lin, Z. Effect of freeze-thaw cycles on triaxial strength property damage to cement improved aeolian sand (CIAS). Materials 2019, 12, 2801. [Google Scholar] [CrossRef] [Scilit] [PubMed]
- Xu, C.W.; Ruan, B. NMR investigation of fiber- and cement-improved aeolian sand under freeze–thaw cycles. J. Railw. Sci. Eng. 2021, 18, 2289–2298. (In Chinese) [Google Scholar]
- Dong, R.X.; Shen, X.D.; Xue, H.J.; Liu, Q. Sulfate Resistance Mechanism of Aeolian Sand Concrete Under Dry-Wet Cycles. Mater. Rep. 2020, 34, 24040–24044. (In Chinese) [Google Scholar] [CrossRef]
- Li, X.; Miao, C.; Shi, Z. Evolution of Pore Structure and Damage Mechanism Analysis of Cement–Silt-Modified Eolian Sand Under Freeze–Thaw Cycles. Materials 2025, 18, 3800. [Google Scholar] [CrossRef] [Scilit] [PubMed]
- Jumassultan, A.; Sagidullina, N.; Kim, J.; Ku, T.; Moon, S.-W. Performance of cement-stabilized sand subjected to freeze-thaw cycles. Geomech. Eng. 2021, 25, 41–48. [Google Scholar] [CrossRef]
- Xiao, R.; An, B.; Wu, F.; Wang, W.; Sui, Y.; Wang, Y. Freeze–Thaw Damage Characterization of Cement-Stabilized Crushed Stone Base with Skeleton Dense Gradation. Materials 2024, 17, 1228. [Google Scholar] [CrossRef] [Scilit] [PubMed]
- Yan, W.; Ruan, B.; Zheng, S.L.; Ding, H.; Nie, R.S.; Ruan, C.X. Experimental study of the unconfined compressive strength of cement-improved aeolian sand at different curing temperatures. J. Railw. Sci. Eng. 2021, 18, 678–686. (In Chinese) [Google Scholar] [CrossRef]
- Ruan, B.; Zheng, S.L.; Ding, H.; Nie, R.S.; Ruan, C.X. Experimental study of the compressive strength of cement-improved aeolian sand under high-temperature curing. J. Railw. Eng. Soc. 2021, 38, 1–6. (In Chinese) [Google Scholar]
- Wassermann, A.; Abdallah, A.; Cuisinier, O. Impact of wetting and drying cycles on the mechanical behaviour of a cement-treated soil. Transp. Geotech. 2022, 36, 100804. [Google Scholar] [CrossRef] [Scilit]
- Zhang, W.S. Shrinkage Behavior of Cement-Stabilized Crushed Stone Materials. Master’s Thesis, University of Science and Technology Liaoning, Anshan, China, 2019. (In Chinese) [Google Scholar]
- Chen, L.B.; Zhang, K.; Huang, B.L. Shrinkage and cracking resistance of cement-stabilized crushed stone containing aeolian sand. In Proceedings of the Symposium on New Materials, New Technologies, and Their Engineering Applications in Civil Engineering, Beijing, China, 28–31 October 2019; Volume II. (In Chinese) [Google Scholar]
- Liu, L.; Wang, X.; Chen, H.; Wan, C. Microstructure-based modelling of drying shrinkage and microcracking of cement paste at high relative humidity. Constr. Build. Mater. 2016, 126, 410–425. [Google Scholar] [CrossRef] [Scilit]
- Wang, B.; Zhao, Y.; Zheng, P.; Liu, J.; Zhu, S. Durability and damage evolution of cement-fly ash stabilized aeolian sand gravel under high-temperature curing and freeze–thaw cycles. Sci. Rep. 2026, 16, 8519. [Google Scholar] [CrossRef] [Scilit] [PubMed]
- JTG 3432—2024; Test Methods of Aggregate for Highway Engineering. Ministry of Transport of the People’s Republic of China: Beijing, China, 2024. (In Chinese)
- JTG 3441—2024; Test Methods of Materials Stabilized with Inorganic Binders for Highway Engineering. Ministry of Transport of the People’s Republic of China: Beijing, China, 2024. (In Chinese)
- Coussy, O.; Monteiro, P.J.M. Poroelastic model for concrete exposed to freezing temperatures. Cem. Concr. Res. 2008, 38, 40–48. [Google Scholar] [CrossRef] [Scilit]
- Lothenbach, B.; Winnefeld, F.; Alder, C.; Wieland, E.; Lunk, P. Effect of temperature on the pore solution, microstructure and hydration products of Portland cement pastes. Cem. Concr. Res. 2007, 37, 483–491. [Google Scholar] [CrossRef] [Scilit]
- Gallucci, E.; Zhang, X.; Scrivener, K. Effect of temperature on the microstructure of calcium silicate hydrate (C-S-H). Cem. Concr. Res. 2013, 53, 185–195. [Google Scholar] [CrossRef] [Scilit]
- Kong, X.; Cui, S.; Wang, G.; Hu, W.; Liang, Y.; Zhang, Z. Evolution Law and Mechanism of Freeze–Thaw Damage of Cement-Stabilized Weathered Sand. Coatings 2022, 12, 272. [Google Scholar] [CrossRef] [Scilit]
- Liu, J.; Wang, B.; Hu, C.; Chen, J.; Zhu, S.; Xu, X. Multiscale study of the road performance of cement and fly ash stabilized aeolian sand gravel base. Constr. Build. Mater. 2023, 397, 131842. [Google Scholar] [CrossRef] [Scilit]
- Santhanam, M.; Cohen, M.D.; Olek, J. Mechanism of sulfate attack: A fresh look: Part 1: Summary of experimental results. Cem. Concr. Res. 2002, 32, 915–921. [Google Scholar] [CrossRef] [Scilit]
- Flatt, R.J. Salt damage in porous materials: How high supersaturations are generated. J. Cryst. Growth 2002, 242, 435–454. [Google Scholar] [CrossRef] [Scilit]
- Maruyama, I. Origin of Drying Shrinkage of Hardened Cement Paste: Hydration Pressure. J. Adv. Concr. Technol. 2010, 8, 187–200. [Google Scholar] [CrossRef] [Scilit]
- Pinson, M.B.; Masoero, E.; Bonnaud, P.A.; Manzano, H.; Ji, Q.; Yip, S.; Thomas, J.J.; Bazant, M.Z.; Van Vliet, K.J.; Jennings, H.M. Hysteresis from Multiscale Porosity: Modeling Water Sorption and Shrinkage in Cement Paste. Phys. Rev. Appl. 2015, 3, 064009. [Google Scholar] [CrossRef] [Scilit]
- Maruyama, I.; Nishioka, Y.; Igarashi, G.; Matsui, K. Microstructural and bulk property changes in hardened cement paste during the first drying process. Cem. Concr. Res. 2014, 58, 20–34. [Google Scholar] [CrossRef] [Scilit]
- Qamhia, I.I.A.; Tutumluer, E.; Ozer, H.; Boler, H.; Shoup, H.; Stolba, A.J. Durability Aspects of Chemically Stabilized Quarry By-Product Applications in Pavement Base and Subbase. Transp. Res. Rec. 2020, 2674, 339–350. [Google Scholar] [CrossRef] [Scilit]

Disclaimer/Publisher’s Note: The statements, opinions and data contained in all publications are solely those of the individual author(s) and contributor(s) and not of MDPI and/or the editor(s). MDPI and/or the editor(s) disclaim responsibility for any injury to people or property resulting from any ideas, methods, instructions or products referred to in the content. |
© 2026 by the authors. Licensee MDPI, Basel, Switzerland. This article is an open access article distributed under the terms and conditions of the Creative Commons Attribution (CC BY) license.