


Abstract
A porous zinc oxide/copper oxide nanomaterial was synthesized by ultrasonic spray pyrolysis at 400 °C from an aqueous 90:10 Zn:Cu cation feed, using a 1.7 MHz atomizer and argon without added hydrogen. X-ray diffraction confirms dominant wurtzite ZnO; weaker features are compatible with candidate Cu2O and CuO contributions, but the copper-containing phases are not unambiguously resolved. Reliable phase fractions and the Zn:Cu ratio in the collected powder are not established. Reflection-mode Scherrer estimates give a mean ZnO coherent-domain size of 17.1 nm after correction with an instrumental FWHM of 0.08° obtained from a silicon standard. Previously processed transmission-mode fits give apparent sizes of 22.0–27.1 nm, with the FWHM-based Halder–Wagner representation showing the strongest linearity (R2 = 0.9460). The model comparison remains exploratory because individual transmission widths are not tabulated and the W–H fits have weak linearity. The 500 and 600 °C profiles retain the principal ZnO reflections and support a qualitative temperature comparison. SEM reveals porous, agglomerated, partially hollow secondary structures, and EDS confirms Zn, O, and Cu without establishing a quantitative Zn:Cu ratio. A proposed droplet-to-particle mechanism describes possible routes to local phase contact. Surface copper speciation, nanoscale contact, and an electronic heterojunction remain unverified.
1. Introduction
Zinc oxide (ZnO) is a widely studied n-type semiconductor oxide because of its low cost, well-characterized physicochemical properties, characteristic wurtzite structure, and use in photocatalytic, sensing, optoelectronic, and surface-mediated processes. Copper(I) oxide (Cu2O), by contrast, is a p-type semiconductor with a substantially narrower optical band gap. When interfacial contact and electronic coupling are established, the combination of n-type ZnO and p-type Cu2O can form a functional heterojunction [1,2,3]. Archela et al. investigated electrodeposited ZnO/Cu2O photoelectrodes [1], Akter et al. combined structural characterization with XPS in coprecipitated composites [2], and Arunodaya et al. examined the optical and electrical behavior of Cu2O/ZnO thin-film heterojunctions [3]. These studies motivate investigation of ZnO/Cu2O composites, but their electronic and surface-chemical conclusions are specific to their own specimens. The designation zinc oxide/copper oxide nanomaterial encompasses the ZnO-dominant material with candidate Cu2O/CuO contributions, without specifying their relative amounts. The nanoscale description refers to ZnO coherent domains; the copper oxide domain sizes and interfaces remain unresolved. A spatially resolved interface and a functional p–n junction have not been demonstrated. Phase contact, interfacial organization, and the relative amount of each component are therefore relevant design variables rather than experimentally resolved properties of the present powder. From a materials-design perspective, the synthetic route is consequently not a neutral processing step: it influences phase segregation, particle architecture, coherent-domain size, porosity, and the spatial scale over which oxide phases may be brought into contact. Conventional preparation routes include post-synthetic mechanochemical processing of preformed powders as well as in situ precipitation or reduction strategies. Abdolhoseinzadeh and Sheibani, for example, investigated ball-milled Cu2O powders modified with ZnO [4]. Mechanochemical processing and wet-chemical preparation can both generate useful composites, while differing in their control over phase contact and in their processing steps. Multistep wet-chemical routes commonly involve controlled reagent addition, washing, and separation. The aerosol route examined here offers a different way of bringing the dissolved precursors together before solidification; it is not assumed to produce better contact without comparative measurements. These considerations motivate aerosol-based approaches capable of combining precursor homogenization and particle formation within a single thermal sequence. The review by Nedelkovski et al. summarizes ZnO-based materials for Crystal Violet photodegradation, including the rationale for ZnO/Cu2O combinations [5]. It provides broader application context, while the interfacial and photocatalytic properties of the powder studied here remain to be tested.
Ultrasonic spray pyrolysis (USP) offers such an alternative. The process begins with ultrasonic atomization of a precursor solution, followed by aerosol transport through a heated reaction zone and thermal conversion of dissolved precursor species into solid particles. Individual aerosol droplets are commonly treated as isolated microreactors in which solvent evaporation, increasing solute concentration, precipitation, precursor decomposition, densification, and oxide formation occur sequentially or partly concurrently [6,7,8]. This droplet-to-particle concept is particularly useful for multicomponent systems because Zn- and Cu-containing species can be mixed at the ionic or molecular scale before solidification. The final microstructure nevertheless depends on competing transport and reaction rates: sufficiently rapid surface drying can generate a rigid outer layer while solvent and gaseous decomposition products remain within the droplet, which can promote hollow, semi-hollow, porous, or shell-like structures. Conversely, slower drying and extensive high-temperature consolidation tend to favor denser particles. Thus, USP provides a direct mechanistic link between process conditions and the morphology ultimately available for surface-controlled applications.
USP has been used to synthesize oxides, mixed oxides, supported phases, doped materials, and other multicomponent nanopowders when compositional homogeneity, adjustable stoichiometry, and continuous or semicontinuous production are desirable [9,10,11,12,13]. In ZnO-containing systems, spray-based synthesis has also been used to tune dopant content, carrier-gas conditions, particle morphology, and photocatalytic response [9,10,14]. For a ZnO/Cu2O composite, simultaneous introduction of Zn and Cu precursors into the same aerosol population is attractive because it can reduce the need for subsequent mechanical blending of independently synthesized oxide powders. At the same time, the possibility of generating an open and porous architecture is relevant because photocatalytic and related interfacial processes depend not only on crystallographic identity, but also on accessible surface area, interparticle voids, diffusion paths, and the extent of contact between phases. It is therefore important to evaluate phase composition and morphology together rather than infer one directly from the other.
The practical advantages of USP include relatively simple precursor-solution preparation, direct control of the feed composition, adjustable aerosol and furnace parameters, and a pathway toward scalable powder production [11]. These advantages do not imply that the process is insensitive to operating conditions. Dedicated atomization, gas-transport, heating, and collection equipment is required [14,15], and the resulting particle properties depend on droplet size, precursor chemistry and concentration, carrier-gas flow rate, residence time, solvent-evaporation kinetics, precursor decomposition, and furnace temperature. Temperature is especially important because it governs the completeness of precursor conversion and the balance between crystallization and sintering. In copper-containing systems, oxidation state can additionally depend on the local chemical environment. For example, reduction of Cu2O toward metallic Cu has been observed in an ethanol-assisted spray-pyrolysis system under reducing conditions [16]. Because those conditions differ from the aqueous Ar-transport conditions used here, that literature is treated as a caution concerning possible copper-phase evolution rather than as a direct mechanistic analogue of the present synthesis.
Previous works have already established ZnO/Cu2O composites and heterojunctions by electrodeposition, coprecipitation, thin-film preparation, and mechanochemical processing [1,2,3,4]. Spray pyrolysis has also been used to fabricate layered ZnO/Cu2O solar-cell structures: Panigrahi et al. investigated how the thicknesses of sequentially deposited layers affect device performance [17]. Accordingly, neither the oxide pairing nor spray pyrolysis in general is claimed as new. Those examples address particular processing routes or functional architectures; they do not establish the phase distribution or interface in an aerosol-derived powder produced from the present mixed aqueous feed. The review by Nedelkovski et al. [5] synthesizes previous literature; it does not report the present experimental USP powder synthesis. Prior spray-deposited layered devices [17] and a collected powder produced from a mixed aerosol feed also differ in their formation geometry and intended characterization. These distinctions define the scope of the comparison without implying priority for USP or the oxide combination.
The specific contribution of this study is the assessment of a collected porous zinc oxide/copper oxide nanomaterial produced by USP at 400 °C from a defined 90:10 Zn:Cu cation feed. The comparison of reflection-mode size estimates and processed transmission-mode model summaries illustrates the dependence of apparent ZnO domain size on the broadening representation. The study also identifies the limits of copper-phase assignment where Cu2O/ZnO overlap and possible CuO contributions are present. The 500 and 600 °C profiles provide a qualitative processing comparison, while SEM/EDS and the proposed droplet mechanism relate morphology to synthesis. No new oxide pairing, verified interface, photocatalytic improvement, or optimized processing temperature is claimed.
This characterization is relevant to the subsequent design of composite powders because selecting a synthesis condition requires knowing both which structural features are supported and which still need to be tested. A porous appearance and coexisting oxide diffraction contributions are insufficient to establish accessible surface area, interfacial charge separation, or catalytic performance. The present results provide a structural and morphological baseline for subsequent measurements of copper surface speciation, nanoscale contact, and functional response. The work therefore addresses synthesis and the reliability of its characterization; it does not demonstrate a photocatalytic improvement or an optimized processing temperature.
Here, USP was applied to prepare a zinc oxide/copper oxide nanomaterial using a 90:10 Zn:Cu cation molar feed. Assuming complete conversion exclusively to ZnO and Cu2O, the theoretical oxide distribution is 91.1 wt% ZnO and 8.9 wt% Cu2O; these are stoichiometric feed calculations, not measured phase fractions. The principal sample, ZCU-400, was examined by XRD and SEM/EDS. The earlier normalized Match! 4 output is examined in Section 3.1 as an incomplete two-phase model, rather than as a validated measurement of product composition. Reflection-mode Scherrer calculations and previously processed transmission-mode line-broadening summaries were compared to assess apparent domain scale and model dependence. Profiles at 500 and 600 °C were interpreted qualitatively. Particular attention is given to possible CuO contributions, reflection overlap, the limits of instrumental correction, and the distinction between crystalline-phase assignments and a demonstrated interface. A literature-supported proposed mechanism describes possible droplet-scale routes to porous particles and local phase contact.
2. Materials and Methods
2.1. Synthesis by Ultrasonic Spray Pyrolysis
ZCU-400 was prepared by USP from an aqueous solution containing zinc nitrate hexahydrate, Zn(NO3)2·6H2O, at 0.09 M and copper(II) acetate hydrate, Cu(CH3COO)2·2H2O, at 0.01 M. The precursor concentrations correspond to a Zn:Cu cation molar ratio of 90:10. Importantly, the cation ratio is not identical to the expected oxide mass ratio because two Cu atoms are required per formula unit of Cu2O. For 1 L of precursor solution, complete conversion would theoretically produce 0.09 mol ZnO and 0.005 mol Cu2O. Using molar masses of 81.38 g mol−1 for ZnO and 143.09 g mol−1 for Cu2O, the corresponding theoretical oxide masses are approximately 7.324 g ZnO and 0.715 g Cu2O, i.e., about 91.1 wt% ZnO and 8.9 wt% Cu2O. If all copper instead formed CuO, the same feed would yield approximately 90.2 wt% ZnO and 9.8 wt% CuO. A mixed Cu2O/CuO product requires a different mass balance. Accordingly, references in this work to a 90:10 feed denote the Zn:Cu cation ratio, whereas the theoretical 91.1:8.9 oxide mass distribution applies only to complete conversion to ZnO and Cu2O. The precursor salts were dissolved in distilled water and stirred magnetically at 500 rpm for 15 min at room temperature to obtain a homogeneous feed solution before atomization.
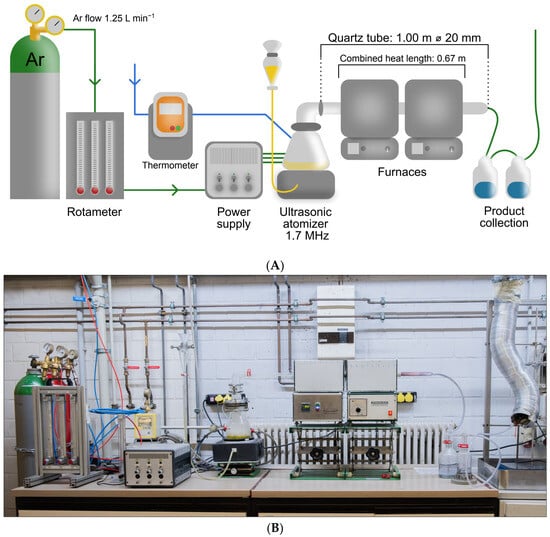
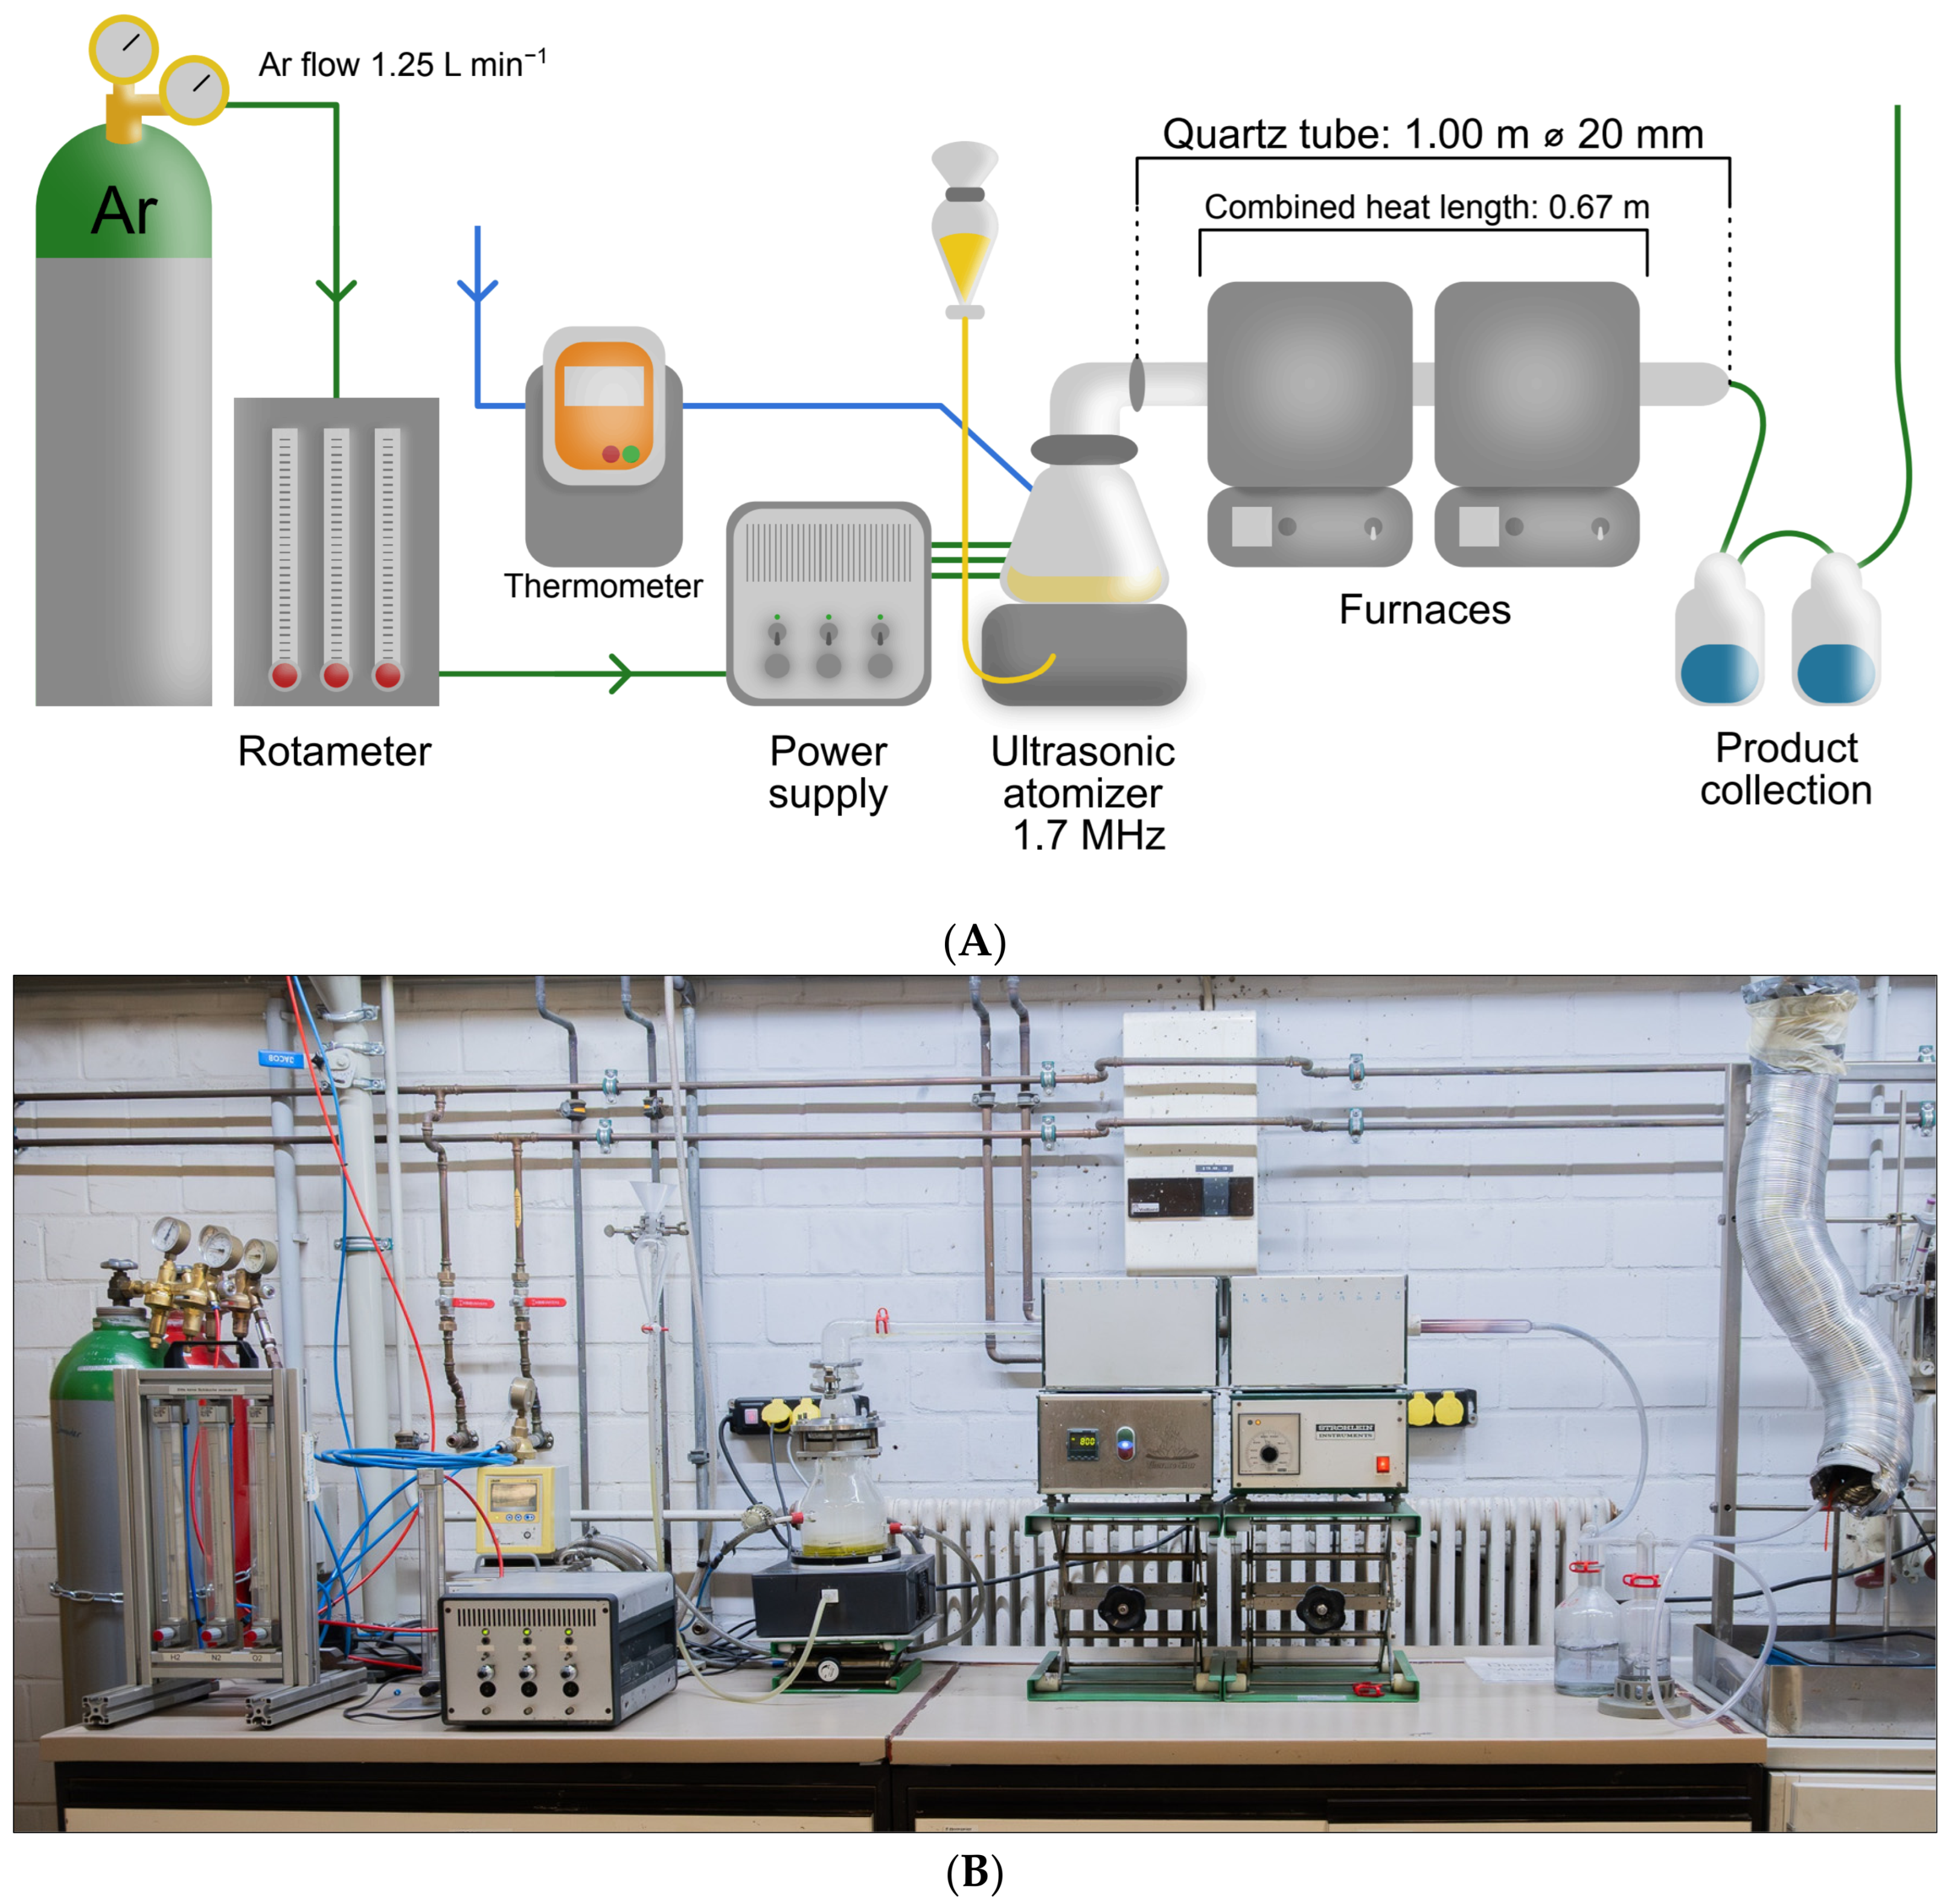
The setup comprised an argon supply, rotameter, ultrasonic atomizer operated at 1.7 MHz, and a quartz reaction tube of total length 1.00 m and nominal diameter 20 mm, passing through two adjacent tube furnaces (Thermo-Star GmbH, Aachen, Germany; Stroehlein Instruments, Selm, Germany, as identified on the apparatus). A 1 m long, 20 mm diameter quartz tube has also been reported for an IME USP configuration by Majerič et al. [18]. The two furnaces form one heating zone with a combined active heated length of 0.67 m and were set to the same nominal temperature: 400 °C for ZCU-400, 500 °C for ZCU-500, and 600 °C for ZCU-600. The aerosol was transported using argon only, with no added H2, at a nominal flow of approximately 1.25 L min−1. Figure 1A shows the corrected geometry; Figure 1B shows the apparatus configuration and is not a record of the setpoint for a particular synthesis. The 400 °C condition was selected to promote precursor conversion while limiting extensive consolidation. Argon is not a reducing reagent, and precursor-dependent copper-phase evolution cannot be inferred solely from the carrier gas [16]. The powder was collected in distilled water and dried at 80 °C for 60 min.
Figure 1.
(A) Schematic of the USP process, and (B) photograph of the apparatus configuration.
Residence time depends on the tube cross-section and active heated length, which must be distinguished from overall tube length; related USP configurations also illustrate the dependence on reactor geometry [15]. For the transit calculation, the reported 20 mm diameter is treated as the nominal internal bore, di = 0.020 m. With the active heated length Lh = 0.67 m, the heated volume is Vh = πdi2Lh/4 = 0.21049 L. At the nominal Ar flow Qr ≈ 1.25 L min−1, assuming that the flow is referenced to 20 °C, pressure is approximately constant, and the gas reaches the furnace setpoint, the ideal plug-flow estimate is τ = (60Vh/Qr)(Tr/T). This gives approximately 4.40 s at 400 °C, 3.83 s at 500 °C, and 3.39 s at 600 °C. Dividing by the unexpanded reference flow gives 10.10 s. The total tube length of 1.00 m is not used as the heated length. These are nominal carrier-gas transit estimates; solvent evaporation, axial temperature gradients, and the velocity distribution can alter aerosol thermal exposure. The estimates depend on the stated flow reference and on treating the reported diameter as the internal bore.
2.2. X-Ray Diffraction and Line-Broadening Analysis
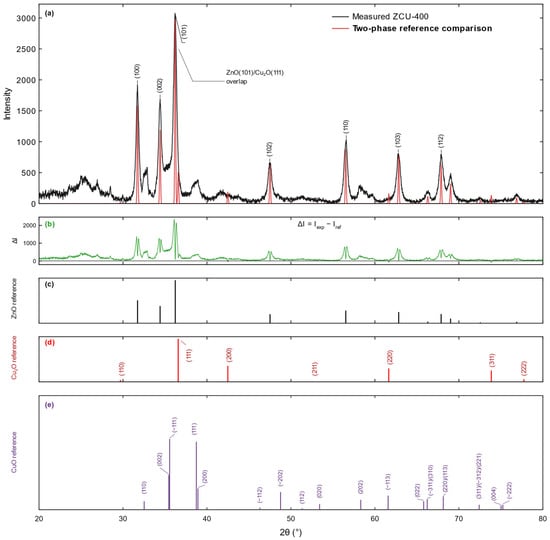
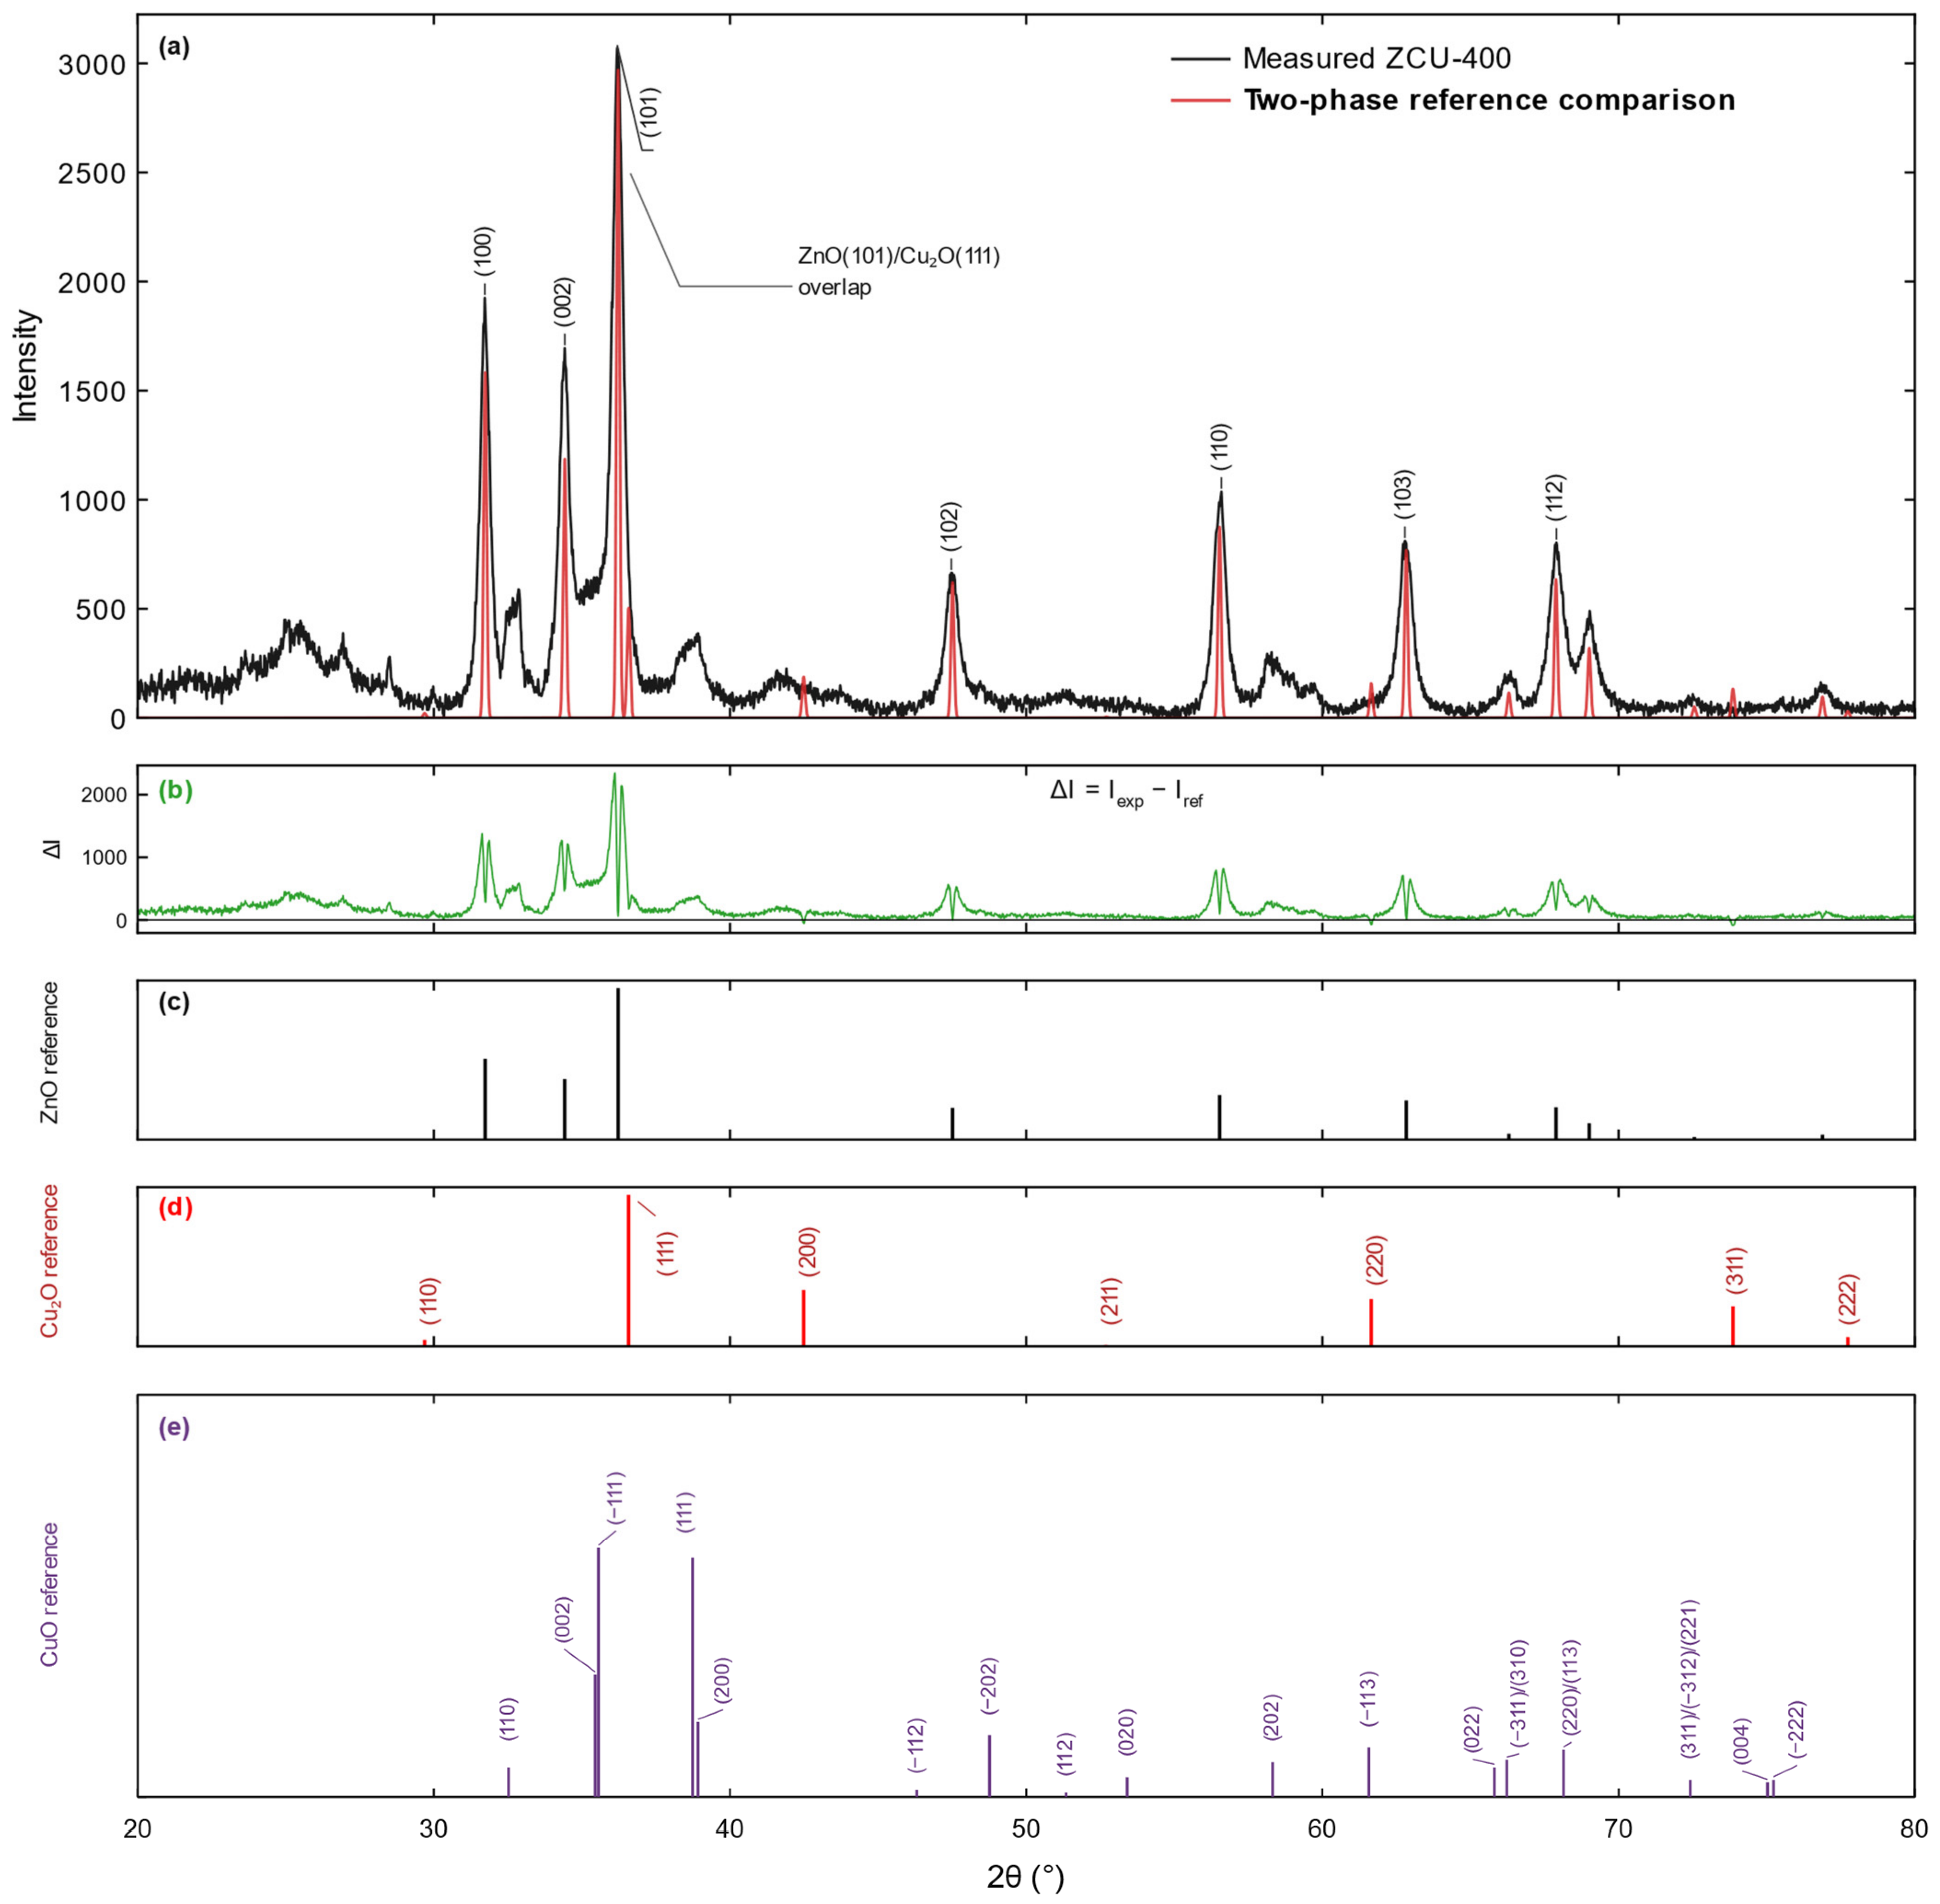
All X-ray diffraction measurements were performed using a Bruker D8 Advance diffractometer (Bruker AXS GmbH, Karlsruhe, Germany) with Cu-Kα radiation (λ = 1.5406 Å), over 2θ = 20–80°. ZCU-400 was examined in reflection geometry for phase identification, and the Scherrer analysis is summarized in Table 1. The angular sampling increment is not documented in the retained measurement description. Reference patterns for zincite ZnO, cuprite Cu2O, and tenorite CuO were considered. The monoclinic CuO structure is described by Åsbrink and Norrby [19], COD 9014580 (a = 4.6837 Å, b = 3.4226 Å, c = 5.1288 Å, β = 99.54°; C2/c). The CuO reference pattern in Figure 2e uses the experimental d-spacings and relative peak-height intensities tabulated by Swanson and Tatge [20] in NBS Circular 539, Volume I, Table 26 (last column, pp. 49–50). All 17 tabulated CuO lines within 20–80° are displayed. Their 2θ positions were calculated by Bragg’s law for λ = 1.5406 Å, and their published relative intensities are normalized to Imax = 100. Unresolved reference groups retain all associated indices and one tabulated intensity; these reference intensities do not quantify the CuO content of the specimen.
Table 1.
Apparent ZnO coherent-domain sizes from reflection-mode Scherrer calculations. The final column applies Gaussian quadrature correction with βinst = 0.08° obtained from a silicon standard. A constant width is used; no 2θ-dependent instrumental-profile function is included.
Figure 2.
XRD profile of ZCU-400 and reference patterns. (a) Black: measured profile; red: ZnO/Cu2O reference comparison. Labels identify the principal ZnO reflections. (b) Green: pointwise unweighted difference ΔI = Iexp − Iref. (c,d) ZnO and Cu2O reference positions. (e) Experimental CuO reference pattern. The 2θ positions were calculated from the tabulated d-spacings using λ = 1.5406 Å. Features near 32.5°, 38.7°, and 58.3° are consistent with possible CuO. The overlap annotation marks a potential ZnO(101)/Cu2O(111) coincidence, not a resolved Cu2O contribution. Other coincident copper-oxide reflections also limit unique assignment; reference intensities do not establish phase fractions or imply that every weak reflection is individually resolved.
Phase identification and the earlier normalized two-phase estimate were obtained using Match! version 4 (Crystal Impact, Bonn, Germany). In RIR analysis, phase-specific intensity scales are divided by their corundum-referenced I/Ic values and normalized over the selected phases [21,22]. The Match! implementation obtains intensity scales by least-squares comparison of reference-entry peaks and profiles with the experimental pattern [22]. Published reference values include RIR(ZnO) = 4.875, calculated from a crystal structure in the supporting information of Hafner et al. [23], RIR(Cu2O) = 8.28 for PDF 01-080-3714, and RIR(CuO) = 3.70 for PDF 04-015-5873 in Domán et al. [24]. ZnO values of 5.3 (experimental calibration) [23] and 5.61 [25] have also been published. These literature benchmarks do not establish which reference entries or I/Ic values were used in the original session. The original entry records, intensity scales, and overlap/background settings are not available for verification. The available diffraction display was therefore reassessed qualitatively against ZnO, Cu2O, and CuO reference positions; no new quantitative three-phase RIR analysis or Rietveld refinement was performed. Phase fractions with defensible uncertainties cannot be reported from these records.
For reflection-mode size estimation, D = Kλ/(βcosθ), with K = 0.9 and β as FWHM in radians. Instrumental broadening was determined using a silicon standard, giving βinst = 0.08°. The listed corrected values use βcorr = (βobs2 − βinst2)1/2 with this constant width. For Gaussian convolution, variances add, and FWHM is proportional to standard deviation, which justifies quadrature subtraction [26]. For mixed Gaussian/Lorentzian profiles, this is an approximation. The calculation does not incorporate a measured 2θ-dependent instrument-profile function; the silicon-standard provenance does not imply that angular dependence was modeled. The correction changes the listed reflection-mode sizes by approximately 0.8–2.3%. Both uncorrected and corrected values are reported, and the corrected mean is approximately 17.1 nm. These estimates do not establish a precise intrinsic strain distribution.
For the additional transmission-mode line-broadening comparison and qualitative temperature assessment, ZCU-400, ZCU-500, and ZCU-600 were examined using the same Bruker D8 Advance diffractometer and the 20–80° acquisition range described above. The nominal source settings and exposure for these transmission acquisitions were 40 kV/40 mA and 9 min, respectively. Their angular sampling increment is not documented in the retained metadata. Seven ZnO reflections, (100), (002), (101), (102), (110), (103), and (112), were reported in the earlier processing as locally fitted from the ZCU-400 transmission pattern using local pseudo-Voigt functions with a linear local background. The retained fit summaries were evaluated with the Monshi–Scherrer, Williamson–Hall uniform deformation model (UDM), Williamson–Hall uniform stress deformation model (USDM), and a Halder–Wagner-type representation [27,28,29]. The Monshi–Scherrer linearization was expressed as lnβ = ln(Kλ/D) + ln(1/cosθ). The UDM relation was βcosθ = Kλ/D + 4εsinθ, whereas the USDM relation was βcosθ = Kλ/D + 4σsinθ/Ehkl; for USDM, the direction-dependent Young modulus Ehkl was calculated from the elastic compliance tensor of wurtzite ZnO. The Halder–Wagner transformed variables were β* = βcosθ/λ and d* = 2sinθ/λ, with (β*/d*)2 plotted against β*/(d*)2. The original Halder–Wagner formulation is based on integral breadth measurements [29]. Because the available processed transmission dataset contains pseudo-Voigt FWHM values rather than independently tabulated integral breadths, the present H–W result is explicitly treated as a FWHM-based comparative implementation and its extracted size/strain terms are regarded as apparent line-broadening parameters rather than strict integral-breadth constants. A size–strain plot (SSP) calculation based on the widely cited formulation of Khorsand Zak et al. [30] was examined during data processing but was not retained in the final quantitative comparison. A subsequent methodological comment demonstrated that the published SSP equation is dimensionally inconsistent and can produce systematically scaled size and strain values [31]. Excluding that formulation avoids treating a mathematically dependent scaling of the same peak-width dataset as an independent validation. Individual transmission-mode FWHM values, their uncertainties, and an angle-dependent instrument profile are not tabulated. The numerical model comparison therefore remains exploratory and is not claimed as an independently reproducible size–strain determination. Regression quality for all retained linear models was assessed using R2; strain- or stress-related parameters were not interpreted quantitatively when linearity was weak.
2.3. SEM/EDS Characterization
SEM characterization was performed using a JSM 7000F field-emission scanning electron microscope (2006; JEOL Ltd., Akishima, Tokyo, Japan). Energy-dispersive X-ray spectroscopy was performed using an Octane Plus-A detector (2015; EDAX, AMETEK Inc., Mahwah, NJ, USA). The micrographs are discussed in terms of particle morphology, agglomeration, porosity, and the presence of hollow or shell-like features. EDS is used for qualitative elemental confirmation. The retained presentation contains one displayed spectrum, without a traceable concentration export, documented number of independent analyzed areas, or area-to-area statistics. Beam voltage/current, live time, detector take-off geometry, and the quantification procedure are not documented in the retained EDS record. No atomic concentrations or numerical Zn:Cu ratio are reported; XRD is used to examine candidate copper phases rather than EDS peak heights.
3. Results and Discussion
3.1. XRD Phase Composition and Crystallite Size
The XRD profile of ZCU-400 is shown in Figure 2. The dominant reflections at approximately 2θ = 31.7°, 34.4°, 36.2°, 47.5°, 56.5°, 62.8°, and 67.9° correspond to the hexagonal wurtzite structure of ZnO (zincite). The identified ZnO phase belongs to the P63mc space group, and the reflection sequence is consistent with literature descriptions of wurtzite ZnO [1,2]. No interpretation of the EDS spectrum is required to establish this phase assignment because the crystallographic identification follows directly from the diffraction pattern. The prominence of the ZnO reflections is also consistent with ZnO being the principal crystalline component expected from the precursor composition.
Candidate cuprite Cu2O features are considered against the comparison reference reflections near 29.7°, 36.6°, 42.5°, 52.7°, 61.7°, 73.8°, and 77.6° [2,4]. The minor-phase interpretation must also consider possible tenorite CuO. In particular, maxima near 32.5°, 38.7°, and 58.3° agree with the CuO(110), CuO(111), and CuO(202) reference positions of approximately 32.52°, 38.73°, and 58.32°, respectively, obtained from the NBS d-spacings [20]. Further reference contributions include the close (002)/(−111) pair near 35.45°/35.55°, the (200) line near 38.92°, and lines near 48.76°, 53.41°, 61.57°, and higher angles. Their NBS relative intensities are displayed in Figure 2e; overlap with nearby oxide features and background can obscure individual contributions. These coincidences support possible CuO in a ZnO-dominant copper oxide powder and preclude an exclusive two-phase interpretation. A reference-pattern match does not establish a CuO mass fraction or uniquely resolve every weak maximum. The principal indexed ZnO peaks, candidate copper-oxide features, and unresolved/background-affected features are therefore distinguished. No significant unmatched maximum is used to establish an additional phase without corroborating reflections.
The Cu2O(111) candidate near 36–37° overlaps with ZnO(101) and is not an independent confirmation of cuprite. The candidate Cu2O(200) feature near 42.5° is less affected by the principal ZnO reflections, but its weak intensity and uncertain background do not establish an unambiguous phase assignment. The low-angle candidate near 29.7° lies in a background-affected region; the candidate near 61.7° is close to the CuO(−113) reference at 61.57° and the ZnO(103) region. Higher-angle candidate features also require consideration of CuO overlap. Thus, no individual reflection in the retained display is claimed to confirm Cu2O unambiguously, and the maxima near 32.5°, 38.7°, and 58.3° make CuO a plausible additional candidate [20]. The earlier Match! 4 output of 89.4 wt% ZnO and 10.6 wt% Cu2O is retained solely as the historical result normalized within the selected two-phase model. It is not accepted as a measured complete composition or as evidence that all copper is present as Cu2O. The missing original reference-entry and intensity-scaling records prevent a reproducible recalculation and a defensible uncertainty estimate. Even if the two-phase output were taken literally, stoichiometric conversion would give approximately 88.1:11.9 Zn:Cu among metal atoms (Zn:Cu ≈ 7.4:1), rather than the 90:10 feed; this is a conditional conversion of the model output, not an independent product measurement. Possible CuO and poorly crystalline material invalidate its use as a total copper balance. The feed-derived 91.1:8.9 wt% oxide distribution likewise remains only a calculation assuming complete conversion exclusively to ZnO and Cu2O. Neither calculation verifies copper retention in the collected powder.
Figure 2 retains the measured black trace and the previously constructed red two-phase reference comparison to expose the limitations of that comparison. The green trace is the pointwise unweighted difference, ΔI(2θ) = Iexp(2θ) − Iref(2θ), on the displayed scale. The red trace is an incomplete ZnO/Cu2O comparison, not a complete three-phase refinement. Structured differences and the CuO reference pattern with normalized NBS intensities [20] show why that comparison cannot establish the complete phase composition. The experimental, comparison, and difference curves have not been refitted or altered. This diagnostic display is separate from the transmission-mode line-broadening summaries in Section 3.2. Structural parameters for ZCU-400 are shown in Table 2.
Table 2.
ZnO structural parameters for ZCU-400. The copper-containing phases are not sufficiently resolved to report reliable lattice parameters or phase fractions.
For hexagonal ZnO, the calculated lattice parameters were a = 3.2529 Å and c = 5.2079 Å, with a unit-cell volume of 47.72 Å3. These values are close to literature values for wurtzite ZnO and show that the principal ZnO lattice remains crystallographically consistent with the zincite structure in the powder. The copper-oxide assignments remain tentative, and the ZnO lattice parameters should not be interpreted as evidence that Cu was substitutionally incorporated into the ZnO lattice. The data support a ZnO-dominant powder with copper oxide contributions; possible CuO must also be considered. With the nominal fixed-width correction, the mean apparent Scherrer size of coherently diffracting ZnO domains from the original dataset was approximately 17.1 nm. This value establishes the nanocrystalline character of the ZnO phase but, as with all Scherrer estimates, it represents a coherence length rather than the dimensions of the larger agglomerates observed by SEM. If cuprite is present, its stoichiometry implies Cu(I); the present tentative assignment does not establish the copper oxidation-state distribution in the powder or at its surface.
3.2. Multimodel XRD Line-Broadening Assessment
The retained transmission-mode processing summary reports local pseudo-Voigt fits for seven ZnO reflections, evaluated with four line-broadening representations. Apparent sizes of 22.0–27.1 nm are listed in Table 3. The individual fitted transmission widths and their uncertainties are not available as a tabulated dataset in this report, so the regressions cannot be independently reconstructed from the presented summary. The values indicate a low-tens-of-nanometres scale but should be treated as exploratory model outputs. Differences from the silicon-corrected reflection-mode mean of 17.1 nm can arise from measurement configuration, instrumental response, overlap, and profile treatment; they do not establish a geometry-dependent physical size or independent validation of an exact domain size.
Table 3.
Retained processed summaries of the transmission-mode line-broadening models. The individual transmission FWHM values, uncertainties, and calibration profile are not tabulated; the entries are exploratory apparent parameters.
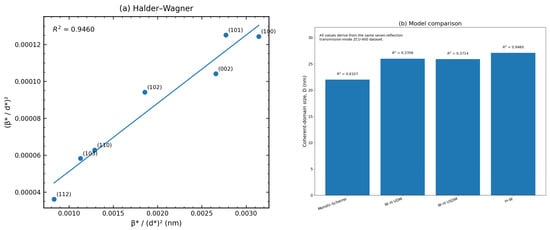
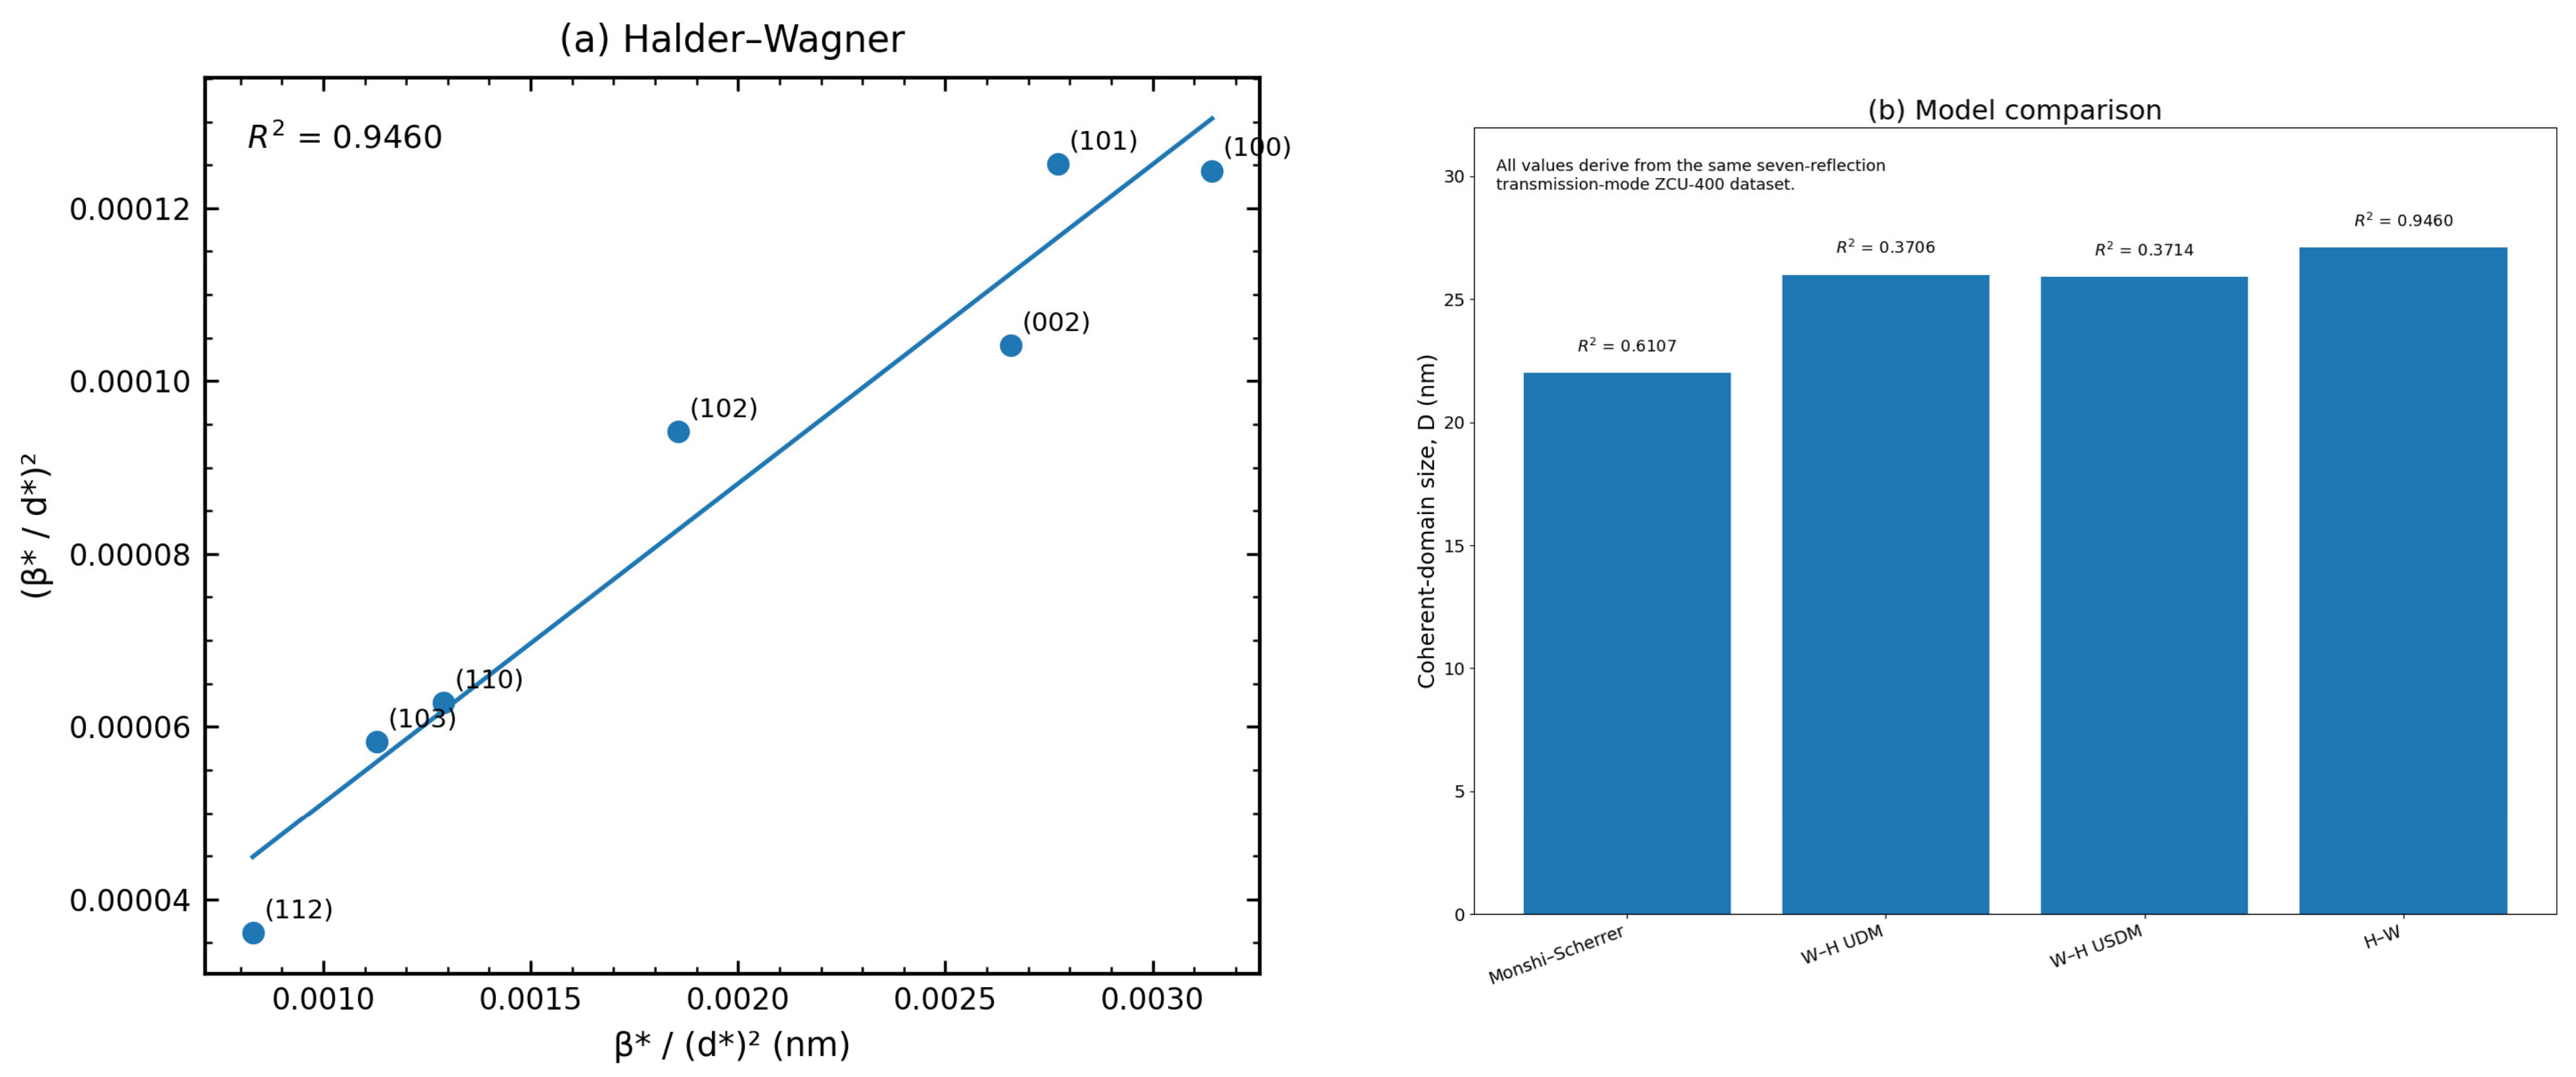
The FWHM-based Halder–Wagner-type representation gave the strongest linearity among the retained models, with R2 = 0.9460 and D = 27.1 nm (Figure 3). The Monshi–Scherrer model yielded D = 22.0 nm with moderate linearity (R2 = 0.6107). By contrast, Williamson–Hall UDM and USDM gave D = 26.0 and 25.9 nm, respectively, but substantially weaker linearity (R2 = 0.3706 and 0.3714). The corresponding UDM microstrain (1.03 × 10⁻³) and USDM stress (123 MPa) are therefore retained only as regression-derived indicative parameters rather than interpreted as precise bulk material constants. The apparent strain term obtained from the FWHM-based H–W treatment (7.54 × 10⁻³) is likewise reported with caution because the original Halder–Wagner formulation is based on integral breadth, whereas FWHM was the width metric available in the processed dataset. The model summaries suggest the domain-size scale: all retained models place the ZnO coherent-domain size in the low-tens-of-nanometres range, with the best-linearized transmission treatment giving approximately 27 nm. The previously calculated SSP result is intentionally omitted from Table 3 and Figure 3 because the dimensional inconsistency of the commonly used SSP equation has been documented in the methodological literature [30,31]. This exclusion limits misleading duplication in the multimodel comparison and prevents a mathematically scaled counterpart of the H–W result from being interpreted as separate experimental confirmation. Low W–H R2 values can be consistent with reflection-dependent domain shape or strain anisotropy [26]. They may also result from overlap, uncertain background, fitting uncertainty, or an unmodeled instrument response. The present regression summary does not distinguish these explanations. No anisotropy mechanism or quantitative residual-stress value is established by R2 alone.
Figure 3.
(a) FWHM-based Halder–Wagner-type linearization of ZnO reflections reported for the additional transmission-mode ZCU-400 pattern; (b) comparison of coherent-domain sizes reported by the four retained models, with the corresponding regression R2 values. The H–W representation is used here as a comparative FWHM-based implementation rather than a strict integral-breadth analysis. Each point in panel (a) is labeled with the corresponding ZnO (hkl) index; the fitted line refers to the transformed width relation rather than a fit to diffraction intensities.
3.3. Influence of Pyrolysis Temperature on the XRD Profiles
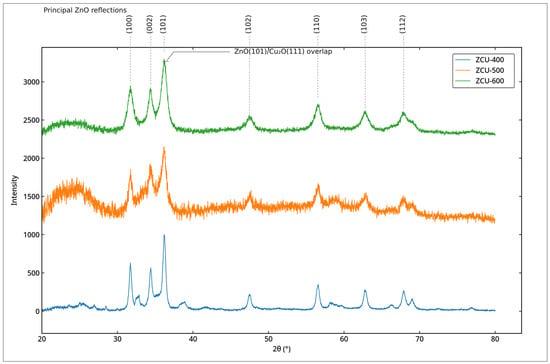
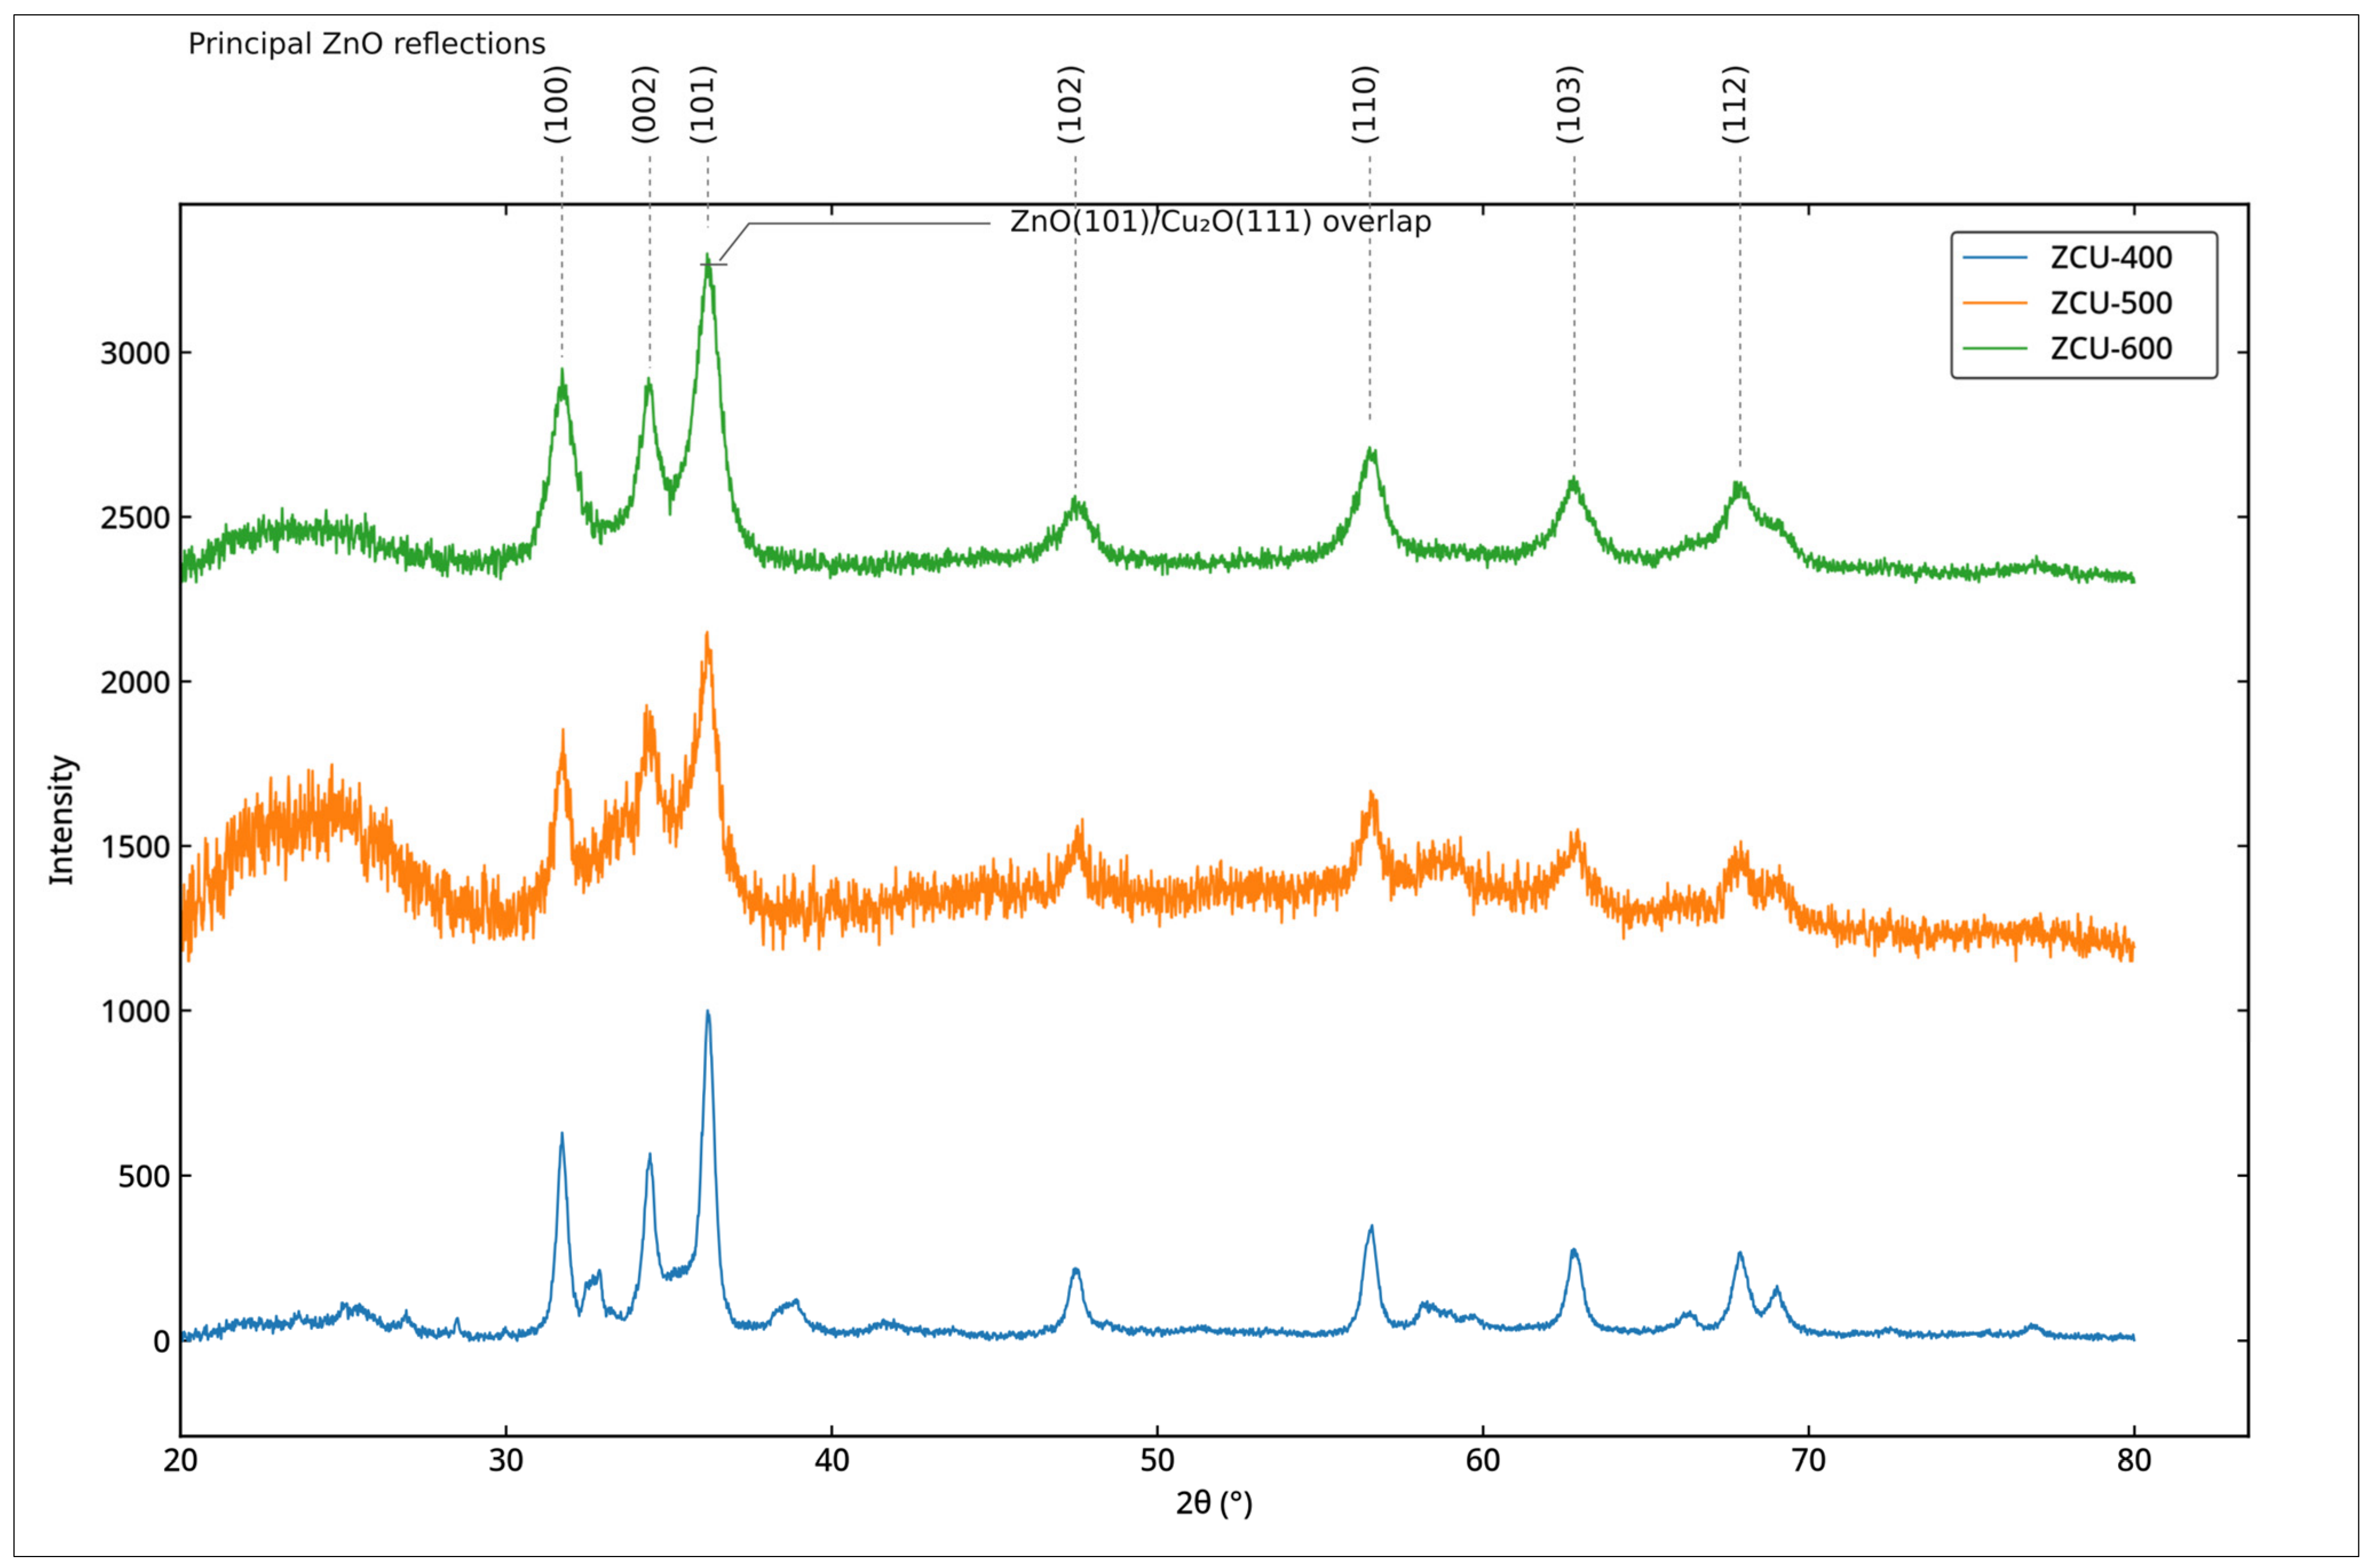
The principal wurtzite ZnO reflection set remains identifiable for samples synthesized at 400, 500, and 600 °C (Figure 4). These transmission profiles are described with the same nominal source conditions, 40 kV/40 mA and 9 min exposure, but equivalence of sample loading, thickness, and background contribution is not established. ZCU-500 and ZCU-600 show stronger counting fluctuations and broad non-Bragg features in the 20–30° region. Scattering from a holder, capillary, or support is a plausible contributor; an amorphous contribution cannot be excluded without a corresponding blank/background measurement. The broad signal is therefore left unassigned and is not interpreted as a measured amorphous fraction or a temperature-induced amorphization trend. Loading, absorption, background, and counting statistics can influence apparent peak prominence. Consequently, the plots support qualitative persistence of the principal ZnO reflections, while precise copper-phase evolution, crystallite growth, and phase stability are not established. Possible CuO and copper-oxide overlap also prevent quantitative minor-phase comparison.
Figure 4.
Stacked XRD profiles of ZCU samples synthesized at 400, 500, and 600 °C, shown in blue, orange, and green, respectively.
Labels identify the principal wurtzite ZnO reflections, and the 36–37° region is marked as a potential overlap between ZnO(101) and candidate Cu2O(111). The labels indicate reflection assignments rather than phase-resolved fitted peaks. Baseline instability, especially for ZCU-500, and minor-phase overlap restrict this comparison to qualitative identification of the principal reflection set; the plotted heights are not used to infer absolute phase fractions or a quantitative temperature-dependent domain-size trend. Broad features at 20–30° are unassigned non-Bragg scattering; a holder/support or amorphous contribution cannot be distinguished. Possible CuO must also be considered when assigning weak copper-oxide features.
3.4. SEM Morphology and EDS Elemental Confirmation
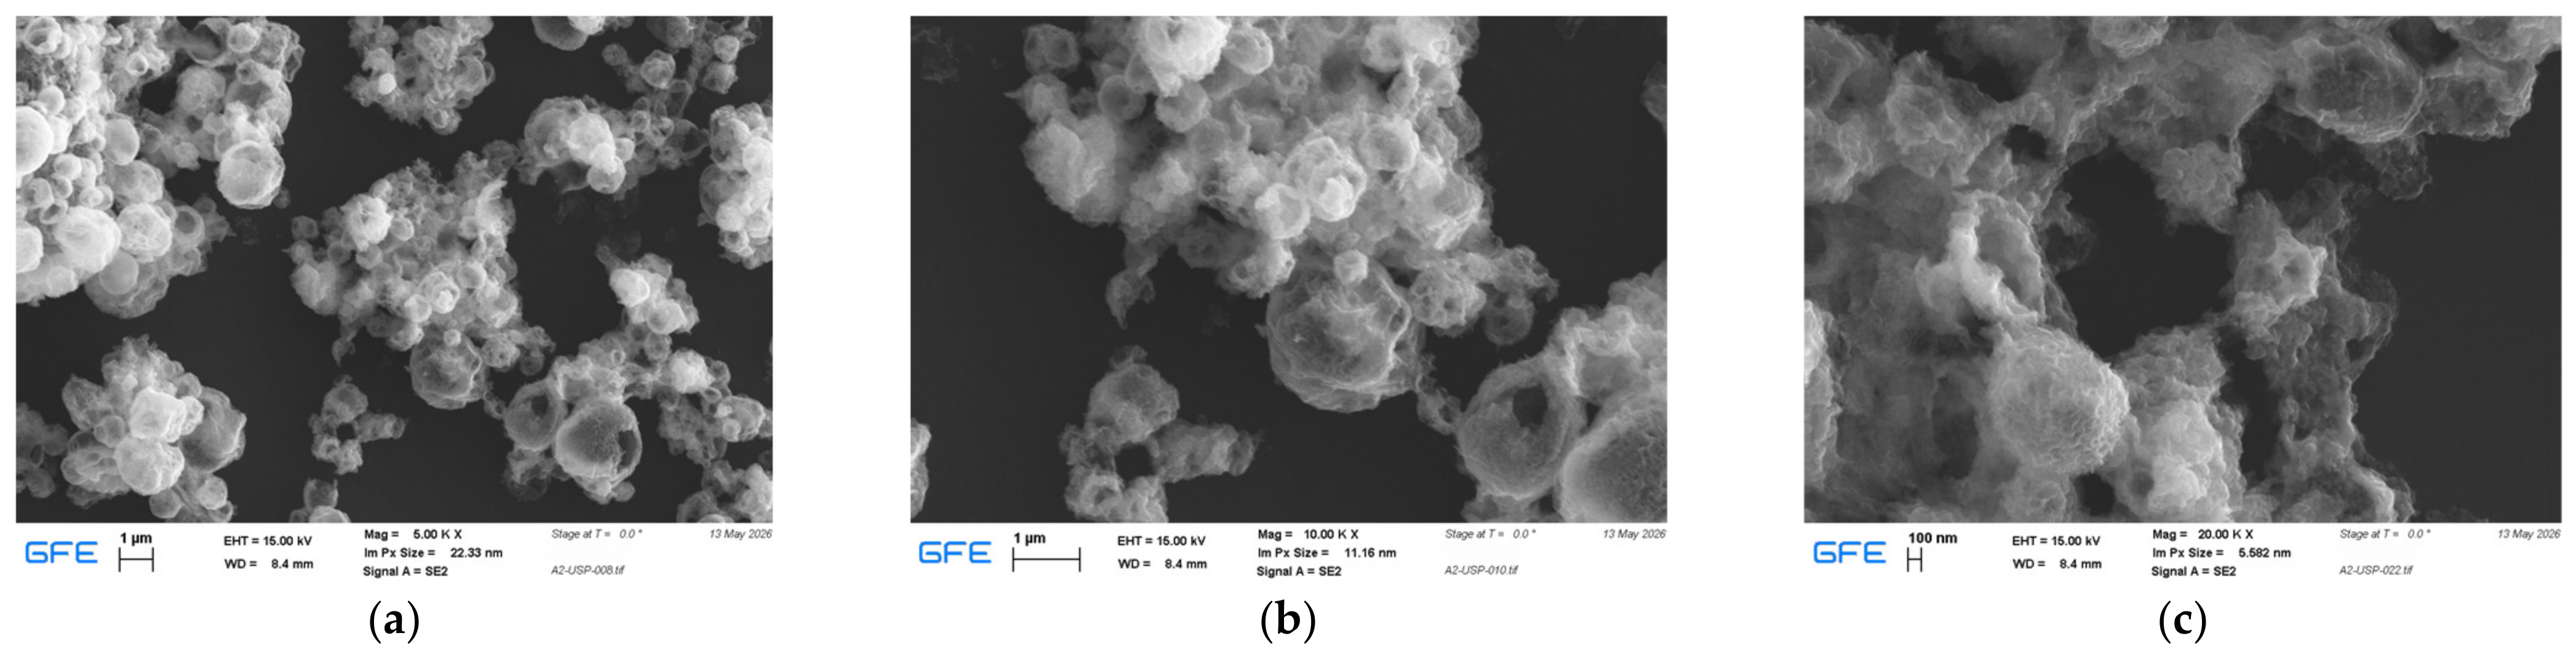
Representative SEM micrographs of ZCU-400 are shown in Figure 5. The powder consists of highly agglomerated, porous, and irregularly spheroidal secondary particles. Numerous interparticle voids and open-textured regions are visible, and several larger particles exhibit hollow or semi-hollow features that are consistent with partial shell formation. At the available magnifications, SEM resolves these secondary morphological features but does not directly establish the size of the crystallographically coherent domains quantified by XRD. It is therefore more accurate to describe the visible agglomerates as containing finer substructures that are consistent with, rather than direct images of, the nanocrystalline domain scale inferred from diffraction. This distinction is important because an SEM-visible particle or agglomerate may contain many coherently diffracting domains separated by defects, boundaries, or interfaces.
Figure 5.
SEM micrographs of the ZCU-400 sample recorded at magnifications of (a) 5000×, (b) 10,000×, and (c) 20,000×.
The observed morphology is consistent with established USP particle-formation mechanisms. As aerosol droplets enter the heated zone, solvent evaporation increases the local precursor concentration and is followed by precipitation and thermal decomposition. If the droplet surface dries faster than the interior, an external solid-rich layer can form while residual solvent and gaseous decomposition products remain trapped inside. Continued heating, internal gas release, shrinkage, and partial collapse can then generate porous, hollow, semi-hollow, or shell-like particles [6,10]. The present micrographs do not imply that every particle follows an identical pathway; rather, the coexistence of irregular spheroids, open agglomerates, and partially hollow structures is compatible with a distribution of droplet histories and local drying rates. Such morphology can be advantageous in surface-mediated applications because interparticle voids and open structures may improve reagent access and increase the fraction of surface that remains accessible after powder collection [7].
The moderate pyrolysis temperature of 400 °C likely limited extensive sintering and densification relative to what would be expected at substantially higher thermal exposure, thereby helping the powder retain an open and fragile morphology. Collection in water followed by drying at 80 °C can additionally promote secondary agglomeration through capillary forces during solvent removal; analogous capillary-driven agglomeration effects have been reported for oxide nanoparticle powders subjected to conventional drying [32]. This interpretation is limited to agglomeration behavior and does not imply identical chemistry between the literature system and the present zinc oxide/copper oxide nanomaterial. SEM contrast in the present images is predominantly topographical, so the micrographs alone cannot distinguish ZnO from Cu2O domains or establish whether any copper-containing phase is homogeneously distributed, concentrated at interfaces, or locally segregated. ZnO is identified by XRD, candidate copper oxides are assessed tentatively, and elemental presence is assessed by EDS. Accordingly, the SEM observations are not presented as direct proof of a ZnO/Cu2O heterostructure. HRTEM with indexed lattice fringes on both sides of an individual boundary, supported by local electron diffraction and STEM elemental mapping, would be needed to test nanoscale contact and phase distribution. Even an observed structural interface would not, on its own, establish band alignment or improved charge separation.
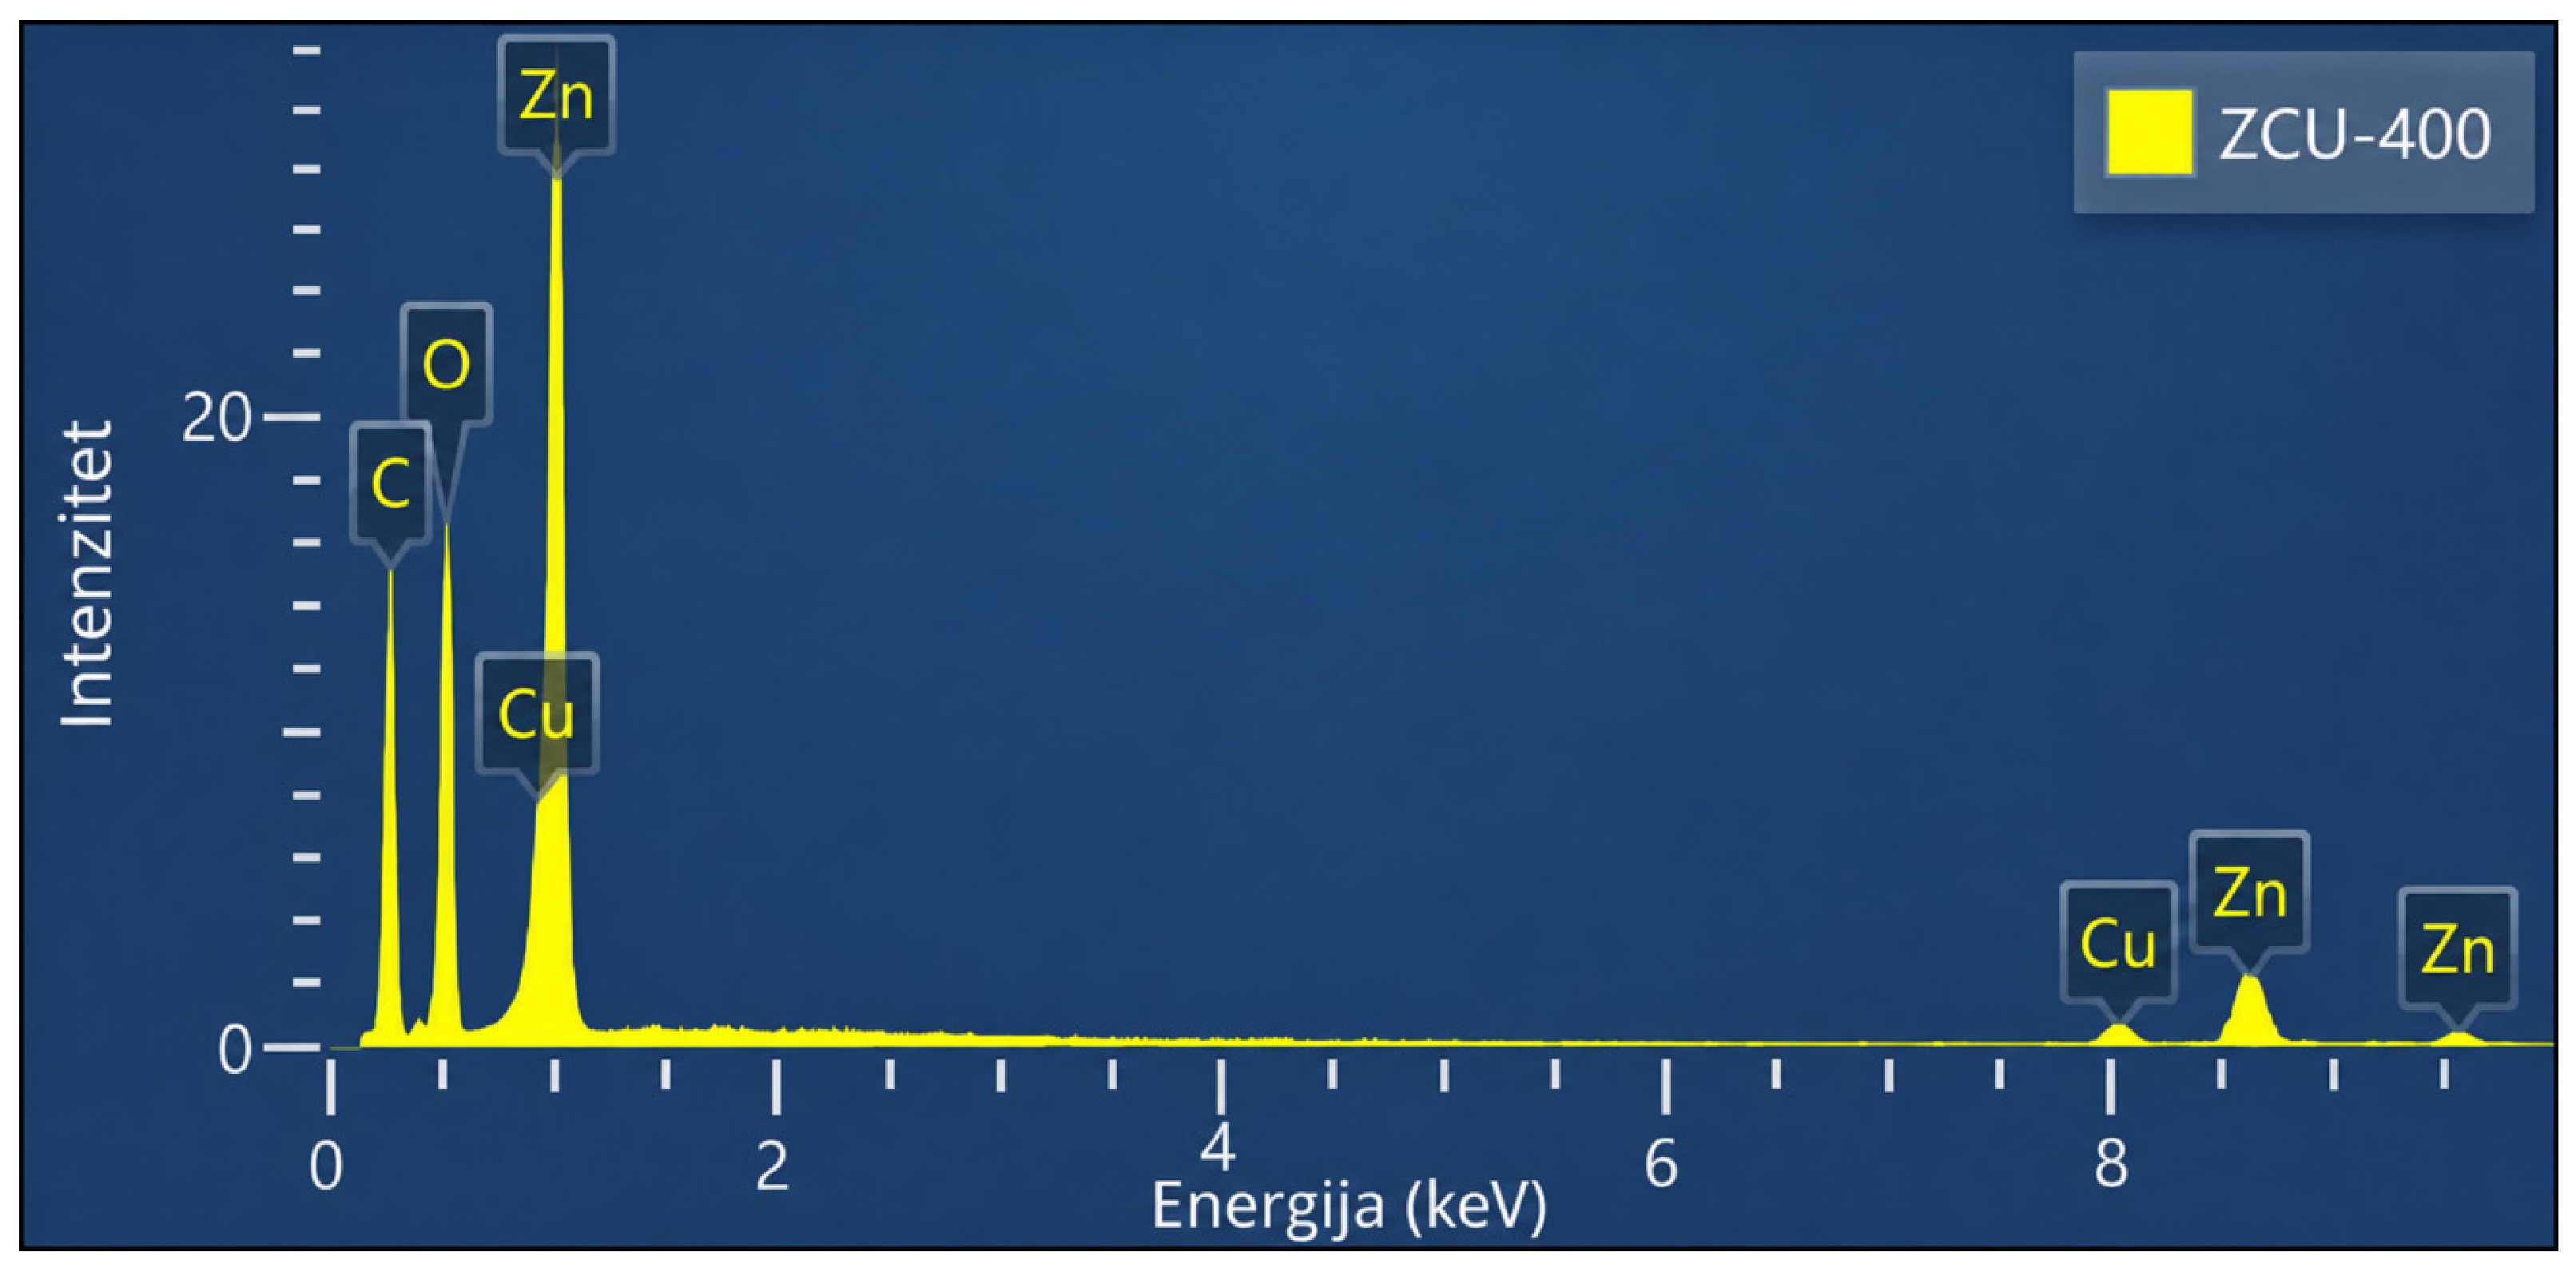
The EDS spectrum of ZCU-400 is presented in Figure 6. Clear signals associated with Zn, O, and Cu are observed, confirming that the elements expected from the mixed Zn/Cu precursor feed are present in the analyzed region. Strong low-energy features include the O K line together with Cu and Zn L-series contributions, while additional Zn and Cu peaks occur in the higher-energy region near their characteristic K lines. A minor C signal is also visible; such a signal can originate from carbonaceous mounting media and/or adventitious surface carbon and is therefore not used for phase identification. The Cu signal confirms copper in the analyzed region, but EDS alone cannot distinguish Cu2O from CuO or establish their relative abundance. Cu2O and CuO are consequently discussed as tentative XRD candidates rather than identified from EDS peak intensity or elemental ratios. Likewise, the relative height of Zn and Cu EDS peaks is not used to determine a crystalline-phase mass fraction, because quantitative phase analysis requires crystallographic or appropriately calibrated compositional methods rather than direct comparison of uncorrected EDS peak intensities. Neither a dominant Cu(I) surface population nor the absence of a thin Cu(II)-containing surface layer is established by these measurements. Candidate crystalline phases and surface chemical speciation are therefore treated as separate questions.
Figure 6.
EDS spectrum of the ZCU-400 sample synthesized by ultrasonic spray pyrolysis at 400 °C. This is a qualitative elemental display; no atomic concentrations, number of independent analyzed areas, or compositional spread can be recovered from it.
A quantitative EDS comparison with the feed requires corrected elemental concentrations rather than raw peak heights. If cZn and cCu are atomic concentrations obtained after spectral background subtraction, line deconvolution, and appropriate matrix correction, the cation ratio is Zn:Cu = cZn/cCu and the Cu cation percentage is 100cCu/(cZn + cCu). The nominal solution target is Zn:Cu = 9:1, or 10 at% Cu among Zn + Cu; oxygen and carbon are excluded from this cation normalization. Reliable reporting should identify the standards or standardless procedure, matrix-correction method, analyzed areas, and uncertainty, because rough porous particles and mounting geometry can introduce systematic errors [33]. The retained EDS presentation provides an elemental spectrum but no traceable quantitative concentration export or replicate-area statistics. No numerical Zn:Cu ratio is therefore inferred from Figure 6. The single displayed spectrum does not document the number or spatial distribution of independent analyzed areas, so neither area-to-area spread nor representativeness of the powder can be evaluated. No new EDS acquisition or re-quantification is reported in this revision. These limitations leave both the local quantitative Zn:Cu ratio and the powder-average ratio unverified; the 90:10 value describes the precursor solution only. Quantified measurements on several representative areas, with documented acquisition and correction conditions, would be needed for the requested local comparison, and a representative bulk elemental analysis would be needed to establish overall copper retention. Even a quantified cation ratio would not distinguish Cu2O from CuO or determine their crystalline-phase fractions.
Surface-sensitive XPS would provide complementary evidence on copper speciation. A defensible analysis should combine the Cu 2p region and its shake-up features with the Cu LMM Auger spectrum or a modified Auger parameter, because Cu(I) and metallic Cu can have overlapping Cu 2p binding energies [34]. The present study reports no XPS spectra, binding energies, or fitted oxidation-state fractions. Small amounts of amorphous or poorly crystalline copper-containing material and surface oxidation cannot be excluded from the available XRD/EDS data. These limitations restrict the conclusions to the identified crystalline phases and elemental presence, without assigning interfacial chemical bonds, defect populations, or a charge-transfer mechanism.
3.5. Proposed Formation Mechanism
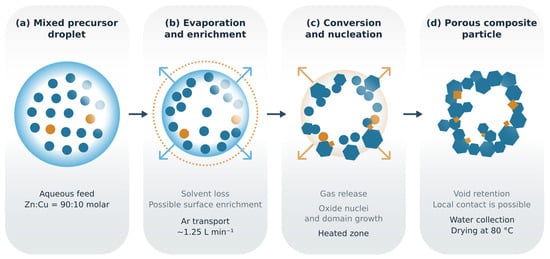
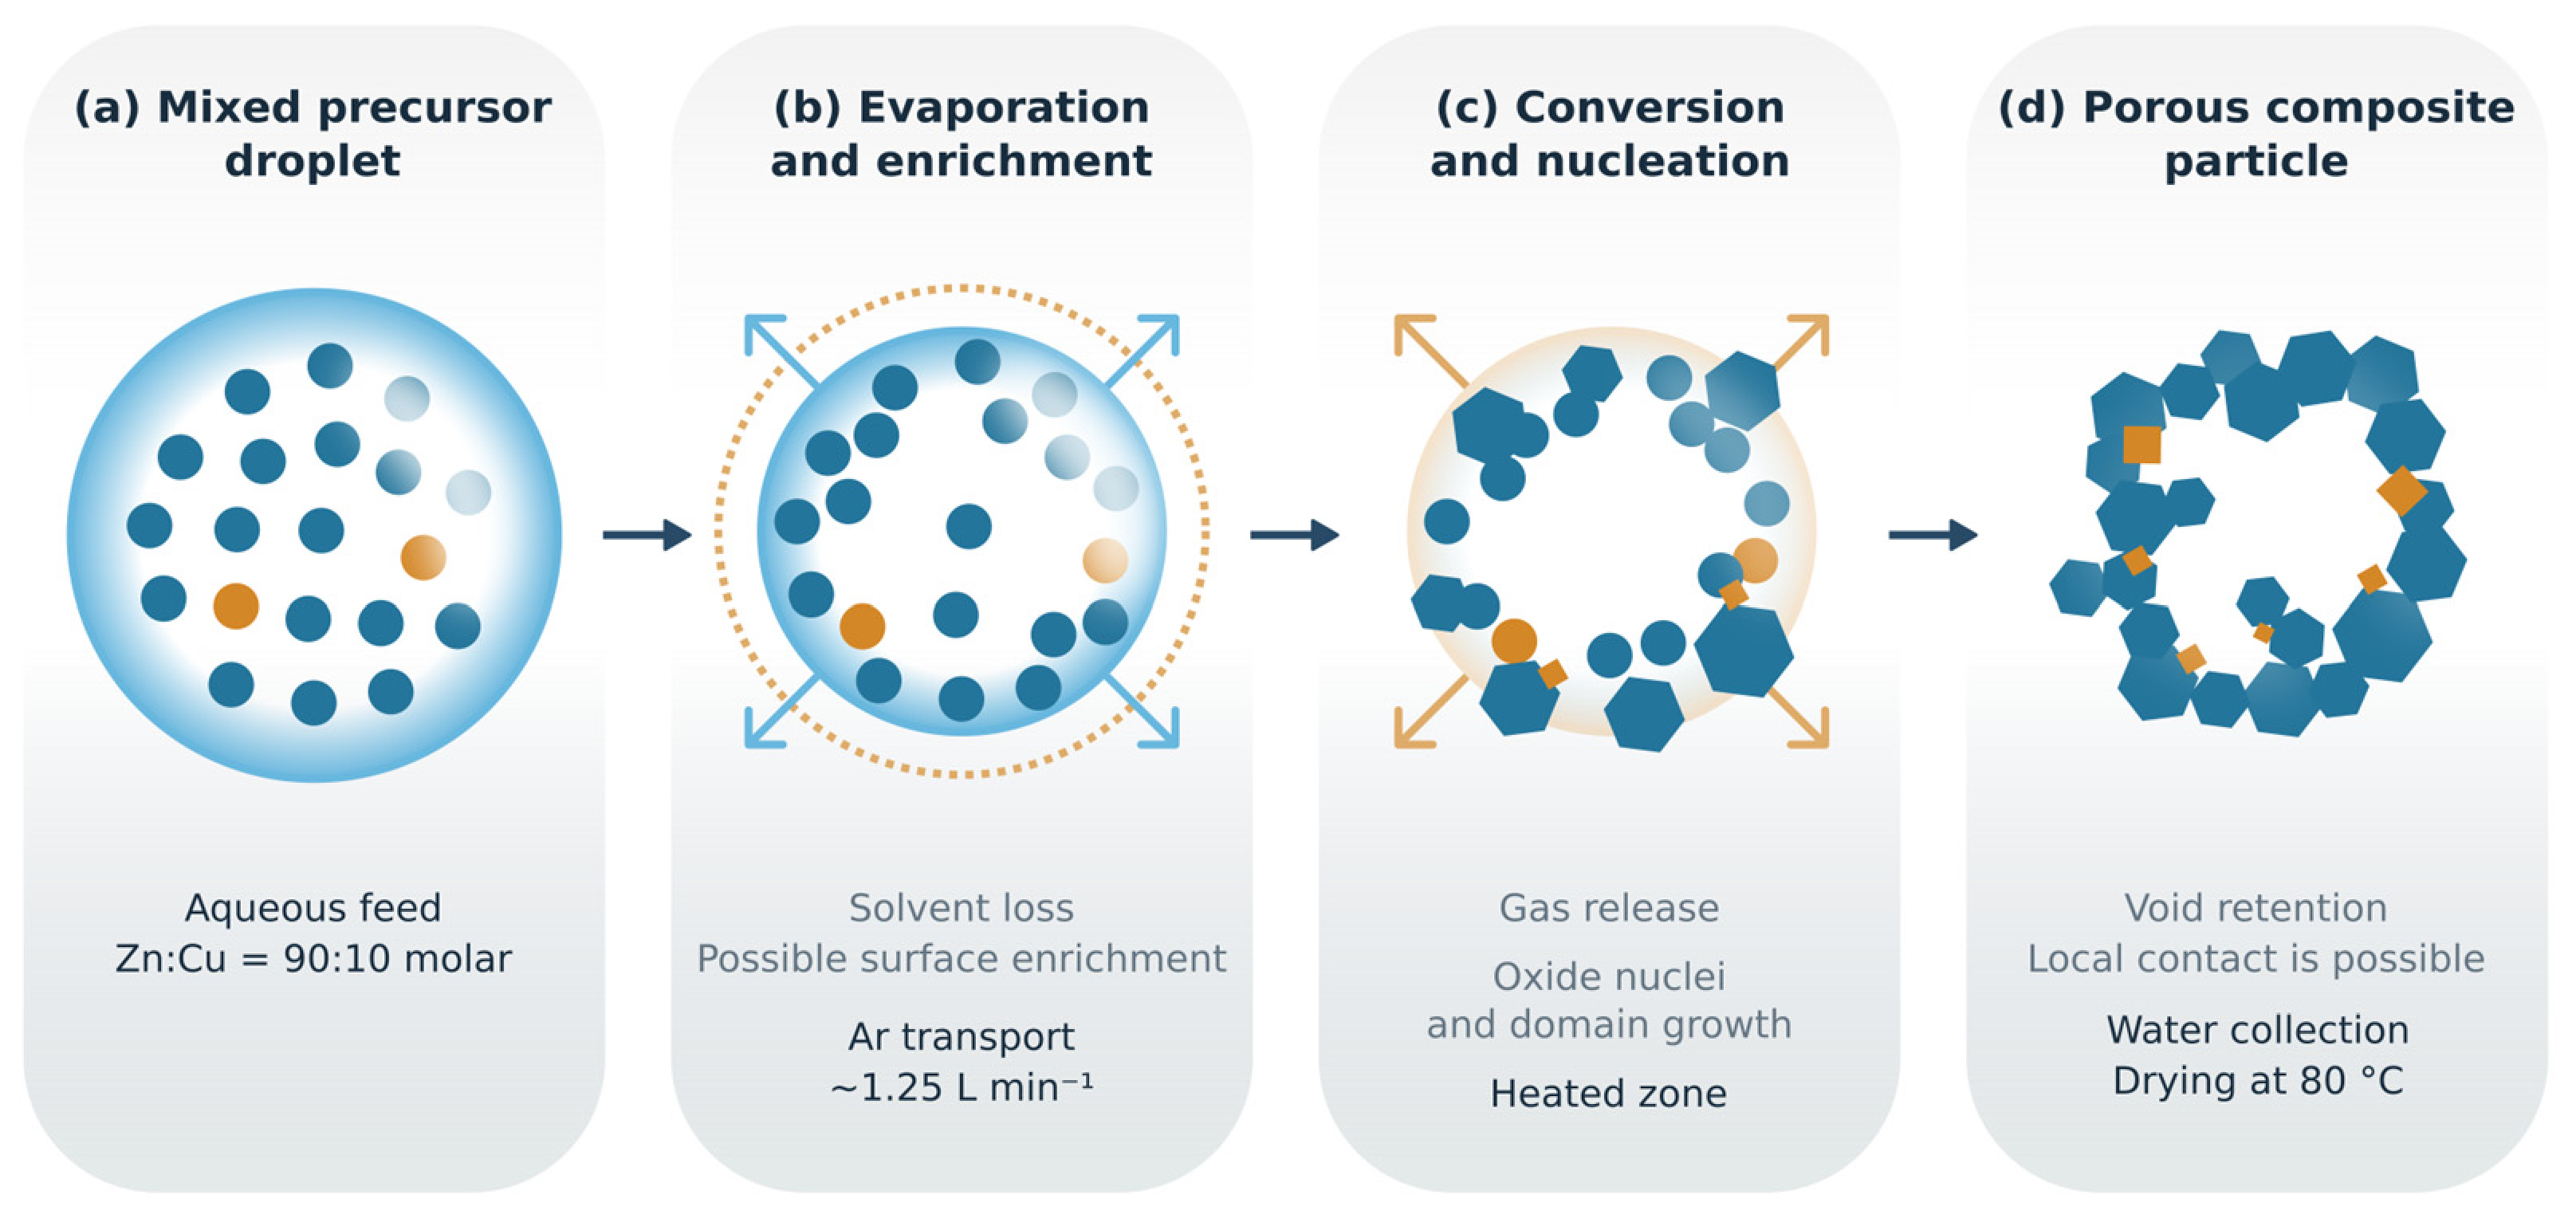
Figure 7 presents a proposed mechanism for the formation of the porous zinc oxide/copper oxide nanomaterial. The schematic is a literature-supported hypothesis, not a reconstruction of directly observed intermediates. Spray-pyrolysis models relate particle morphology to the competition between solvent evaporation and solute redistribution within an aerosol droplet [6,7,8]. The mixed feed supplies Zn- and Cu-containing species to the same droplet population, providing an opportunity for close association before solidification. It does not guarantee that the final oxides share an interface, because segregation may occur during drying, decomposition, or subsequent growth.
Figure 7.
Proposed droplet-to-particle mechanism for the porous zinc oxide/copper oxide nanomaterial synthesized at 400 °C: (a) mixed precursor droplet; (b) solvent evaporation and possible surface enrichment; (c) precursor conversion, nucleation, and domain growth; and (d) retention of a porous or partially hollow particle. Blue and orange precursor symbols denote Zn- and Cu-containing species, respectively; the feed salts are specified in Section 2.1. Blue and orange solid regions schematically represent ZnO and candidate copper oxide domains. Their phase identity, amount, spatial distribution, and local contact are not experimentally resolved. The formation sequence and possible contact are hypotheses supported by general spray-pyrolysis literature [6,8,10], not TEM/HRTEM observations.
As a droplet passes into the heated zone, water evaporation increases precursor concentration. If redistribution is slower than surface solvent loss, a solute-rich outer region may develop and eventually form a rigid skin. Continued removal of solvent and decomposition products, together with shrinkage or partial collapse, can leave voids and a porous secondary particle. The hollow and open features in the SEM images are compatible with this route, although internal void volume, accessible surface area, and shell thickness have not been measured. The droplet sketch therefore represents one possible morphological history rather than a uniform architecture assigned to the entire powder [6,8].
Formation of ZnO and copper oxide phases involves both thermodynamic driving forces and kinetic constraints. Increasing concentration favors precursor precipitation; dehydration and decomposition then generate solid species from which oxide nuclei can emerge. Whether ZnO or a copper-containing phase nucleates first depends on precursor decomposition, local composition, supersaturation, and nucleation barriers. A favorable bulk free-energy change alone does not prescribe the sequence. The ex situ diffraction pattern is an endpoint observation and does not establish simultaneous nucleation, a ZnO-first pathway, or a quantitative equilibrium calculation. No in situ thermal or diffraction measurements, local oxygen potentials, or phase-specific interface energies are available to resolve that sequence.
Copper-phase selection requires particular caution because the feed contains Cu(II), whereas crystalline cuprite contains Cu(I). Argon limits the external supply of oxygen but is not itself a reducing reagent. The effective redox environment may be influenced by precursor decomposition and the gases generated inside a droplet, but the relevant gaseous species and reducing capacity were not measured. Firmansyah et al. demonstrated atmosphere-dependent copper-phase evolution in an ethanol-assisted spray-pyrolysis system [16]; that result establishes the importance of precursor and gas chemistry, not the specific reaction route in the present aqueous nitrate/acetate feed. Accordingly, the schematic identifies a possible conversion stage without inventing a balanced net reduction reaction or assigning a measured Cu(II)-to-Cu(I) pathway. The possible CuO contribution identified in Section 3.1 further argues against assigning all copper to a single reduction endpoint or depicting one verified copper oxidation state.
Two conditional routes could bring the resulting phases into contact. If one solid phase is already present and wetting is favorable, heterogeneous nucleation of the second phase on its surface may reduce the nucleation barrier compared with separate nucleation. Alternatively, separately nucleated domains may approach and impinge during growth and droplet shrinkage. The latter route can create physical contact without requiring an epitaxial relationship or a continuous coating. Simultaneous precursor delivery has been used to control constituent distribution in related Ag/ZnO USP composites [10], but differences in oxide chemistry prevent transfer of that architecture to this powder. The schematic therefore shows possible local contacts within a ZnO-dominant porous particle; spatial segregation and Cu2O/CuO coexistence remain alternatives.
Water collection and drying may subsequently increase secondary agglomeration, further separating the collected-powder morphology from the architecture initially produced in an individual droplet [32]. Testing the proposed mechanism would require interrupted or in situ synthesis measurements, complementary thermal/evolved-gas analysis, and HRTEM/STEM characterization of representative particles. XPS with Cu LMM analysis would address surface copper speciation [34]. Until those measurements are available, the proposed formation route explains how contact could arise, while the experimental conclusions remain limited to confirmed ZnO, qualitative copper detection, tentative copper-oxide assignments, apparent ZnO coherent-domain size, and SEM-visible morphology. No specific photocatalytic charge-transfer pathway is inferred.
4. Conclusions
USP at 400 °C produced a porous, shell-like agglomerated powder with XRD-confirmed dominant wurtzite ZnO and EDS-detected copper. The weaker diffraction features are compatible with candidate Cu2O and CuO contributions, but neither the copper-phase distribution nor reliable phase fractions are established. The Zn:Cu ratio in the collected powder remains unverified; the 90:10 cation ratio applies only to the precursor solution. The broad designation zinc oxide/copper oxide nanomaterial accommodates the unresolved Cu2O/CuO distribution without assigning all copper to a single oxide phase.
Reflection-mode Scherrer calculations and processed transmission-mode model summaries suggest ZnO coherent domains on a scale of tens of nanometres. The use of a constant silicon-standard instrumental width, missing individual transmission widths, possible overlap, and weak W–H linearity limit quantitative size–strain separation. A higher R2 for the FWHM-based Halder–Wagner representation does not establish a physically correct strain model or an independently calibrated size. An angle-dependent instrument-profile treatment and a complete transmission reflection-width dataset are required for reproducible quantitative comparison.
The temperature comparison shows that the principal ZnO reflection set remains identifiable between 400 and 600 °C. It does not establish that 400 °C is an optimum, that Cu2O remains quantitatively unchanged, or that domain growth is monotonic. Resolving those processing questions requires stable backgrounds and phase-resolved diffraction analysis. The present contribution is therefore a defined synthesis and characterization baseline rather than a fully optimized material.
The proposed droplet-to-particle mechanism provides testable routes by which evaporation, precursor conversion, and domain growth could generate porous particles and possible phase contact. SEM-visible morphology and tentative copper-oxide diffraction assignments cannot establish surface Cu(I) abundance, a lattice-resolved interface, or a functional p–n junction. The next decisive steps include reproducible multiphase diffraction analysis, representative quantitative elemental measurements, and complementary XPS/Auger and HRTEM/STEM measurements, followed by direct surface-area and application-specific performance testing. These measurements would determine whether the proposed architecture produces the interfacial behavior that motivates further development of ZnO/Cu2O powders.
Author Contributions
Conceptualization, V.N., M.R. and S.S. (Srećko Stopić); methodology, V.N., M.R. and S.S. (Srećko Stopić); validation, M.R., S.S. (Srećko Stopić) and D.M.; formal analysis, V.N., M.R. and B.F.; investigation, V.N., D.M., S.S. (Sonja Stanković) and A.C.; data curation, V.N., D.M., S.S. (Sonja Stanković) and A.C.; visualization, V.N., A.C. and B.F.; writing: original draft preparation, V.N.; writing: review and editing, V.N., M.R., S.S. (Srećko Stopić), D.M. and S.S. (Sonja Stanković); supervision, M.R., S.S. (Srećko Stopić) and B.F.; project administration, M.R. and S.S. (Srećko Stopić); funding acquisition, S.S. (Srećko Stopić) and B.F. All authors have read and agreed to the published version of the manuscript.
Funding
The research presented in this paper was conducted with the financial support of the Ministry of Science, Technological Development, and Innovations of the Republic of Serbia, within the funding of the scientific research work at the University of Belgrade, Technical Faculty in Bor (contract number 451-03-34/2026-03/200131).
Institutional Review Board Statement
Not applicable.
Informed Consent Statement
Not applicable.
Data Availability Statement
The diffraction displays and processed structural summaries are presented in the manuscript. The earlier Match! 4 output is retained in Section 3.1 only as an incomplete two-phase model result; the original reference-entry records and intensity-scaling settings are not available for verification. Individual transmission peak-width outputs, a traceable quantitative EDS concentration export, and independent-area EDS statistics are unavailable. No new three-phase refinement or quantitative EDS analysis is reported. The phase fractions and product Zn:Cu ratio are therefore not established.
Acknowledgments
The authors acknowledge the experimental and analytical infrastructure made available by the participating institutions.
Conflicts of Interest
The authors declare no conflicts of interest.
Abbreviations
The following abbreviations are used in this manuscript:
| Abbreviation | Definition |
| EDS | Energy-dispersive X-ray spectroscopy |
| FE-SEM | Field-emission scanning electron microscopy |
| FWHM | Full width at half maximum |
| RIR | Reference intensity ratio |
| SEM | Scanning electron microscopy |
| USP | Ultrasonic spray pyrolysis |
| XRD | X-ray diffraction |
| HW | Halder–Wagner |
| SSP | Size–strain plot |
| UDM | Uniform deformation model |
| USDM | Uniform stress deformation model |
| W–H | Williamson–Hall |
References
- Archela, E.; de Camargo, L.P.; da Silva Pelissari, M.R.; Dall’Antonia, L.H. n-ZnO/p-Cu2O Heterojunction Electrode: Characterization and Evaluation of Their Photoelectrochemical Properties. Int. J. Electrochem. Sci. 2019, 14, 3581–3594. [Google Scholar] [CrossRef] [Scilit] [PubMed]
- Akter, N.; Ahmed, T.; Haque, I.; Hossain, M.K.; Ray, G.; Hossain, M.M.; Islam, M.S.; Shaikh, M.A.A.; Akhtar, U.S. XPS Valence Band Observable Light-Responsive System for Photocatalytic Acid Red114 Dye Decomposition Using a ZnO–Cu2O Heterojunction. Heliyon 2024, 10, e30802. [Google Scholar] [CrossRef] [Scilit] [PubMed]
- Arunodaya, J.; Nayak, N.; Sahoo, T. Tailoring the Optical and Electrical Behavior of Cu2O/ZnO Heterojunction by Varying the Zn2+ Ion Concentration for Solar-Cell Applications. Micro Nanostruct. 2023, 174, 207488. [Google Scholar] [CrossRef] [Scilit]
- Abdolhoseinzadeh, A.; Sheibani, S. Enhanced Photocatalytic Performance of Cu2O Nano-Photocatalyst Powder Modified by Ball Milling and ZnO. Adv. Powder Technol. 2020, 31, 40–50. [Google Scholar] [CrossRef] [Scilit]
- Nedelkovski, V.; Radovanović, M.; Antonijević, M. Advances in Photocatalytic Degradation of Crystal Violet Using ZnO-Based Nanomaterials and Optimization Possibilities: A Review. ChemEngineering 2025, 9, 120. [Google Scholar] [CrossRef] [Scilit]
- Rahemi Ardekani, S.; Sabour Rouh Aghdam, A.; Nazari, M.; Bayat, A.; Yazdani, E.; Saievar-Iranizad, E. A Comprehensive Review on Ultrasonic Spray Pyrolysis Technique: Mechanism, Main Parameters and Applications in Condensed Matter. J. Anal. Appl. Pyrolysis 2019, 141, 104631. [Google Scholar] [CrossRef] [Scilit]
- Workie, A.B.; Ningsih, H.S.; Shih, S.-J. An Comprehensive Review on the Spray Pyrolysis Technique: Historical Context, Operational Factors, Classifications, and Product Applications. J. Anal. Appl. Pyrolysis 2023, 170, 105915. [Google Scholar] [CrossRef] [Scilit]
- Messing, G.L.; Zhang, S.-C.; Jayanthi, G.V. Ceramic Powder Synthesis by Spray Pyrolysis. J. Am. Ceram. Soc. 1993, 76, 2707–2726. [Google Scholar] [CrossRef] [Scilit]
- Hudandini, M.; Puri, N.R.; Winardi, S.; Widiyastuti, W.; Shimada, M.; Kusdianto, K. Photocatalytic Activity of ZnO/Ag Nanoparticles Fabricated by a Spray Pyrolysis Method with Different O2:N2 Carrier Gas Ratios and Ag Contents. Catalysts 2022, 12, 1374. [Google Scholar] [CrossRef] [Scilit]
- Muñoz-Fernández, L.; Alkan, G.; Milošević, O.; Rabanal, M.E.; Friedrich, B. Synthesis and Characterisation of Spherical Core-Shell Ag/ZnO Nanocomposites Using Single and Two-Steps Ultrasonic Spray Pyrolysis (USP). Catal. Today 2019, 321–322, 26–33. [Google Scholar] [CrossRef] [Scilit]
- Nguyen, T.H.A.; Quang, D.T.; Tan, L.V.; Vo, T.K. Ultrasonic Spray Pyrolysis Synthesis of TiO2/Al2O3 Microspheres with Enhanced Removal Efficiency towards Toxic Industrial Dyes. RSC Adv. 2023, 13, 5859–5868. [Google Scholar] [CrossRef] [Scilit] [PubMed]
- Yeşiltepe Özcelik, D.; Ebin, B.; Stopic, S.; Gürmen, S.; Friedrich, B. Mixed Oxides NiO/ZnO/Al2O3 Synthesized in a Single Step via Ultrasonic Spray Pyrolysis (USP) Method. Metals 2022, 12, 73. [Google Scholar] [CrossRef] [Scilit]
- Zheng, J.; Song, F.; Che, S.; Li, W.; Ying, Y.; Yu, J.; Qiao, L. One Step Synthesis Process for Fabricating NiFe2O4 Nanoparticle Loaded Porous Carbon Spheres by Ultrasonic Spray Pyrolysis. Adv. Powder Technol. 2018, 29, 1474–1480. [Google Scholar] [CrossRef] [Scilit]
- Kusdianto, K.; Puri, N.R.; Shimada, M.; Madhania, S.; Winardi, S. Synergistic Effect of Calcination Temperature and Silver Doping on Photocatalytic Performance of ZnO Material. Materials 2025, 18, 3362. [Google Scholar] [CrossRef] [Scilit] [PubMed]
- Stopic, S.; Hounsinou, A.H.; Husovic, T.V.; Emil-Kaya, E.; Friedrich, B. Synthesis of AgCoCuFeNi High Entropy Alloy Nanoparticles by Hydrogen Reduction-Assisted Ultrasonic Spray Pyrolysis. ChemEngineering 2024, 8, 63. [Google Scholar] [CrossRef] [Scilit]
- Firmansyah, D.A.; Kim, T.; Kim, S.; Sullivan, K.; Zachariah, M.R.; Lee, D. Crystalline Phase Reduction of Cuprous Oxide (Cu2O) Nanoparticles Accompanied by a Morphology Change during Ethanol-Assisted Spray Pyrolysis. Langmuir 2009, 25, 7063–7071. [Google Scholar] [CrossRef] [Scilit] [PubMed]
- Panigrahi, S.; Nunes, D.; Calmeiro, T.; Kardarian, K.; Martins, R.; Fortunato, E. Oxide-Based Solar Cell: Impact of Layer Thicknesses on the Device Performance. ACS Comb. Sci. 2017, 19, 113–120. [Google Scholar] [CrossRef] [Scilit] [PubMed]
- Majerič, P.; Rudolf, R.; Anžel, I.; Bogović, J.; Stopić, S.; Friedrich, B. Synthesis of NiTi/Ni-TiO2 Composite Nanoparticles via Ultrasonic Spray Pyrolysis. Mater. Tehnol. 2015, 49, 75–80. Available online: https://dk.um.si/IzpisGradiva.php?id=65243&lang=eng (accessed on 9 October 2026). [CrossRef] [Scilit]
- Åsbrink, S.; Norrby, L.-J. A Refinement of the Crystal Structure of Copper(II) Oxide with a Discussion of Some Exceptional e.s.d.’s. Acta Crystallogr. B 1970, 26, 8–15. [Google Scholar] [CrossRef] [Scilit]
- Swanson, H.E.; Tatge, E. Standard X-Ray Diffraction Powder Patterns; National Bureau of Standards Circular 539, Volume I; U.S. Government Printing Office: Washington, DC, USA, 1953; pp. 49–50, Table 26. [Google Scholar] [CrossRef] [Scilit]
- Chung, F.H. Quantitative Interpretation of X-ray Diffraction Patterns of Mixtures. I. Matrix-Flushing Method for Quantitative Multicomponent Analysis. J. Appl. Crystallogr. 1974, 7, 519–525. [Google Scholar] [CrossRef] [Scilit]
- Crystal Impact. Match! Help Reference Intensity Ratio Method for Quantitative Analysis. Available online: https://www.crystalimpact.com/match/help/idh_quant_analysis_RIR.htm (accessed on 10 October 2026).
- Hafner, M.R.; Villanova, L.; Carraro, F. App-based Quantification of Crystal Phases and Amorphous Content in ZIF Biocomposites. CrystEngComm 2022, 24, 7266–7271, Supporting Information, Table S1. [Google Scholar] [CrossRef] [Scilit] [PubMed]
- Domán, A.; Madarász, J.; László, K. In Situ Evolved Gas Analysis Assisted Thermogravimetric (TG-FTIR and TG/DTA–MS) Studies on Non-activated Copper Benzene-1,3,5-tricarboxylate. Thermochim. Acta 2017, 647, 62–69. [Google Scholar] [CrossRef] [Scilit]
- Huang, Q.; Wang, C.; Shan, Q. Quantitative Deviation of Nanocrystals Using the RIR Method in X-ray Diffraction (XRD). Nanomaterials 2022, 12, 2320. [Google Scholar] [CrossRef] [Scilit] [PubMed]
- Scardi, P.; Leoni, M.; Delhez, R. Line Broadening Analysis Using Integral Breadth Methods: A Critical Review. J. Appl. Crystallogr. 2004, 37, 381–390. [Google Scholar] [CrossRef] [Scilit]
- Monshi, A.; Foroughi, M.R.; Monshi, M.R. Modified Scherrer Equation to Estimate More Accurately Nano-Crystallite Size Using XRD. World J. Nano Sci. Eng. 2012, 2, 154–160. [Google Scholar] [CrossRef]
- Williamson, G.K.; Hall, W.H. X-ray Line Broadening from Filed Aluminium and Wolfram. Acta Metall. 1953, 1, 22–31. [Google Scholar] [CrossRef] [Scilit]
- Halder, N.C.; Wagner, C.N.J. Separation of Particle Size and Lattice Strain in Integral Breadth Measurements. Acta Crystallogr. 1966, 20, 312–313. [Google Scholar] [CrossRef] [Scilit]
- Khorsand Zak, A.; Abd Majid, W.H.; Abrishami, M.E.; Yousefi, R. X-ray Analysis of ZnO Nanoparticles by Williamson–Hall and Size–Strain Plot Methods. Solid State Sci. 2011, 13, 251–256. [Google Scholar] [CrossRef] [Scilit]
- Pal, A. Comments on “X-ray Analysis of ZnO Nanoparticles by Williamson Hall and Size-Strain Plot Methods” Solid State Sciences 13 (2011) 251–256. Solid State Sci. 2023, 135, 107060. [Google Scholar] [CrossRef] [Scilit]
- Wang, B.; Zhang, W.; Zhang, W.; Yu, C.; Wang, G.; Huang, L.; Mujumdar, A.S. Influence of Drying Processes on Agglomeration and Grain Diameters of Magnesium Oxide Nanoparticles. Dry. Technol. 2007, 25, 715–721. [Google Scholar] [CrossRef] [Scilit]
- Newbury, D.E.; Ritchie, N.W.M. Is Scanning Electron Microscopy/Energy Dispersive X-ray Spectrometry (SEM/EDS) Quantitative? Scanning 2013, 35, 141–168. [Google Scholar] [CrossRef] [Scilit] [PubMed]
- Biesinger, M.C. Advanced analysis of copper X-ray photoelectron spectra. Surf. Interface Anal. 2017, 49, 1325–1334. [Google Scholar] [CrossRef] [Scilit]

Disclaimer/Publisher’s Note: The statements, opinions and data contained in all publications are solely those of the individual author(s) and contributor(s) and not of MDPI and/or the editor(s). MDPI and/or the editor(s) disclaim responsibility for any injury to people or property resulting from any ideas, methods, instructions or products referred to in the content. |
© 2026 by the authors. Licensee MDPI, Basel, Switzerland. This article is an open access article distributed under the terms and conditions of the Creative Commons Attribution (CC BY) license.