


Abstract
Microcomputed tomography (microCT) enables non-destructive 3D imaging, but conventional segmentation cannot resolve objects smaller than a voxel. This study presents a microCT-based method that maps degradation-induced sub-voxel porosity by converting voxel-specific X-ray attenuation changes between registered pre- and post-degradation datasets into porosity estimates. The method also accounts for other degradation-induced physical and chemical changes that affect X-ray attenuation; however, their contributions cannot be directly separated from the estimated change in porosity. The method was demonstrated on poly(3-hydroxybutyrate-co-3-hydroxyvalerate) (PHBV), Poly(lactic-co-glycolic acid) (PLGA) and tricalcium phosphate (TCP) scaffolds. Specimens were scanned before and after degradation using identical acquisition and reconstruction settings, and datasets were 3D-registered. The estimated effective sub-voxel porosity increase was 8.33 ± 0.63%, versus a gravimetric mass loss of 7.89 ± 0.82%. SEM showed a pore area fraction of 7.64 ± 0.23% and a mean equivalent pore diameter of 1.79 ± 1.15 μm, below the 5.5 μm voxel size. Maps revealed spatially heterogeneous degradation-related changes. The consistency between the microCT-derived estimate and the complementary evidence from gravimetry and SEM provides indirect validation of the interpretation of the measured X-ray attenuation changes in terms of effective sub-voxel porosity.
1. Introduction
The field of tissue engineering (TE) has advanced dramatically in the last few decades, offering the potential for regenerating almost every tissue and organ of the human body [1,2,3,4,5]. TE aims at the development of biological products that repair, regenerate or replace tissues and/or organs. It offers solutions and hope for sufferers of diseases that are currently untreatable, where life is at stake, and for regenerating diseased, damaged, or defective tissues and organs. One of the most promising approaches in tissue engineering is the use of degradable materials to facilitate organ and tissue regeneration, which constitutes one of the basic tenets of the field [6,7,8,9]. However, the question of how to optimally design such biomaterials remains unresolved.
MicroCT has been used to characterize scaffold microarchitecture [10] and monitor structural changes during in vitro degradation [11]. However, conventional segmentation of microCT images is influenced by spatial resolution, partial-volume effects, and the choice of segmentation threshold [12,13]. Analyzing grayscale changes between pre- and post-degradation datasets may therefore provide complementary information on degradation-related changes that are not fully captured by conventional segmentation. In the present study, these changes are used to estimate effective sub-voxel porosity. Importantly, however, changes in grayscale values reflect the combined effects of degradation-related processes that can be detected through X-ray attenuation, including void formation and potential changes in material composition and density. These contributions cannot be distinguished using the present method; therefore, the resulting sub-voxel porosity should be interpreted as an effective attenuation-derived estimate.
MicroCT has also been used to monitor structural changes during in vitro degradation of polymer scaffolds by quantifying parameters such as porosity and pore size [14]. Grayscale-based methods have also been developed to estimate sub-resolution porosity in porous materials [15]. However, these grayscale-based approaches were not designed to quantify degradation-related changes by comparing registered microCT datasets acquired before and after degradation.
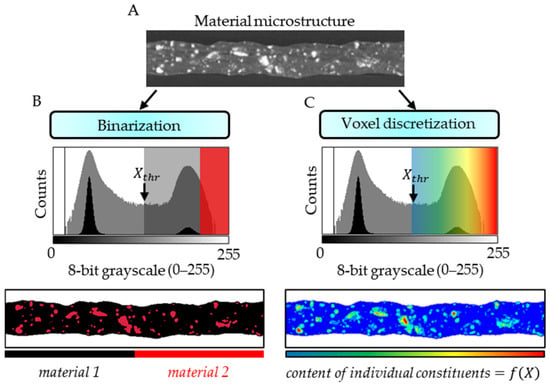
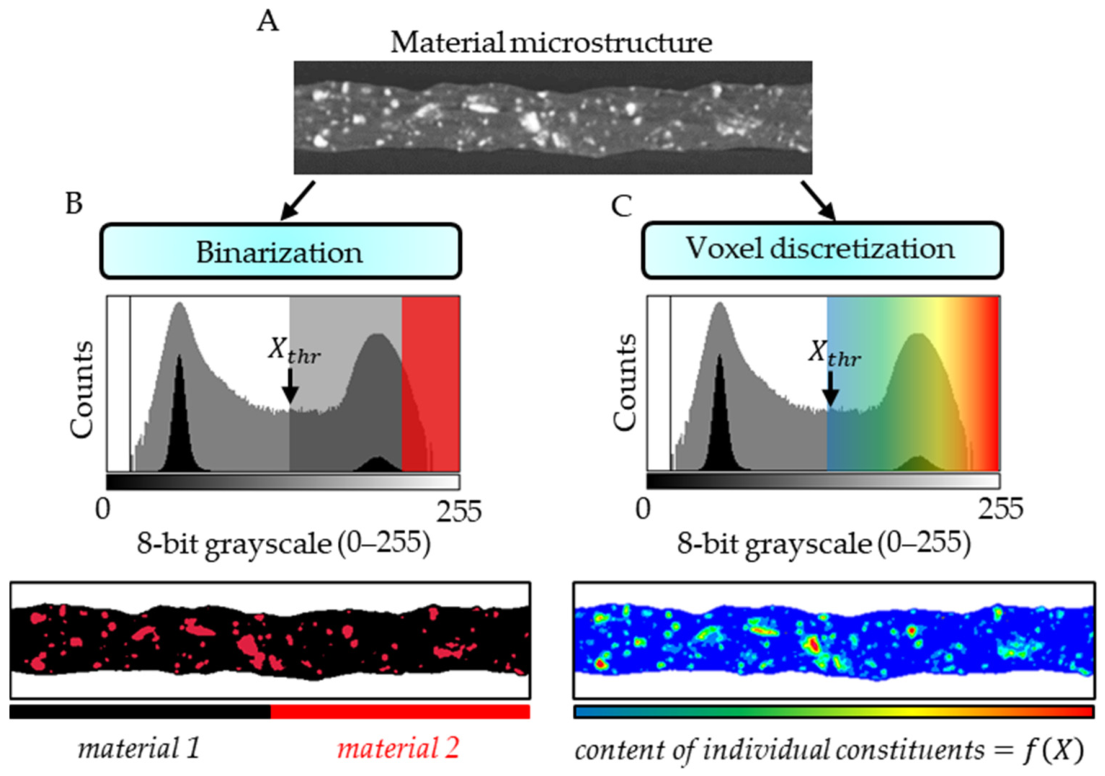
There has been extensive research on the use of microCT for microstructural investigation, with image binarization being one of the basic procedures in image analysis [16,17,18,19]. Image binarization is the process of converting an image consisting of 2D pixels or 3D voxels, originally represented as an 8- or 16-bit grayscale image (Figure 1A), into an image containing only 0 and 1 values (Figure 1B). This allows selected objects to be separated based on a binarization threshold (). In this context, the spatial resolution of the microCT measurement strongly influences which material components can be considered in quantitative analysis. Ideally, the resolution should be sufficient to resolve the smallest object of interest. However, the voxel discretization of the material volume provides each voxel with a reconstructed gray value representing the averaged X-ray attenuation of the material components present within its volume (Figure 1C). Therefore, material components smaller than the voxel size, including nano- and microscale features, cannot be individually resolved by conventional image segmentation, but their effective volume fractions can still influence the reconstructed gray value of the voxel.
Figure 1.
Virtual cross-section of the microCT-scanned fiber consisting of a gray matrix and white particles (A). MicroCT image binarization detailing the matrix and particles (B). Voxel discretization allows for the specification of individual material constituents depending on the gray values of the voxels (C). —binarization threshold.
Crawley and co-authors [20] were the first to relate and use in practice the dependence of the X-ray attenuation coefficient on the volume fraction of the components of the tested material. This approach was further developed by Hellmich et al. [21] for the analysis of jaw bone tissue, taking into account the presence of pores within the volume of the analyzed voxels. In the present study, this concept is further extended from the characterization of a single material state to the quantitative comparison of two registered states of the same specimen: the initial state and any selected stage of degradation. This extension enables degradation-induced changes in unresolved porosity to be mapped in three dimensions at the sub-voxel level. An important methodological point is that microCT cannot directly resolve pores smaller than the voxel size as individual objects. Nevertheless, a sub-voxel pore population changes the effective X-ray attenuation and therefore the reconstructed gray value. In this study, degradation-induced effective sub-voxel porosity is estimated from voxel-specific changes in X-ray attenuation between spatially registered microCT datasets acquired from the same specimen before and after degradation. The resulting estimate represents an effective void fraction within individual voxels rather than the directly resolved size or geometry of individual sub-voxel pores.
A ternary bone scaffold was selected to demonstrate the applicability of the novel method. Poly(lactic-co-glycolic acid) (PLGA) is widely used because its hydrolytically labile ester bonds enable tunable degradation. In aqueous environments, water penetrates the polymer, ester-bond cleavage reduces molecular weight, and subsequent chain scission and solubilization produce lactic- and glycolic-acid-derived degradation products [22,23]. The kinetics are strongly affected by the lactide:glycolide ratio, molecular weight and device morphology. In contrast, poly(3-hydroxybutyrate-co-3-hydroxyvalerate) used as a matrix (PHBV) is a biodegradable polyester whose degradation can be considerably slower at the level of mass loss, although substantial molecular-weight reduction and changes in mechanical properties may occur before macroscopic mass loss becomes pronounced [24,25,26]. This distinction is particularly important when interpreting long-term degradation of PHBV-rich composites.
Combining a slowly degrading polymer matrix with a more hydrolytically labile polymer and a calcium-phosphate phase offers a route to tailor scaffold degradation and biological functionality. Ternary composite scaffolds containing a polymer matrix, PLGA, and tricalcium phosphate (TCP) have been investigated as bone-regeneration materials because TCP can contribute osteoconductive functionality while also modifying the degradation environment [27,28,29,30]. In the present study, the ternary PHBV/PLGA/TCP composite was selected not only for its relevance to bone-tissue engineering but also as a methodological test case for a multicomponent material in which several constituents contribute to the X-ray signal and may respond differently during degradation. The internal architecture is an additional determinant of performance: pore dimensions and fiber lay-down patterns influence transport, cell colonization, and mechanical behavior [31,32]. Thus, a method capable of mapping degradation-related changes in three dimensions is particularly relevant to composite scaffolds, where the spatial relationship between constituents may influence local degradation.
The objective of this study was therefore to establish and demonstrate the method for quantifying and spatially visualizing degradation-induced sub-voxel porosity in a PHBV/PLGA/TCP scaffold after two weeks of hydrolytic degradation in phosphate-buffered saline (PBS). The ternary polymer/polymer/ceramic composition was intentionally chosen to demonstrate that the workflow can be applied to a multicomponent composite rather than only to a single-phase material. The specific aims were to (i) determine gravimetric mass loss, (ii) calculate voxel-specific estimates of degradation-induced sub-voxel porosity from microCT datasets, (iii) assess the variability of the calculated sub-voxel porosity changes using a repeat-scan control, (iv) quantify and visualize the three-dimensional distribution of degradation-related changes, and (v) provide indirect validation for the microCT-based interpretation using complementary morphological evidence from SEM analysis of fracture surfaces. The working hypothesis was that two weeks of hydrolytic degradation would produce measurable changes in the grayscale-derived sub-voxel porosity estimate, accompanied by mass loss detectable by gravimetry and morphological changes observable by SEM.
2. Materials and Methods
2.1. Materials
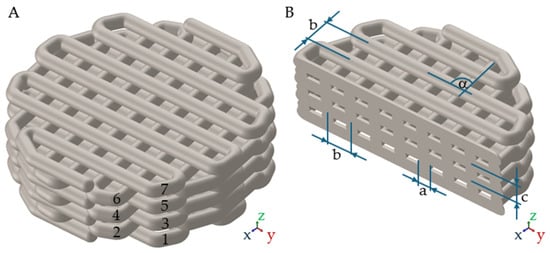
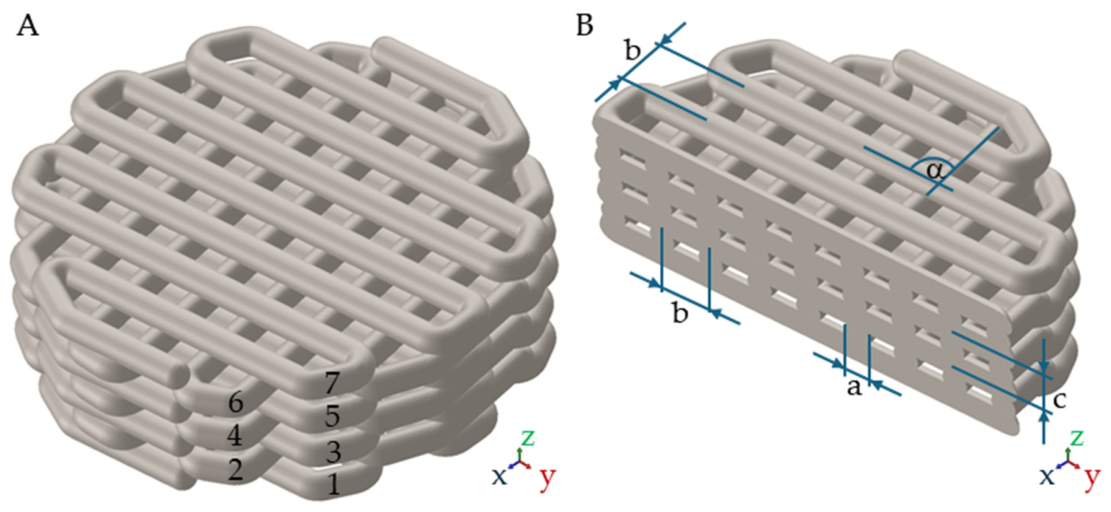
The scaffold was designed as a cylindrical porous architecture composed of deposited fibers arranged in seven layers (Figure 2). The nominal fiber diameter was 0.33 mm, the center-to-center fiber spacing was 0.66 mm, the resulting designed pore size in the xy plane was 0.33 mm, and the nominal three-dimensional pore size was approximately 0.30 mm. The distance between successive layers in the z direction was 0.24 mm, and adjacent layers were rotated by 90°. The model height was 1.77 mm and the diameter was 5.78 mm. The overall dimensions were compatible with the wells used for the in vitro experiments.
Figure 2.
CAD design of the porous composite scaffold (A) and its virtual cross-section (B). The architecture comprised seven fiber layers with a 0.33 mm fiber diameter (a), 0.66 mm center-to-center spacing (b) and a 90° rotation between adjacent layers (α).
Poly(3-hydroxybutyrate-co-3-hydroxyvalerate) (PHBV) containing 12 wt.% 3-hydroxyvalerate (Sigma-Aldrich, St. Louis, MO, USA), poly(L-lactide-co-glycolide) (PLGA; Resomer LG 855 S; lactide-to-glycolide molar ratio of 85:15; Boehringer Ingelheim, Ingelheim am Rhein, Germany), and tricalcium phosphate (TCP; nanopowder; with a particle size of less than 200 nm, according to BET; Sigma-Aldrich, St. Louis, MO, USA) were used in this study. The composite feedstock was prepared by the solution casting method [33]. PHBV and PLGA were dissolved in methylene chloride (Chempur, Piekary Śląskie, Poland). TCP was then added and the suspension was magnetically stirred to obtain a homogeneous distribution of ceramic particles. The mixture was cast into a Petri dish and dried under a fume hood for 24 h, followed by vacuum drying for 72 h at 25 °C and 50 mbar. The resulting composite film was cut into small pieces and used as feedstock for 3D printing. The final mass and volume fractions are summarized in Table 1. A Bioscaffolder system (SysEng, Radeberg, Germany) was used to fabricate the samples (n = 6).
Table 1.
Composition of the PHBV/PLGA/TCP composite feedstock.
2.2. In Vitro Hydrolytic Degradation
Hydrolytic degradation was performed in accordance with ISO 10993-13:2010 [34]. Phosphate-buffered saline (PBS; Sigma-Aldrich, St. Louis, MO, USA) was prepared according to the manufacturer’s instructions by dissolving one PBS tablet in 200 mL of demineralized water. Sodium azide (NaN3, Sigma-Aldrich, St. Louis, MO, USA) was added to a final concentration of 0.02% to suppress microbial growth; the final pH was 7.370. Each scaffold (n = 6) was placed in an individual well containing 10 mL of PBS/NaN3 in a six-well plate. Samples were incubated at 37 °C with orbital shaking at 65 rpm for two weeks. The percentage mass loss was calculated from the dry mass before () and after () degradation:
Before degradation, all specimens were scanned by microCT and weighed using a laboratory balance (Radwag XA 110, Radom, Poland). After a two-week period, the same specimens were removed, dried under vacuum for 96 h at 25 °C and 50 mbar (Memmert VO 400, Schwabach, Germany), and weighed again. Residual methylene chloride was assumed to be negligible due to its high volatility and the drying conditions; however, its potential contribution to mass loss during PBS immersion cannot be completely excluded. The final TCP content and distribution were not independently quantified, and the nominal TCP content was used. Results are reported as mean ± standard deviation (SD).
2.3. MicroCT Acquisition
The same specimens were imaged before and after degradation using a SkyScan 1172 microCT system (Bruker microCT, Kontich, Belgium) with identical acquisition parameters and phantom. The X-ray tube voltage was 40 kV, the current 250 μA, the exposure time 1 s per projection, and 600 projections were acquired. The reconstructed voxel edge length was 5.5 μm. Reconstruction was performed using the NRecon software (ver. 1.7.4.6, Bruker microCT, Kontich, Belgium). Identical acquisition and reconstruction conditions were essential because the analysis relies on gray value differences between corresponding voxels.
2.4. MicroCT-Based Degradation-Induced Sub-Voxel Porosity
The input for the method presented in this study consisted of two microCT scans of the same scaffold: the first acquired in the initial state and the second acquired after the degradation test. Each voxel was represented by an 8-bit reconstructed gray value () corresponding to the local reconstructed X-ray attenuation. The two datasets were then spatially registered in three dimensions using DataViewer (ver. 1.5.6.2, 64-bit, Bruker microCT, Kontich, Belgium). The registration parameters were optimized until spatial correspondence between the pre- and post-degradation datasets was achieved, with particular attention to the scaffold geometry and fiber boundaries. This procedure enabled voxel-specific comparison of corresponding locations in the two registered volumes. The reconstructed voxel-specific X-ray attenuation coefficients were related to the gray values by the linear relationship [35]:
where and are voxel-independent microCT constants. The voxel-specific gray values were then used to estimate the effective sub-voxel porosity change, including contributions from unresolved constituents smaller than the voxel size. In the present formulation, the variable represents the effective volume fraction of newly formed void space within the analyzed voxel and can therefore be interpreted as the air volume fraction associated with degradation-induced porosity. The analysis assumes that the dominant detectable change between the initial and degraded states is the formation or increase of internal void space. Under this assumption, the rule of mixtures for the X-ray attenuation coefficient of a composite material [20,21] can be written as:
where is the X-ray attenuation coefficient of material (bone scaffold) voxel i (, where is the total number of voxels) after the degradation test, is the X-ray attenuation coefficient of air, is the X-ray attenuation coefficient of the scaffold voxel i in the initial state (after manufacturing). Inserting (2) into (3) yields an average rule of mixtures for gray values ():
which can be transformed to provide the voxel-specific porosity changes from gray values, in the form:
where is the gray value of the scaffold voxel i after the degradation test, is the gray value of air, and is the gray value of the scaffold voxel i in the initial state. was identified from the “air peak” of a gray value histogram. The minimum value between the “air peak” and the “solid peak” was identified as the threshold to delineate between pure “air voxels” (air surrounding the scaffold) and “solid voxels” (material of the scaffold), with the latter containing a sub-voxel porosity change according to (5). Hence, the sub-voxel porosity change can be expressed as:
If , this means that material composition change (caused by degradation) is due to density decrease caused by new pores, and, in this case, ranges from 0 to 1 (0–100%). A value of 1 corresponds to a voxel that is effectively occupied by air.
The total increase in sub-voxel porosity induced by degradation of the investigated material ) was calculated as follows:
where is the probability density function of gray-scaled attenuation values . Use of (6) in (7) yields:
A repeat-scan control was performed by scanning the same scaffold twice in its initial, undegraded state using identical acquisition and reconstruction parameters. The two datasets were spatially registered, and voxel-specific apparent changes in effective sub-voxel porosity were calculated using the same equation as for the pre- and post-degradation comparison. The mean change was calculated to assess the variability observed in the absence of degradation.
CTAn (ver. 1.20.8.0 +, Bruker microCT, Kontich, Belgium) and CTVox (ver. 3.3.1, Bruker microCT, Kontich, Belgium) software were used to process images and obtain two- and three-dimensional visualizations. The complete analysis was performed on the registered pre- and post-degradation datasets, and the same thresholding and processing rules were applied to the corresponding datasets. Results of sub-voxel porosity change (n = 3) are reported as mean ± standard deviation (SD).
2.5. Validation of the MicroCT-Derived Porosity Change
The microCT-derived total sub-voxel porosity change was assessed using two complementary measurements: gravimetry and scanning electron microscopy (SEM). Gravimetry provided a global mass-balance measure of material loss (n = 6), whereas SEM provided higher-resolution but localized morphological evidence of pore formation. These techniques were treated as complementary checks rather than as measurements of the same physical quantity.
Samples were vacuum-dried before SEM examination. Scaffold fibers were fractured after cooling in liquid nitrogen, and the fracture surfaces were imaged using a Phenom Pro-X scanning electron microscope (Thermo Fisher Scientific, Eindhoven, The Netherlands) without conductive coating. SEM images were acquired at 800× and 3000× magnification at an accelerating voltage of 10 kV, with pixel sizes of 0.163 μm and 0.043 μm, respectively. One fracture surface was examined for each of the three scaffolds (n = 3), and three fields of view per scaffold were analyzed at each magnification. The SEM observations were obtained from selected fracture surfaces that were not spatially matched to the regions analyzed by microCT, and fracture-related artifacts cannot be excluded.
Qualitative and quantitative image analyses were performed using CTAn. Pores were identified by image binarization, and the pore area fraction, pore number, and equivalent pore diameter were determined for the analyzed fields. Gravimetry and SEM results are reported as the mean ± standard deviation (SD).
3. Results
3.1. MicroCT-Based Characterization of Degradation-Induced Sub-Voxel Porosity
The air peak in the 8-bit gray value histograms was 44.14 ± 0.53. The scaffold peak shifted from 81.74 ± 0.47 before degradation to 78.81 ± 0.54 after two weeks of degradation. The reduction in the scaffold gray value is consistent with a decrease in effective X-ray attenuation associated with the material degradation.
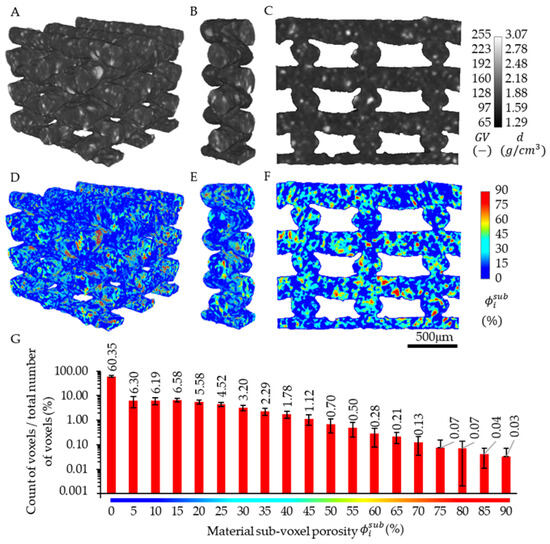
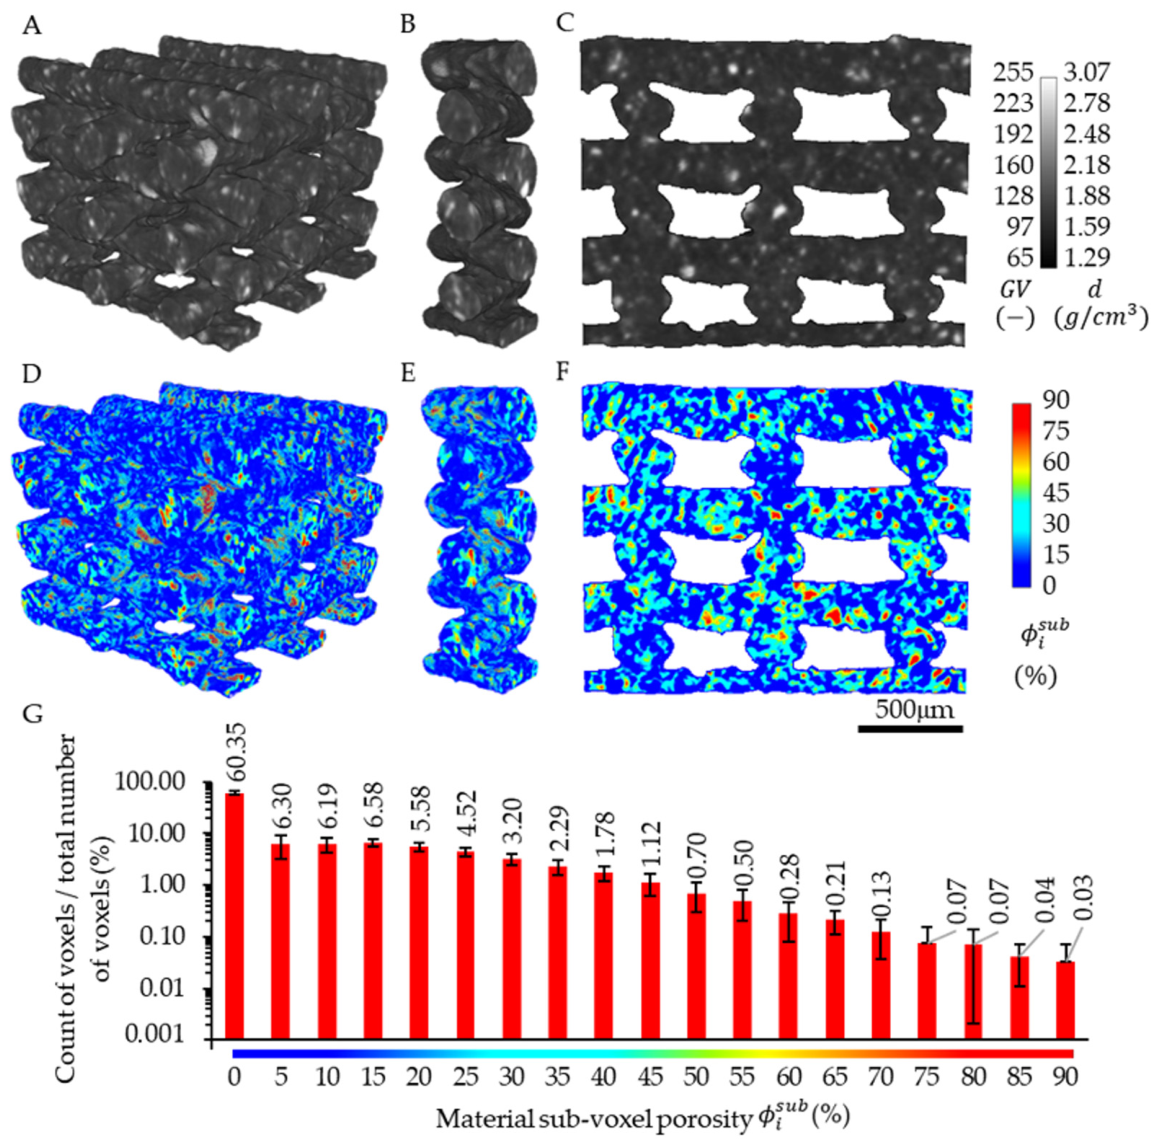
Application of the microCT-based degradation-induced sub-voxel porosity mapping analysis revealed an effective increase in sub-voxel porosity of 8.33 ± 0.63% (mean ± standard deviation). This indicates that calculating the total increase in sub-voxel porosity requires more than substituting the characteristic peak positions into Equation (5), which yields a value of 7.79 ± 0.52%. In the repeat-scan control, the mean apparent change in effective sub-voxel porosity was 0.38%.
The new method indicated that degradation-related changes were distributed throughout the analyzed scaffold volume. Nevertheless, regions containing TCP and regions located at fiber intersections showed locally higher sub-voxel porosity changes . On average, 60.35% of the scaffold volume showed no change in . A small fraction of the scaffold volume (0.03%) exhibited a very large change in , reaching an approximately 90% increase in sub-voxel porosity. These voxels were located in surface regions corresponding to TCP particles. The coefficient of variation (CV) of the degradation-induced sub-voxel porosity increments was 162.4%, indicating substantial variability and reflecting the heterogeneous distribution of porosity increments across the analyzed volume. The results are shown for a representative part of the scaffold (Figure 3).
Figure 3.
MicroCT images of a representative part of the scaffold in the initial state—after manufacturing (A–C); results of material sub-voxel porosity changes after two weeks of in vitro degradation (D–F); 3D view (A,D), 3D internal part (B,E), and 2D cross-section (C,F); histogram of material composition change (G).
3.2. Validation of the New Method—Gravimetric and SEM Analysis
The mean initial dry mass of composite scaffolds was 0.0266 ± 0.0015 g. After two weeks in PBS and subsequent drying, the mean mass was 0.0245 ± 0.0016 g. The corresponding mass loss was 7.89 ± 0.82%.
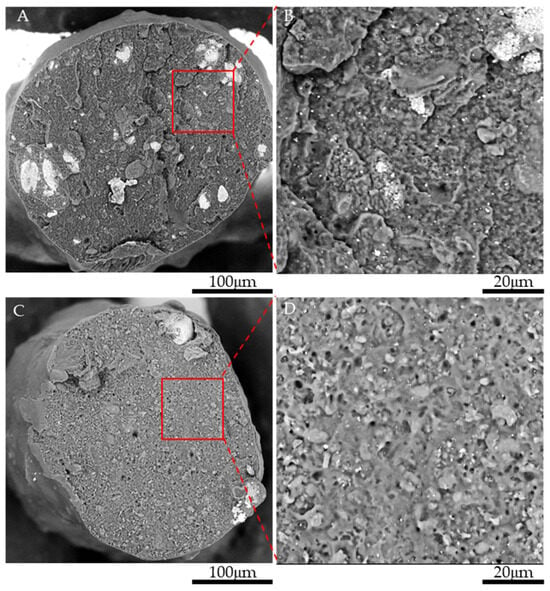
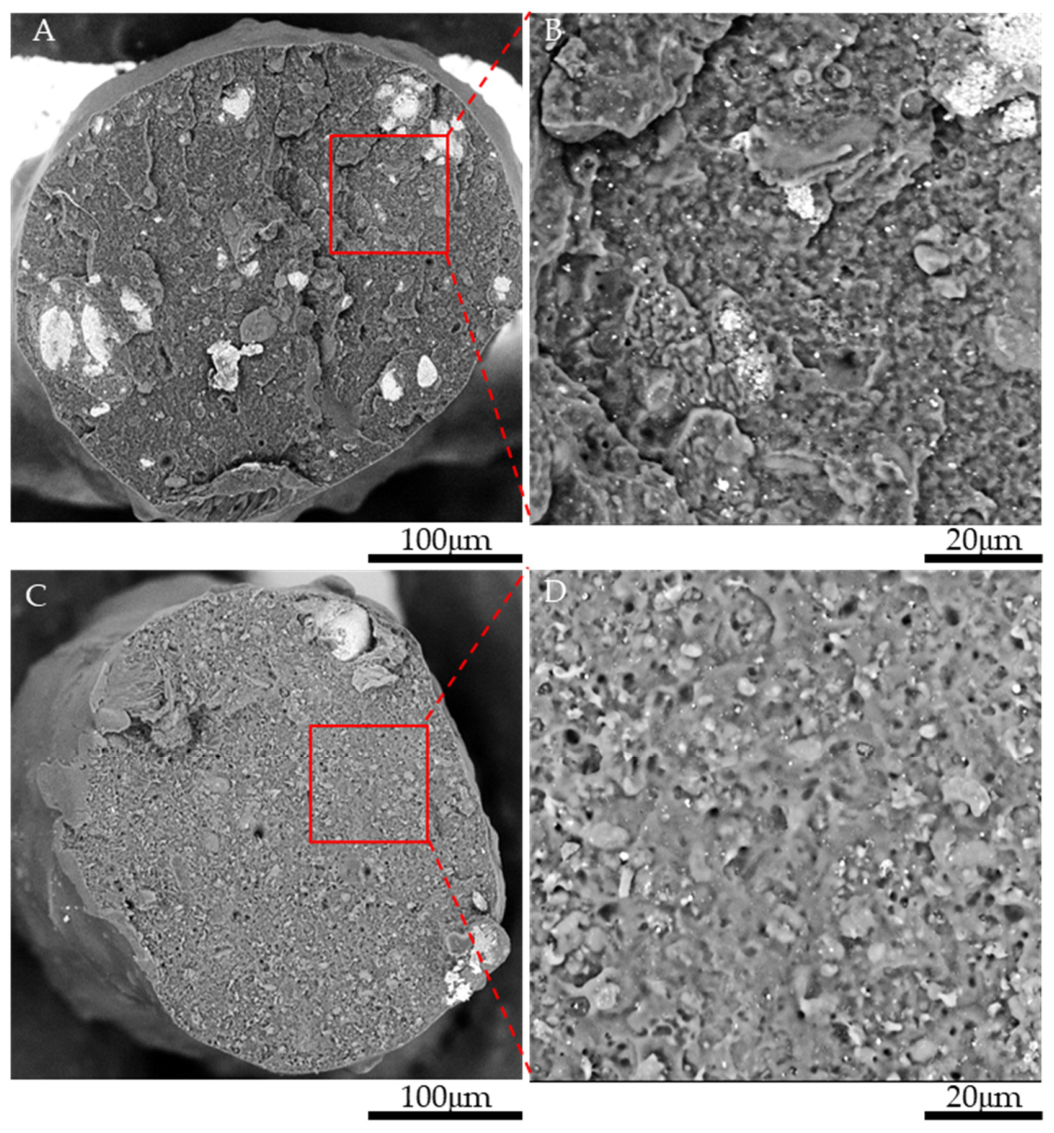
Validation of the new method for calculating sub-voxel porosity from microCT data was performed not only by determining mass loss but also by SEM observations of fracture surfaces of the composite scaffold fibers in the initial state (Figure 4A,B) and after in vitro hydrolytic degradation (Figure 4C,D). Fibers of the composite scaffold in the initial state exhibited an approximately solid structure, with a negligible number of pores observed. In contrast, numerous pores were observed in the fibers of the composite scaffold after degradation, occurring either individually or as networks of interconnected pores.
Figure 4.
Fracture surface of a composite scaffold fiber in the initial state (A,B) and after two weeks of in vitro hydrolytic degradation in PBS (C,D).
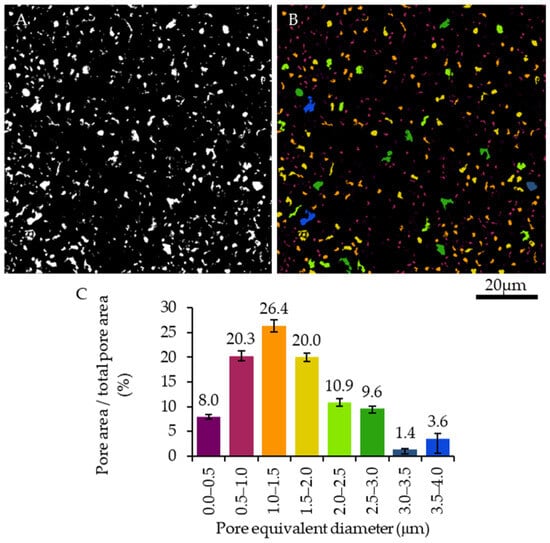
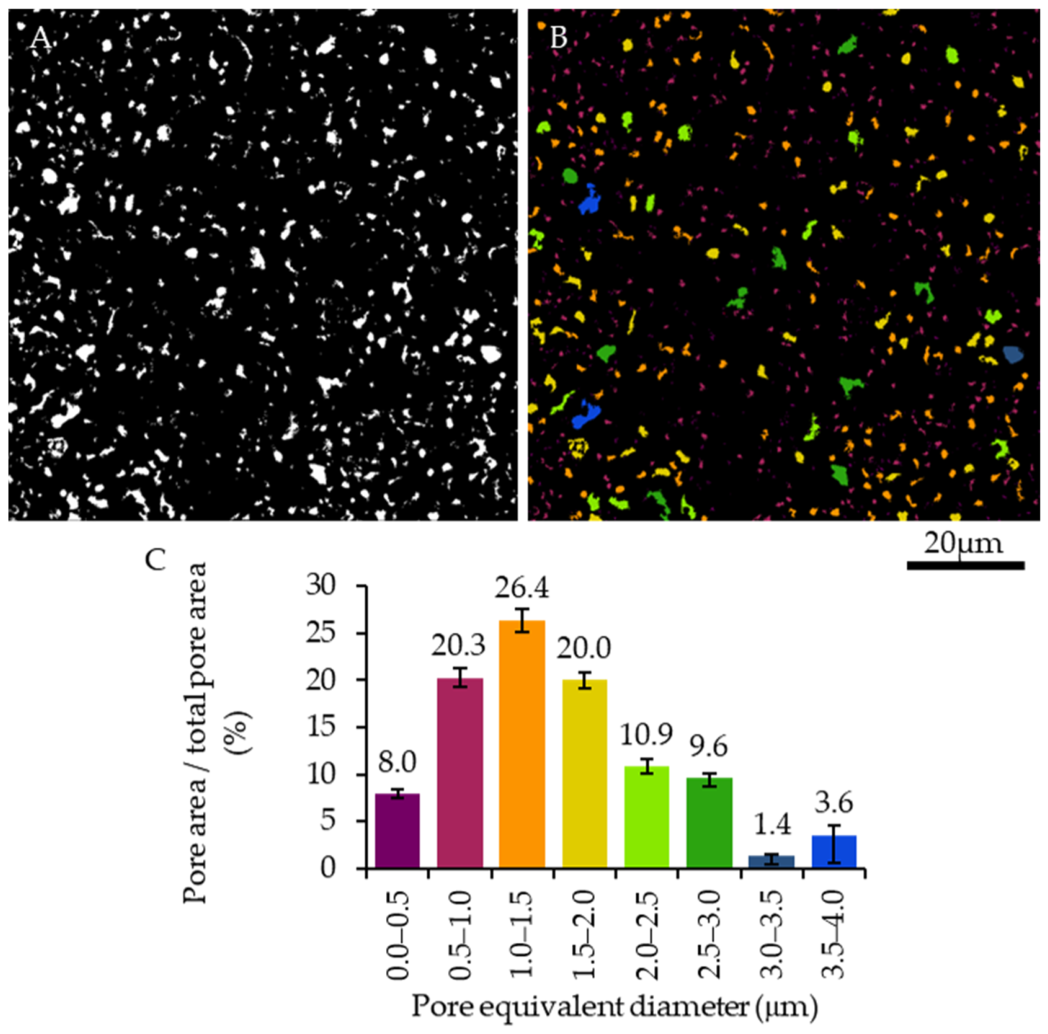
SEM images of the fracture surfaces of fibers after degradation were subjected to image analysis. Images were binarized (Figure 5A; binarization of the image shown in Figure 4D). The pore area fraction, expressed as the ratio of the pore area (white regions) to the total analyzed area (8000 μm2), was calculated as 7.64 ± 0.23%. This value was comparable in magnitude to the gravimetric mass loss of 7.89 ± 0.82%. The number of pores was 1223 ± 98. The pores were divided into ranges according to their equivalent diameter (Figure 5B), and the ratio of pore area to the total analyzed area was calculated as a function of pore equivalent diameter (Figure 5C). The mean pore size was 1.79 ± 1.15 μm. This value was approximately three times smaller than the voxel size used in microtomographic imaging (5.5 μm). Nevertheless, these sub-voxel pores can contribute to the effective X-ray attenuation of microCT voxels, providing a physical basis for estimating their volumetric contribution from registered gray value changes.
Figure 5.
Binary image of pores and interconnected pore networks (binarization of the image shown in Figure 4D) in the scaffold after two weeks of in vitro hydrolytic degradation in PBS (A), and color assignment to the pores (B) according to their equivalent diameter (C).
4. Discussion
Existing partial-volume approaches exploit intermediate voxel intensities to estimate the local fractions of unresolved phases [36]. In contrast, differential microCT methods for sub-resolution porosity characterization compare scans acquired under different pore-filling conditions, typically using a dry scan and a scan after saturation with a contrast-enhancing liquid, to identify pore space unresolved in conventional images [37]. The present approach differs in that it compares spatially registered scans of the same specimen acquired before and after degradation under identical acquisition and reconstruction conditions. Voxel-specific attenuation changes are used to map degradation-induced changes in effective sub-voxel porosity. However, the method does not directly resolve individual sub-voxel pores. This distinction is essential: the method extends the information content of microCT rather than overcoming its physical spatial-resolution limit.
The mean apparent change observed in the repeat-scan control (0.38%) was approximately 22 times lower than the mean degradation-induced increase in effective sub-voxel porosity (8.33%). This comparison supports the interpretation that the observed changes exceed the variability associated with repeat scanning under the applied conditions. However, the repeat-scan control does not establish the absolute accuracy of the method or demonstrate that all attenuation changes after degradation arise exclusively from void formation.
An important feature is that the method is inherently three-dimensional. Gravimetric mass loss provides a global scalar measure and cannot indicate where material loss occurred. SEM provides substantially higher spatial resolution, but samples fracture surfaces and selected regions rather than the entire intact scaffold volume. In contrast, the proposed analysis preserves the three-dimensional location of the X-ray attenuation change throughout the specimen. The resulting maps can therefore distinguish relatively unchanged regions from regions with increased effective sub-voxel porosity and reveal spatial heterogeneity of degradation. This spatial dimension is particularly relevant for porous biomaterials, where localized internal degradation may influence transport pathways, local mechanical integrity, and the evolution of the pore network.
The SEM observations provide an important independent indirect validation of the physical interpretation. The degraded regions contained 7.64 ± 0.23% pore area, 1223 ± 98 pores per analyzed field, and a mean equivalent pore diameter of 1.79 ± 1.15 μm. These characteristic pore dimensions are substantially smaller than the 5.5 μm microCT voxel. SEM therefore demonstrates the physical presence of sub-voxel porosity that cannot be identified by conventional pore-by-pore segmentation at the microCT resolution, while the new method provides the complementary three-dimensional spatial distribution. The two techniques should not be regarded as measuring identical quantities: SEM quantifies morphology in selected fracture-surface regions, whereas the new method estimates an effective volumetric porosity from voxel-specific X-ray attenuation changes. Their agreement at the level of degradation-induced pore formation supports the proposed interpretation.
The selection of the PHBV/PLGA/TCP ternary composite is also central to the methodological significance of the work. PHBV, PLGA, and TCP can contribute differently to X-ray attenuation and can undergo different degradation or dissolution processes. The method does not require individual segmentation of PHBV, PLGA, and TCP at the sub-voxel scale; instead, each “degraded” voxel is compared with its own pre-degradation reference. This makes the workflow particularly relevant to composite biomaterials in which phase-specific degradation may occur below the spatial resolution of the imaging system. At the same time, the current formulation assumes that the observed X-ray attenuation change can be represented as a change in the effective fraction of original material and newly formed void space. Consequently, the method should be interpreted as an effective sub-voxel porosity measure rather than a direct chemical assay of the individual constituents.
The localized increase in sub-voxel porosity observed in the vicinity of TCP-rich regions may be related to the local dissolution of TCP and the degradation of the surrounding polymer matrix. Previous studies on polymer/TCP composites have shown that degradation of the polymer matrix can expose or detach TCP particles, followed by their dissolution and the formation of local porous features [38]. In addition, the spatially heterogeneous degradation observed near fiber intersections may be related to the local scaffold geometry and differences in surface-to-volume ratio, which have been reported to influence degradation kinetics in additively manufactured fibrous scaffolds [39]. The spatial maps should therefore be considered primarily as evidence that degradation is heterogeneous in three dimensions and as a basis for future studies.
The measured 7.89 ± 0.82% mass loss demonstrates that appreciable material loss occurred under the selected conditions. Literature reports indicate that PLGA [40] and PHBV [41] can exhibit changes in molecular weight and mechanical properties before or independently of large changes in macroscopic mass. Thus, the present data support the conclusion that internal microstructural changes can already be detected after two weeks, but they do not permit conclusions about the eventual degradation rate or lifetime of the composite scaffold.
The broader significance of the proposed method is its potential to provide a non-destructive three-dimensional complement to conventional degradation measurements. For X-ray-penetrable degradable polymers, polymer/ceramic composites, porous biomaterials, and other single and multicomponent materials, the approach could be used to follow the spatial development of sub-resolution internal changes while retaining the macroscopic specimen for subsequent analyses. The ability to compare each specimen with its own pre-degradation state may also reduce the influence of specimen-to-specimen variability.
The limitations of the method should also be taken into account. The sub-voxel porosity method does not explicitly separate changes in solid-phase composition from the formation of void space. In the present study, it was assumed that the dominant consequence of degradation detectable by the proposed method was the formation or increase of internal void space, and the observed changes in X-ray attenuation were therefore interpreted in terms of effective sub-voxel porosity. The estimates may also be affected by grayscale noise, the limited dynamic range of the 8-bit images, residual beam-hardening artifacts, and potential scanner drift between acquisitions. The method is particularly sensitive to image-registration errors at edge voxels, where even small misalignments may produce artificial grayscale differences. Furthermore, the registration procedure does not account for potential deformations induced by degradation. The repeat-scan control performed in this study included the 3D image-registration procedure; therefore, the resulting apparent porosity changes also reflect registration-related variability under the applied conditions. The specimens were scanned in the dry state before and after degradation, and this condition should be considered when interpreting the attenuation differences. Gravimetric measurements and SEM observations provided indirect validation of material loss and morphological changes, respectively, but did not constitute independent local validation of the estimated sub-voxel porosity.
Overall, this study demonstrates a new approach for three-dimensional assessment of degradation-related internal changes at the sub-voxel level. Its methodological contribution is the conversion of X-ray attenuation changes between registered pre- and post-degradation microCT datasets into a quantitative spatial map of degradation-induced effective sub-voxel porosity, with independent morphological corroboration by SEM and global mass-balance comparison by gravimetry. The results show that degradation-related internal changes associated with features smaller than the microCT voxel size (5.5 μm in this study) can be detected and spatially mapped without resolving individual pores, providing information that is complementary to global mass loss and high-resolution but localized microscopy.
5. Conclusions
This study demonstrates a microCT-based degradation-induced sub-voxel porosity mapping method for three-dimensional assessment of degradation-related internal changes. By comparing co-registered microCT datasets acquired from the same specimen before and after degradation under identical imaging conditions, the method converts voxel-specific X-ray attenuation changes into an effective sub-voxel porosity estimate without requiring individual pores to be resolved. After two weeks of hydrolytic exposure, the method yielded an effective sub-voxel porosity increase of 8.33 ± 0.63%. This interpretation assumes that the dominant degradation-induced attenuation changes arise from the formation or enlargement of void space. Contributions from other physical and chemical changes in the material, including changes in the composition or density, cannot be independently separated by the proposed method. Accordingly, the reported value represents an estimate of effective sub-voxel porosity rather than a direct measurement of absolute porosity. Gravimetric analysis showed a mass loss of 7.89 ± 0.82%, while independent SEM analysis revealed a pore area fraction of 7.64 ± 0.23% and a mean equivalent pore diameter of 1.79 ± 1.15 μm. These results provide complementary evidence of degradation-induced internal changes, although the three techniques quantify different physical quantities and sample different spatial scales. The PHBV/PLGA/TCP composite was selected to demonstrate the method under multicomponent conditions. The resulting three-dimensional maps reveal spatial heterogeneity that cannot be obtained from gravimetric measurements alone and complement the localized morphological information provided by SEM. The two-week exposure represents a proof-of-concept demonstration rather than a characterization of degradation kinetics or scaffold lifetime. Further studies involving multiple degradation time points, different material compositions, and higher-resolution synchrotron CT imaging are needed to assess the quantitative accuracy and broader applicability of the method.
Funding
This work was supported by the National Centre for Research and Development, Poland, under the Lider XIV program (project title: “New generation of hybrid bone scaffold enriched with growth factors with controlled degradation kinetics and biomimetic architecture”, acronym: BioBONE, project no. LIDER14/0310/2023).
Institutional Review Board Statement
Not applicable.
Informed Consent Statement
Not applicable.
Data Availability Statement
The original data presented in the study are openly available in the Warsaw University of Technology Data Repository at https://doi.org/10.71724/k08x-as52.
Conflicts of Interest
The author declares no conflicts of interest.
References
- Langer, R.; Vacanti, J.D. Tissue Engineering. Science 1993, 260, 920–926. [Google Scholar] [CrossRef] [Scilit] [PubMed]
- Bonassar, L.J.; Vacanti, C.A. Tissue Engineering: The First Decade and Beyond. J. Cell. Biochem. 1998, 72, 297–303. [Google Scholar] [CrossRef]
- Hoganson, D.M.; Pryor, H.I.; Vacanti, J.P. Tissue Engineering and Organ Structure: A Vascularized Approach to Liver and Lung. Pediatr. Res. 2008, 63, 520–526. [Google Scholar] [CrossRef] [Scilit] [PubMed]
- Langer, R.; Vacanti, J. Advances in Tissue Engineering. J. Pediatr. Surg. 2016, 51, 8–12. [Google Scholar] [CrossRef] [Scilit] [PubMed]
- Hoang, V.T.; Nguyen, Q.T.; Phan, T.T.K.; Pham, T.H.; Dinh, N.T.H.; Anh, L.P.H.; Dao, L.T.M.; Bui, V.D.; Dao, H.N.; Le, D.S.; et al. Tissue Engineering and Regenerative Medicine: Perspectives and Challenges. MedComm 2025, 6, e70192. [Google Scholar] [CrossRef] [Scilit] [PubMed]
- Koch, S.E.; de Kort, B.J.; Holshuijsen, N.; Brouwer, H.F.M.; van der Valk, D.C.; Dankers, P.Y.W.; van Luijk, J.A.K.R.; Hooijmans, C.R.; de Vries, R.B.M.; Bouten, C.V.C.; et al. Animal Studies for the Evaluation of in Situ Tissue-Engineered Vascular Grafts—A Systematic Review, Evidence Map, and Meta-Analysis. npj Regen. Med. 2022, 7, 17. [Google Scholar] [CrossRef] [Scilit] [PubMed]
- Koons, G.L.; Diba, M.; Mikos, A.G. Materials Design for Bone-Tissue Engineering. Nat. Rev. Mater. 2020, 5, 584–603. [Google Scholar] [CrossRef] [Scilit]
- Bose, S.; Roy, M.; Bandyopadhyay, A. Recent Advances in Bone Tissue Engineering Scaffolds. Trends Biotechnol. 2012, 30, 546–554. [Google Scholar] [CrossRef] [Scilit] [PubMed]
- Ma, P.X. Scaffolds for Tissue Fabrication. Mater. Today 2004, 7, 30–40. [Google Scholar] [CrossRef] [Scilit]
- Jones, A.C.; Milthorpe, B.; Averdunk, H.; Limaye, A.; Senden, T.J.; Sakellariou, A.; Sheppard, A.P.; Sok, R.M.; Knackstedt, M.A.; Brandwood, A.; et al. Analysis of 3D Bone Ingrowth into Polymer Scaffolds via Micro-Computed Tomography Imaging. Biomaterials 2004, 25, 4947–4954. [Google Scholar] [CrossRef] [Scilit] [PubMed]
- van Lenthe, G.H.; Hagenmüller, H.; Bohner, M.; Hollister, S.J.; Meinel, L.; Müller, R. Nondestructive Micro-Computed Tomography for Biological Imaging and Quantification of Scaffold–Bone Interaction in Vivo. Biomaterials 2007, 28, 2479–2490. [Google Scholar] [CrossRef] [Scilit] [PubMed]
- Cengiz, I.F.; Oliveira, J.M.; Reis, R.L. Micro-CT—A Digital 3D Microstructural Voyage into Scaffolds: A Systematic Review of the Reported Methods and Results. Biomater. Res. 2018, 22, 26. [Google Scholar] [CrossRef] [Scilit] [PubMed]
- Bartoš, M.; Suchý, T.; Luňáčková, J.; Soukup, P. The Micro-CT Analysis of the Structural Parameters of Collagen-Based Porous Scaffolds: The Influence of Image Processing and Binarization. Microsc. Microanal. 2023, 29, 244–253. [Google Scholar] [CrossRef] [Scilit]
- Wang, M.O.; Piard, C.M.; Melchiorri, A.; Dreher, M.L.; Fisher, J.P. Evaluating Changes in Structure and Cytotoxicity during in Vitro Degradation of Three-Dimensional Printed Scaffolds. Tissue Eng. Part A 2015, 21, 1642–1653. [Google Scholar] [CrossRef] [Scilit] [PubMed]
- Zhuang, L.; Shin, H.S.; Yeom, S.; Pham, C.N.; Kim, Y.J. A Novel Method for Estimating Subresolution Porosity from CT Images and Its Application to Homogeneity Evaluation of Porous Media. Sci. Rep. 2022, 12, 16229. [Google Scholar] [CrossRef] [Scilit] [PubMed]
- Tuan, H.S.; Hutmacher, D.W. Application of Micro CT and Computation Modeling in Bone Tissue Engineering. CAD Comput. Aided Des. 2005, 37, 1151–1161. [Google Scholar] [CrossRef] [Scilit]
- Jones, A.C.; Arns, C.H.; Sheppard, A.P.; Hutmacher, D.W.; Milthorpe, B.K.; Knackstedt, M.A. Assessment of Bone Ingrowth into Porous Biomaterials Using MICRO-CT. Biomaterials 2007, 28, 2491–2504. [Google Scholar] [CrossRef] [Scilit] [PubMed]
- Peyrin, F. Evaluation of Bone Scaffolds by Micro-CT. In Proceedings of the Osteoporosis International; Springer: Berlin/Heidelberg, Germany, 2011; Volume 22, pp. 2043–2048. [Google Scholar]
- Kerckhofs, G.; Chai, Y.C.; Luyten, F.P.; Geris, L. Combining MicroCT-Based Characterization with Empirical Modelling as a Robust Screening Approach for the Design of Optimized CaP-Containing Scaffolds for Progenitor Cell-Mediated Bone Formation. Acta Biomater. 2016, 35, 330–340. [Google Scholar] [CrossRef] [Scilit] [PubMed]
- Crawley, E.O.; Evans, W.D.; Owen, G.M. A Theoretical Analysis of the Accuracy of Single-Energy CT Bone-Mineral Measurements. Phys. Med. Biol. 1988, 33, 1113–1127. [Google Scholar] [CrossRef] [Scilit] [PubMed]
- Hellmich, C.; Kober, C.; Erdmann, B. Micromechanics-Based Conversion of CT Data into Anisotropic Elasticity Tensors, Applied to FE Simulations of a Mandible. Ann. Biomed. Eng. 2008, 36, 108–122. [Google Scholar] [CrossRef] [Scilit] [PubMed]
- Ghosh Dastidar, A.; Clarke, S.A.; Larrañeta, E.; Buchanan, F.; Manda, K. In Vitro Degradation of 3D-Printed Poly(L-Lactide-Co-Glycolic Acid) Scaffolds for Tissue Engineering Applications. Polymers 2023, 15, 3714. [Google Scholar] [CrossRef] [Scilit] [PubMed]
- Makadia, H.K.; Siegel, S.J. Poly Lactic-Co-Glycolic Acid (PLGA) as Biodegradable Controlled Drug Delivery Carrier. Polymers 2011, 3, 1377–1397. [Google Scholar] [CrossRef] [Scilit] [PubMed]
- Kovalcik, A.; Obruca, S.; Kalina, M.; Machovsky, M.; Enev, V.; Jakesova, M.; Sobkova, M.; Marova, I. Enzymatic Hydrolysis of Poly(3-Hydroxybutyrate-Co-3-Hydroxyvalerate) Scaffolds. Materials 2020, 13, 2992. [Google Scholar] [CrossRef] [Scilit] [PubMed]
- Patel, R.; Gómez-Cerezo, M.N.; Huang, H.; Grøndahl, L.; Lu, M. Degradation Behaviour of Porous Poly(Hydroxybutyrate-Co-Hydroxyvalerate) (PHBV) Scaffolds in Cell Culture. Int. J. Biol. Macromol. 2024, 257, 128644. [Google Scholar] [CrossRef] [Scilit] [PubMed]
- Patel, R.; Monticone, D.; Lu, M.; Grøndahl, L.; Huang, H. Hydrolytic Degradation of Porous Poly(Hydroxybutyrate-Co-Hydroxyvalerate) Scaffolds Manufactured Using Selective Laser Sintering. Polym. Degrad. Stab. 2021, 187, 109545. [Google Scholar] [CrossRef] [Scilit]
- Idaszek, J.; Bruinink, A.; Święszkowski, W. Ternary Composite Scaffolds with Tailorable Degradation Rate and Highly Improved Colonization by Human Bone Marrow Stromal Cells. J. Biomed. Mater. Res. Part A 2015, 103, 2394–2404. [Google Scholar] [CrossRef] [Scilit] [PubMed]
- Wu, L.; Ding, J. In Vitro Degradation of Three-Dimensional Porous Poly(d,l-Lactide-Co-Glycolide) Scaffolds for Tissue Engineering. Biomaterials 2004, 25, 5821–5830. [Google Scholar] [CrossRef] [Scilit] [PubMed]
- Ehrenfried, L.M.; Patel, M.H.; Cameron, R.E. The Effect of Tri-Calcium Phosphate (TCP) Addition on the Degradation of Polylactide-Co-Glycolide (PLGA). J. Mater. Sci. Mater. Med. 2007, 19, 459–466. [Google Scholar] [CrossRef] [Scilit] [PubMed]
- Cao, S.; Han, J.; Sharma, N.; Msallem, B.; Jeong, W.; Son, J.; Kunz, C.; Kang, H.W.; Thieringer, F.M. In Vitro Mechanical and Biological Properties of 3D Printed Polymer Composite and β-Tricalcium Phosphate Scaffold on Human Dental Pulp Stem Cells. Materials 2020, 13, 3057. [Google Scholar] [CrossRef] [Scilit] [PubMed]
- Ostrowska, B.; Di Luca, A.; Moroni, L.; Swieszkowski, W. Influence of Internal Pore Architecture on Biological and Mechanical Properties of Three-Dimensional Fiber Deposited Scaffolds for Bone Regeneration. J. Biomed. Mater. Res. Part A 2016, 104, 991–1001. [Google Scholar] [CrossRef] [Scilit] [PubMed]
- Murphy, C.M.; Haugh, M.G.; O’Brien, F.J. The Effect of Mean Pore Size on Cell Attachment, Proliferation and Migration in Collagen–Glycosaminoglycan Scaffolds for Bone Tissue Engineering. Biomaterials 2010, 31, 461–466. [Google Scholar] [CrossRef] [Scilit] [PubMed]
- Szlazak, K.; Jaroszewicz, J.; Ostrowska, B.; Jaroszewicz, T.; Nabiałek, M.; Szota, M.; Swieszkowski, W. Characterization of Three-Dimensional Printed Composite Scaffolds Prepared with Different Fabrication Methods. Arch. Metall. Mater. 2016, 61, 645–649. [Google Scholar] [CrossRef] [Scilit]
- ISO 10993-13:2010; Biological Evaluation of Medical Devices—Part 13: Identification and Quantification of Degradation Products from Polymeric Medical Devices. International Organization for Standardization: Geneva, Switzerland, 2010.
- Radon, J. On the Determination of Functions from Their Integral Values along Certain Manifolds. Med. Imaging IEEE Trans. 1986, 5, 170–176. [Google Scholar] [CrossRef] [Scilit] [PubMed]
- Kato, M.; Takahashi, M.; Kawasaki, S.; Mukunoki, T.; Kaneko, K. Evaluation of Porosity and Its Variation in Porous Materials Using Microfocus X-Ray Computed Tomography Considering the Partial Volume Effect. Mater. Trans. 2013, 54, 1678–1685. [Google Scholar] [CrossRef] [Scilit]
- Lin, Q.; Al-Khulaifi, Y.; Blunt, M.J.; Bijeljic, B. Quantification of Sub-Resolution Porosity in Carbonate Rocks by Applying High-Salinity Contrast Brine Using X-Ray Microtomography Differential Imaging. Adv. Water Resour. 2016, 96, 306–322. [Google Scholar] [CrossRef] [Scilit]
- Ftiti, S.; Cifuentes, S.C.; Guidara, A.; Rams, J.; Tounsi, H.; Fernández-Blázquez, J.P. The Structural, Thermal and Morphological Characterization of Polylactic Acid/Β-Tricalcium Phosphate (PLA/Β-TCP) Composites upon Immersion in SBF: A Comprehensive Analysis. Polymers 2024, 16, 719. [Google Scholar] [CrossRef] [Scilit] [PubMed]
- Dziemiańczyk, P.; Łysik, D.; Vernay, F.; Mystkowska, J. Understanding Polycaprolactone Degradation: Molecular Mechanisms and Implications for Biomedical Device Design. Materials 2026, 19, 3894. [Google Scholar] [CrossRef] [Scilit] [PubMed]
- Shirazi, R.N.; Aldabbagh, F.; Erxleben, A.; Rochev, Y.; McHugh, P. Nanomechanical Properties of Poly(Lactic-Co-Glycolic) Acid Film during Degradation. Acta Biomater. 2014, 10, 4695–4703. [Google Scholar] [CrossRef] [Scilit] [PubMed]
- Diermann, S.H.; Lu, M.; Edwards, G.; Dargusch, M.; Huang, H. In Vitro Degradation of a Unique Porous PHBV Scaffold Manufactured Using Selective Laser Sintering. J. Biomed. Mater. Res. A 2019, 107, 154–162. [Google Scholar] [CrossRef] [Scilit] [PubMed]

Disclaimer/Publisher’s Note: The statements, opinions and data contained in all publications are solely those of the individual author(s) and contributor(s) and not of MDPI and/or the editor(s). MDPI and/or the editor(s) disclaim responsibility for any injury to people or property resulting from any ideas, methods, instructions or products referred to in the content. |
© 2026 by the author. Licensee MDPI, Basel, Switzerland. This article is an open access article distributed under the terms and conditions of the Creative Commons Attribution (CC BY) license.