


Abstract
Punching shear is a brittle failure mode in reinforced-concrete slab–column connections, requiring predictive models with explicit validity limits. This study develops a mechanics-informed machine-learning workflow using 1068 quality-controlled specimens from 111 literature sources. XGBoost achieved R2 = 0.932 under a specimen-random five-fold benchmark, while leakage-safe nested source-grouped validation yielded R2 = 0.858 and a fully source-disjoint holdout yielded R2 = 0.793. Performance was substantially weaker for scarce edge and corner connections than for interior connections, demonstrating configuration-dependent transfer limitations. Predictive-importance analyses identified geometry and loading as the dominant variable blocks; these associations were not causal. Conformal prediction provided marginal predictive-uncertainty diagnostics, including 97.90% coverage with a 507.14 kN mean interval width on the source-disjoint test, but does not establish configuration-conditional coverage or structural reliability. Bounded perturbations were likewise interpreted as sensitivity analysis rather than reliability assessment. A separate nine-specimen geogrid program provided complementary post-failure evidence; quantitative post-peak conclusions were restricted to the three specimens with complete records. The workflow supports validation-aware research screening within the represented domain while emphasizing source separation and configuration-specific applicability.
1. Introduction
Punching shear is a critical brittle failure mechanism in reinforced-concrete (RC) flat slabs and slab–column connections. Unlike flexural failure, punching may develop with limited deformation and relatively little warning, potentially compromising local load transfer and, in severe cases, contributing to progressive or disproportionate structural damage. Reliable assessment of punching shear resistance is therefore essential for the safe design and evaluation of flat-slab systems [1,2,3,4,5,6,7,8,9]. The response is governed by interacting geometric, material, reinforcement, loading, and connection-specific parameters, which complicates prediction across the range of configurations represented in experimental databases. The broader application of artificial intelligence in structural engineering and experimental studies of slab–column punching behavior further motivate data-driven assessment [10,11].
Machine-learning (ML) methods have consequently received increasing attention as complementary tools for punching-shear prediction. Related assessment and database studies have addressed progressive-collapse criteria and experimental or code-based datasets [12,13,14,15], while experimental work has also examined geogrid-reinforced slabs [16]. Several ML studies have reported strong predictive performance for the databases considered [12,17,18,19]. General interpretability research and numerical modeling of UHPFRC slabs provide complementary methodological and mechanics context [20,21], while further punching-shear ML applications are reported in [22,23]. The use of ML for punching-shear prediction is therefore already established and, by itself, is not the novelty pursued in the present study.
Recent punching-shear studies have extended this work beyond point prediction. Nguyen et al. [12] developed an XGBoost model for 497 interior slab–column connections, compared it with alternative ML models, design codes, and empirical formulations, examined relative input importance, and implemented a graphical interface. The complementary literature has examined internal GFRP/grating reinforcement and comparative shear-prediction models [24,25], automated ensemble learning and progressive-collapse response in reinforced-concrete systems [26,27], and the methodological foundations of SHAP, conformal prediction, geogrid-reinforced slab behavior, and structural reliability/probability analysis [28,29,30,31,32,33]. Mangalathu et al. [34] evaluated eight regression approaches using 380 two-way RC flat-slab tests at interior supports without transverse reinforcement, selected XGBoost following random training-testing evaluation, compared its predictions with established design provisions and empirical models, and used SHapley Additive exPlanations (SHAP) for model interpretation. Liang et al. [17] used XGBoost together with SHAP and partial-dependence analysis to examine punching resistance, failure behavior, and influential structural parameters. Shen et al. [35] coupled machine-learning surrogate modeling based on 610 experimental records with Monte Carlo simulation and reliability-oriented assessment. Yan and Xie [22] combined Bayesian optimization, multiple ML algorithms, SHAP analysis, design provisions, and Critical Shear Crack Theory (CSCT) for 337 flat slabs with transverse reinforcement. More recently, Ren and Liu [36] introduced probabilistic NGBoost modeling, SHAP and Sobol sensitivity analyses, and Monte Carlo-based reliability assessment using 594 experimental tests, while Shah et al. [37] compared eight ML algorithms using 378 validated flat-slab tests and employed SHAP and partial-dependence plots (PDPs) for explainability-oriented interpretation. Collectively, these studies demonstrate that high predictive accuracy, explainable artificial intelligence (XAI), optimization, probabilistic modeling, reliability-oriented analysis, code benchmarking, and practical implementation have already become important components of punching-shear ML research.
A more fundamental issue concerns how predictive performance is validated when experimental data are compiled from multiple literature sources. Specimens originating from the same experimental campaign may share materials, geometric families, reinforcement details, loading arrangements, test procedures, instrumentation, and laboratory-specific practices. Consequently, a random specimen-level split can place closely related observations from the same experimental source in both model-development and evaluation subsets. Under such a protocol, strong test performance may reflect a combination of interpolation within represented experimental programs and transfer across programs rather than cross-study transfer alone.
This distinction becomes important when the intended inference extends beyond individual withheld specimens. Source-grouped cross-validation provides a stricter evaluation by keeping records associated with the same literature source within a common partition, thereby preventing specimens from that source from being divided between training and validation folds. A fully source-disjoint holdout imposes a further test by evaluating the model on experimental sources excluded entirely from model development. Comparing specimen-random, source-grouped, and source-disjoint protocols therefore provides a direct means of determining how estimated predictive performance changes as the separation between model-development and evaluation evidence becomes progressively stricter.
Aggregate performance metrics can additionally conceal configuration-dependent limitations. Literature-derived punching-shear databases are frequently dominated by interior slab–column connections, whereas edge and corner configurations are substantially less represented. A strong global coefficient of determination or low overall prediction error may therefore be driven primarily by performance for the dominant structural configuration. Connection-specific evaluation is consequently needed to determine whether cross-study predictive performance remains consistent across interior, edge, and corner connections or deteriorates where experimental support is sparse.
Interpretability should likewise be considered within this validation context. SHAP and related feature-attribution methods can identify variables associated with model predictions, but they do not establish causal structural mechanisms, particularly when measured variables and engineered descriptors are correlated. Their engineering value is strengthened when feature attribution is complemented by independent diagnostics such as held-out grouped permutation importance and feature ablation and when the resulting patterns are examined against established punching-shear mechanics. The relevant question is therefore not simply whether an ML model can be explained, but whether model-derived predictive associations remain useful and physically plausible under source-separated evaluation.
Predictive uncertainty and empirical support constitute a related limitation. Point predictions alone do not indicate the magnitude of plausible prediction error or whether a queried case is adequately represented by the available predictor space. Conformal prediction can provide marginal prediction intervals under its stated exchangeability conditions, while applicability-domain screening can identify cases with weak empirical support. These diagnostics are distinct from formal structural reliability analysis and do not replace code-based safety verification. Instead, they provide complementary information regarding predictive uncertainty and data support, particularly when transfer to experimental sources excluded from model development is examined.
Table 1 summarizes the methodological positioning of representative punching-shear ML studies relevant to the present work. The literature has already demonstrated ensemble learning, explainability, optimization, probabilistic and reliability-oriented analysis, code benchmarking, and practical implementation [12,17,22,34,35,36,37]. The computational components used in this study draw on established Random Forest, XGBoost, CatBoost, SHAP, and conformal-prediction formulations [38,39,40,41,42], while specialized punching-shear ML applications have also addressed lightweight, fiber-reinforced, FRP-reinforced, and strengthened slab systems [43,44,45,46,47]. Against this background, the present study focuses on a validation issue that remains insufficiently characterized in the punching-shear ML literature: how estimated predictive performance changes when evaluation is progressively tightened from specimen-random testing to source-grouped cross-validation and fully source-disjoint testing, and whether the resulting cross-study transferability remains consistent across connection configurations. Predictive uncertainty and applicability-domain diagnostics are then examined within this transfer-oriented framework to identify where empirical support or predictive precision becomes limiting.
Table 1.
Validation-centered methodological positioning of representative machine-learning studies on punching-shear assessment.
SHAP: SHapley Additive exPlanations; PDP: partial-dependence plot; CSCT: Critical Shear Crack Theory; GUI: graphical user interface. “Not identified in the reported evaluation” is used conservatively where a dedicated source-grouped, source-disjoint, or configuration-transfer assessment was not identified in the methodological evaluation considered here; it should not be interpreted as a claim that the broader study contains no related analysis. Source-grouped validation denotes evaluation in which records from the same literature source remain within the same partition, whereas fully source-disjoint testing denotes evaluation on literature sources excluded entirely from model development. The comparison is intended to distinguish validation and transferability evidence rather than to rank studies according to predictive accuracy.
Against this background, the central research question of the present study is:
To what extent does predictive performance persist when punching-shear ML models are evaluated under progressively stricter separation of experimental sources, from specimen-level evaluation to cross-study transfer?
This question is addressed through four specific research questions:
RQ1—Validation-induced generalization gap: How does estimated punching-shear predictive performance change when evaluation progresses from specimen-random validation to source-grouped cross-validation and fully source-disjoint testing?
RQ2—Configuration-dependent transferability: Is cross-study predictive performance consistent across interior, edge, and corner slab–column connections, or can aggregate accuracy conceal configuration-specific generalization limitations?
RQ3—Mechanics-informed transferability: Do mechanics-informed descriptors and model-derived importance patterns remain useful and physically plausible under source-separated evaluation?
RQ4—Uncertainty and applicability under transfer: Can predictive uncertainty and empirical support be characterized under source-separated transfer, and where do interval width, applicability-domain limitations, and sparse structural configurations constrain engineering interpretation?
To answer these questions, a quality-controlled database of 1068 experimentally tested slab–column connections from 111 traceable literature-source groups is examined under a hierarchical validation strategy comprising specimen-random evaluation, source-grouped cross-validation, and a fully source-disjoint holdout. Random Forest, XGBoost, and CatBoost are first compared under the reproduced specimen-level benchmark, after which XGBoost is subjected to source-aware validation and diagnostic analyses. Mechanics-informed feature engineering is complemented by SHAP, held-out grouped permutation importance, and feature ablation. Predictive limitations are further examined using marginal split-conformal diagnostics, applicability-domain screening, connection-specific performance assessment, and bounded input-perturbation analysis. Nominal ACI 318-19 and Eurocode 2 predictions are retained only as engineering error benchmarks and not as targets for replacement.
A separate nine-specimen experimental program using steel- and geogrid-reinforced cementitious slabs provides complementary post-failure mechanics observations. Because complete post-peak records are available for only three specimens, quantitative post-failure conclusions are restricted to those records and are not presented as external validation of the ML predictor or as evidence of universal geogrid superiority. The experimental program therefore serves as complementary mechanics evidence rather than as validation of predictive generalization.
Finally, the evaluated workflow is implemented in a research-screening interface that reports the point prediction together with applicability-domain status, reference uncertainty information, and relevant safeguards. The interface is intended as an operational translation of the study findings rather than as an independent methodological novelty, a validated structural-design tool, or a substitute for code-based verification and engineering review.
The contribution of the present study therefore lies in a validation-centered assessment of punching-shear machine learning. Rather than treating high specimen-level accuracy as sufficient evidence of generalizability, the study quantifies how predictive performance changes as experimental-source separation becomes progressively more stringent, examines whether the resulting transfer limitations are configuration dependent, and relates those limitations to mechanics-informed interpretation, predictive uncertainty, and applicability-domain support. This framing is intended to define both the predictive capability and the evidential limits of data-driven punching-shear assessment within the represented literature domain.
2. Database Development and Feature Preparation
Figure 1 summarizes the study workflow, comprising database assembly and quality control, mechanics-informed feature construction, specimen-level and source-separated validation, model interpretation, predictive-uncertainty and applicability-domain assessment, code benchmarking, and a separate post-failure mechanics investigation.
Figure 1.
Overall workflow of the proposed explainable and uncertainty-aware machine-learning framework for punching-shear assessment, including specimen-level evaluation, source-separated validation, predictive-uncertainty and applicability analyses, and complementary post-failure experimental evidence.
The verified database was initially partitioned at specimen level into 854 training and 214 withheld test specimens using random_state = 42. Because literature-source identifiers were not used as grouping constraints in this benchmark, specimens from the same experimental campaign may occur in both partitions; these results therefore characterize within-database interpolation rather than fully independent cross-study transfer. Cross-study generalization was subsequently examined using source-grouped cross-validation and a fully source-disjoint holdout.
SHAP, conformal prediction, applicability-domain screening, and bounded perturbation analysis were used as complementary diagnostic tools. The separate geogrid experiments were reserved for mechanics-consistency and post-failure assessment and were not used as predictive-validation evidence.
2.1. General Description of the Experimental Database
The final quality-controlled database contains 1068 published slab–column tests with measured punching capacity, Vexp, as the prediction target. Records were harmonized in consistent units and screened for missing, nonphysical, duplicate, and traceability-related inconsistencies.
The database contains 983 interior (92.0%), 51 edge (4.8%), and 34 corner (3.2%) connections under concentric and eccentric loading. This imbalance is explicitly considered in the subsequent configuration-specific transfer assessment and limits inference for the sparse edge and corner subsets.
The experimentally measured punching shear capacity, Vexp, was the target. The database was divided at specimen level into 854 training records (80%) and 214 withheld test records (20%) using random_state = 42. The withheld set was not used for fitting or tuning, but it was not isolated by publication campaign. Accordingly, it is termed a withheld specimen-level test set rather than an independent or external holdout.
Figure 2 summarizes the database compilation, quality-control procedure, feature preparation, and subsequent dataset partitioning adopted prior to machine-learning model development.
Figure 2.
Database compilation, quality control, and data-partitioning procedure adopted for assembling the unified experimental database used for machine-learning model development and validation.
2.2. Database Characterization, Traceability, and Scope
Table 2 summarizes the principal ranges and dispersion of the experimental variables. The database spans substantial variation in material, geometric, and resistance-related quantities; however, broad marginal ranges should not be interpreted as evidence of balanced or representative coverage, particularly given the strong predominance of interior connections.
Table 2.
Descriptive statistics of the principal experimental variables included in the assembled database.
Figure 3 shows the marginal distributions of concrete strength, slab depth, longitudinal reinforcement ratio, and capacity. The database stores ρl in percentage points (e.g., 1.00 denotes 1.00%). The maximum recorded value, 15.6%, corresponds to the record labeled “Hanai and Holanda.” Because this value could not be independently reconciled with a source worksheet in the available archive, it was retained for traceability and treated as an extreme record rather than evidence of representative coverage.
Figure 3.
Distribution of the principal variables included in the assembled database: (a) concrete compressive strength (fc), (b) effective slab depth (d), (c) flexural reinforcement ratio (ρl), and (d) experimental punching shear capacity (Vexp).
Table 3 summarizes the distribution of slab–column connection types. Interior connections constitute 983 specimens (92.0%), whereas edge and corner connections account for 51 (4.8%) and 34 (3.2%) specimens, respectively. This distribution reflects the predominance of interior slab–column connections in the published experimental literature rather than a deliberate sampling strategy.
Table 3.
Distribution of slab–column connection types included in the experimental dataset.
The strong configuration imbalance means that results are most defensible for interior specimens; edge and corner predictions require cautious interpretation and further independent experimental evidence.
2.3. Input and Output Variables
The validated grouped analyses used 16 predictors: seven measured variables (d, u1, fc, fy, ρl, Vf, and Ac), eccentricity ratio e/d, three connection-type indicators, and five derived mechanics descriptors (√fc, Ac/d2, ρlfy, ρl√fc, and u1d). All 16 fields were complete in the 1068-record quality-controlled dataset. Column dimensions c1 and c2 and slab thickness h remain traceability fields in the source dataset but were not used in the validated 16-feature model; h is missing in 946 records.
The experimentally measured ultimate punching shear capacity Vexp was adopted as the output variable throughout this investigation. Table 4 summarizes the input and output variables used for machine-learning model development.
Table 4.
Audited variables used in the validated 16-feature models and the experimental targets.
2.4. Feature Audit and Exclusion of Ambiguous Variables
Predictor selection balanced structural relevance with cross-study reporting. Effective depth and critical perimeter describe the shear-transfer region; concrete and reinforcement variables describe material resistance, crack control, dowel action, and redistribution; loaded area and e/d describe column geometry and eccentric loading; connection indicators distinguish interior, edge, and corner configurations. Derived descriptors encode prespecified mechanics combinations and are tested by ablation. Potential variables were excluded when they were unavailable in most studies, inconsistently defined, insufficiently traceable, dependent on incompatible assumptions, excessively incomplete, or derived from the response and therefore at risk of leakage.
The processed field m was excluded because the supplied data dictionary and source-traceability materials did not provide a stable definition, unit, or reproducible derivation across studies. “Ambiguous” therefore refers to unverifiable semantic and dimensional provenance, not merely low predictive value. Manual review of source papers cannot recover variables that individual campaigns did not report or defined incompatibly; heterogeneous reporting is an inherent limitation of literature-derived databases. Table 5 summarizes the audit outcome.
Table 5.
Outcome of the feature-audit procedure.
Following removal of the ambiguous descriptor m, the remaining variables had defined engineering meaning and traceable units. Their predictive importance is evaluated as association within the fitted model; it does not establish that the model recovered unique or causal punching-shear mechanisms.
2.5. Data Preprocessing and Mathematical Representation
The final validated predictor matrix contained 16 features. Seven directly reported engineering variables were retained: effective depth d, critical punching perimeter u1, concrete compressive strength fc, reinforcement yield strength fy, longitudinal reinforcement ratio ρl, fiber volume fraction Vf, and loaded column area Ac. Loading eccentricity was represented by the dimensionless ratio e/d. Connection configuration was represented by three one-hot indicator variables for interior, edge, and corner connections.
Five prespecified mechanics-informed descriptors were subsequently generated from the retained predictors: √fc, Ac/d2, ρlfy, ρl√fc, and u1d. These engineered descriptors were calculated without using the experimental punching-capacity target.
The resulting supervised regression problem can be written as
where X contains the 16 predictors listed in Table 4, and Vpred is the predicted ultimate punching shear capacity. The experimentally measured capacity Vexp was used only as the response variable.
Vpred = f(X),
No numerical normalization was required for the primary RF, XGBoost, or CatBoost fitting because all three are tree-based learners. However, connection type was explicitly represented by the three binary indicator variables listed in Table 4. Standardization was used only within the applicability-domain analysis, where distances were computed in training-fold standardized feature space.
Column dimensions c1 and c2 and total slab thickness h remain source-level traceability fields but were not used in the validated 16-feature model. In particular, h is missing in 946 of the 1068 records.
2.6. Physical Relevance of the Selected Variables
The selected predictors represent complementary aspects of punching-shear resistance and load transfer. Effective depth d and critical perimeter u1 characterize the shear-resisting geometry; fc, ρl, and fy describe concrete and reinforcement-related resistance; Ac, e/d, and connection type characterize loading and boundary geometry; and Vf represents fiber content where applicable. Engineered terms combine these measured quantities to represent coupled mechanics-informed descriptors and are interpreted as predictive associations rather than independent causal mechanisms.
2.7. Independent Mechanics-Consistency Experiment Using Geogrid-Reinforced Slabs
A separate nine-specimen experimental program examined steel- and uniaxial-geogrid-reinforced cementitious slabs. These specimens were not used for model training, tuning, uncertainty calibration, or predictive validation. Their role was restricted to complementary mechanics-consistency and post-punching integrity assessment, with quantitative post-peak comparisons limited to specimens for which complete digitized load–displacement records were available.
3. Machine Learning Framework and Model Development
3.1. Overview of the Proposed Framework
The modeling framework compared RF, XGBoost, and CatBoost using identical predictors and specimen-level partitions. The subsequent source-separated analyses focused on XGBoost to quantify cross-study transferability, while SHAP, uncertainty, applicability-domain, sensitivity, and engineering-benchmark analyses were applied as complementary diagnostics.
3.2. Problem Formulation
Punching capacity was formulated as a supervised nonlinear regression problem, Vpred = f(X), using the audited predictors defined in Table 4. Model selection and tuning were performed without access to the withheld evaluation data.
f:X → Vexp
Vpred = f(X)
3.3. Data Preparation for Machine Learning
All model predictors were numerical. Scaling was unnecessary for RF, XGBoost, and CatBoost; standardization was applied only for distance-based applicability-domain assessment. Identical predictors and evaluation partitions were used for comparative model assessment.
3.4. Hyperparameter Optimization
GridSearchCV independently optimized each model on the training set using five-fold cross-validation. Selection prioritized mean R2, with MAE and RMSE used to check error magnitude and stability. Search spaces and reproducibility controls are reported in Table 6 and Table 7.
Table 6.
Documented hyperparameter status of the investigated machine-learning models.
Table 7.
Reproducibility status and retained hyperparameter settings of the investigated machine-learning models.
3.5. Machine Learning Models
Random Forest (RF), XGBoost, and CatBoost were retained as established comparative tree-ensemble baselines for heterogeneous tabular regression [38,39,40]. RF provides a bagging-based ensemble, whereas XGBoost and CatBoost represent gradient-boosting alternatives with distinct training strategies. Their inclusion enables comparison across established nonlinear ensemble paradigms; none is presented as an algorithmic contribution of this study.
3.6. Five-Fold Cross-Validation Strategy
Three progressively stricter evaluation levels were distinguished. First, five shuffled specimen-level folds (random_state = 42) reproduced conventional within-database validation without publication-level separation. Second, five-fold GroupKFold used the complete verbatim Reference field to keep each of the 111 literature sources entirely within either training or validation in every fold.
Third, a source-disjoint GroupShuffleSplit held out 23 complete sources after model selection using only the remaining 88 sources. These protocols respectively characterize specimen-level interpolation, transfer among represented studies, and held-out-study transfer.
3.7. Performance Evaluation Metrics
Predictive performance was quantified using R2, MAE, RMSE, MBE, MPE, and MAPE, where Vexp, Vpred, and n denote the experimental capacity, predicted capacity, and sample size, respectively. MAE and RMSE quantify absolute prediction error, whereas MBE, MPE, and MAPE characterize bias and relative error. The metrics were calculated as follows:
The coefficient of determination is defined as
The mean absolute error is expressed as
The root mean square error is given by
To quantify systematic prediction bias, the mean bias error is calculated as
The mean percentage error is defined as
The mean absolute percentage error is expressed as
3.8. Holdout Validation Strategy
The reproduced specimen-level benchmark used the fixed 854/214 training/test partition (random_state = 42). The 214-specimen test set was excluded from fitting, hyperparameter selection, and conformal calibration. Because publication sources were not isolated across this split, its performance is reported explicitly as withheld specimen-level evaluation rather than external or source-independent validation. The optimized RF, XGBoost, and CatBoost models were evaluated on this set without further adjustment.
3.9. Source-Grouped Validation Analysis
Source identity was audited before grouped analysis. The nominal source column was empty, whereas Reference was complete for all 1068 records and contained 111 distinct verbatim labels; no labels were inferred or merged. Five-fold GroupKFold assigned every reference exclusively to training or validation in each fold, and the audited overlap was zero. XGBoost was selected using R2 over an explicitly reported 432-candidate grouped grid (2160 fits): n_estimators 300–800, max_depth 3–5, learning_rate 0.03–0.10, subsample and colsample_bytree 0.8–1.0, min_child_weight 1 or 3, and reg_lambda 1 or 3. The selected setting was n_estimators = 800, max_depth = 3, learning_rate = 0.03, subsample = 0.8, colsample_bytree = 1.0, min_child_weight = 1, reg_lambda = 1, and random_state = 42. This grouped grid is distinct from the larger legacy specimen-random search space in Table 6. Out-of-fold predictions supplied all grouped metrics. A separate 80/20 GroupShuffleSplit contained 88 training sources and 23 test sources; hyperparameters were returned by GroupKFold using training sources only. The retained hyperparameter settings and their reproducibility status are summarized in Table 7.
3.10. Applicability-Domain Assessment
For each source-grouped validation fold, predictors were standardized using the mean and standard deviation estimated from the training portion of that fold only. Applicability was then assessed in the standardized feature space using a five-nearest-neighbor (5-NN) distance criterion. For each training specimen, the mean Euclidean distance to its five nearest training neighbors was calculated using a self-excluded neighbor search. The fold-specific applicability-domain threshold was defined as the 95th percentile of the resulting training-sample mean 5-NN distance distribution. Each held-out specimen was subsequently standardized using the corresponding training-fold statistics, and its mean Euclidean distance to the five nearest training specimens was calculated. Specimens with distances not exceeding the fold-specific threshold were classified as inside the training-density envelope, whereas those exceeding the threshold were classified as outside the applicability domain. This procedure provides a local data-support diagnostic for identifying predictions made in sparsely represented regions of the predictor space; it is not a deterministic boundary of physical validity and does not convert model predictions into code-qualified design values.
3.11. Nested Bayesian Hyperparameter Optimization Audit
To test whether the coarse grouped grid constrained the conclusions, a leakage-safe nested Optuna/TPE audit was performed for XGBoost. Five outer GroupKFold folds supplied untouched source-separated evaluation data. Within each outer-training partition, five-fold GroupKFold minimized RMSE over 300 TPE trials, giving 1500 completed trials. All five outer and 25 inner train–validation source intersections were empty. The outer-validation records were not used for tuning. Early stopping was omitted because leakage-safe implementation would require another source-separated partition inside every inner-training fold.
The Bayesian search allowed 50–1500 estimators, depth 2–10, log-uniform learning rate 0.005–0.30, child weight 1–15, subsample and column fractions 0.50–1.00, gamma 0–1, log-uniform L1 penalty 10−8–10, and log-uniform L2 penalty 10−3–100. This audit evaluates sensitivity to a substantially wider search space; it does not redefine Optuna or GridSearch as the superior optimizer.
3.12. Physics-Informed Feature Engineering
Mechanics-informed descriptors were restricted to the five engineered inputs used in the validated 16-feature model: u1d, ρlfy, ρl√fc, Ac/d2, and √fc. These terms represent shear-resisting geometry, reinforcement capacity, reinforcement-concrete interaction, relative loaded-column geometry, and concrete-strength scaling, respectively. No additional Vf√fc interaction was used in the validated predictor matrix.
The engineered features were formulated only from measured predictor variables and are defined consistently with Table 4 and Table 5 as follows:
where u1d represents the effective shear-transfer region, ρlfy characterizes reinforcement capacity, ρl√fc represents a coupled reinforcement-concrete descriptor, Ac/d2 represents loaded-column geometry relative to effective depth, and √fc is the concrete-strength transformation. These definitions are the feature names used throughout the validated model and interpretation sections.
F1 = u1d; F2 = ρlfy; F3 = ρl√fc; F4 = Ac/d2; F5 = √fc
All engineered descriptors were calculated exclusively from predictor variables and independently of the experimental punching-capacity target. Accordingly, the feature-engineering step did not introduce target-derived information into the predictors. Source overlap and partition leakage were addressed separately through the grouped validation protocols.
The engineered descriptors compactly encode coupled mechanics-informed effects. Their incremental predictive contribution was modest under source-grouped ablation.
Furthermore, preserving the engineering meaning of the engineered descriptors facilitates mechanics-informed interpretation of the subsequent SHAP analysis. However, because original and engineered predictors are correlated, the resulting SHAP attributions are interpreted as model-specific predictive associations and mechanics-consistency evidence rather than as uniquely identifiable or causal physical contributions.
3.13. SHAP Explainability Analysis [41]
SHapley Additive exPlanations (SHAP) values were computed for the fitted XGBoost model to describe global and local predictive associations. Positive values raise a prediction relative to the baseline and negative values reduce it. Because original and engineered predictors are correlated, individual attribution is neither unique nor causal. A complementary held-out group permutation analysis aggregated variables into geometry/loading, longitudinal reinforcement, fibers, and concrete-strength blocks.
The SHAP prediction decomposition is expressed as
where f(x) is the predicted punching shear capacity, ϕ0 is the baseline prediction corresponding to the expected model output, ϕi is the SHAP value representing the contribution of the ith input variable, and M is the total number of input features.
Positive SHAP values indicate that an input variable increases the predicted punching shear capacity relative to the baseline prediction, whereas negative SHAP values reduce the predicted punching shear capacity.
SHAP summary and mean-absolute-importance plots were used to describe associations learned by the fitted model. Because u1, d, u1d, ρl, fγ, ρlfγ, fc, and ρl√fc are correlated or algebraically related, individual attributions are not assumed to be unique or causally identifiable. Mechanically related variables should be interpreted as groups (geometry, concrete, and reinforcement), and a grouped-feature ablation or conditional SHAP analysis is required before making stable variable-level claims.
Agreement between grouped SHAP patterns and established mechanics is treated only as a plausibility check. It does not independently verify causal structural mechanisms, particularly because several interaction variables were engineered from those same mechanics.
3.14. Conformal Prediction for Uncertainty Quantification [29,30]
Absolute-residual split conformal prediction was applied to provide marginal prediction intervals. For the specimen-level benchmark, a calibration subset separate from model fitting and the 214-specimen withheld test set supplied the finite-sample residual quantile q, giving the interval Vpred ± q. The later source-disjoint global and adaptive intervals are reported as source-transfer diagnostics. The archived manuscript materials establish their final coverage and width values, but do not specify the exact source allocation used for conformal calibration or the complete adaptive scaling rule; these source-disjoint intervals are therefore treated as exploratory diagnostics rather than as a fully reproducible new conformal procedure.
The conformal prediction interval is defined as
where PI denotes the prediction interval, Vpred is the predicted punching shear capacity, and q is the conformal quantile estimated from the calibration residuals.
The conformal quantile is expressed as
where Q1−α(⋅) denotes the empirical (1 − α)-quantile of the absolute calibration residuals, Vexp,i is the experimentally measured punching shear capacity of the ith calibration specimen, Vpred,i is the corresponding model prediction, Ncal is the total number of calibration samples, and α is the significance level corresponding to the desired confidence level.
For ncal calibration residuals and miscoverage level α, the finite-sample quantile level was ceil[(ncal + 1)(1 − α)]/ncal. The 95% interval used the corresponding empirical quantile of absolute calibration residuals, with random_state = 42. .
The withheld test set was not used for calibration.
Coverage and mean prediction-interval width were used to assess marginal calibration and sharpness. The original specimen-level split and the source-disjoint diagnostic are reported separately; neither aggregate coverage result guarantees connection-specific, loading-specific, or capacity-conditional coverage.
The implemented absolute-residual method produces a symmetric global interval of constant half-width q around each point prediction. It provides marginal coverage under exchangeability, not specimen-specific width or guaranteed conditional coverage.
The conformal procedure therefore supplements point predictions with marginally calibrated intervals under exchangeability; it does not guarantee conditional or specimen-specific coverage.
3.15. Monte Carlo Robustness Analysis
A 5000-realization stress test independently varied selected inputs within ±15% of nominal values. These bounded perturbations are not test-calibrated probability distributions and omit cross-variable dependence; outputs are therefore robustness scenarios rather than failure probabilities.
The perturbations were sampled independently using bounded marginal ranges. The ±15% range was not derived from test-specific distributions, and cross-variable dependencies were not modeled. Accordingly, the results are interpreted as scenario-based sensitivity to simultaneous perturbations, not as failure probabilities or a formal reliability analysis.
For each realization, a perturbed input vector was generated and evaluated using the optimized XGBoost model to obtain the corresponding predicted punching shear capacity. The statistical characteristics of the simulated predictions were subsequently quantified using the mean value, standard deviation, coefficient of variation (COV), and the 5th and 95th percentiles.
The coefficient of variation was calculated as
where μ denotes the mean predicted punching shear capacity and σ represents the corresponding standard deviation.
Probability density functions and cumulative distribution functions were analyzed to characterize the predicted-capacity distributions and evaluate the sensitivity of the optimized model to the prescribed bounded input perturbations. The ±15% ranges were not calibrated from empirical probability distributions, and cross-variable dependence was not modeled. The results therefore represent scenario-based sensitivity rather than physical uncertainty distributions, failure probabilities, or formal structural reliability.
The bounded perturbation analysis complements conformal prediction by examining how simultaneous input changes propagate through the fitted model. Together, they characterize residual uncertainty and scenario sensitivity without being presented as a formal reliability analysis.
3.16. Engineering Safety Assessment
Post-punching response was evaluated separately using peak load, residual-load ratio, crack bridging, and the Collapse-Arrest Index (CAI), defined as post-peak absorbed energy divided by total absorbed energy. Higher CAI denotes a larger post-peak energy fraction, not necessarily greater peak resistance.
To provide a quantitative measure of post-failure structural resilience, a Collapse-Arrest Index (CAI) is introduced and defined as
where Epost\mbox−peak is the energy absorbed after reaching the peak load, and Etotal is the total energy absorbed throughout the loading test.
The proposed index provides a normalized measure of the proportion of energy dissipated during the post-peak stage and therefore reflects the ability of the structural system to sustain load after punching failure. Higher CAI values indicate greater post-failure resilience and an improved capacity to arrest localized punching damage.
In addition to CAI, the experiment considered residual load ratio, post-peak deformation, crack bridging, and failure localization, providing a broader description of post-punching integrity than peak capacity alone.
Accordingly, the experimental program complements the ultimate-resistance prediction study by addressing a separate post-failure performance objective. It provides mechanics-consistency and case-specific post-peak observations for the tested configurations but does not verify machine-learning predictions, establish causal SHAP attribution, or demonstrate general design applicability.
4. Results and Discussion
4.1. Performance of Machine Learning Models
The comparative five-fold specimen-level cross-validation results for XGBoost, Random Forest, and CatBoost are summarized in Table 8 and Figure 4.
Table 8.
Five-fold specimen-level cross-validation performance of the investigated machine-learning models.
Figure 4.
Five-fold cross-validation performance of the investigated ML models (mean R2 ± standard deviation).
The between-fold standard deviations of R2 were 0.015, 0.014, and 0.034 for XGBoost, Random Forest, and CatBoost, respectively (Table 8; Figure 4), indicating relatively limited variation across the comparative specimen-level partitions. The XGBoost value R2 = 0.927 in Table 8/Figure 4 is the mean from the comparative three-model cross-validation workflow, whereas R2 = 0.932 is the separately reproduced specimen-random five-fold benchmark used in the later source-separation analysis. They are therefore reported as results from distinct evaluation runs and should not be interpreted as the same numerical estimate. Because neither specimen-level workflow grouped records by source publication or campaign, both characterize within-database specimen-level performance rather than transfer to unseen experimental programs.
4.2. Withheld Specimen-Level Test Performance
On the 214 withheld specimens, XGBoost achieved R2 = 0.924, MAE = 44.10 kN, RMSE = 77.71 kN, MBE = 12.01 kN, MPE = −3.90%, and MAPE = 17.39% (Figure 5). These aggregate results indicate limited mean bias, although subgroup and source-level bias require separate assessment.
Figure 5.
Comparison between experimentally measured and predicted punching shear capacities for the withheld specimen-level test dataset. The dashed line represents the line of perfect agreement (y = x).
4.3. Residual Diagnostics and Bias Assessment
Residual diagnostics for the 214 withheld specimen-level test records are summarized in Table 9 and Figure 6 and Figure 7. The model gave MBE = 12.01 kN, MPE = −3.90%, and MAPE = 17.39%; residuals were concentrated around zero, with greater dispersion at higher capacities.
Table 9.
Bias-related statistical indicators of the optimized XGBoost model for the withheld specimen-level test dataset.
Figure 6.
Distribution of prediction residuals for the withheld specimen-level test dataset. The orange solid line represents the kernel density estimate (KDE), while the black dashed line indicates zero residual.
Figure 7.
Residuals versus predicted punching shear capacity for the optimized XGBoost model. The blue dashed line indicates zero residual (perfect agreement between predicted and experimental capacities).
Figure 6 shows the residual distribution, while Figure 7 shows residuals versus predicted capacity. These diagnostics describe the withheld specimen-level benchmark only and do not establish source-level or subgroup-uniform error behavior.
Taken together, the residual diagnostics indicate limited aggregate bias but increasing dispersion for a small number of high-capacity cases; subgroup and source-separated performance are therefore evaluated separately in the following section.
4.4. Source-Grouped Generalization Performance
Source-grouped five-fold out-of-fold prediction using the globally selected grouped-grid configuration produced R2 = 0.881, MAE = 60.71 kN, RMSE = 93.22 kN, MBE = −1.21 kN, MPE = −13.97%, and MAPE = 29.84%. The reproduced specimen-random five-fold benchmark gave R2 = 0.932, MAE = 42.68 kN, and RMSE = 70.54 kN. The leakage-safe nested source-grouped audit, reported separately in Section 4.11, gave the more conservative pooled estimate R2 = 0.858, MAE = 66.38 kN, and RMSE = 101.80 kN. The separate source-disjoint test, with model selection performed using the 88 training sources and evaluation on 23 unseen source labels, gave R2 = 0.793, MAE = 55.38 kN, RMSE = 83.73 kN, and MAPE = 23.05%. The lower source-disjoint R2 does not correspond to a monotonic worsening of MAE or RMSE relative to GroupKFold because R2 and absolute-error metrics depend on the response distribution and composition of each evaluation set. GroupKFold already enforces source separation within each fold; the additional role of the source-disjoint holdout is that its 23 literature sources remain outside model selection and are used only for final held-out-study evaluation. These results quantify protocol-dependent transfer under the stated partitions and do not establish universal external validity. Table 10 compares the protocols, while Figure 8 and Figure 9 show the grouped out-of-fold predictions and residuals, respectively.
Table 10.
Comparison of specimen-level, source-grouped, and source-disjoint XGBoost validation protocols.
Figure 8.
Source-grouped out-of-fold observed versus predicted capacity.
Figure 9.
Source-grouped out-of-fold residuals versus observed capacity.
Connection-specific grouped results expose the database imbalance. Interior specimens (n = 983) achieved R2 = 0.886, MAE = 59.89 kN, RMSE = 92.90 kN, and MAPE = 26.83%; edge specimens (n = 51) achieved R2 = 0.309, MAE = 82.39 kN, RMSE = 111.11 kN, and MAPE = 50.85%; and corner specimens (n = 34) achieved R2 = −0.851, MAE = 51.94 kN, RMSE = 70.35 kN, and MAPE = 85.18%. Negative corner R2 indicates that the grouped out-of-fold predictions were worse than predicting the corner-subgroup mean. The substantially higher relative errors for edge and especially corner connections further demonstrate that aggregate model performance should not be interpreted as uniform predictive capability across connection types. Sparse edge/corner data, eccentric moment transfer, truncated control perimeters, and campaign-specific boundary conditions therefore prevent credible broad predictive claims for these configurations.
Bootstrap confidence intervals were additionally calculated for the connection-specific grouped out-of-fold metrics. For interior connections, R2 = 0.886 (95% bootstrap CI = 0.857 to 0.907) and MAE = 59.89 kN (95% bootstrap CI = 55.64 to 64.39 kN). For edge connections, R2 = 0.309 (95% bootstrap CI = −0.207 to 0.611) and MAE = 82.39 kN (95% bootstrap CI = 62.89 to 103.33 kN). For corner connections, R2 = −0.851 (95% bootstrap CI = −3.123 to 0.113) and MAE = 51.94 kN (95% bootstrap CI = 36.39 to 68.06 kN). The substantially wider intervals for the sparse edge and corner subsets reinforce that these subgroup estimates are less stable than those obtained for interior connections.
The fixed-hyperparameter grouped ablation showed a modest contribution from engineered terms: R2 changed from 0.880 to 0.881 and MAE from 62.51 to 60.71 kN. Grouped held-out permutation analysis ranked geometry/loading first, followed by longitudinal reinforcement, fibers, and concrete strength. These associations are mechanically plausible but not causal because correlated original and engineered variables can exchange attribution. The standardized fold-specific five-nearest-neighbor screen gave MAE = 54.79 kN within and 87.88 kN outside the training-density envelope. Although outside-domain R2 was numerically higher, R2 is composition-dependent and does not contradict the materially larger absolute errors; the domain flag is therefore based on data support and error magnitude, not R2 alone.
4.5. Benchmark Comparison with Current Design Provisions
XGBoost was benchmarked against the nominal resistance equations of ACI 318-19 and Eurocode 2 using the same 214-specimen withheld set. Strength-reduction and material partial factors were omitted so that the comparison addresses nominal prediction error rather than design safety. fib Model Code 2010 and CSCT were not implemented numerically because the deformation and slab-rotation information required for consistent application was unavailable for much of the database.
Table 11 shows that XGBoost yielded the lowest prediction errors on this specimen-level benchmark (R2 = 0.924, MAE = 44.10 kN, RMSE = 77.71 kN, MAPE = 17.39%), compared with ACI 318-19 (0.762, 106.26 kN, 137.12 kN, and 47.70%) and Eurocode 2 (0.322, 172.60 kN, 231.71 kN, and 55.67%), respectively. Figure 10 presents the corresponding MAE benchmark (106.26, 172.60, and 44.10 kN, respectively), where lower MAE indicates better predictive agreement. These results quantify nominal predictive agreement only; they neither compare complete design systems nor imply replacement of code-based resistance, safety, detailing, or applicability requirements.
Table 11.
Comparative predictive performance of the proposed XGBoost model and current design provisions using the withheld specimen-level test dataset.
Figure 10.
Benchmarking of predictive performance using mean absolute error (MAE) for ACI 318–19, Eurocode 2 (nominal), and the optimized XGBoost model on the withheld specimen-level test dataset (N = 214). Lower MAE values indicate better predictive accuracy.
4.6. SHAP-Based Explainability Analysis
4.6.1. Global and Grouped Feature Importance
Figure 11 presents the global SHAP distributions and the corresponding mean absolute SHAP importance values for the selected 16-feature XGBoost configuration. Because several engineered descriptors are deterministic combinations of the original variables, the importance assigned to individual features should not be interpreted independently. The results are therefore considered both at the individual-feature level and in terms of broader geometry, reinforcement, fiber, and concrete-related mechanisms.
Figure 11.
Global SHAP analysis of the selected 16-feature XGBoost configuration: (a) SHAP summary distribution showing the magnitude and direction of model-attributed contributions and (b) global feature-importance ranking based on mean absolute SHAP values.
The SHAP analysis indicates that geometry-related information dominates the fitted response, with effective depth and perimeter-related descriptors among the highest-ranked predictors, followed by reinforcement-concrete, concrete-strength, fiber, and loaded-area information. The direction of the principal associations is qualitatively consistent with established punching-shear mechanics. However, because several engineered descriptors are deterministic combinations of measured variables, attribution can be redistributed among correlated original and engineered predictors; individual SHAP rankings therefore cannot be interpreted as uniquely separable physical effects.
Connection-type indicators exhibited comparatively small global SHAP contributions, but this should not be interpreted as evidence that connection configuration is mechanically unimportant. The database is dominated by interior connections, while the source-grouped results show substantially weaker transfer for edge and corner configurations. Consistently, source-grouped permutation importance at the engineering-block level ranked geometry/loading first, followed by longitudinal reinforcement, fibers, and concrete-related information. The interpretability analysis is therefore used as a mechanics-consistency audit of predictive associations, not as causal identification of governing structural mechanisms.
4.6.2. Local Interpretation
Dependence patterns revealed nonlinear associations and interactions among geometry, reinforcement, and concrete-related predictors. Larger d and u1d generally shifted predictions upward within the represented data range. These patterns support mechanics-consistency assessment but do not establish causal effects.
4.6.3. Relationship with Current Design Practice
The grouped importance patterns are qualitatively consistent with the roles assigned to effective depth, control perimeter, concrete strength, and reinforcement in established punching-shear formulations. Because related mechanics-informed descriptors were deliberately included in the predictor set, this agreement is interpreted only as a plausibility check rather than independent physical validation.
4.7. Uncertainty Quantification Using Split Conformal Prediction
Figure 12 reports the specimen-level split-conformal benchmark, which achieved 96.3% marginal coverage at a nominal 95% level with a constant total interval width of 354.04 kN (q = 177.02 kN). Under source-disjoint evaluation, the reported global diagnostic achieved 97.90% coverage with a mean width of 507.14 kN, while the exploratory adaptive diagnostic achieved 96.22% coverage with a larger mean width of 544.74 kN and therefore did not improve sharpness. Because the archived analysis does not fully specify the source-level calibration allocation and adaptive scaling rule, these source-disjoint values are interpreted as diagnostic evidence rather than as a separately reproducible conformal method. The source-disjoint test contained 237 interior, one edge, and no corner specimen, so configuration-conditional coverage cannot be estimated credibly for the sparse connection types.
Figure 12.
Split conformal prediction intervals obtained for the withheld specimen-level test dataset. The shaded region represents the 95% prediction interval, whereas the solid and dashed curves denote the experimentally measured and predicted punching shear capacities, respectively. The observed empirical coverage was 96.3%, with a mean prediction interval width (MPIW) of 354.0 kN.
4.8. Perturbation-Based Robustness Analysis
4.8.1. Statistical Evaluation
Under the prescribed 5000 bounded perturbations, the interior/concentric scenario showed a mean predicted capacity of 308.20 kN and COV of 7.51%, whereas the edge/corner eccentric scenario showed 272.57 kN and 28.39%, respectively (Table 12; Figure 13). The wider response of the latter scenario indicates greater model sensitivity to the imposed input perturbations. These distributions represent bounded sensitivity diagnostics only and should not be interpreted as calibrated input uncertainty, failure probability, or structural reliability.
Table 12.
Statistical summary of the perturbation-based robustness analysis.
Figure 13.
Monte Carlo robustness analysis: (a) probability density functions (PDFs) and (b) cumulative distribution functions (CDFs) of the predicted punching-shear capacity for the interior/concentric and edge–corner/eccentric scenarios.
4.8.2. Distribution of Perturbation Responses
Figure 13 presents the predicted punching-shear capacity distributions under bounded perturbations. The interior/concentric scenario shows a narrower distribution (COV = 7.51%), whereas the edge–corner/eccentric scenario exhibits greater dispersion (COV = 28.39%), indicating higher sensitivity to input perturbations. These distributions reflect model sensitivity rather than calibrated uncertainty or structural reliability.
4.9. Mechanics-Consistency Experimental Assessment
4.9.1. Experimental Scope and Reporting
The separate nine-specimen program was used exclusively for complementary mechanics-consistency and post-failure assessment and not for predictive validation. Quantitative post-peak comparisons were restricted to the three specimens with complete digitized load–displacement records.
4.9.2. Failure Mechanism and Structural Integrity
Figure 14 illustrates representative localized punching damage, crack development, punching-cone formation, and post-failure engagement of the embedded uniaxial geogrid.
Figure 14.
Representative failure patterns illustrating localized punching failure, crack propagation, punching cone formation, and crack-bridging action of the proposed uniaxial geogrid after testing.
4.9.3. Post-Punching Load–Displacement Response and CAI
Figure 15 presents the three specimens for which complete digitized post-peak load–displacement records were available. Quantitative CAI and residual-load comparisons are restricted to these three records; the remaining six tests are excluded from quantitative post-peak comparison because equivalent complete digitized records were unavailable.
Figure 15.
Load–displacement responses of the tested cementitious slabs illustrating the elastic response, peak punching load, and post-peak behavior of the proposed uniaxial geogrid reinforcement system.
Table 13 summarizes the post-peak metrics for the three specimens with complete digitized load–displacement records.
Table 13.
Post-peak metrics for the three specimens with complete digitized load–displacement records.
Among the three specimens with complete post-peak records, Geogrid-1 and Geogrid-2 reached peak loads of 17.1 and 22.2 kN, compared with 36.0 kN for Steel-S-5-3. Their residual-load ratios were nevertheless higher (0.538 and 0.581 versus 0.333), as were their CAI values (0.640 and 0.807 versus 0.560). Thus, the tested geogrid specimens exhibited greater normalized post-peak retention, not greater peak capacity. The observed crack-bridging behavior is consistent with continued tensile engagement after punching; however, three complete records are insufficient to establish population-level superiority, causality, or a design rule.
4.10. Engineering Implications
The results establish a hierarchy of predictive evidence rather than a monotonic error-degradation sequence. Specimen-level accuracy does not by itself establish cross-study transferability: R2 decreased under source-separated evaluation, but MAE and RMSE did not worsen monotonically between GroupKFold and the source-disjoint holdout because the evaluation sets differ in response distribution and composition. GroupKFold already isolates literature sources within folds, whereas the source-disjoint holdout additionally keeps the held-out studies outside model selection. The leakage-safe nested audit provides the most conservative source-grouped estimate and confirms that the central limitation is transfer across heterogeneous studies, particularly for sparsely represented edge and corner configurations. The source-aware learning curve further indicates that expanding independent source diversity is more consequential than increasing model complexity.
For engineering screening, model output should be interpreted jointly with applicability-domain status, predictive uncertainty, connection-specific evidence, mechanics-consistency diagnostics, and governing code requirements. SHAP attribution should be treated as associative, conformal intervals as marginal predictive uncertainty rather than reliability bounds, and code benchmarking as nominal-error context. The separate geogrid observations address post-punching integrity rather than predictive validation or ultimate-resistance superiority. Any prediction outside the represented domain or inconsistent with established mechanics or code checks requires source-level review rather than automatic acceptance.
4.11. Nested Bayesian Optimization and Model-Complexity Audit
Nested Optuna produced pooled source-grouped out-of-fold R2 = 0.858, MAE = 66.38 kN, RMSE = 101.80 kN, MAPE = 33.07%, MBE = 0.30 kN, and MPE = −14.05%. Across outer folds, mean R2 was 0.854 ± 0.026, MAE was 66.38 ± 9.74 kN, and RMSE was 100.43 ± 18.60 kN. Selected tree counts ranged from 450 to 1413 (median 984), depths from 2 to 6, and learning rates from 0.0172 to 0.1071. This variation indicates source-fold sensitivity rather than a universal optimum.
The leakage-safe nested Optuna audit yielded pooled R2 = 0.858, MAE = 66.38 kN, RMSE = 101.80 kN, and MAPE = 33.07%. The grouped GridSearch result (R2 = 0.881, MAE = 60.71 kN, RMSE = 93.22 kN, MAPE = 29.84%) used hyperparameters selected globally with grouped cross-validation and is therefore retained as a tuned grouped estimate rather than the primary unbiased estimate of source-grouped generalization. The nested result is emphasized when discussing validation rigor because each outer fold remained untouched during hyperparameter selection. Table 14 compares the protocols; the difference should not be interpreted as evidence that either optimization algorithm is intrinsically superior.
Table 14.
Comparison of grouped GridSearch and nested Optuna/TPE results. The protocols differ in nesting and do not isolate optimizer superiority.
Tree-count sensitivity was evaluated directly under source-grouped validation (Figure 16). Mean validation RMSE decreased from 131.39 kN at 50 trees to 92.15 kN at 800 trees, then remained nearly flat at 92.21, 92.25, and 92.59 kN for 1000, 1200, and 1500 trees. Training errors continued to decrease, but no material validation deterioration occurred at 800 trees. Thus, estimator count alone did not establish overfitting in this dataset. The source-aware learning curve (Figure 17) reduced grouped-validation RMSE from 140.58 kN at 20% of training sources to 95.10 kN at 100%, indicating that additional independent studies are more valuable than further model complexity.
Figure 16.
Training and source-grouped validation RMSE versus estimator count with the grouped-grid configuration otherwise fixed. The curve tests model-size sensitivity and does not prove absence of overfitting.
Figure 17.
Source-aware learning curve based on repeated fractions of outer-training sources. Error bars show variation across source-separated evaluations.
Nested Optuna subgroup performance remained imbalanced: interior R2 = 0.863, MAE = 65.98 kN, RMSE = 102.04 kN, and MAPE = 30.35%; edge R2 = 0.222, MAE = 88.38 kN, RMSE = 117.95 kN, and MAPE = 46.63%; corner R2 = −0.349, MAE = 45.02 kN, RMSE = 60.05 kN, and MAPE = 91.52%. These results reinforce, rather than remove, the edge/corner applicability warning.
4.12. Engineering Screening and Implemented GUI Prototype
To demonstrate the engineering-screening pathway in executable form, a lightweight Streamlit graphical interface was developed and supplied as Supplementary Software (see Supplementary Materials). The implemented sequence is engineering inputs; unit and raw-range validation; deterministic feature construction; applicability-domain check; XGBoost point prediction; reference marginal conformal uncertainty display; connection-type warning; nominal ACI 318-19/Eurocode 2 benchmark context; and mandatory engineering reviews. The interface is intended for research screening and does not replace ACI 318, Eurocode 2, safety or partial factors, detailing requirements, load combinations, or professional judgment.
The operational XGBoost bundle uses the grouped-grid configuration and was refit on all 1068 QC records solely to make the software functional. This full-data refit is not additional validation evidence; all performance claims remain tied to the specimen-random, source-grouped, source-disjoint, and nested evaluations reported above. The interface calculates standardized mean five-nearest-neighbor distance and applies a full-database deployment-screening threshold of 1.903312, defined as the 95th percentile of self-excluded training distances. This threshold is a prototype screening diagnostic, not a new validation-performance statistic or a replacement for the fold-specific analysis.
The displayed ±177.02 kN uncertainty band is the manuscript reference split-conformal half-width associated with 96.3% observed marginal coverage at a nominal 95% level. It is not a deployment-recalibrated interval, subgroup-conditional guarantee, or structural-reliability result. The GUI presents the manuscript nominal code-benchmark metrics only; it does not calculate per-case ACI 318-19 or Eurocode 2 resistance because complete code-specific geometry, eccentricity treatment, safety formats, detailing checks, and scope verification are not implemented. The Supplementary Software package includes the Streamlit application, operational model bundle, QC data copy, requirements file, README, and methodology note; software checks are documented in the supplementary package rather than treated as research results in the manuscript.
Figure 18 presents the implemented research-screening interface for a representative median database case. The interface integrates the point prediction, applicability-domain status, reference marginal uncertainty, subgroup warning, and the mandatory engineering-review boundary.
Figure 18.
Implemented Streamlit research-screening interface for a representative median database case. The displayed output is a screening result, not a structural-design resistance; code checks, safety factors, detailing requirements, load combinations, and professional review remain mandatory.
4.13. Limitations
The analysis represents 111 literature sources only, and transfer beyond them is not established. Edge and corner samples remain scarce, with weak or negative grouped R2, and nested Optuna parameters vary across source folds. Exact selected legacy specimen-random RF and CatBoost hyperparameters were not archived, so their comparative results are not claimed to be independently reproducible from the supplied package; reproducibility claims are centered on the documented XGBoost workflows. SHAP and grouped importance remain associative under correlated predictors. Conformal intervals provide marginal, not conditional, coverage; the adaptive diagnostic did not improve sharpness, and the archived materials do not fully specify the source-level calibration allocation or adaptive scaling rule for the source-disjoint conformal diagnostics. Applicability-domain limits depend on training density, and absolute error increased materially outside that envelope. Independent ±15% perturbations are bounded sensitivity scenarios, not calibrated reliability analysis. Code comparisons concern nominal resistance only. The nine tests are separate mechanics experiments, with quantitative post-peak evidence limited to three complete records. The implemented GUI is a research-screening prototype and has not undergone prospective deployment, human-factors, or code-software verification. No design replacement is claimed.
5. Conclusions
This study developed an explainable machine-learning workflow for estimating punching shear capacity within the represented literature domain. Source-grouped validation, grouped interpretation, marginal uncertainty quantification, bounded sensitivity analysis, and a complementary geogrid experiment were used to define both capability and limitation; none constitute formal structural reliability verification.
The principal conclusions are summarized as follows.
- A quality-controlled database of 1068 specimens from 111 verbatim source groups provides a broad but imbalanced literature-derived basis for model development and source-separated evaluation; 983 records are interior, 51 edge, and 34 corner connections.
- XGBoost achieved R2 = 0.932 under the reproduced specimen-random five-fold benchmark. The tuned grouped-grid analysis gave R2 = 0.881, whereas the leakage-safe nested source-grouped audit gave R2 = 0.858; the latter is the more conservative estimate because hyperparameter selection was confined to inner source-grouped folds. The source-disjoint held-out-study evaluation gave R2 = 0.793. Because MAE and RMSE did not worsen monotonically between the grouped and source-disjoint sets, these results should be interpreted as protocol- and composition-dependent evidence of transfer rather than as a monotonic degradation sequence.
- GroupKFold already prevents source overlap between training and validation within each fold. The source-disjoint holdout adds a different evidential constraint by keeping 23 complete literature sources outside model selection and using them only for held-out-study evaluation. This distinction, together with the nested audit, defines the validation-centered contribution of the study.
- Grouped SHAP patterns emphasized geometry, concrete strength, and reinforcement-related variables. Their qualitative agreement with established mechanics supports plausibility but not causal or uniquely allocated feature attribution.
- The specimen-level split-conformal benchmark achieved 96.3% marginal coverage with a constant total width of 354.04 kN. Under source-disjoint evaluation, the global interval achieved 97.90% coverage with a mean width of 507.14 kN, while the adaptive variant achieved 96.22% coverage with 544.74 kN and did not improve sharpness. These results quantify marginal predictive uncertainty and do not establish subgroup-conditional coverage or structural reliability.
- For the three specimens with complete post-peak records, the two tested geogrid specimens exhibited higher normalized residual-load ratios and CAI values than the tested steel specimen. This case-specific observation is consistent with tensile bridging after punching, but the experiments provide complementary mechanics-consistency and post-peak evidence only; they do not constitute predictive or causal validation, establish general geogrid superiority, or support a design rule. Quantitative CAI evidence remains restricted to these three completely digitized records.
- Source-grouped subgroup performance was R2 = 0.886 for interior, 0.309 for edge, and −0.851 for corner connections. The sparse edge/corner results require explicit applicability warnings and additional testing.
Overall, the framework is a research-oriented decision-support workflow, not a replacement for code design. Its output should be used only within the represented domain and together with design resistance, safety factors, detailing requirements, and engineering review.
6. Future Research
Future research should prioritize the expansion and diversification of the experimental evidence base, particularly through new and genuinely independent testing programs for edge and corner slab–column connections, which remain sparsely represented in the present database. Prospective validation using experimental campaigns or external datasets not represented in the current literature compilation is also required to assess transferability beyond the evidence base used in this study.
A second priority is the systematic replication of matched geogrid-reinforced post-peak experiments with complete load–displacement acquisition. Such testing would enable more rigorous assessment of residual capacity, deformation behavior, collapse-arrest characteristics, and post-failure integrity than is possible from the three complete post-peak records currently available.
As subgroup sample sizes increase, future work should investigate conditional or locally adaptive uncertainty-quantification methods, including subgroup-aware conformal approaches, rather than relying solely on marginal coverage. Formal structural-reliability analysis should be considered only after representative probabilistic distributions and dependence structures for the governing input variables have been established from appropriate experimental or field evidence.
Future studies should also extend mechanics-based benchmarking to additional formulations, including fib Model Code/CSCT-based approaches, where the required deformation, rotation, geometry, and material variables can be reconstructed consistently across specimens. Finally, the implemented research-screening GUI should undergo prospective validation, usability assessment, interface refinement, and evaluation of warning and uncertainty communication before consideration for broader engineering deployment.
Overall, further increases in algorithmic complexity are considered secondary to acquiring broader, more diverse, and genuinely independent experimental evidence, improving uncertainty characterization, and establishing prospective validation under conditions not represented in the current literature database.
Supplementary Materials
The following supporting information can be downloaded at https://www.mdpi.com/article/10.3390/ma19204351/s1. The supporting information accompanying this article includes the quality-controlled dataset, source-grouped validation assignments and leakage audits, out-of-fold predictions, uncertainty and applicability-domain analyses, interpretability outputs, optimization and sensitivity analyses, reproducibility scripts and computational-environment information, and the research-screening GUI package.
Author Contributions
Conceptualization, A.N.E. and H.M.I.; methodology, A.N.E., H.M.I. and M.A.M.; software, A.N.E.; validation, A.N.E., H.M.I., M.A.M. and A.G.; formal analysis, A.N.E. and M.A.M.; investigation, A.N.E. and A.G.; resources, H.M.I., M.A.M. and A.G.; data curation, A.N.E. and M.A.M.; writing—original draft preparation, A.N.E.; writing—review and editing, A.N.E., H.M.I., M.A.M. and A.G.; visualization, A.N.E.; supervision, H.M.I.; project administration, A.N.E. All authors have read and agreed to the published version of the manuscript.
Funding
This research received no external funding.
Institutional Review Board Statement
Not applicable.
Informed Consent Statement
Not applicable.
Data Availability Statement
The original contributions presented in this study are included in the article/Supplementary Materials. Further inquiries can be directed at the corresponding author.
Acknowledgments
During the preparation of this manuscript, the authors used ChatGPT (OpenAI, GPT-5.6) for language refinement, improvement of textual clarity and organization, and assistance with selected computational and software-development tasks. All AI-assisted outputs were critically reviewed, verified, and edited by the authors. The authors take full responsibility for the scientific content, analyses, interpretations, and conclusions presented in this publication.
Conflicts of Interest
Author Mina A. Mikaeel was employed by the company KS Engineers, P.C. The remaining authors declare that the research was conducted in the absence of any commercial or financial relationships that could be construed as potential conflicts of interest.
Abbreviations
The following abbreviations are used in this manuscript:
| ACI | American Concrete Institute |
| AI | Artificial intelligence |
| ANN | Artificial neural network |
| CAI | Collapse-Arrest Index |
| CDF | Cumulative distribution function |
| COV | Coefficient of variation |
| CSCT | Critical Shear Crack Theory |
| CV | Cross-validation |
| DT | Decision tree |
| EC2 | Eurocode 2 |
| FRP | Fiber-reinforced polymer |
| GFRP | Glass-fiber-reinforced polymer |
| GP | Gaussian process |
| KDE | Kernel density estimation |
| MAE | Mean absolute error |
| MAPE | Mean absolute percentage error |
| MBE | Mean bias error |
| MCS | Monte Carlo simulation |
| ML | Machine learning |
| MPE | Mean percentage error |
| MPIW | Mean prediction interval width |
| NGBoost | Natural Gradient Boosting |
| Probability density function | |
| PDP | Partial dependence plot |
| RC | Reinforced concrete |
| RF | Random Forest |
| RMSE | Root mean square error |
| SHAP | SHapley Additive exPlanations |
| SVM | Support vector machine |
| SVR | Support vector regression |
| UHPFRC | Ultra-high-performance fiber-reinforced concrete |
| XAI | Explainable artificial intelligence |
| XGBoost | Extreme Gradient Boosting |
References
- Hallgren, M. Punching Shear Capacity of Reinforced High-Strength Concrete Slabs; Royal Institute of Technology (KTH): Stockholm, Sweden, 1996. [Google Scholar]
- Muttoni, A. Punching shear strength of reinforced concrete slabs without transverse reinforcement. ACI Struct. J. 2008, 105, 440–450. [Google Scholar] [CrossRef] [Scilit] [PubMed]
- Fernández Ruiz, M.; Muttoni, A. Applications of critical shear crack theory to punching of reinforced concrete slabs with transverse reinforcement. ACI Struct. J. 2009, 106, 485–494. [Google Scholar] [CrossRef] [Scilit] [PubMed]
- Sagaseta, J.; Tassinari, L.; Fernández Ruiz, M.; Muttoni, A. Punching of flat slabs supported on rectangular columns. Eng. Struct. 2014, 77, 17–33. [Google Scholar] [CrossRef] [Scilit]
- ACI Committee 318. Building Code Requirements for Structural Concrete (ACI 318-19) and Commentary (ACI 318R-19); American Concrete Institute: Farmington Hills, MI, USA, 2019. [Google Scholar]
- EN 1992-1-1; Eurocode 2: Design of Concrete Structures—Part 1-1: General Rules and Rules for Buildings. CEN: Brussels, Belgium, 2004.
- Fédération Internationale du Béton (fib). fib Model Code for Concrete Structures 2010; Fédération Internationale du Béton: Lausanne, Switzerland, 2013. [Google Scholar]
- Guandalini, S.; Burdet, O.; Muttoni, A. Punching tests of slabs with low reinforcement ratios. ACI Struct. J. 2009, 106, 87–95. [Google Scholar] [CrossRef] [Scilit] [PubMed]
- Micallef, K.; Sagaseta, J.; Fernández Ruiz, M.; Muttoni, A. Assessing punching shear failure in reinforced concrete flat slabs subjected to localised impact loading. Int. J. Impact Eng. 2014, 71, 17–33. [Google Scholar] [CrossRef] [Scilit]
- Salehi, H.; Burgueño, R. Emerging artificial intelligence methods in structural engineering. Eng. Struct. 2018, 171, 170–189. [Google Scholar] [CrossRef] [Scilit]
- Jang, J.-I.; Kang, S.-M. Punching shear behavior of shear-reinforced slab-column connections with varying flexural reinforcement. Int. J. Concr. Struct. Mater. 2019, 13, 29. [Google Scholar] [CrossRef] [Scilit]
- Nguyen, H.D.; Truong, G.T.; Shin, M. Development of an extreme gradient boosting model for predicting the punching shear resistance of reinforced-concrete interior slabs. Eng. Struct. 2021, 235, 112067. [Google Scholar] [CrossRef] [Scilit]
- Yankelevsky, D.Z.; Karinski, Y.S.; Brodsky, A.; Feldgun, V.R. Evaluation of punching shear design criteria to prevent progressive collapse of reinforced-concrete flat slabs. Int. J. Prot. Struct. 2021, 12, 174–205. [Google Scholar] [CrossRef] [Scilit]
- de Sousa, A.M.D.; Lantsoght, E.O.L.; El Debs, M.K. Databases of One-Way Slabs Under Concentrated Loads: Parameter Analyses and Validation of the Proposed Approach; Zenodo: Genève, Switzerland, 2022. [Google Scholar]
- Vargas, D.; Lantsoght, E.O.L.; Genikomsou, A.S. Flat slabs in eccentric punching shear: Experimental database and code analysis. Buildings 2022, 12, 2092. [Google Scholar] [CrossRef] [Scilit]
- RajeshKumar, K.; Awoyera, P.O.; Shyamala, G.; Kumar, V.; Gurumoorthy, N.; Kayikci, S.; Bendezú Romero, L.M.; Krishna Prakash, A. Structural performance of biaxial geogrid-reinforced concrete slabs. Int. J. Civ. Eng. 2022, 20, 349–359. [Google Scholar] [CrossRef] [Scilit]
- Liang, S.; Shen, Y.; Ren, X. Comparative study of influential factors for punching shear resistance and failure of reinforced-concrete slab-column joints using machine-learning models. Structures 2022, 45, 1333–1349. [Google Scholar] [CrossRef] [Scilit]
- Abdallah, M.H.; Thoeny, Z.A.; Henedy, S.N.; Al-Abdaly, N.M.; Imran, H.; Bernardo, L.F.A.; Al-Khafaji, Z. Machine-learning-based prediction of the punching shear capacity of reinforced-concrete flat slabs: An advanced M5P model-tree approach. Appl. Sci. 2023, 13, 8325. [Google Scholar] [CrossRef] [Scilit]
- Wu, Y.; Zhou, Y. Prediction and feature analysis of the punching shear strength of two-way reinforced-concrete slabs using an optimized machine-learning algorithm and SHapley additive explanations. Mech. Adv. Mater. Struct. 2023, 30, 3086–3096. [Google Scholar] [CrossRef] [Scilit]
- Molnar, C. Interpretable Machine Learning, 2nd ed.; Leanpub: Victoria, BC, Canada, 2022; Available online: https://christophm.github.io/interpretable-ml-book/ (accessed on 14 August 2026).
- Le, A.H.; Vu, H.-P.; Pham, D.-D. Numerical modelling of the punching shear behavior of UHPFRC flat slabs. In Proceedings of the Third International Conference on Sustainable Civil Engineering and Architecture; Springer: Singapore, 2023. [Google Scholar] [CrossRef] [Scilit]
- Yan, H.-J.; Xie, N. Optimized machine-learning algorithms for predicting the punching shear resistance of flat slabs with transverse reinforcement. Int. J. Concr. Struct. Mater. 2024, 18, 76. [Google Scholar] [CrossRef] [Scilit]
- Zheng, S.; Hu, T.; Khodadadi, N.; Nanni, A. Explainable prediction model for punching shear strength of FRP-RC slabs based on kernel density estimation and XGBoost. Sci. Rep. 2024, 14, 31760. [Google Scholar] [CrossRef] [Scilit] [PubMed]
- Mostafa, H.M.F.; Mahmoud, A.A.; Mostafa, T.S.; Khater, A.N.M. Experimental and analytical punching shear behavior of reinforced-concrete flat slabs with internal GFRP gratings. Structures 2024, 64, 105882. [Google Scholar] [CrossRef] [Scilit]
- Wahab, S.; Mahmoudabadi, N.S.; Waqas, S.; Herl, N.; Iqbal, M.; Alam, K.; Ahmad, A. Comparative analysis of shear-strength prediction models for reinforced-concrete slab-column connections. Adv. Civ. Eng. 2024, 2024, 1784088. [Google Scholar] [CrossRef] [Scilit]
- Wei, J.; Ren, J.; Chen, B.; Ji, X.-H.; Jia, B.; Sui, Z.-J.; Gao, Z.-Y.; Xia, P.; Peng, K.-D. Automated ensemble learning for shear-strength prediction in marine reinforced-concrete slabs: A self-optimizing stacked framework. Case Stud. Constr. Mater. 2025, 23, e05243. [Google Scholar] [CrossRef] [Scilit]
- Chen, G.; Cheng, X.; Diao, M.; Li, Y.; Lu, Y. Progressive-collapse resistance of one-way wet-connected precast concrete beam-slab-column substructures: Experimental and numerical investigations. Eng. Struct. 2025, 327, 121288. [Google Scholar] [CrossRef] [Scilit]
- Lundberg, S.M.; Lee, S.-I. A unified approach to interpreting model predictions. In Advances in Neural Information Processing Systems 30; Curran Associates: Red Hook, NY, USA, 2017; Volume 30. [Google Scholar]
- Vovk, V.; Gammerman, A.; Shafer, G. Algorithmic Learning in a Random World; Springer: New York, NY, USA, 2005. [Google Scholar]
- Angelopoulos, A.N.; Bates, S. A gentle introduction to conformal prediction and distribution-free uncertainty quantification. arXiv 2021, arXiv:2107.07511. [Google Scholar]
- Mohamed, R.N.A.; El Sebai, A.M.; Gabr, A.S.A.-H. Flexural behavior of reinforced-concrete slabs reinforced with innovative hybrid reinforcement of geogrids and steel bars. Buildings 2020, 10, 161. [Google Scholar] [CrossRef] [Scilit]
- Melchers, R.E.; Beck, A.T. Structural Reliability Analysis and Prediction, 3rd ed.; John Wiley & Sons: Hoboken, NJ, USA, 2018. [Google Scholar]
- Ang, A.H.-S.; Tang, W.H. Probability Concepts in Engineering: Emphasis on Applications to Civil and Environmental Engineering, 2nd ed.; John Wiley & Sons: Hoboken, NJ, USA, 2007. [Google Scholar]
- Mangalathu, S.; Shin, H.; Choi, E.; Jeon, J.-S. Explainable machine-learning models for punching shear strength estimation of flat slabs without transverse reinforcement. J. Build. Eng. 2021, 39, 102300. [Google Scholar] [CrossRef] [Scilit]
- Shen, L.; Shen, Y.; Liang, S. Reliability analysis of RC slab-column joints under punching shear load using a machine learning-based surrogate model. Buildings 2022, 12, 1750. [Google Scholar] [CrossRef] [Scilit]
- Ren, X.; Liu, X. Probabilistic modeling and mechanism analysis of punching shear failure of RC slab-column joints based on NGBoost model. Eng. Fail. Anal. 2025, 182, 110057. [Google Scholar] [CrossRef] [Scilit]
- Shah, Q.; Ullah, I.; Khoso, W.A.; Iqbal, F.; Umali, M. Explainable and comparative machine-learning models for punching shear prediction in reinforced-concrete flat slabs. Multiscale Multidiscip. Model. Exp. Des. 2026, 9, 146. [Google Scholar] [CrossRef] [Scilit]
- Breiman, L. Random forests. Mach. Learn. 2001, 45, 5–32. [Google Scholar] [CrossRef] [Scilit]
- Chen, T.; Guestrin, C. XGBoost: A scalable tree boosting system. In Proceedings of the 22nd ACM SIGKDD International Conference on Knowledge Discovery and Data Mining, San Francisco, CA, USA, 13–17 August 2016; pp. 785–794. [Google Scholar] [CrossRef] [Scilit]
- Prokhorenkova, L.; Gusev, G.; Vorobev, A.; Dorogush, A.V.; Gulin, A. CatBoost: Unbiased boosting with categorical features. In Advances in Neural Information Processing Systems 31; Curran Associates: Red Hook, NY, USA, 2018; Volume 31. [Google Scholar]
- Lundberg, S.M.; Erion, G.G.; Chen, H.; DeGrave, A.; Prutkin, J.M.; Nair, B.; Katz, R.; Himmelfarb, J.; Bansal, N.; Lee, S.-I. From local explanations to global understanding with explainable AI for trees. Nat. Mach. Intell. 2020, 2, 56–67. [Google Scholar] [CrossRef] [Scilit] [PubMed]
- Romano, Y.; Patterson, E.; Candès, E.J. Conformalized quantile regression. In Advances in Neural Information Processing Systems 32; Curran Associates: Red Hook, NY, USA, 2019; Volume 32. [Google Scholar]
- Ebid, A.; Deifalla, A. Using artificial intelligence techniques to predict punching shear capacity of lightweight concrete slabs. Materials 2022, 15, 2732. [Google Scholar] [CrossRef] [Scilit] [PubMed]
- Hoang, N.-D. Estimating punching shear capacity of steel fibre reinforced concrete slabs using sequential piecewise multiple linear regression and artificial neural network. Measurement 2019, 137, 58–70. [Google Scholar] [CrossRef] [Scilit]
- Vu, D.-T.; Hoang, N.-D. Punching shear capacity estimation of FRP-reinforced concrete slabs using a hybrid machine learning approach. Struct. Infrastruct. Eng. 2016, 12, 1153–1161. [Google Scholar] [CrossRef] [Scilit]
- Alotaibi, E.; Mostafa, O.; Nassif, N.; Omar, M.; Arab, M.G. Prediction of punching shear capacity for fiber-reinforced concrete slabs using neuro-nomographs constructed by machine learning. J. Struct. Eng. 2021, 147, 04021075. [Google Scholar] [CrossRef] [Scilit]
- Gomaa, A.M.; Khafaga, S.A.; Lotfy, E.M.; Hosny, S.; Ahmed, M.A. Comparative study of models predicting punching shear capacity of strengthened corroded RC slab-column joints. HBRC J. 2024, 20, 257–274. [Google Scholar] [CrossRef] [Scilit]
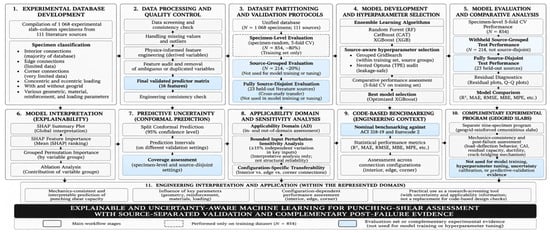
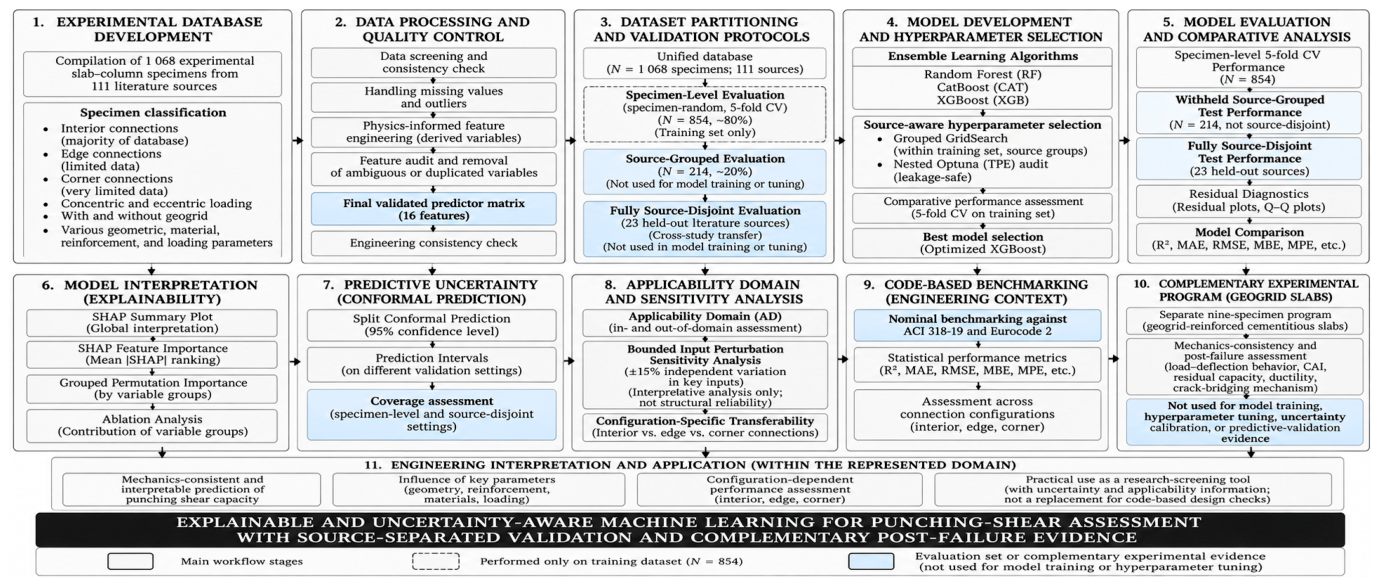
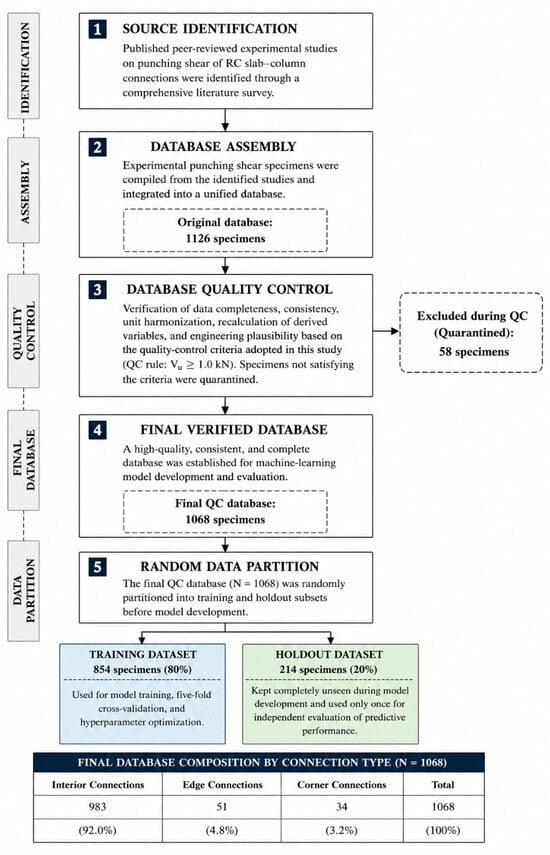
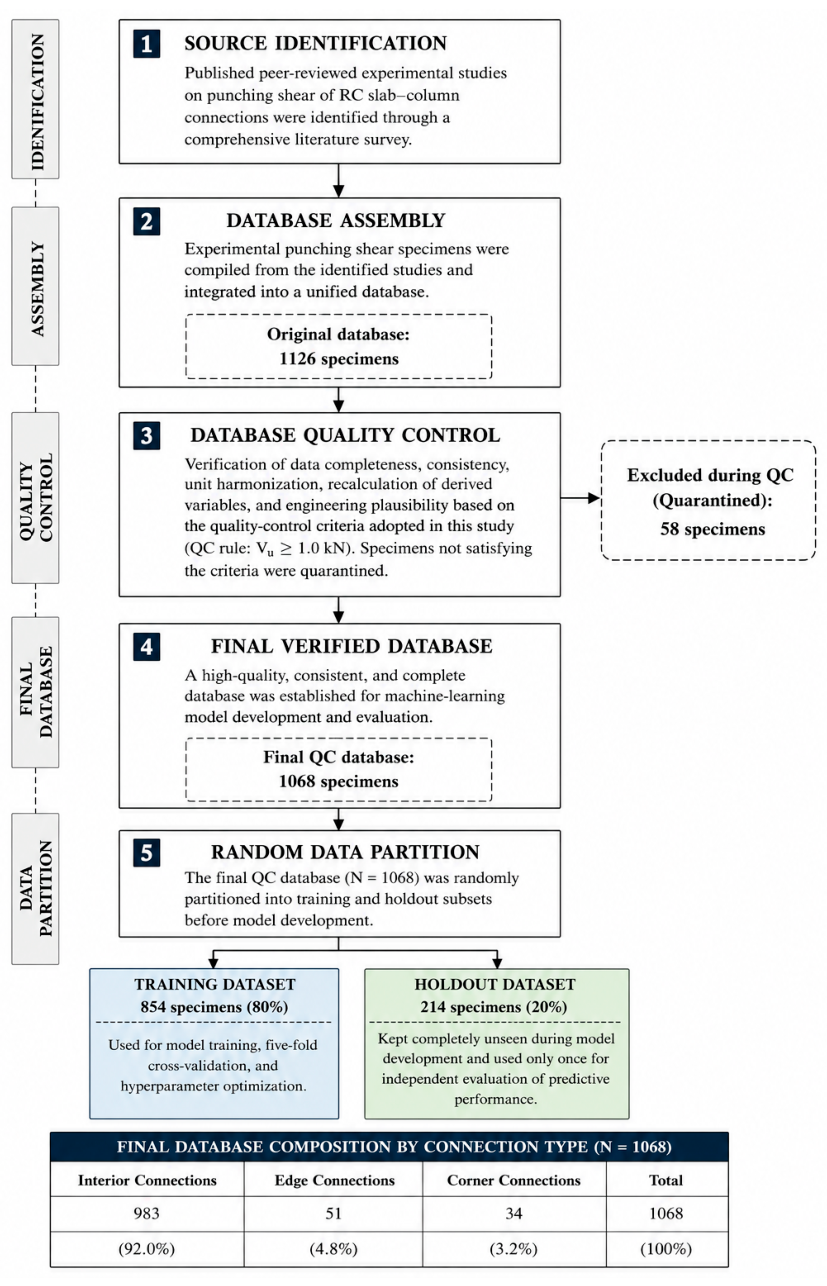
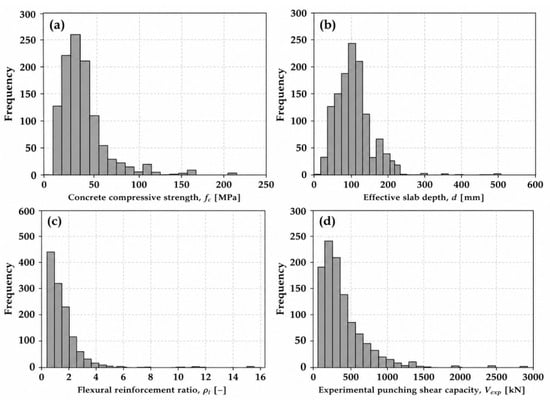
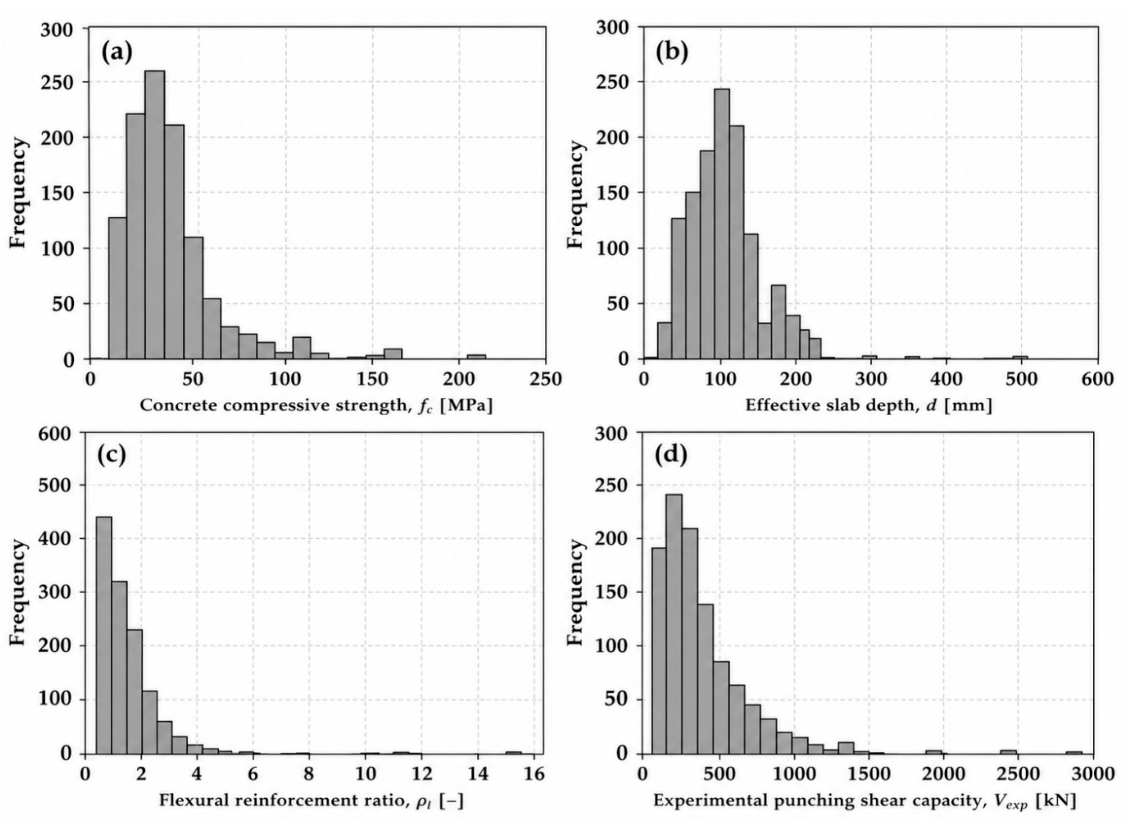
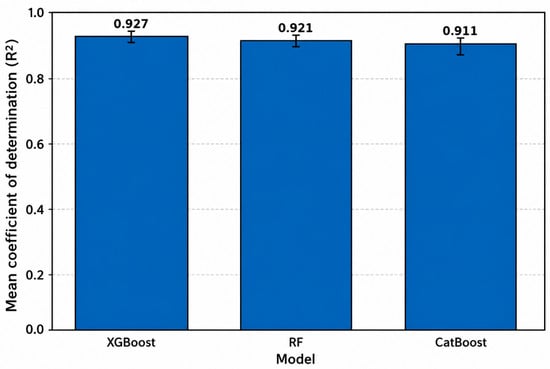
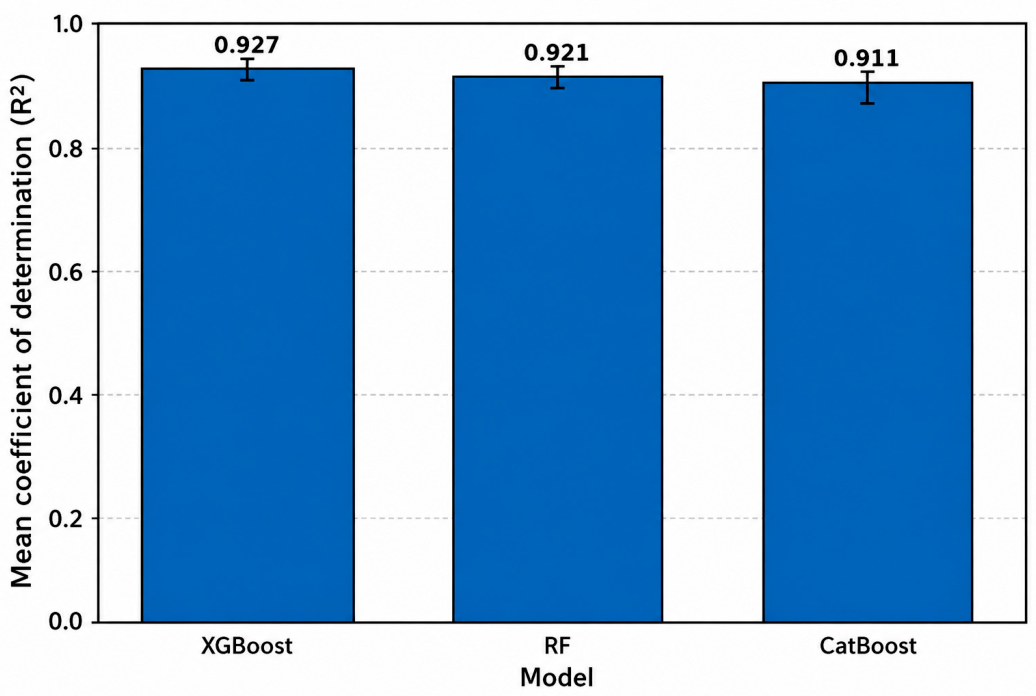
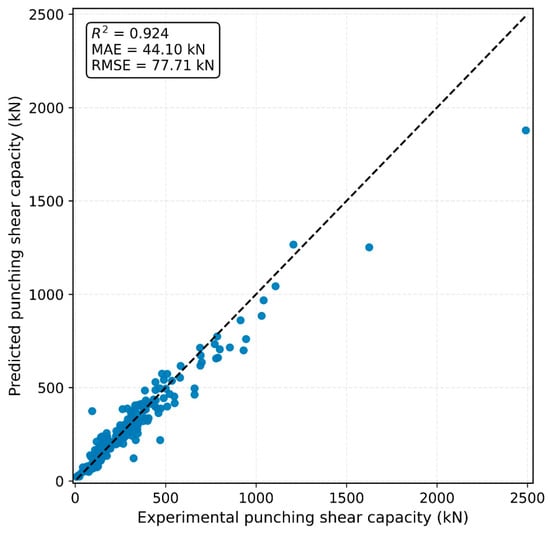
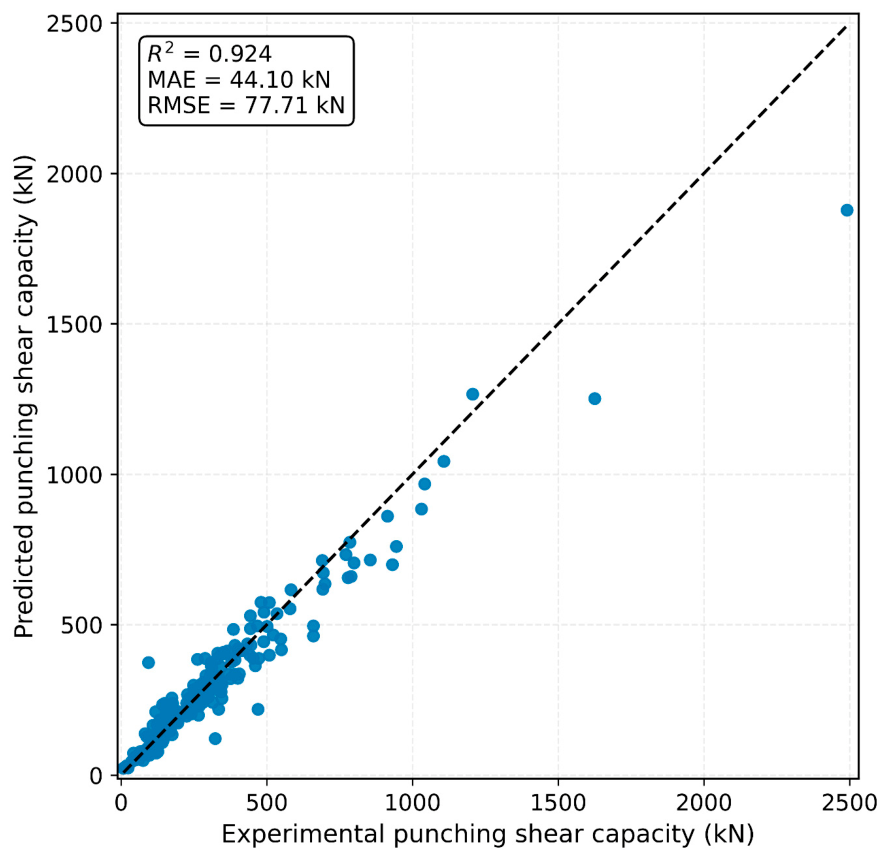
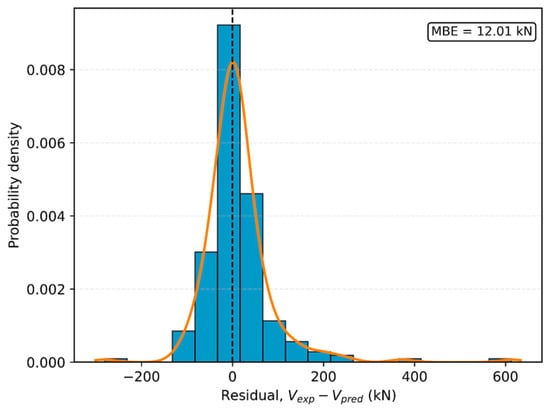
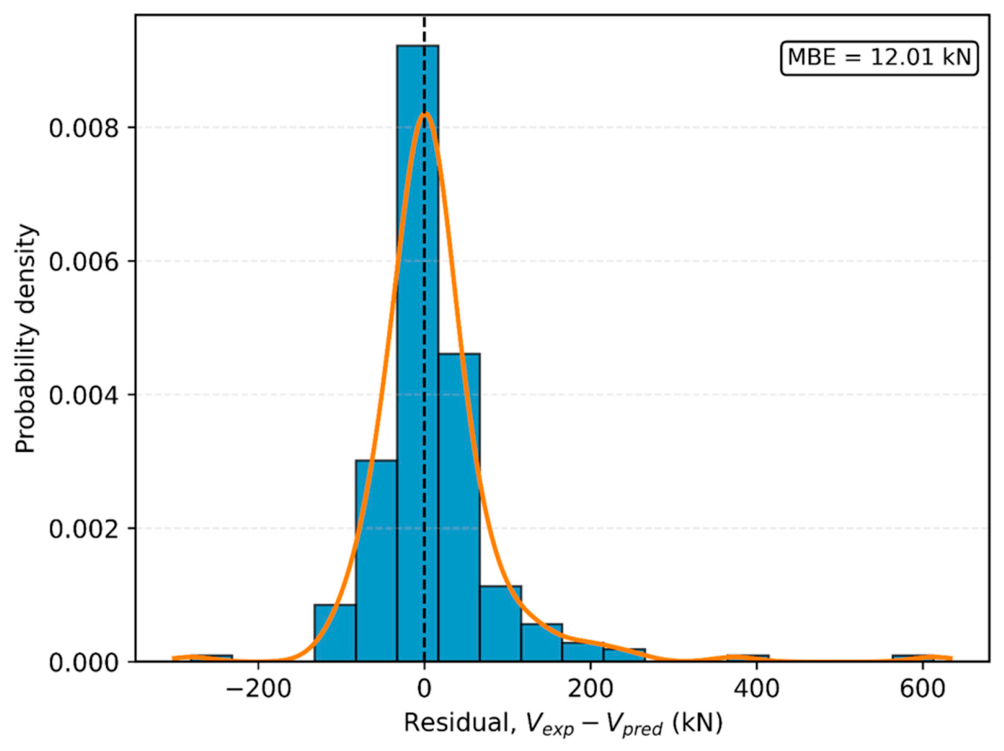
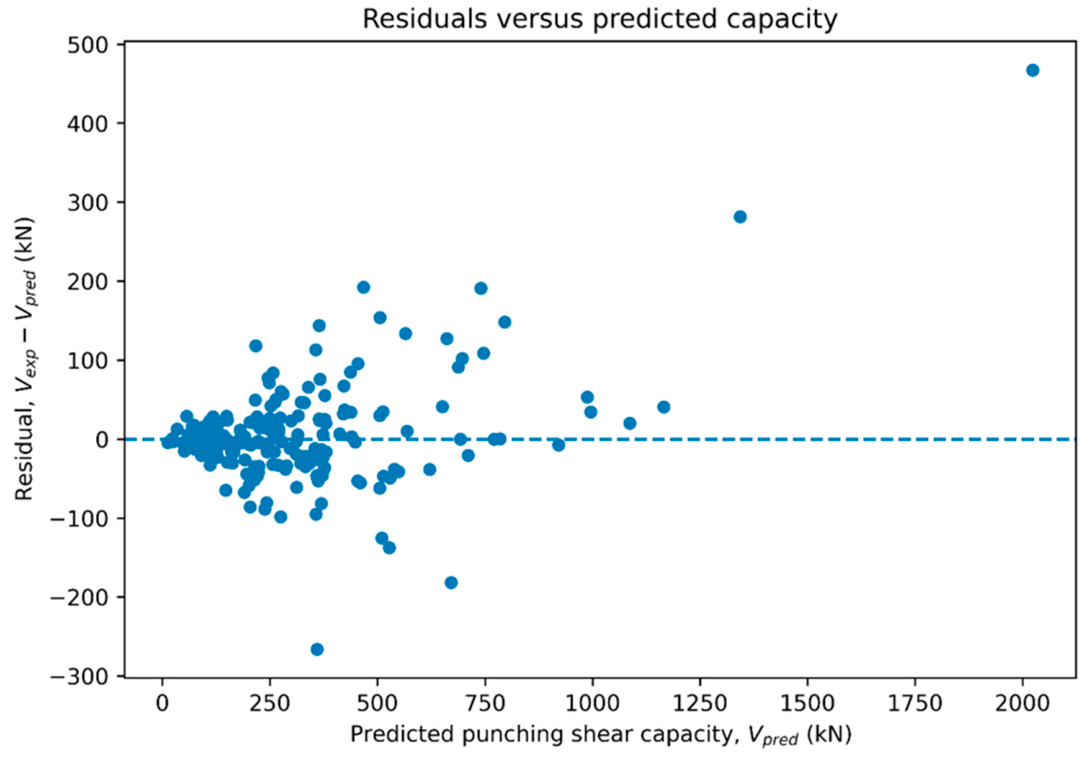
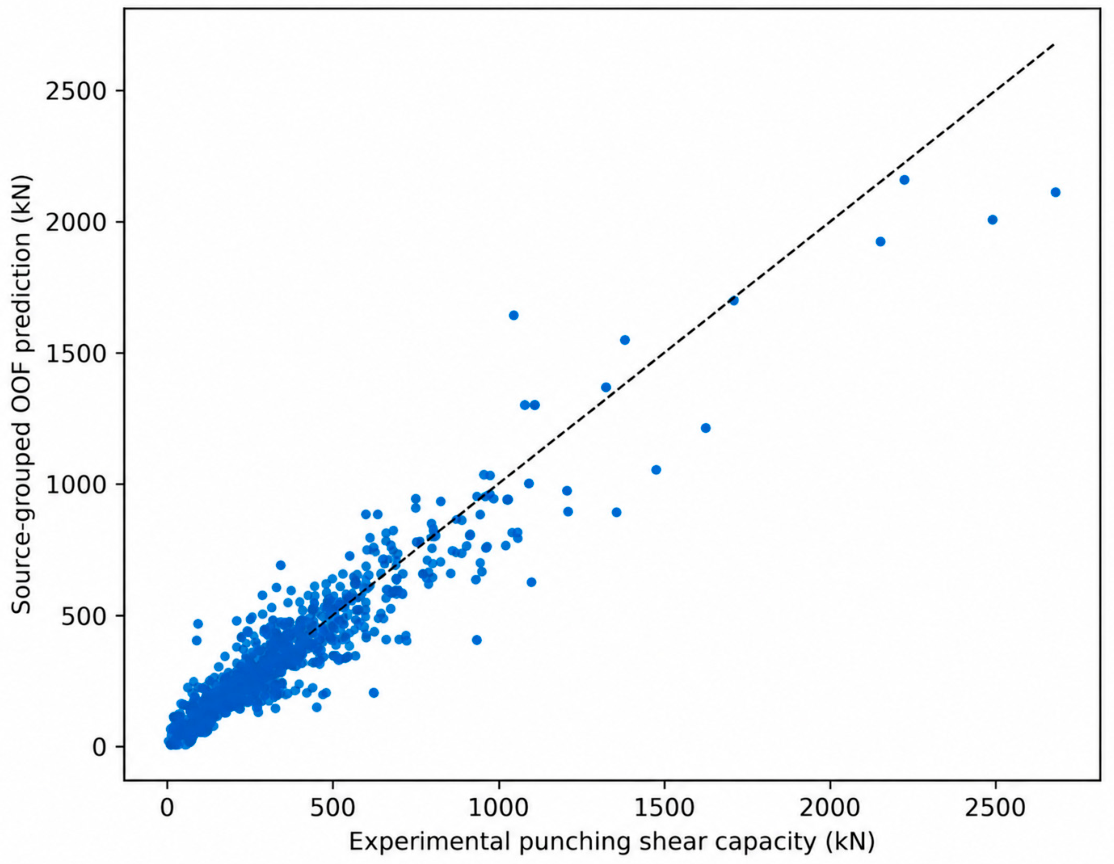
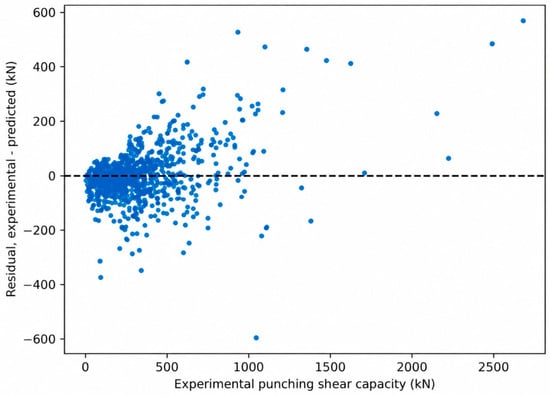
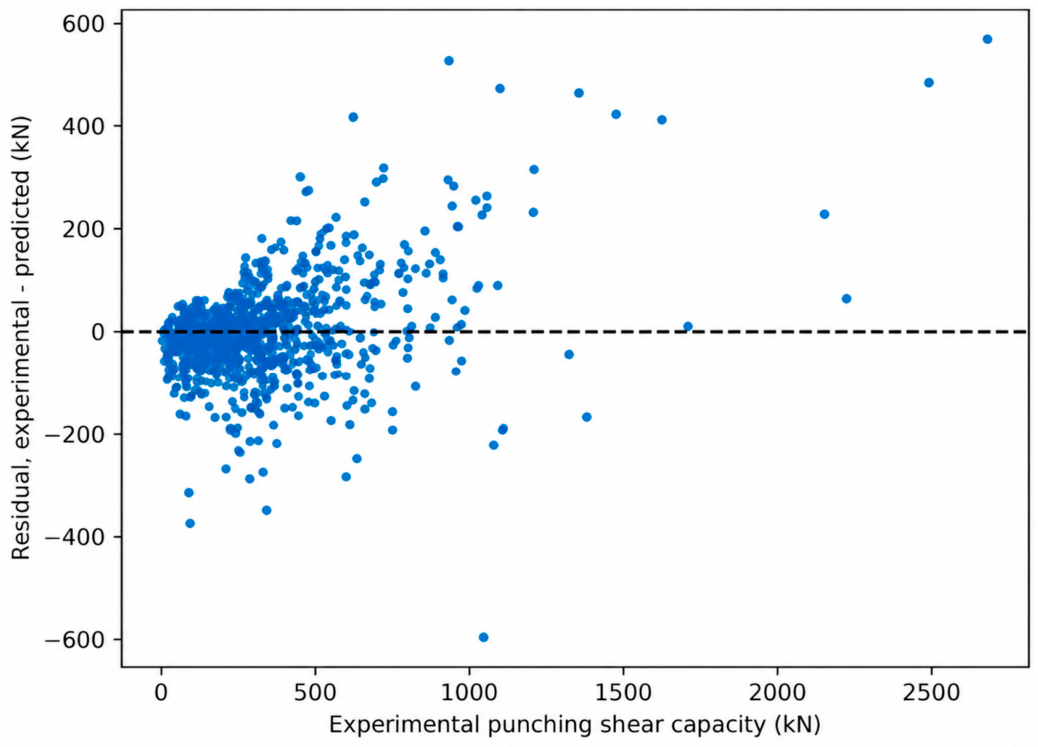
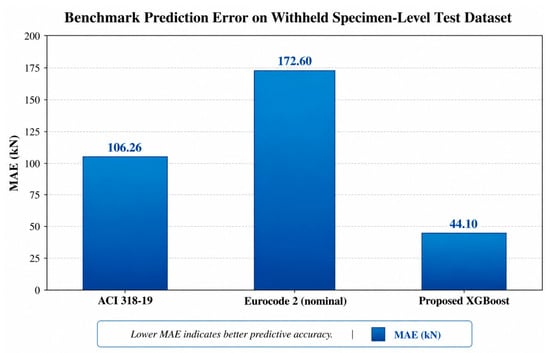
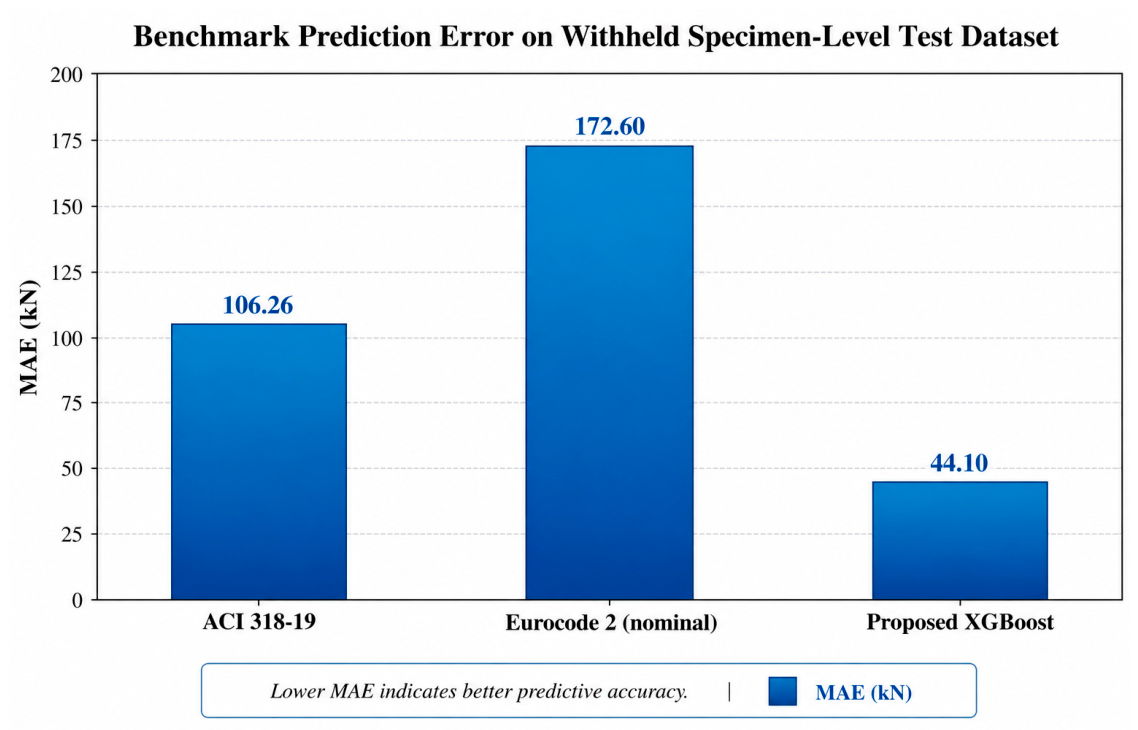
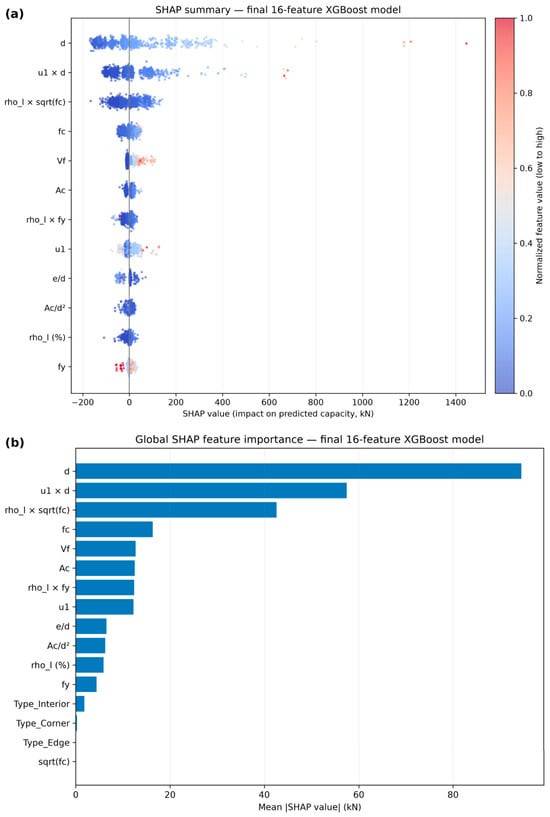
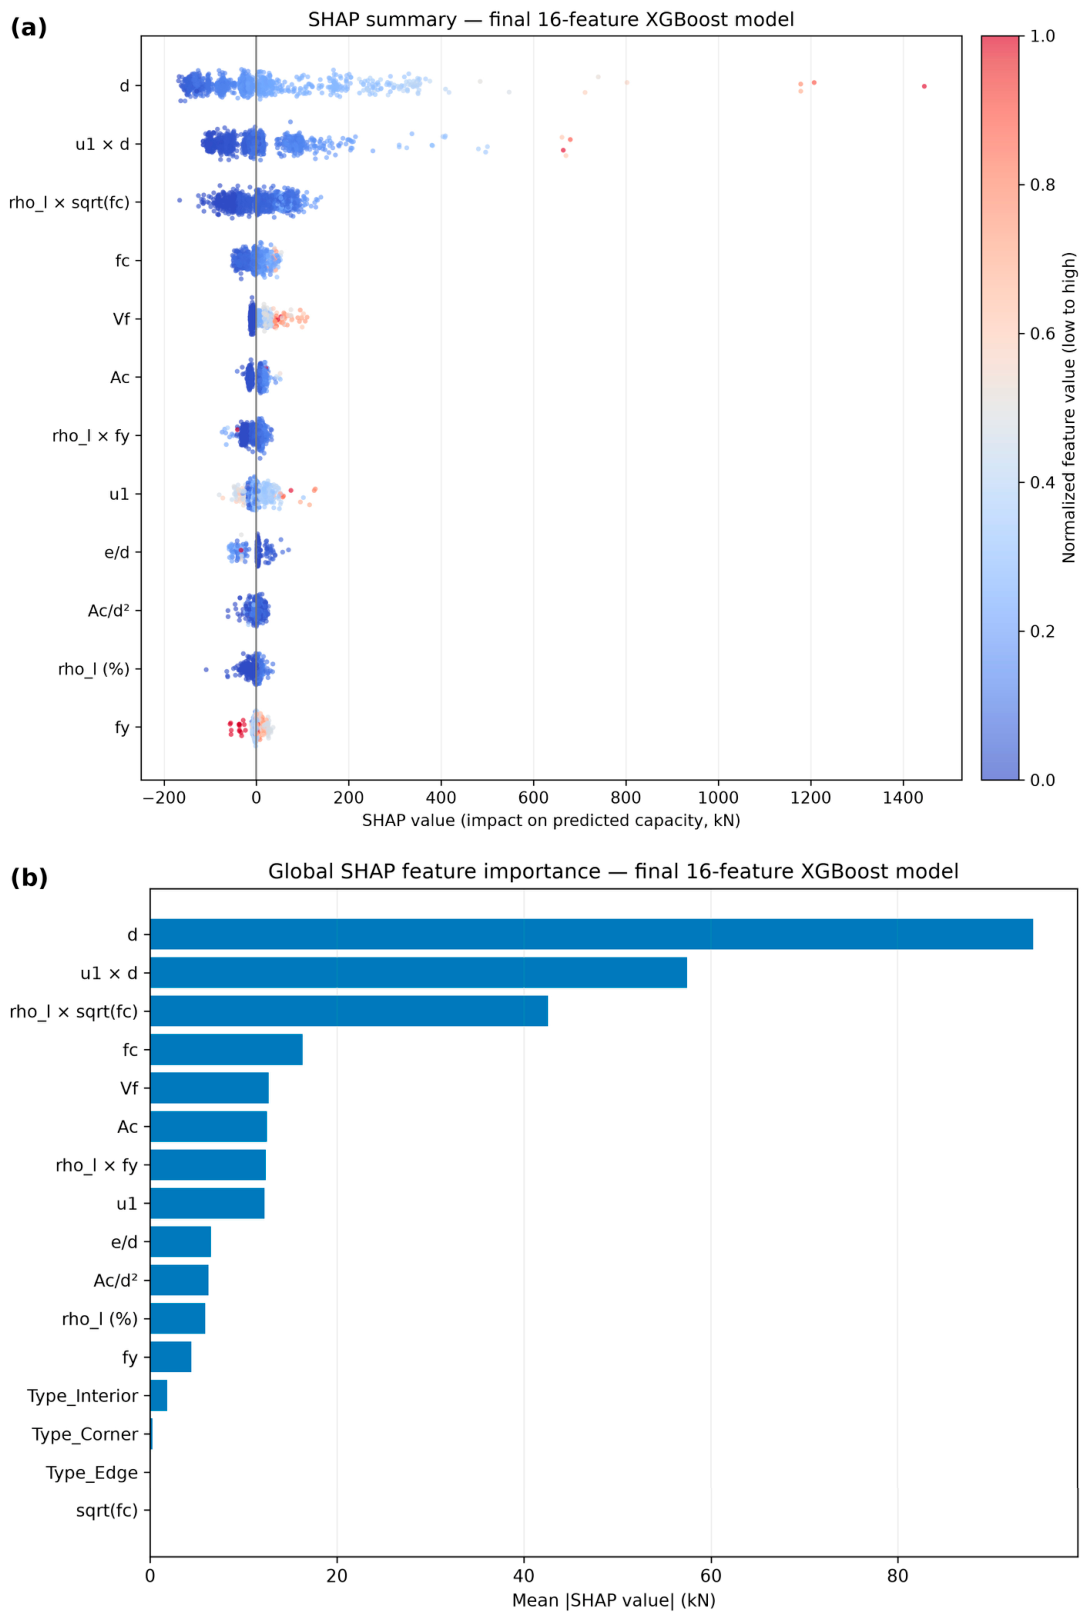
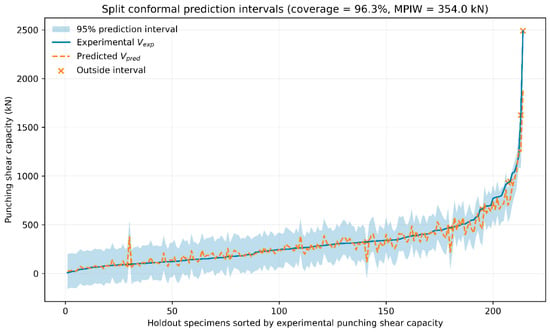
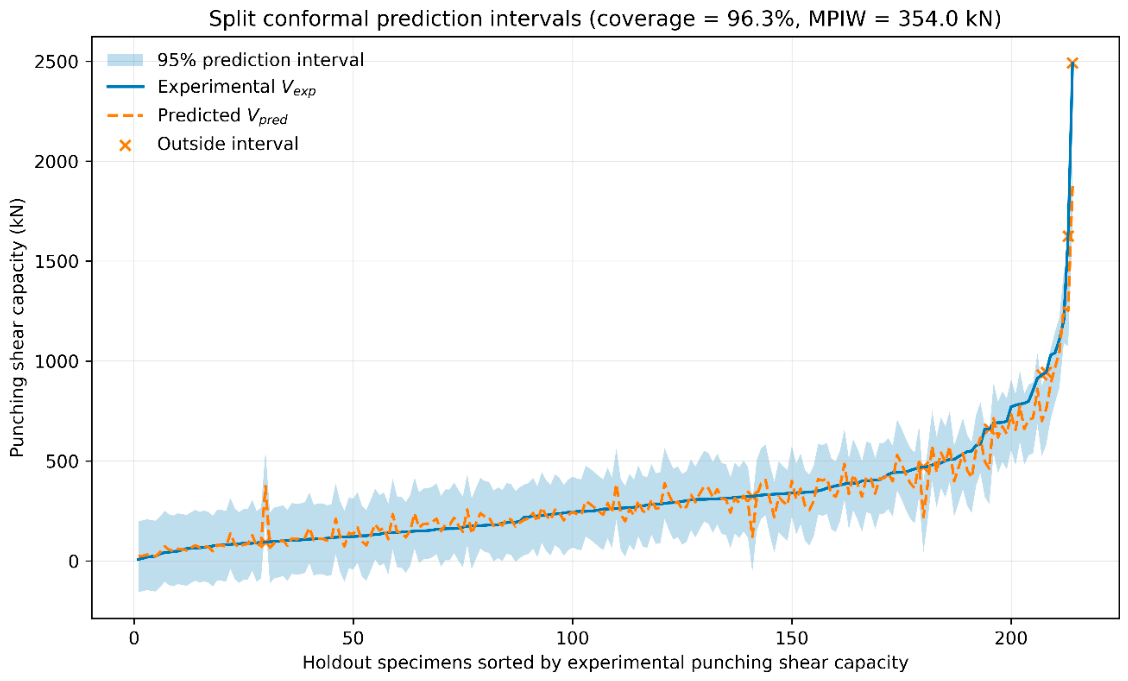
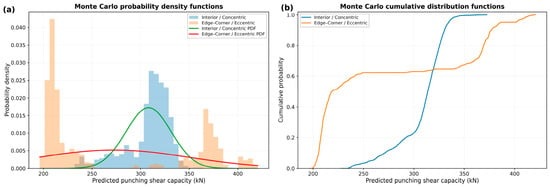
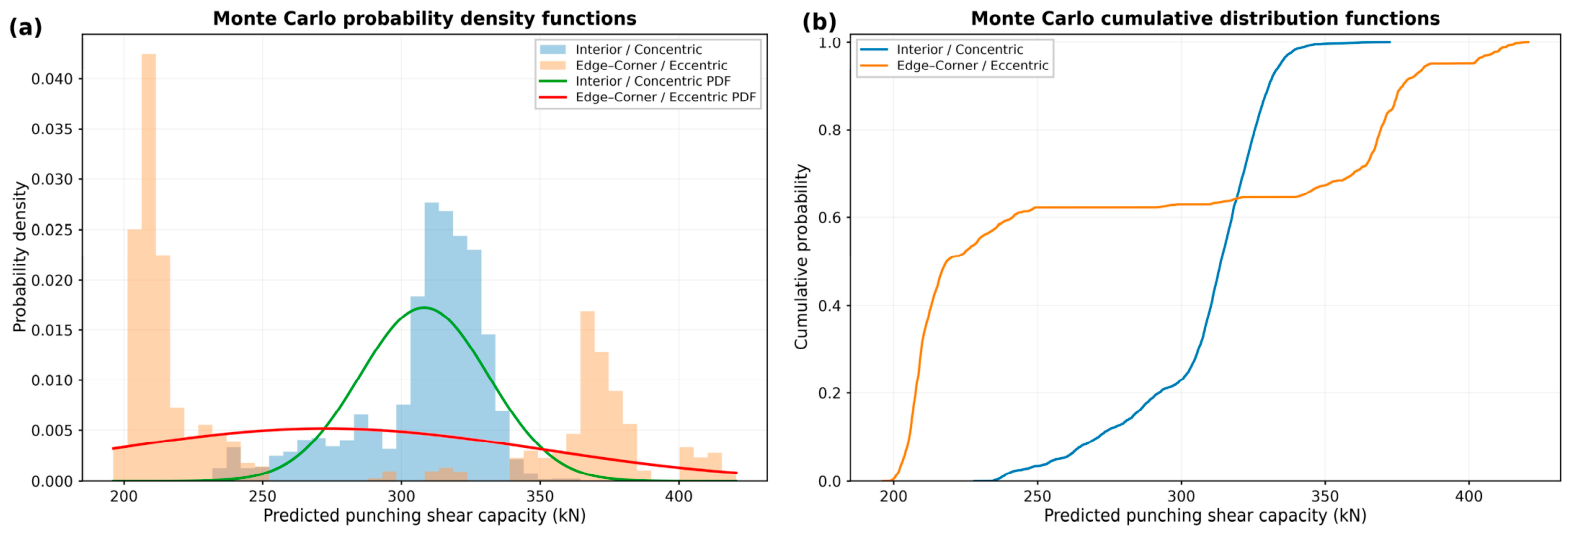
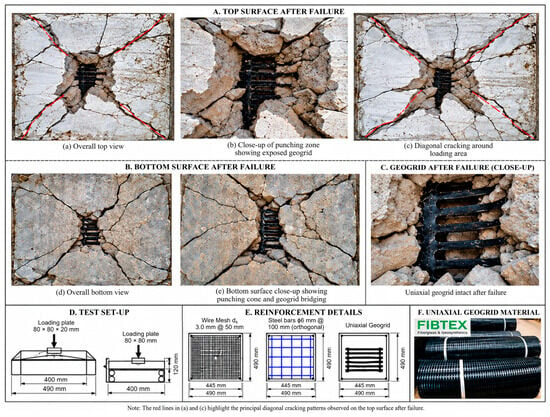
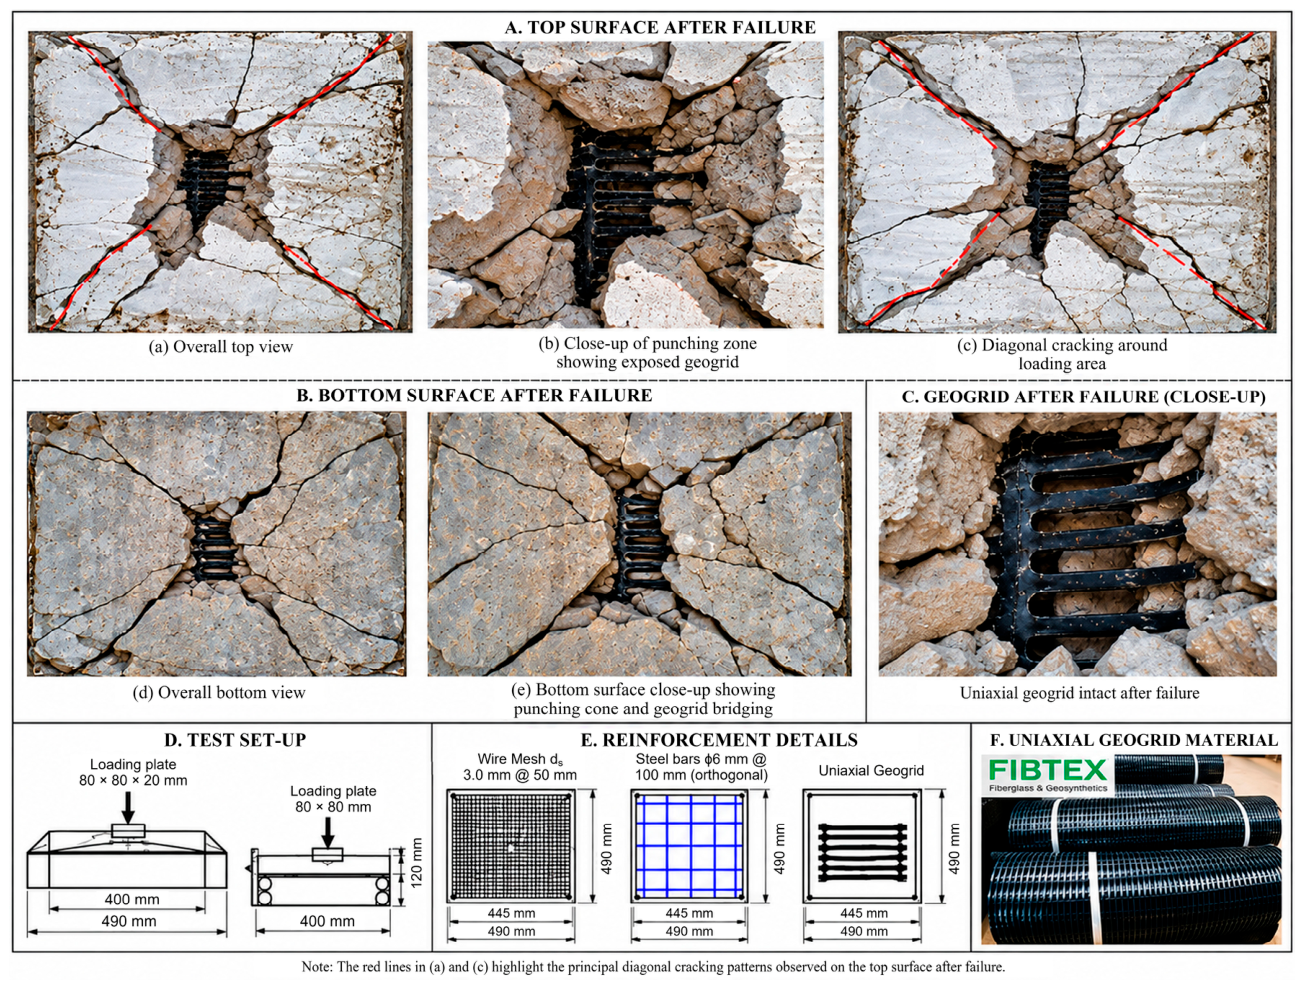
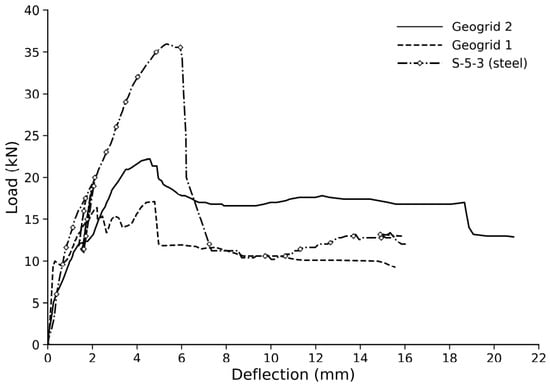
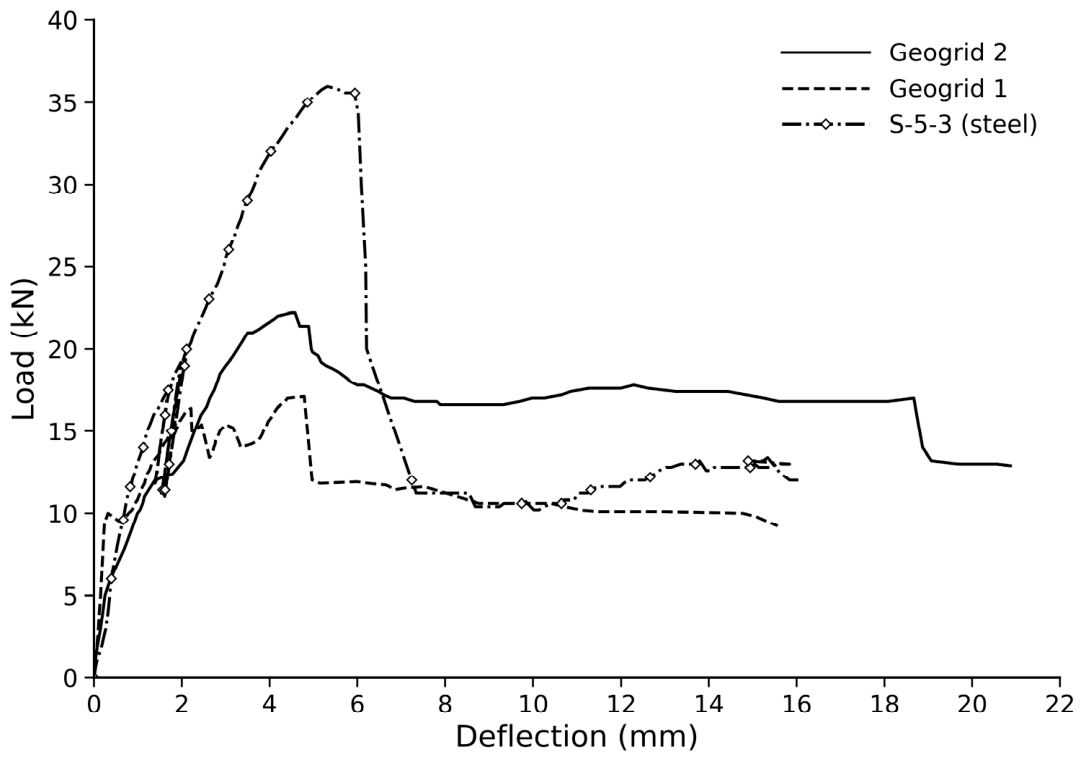
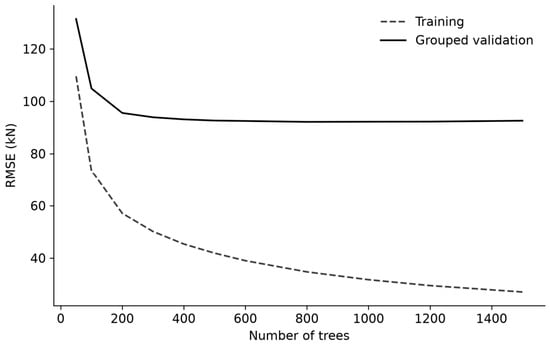
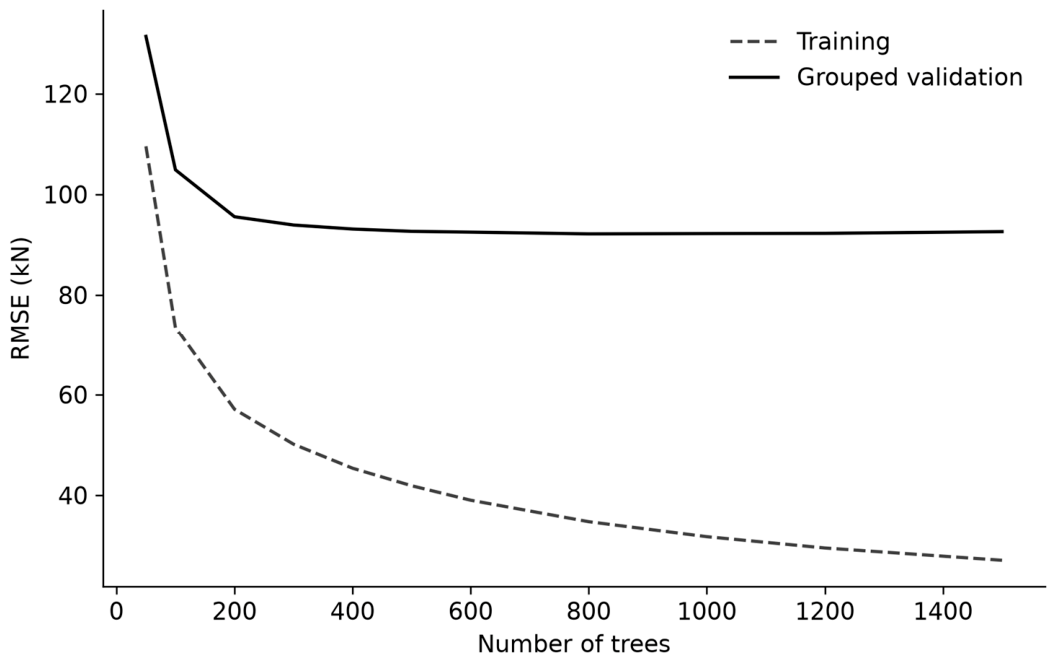
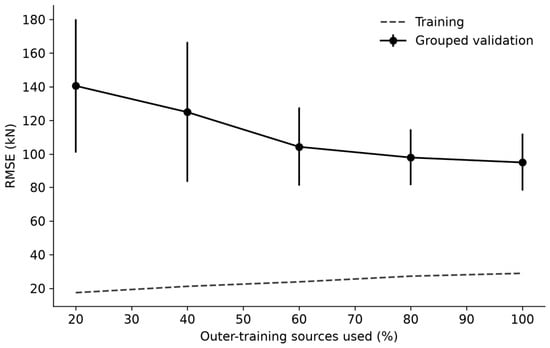
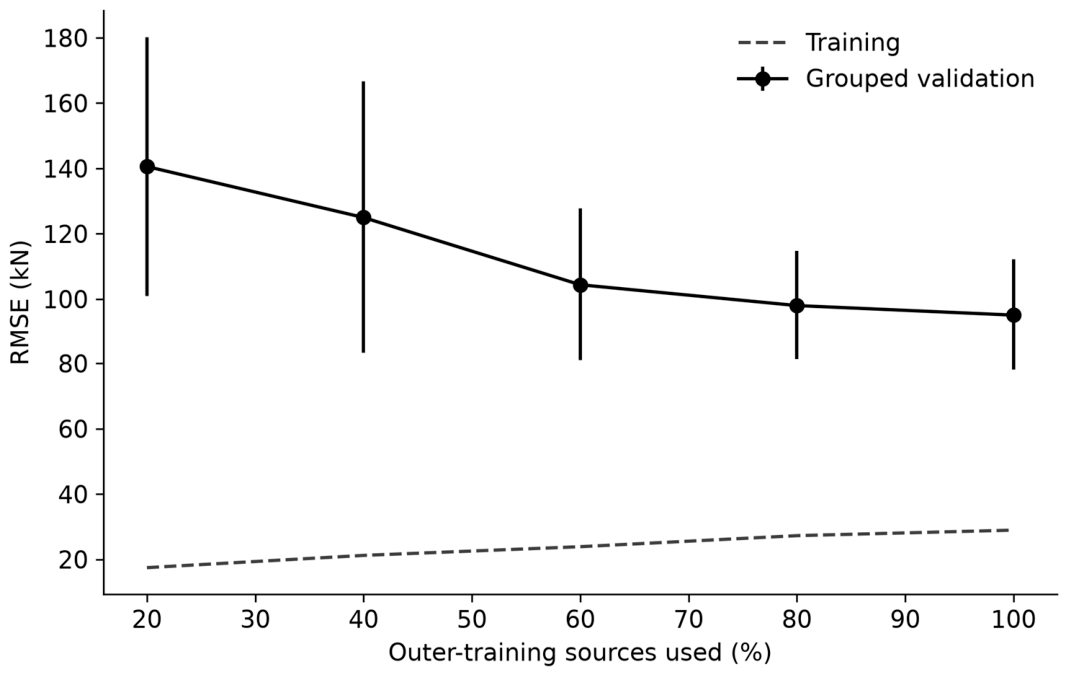
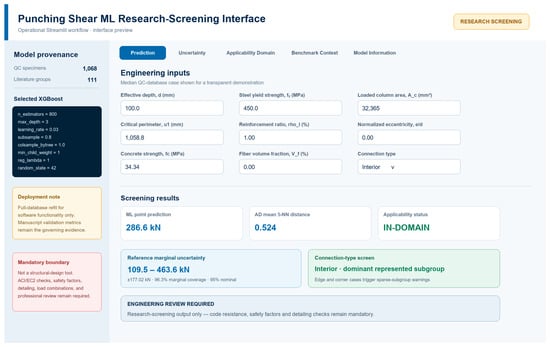


Disclaimer/Publisher’s Note: The statements, opinions and data contained in all publications are solely those of the individual author(s) and contributor(s) and not of MDPI and/or the editor(s). MDPI and/or the editor(s) disclaim responsibility for any injury to people or property resulting from any ideas, methods, instructions or products referred to in the content. |
© 2026 by the authors. Licensee MDPI, Basel, Switzerland. This article is an open access article distributed under the terms and conditions of the Creative Commons Attribution (CC BY) license.