


Highlights
- ATR-FTIR indicates octahedral-like (α-type) Mo6+ environments in CoMoO4 powders classified as β-phase by XRD.
- The nominally β-CoMoO4 powder calcined at 450 °C is the most active sample in the Briggs–Rauscher and voltammetric tests.
- Briggs–Rauscher oscillations discriminate the H2O2 reactivity of the three powders with high mass sensitivity.
- The descriptor Φ = ρα × SBET identifies the most active powder; its limitations are discussed.
- Bulk phase identity alone does not predict peroxidase-mimetic activity in this CoMoO4 series.
Abstract
Whether the bulk crystallographic phase determines the H2O2 reactivity of oxide nanopowders has direct implications for catalyst design. Three glycine–nitrate-derived CoMoO4 nanopowders—as-synthesized, calcined at 450 °C (both β-CoMoO4 by XRD), and calcined at 1000 °C (α-CoMoO4)—were studied by ATR-FTIR spectroscopy, the Briggs–Rauscher (BR) oscillatory reaction, cyclic voltammetry (CV), and electrochemical impedance spectroscopy. Deconvolution of the Mo–O stretching region with a uniform Voigt line shape resolves octahedral (α-type) and tetrahedral (β-type) Mo6+ components in both β-classified powders, indicating short-range coordination heterogeneity not detected by XRD. In the BR reaction (n = 3), the 450 °C powder suppresses oscillations at ≤0.002 g, whereas the as-synthesized powder still oscillates at 0.040 g (slope of the τosc decrease is 5172 ± 406 s g−1), and the bulk-α 1000 °C powder is about four times less active per gram than the as-synthesized powder. CV supports the highest activity of the 450 °C powder. A semi-quantitative descriptor, Φ = ρα × SBET, combining the FTIR α-type band-area fraction with the BET surface area, identifies the most active powder but does not discriminate between the two less active ones. Within this series, bulk phase identity alone does not predict peroxidase-mimetic activity.
1. Introduction
Cobalt molybdate (CoMoO4) has attracted sustained interest across a broad range of technological domains: as a supercapacitor electrode material [1,2,3], a heterogeneous catalyst [4,5], a photocatalyst [6], and a microwave dielectric ceramic [7]. Across applications, the surface chemistry of CoMoO4, rather than its bulk stoichiometry alone, is a key determinant of its functional performance. CoMoO4 is particularly versatile among AMoO4 compounds owing to the coexistence of two complementary properties: the Co2+/Co3+ faradaic redox couple and the Lewis acidity of Mo6+ centres. In the peroxidase-like decomposition of H2O2, Co2+/Co3+ redox cycling is thought to carry the electron-transfer step, while Lewis-acidic Mo6+ centres may facilitate substrate coordination and peroxide activation [8]. Further contributions can arise from oxygen vacancies, which act as adsorption and activation sites for H2O2 and modify the electronic structure of neighbouring metal centres; from surface hydroxylation, which provides Brønsted sites and affects the adsorption of H2O2; and from defects, including undercoordinated Co and Mo at grain boundaries and in poorly crystalline domains [8]. Through these contributions, CoMoO4 behaves as a peroxidase mimic, catalyzing the decomposition of H2O2 in a manner that has been compared with the iron-porphyrin active sites of natural peroxidase enzymes, in which the peroxide is activated through coordination to a Lewis-acidic metal centre [8]. Lewis acid sites on transition-metal oxide surfaces are coordinatively unsaturated metal centres capable of accepting electron pairs from adsorbed nucleophiles [9,10]. On the basis of coordination-chemistry arguments and the prior literature, Mo6+ in octahedral-like coordination, which exposes short, high-bond-order terminal Mo–O bonds, is expected to be more Lewis-acidic and to activate oxidative substrates more readily than Mo6+ in the fully saturated MoO4 tetrahedra of the β-polymorph [8,11]. This expectation was not tested directly in the present study.
CoMoO4 exists in two monoclinic polymorphs that differ fundamentally in their Mo6+ local coordination geometry. In the β-phase (C2/m, ICSD #78328), Mo6+ occupies isolated tetrahedral MoO4 sites (Mo–O ≈ 1.82 Å). In the α-polymorph (C2/m, ICSD #23808), both Co2+ and Mo6+ are octahedrally coordinated: Mo6+ occupies edge-sharing MoO6 octahedra assembled into Mo4O16 tetramers, with Mo–O bond lengths spanning 1.73–2.25 Å, and the unit-cell volume is smaller (≈601 vs. ≈703 Å3) [11,12,13]. Which polymorph is observed at room temperature depends on thermal history, mechanical stress and crystallite size: the β-phase can be retained metastably, particularly in nanocrystalline powders, whereas grinding or pressure favours the α-form [9,14]. For the GNP-derived powders studied here, complete conversion to α-CoMoO4 was observed only after calcination at 1000 °C, above the DTA event at ≈913 °C [6].
Shifting from tetrahedral to octahedral Mo6+ coordination may therefore have surface-chemical consequences. In α-CoMoO4, the distorted MoO6 octahedra expose short terminal Mo–O bonds (≈1.73 Å) at coordinatively unsaturated Mo6+ centres. On structural grounds, it is anticipated that these undersaturated sites carry higher Lewis acidity than the fully saturated MoO4 tetrahedra of β-CoMoO4 [11]; as a consequence, they have been proposed to activate H2O2 more effectively [8]. Kinetic measurements on cobalt–molybdenum oxide surfaces have been reported to be consistent with Lewis acid site density at Mo6+ playing a primary role in controlling oxidative surface reaction rates, with octahedral and tetrahedral coordination environments yielding measurably different activation parameters [15]. Mo6+ coordination geometry, through its expected effect on Lewis acidity, may therefore be regarded as one structural predictor of intrinsic per-site activity (as inferred from coordination-chemistry arguments and the literature cited rather than from direct measurement in the present study). The macroscopic rate per gram, however, is additionally governed by geometric accessibility and may be modulated by Co2+/Co3+ redox chemistry, oxygen vacancies and defect density [8]. On this basis alone, the bulk-α 1000 °C powder would be expected to be the most active peroxidase mimic in this series; the data presented below show that this expectation is not fulfilled.
The starting point for the present study is an earlier characterization of the same three CoMoO4 powders prepared by the glycine–nitrate process (GNP) [6], which established bulk XRD phase identities, FESEM morphology, BET textural parameters, and photocatalytic activity towards crystal violet under UV irradiation. The 1000 °C powder proved to be the most efficient photocatalyst, which was attributed to the ability of its well-crystallized, single-phase α-CoMoO4 structure to suppress bulk charge-carrier recombination rather than to its band gap [6]. Two questions lay outside the scope of that study: (1) whether the nominally single-phase β powders carry any local (short-range) coordination heterogeneity not detected by powder XRD; and (2) how the three powders rank when the performance criterion shifts from photocatalysis to reactivity towards H2O2.
In relation to the first question, there are good mechanistic reasons to expect coordination heterogeneity in GNP-derived products. First, a computational exploration of the CoMoO4 energy landscape has identified eleven structurally distinct polymorphic modifications within a narrow energy window of ≈20 kJ mol−1, all kinetically accessible at the temperatures reached during low-temperature synthesis [16]. The spatially disordered combustion front inherent to the GNP process can simultaneously nucleate and arrest multiple distinct local coordination environments in adjacent sub-micrometre domains, generating local Mo6+ coordination that diverges from what long-range powder XRD reports as a single phase. Similar behaviour has been reported for GNP-derived Co0.9R0.1MoO4 (R = Ho, Yb, Gd) across all calcination temperatures studied [17], suggesting that coordination heterogeneity may be a recurring characteristic of this synthesis route rather than a composition-specific anomaly. To the best of the authors’ knowledge, whether the bulk phase label reliably predicts peroxidase-mimetic reactivity in GNP-derived CoMoO4 and whether local coordination heterogeneity accessible by FTIR correlates with differences in reactivity have yet to be addressed for any binary cobalt–molybdenum oxide system.
To probe the reactivity of the powders towards H2O2 with high sensitivity, we use the Briggs–Rauscher (BR) oscillatory reaction [18,19,20]. In the BR system, H2O2 acts mainly as the reductant that converts iodate and hypoiodous acid to iodide, with O2 evolution, and regenerates Mn2+ from Mn3+ in the radical, autocatalytic HIO2/IO2• pathway [18,20]. Any insoluble surface that heterogeneously decomposes H2O2 therefore withdraws a key reactant from the oscillator and shortens the oscillatory time τosc. The non-linearity of the autocatalytic feedback functions as a chemical amplifier: minor differences in the rate of H2O2 consumption are translated into qualitatively distinct macroscopic outcomes (e.g., shortened reaction time, distorted waveform, or complete oscillation suppression), which makes the BR reaction a highly sensitive kinetic discriminator; the same sensitivity underlies its established use for measuring the activity of antioxidants that scavenge its radical intermediates [21]. It should be noted, however, that dissolved transition-metal species released from the solid surface, including Co2+ ions and Mo-oxo complexes, may also interact with the autocatalytic Mn2+/Mn3+ redox couple and with iodine intermediates, thereby perturbing the oscillatory dynamics through pathways other than H2O2 consumption. This possibility is considered explicitly in the interpretation of the experimental results presented below. The present group previously demonstrated that BR dynamics are able to distinguish structurally similar but catalytically differentiated insoluble oxide materials [22]; here we apply this approach for the first time to a binary cobalt–molybdenum oxide. To ensure that the band-area ratios ρα are comparable, the Mo–O stretching region (≈870–1000 cm−1) of the ATR-FTIR spectra was deconvoluted with the same Voigt line shape for all three samples. Cyclic voltammetry (CV) and electrochemical impedance spectroscopy (EIS) provide complementary electrochemical data on the same three samples.
The central finding of this study, demonstrated for this series of three GNP-derived CoMoO4 samples, is that the 450 °C powder, classified as single-phase β-CoMoO4 by powder XRD, outperforms the bulk-α 1000 °C powder in all kinetic and electrochemical tests. This apparent paradox is partly rationalized by an empirical, semi-quantitative descriptor Φ = ρα × SBET, where ρα is the relative FTIR band-area fraction of α-type (octahedral) Mo–O environments (a coordination-sensitive descriptor rather than a direct measurement of Lewis acidity) and SBET is the BET specific surface area. High-temperature sintering at 1000 °C completes the conversion to octahedral Mo6+ but strongly reduces the porosity and lowers SBET, whereas mild calcination at 450 °C yields the finest, defect-rich crystallites together with the highest α-type band-area fraction in the series, yielding the largest Φ. Φ does not, however, discriminate between the as-synthesized and 1000 °C powders, whose activities differ about fourfold; its limitations are discussed in Section 3.5. The bulk phase label alone is therefore neither necessary nor sufficient to predict peroxidase-mimetic reactivity within this three-sample series. The same powders were previously shown to differ in photocatalytic activity, the 1000 °C powder being the most efficient photocatalyst [6]; the present study addresses a different property, their reactivity towards H2O2.
2. Materials and Methods
2.1. Synthesis
The CoMoO4 nanopowders were prepared according to the glycine nitrate process, as described in detail in ref. [6]. Co(NO3)2·6H2O and (NH4)6Mo7O24·4H2O (Sigma-Aldrich/Merck, Darmstadt, Germany) were all dissolved together using glycine (Fischer Scientific, Waltham, MA, USA) in deionized water at the stoichiometric fuel-to-oxidizer equivalence ratio (φ = 1), following propellant chemistry conventions [23]. The self-propagating combustion reaction produced a highly porous as-synthesized powder. Portions were then calcined in a Nabertherm muffle furnace in static air for 10 min at 450 °C and at 1000 °C. Both temperatures lie above the β-CoMoO4 crystallization event (360–416 °C) [6], and they lie below and above, respectively, the DTA event at ≈913 °C associated with the β → α conversion of these powders [6]; the 450 °C powder therefore remains β-CoMoO4, whereas the 1000 °C powder is fully converted to α-CoMoO4.
2.2. Sample Characterization
FTIR spectroscopy. ATR-FTIR spectra were recorded on a Perkin-Elmer spectrometer equipped with a universal attenuated total reflectance (ATR) accessory over the spectral range 400–4000 cm−1 (20 scans, spectral resolution 4 cm−1); the powders were measured directly in contact with the ATR crystal, without any sample preparation. At the Mo–O stretching frequencies, the evanescent wave penetrates approximately 0.5–2 μm into the sample, so the spectra reflect predominantly the bulk and near-surface region of the particles rather than the outermost surface layer. Because this probing depth greatly exceeds the crystallite size (5–38 nm), the FTIR data describe the local coordination of whole particles rather than of their surface alone. The Mo–O stretching region (≈870–1000 cm−1) was deconvoluted using Voigt (Gaussian–Lorentzian convolution) profiles in area form (PeakFit, “Voigt Area” function); the same line shape was applied to all three samples. The fit itself was performed over the 500–1000 cm−1 window, with the same window and baseline treatment for all samples, and ρα was obtained from the components within the Mo–O stretching region. The Voigt profile was chosen because vibrational bands of solids are broadened both inhomogeneously (Gaussian contribution, from the distribution of local environments) and homogeneously (Lorentzian contribution, from finite phonon lifetimes), so that neither a pure Gaussian nor a pure Lorentzian profile describes them adequately. Within this region, the lower-wavenumber component was assigned to octahedrally coordinated Mo (α-type, να) and the higher-wavenumber component to tetrahedrally coordinated Mo (β-type, νβ) [14,24,25]. The relative α-type band-area fraction was calculated as ρα = A(να)/[A(να) + A(νβ)], using the analytic area of each fitted band as A. For the as-synthesized sample, the β-type envelope was resolved into two components (948.0 and 968.2 cm−1), whose areas were summed. Uncertainties of ρα were propagated from the standard errors of the fitted band areas. Fits started from different initial band positions, widths and heights converged to the same band positions and areas, and the residuals showed no systematic structure. Because the α- and β-type bands lie within ~40 cm−1 of each other, the wavenumber dependence of the ATR penetration depth (dp ∝ 1/ν) changes their area ratio by less than ~5%.
Deconvolution was performed to resolve overlapping tetrahedral (β-type) and octahedral (α-type) Mo–O components that cannot be distinguished by visual inspection of the raw spectra. ρα is a semi-quantitative relative band-area fraction. It is not an absolute phase fraction, because the IR absorption strengths of the two coordination types may differ, and it is not a direct measure of Lewis acid site density. It is used only to compare trends between samples measured under identical conditions, and it forms one factor of the comparative descriptor Φ = ρα × SBET (Section 3.5). The BET surface areas and FESEM images were obtained as described in ref. [6].
Briggs–Rauscher oscillatory reaction. All BR experiments were conducted in a thermostated double-walled glass cell (Metrohm EA 876-20, 25 mL) at 25.0 ± 0.1 °C under continuous stirring at 900 rpm. A Pt working electrode and a Ag/AgCl (3 mol dm−3 KCl) reference electrode recorded the potential–time response. All reagents were analytical grade (Merck). The initial concentrations were as follows: [CH2(COOH)2]0 = 0.0789 mol dm−3, [MnSO4]0 = 0.00752 mol dm−3, [HClO4]0 = 0.03 mol dm−3, [KIO3]0 = 0.0752 mol dm−3, [H2O2]0 = 1.176 mol dm−3. The reagents were added in the following fixed order: (1) CH2(COOH)2, (2) MnSO4, (3) HClO4, and (4) KIO3. All CoMoO4 samples were introduced as a suspension 3 min prior to H2O2 addition, which defined t0 = 0. The oscillatory time τosc was taken as the interval from H2O2 addition to the last observable oscillation. The mass ranges tested were as follows: 0.0103–0.0400 g (as-synthesized), 0.0011–0.0074 g (450 °C), 0.0515–0.1500 g (1000 °C). All BR experiments were performed in triplicate (n = 3) for each catalyst mass. tThe vertical error bars are 95% confidence intervals of τosc calculated from Student’s t-distribution (±5 s), and the horizontal error bars correspond to the uncertainty of the catalyst mass (±0.0001 g). The regression parameters of the calibration lines are given with their standard errors. Because oscillation suppression is a yes/no outcome, the suppression threshold is reported as the mass interval within which suppression occurred in all replicates.
The mechanistic basis for using τosc as a kinetic probe of H2O2-related reactivity lies in the central role of H2O2 in the BR mechanism: H2O2 reduces iodate and hypoiodous acid to iodide and regenerates Mn2+ from Mn3+ in the radical, autocatalytic pathway, so that any solid that heterogeneously decomposes H2O2 withdraws a key reactant from the oscillator and shortens τosc [18,19,20]. The sensitivity of τosc to H2O2 perturbation arises from the non-linearity of the autocatalytic feedback, as established by independent mechanistic and kinetic studies of the BR system [18,20,21]. The application of this framework to discriminate the H2O2 reactivity of insoluble solid oxide materials was previously demonstrated by the present group [22]. It should be noted that dissolved transition-metal species released from the solid surface—including Co2+ ions and Mo-oxo complexes—may also perturb the BR oscillatory dynamics through pathways other than H2O2 consumption. This possibility is considered explicitly in the interpretation of the results in Section 3.3.
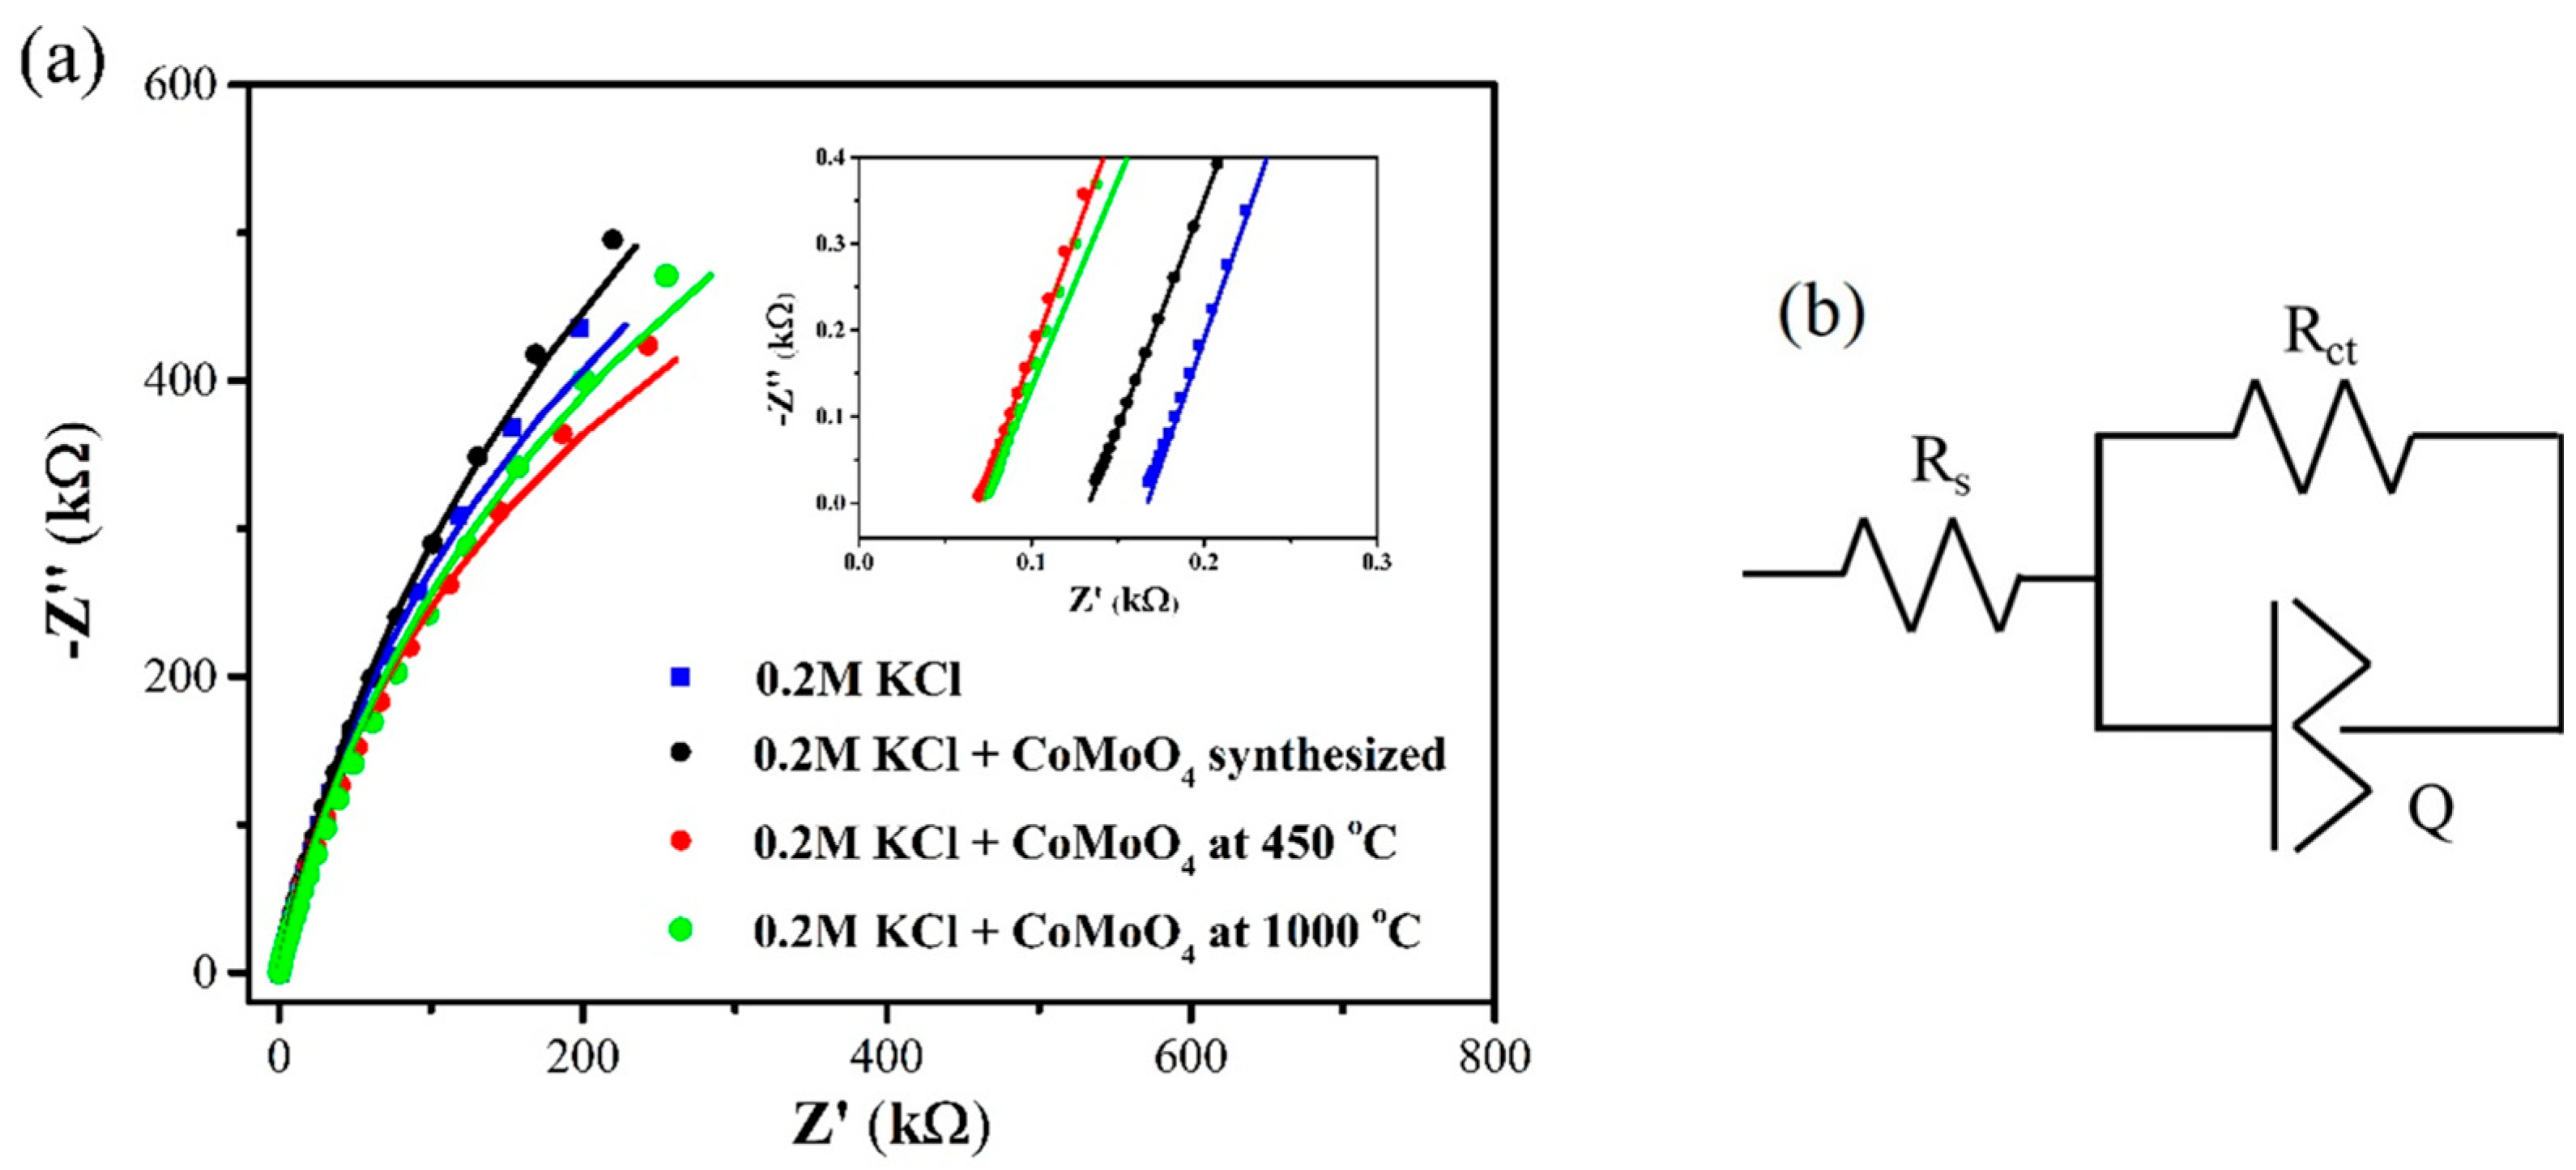
Cyclic voltammetry and EIS. All electrochemical measurements used a three-electrode cell containing a Pt disc working electrode (geometric area 0.07 cm2), a Pt rod counter electrode, and a Ag/AgCl (3 mol dm−3 KCl) reference electrode (+0.210 V vs. NHE), driven by an Autolab PGSTAT302N potentiostat (Metrohm, The Netherlands) under NOVA 2.1. CV was recorded at 50 mV s−1 in four electrolytes (25 mL each; background 0.03 mol dm−3 HClO4): malonic acid (0.0789 mol dm−3), MnSO4 (0.00752 mol dm−3), KIO3 (0.0752 mol dm−3) and H2O2 (1.176 mol dm−3), both with and without 0.02 g of each CoMoO4 sample. The scan-rate-dependent measurements (20–300 mV s−1) were carried out in the H2O2 + HClO4 electrolyte; CV in this electrolyte is the electrochemical measurement performed under reaction-relevant conditions. The EIS was recorded in 0.2 mol dm−3 KCl at an open-circuit potential (100 kHz–10 mHz; 10 mV rms perturbation). In order to characterize the interfacial properties of the electrode–powder suspension in the absence of faradaic reactions from the oscillatory reagents, the EIS measurements were performed in KCl rather than under H2O2 reaction conditions; therefore, the relationship between the derived impedance parameters and peroxidase-mimetic activity is interpreted as correlative rather than mechanistic (see Section 3.4). The Nyquist plots were fitted to the Randles equivalent circuit Rs(Q(Rct)) using the NOVA 2.1 software (Metrohm Autolab, Utrecht, The Netherlands). The effective double-layer capacitance was extracted via the Brug model [26].
3. Results and Discussion
3.1. Bulk Structure, Morphology, and Textural Properties
Powder XRD confirms single-phase β-CoMoO4 (C2/m, ICSD #78328; tetrahedral Mo6+) for the as-synthesized and 450 °C samples and single-phase α-CoMoO4 (C2/m, ICSD #23808; octahedral Mo6+) for the 1000 °C sample (Table 1). The β → α conversion contracts the unit cell from ≈703 to ≈601 Å3 at the DTA endotherm near 913 °C [6], and the lattice parameters agree well with published ICSD data for both phases [6,16].
Table 1.
Bulk structural and textural parameters (XRD, DTA, BET from ref. [6]). D, Scherrer crystallite size; SBET, BET surface area; Eg, optical band gap (Kubelka–Munk).
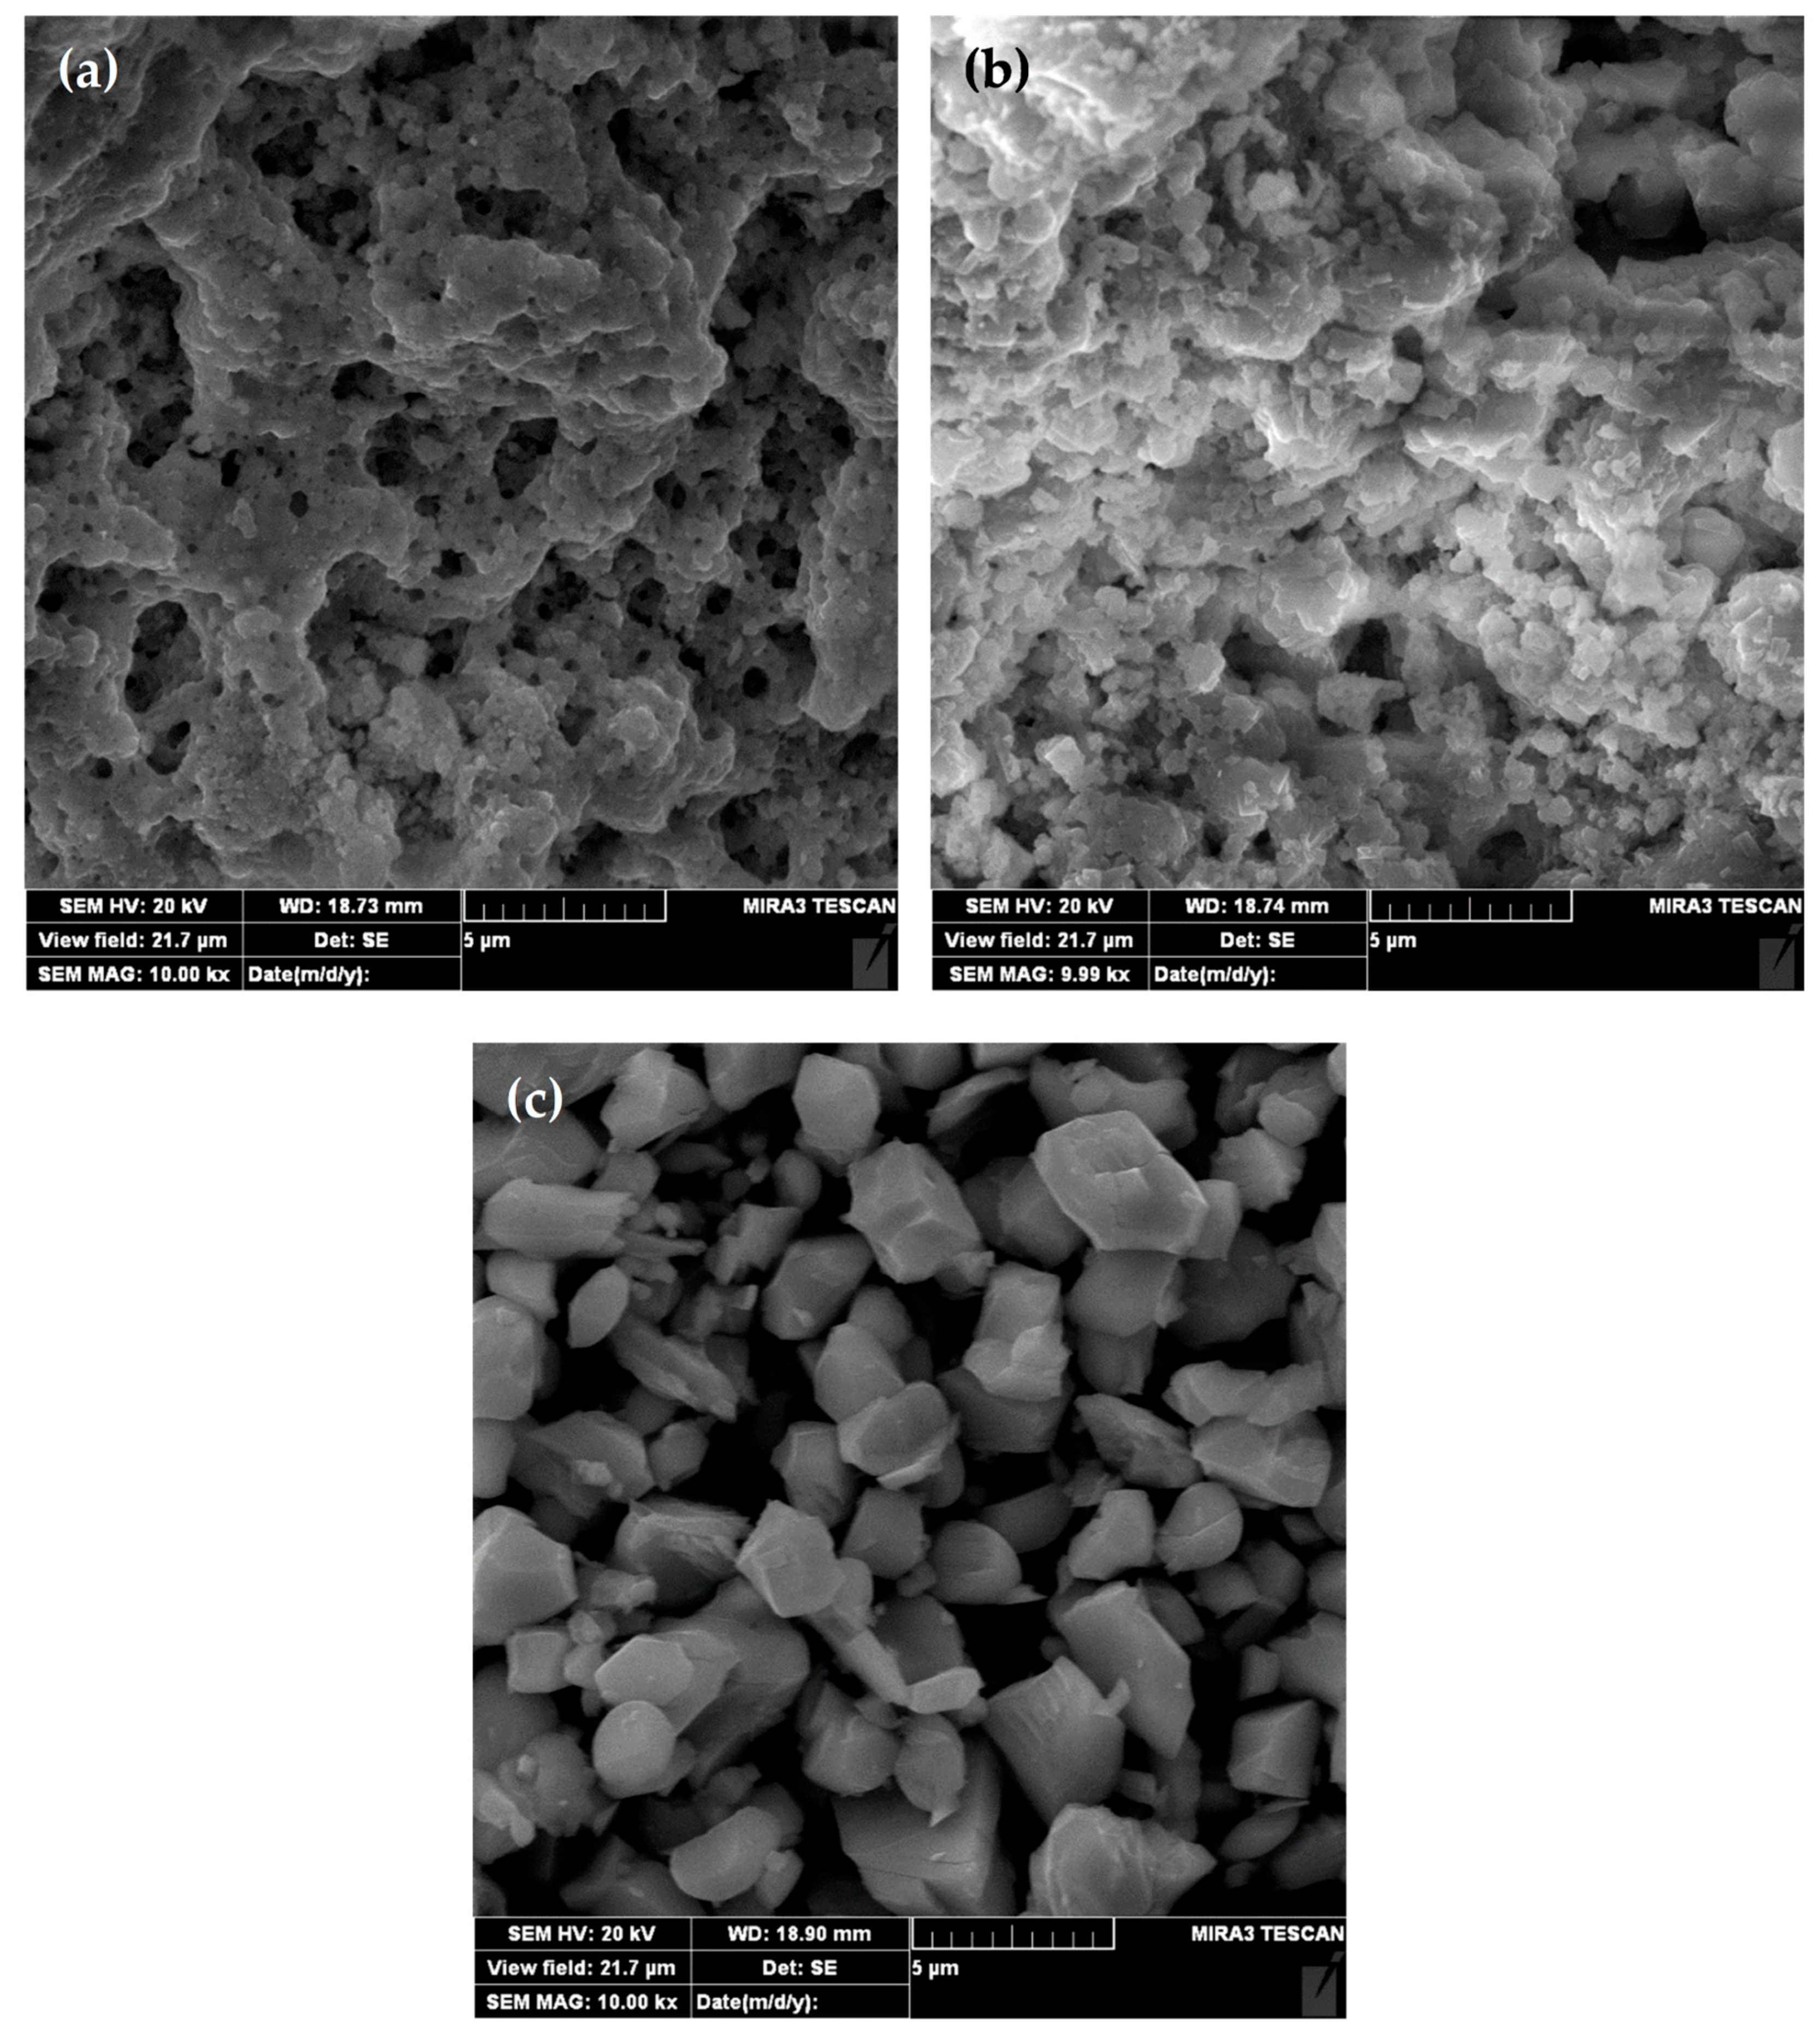
Calcination changes the texture systematically. The BET surface area goes from 22 m2 g−1 (as-synthesized) up to 24 m2 g−1 at 450 °C and then drops to 15 m2 g−1 at 1000 °C, while the crystallite size grows from 5.2 to 38.4 nm [6]. SBET is used here as a measure of the textural surface area; its accessibility to H2O2 under reaction conditions is an assumption. FESEM (Figure 1) shows the corresponding morphological progression: a highly porous sponge-type network for the as-synthesized powder, formed by the large gas volume released during combustion, which also retains residual amorphous and hydroxylated surface phases from the incompletely crystallized combustion product; grape-like agglomerates of fine crystallites with interstitial voids for the 450 °C powder; and well-faceted polyhedral grains for the 1000 °C powder, with no open porosity resolved at FESEM magnification.
Figure 1.
FESEM images of (a) CoMoO4 as-synthesized, (b) CoMoO4 at 450 °C, and (c) CoMoO4 at 1000 °C; scale bar 5 μm.
3.2. FTIR Spectroscopy: Local Coordination Heterogeneity
Infrared spectroscopy is sensitive to the local coordination environment of each Mo6+ centre rather than to long-range crystallographic order, making it the method of choice for detecting local coordination states that bulk XRD does not register. The two CoMoO4 polymorphs differ precisely in their Mo6+ local environment: β-CoMoO4 is built from isolated MoO4 tetrahedra, while α-CoMoO4 contains edge-sharing MoO6 octahedra assembled into Mo4O16 tetramers [11,24]. The two envelopes in the Mo–O stretching region are assigned on the basis of the literature on CoMoO4 [14,24,25] and of our own α-CoMoO4 reference: in the 1000 °C powder, which is single-phase α-CoMoO4 by XRD, 76% of the fitted Mo–O stretching area lies in the lower-wavenumber component (898.6 cm−1). The Hardcastle–Wachs correlation [27] relates the stretching frequency to individual Mo–O bond lengths; because the distorted MoO6 octahedra contain both short terminal (≈1.73 Å) and long (up to ≈2.25 Å) Mo–O bonds, this correlation alone does not order the two envelopes unambiguously and is not used here as the main argument. On this basis, within the Mo–O stretching region, the lower-wavenumber component (≈926–899 cm−1) is assigned to α-type and the higher-wavenumber component (≈968–937 cm−1) to β-type Mo6+ environments (Figure 2, Table 2).
Table 2.
FTIR band positions from Voigt deconvolution of the as-synthesized, 450 °C and 1000 °C CoMoO4 spectra, with their assignments. Assignments follow Rahulan et al. [24], Cherian et al. [25], Costa et al. [12], Rodriguez et al. [13] and Lakhlifi et al. [14]; bond-length considerations follow Hardcastle and Wachs [27].
Both components appear in the as-synthesized powder, which XRD classifies as single-phase β-CoMoO4 [6]: the β-type envelope (948.0 and 968.2 cm−1) arises from terminal Mo=O stretching of isolated MoO4 tetrahedra, and the α-type band at 925.4 cm−1 is attributed to distorted, octahedral-like Mo–O environments, which are not expected in a purely tetrahedral framework [11,24]. The band positions are stable with respect to the starting parameters of the fit. The 450 °C powder shows the same two contributions (925.9 and 964.4 cm−1), but with a much larger relative contribution of the α-type band. The 1000 °C powder, fully converted to α-CoMoO4 according to XRD, is dominated by a broadened α-type band shifted to 898.6 cm−1, accompanied by a weaker higher-wavenumber component at 937.3 cm−1.
These observations are consistent with what the CoMoO4 energy landscape calculation predicts [19]: multiple structural modifications exist within a narrow energy range, and the spatially irregular GNP combustion front can nucleate different local environments in adjacent microdomains. What FTIR detects is the result—a material whose local Mo–O coordination is consistent with the presence of α-like octahedral Mo6+ environments even where the bulk diffraction pattern reads as pure β-CoMoO4. The band-area ratio ρα is used here as a comparative structural descriptor of the as-synthesized and annealed (450 °C and 1000 °C) samples. Changes in ρα may be qualitatively related to changes in the coordination environment of Mo and Co cations; however, ρα is not a direct measure of Lewis acid site density, which would require independent characterization of surface acidity.
Figure 2.
Deconvolution of the 500–1000 cm−1 region of the FTIR spectra of (a) CoMoO4 as-synthesized, (b) CoMoO4 at 450 °C, and (c) CoMoO4 at 1000 °C. Coloured sub-bands are the fitted Voigt components; red envelope, cumulative fit. The same line shape, fitting window and baseline treatment were used for all three spectra.
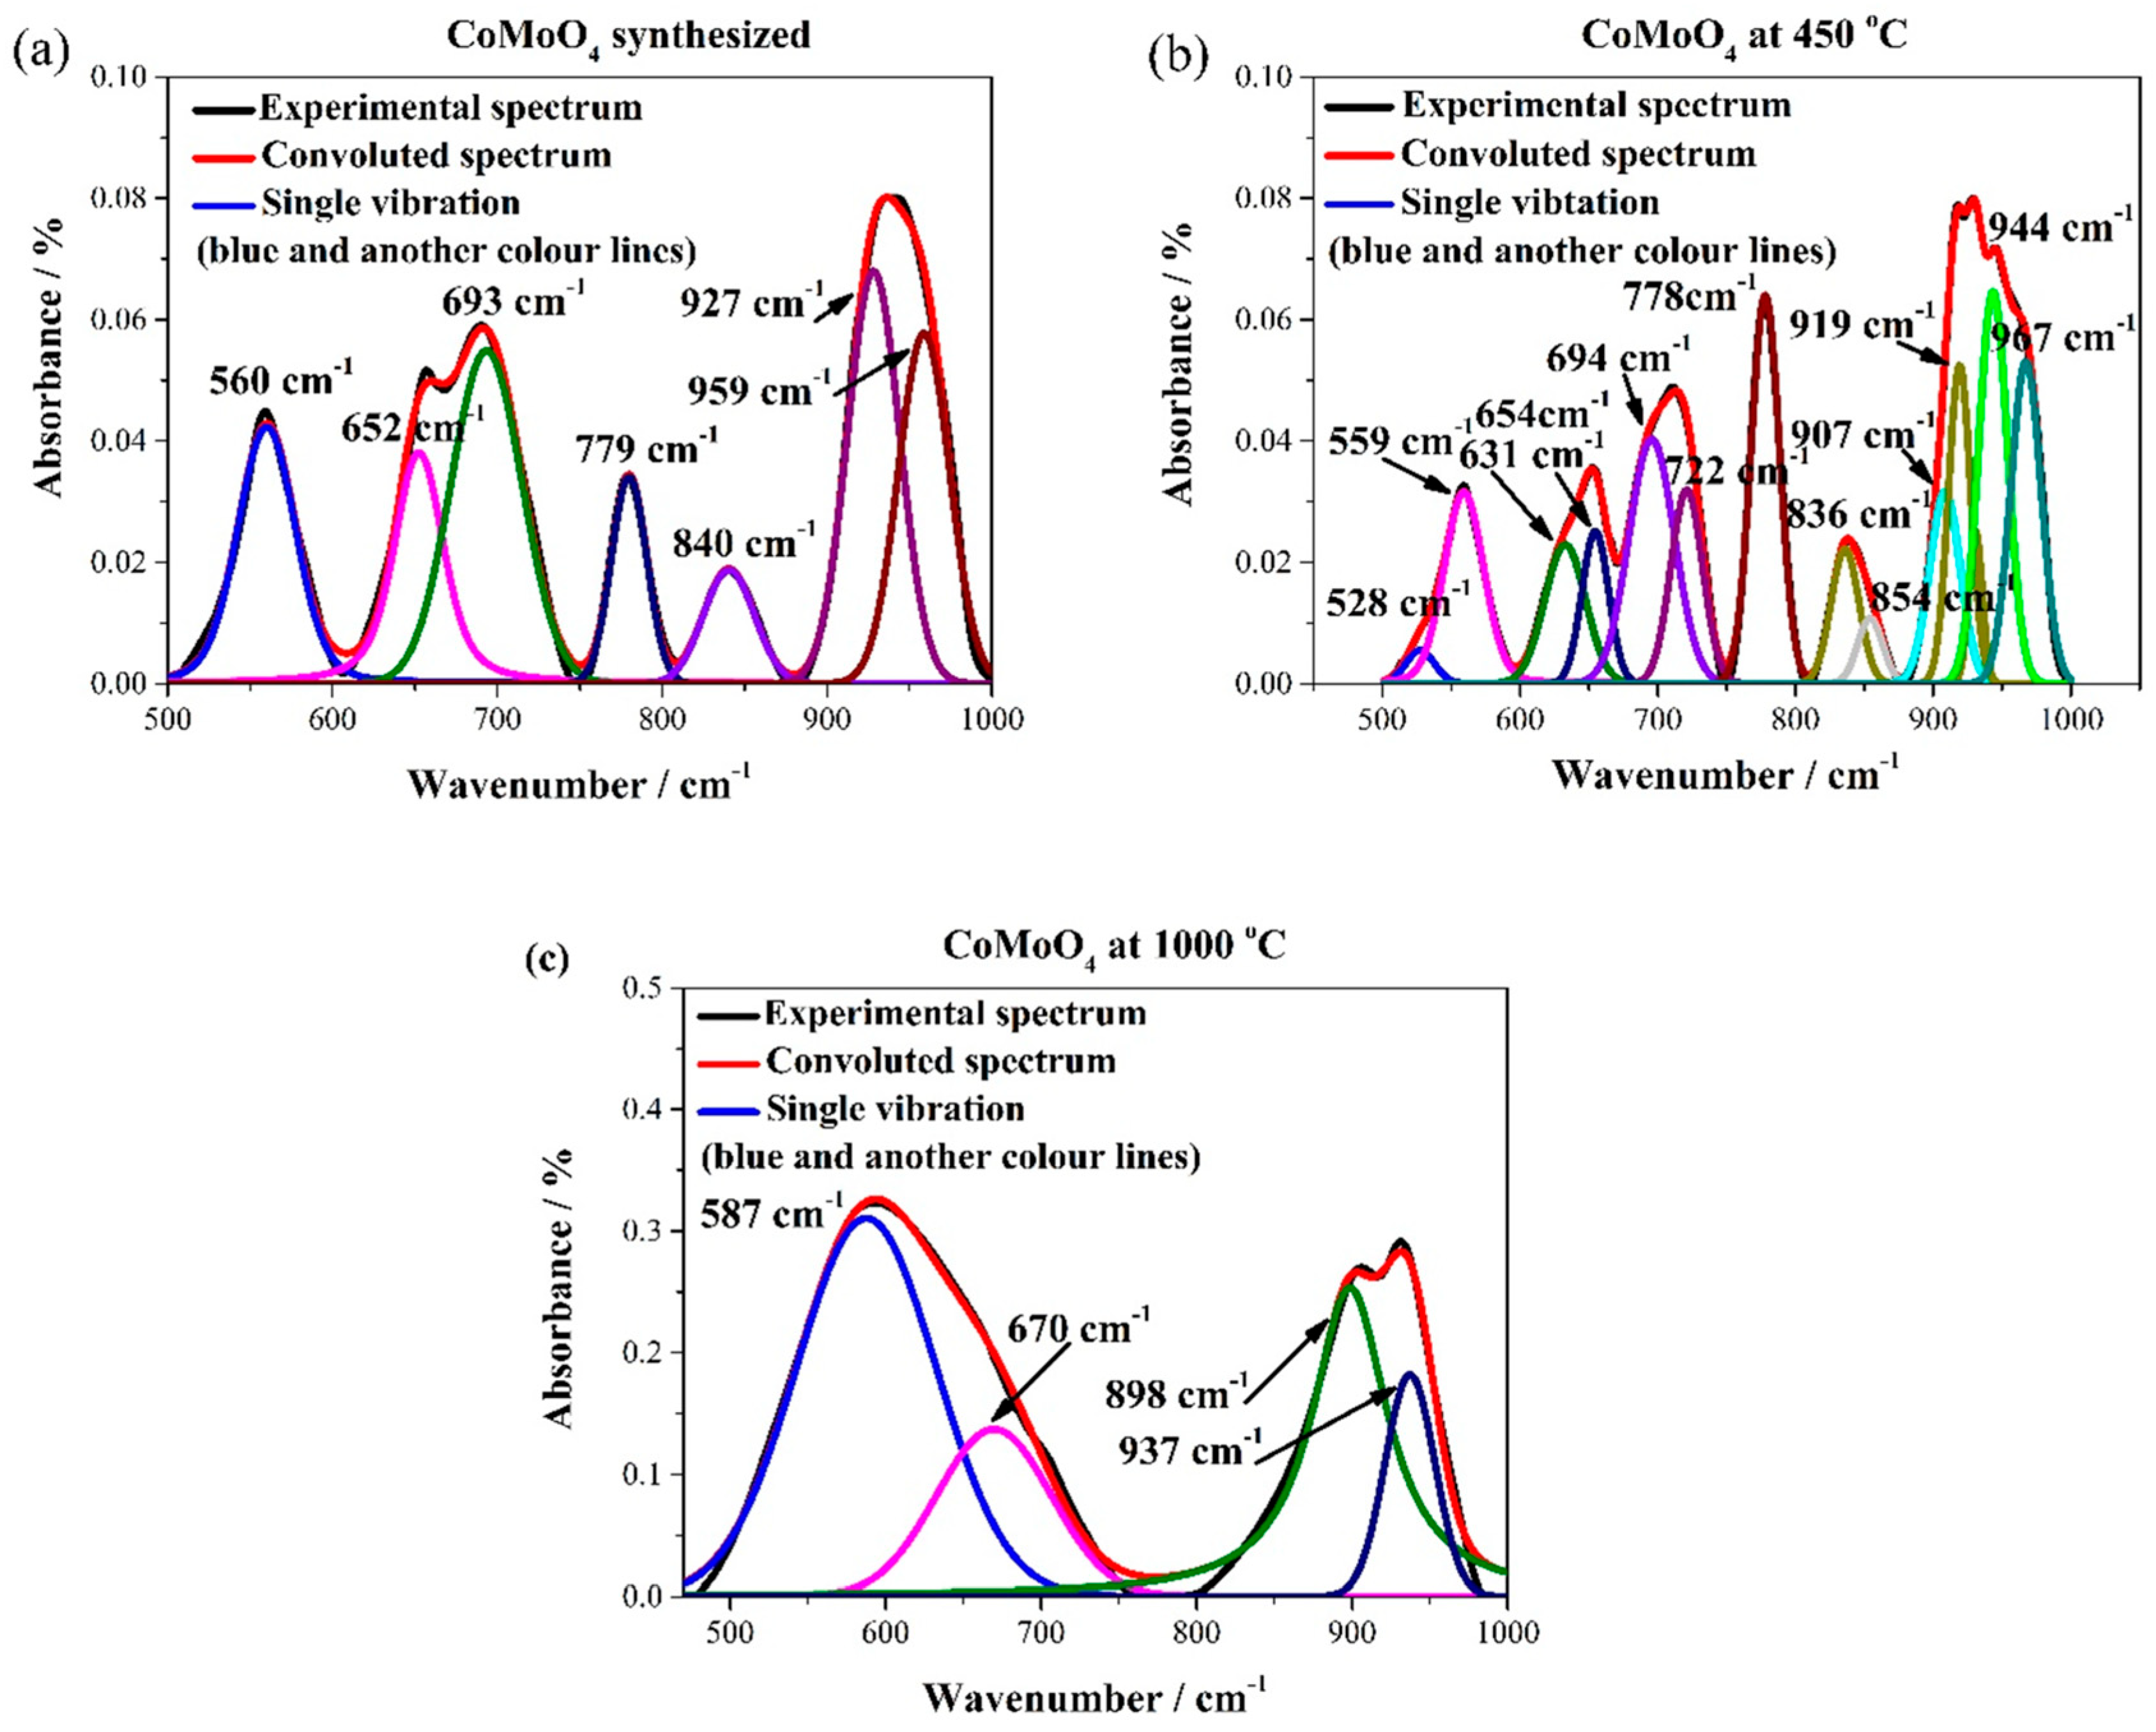
All fits reproduce the experimental spectra well (R2 ≥ 0.9925; Table 3). In the as-synthesized powder, the α- and β-type contributions are comparable (ρα = 0.47 ± 0.25); the large uncertainty arises because three strongly overlapping components (925.4, 948.0 and 968.2 cm−1) must be resolved within a narrow region. After annealing at 450 °C, the α-type band dominates the Mo–O stretching region (ρα = 0.90 ± 0.07), with the β-type band accounting for ≈10% of the Mo–O stretching area. After annealing at 1000 °C, the α-type contribution remains dominant (ρα = 0.76 ± 0.02); the α-type band is shifted to 898.6 cm−1 and broadened, with a pronounced Lorentzian contribution, indicating a change in the local Mo–O environment and/or crystallinity. That ρα does not reach unity even for this sample, which is single-phase α-CoMoO4 by XRD, further shows that ρα is a relative band-area descriptor rather than a phase fraction. Within uncertainty, the ρα values of the as-synthesized and 1000 °C powders cannot be distinguished (they differ by only about 1.2 standard uncertainties); only the 450 °C powder stands out.
Table 3.
Voigt-profile deconvolution of the Mo–O stretching region (≈870–1000 cm−1): band positions of the α-type and β-type components (να, νβ), analytic band areas A(α) and A(β) (a.u.), relative α-type band-area fraction ρα = A(α)/[A(α) + A(β)] (± uncertainty propagated from the fitted-area standard errors), BET surface area SBET [6], comparative descriptor Φ = ρα × SBET, and coefficient of determination of the fit R2. All spectra were fitted with the same Voigt line shape.
The high ρα obtained for the 450 °C powder, which is single-phase β-CoMoO4 by XRD, must be interpreted with caution. Band-area fractions are not phase fractions, and the ≈926 cm−1 band may also contain contributions from distorted or defective Mo–O environments and from poorly crystalline molybdate domains below the XRD detection limit. ρα therefore indicates only the relative contribution of octahedral-type Mo–O environments within this series. It should also be noted that the α-type component of the two β-classified powders (925–926 cm−1) lies about 27 cm−1 above that of α-CoMoO4 (898.6 cm−1); it therefore cannot be identified with crystalline α-CoMoO4, and a contribution from modes intrinsic to the β-CoMoO4 lattice cannot be excluded. Combined with the BET surface area, it gives Φ = 21.5 ± 1.7 m2 g−1 for the 450 °C powder, which has both the highest ρα and the largest SBET (24 m2 g−1). At 1000 °C, the lower ρα and the reduced surface area (15 m2 g−1) give Φ = 11.4 ± 0.3 m2 g−1, which is indistinguishable within uncertainty from that of the as-synthesized powder (10.3 ± 5.5 m2 g−1).
3.3. Briggs–Rauscher Oscillatory Reaction: A Quantitative Kinetic Probe
An autocatalytic iodine feedback loop sustains the BR oscillatory reaction [16,17]: H2O2 acts mainly as the reductant that converts iodate and hypoiodous acid to iodide and regenerates Mn2+ from Mn3+ in the radical, autocatalytic pathway [18,20]. The Pt electrode monitors the overall oscillatory redox potential, cycling between ∼790 mV (I2-dominated oxidized state) and ∼690 mV (I−-dominated reduced state) [22]. Any solid surface that decomposes H2O2 withdraws this reactant from the oscillator and shortens τosc. CoMoO4 has been proposed to act as a peroxidase mimic via Co2+/Co3+ redox cycling facilitated by surface Mo6+ sites that, in octahedral-like coordination, are expected to exhibit Lewis-acidic character [8]. The non-linearity of the BR feedback amplifies differences in the H2O2 consumption rate into qualitatively distinct macroscopic outcomes, making it an unusually sensitive kinetic probe of reactivity towards H2O2. A contribution of dissolved species to the BR response cannot be completely excluded (Section 2.2).
3.3.1. CoMoO4 As-Synthesized: Linear Mass Dependence and Gravimetric Calibration
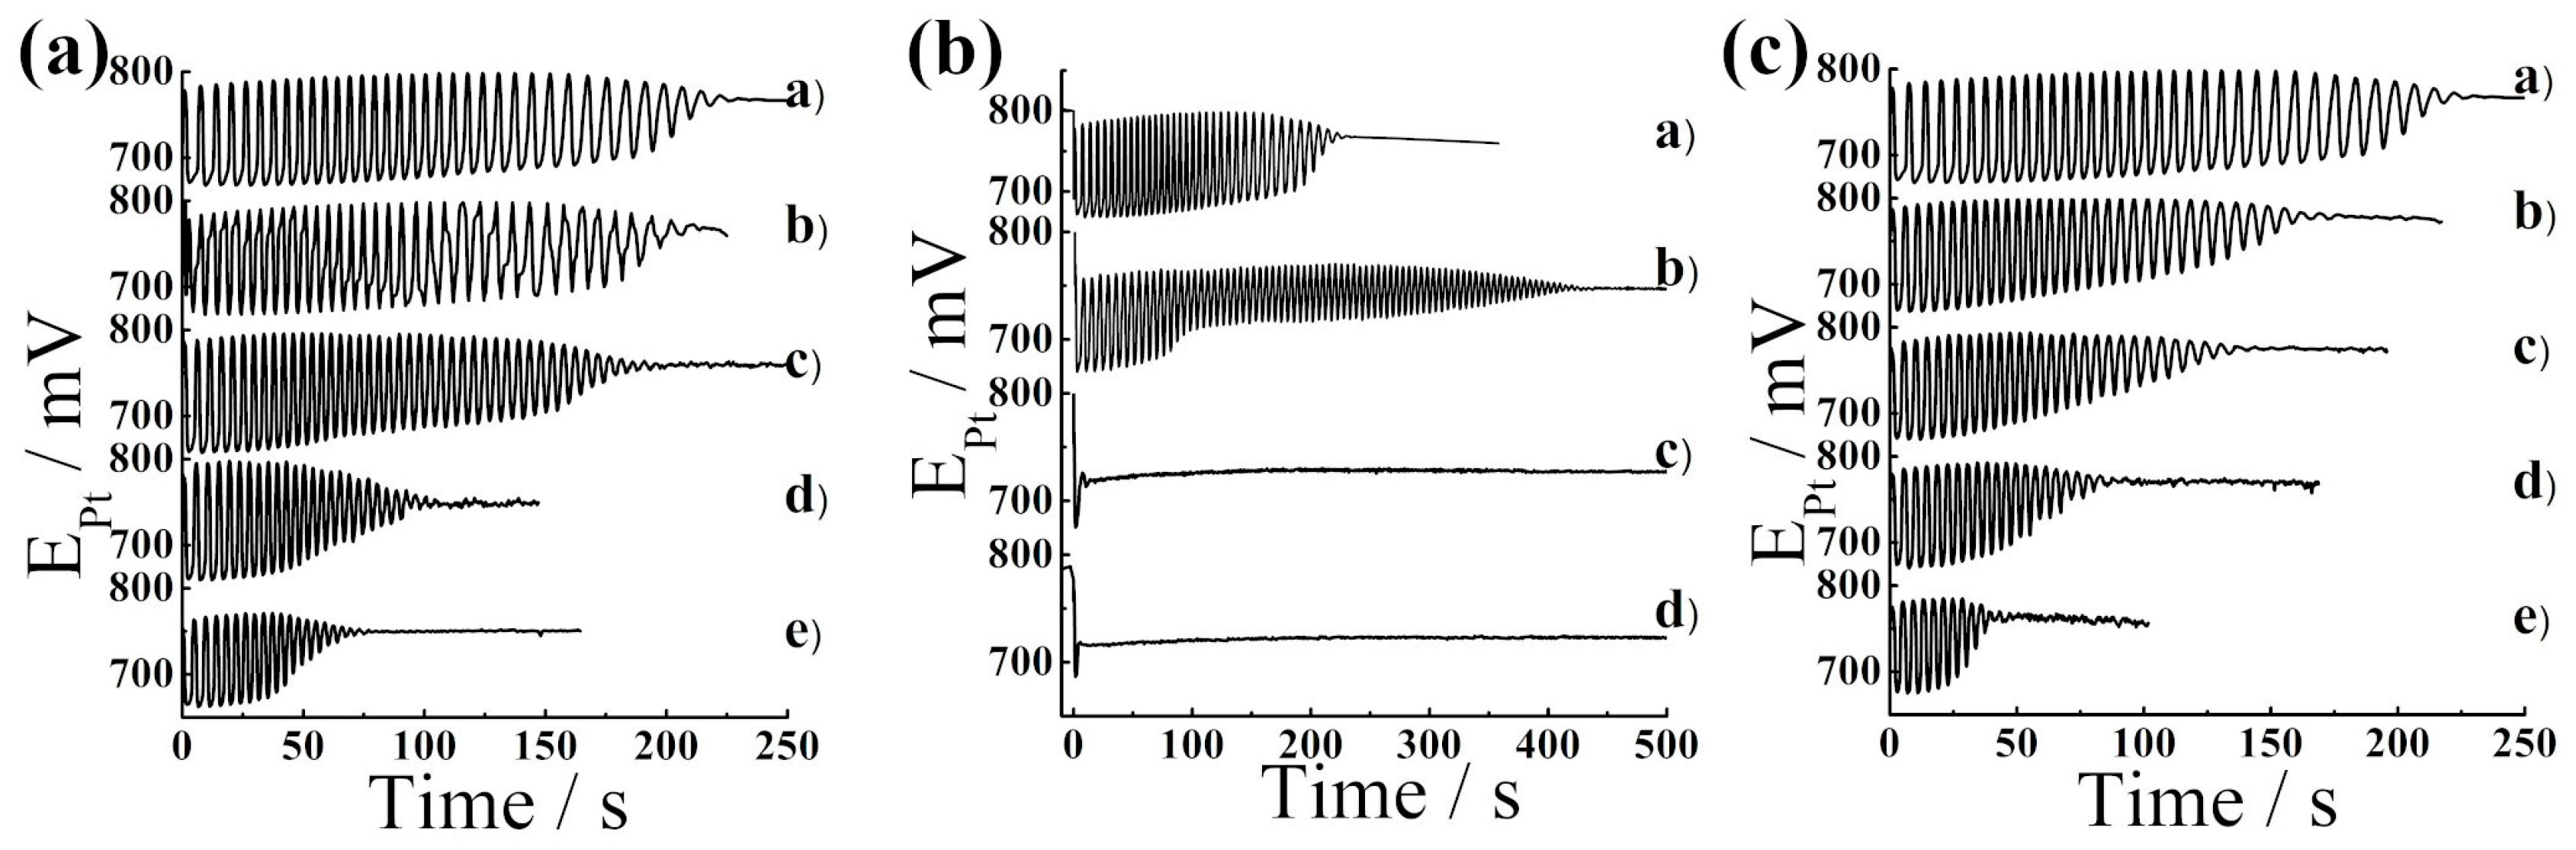
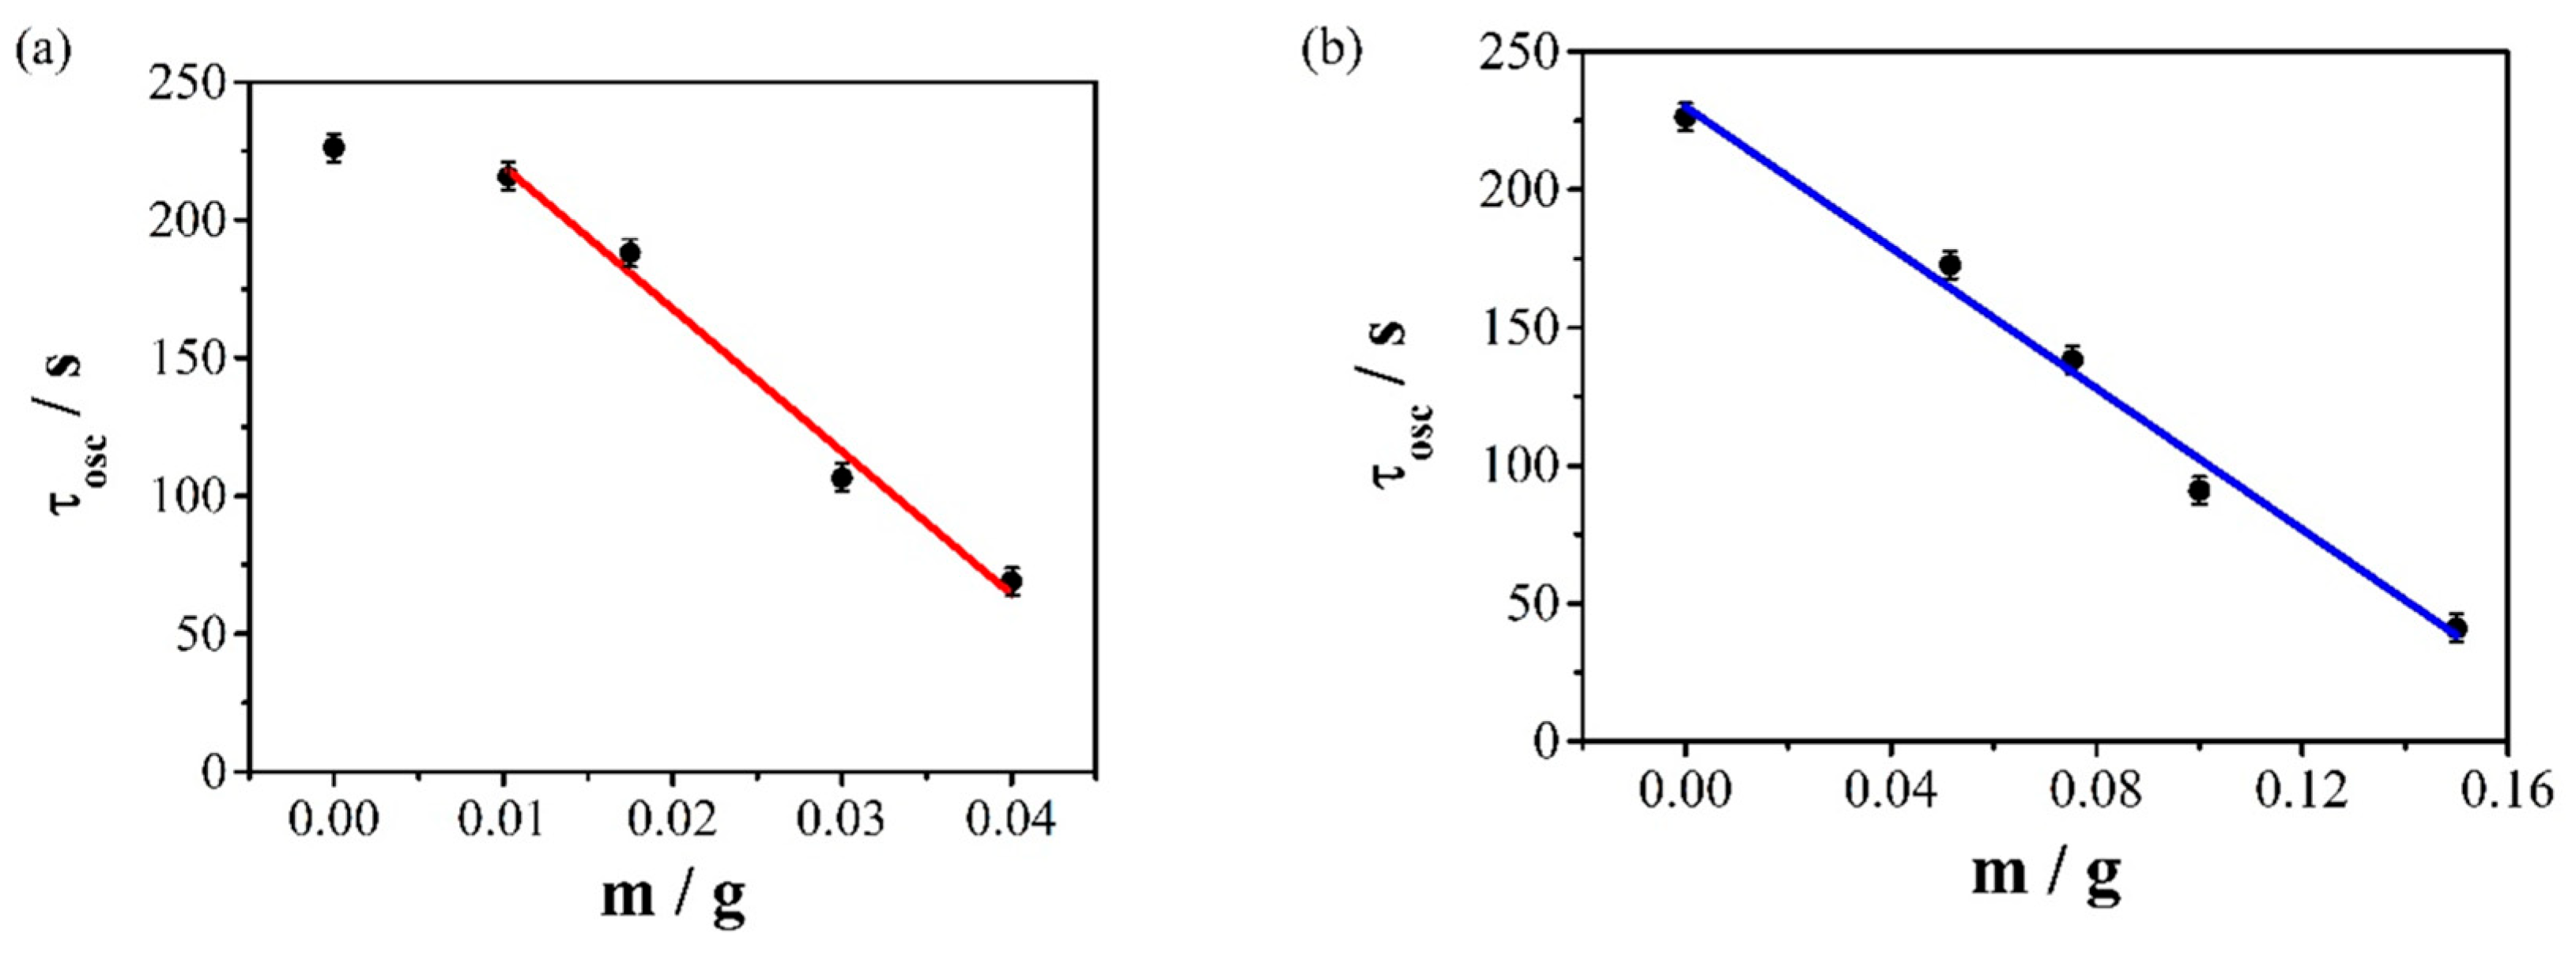
BR oscillograms for the blank (trace a) and CoMoO4 as-synthesized at 0.0103 g (b), 0.0175 g (c), 0.0300 g (d), and 0.0400 g (e) are shown in Figure 3a. The blank shows regular oscillations (∼100 mV amplitude; τosc ≈ 250 s). Addition of CoMoO4 as-synthesized reduces τosc monotonically while fully preserving oscillogram morphology: amplitude and waveform shape remain unchanged at all masses, which is consistent with a perturbation that mainly shortens the oscillatory regime without a marked change in iodine speciation. For each experimental point, three replicate measurements of τosc were performed, and the uncertainty of τosc was determined using Student’s t-distribution at a 95% confidence level. Figure 4a presents the dependence of τosc on mass, together with the corresponding error bars. The mass dependence is linear (Figure 4a):
where τosc is in seconds and m is mass in grams; the uncertainties are standard errors of the regression parameters. Linearity over 0.01–0.04 g is consistent with a constant mass-specific effect across this mass range. Equation (1) simultaneously provides a gravimetric analytical calibration function with a sensitivity of 5172 ± 406 s g−1.
τosc = (271.3 ± 10.9) − (5172 ± 406) × m [adj. R2 = 0.982]
Figure 3.
(a) Potential–time oscillograms (EPt vs. Ag/AgCl) for the BR reaction without CoMoO4 as-synthesized (a) and with 0.0103 g (b), 0.0175 g (c), 0.0300 g (d), and 0.0400 g (e). T = 25.0 °C, 900 rpm. The preserved oscillogram morphology is consistent with a perturbation that mainly shortens the oscillatory regime; (b) BR oscillograms without CoMoO4 at 450 °C (a) and with 0.0011 g (b), 0.0020 g (c), and 0.0074 g (d). Trace (b): extension of τosc with compressed amplitude, attributed to the non-linear response of the oscillator to the added solid (see text). Traces (c) and (d): complete oscillation suppression. The suppression threshold (0.0011–0.0020 g, n = 3) is at least 20-fold lower than for CoMoO4 as-synthesized; (c) BR oscillograms without CoMoO4 at 1000 °C (a) and with 0.0515 g (b), 0.0753 g (c), 0.1000 g (d), and 0.1500 g (e). T = 25.0 °C. Qualitatively analogous to CoMoO4 as-synthesized but requiring ≈4× more mass, consistent with its smaller textural surface area and strongly reduced porosity.
3.3.2. CoMoO4 at 450 °C: Complete Oscillation Suppression at Milligram Loading
CoMoO4 at 450 °C produces qualitatively and quantitatively distinct BR behaviour (Figure 3b), which constitutes the most striking kinetic result in this study. At 0.0011 g (trace b), τosc is extended to ∼350 s instead of being shortened, oscillatory amplitude is compressed to ∼30 mV centred near 745 mV, and the waveform becomes irregular and asymmetric. This counterintuitive behaviour is a consequence of the non-linear nature of the BR oscillatory system combined with specific properties of the material itself. A synergistic effect may also play a role: in non-linear systems, even small perturbations can shift the system in phase space, and the response to an added heterogeneous (insoluble) material is therefore not a simple sum of the individual contributions. We have previously observed comparable behaviour with clay minerals [28], and in that case, the effect likewise could not be attributed solely to the leaching of ions into the reaction mixture. A possible contribution from Co and Mo ions leached from the powder cannot be completely excluded; however, because the three samples have the same chemical composition but affect the oscillator very differently, their structural and surface characteristics are supposed to be the dominant factor. It should be emphasized that this interpretation is proposed as a working hypothesis pending direct characterization of solution speciation. The amplitude compression and waveform distortion in this work confirm a substantial mechanistic perturbation even at this low mass (1.1 mg) of CoMoO4 at 450 °C.
At 0.0020 g (trace c) and 0.0074 g (trace d), oscillations are completely suppressed: EPt drops to ≈720 mV within seconds of H2O2 addition, indicating that the H2O2 concentration has decreased substantially, most likely below the level required to sustain the oscillatory regime. However, the potential alone does not allow for a definitive conclusion regarding the complete consumption of H2O2. The suppression threshold of CoMoO4 at 450 °C lies between 0.0011 and 0.0020 g in all three replicates, at least 20-fold lower than the mass at which CoMoO4 as-synthesized remains oscillatory (0.040 g). Since both samples share identical elemental composition, this gap most likely originates in structural, morphological and surface differences. We attribute it to three factors acting together in CoMoO4 at 450 °C: (i) the largest textural surface area per gram in the series (SBET = 24 vs. 22 m2 g−1 for CoMoO4 as-synthesized, a modest 9% difference); (ii) the smallest crystallite size in the series (D = 5.2 nm, Table 1), with the crystallites assembled into grape-like agglomerates with interstitial voids (Figure 1b), which exposes a high density of crystallite edges and grain boundaries to the reaction medium;; and (iii) the highest relative contribution of octahedral-type Mo–O environments in the series (ρα = 0.90 ± 0.07; Section 3.2), which, on structural grounds, may provide more reactive Mo6+ sites than the tetrahedral Mo6+ of the β-CoMoO4 bulk. Factor (i) alone cannot explain the >20-fold reactivity difference, because the surface area gap is far too small. The combination of fine crystallite morphology and local Mo coordination is the most plausible explanation within this series, although contributions from factors not measured here (Co2+/Co3+ redox chemistry, oxygen vacancies, surface hydroxylation) and from leached ions cannot be completely excluded.
3.3.3. CoMoO4 at 1000 °C: Moderate Reactivity Despite Bulk α-CoMoO4 Phase
CoMoO4 at 1000 °C shows progressive, morphologically smooth τosc reduction without oscillation suppression over 0.0515–0.1500 g (Figure 3c and Figure 4b):
The slope ratio (CoMoO4 as-synthesized)/(CoMoO4 at 1000 °C) = 5172/1278 = 4.05 ± 0.41: CoMoO4 as-synthesized is approximately four times more active per gram than CoMoO4 at 1000 °C; the difference between the two slopes is about nine times its combined standard error. This ordering is initially surprising, because CoMoO4 at 1000 °C is bulk α-CoMoO4 with octahedral Mo6+ centres expected, on structural grounds, to be more Lewis-acidic, while CoMoO4 as-synthesized is bulk β-CoMoO4 with tetrahedral Mo6+. Two factors are likely to contribute. First, CoMoO4 at 1000 °C has a 32% lower BET surface area (15 vs. 22 m2 g−1) and hence a smaller textural surface area per gram. Second, its smooth morphology with strongly reduced porosity (Figure 1c) is likely to restrict substrate access to whatever surface α-CoMoO4 sites are present. The macroscopic rate per gram is therefore determined by the product of intrinsic per-site activity and geometric accessibility, and for CoMoO4 at 1000 °C, the latter appears to be restricted by calcination to such an extent that any advantage in per-site activity expected for bulk α-CoMoO4 is more than offset. This motivates the Φ = ρα × SBET descriptor discussed in Section 3.5.
τosc = (230.1 ± 7.3) − (1278 ± 80) × m [adj. R2 > 0.98]
Figure 4.
(a) Oscillatory time τosc vs. mass of CoMoO4 as-synthesized; solid line: linear fit, Equation (1), adj. R2 = 0.982. (b) τosc vs. mass of CoMoO4 at 1000 °C; solid line: linear fit, Equation (2), adj. R2 > 0.98. Points are means of three measurements (n = 3); vertical error bars are 95% confidence intervals (Student’s t-distribution) and horizontal error bars the uncertainty of the catalyst mass (±0.0001 g). The slope for the as-synthesized powder is 4.05 ± 0.41 times that for the 1000 °C powder.
3.4. Cyclic Voltammetry and Electrochemical Impedance Spectroscopy
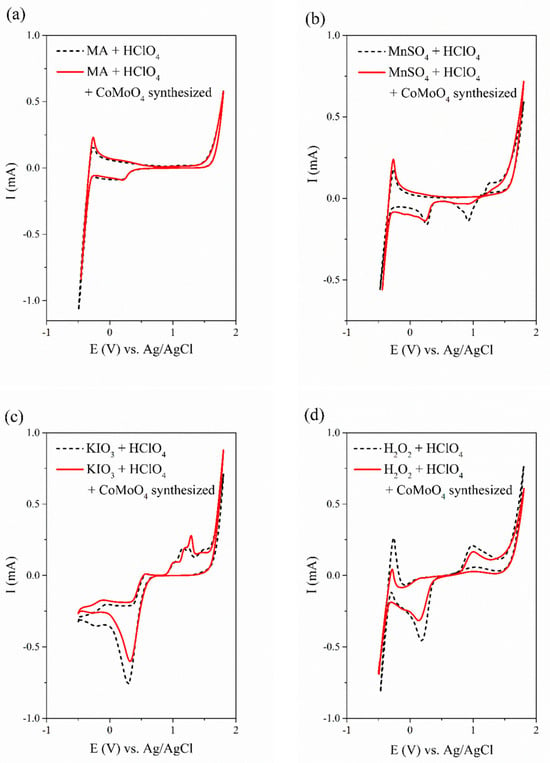
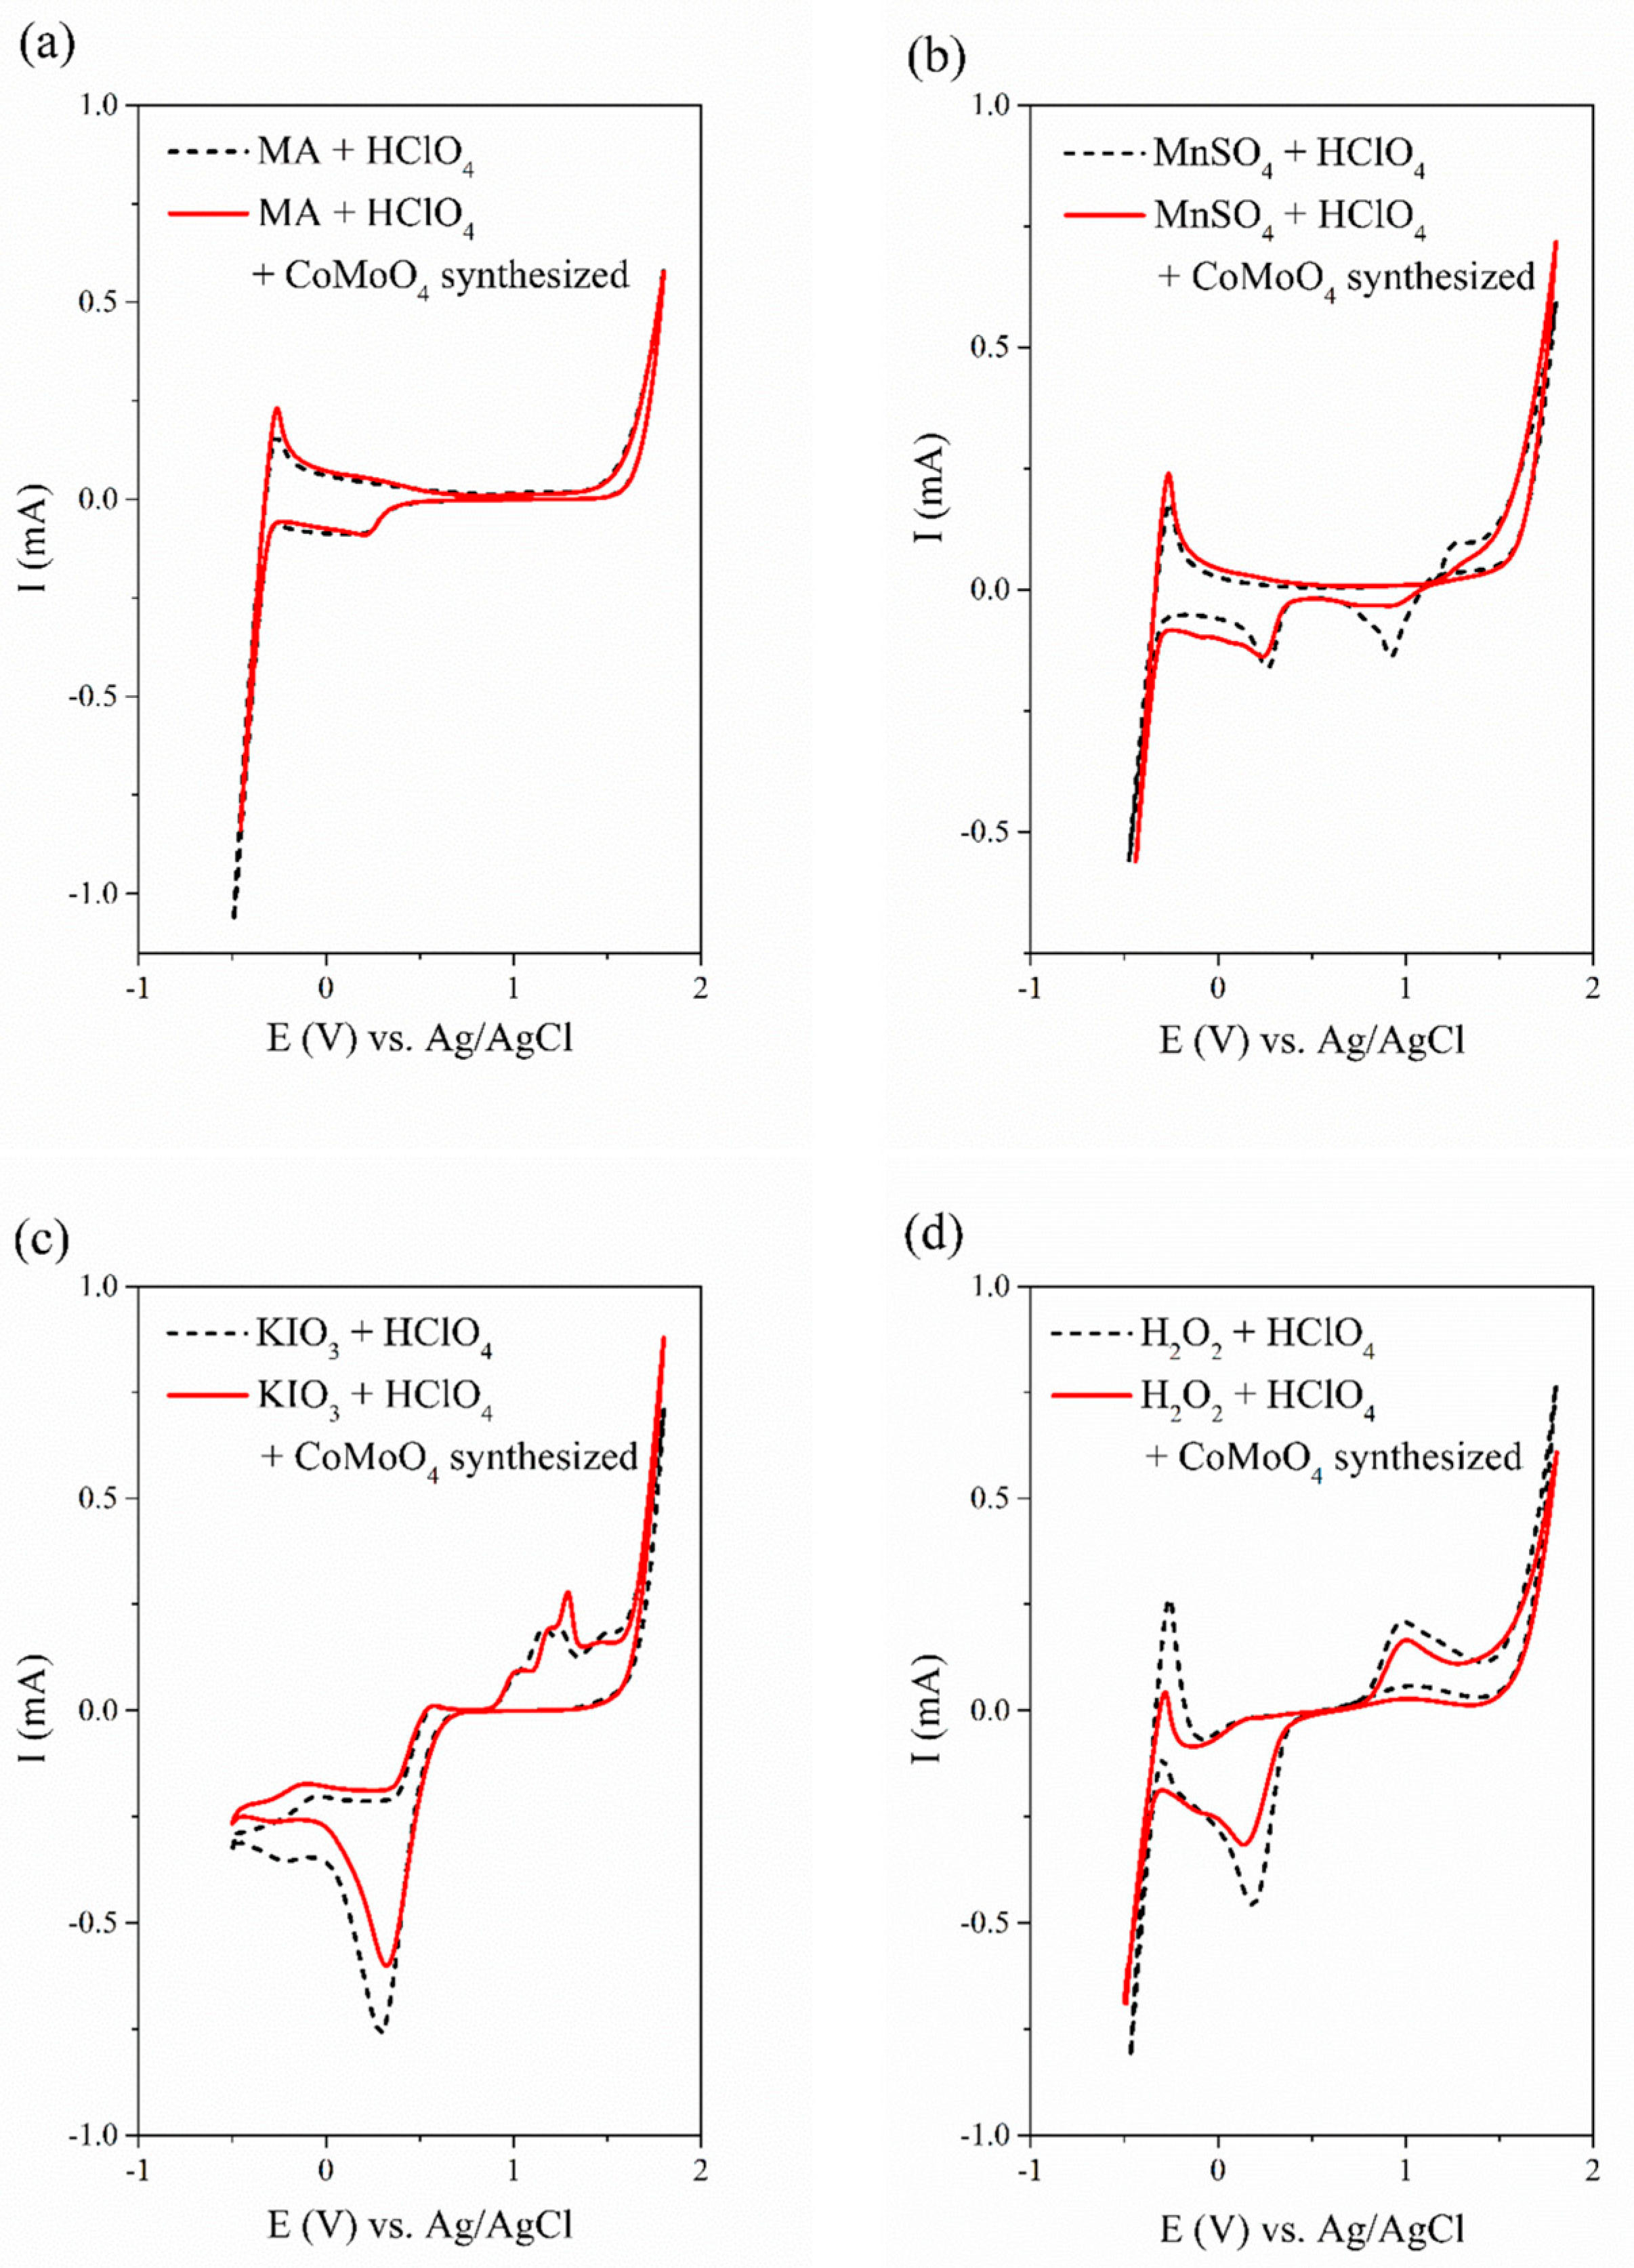
The cyclic voltammograms recorded for the investigated set of electrolytes, with and without added samples of synthesized CoMoO4, are presented in Figure 5a–d. A clear difference in the voltammetric response was observed in the MnSO4- and H2O2-containing electrolytes for the as-synthesized CoMoO4 and the CoMoO4 at 450 °C samples (Figure 5; for CoMoO4 at 450 °C, see also Figure S1a–d), whereas the CoMoO4 at 1000 °C sample (Figure S2a–d) produced only a minor perturbation, confined to the H2O2-containing system.
Figure 5.
Cyclic voltammograms recorded in the (a) MA–HClO4; (b) MnSO4–HClO4; (c) KIO3–HClO4, and (d) H2O2–HClO4 electrolytes without (dashed) and with (solid) the added synthesized CoMoO4 powders.
The close similarity of the response between CoMoO4 as-synthesized and CoMoO4 at 450 °C is consistent with their shared bulk β-CoMoO4 structure and comparable surface areas, although the two powders differ markedly in the BR test (Section 3.3). Phase-dependent differences in the interaction of CoMoO4 polymorphs with oxygen-containing molecules such as water and H2O2 have been reported previously [29]: preferential interaction of water with α-CoMoO4 has been ascribed to electronically less dense surface regions that favour binding of oxygen, while the deficiency in oxygen atoms on specific crystallographic planes explains the preferential interaction of certain CoMoO4 surfaces with H2O2 [29].
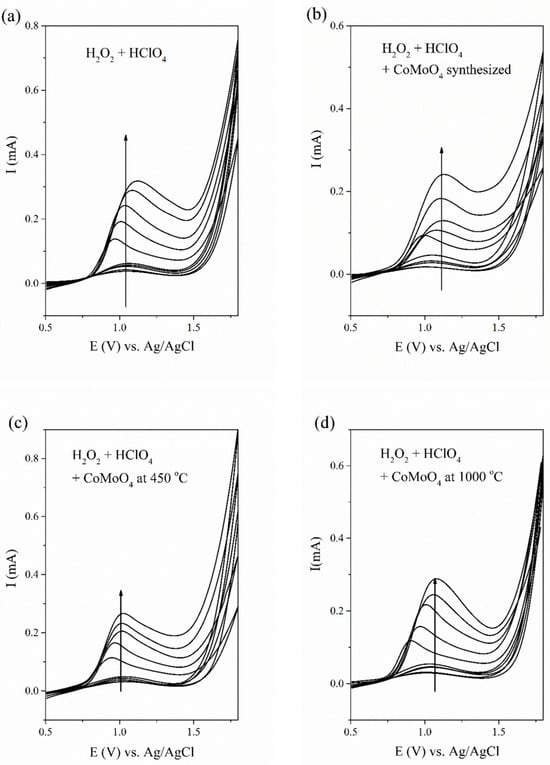
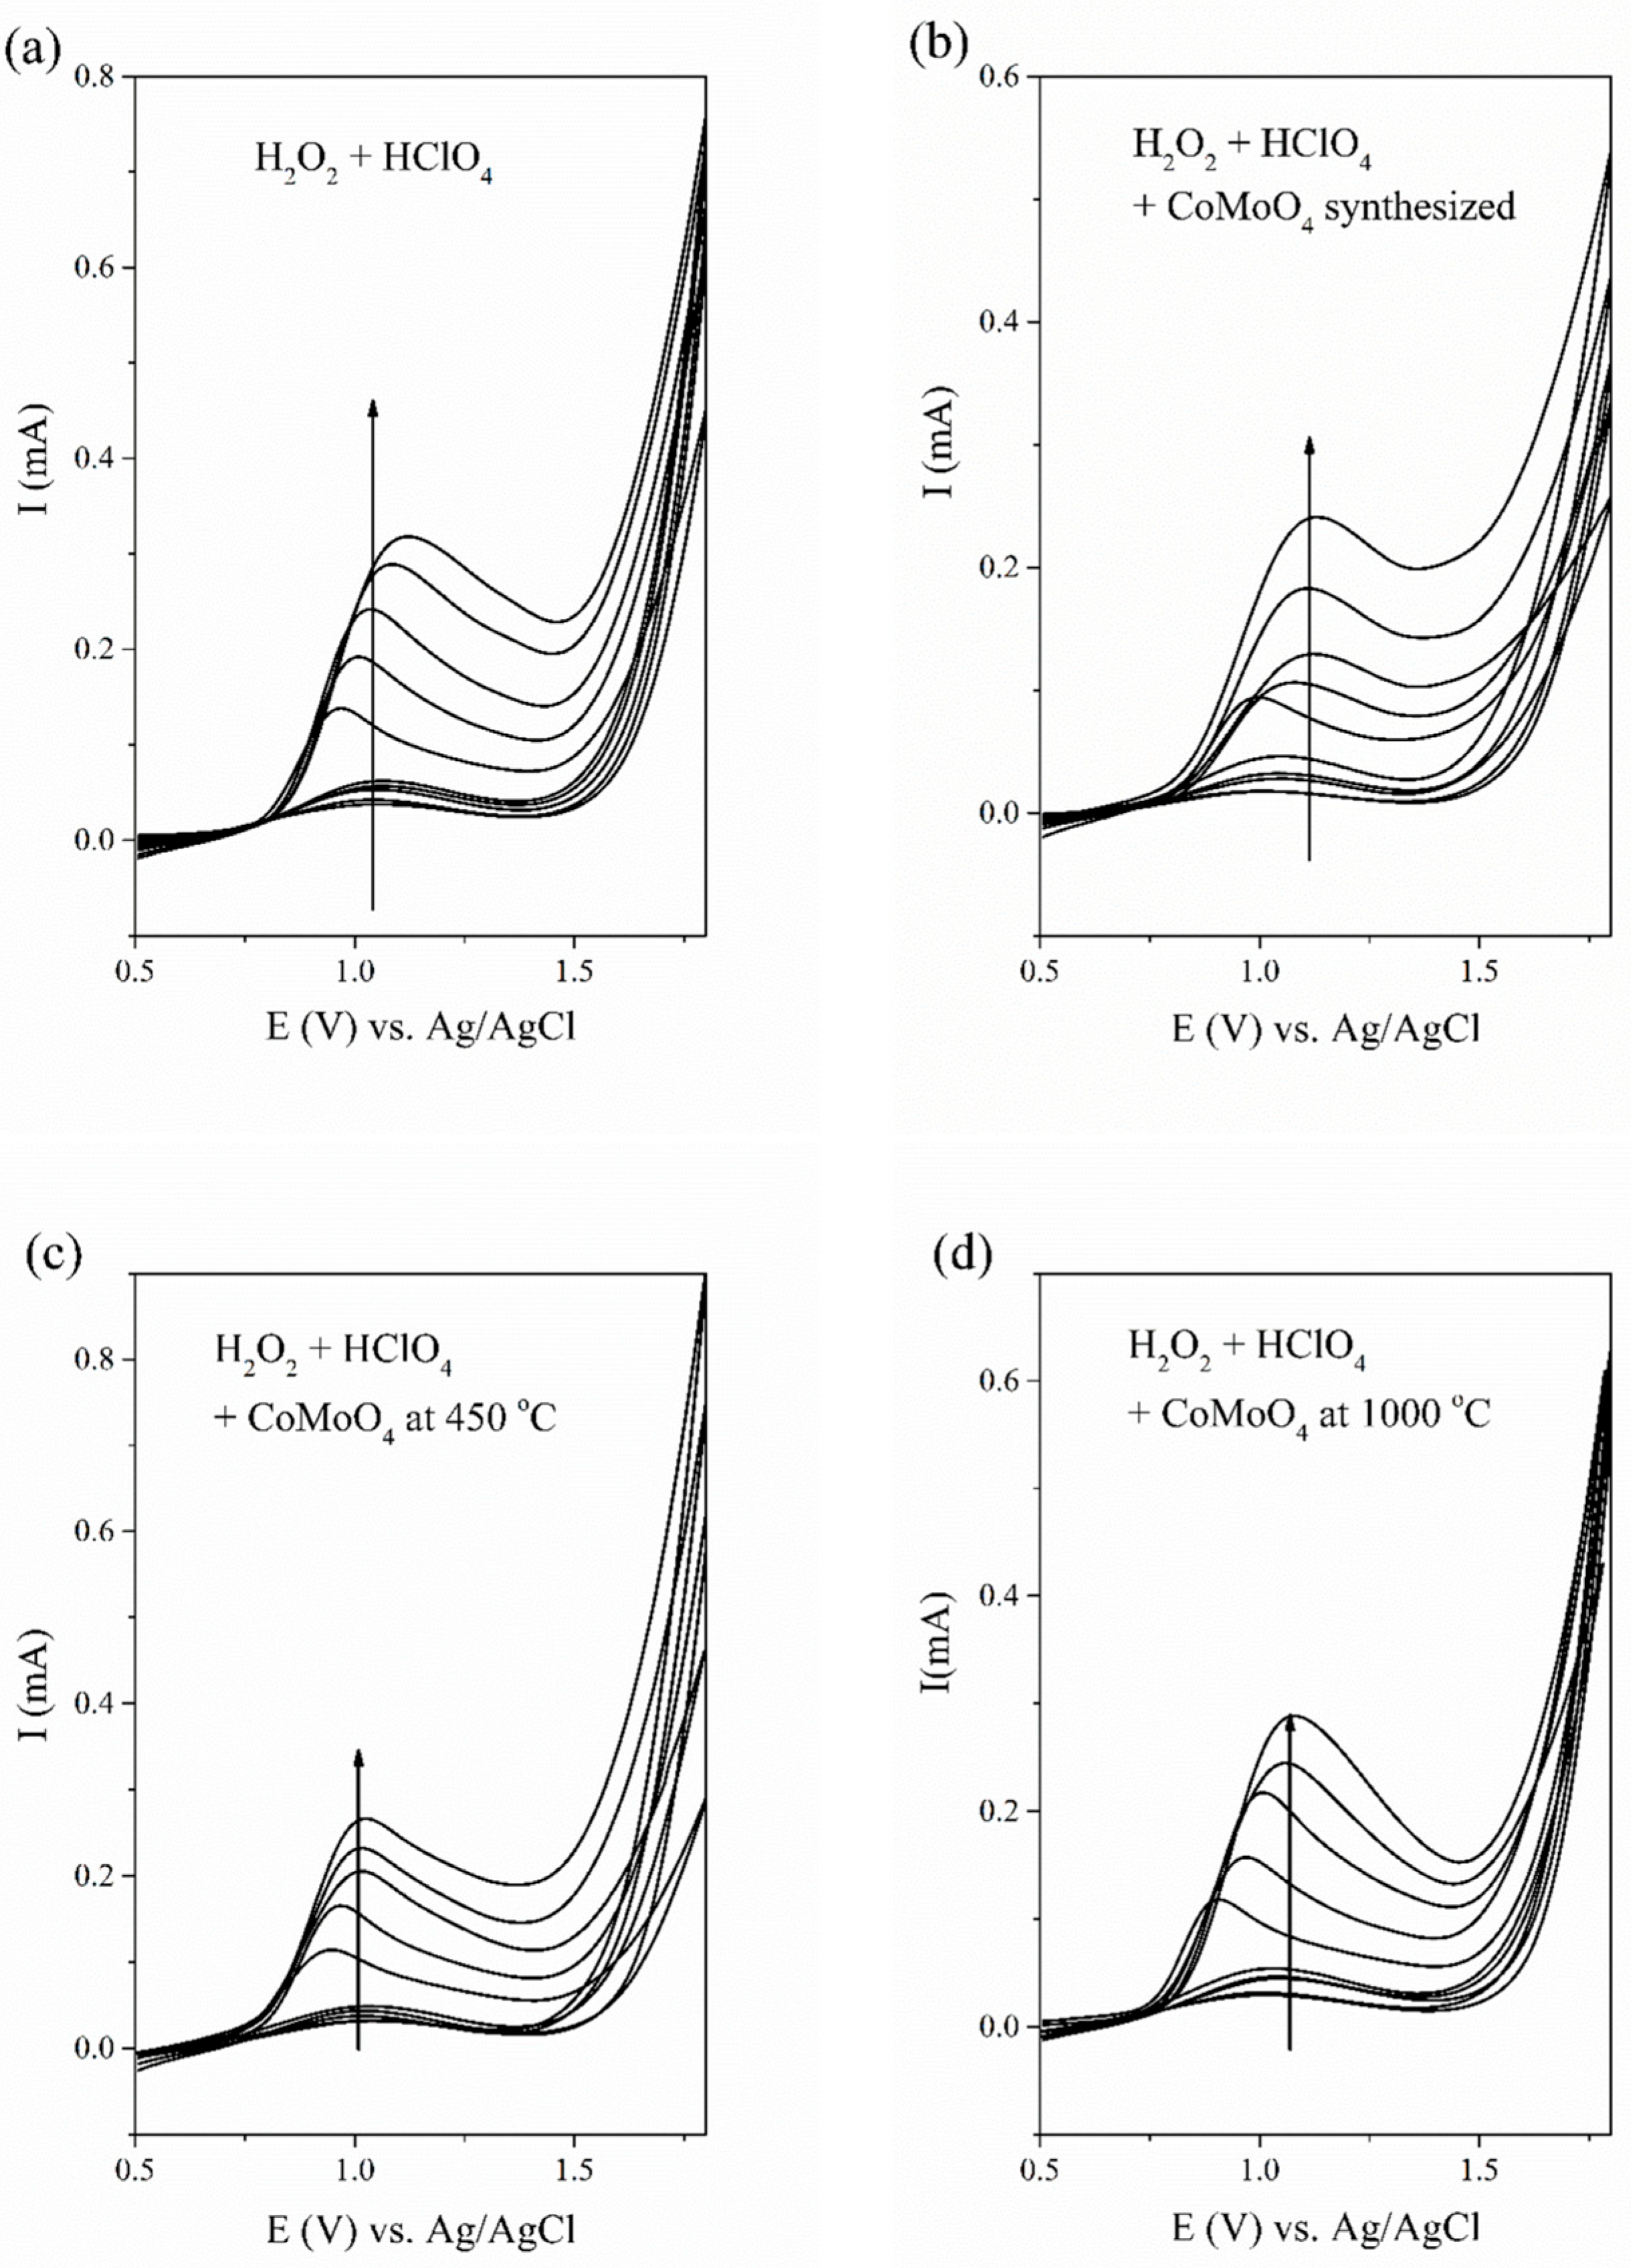
Since all three samples influenced the H2O2 oxidation process, the voltammetric behaviour was examined further as a function of scan rate (Figure 6a–d).
Figure 6.
Cyclic voltammograms recorded at different scan rates in the H2O2–HClO4 electrolyte: (a) blank, and with the added CoMoO4 sample: (b) CoMoO4 as-synthesized, (c) CoMoO4 at 450 °C and (d) CoMoO4 at 1000 °C.
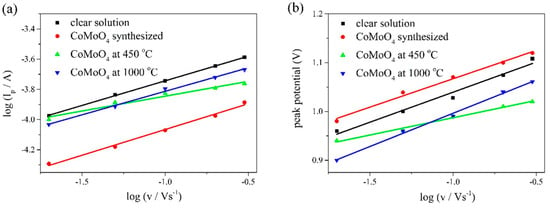
The slopes of the log(Ip) vs. log(ν) plots (Figure 7a) amounted to 0.33, 0.34, 0.20, and 0.31 for the blank solution and for the electrolytes containing CoMoO4 as-synthesized, CoMoO4 at 450 °C, and CoMoO4 at 1000 °C, respectively. Theoretically, a slope of 0.5 is expected for a purely diffusion-controlled process and 1 for a purely adsorption-controlled process, with intermediate values indicating mixed control; values below 0.5 signal an additional kinetic (chemical) contribution to the overall rate [30]. The comparatively low slope of the blank (0.33) is consistent with the complex autocatalytic decomposition of H2O2 at platinum in acidic media and the concomitant formation of adsorbed oxygen species at the Pt surface, and it is taken as the effective baseline for the system. The pronounced decrease to 0.20 for CoMoO4 at 450 °C indicates that this material further modifies the H2O2 reaction mechanism.
Figure 7.
(a) Dependence of log(Ip) on log(v) and (b) dependence of the peak potential Ep on log(v) for the blank solution and for the electrolytes containing the CoMoO4 samples.
A plausible interpretation of this behaviour is a chemical–electrochemical (CE) mechanism, in which a heterogeneous catalytic step precedes electron transfer [30,31]. The highly active surface of CoMoO4 at 450 °C drives the heterogeneous catalytic decomposition of H2O2 within the bulk solution and the diffusion layer, depleting the electroactive species before it reaches the Pt surface. At high scan rates, the short experimental timescale limits this prior depletion, and the diffusion layer remains relatively undisturbed; at low scan rates, the longer timescale allows the catalyst to substantially deplete the local H2O2 concentration near the electrode. The resulting selective suppression of the peak current at low scan rates compresses the overall current range across the scan-rate window, directly lowering the apparent slope to 0.20.
The slopes of the Ep vs. log(ν) plots (Figure 7b) followed the same trend. The corresponding slopes were 123, 116, 71, and 136 mV dec−1 for the blank and for CoMoO4 as-synthesized, CoMoO4 at 450 °C, and CoMoO4 at 1000 °C, respectively. For a totally irreversible, diffusion-controlled process, the peak potential varies with scan rate according to [25,26]:
where b = 2.303RT/(αnF) = 0.059/(αn) V at 25 °C is the Tafel slope, with α being the transfer coefficient and n the number of electrons transferred. The experimentally measured ∂Ep/∂log ν therefore corresponds to b/2, so the apparent Tafel slope for CoMoO4 at 450 °C is b ≈ 142 mV dec−1 (from ∂Ep/∂log ν = 71 mV dec−1). Because the system operates under mixed kinetic control, however, these apparent slopes cannot be used for reliable extraction of α and n; they are reported here only as a qualitative, comparative diagnostic.
Ep = (b/2) log ν + const.
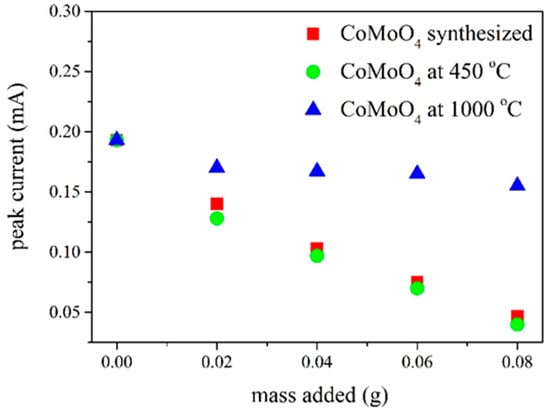
The influence of catalyst loading was assessed by recording a voltammogram after each successive addition of a sample aliquot (Figure 8). CoMoO4 as-synthesized and CoMoO4 at 450 °C produced a comparable, marked decrease in peak current, whereas CoMoO4 at 1000 °C had a much more moderate effect. This trend follows the activity ranking obtained in the BR test and is attributed to competitive heterogeneous H2O2 disproportionation at the powder surface:
2 H2O2 → 2 H2O + O2
Figure 8.
Dependence of the peak current on the mass of CoMoO4 added to the H2O2–HClO4 electrolyte.
The 1000 °C sample, despite being bulk α-CoMoO4, is far less active in this respect, most likely because calcination has reduced both the accessible surface area and the porosity available to the substrate. Although CoMoO4 as-synthesized also lowers the absolute peak current—indicating that it also decomposes H2O2—it retains a log(Ip)/log(ν) slope of 0.34, essentially identical to that of the blank (0.33). Within the CE framework, this divergence reflects the magnitude of the heterogeneous rate constant: CoMoO4 at 450 °C acts as a fast catalyst that dynamically perturbs the transient diffusion layer during the voltammetric sweep, while the slower CoMoO4 as-synthesized depletes the bulk concentration without appreciably altering the diffusion layer on the experimental timescale, keeping the slope at 0.34.
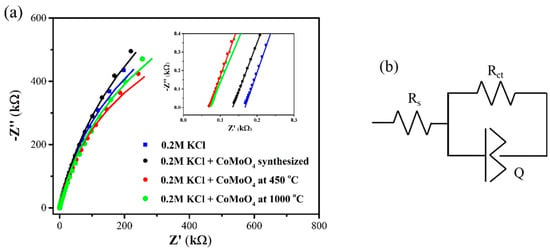
The Nyquist plots recorded in 0.2 mol dm−3 KCl, with and without the added samples, are presented in Figure 9a. The spectra consist of incomplete semicircles, indicating a predominantly capacitive behaviour of the electrode interface. Since the measurements were performed at open-circuit potential in an electrolyte free of electroactive species, high charge-transfer resistances are expected, the only anticipated faradaic process being oxide formation at the Pt surface. The spectra were fitted with a modified Randles equivalent circuit (Figure 9b) comprising the solution resistance (Rs) in series with the parallel combination of a constant-phase element (Q), representing the double-layer capacitance, and the charge-transfer resistance (Rct).
Figure 9.
(a) Nyquist plots recorded in 0.2 mol dm−3 KCl with and without the added CoMoO4 samples (inset: high-frequency region) and (b) the modified Randles equivalent circuit used to fit the spectra.
The constant-phase element (CPE) accounts for the non-ideal capacitive response; its impedance is given by [26]:
where Y is the CPE admittance, i is the imaginary unit, ω is the angular frequency, n is the CPE exponent (associated with surface inhomogeneity), and Q is the magnitude of the admittance at ω = 1 rad s−1. Depending on the value of n, the CPE reduces to a pure capacitance (n = 1), a pure resistance (n = 0), or a Warburg impedance (n = 0.5).
Z = 1/Y = 1/[(i ω)n Q]
The effective double-layer capacitance was calculated from the CPE parameters using the Brug relation [26]. Because Rct >> Rs for all systems studied here (MΩ vs. hundreds of Ω), the simplified form applies:
Ceff = Y01/n · Rs(1−n)/n
The high-frequency intercept on the real axis corresponds to the combined series resistance Rs, which comprises the intrinsic resistance of the electrode material, the ionic resistance of the electrolyte, and the contact resistance. The addition of the CoMoO4 powders lowered Rs in every case (from 193 Ω for the blank to 69–142 Ω) (Table 4). Because even complete dissolution of the added powder would change the ionic strength of 0.2 mol dm−3 KCl by less than 2%, this decrease cannot arise from increased electrolyte conductivity; it more likely reflects particles in contact with, or deposited on, the Pt surface and the associated change in the effective current path. The charge-transfer resistance, by contrast, did not follow a single trend: Rct decreased only for CoMoO4 at 450 °C (1.29 vs. 1.60 MΩ for the blank), remained essentially unchanged for CoMoO4 at 1000 °C (1.63 MΩ), and increased for CoMoO4 as-synthesized (2.09 MΩ) (Table 4). The lower Rct of CoMoO4 at 450 °C suggests that species released from the powder, or the solid phase itself, facilitate charge transfer, possibly acting as redox mediators at the Pt/electrolyte interface. The increase observed for CoMoO4 as-synthesized is consistent with partial blocking of the Pt surface by adsorbed or leached species and residual amorphous/hydroxylated surface phases—formed during the as-synthesized stage of incomplete crystallization—that lack the well-defined mediating sites present in the more crystalline powders.
Table 4.
Impedance parameters extracted from the Nyquist plots and the corresponding effective capacitances, Ceff, derived via the Brug model [26].
The effective double-layer capacitance, Ceff, decreased systematically from 1.19 µF for the blank to 0.73 µF for the 1000 °C sample. This attenuation is attributed to the non-faradaic adsorption of leached species or fine particulate matter onto the Pt surface: displacement of compact water molecules within the Helmholtz layer by bulkier adsorbed species increases the effective double-layer thickness and lowers the local dielectric permittivity, thereby reducing the capacitance. Overall, CoMoO4 at 450 °C exhibits the lowest Rct and one of the two lowest Rs values, indicating the most pronounced modification of the Pt/electrolyte interface (Table 4). Because these measurements were performed in KCl, in the absence of H2O2, the EIS parameters describe interfacial properties and not peroxidase-mimetic activity; their relationship to the BR and CV results is correlative rather than mechanistic.
3.5. Descriptor Φ = ρα × SBET: Scope and Limitations
The four independent datasets—FTIR, BR, CV and EIS—show that macroscopic kinetic reactivity in this series of GNP-derived CoMoO4 powders is not determined by the bulk crystallographic phase alone. We examine here to what extent it can be rationalized by the empirical, semi-quantitative descriptor Φ = ρα × SBET, where ρα is the α-type FTIR band-area fraction (Section 3.2) and SBET is the BET specific surface area. Three observations are relevant:
(1) The 450 °C powder (bulk-β by XRD) is the most active sample in the BR test and the only one that changes the log Ip–log ν slope in CV. It suppresses BR oscillations at ≤0.002 g, shows the lowest Rct in EIS, and gives CE kinetics in CV. Although its SBET exceeds the as-synthesized sample by only 9%, FTIR deconvolution (Table 3) gives ρα = 0.90 ± 0.07 for the 450 °C powder—the highest value in the series—indicating the largest relative contribution of octahedral-type Mo–O environments. The corresponding Φ = 21.5 m2 g−1 is 2.1-fold larger than for the as-synthesized powder (Φ = 10.3 m2 g−1) and 1.9-fold larger than for the 1000 °C sample (Φ = 11.4 m2 g−1).
(2) The 1000 °C powder (bulk-α) is the least active per gram. Its fully octahedral Mo6+ coordination is expected to confer the highest per-site Lewis acidity [8,9], but calcination reduces SBET to 15 m2 g−1 and strongly reduces the porosity, lowering Φ to a value comparable to that of the as-synthesized powder. This is the apparent paradox: the bulk phase expected to be the most Lewis-acidic is the least reactive.
(3) The as-synthesized powder lies between the two in activity: moderate SBET, the lowest α-type band-area fraction, and a Φ value indistinguishable within uncertainty from that of the 1000 °C powder. Its BR slope (5172 s g−1) is four times the 1000 °C value, and its suppression threshold is at least 20-fold higher than that of the 450 °C sample, while Φ reproduces the second difference but not the first (see below).
It should be noted that Φ does not reproduce the BR activity order of the as-synthesized and 1000 °C powders: the as-synthesized powder is about four times more active per gram (BR slopes 5172 ± 406 vs. 1278 ± 80 s g−1; Section 3.3.3), whereas their Φ values (10.3 ± 5.5 and 11.4 ± 0.3 m2 g−1) are indistinguishable within uncertainty. Even after normalization of the BR slopes to SBET, the as-synthesized powder remains about 2.8 times more active (≈235 vs. ≈85 s m−2). Part of this discrepancy reflects a known limitation of BET surface area as a measure of the area accessible to substrates in solution: grains of the 1000 °C sample, with their strongly reduced porosity (Figure 1c), present mainly their external surface to aqueous H2O2, so the effectively accessible area is likely smaller than the BET value, whereas the porous as-synthesized morphology allows diffusive access through its open pore network. In addition, factors not included in Φ—Co2+/Co3+ redox chemistry, oxygen vacancies, surface hydroxylation (including the residual amorphous and hydroxylated phases of the as-synthesized powder), and defect density—are likely to contribute. The descriptor Φ therefore provides a partial rationalization of the observed reactivity trend by combining structural (ρα) and textural (SBET) contributions. However, it does not reproduce the activity order of the as-synthesized and 1000 °C samples, indicating that additional factors, such as phase composition, crystallite size, defect concentration, or the nature of surface Co and Mo species, also influence the reactivity. Validation of Φ on a broader set of samples would be required to establish its predictive value.
Together with the photocatalytic results reported previously for the same powders [6], in which the 1000 °C powder was the most efficient photocatalyst, the present data suggest that calcination temperature may affect bulk-controlled (photocatalytic) and surface- and texture-controlled (peroxidase-mimetic) behaviour in different ways. Because this comparison combines data from two separate studies, it should be regarded as a hypothesis for future work rather than as a result of the present study.
The descriptor Φ is currently defined semi-quantitatively because ρα is estimated from relative FTIR band intensities rather than by a direct surface-site titration. Accordingly, Φ should presently be regarded as a comparative descriptor for the investigated sample series rather than as an absolute measure of Lewis acid site density. Placing Φ on a rigorous quantitative footing—through, for example, X-ray photoelectron spectroscopy of the Co 2p, Mo 3d and O 1s levels (Co3+/Co2+ ratio, oxygen vacancies), electron paramagnetic resonance for vacancy-related defects, temperature-programmed reduction of surface Mo6+, or infrared spectroscopy of adsorbed pyridine or CO (Lewis and Brønsted acidity)—remains an open goal and would allow the contributions of the individual factors to be separated.
4. Conclusions
Three glycine–nitrate-derived CoMoO4 nanopowders—as-synthesized and calcined at 450 °C (both β-CoMoO4 by XRD) and calcined at 1000 °C (α-CoMoO4)—were compared by ATR-FTIR spectroscopy, the Briggs–Rauscher reaction, cyclic voltammetry and electrochemical impedance spectroscopy. The following conclusions apply to this three-sample series.
(1) Deconvolution of the Mo–O stretching region with a uniform Voigt line shape resolves octahedral (α-type) and tetrahedral (β-type) Mo6+ components in both β-classified powders, indicating short-range coordination heterogeneity not detected by powder XRD. The band-area fraction ρα is a semi-quantitative, relative quantity and not a direct measure of Lewis acid site density.
(2) The 450 °C powder is the most active sample: it suppresses BR oscillations at ≤0.002 g (threshold 0.0011–0.0020 g), whereas the as-synthesized powder still oscillates at 0.040 g (slope 5172 ± 406 s g−1, n = 3) and the bulk-α 1000 °C powder is about four times less active per gram than the as-synthesized powder. Complete H2O2 depletion was not demonstrated, and a contribution of dissolved Co/Mo species to the oscillatory response cannot be completely excluded.
(3) CV in H2O2-containing electrolyte supports the highest activity of the 450 °C powder; EIS in KCl provides correlative evidence of interfacial modification.
(4) The descriptor Φ = ρα × SBET identifies the most active powder but does not discriminate between the as-synthesized and 1000 °C powders. Co2+/Co3+ redox chemistry, oxygen vacancies, surface hydroxylation, and defects are likely additional contributors.
(5) Within this series, bulk phase identity alone does not predict peroxidase-mimetic activity. Direct surface-acidity measurements (pyridine-FTIR, XPS) and a larger set of samples are needed to test whether the proposed relationship between local coordination, accessibility and activity holds more generally.
Supplementary Materials
The following supporting information can be downloaded at https://www.mdpi.com/article/10.3390/ma19204318/s1, Figure S1: Cyclic voltammograms recorded in the (a) MA–HClO4; (b) MnSO4–HClO4; (c) KIO3–HClO4, and (d) H2O2–HClO4 electrolytes without (dashed) and with (solid) the added CoMoO4 at 450 °C.; Figure S2: Cyclic voltammograms recorded in the (a) MA–HClO4; (b) MnSO4–HClO4; (c) KIO3–HClO4, and (d) H2O2–HClO4 electrolytes without (dashed) and with (solid) the added CoMoO4 at 1000 °C.
Author Contributions
Conceptualization, M.R. and M.Č.; methodology, M.R., M.C.P. and M.Č.; software, M.R., J.P.M. and J.V.S.; validation, J.V.S., J.P.M. and D.J.; formal analysis, M.C.P., J.P.M. and D.J.; investigation, M.R., M.C.P., J.V.S. and Z.M.; writing—original draft preparation, M.R., Z.M. and M.Č.; writing—review and editing, M.R., Z.M. and M.Č.; visualization, J.V.S. and D.J. All authors have read and agreed to the published version of the manuscript.
Funding
This research was funded by the Ministry of Science, Technological Development and Innovation of the Republic of Serbia, based on contract no. 451-03-33/2026-03/200017 through the realization of research theme 1702614 (“Vinča” Institute of Nuclear Sciences—National Institute of the Republic of Serbia, University of Belgrade); 451-03-33/2026-03/200026 (Institute of Chemistry, Technology and Metallurgy, University of Belgrade); 451-03-33/2026-03/200053 (Institute for Multidisciplinary Research, University of Belgrade); and 451-03-33/2026-03/200146 (Faculty of Physical Chemistry, University of Belgrade).
Data Availability Statement
The original contributions presented in this study are included in the article/Supplementary Material. Further inquiries can be directed to the corresponding author.
Conflicts of Interest
The authors declare no conflicts of interest.
References
- Mai, L.Q.; Yang, F.; Zhao, Y.L.; Xu, X.; Xu, L.; Luo, Y.Z. Hierarchical MnMoO4/CoMoO4 heterostructured nanowires with enhanced supercapacitor performance. Nat. Commun. 2011, 2, 381. [Google Scholar] [CrossRef] [Scilit]
- Veerasubramani, G.K.; Krishnamoorthy, K.; Radhakrishnan, S.; Kim, N.-J.; Kim, S.J. Synthesis, characterization, and electrochemical properties of CoMoO4 nanostructures. Int. J. Hydrogen Energy 2014, 39, 5186–5193. [Google Scholar] [CrossRef] [Scilit]
- Xu, Z.; Li, Z.; Tan, X.; Holt, C.M.B.; Zhang, L.; Amirkhiz, B.S.; Mitlin, D. Supercapacitive carbon nanotube-cobalt molybdate nanocomposites prepared via solvent-free microwave synthesis. RSC Adv. 2012, 2, 2753–2755. [Google Scholar] [CrossRef] [Scilit]
- Zhang, Y.J.; Rodríguez-Ramos, I.; Guerrero-Ruiz, A. Oxidative dehydrogenation of isobutane over magnesium molybdate catalysts. Catal. Today 2000, 61, 377–382. [Google Scholar] [CrossRef] [Scilit]
- Kojima, R.; Aika, K.-I. Cobalt molybdenum bimetallic nitride catalysts for ammonia synthesis. Appl. Catal. A Gen. 2001, 215, 149–160. [Google Scholar] [CrossRef] [Scilit]
- Rosić, M.; Zarubica, A.; Šaponjić, A.; Babić, B.; Zagorac, J.; Jordanov, D.; Matović, B. Structural and photocatalytic examination of CoMoO4 nanopowders synthesized by GNP method. Mater. Res. Bull. 2018, 98, 111–120. [Google Scholar] [CrossRef] [Scilit]
- Choi, G.-K.; Kim, J.-R.; Yoon, S.H.; Hong, K.S. Microwave dielectric properties of scheelite (A = Ca, Sr, Ba) and wolframite (A = Mg, Zn, Mn) AMoO4 compounds. J. Eur. Ceram. Soc. 2007, 27, 3063–3067. [Google Scholar] [CrossRef] [Scilit]
- Wang, Z.; Ju, P.; Zhang, Y.; Jiang, F.; Ding, H.; Sun, C. CoMoO4 nanobelts as efficient peroxidase mimics for the colorimetric determination of H2O2. Microchim. Acta 2020, 187, 424. [Google Scholar] [CrossRef] [Scilit]
- Busca, G. The surface acidity of solid oxides and its characterization by IR spectroscopic methods. An attempt at systematization. Phys. Chem. Chem. Phys. 1999, 1, 723–736. [Google Scholar] [CrossRef] [Scilit]
- Wachs, I.E. Recent conceptual advances in the catalysis science of mixed metal oxide catalytic materials. Catal. Today 2005, 100, 79–94. [Google Scholar] [CrossRef] [Scilit]
- Robertson, L.C.; Gaudon, M.; Jobic, S.; Deniard, P.; Demourgues, A. Investigation of the First-Order Phase Transition in the Co1−xMgxMoO4Solid Solution and Discussion of the Associated Thermochromic Behavior. Inorg. Chem. 2011, 50, 2878–2884. [Google Scholar] [CrossRef] [Scilit]
- Costa, R.K.S.; Teles, S.C.; Siqueira, K.P.F. The relationship between crystal structures and thermochromism in CoMoO4. Chem. Pap. 2021, 75, 237–248. [Google Scholar] [CrossRef] [Scilit]
- Rodriguez, J.A.; Chaturvedi, S.; Hanson, J.C.; Albornoz, A.; Brito, J.L.J. Electronic Properties and Phase Transformations in CoMoO4 and NiMoO4: XANES and Time-Resolved Synchrotron XRD Studies. Phys. Chem. B 1998, 102, 1347–1355. [Google Scholar] [CrossRef] [Scilit]
- Lakhlifi, H.; El Jabbar, Y.; Benchikhi, M.; Er-Rakho, L.; Durand, B.; El Ouatib, R. Nanocrystalline transition metal (CoMoO4) prepared by sol gel method: Correlation between powder colors and α/β phase transformations. Inorg. Chem. Commun. 2022, 145, 110049. [Google Scholar] [CrossRef] [Scilit]
- Cai, G.; Chin, Y.-H.C. Thermochemical and Kinetic Correlations of Redox and Lewis Sites on Cobalt–Molybdenum Oxides: Illustrated with Alkanol-O2 Catalysis. ACS Catal. 2025, 15, 11673–11694. [Google Scholar] [CrossRef] [Scilit]
- Zagorac, D.; Schön, J.C.; Rosić, M.; Zagorac, J.; Jordanov, D.; Luković, J.; Matović, B. Theoretical and Experimental Study of Structural Phases in CoMoO4. Cryst. Res. Technol. 2017, 52, 1700069. [Google Scholar] [CrossRef] [Scilit]
- Rosić, M.; Milošević, M.; Čebela, M.; Dodevski, V.; Lojpur, V.; Čakar, U.; Stopic, S. Spectroscopic and Morphological Examination of Co0.9R0.1MoO4 (R = Ho, Yb, Gd) Obtained by Glycine Nitrate Procedure. Materials 2025, 18, 397. [Google Scholar] [CrossRef] [Scilit]
- De Kepper, P.; Epstein, I.R. Mechanistic study of oscillations and bistability in the Briggs-Rauscher reaction. J. Am. Chem. Soc. 1982, 104, 49–55. [Google Scholar] [CrossRef] [Scilit]
- Briggs, T.S.; Rauscher, W.C. An oscillating iodine clock. J. Chem. Educ. 1973, 50, 496. [Google Scholar] [CrossRef] [Scilit]
- Furrow, S.D.; Noyes, R.M. The oscillatory Briggs-Rauscher reaction. 1. Examination of subsystems. J. Am. Chem. Soc. 1982, 104, 38–42. [Google Scholar] [CrossRef] [Scilit]
- Cervellati, R.; Höner, K.; Furrow, S.D.; Neddens, C.; Costa, S. The Briggs-Rauscher reaction as a test to measure the activity of antioxidants. Helv. Chim. Acta 2001, 84, 3533–3547. [Google Scholar] [CrossRef] [Scilit]
- Pagnacco, M.C.; Maksimović, J.P.; Mudrinić, T.M.; Mojović, Z.D.; Nedić, Z.P. Briggs-Rauscher reaction as a novel electrochemical detector for phosphate tungsten and phosphate molybdenum bronzes. J. Electroanal. Chem. 2019, 849, 113369. [Google Scholar] [CrossRef] [Scilit]
- Bošković, S.; Matović, B.; Vlajić, M.; Krstić, V. Modified glycine nitrate procedure (MGNP) for the synthesis of SOFC nanopowders. Ceram. Int. 2007, 33, 89–93. [Google Scholar] [CrossRef] [Scilit]
- Rahulan, K.M.; Flower, N.A.L.; Sujatha, R.A.; Mathiyarasu, V. Nonlinear optical absorption studies of CoMoO4 hybrid nanostructures. J. Mater. Sci. Mater. Electron. 2018, 29, 1504–1509. [Google Scholar] [CrossRef] [Scilit]
- Cherian, C.T.; Reddy, M.V.; Haur, S.C.; Chowdari, B.V.R. Interconnected network of CoMoO4 submicrometer particles as high capacity anode material for lithium ion batteries. ACS Appl. Mater. Interfaces 2013, 5, 918–923. [Google Scholar] [CrossRef] [Scilit]
- Brug, G.J.; van den Eeden, A.L.G.; Sluyters-Rehbach, M.; Sluyters, J.H. The analysis of electrode impedances complicated by the presence of a constant phase element. J. Electroanal. Chem. 1984, 176, 275–295. [Google Scholar] [CrossRef]
- Hardcastle, F.D.; Wachs, I.E. Determination of molybdenum–oxygen bond distances and bond orders by Raman spectroscopy. J. Raman Spectrosc. 1990, 21, 683–691. [Google Scholar] [CrossRef] [Scilit]
- Pagnacco, M.; Maksimović, J.; Mudrinić, T.; Banković, P.; Nedić-Vasiljević, B.; Milutinović-Nikolić, A. Oscillatory Briggs-Rauscher Reaction as “Fingerprint” for Bentonite Identification: The Fine-Tuning of Oscillatory Dynamics with Addition of Clay. ChemistrySelect 2020, 5, 8137–8141. [Google Scholar] [CrossRef] [Scilit]
- Ray, S.K.; Bastakoti, B.P. Improved supercapacitor and oxygen evolution reaction performances of morphology-controlled cobalt molybdate. Int. J. Hydrogen Energy 2024, 51, 1109–1118. [Google Scholar] [CrossRef] [Scilit]
- Bard, A.J.; Faulkner, L.R. Electrochemical Methods: Fundamentals and Applications, 2nd ed.; Wiley: New York, NY, USA, 2001; pp. 231–236. [Google Scholar]
- Orazem, M.E.; Tribollet, B. Electrochemical Impedance Spectroscopy, 2nd ed.; Wiley: Hoboken, NJ, USA, 2017; pp. 159–163. [Google Scholar]

Disclaimer/Publisher’s Note: The statements, opinions and data contained in all publications are solely those of the individual author(s) and contributor(s) and not of MDPI and/or the editor(s). MDPI and/or the editor(s) disclaim responsibility for any injury to people or property resulting from any ideas, methods, instructions or products referred to in the content. |
© 2026 by the authors. Licensee MDPI, Basel, Switzerland. This article is an open access article distributed under the terms and conditions of the Creative Commons Attribution (CC BY) license.