


Abstract
The Ni-doped Li2B4O7 (Li2O–2B2O3) glass was prepared by the conventional melt-quenching method. Structural and spectroscopic properties of the glass were investigated using X-ray diffraction (XRD), optical absorption, and photoluminescence spectroscopy, including excitation, emission, and decay kinetics. The absence of sharp diffraction peaks in the XRD pattern confirms the disordered glassy structure of the investigated glass. The optical absorption spectrum shows three broad bands associated with spin-allowed transitions of Ni2+ (3d8) ions. The excitation and emission spectra of the Li2B4O7:Ni glass reveal several spin-allowed and spin-forbidden 3d–3d transitions of Ni2+ ions. In particular, the Li2B4O7:Ni glass exhibits broad green and red emissions centred at approximately 525 and 687 nm, respectively, as well as weak near-infrared emission bands in the 900–1100 and 1500–1750 nm regions. The analysis of the crystal field splitting for Ni2+ ions in the Li2B4O7:Ni glass is carried out, and the Racah parameters (B and C) and the crystal field strength (Dq) are calculated. The Tanabe–Sugano diagram for the octahedrally coordinated Ni2+ ions in the Li2B4O7:Ni glass is built and discussed.
1. Introduction
Borate glasses are glassy materials that contain boron oxide (glass former) and various other oxides (glass modifiers). These glasses have interesting optical properties and are used in various applications such as solid-state lighting, laser materials, scintillation detectors, and optical fibres [1,2,3,4]. The preparation of borate glasses is simple and cost-effective compared with complicated methods for growing the corresponding single crystals. Besides this, the properties of borate glasses can be easily modified by doping with rare-earth and/or transition metal impurities. The presence of nickel (Ni) impurity in borate glasses is useful for many technological applications [5,6,7]. In particular, the Ni-doped borate glasses can be used as (1) luminescent materials for solid-state lighting; (2) the active medium in optical fibre amplifiers; (3) the gain medium in laser systems; (4) the transparent layers in photovoltaic devices, such as solar cells, to enhance the efficiency of light absorption.
This work is focused on studies of Ni-doped borate glass with the Li2B4O7 (Li2O–2B2O3) chemical composition, which is equivalent to the well-known lithium tetraborate crystal [8,9,10]. The Li2B4O7:Ni glass can be easily fabricated into a variety of shapes and sizes, which is practically impossible for the crystalline analogue. The spectroscopic terms of transition metal ions, including nickel ions, are split in the crystal field according to the ligand field theory, depending on the symmetry of the local environment of 3d ions. It should be noted that a full understanding of the optical and structural properties of Ni-doped Li2B4O7 glass is necessary to exploit its potential for various optical and electronic applications.
In this work, we use X-ray diffraction (XRD) and optical spectroscopy (absorption and luminescence) techniques to investigate the spectroscopic properties of the Ni-doped Li2B4O7 glass. XRD is a powerful technique for the structural characterisation of a material. In this work, XRD was used to confirm the disordered glassy structure of the investigated material. Optical absorption and luminescence spectroscopy was used to obtain valuable information about the electronic and local structure of nickel ions.
The Ni impurity is typically incorporated into the network of oxide glasses as Ni2+ (3d8) ions, which can be detected by optical absorption spectroscopy due to the presence of three intense spin-allowed absorption bands in the visible to near-infrared (Vis–NIR) spectral range. The optical spectra of Ni2+ ions are dependent on their local surroundings. The four-, five-, and/or six-coordinated Ni2+ ions can be observed in glasses depending on the glass composition and the content and nature of modifiers. In particular, Ni2+ ions in the tetrahedral geometry (four-fold coordination) have been observed in potassium silicate glasses [11]. The Ni2+ ions in the trigonal bipyramidal geometry (five-fold coordination) have been observed in calcium and magnesium silicate and various borosilicate glasses [11,12]. The Ni2+ ions in the octahedral geometry (six-fold coordination) are dominant in alkali borate glasses [12,13].
The position of the optical absorption bands of Ni2+ ions is dependent on the crystal field strength, which decreases with lowering of coordination number. As a consequence, the optical absorption bands of Ni2+ in the tetrahedral configuration are considerably red-shifted compared to those in the octahedral configuration. It has been summarised in [14] that the colour of a glass sample can indicate the coordination number of the oxygen anions around the Ni2+ cation. Glasses with Ni2+ ions in the four-fold coordination reveal a blue colour because the most intense absorption band is located in the red spectral range [14]. Glasses containing Ni2+ ions in the five-fold coordination have an intense brown colour because a very broad absorption band is located in the blue-green spectral range [14]. The most intense absorption band of Ni2+ ions in the six-fold coordination is located in the blue spectral region, resulting in a yellow colour for the corresponding glasses [14]. Therefore, the positions and shapes of the Ni2+ absorption bands provide valuable information about the coordination geometry and degree of structural distortion surrounding the impurity ion.
Several studies have reported the spectroscopic properties of Ni-doped borate glasses with chemical compositions similar to the investigated glass. For instance, the optical absorption of Ni-doped borate glasses with 20R2O–80B2O3 composition (where R = Li, Na and K) was studied in [15]. The absorption spectrum of the Ni-doped Li2O–4B2O3 glass showed a band at 416 nm, which was assigned to the 3A2g (F)–3T1g (P) transition of Ni2+ ions in the octahedral coordination [15]. However, article [15] did not examine the optical absorption in the NIR spectral region, perform luminescence studies, and analyse crystal field parameters. Another study [16] reported the optical absorption of Ni-doped sodium zinc borate glass with 20Na2O–15ZnO–64B2O3–1NiO composition. The observed two bands with maxima at 424 nm and 799 nm were assigned to spin-allowed transitions of Ni2+ ions in the octahedral field [16]. In bismuth borate glass with 29Bi2O3–70B2O3–1NiO composition, an absorption band at 423 nm was observed, which was due to the spin-allowed 3A2g (F) → 3T1g (P) transition of Ni2+ ions in the octahedral geometry [17]. However, analysis of the crystal field splitting of Ni2+ ions is missing in [17]. Three broad absorption bands at 425, 793, and 1264 nm assigned to the 3A2g(3F) → 3T1g(3P), 3Tlg(3F), and 3T2g(3F) spin-allowed transitions of Ni2+ ions in the octahedral coordination were observed in the lead borate glass with 49.5PbO–50B2O3–0.5NiO chemical composition [18]. However, study [18] did not analyse the crystal field or perform detailed luminescence studies.
The available referenced data indicate that the luminescent properties and crystal field splitting in Ni-doped borate glasses have not been thoroughly studied. In particular, a comprehensive spectroscopic description of the Ni-doped Li2B4O7 glass is still lacking. Accordingly, the present work aims to provide a comprehensive structural and spectroscopic characterisation of the Li2B4O7:Ni glass. XRD was employed to examine the glassy structure of the investigated material. UV–Vis–NIR absorption and photoluminescence spectroscopy were used to identify the oxidation state and the electronic transitions of Ni impurity ions. The luminescence decay kinetics were analysed to assess the influence of multiple radiative channels and structural disorder on the excited-state relaxation. Finally, the experimental transition energies were used to determine the crystal-field strength and Racah parameters and to construct a Tanabe–Sugano diagram. The combination of the obtained results provides valuable insight into the electron structure, ligand crystal-field environment, and spectroscopic behaviour of the Ni impurity centres in the Li2B4O7:Ni glass.
2. Materials and Methods
2.1. Preparation of the Ni-Doped Li2B4O7 Glass
The Ni-doped lithium tetraborate glass with the nominal composition Li2B4O7 (or Li2O–2B2O3) was prepared by the conventional melt-quenching method under the technological conditions described in [19]. The starting materials used for the preparation of the Li2B4O7 host composition were lithium carbonate (Li2CO3, purity—≥99.9%, Sigma-Aldrich) and boric acid (H3BO3, purity—99.97%, Sigma-Aldrich), in amounts of 0.1 and 0.4 mol, respectively. The reagents were weighed in stoichiometric proportions, thoroughly mixed and loaded into a 60 mL corundum crucible. The solid-state synthesis of the Li2B4O7 compound was carried out using the following multi-step chemical reaction:
The nickel impurity was introduced in the form of nickel (II) oxide (NiO, purity—99.99%, Sigma-Aldrich) at a nominal concentration of 1.0 mol.%. The Li2B4O7:Ni glass was obtained by a quick cooling of the corresponding melt. To avoid the crystallisation processes, the melt was heated approximately 100 K above the melting point of Li2B4O7 (Tmelt = 917 °C, or 1190 K) [19]. The process of glass preparation was carried out in the air. The resulting glass samples were cut and polished to sizes of approximately 10 × 6 × 2 mm3 for optical absorption and photoluminescence measurements. Meanwhile, small pieces were used for the XRD studies.
2.2. Experimental Techniques
The XRD studies were carried out with usage of a computer-controlled X-ray diffractometer (model DRON-3, NPO “Burevestnik”, Leningrad, USSR) with Cu Kα radiation source. The XRD diffractogram was obtained in the 2θ angle range of 5–145° with a scanning speed of 2.0°/min. The optical absorption spectrum of the Li2B4O7:Ni glass was measured using the Agilent Cary 5000 UV–Vis–NIR spectrophotometer (Agilent Technologies, Inc., Santa Clara, CA, USA). The spectrophotometer includes a double-beam optical system, deuterium and tungsten halogen lamps, a double-grating monochromator, an R928 photomultiplier tube, and a cooled PbS detector.
The luminescence emission and excitation spectra in the UV–Vis spectral range, as well as slow decay kinetics, were registered using the Horiba FluoroMax–4 spectrofluorimeter (HORIBA, Ltd., Kyoto, Japan). The spectrofluorimeter includes a 150 W xenon lamp, excitation and emission grating monochromators, and an R928P photomultiplier tube. The luminescence emission spectra in the NIR spectral region were registered using the Dongwoo Optron DM711 monochromator (Dongwoo Optron Co., Ltd., Gwangju-si, Republic of Korea) and an InGaAs detector (Hamamatsu, Japan). The NIR luminescence was excited using a high-power LED at λexc = 445 nm. The fast decay kinetics was registered using an experimental setup containing a Continuum Surelite optical parametric oscillator (OPO) pumped by the third harmonic of a pulsed Nd:YAG laser, a GDM 1000 grating monochromator (Carl Zeiss Jena, Jena, Germany), a Hamamatsu R955 photomultiplier tube (Hamamatsu Photonics K.K., Hamamatsu City, Japan), and a Tektronix MSO44 oscilloscope (Tektronix, Inc., Beaverton, OR, USA). All investigations were performed at room temperature.
3. Results and Discussion
3.1. XRD Characterisation
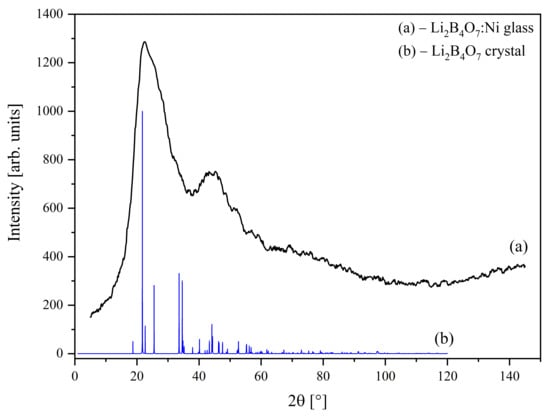
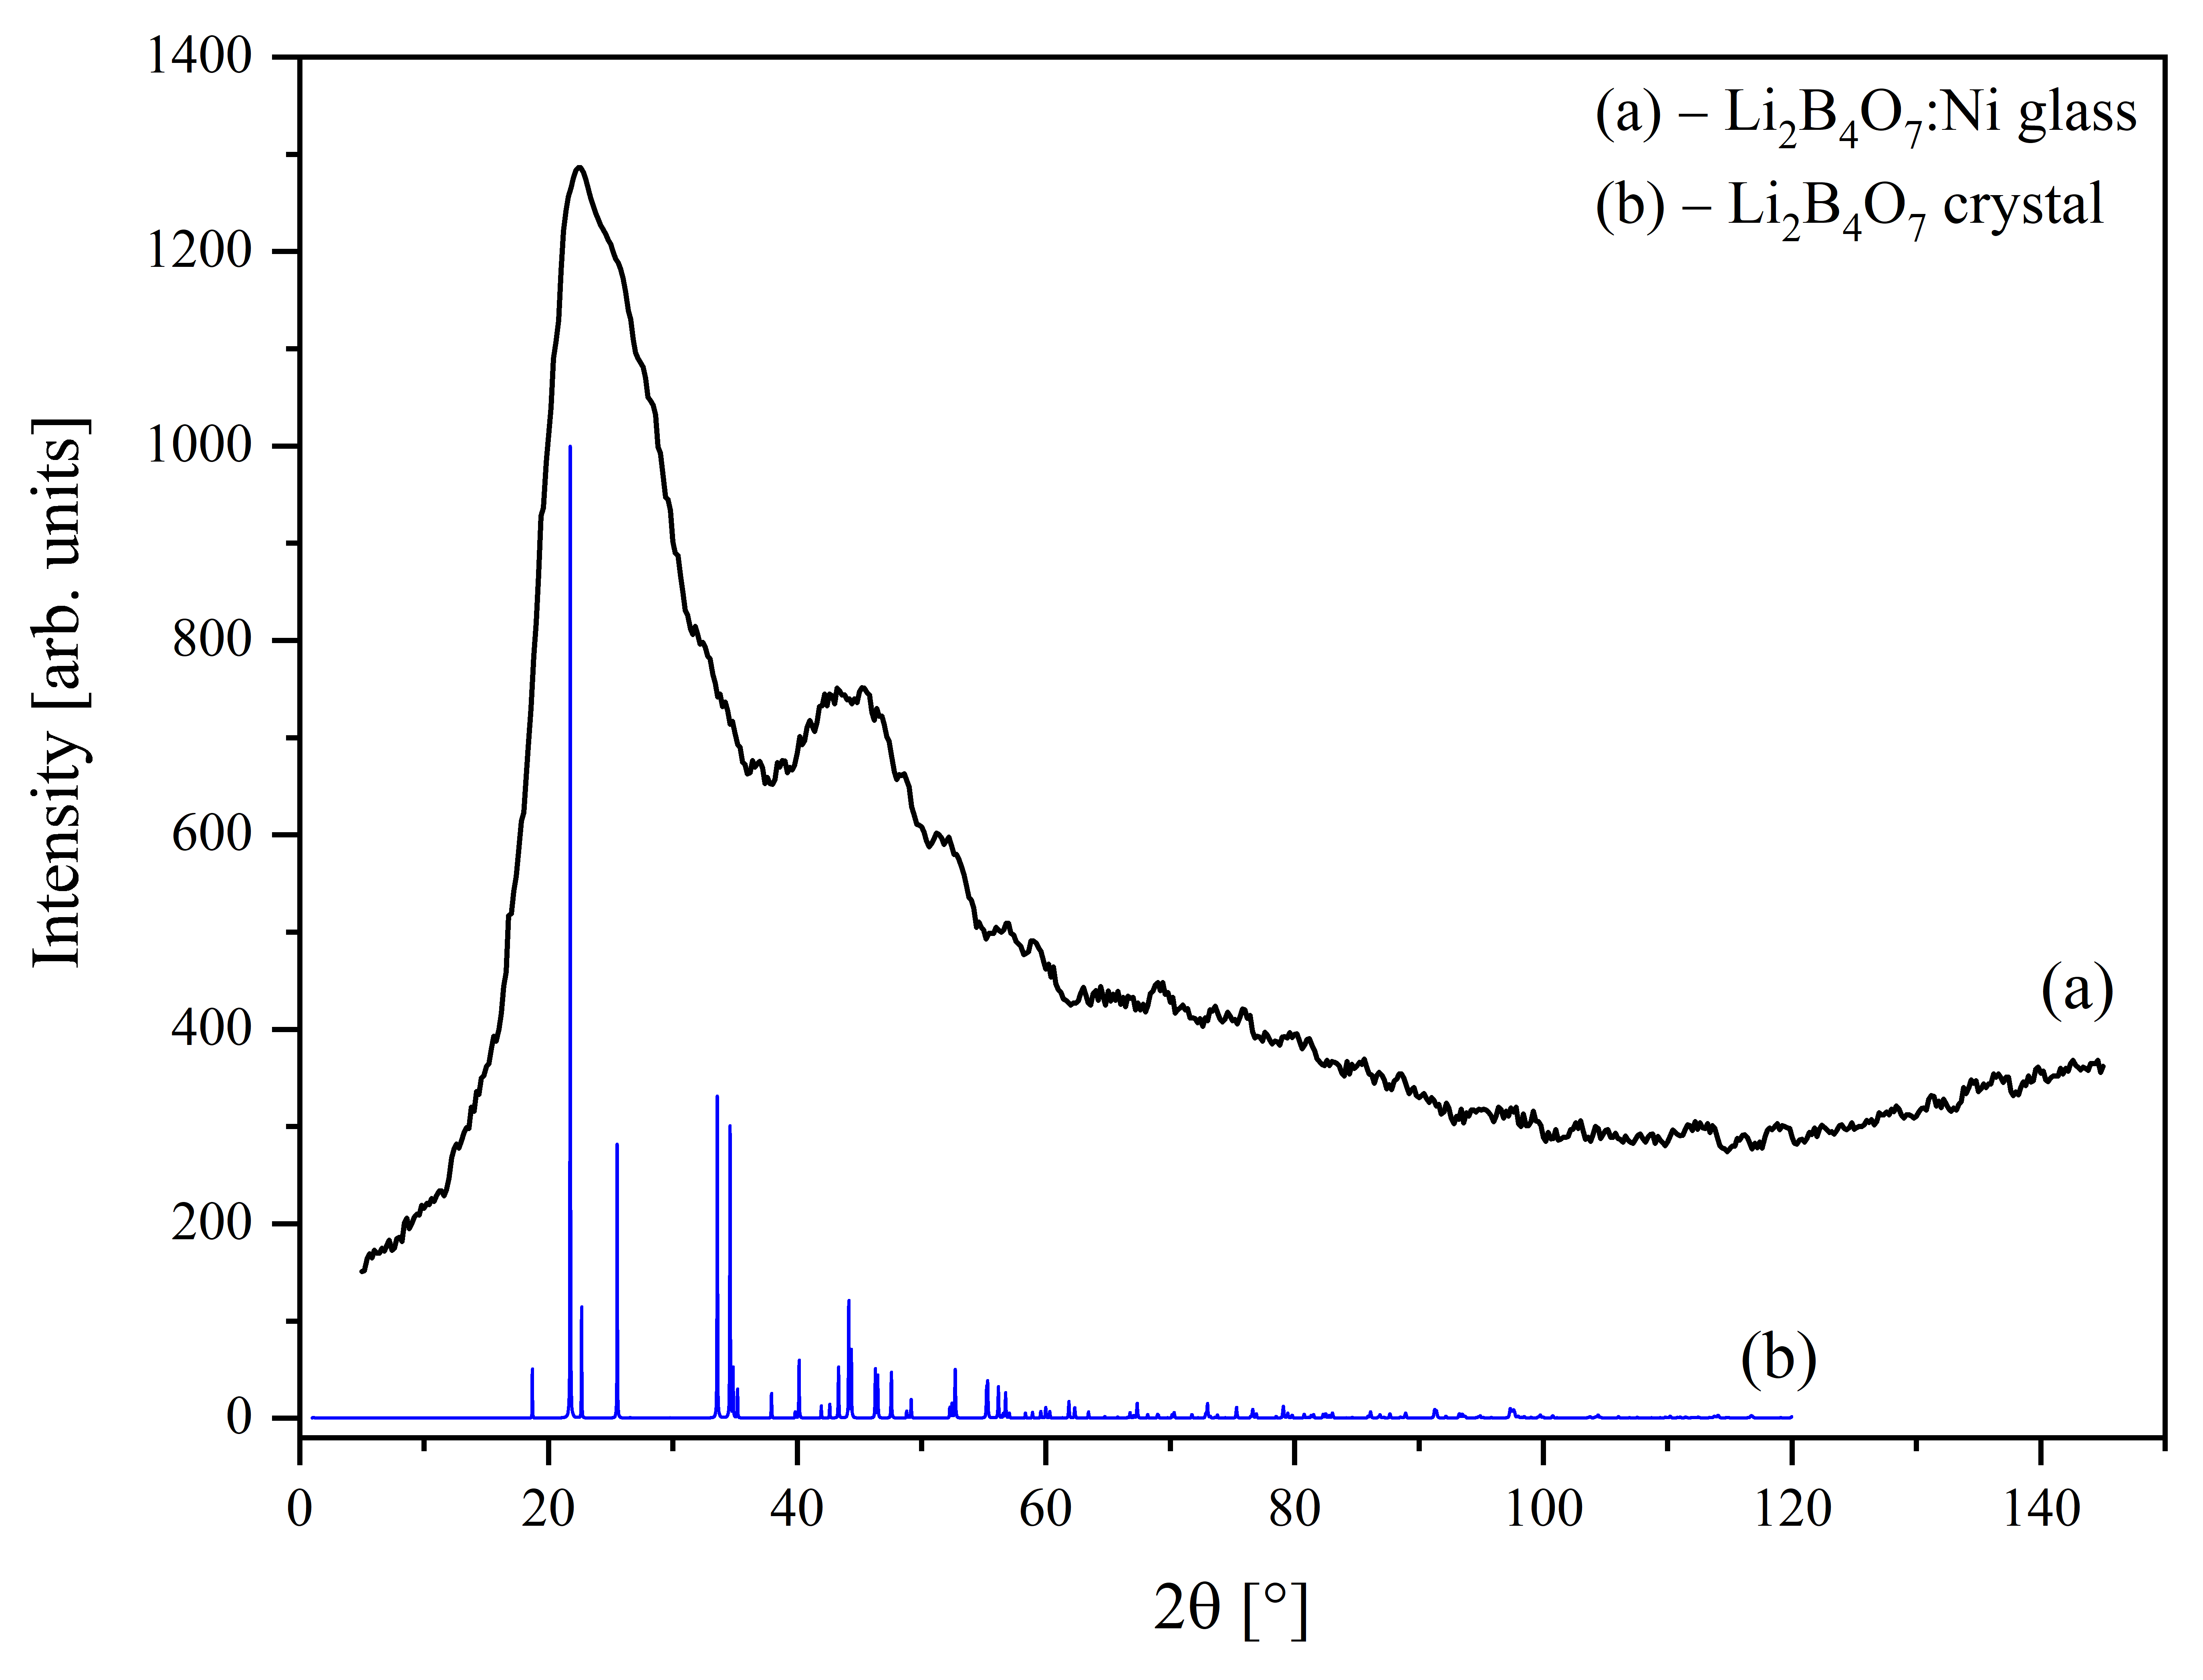
Figure 1 shows the experimental X-ray diffraction pattern of the Li2B4O7:Ni glass together with the reference diffraction profile of crystalline Li2B4O7 calculated from the crystallographic data reported in [20]. The experimental XRD pattern of the Li2B4O7:Ni glass is characterised by a broad diffuse scattering halo and the absence of sharp Bragg reflections, indicating the absence of detectable long-range crystalline order and confirming the disordered glassy (vitreous) structure of the investigated sample. The position of the main diffuse maximum is consistent with the region of the strongest reflections of crystalline Li2B4O7, suggesting that the short-range structural properties of the glass retain some similarity to those of the crystalline phase.
Figure 1.
The experimental XRD profile of the Li2B4O7:Ni glass (black curves (a)) and the diffraction peaks of the Li2B4O7 crystal (blue curves (b)).
3.2. Optical Absorption and Crystal-Field Analysis
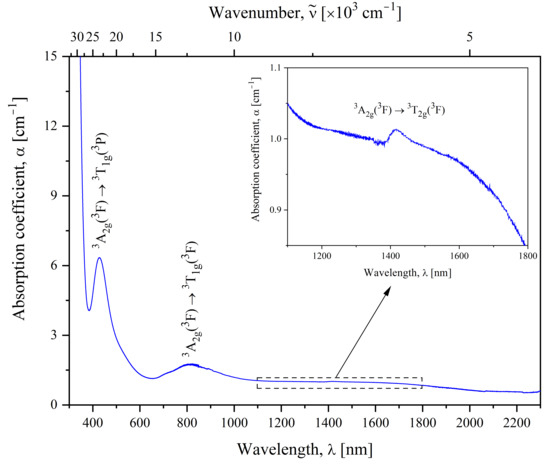
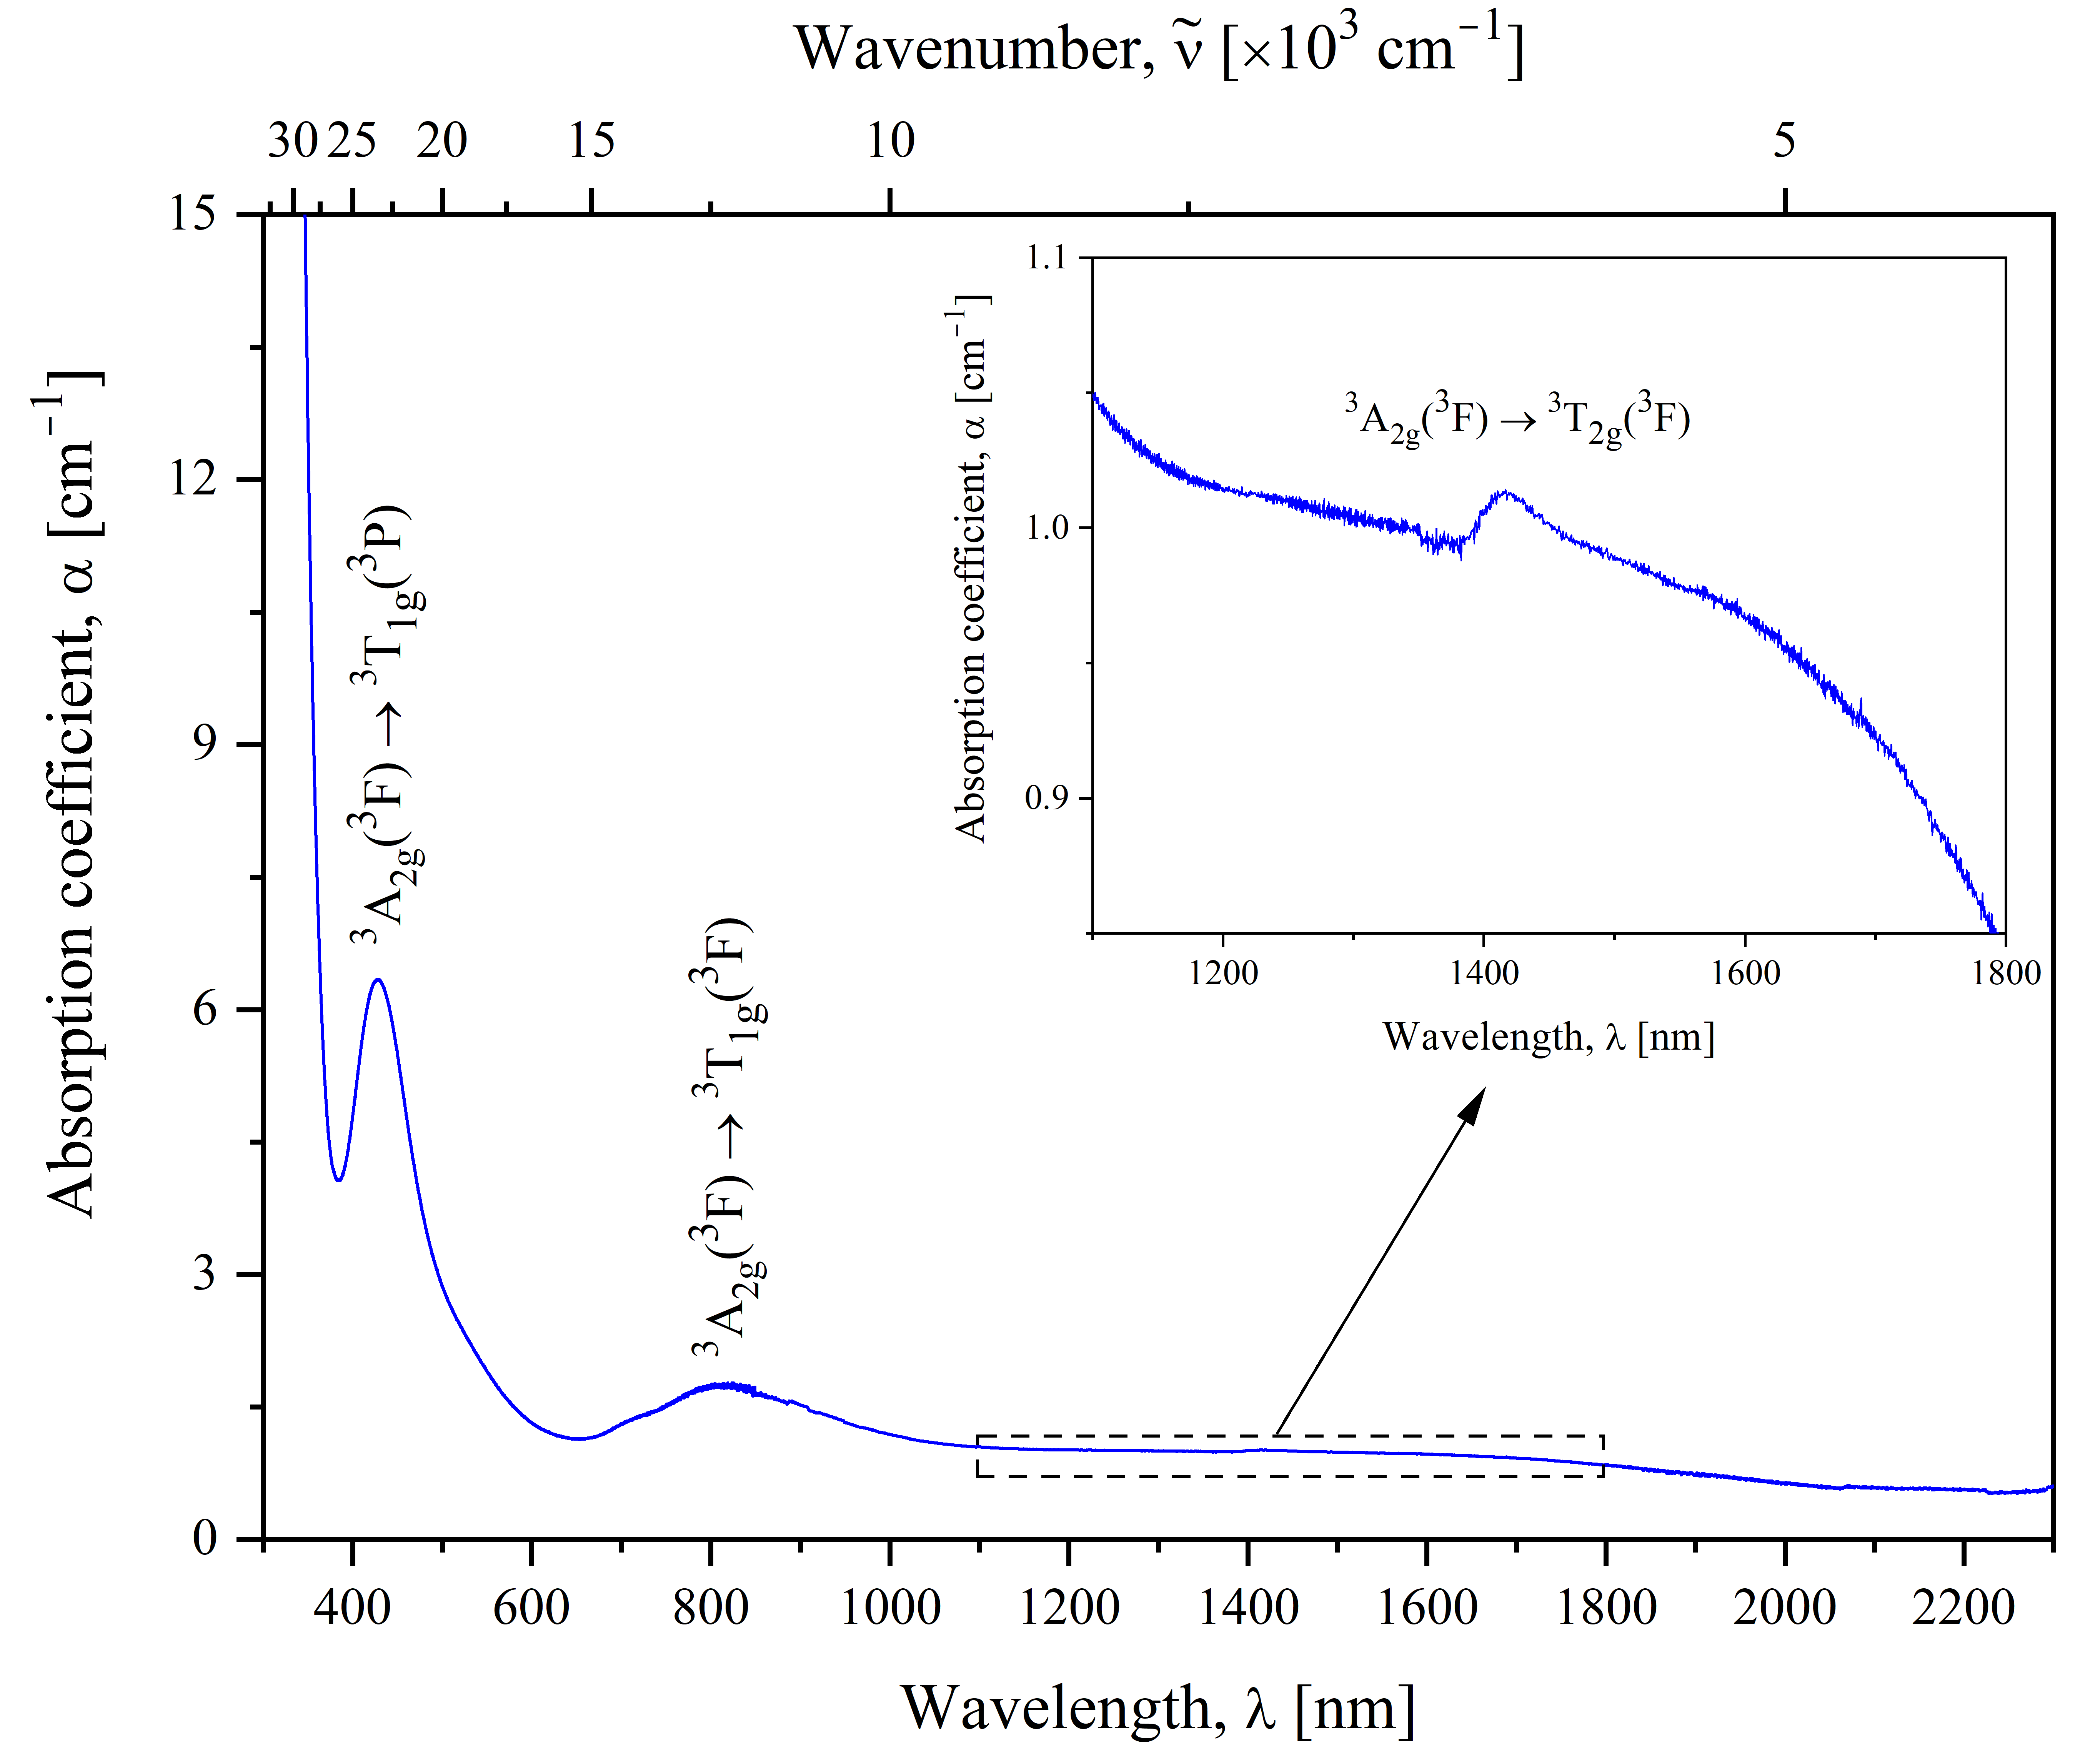
The UV–Vis–NIR optical absorption spectrum of the Li2B4O7:Ni glass is shown in Figure 2. The fundamental absorption edge of the glass host is manifested by a steep increase in the absorbance approximately between 370 nm and 320 nm. In addition to the host absorption edge, three broad absorption bands are observed at 428 nm (23,364 cm−1), 815 nm (12,270 cm−1), and 1417 nm (7057 cm−1). The absorption band at 428 nm is the strongest, whereas the absorption band at 1417 nm is the weakest. After careful examination and verification, the observed absorption bands are related to the 3d–3d transitions of Ni2+ ions.
Figure 2.
Optical absorption spectrum of the Li2B4O7:Ni glass registered in the UV–Vis–NIR spectral range.
The Ni2+ ions contain 8 electrons in the unfilled 3d shell and have five LS terms: two spin-triplets (3F and 3P) and three spin-singlets (1D, 1G, and 1S). The relative positions of the spectroscopic terms can be expressed in terms of the Racah parameters B and C [21]. The 2S+1L terms are split under the influence of the crystal field. In particular, in the octahedral crystal field the 3F ground term splits into the 3A2g, 3T2g, and 3T1g states, the 3P term transforms to the 3T1g state, the 1D term splits into the 1Eg and 1T2g states, the 1G term splits into the 1A1g, 1T1g, 1Eg, and 1T2g states, and the 1S term transforms to the 1A1g state. The crystal field splitting can be analysed using the Tanabe–Sugano diagram [22], which depicts the dependence of E/B on Dq/B for a fixed C/B ratio, where E is the energy of the crystal field state and Dq is the strength of the crystal field.
The observed three broad absorption bands peaking at 428 nm, 815 nm, and 1417 nm are assigned to the spin-allowed transitions 3A2g (3F) → 3T2g (3F), 3A2g (3F) → 3T1g (3F), and 3A2g (3F) → 3T1g (3P), respectively. The relatively large bandwidths of these transitions are consistent with the distribution of local crystal-field environments expected for Ni2+ centres in a structurally disordered glass. Spin-forbidden triplet-singlet transitions are not observed in Figure 2 due to their low intensity caused by the spin-forbidden character. Besides this, the inhomogeneous broadening of spin-allowed absorption bands caused by the disordered structure of the Li2B4O7:Ni glass can hide weak triplet-singlet transitions.
The energies of the three triplet crystal field states can be expressed analytically as functions of the crystal-field parameter Dq and the Racah parameter B by solving the corresponding Tanabe–Sugano matrices. The explicit expressions used in the present analysis are the following:
E(3T2g(3F)) = 10Dq
Using the energies obtained from the optical absorption spectrum, it is possible to calculate the Dq and B values from different pairs of transitions. It is possible to obtain three sets of Dq and B values using Equations (2) and (3), Equations (2) and (4), and Equations (3) and (4). As a result, slightly different values of the Dq and B parameters were obtained depending on the equations used for the calculation. In particular, Dq = 706 cm−1 was obtained using Equations (2) and (3), and Equations (2) and (4), B = 943 cm−1 was obtained using Equations (2) and (4) as well as Dq = 727 cm−1 and B = 921 cm−1 were obtained using Equations (3) and (4). The differences between the obtained values are expected for a structurally disordered glass host, where the local crystal field is not perfectly described in the framework of an ideal octahedral model.
A weak shoulder near 520 nm is visible on the long-wavelength side of the strongest absorption band at 428 nm. This shoulder can be associated with Ni2+ ions in the trigonal bipyramidal geometry (five-fold coordination) according to [11,12]. However, this assignment cannot be considered unambiguous because the shoulder lies close to the intense 428 nm absorption band and may also contain contributions from weak spin-forbidden transitions or from the splitting and broadening of crystal-field states in a distorted octahedral environment. Moreover, additional absorption bands that could be unambiguously assigned to the five-coordinated Ni2+ ions were not observed or were hidden by the broad absorption of the six-coordinated Ni2+ ions. On the one hand, the attribution of the shoulder around 520 nm to the five-coordinated Ni2+ ions has sense, but on the other hand, it can also be associated with several inhomogeneously broadened spin-forbidden transitions of Ni2+ ions or with the distortion of the octahedral field (Jahn-Teller effect). Therefore, in the further analysis only the three well-defined absorption maxima related exclusively to the octahedral geometry of the ligand field are considered.
To obtain a single consistent set of crystal-field parameters, the three experimental transition energies were fitted simultaneously using a least-squares procedure. The Dq and B parameters were determined by minimising the root mean square deviation between the experimental energies obtained from the optical absorption spectrum and the theoretical energies calculated from Equations (2)–(4). Using this method, it is possible to obtain Dq = 720.3 cm−1 and B = 928.7 cm−1. Consequently, the Dq/B ratio equals 0.776 and indicates a weak crystal field in the Li2B4O7:Ni glass. A strong crystal field condition usually corresponds to the relation Dq/B > 1.6, in which the first excited crystal field state is 1Eg (1D) instead of 3T2g (3F) for the weak crystal field.
It should be noted that the theoretical energies given by Equations (2)–(4) are non-linearly dependent on the Dq and B parameters. As a result, obtaining uncertainties of the Dq and B values is a very complicated task. Therefore, the Monte Carlo method according to the procedure described in [23] was used to estimate the uncertainties of the fitted parameters. Two hundred sets of simulated transition energies were generated by randomly varying the experimental energies within their respective uncertainties. For each simulated data set, Dq and B were recalculated using the same least-squares fitting procedure as for the experimental data. The resulting distributions of Dq and B were approximately Gaussian, with standard deviations of 7.3 and 4.9 cm−1, respectively. The 95% confidence intervals give Dq = 720 ± 15 cm−1 and B = 929 ± 10 cm−1. The obtained Dq/B = 0.776 ± 0.024 value in the Li2B4O7:Ni glass will be used below for the identification of Ni2+ transitions in the luminescence spectra using the Tanabe–Sugano diagram [22].
3.3. Luminescence Excitation and Emission Spectra in the UV–Vis Range
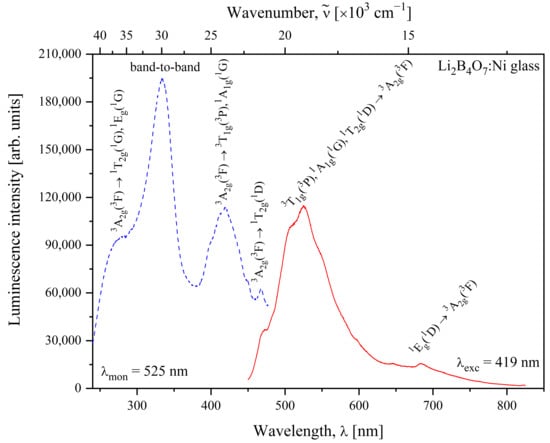
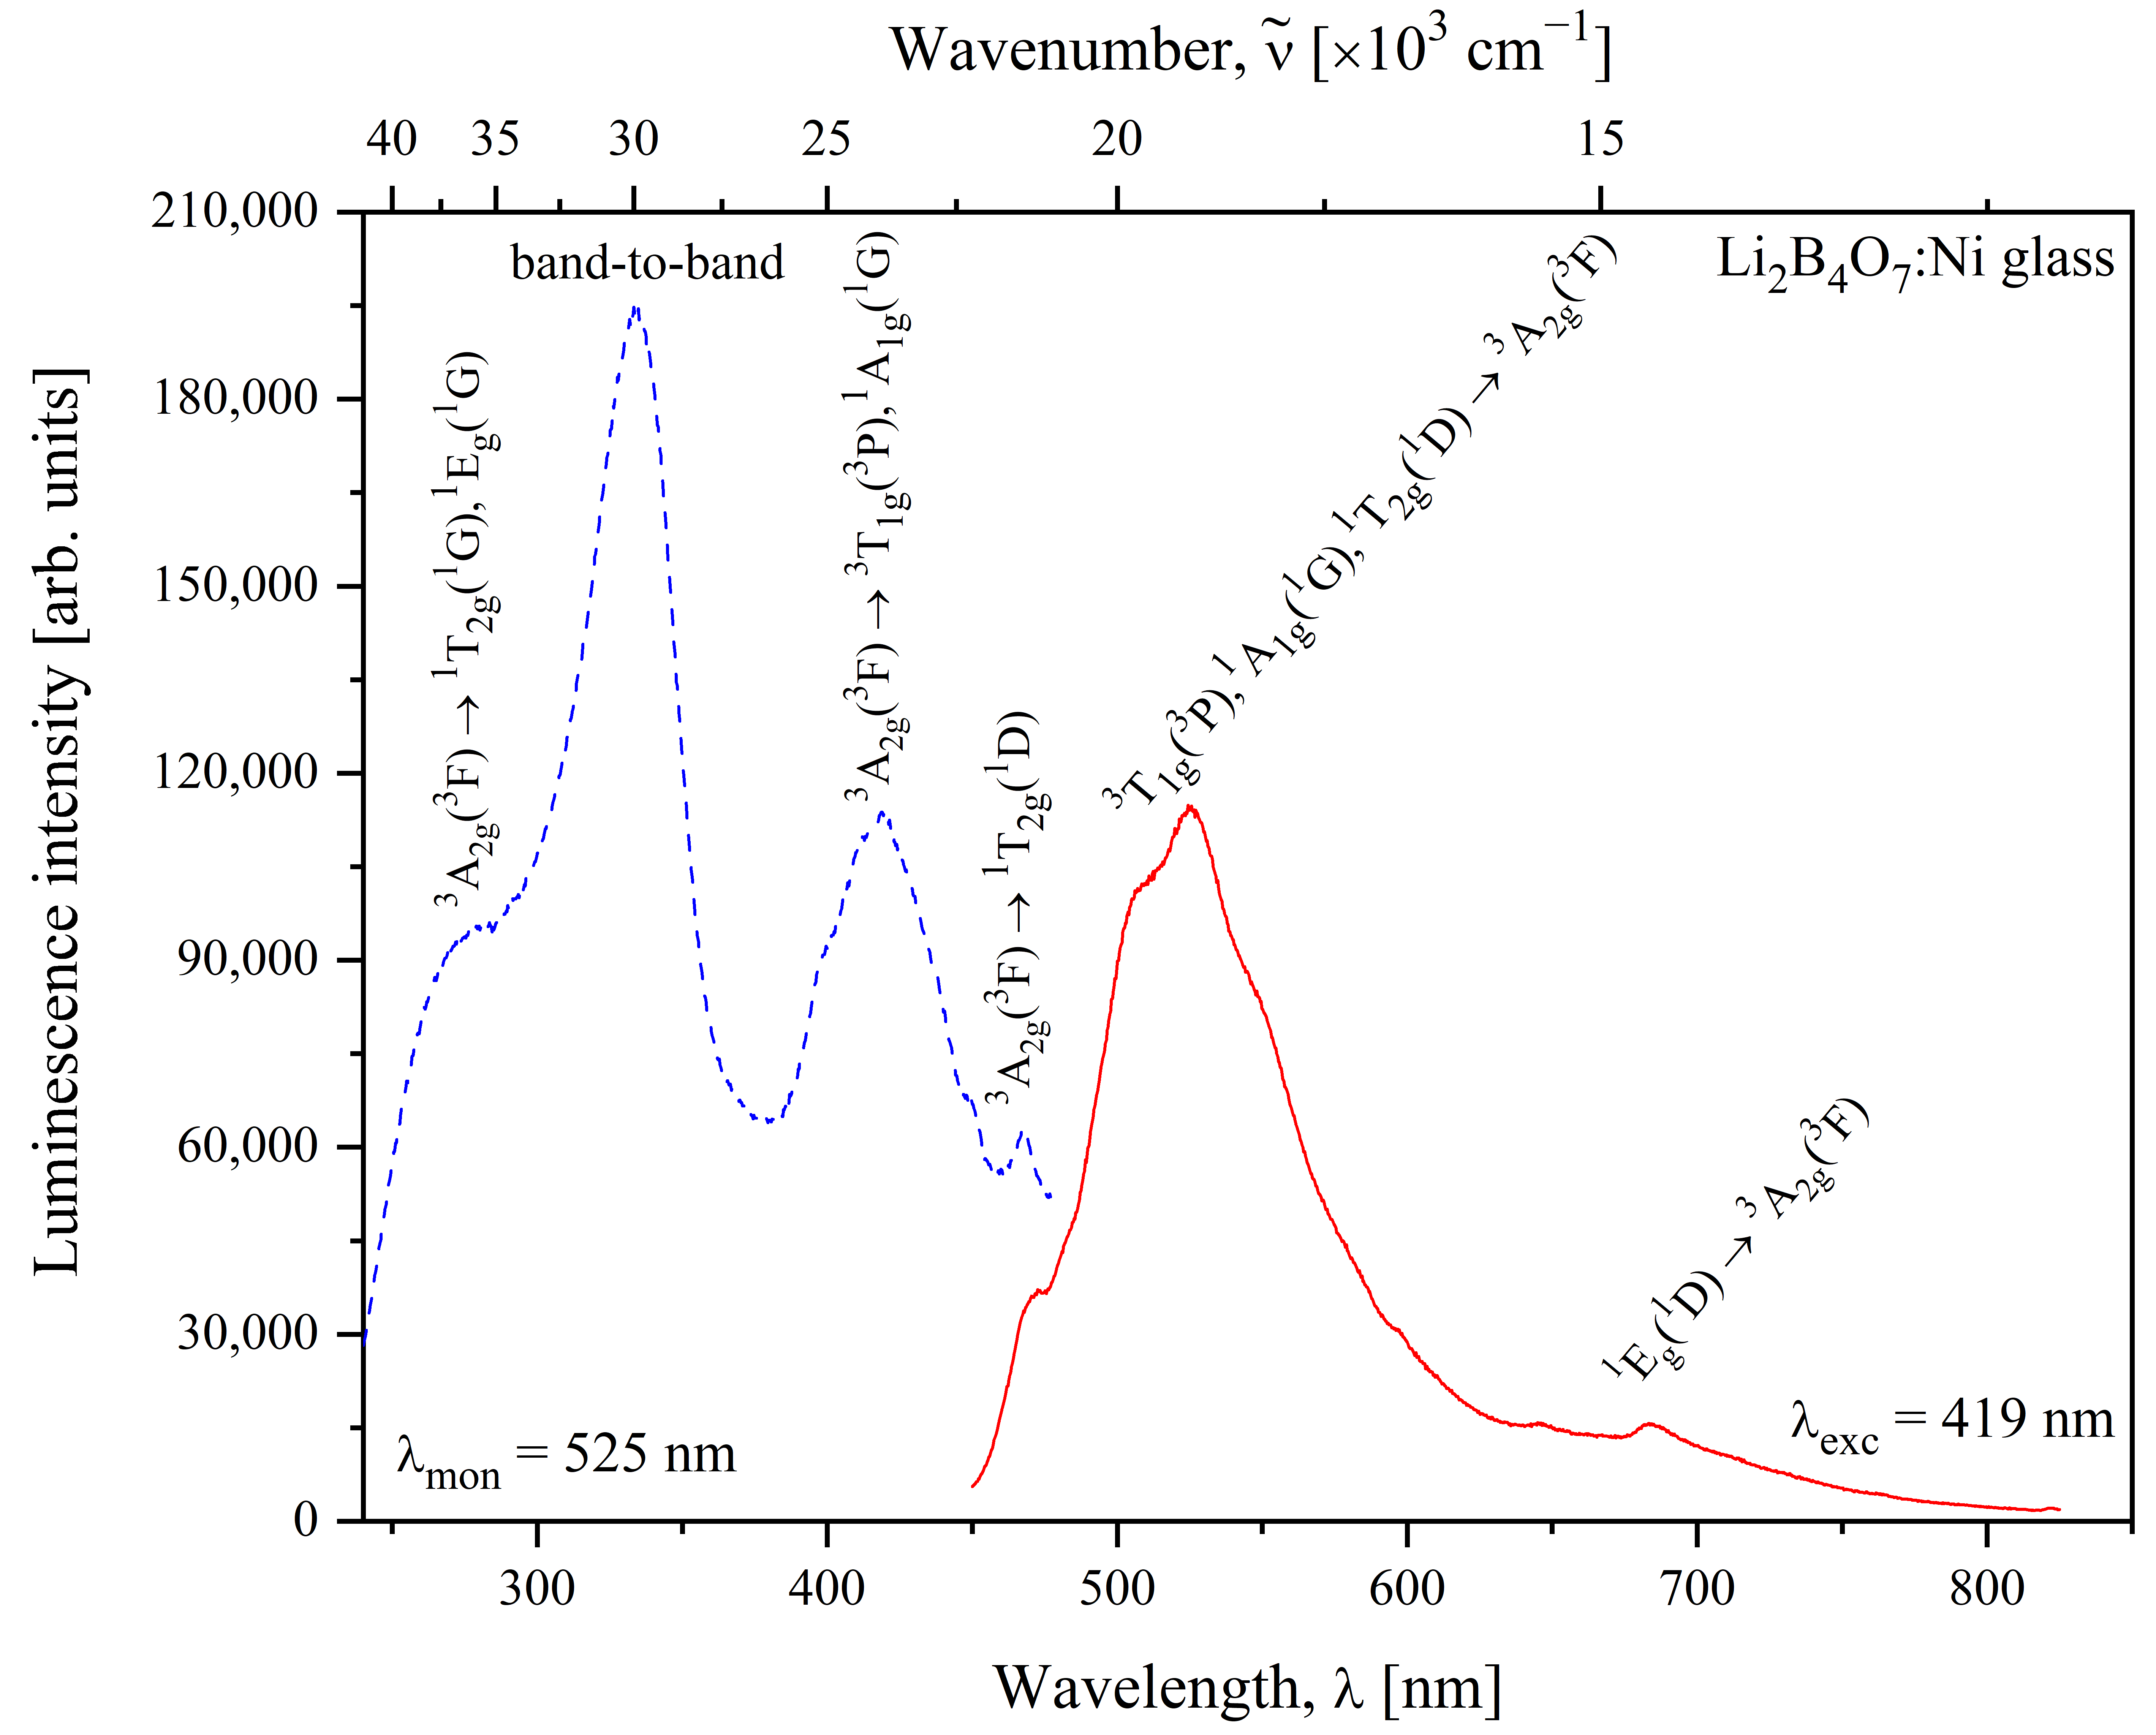
The strongest Ni2+ absorption band is at 428 nm; therefore, excitation in the violet-blue spectral region is particularly effective for investigating the luminescence of the Ni-doped Li2B4O7 glass. The photoluminescence excitation and emission spectra of the Li2B4O7:Ni glass are presented in Figure 3. First, a series of emission spectra was registered under excitation at different wavelengths in the violet-blue spectral region in order to determine the excitation wavelength providing the highest emission intensity. The emission spectrum of the Li2B4O7:Ni glass was registered upon excitation at 419 nm and is given by the red curve in Figure 3.
Figure 3.
Luminescence excitation (blue dashed curve) and emission (red solid curve) spectra of the Li2B4O7:Ni glass, registered under excitation at λexc = 419 nm and by monitoring at λmon = 525 nm, respectively.
The emission spectrum exhibits a strong broad band at 525 nm (19,048 cm−1) and a much weaker band near 684 nm (14,620 cm−1). The full width at half maximum (FWHM) of the green emission band equals 77 nm (2787 cm−1). The emission band peaked at 525 nm belongs to the 3T1g (3P) → 3A2g (3F) transition of Ni2+ ions. It should be noted that the 1A1g (1G) → 3A2g (3F) and 1T2g (1D) → 3A2g (3F) spin-forbidden transitions can also contribute to the green emission of the Li2B4O7:Ni glass, as the 1A1g (1G) and 1T2g (1D) states lie in the vicinity of the 3T1g (3P) state at Dq/B = 0.776. The weak emission band peaked near 684 nm belongs to the 1Eg (1D) → 3A2g (3F) transition of Ni2+ ions.
The excitation spectrum of the Li2B4O7:Ni glass given in Figure 3 was registered by monitoring the intensity of the emission peak at 525 nm. The excitation spectrum consists of an intense band at 419 nm, a weak band at 467 nm, a very intense band at 334 nm, and a shoulder near 280–290 nm. The intense band at 419 nm (23,866 cm−1) belongs to the 3A2g (3F) → 3T1g (3P) transition of Ni2+ ions. The 3A2g (3F) → 1A1g (1G) transition can also contribute to the band at 419 nm because the 3T1g (3P) and 1A1g (1G) states are very close at Dq/B = 0.776. The weak band at 467 nm (21,413 cm−1) is related to the 3A2g (3F) → 1T2g (1D) transition of Ni2+ ions. The very intense band at 334 nm cannot be related to nickel impurity, because Ni2+ ions in the Li2B4O7:Ni glass do not exhibit any spin-allowed transitions in the UV region within the present crystal-field model. The band at 334 nm agrees well with the fundamental absorption edge of the glass host and can be attributed to the band-to-band transition of the Li2B4O7:Ni glass. The shoulder near 280–290 nm can be assigned to the 3A2g (3F) → 1Eg (1G) and 3A2g (3F) → 1T2g (1G) transitions of Ni2+ ions.
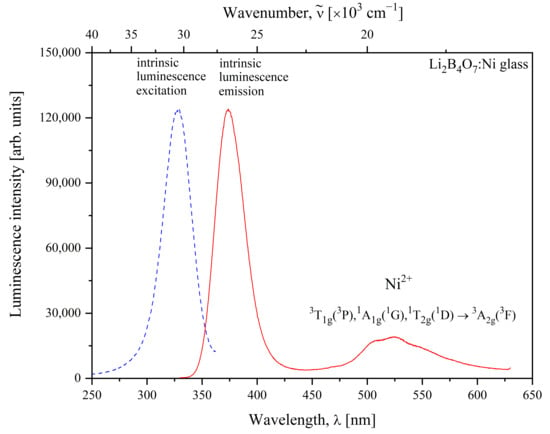
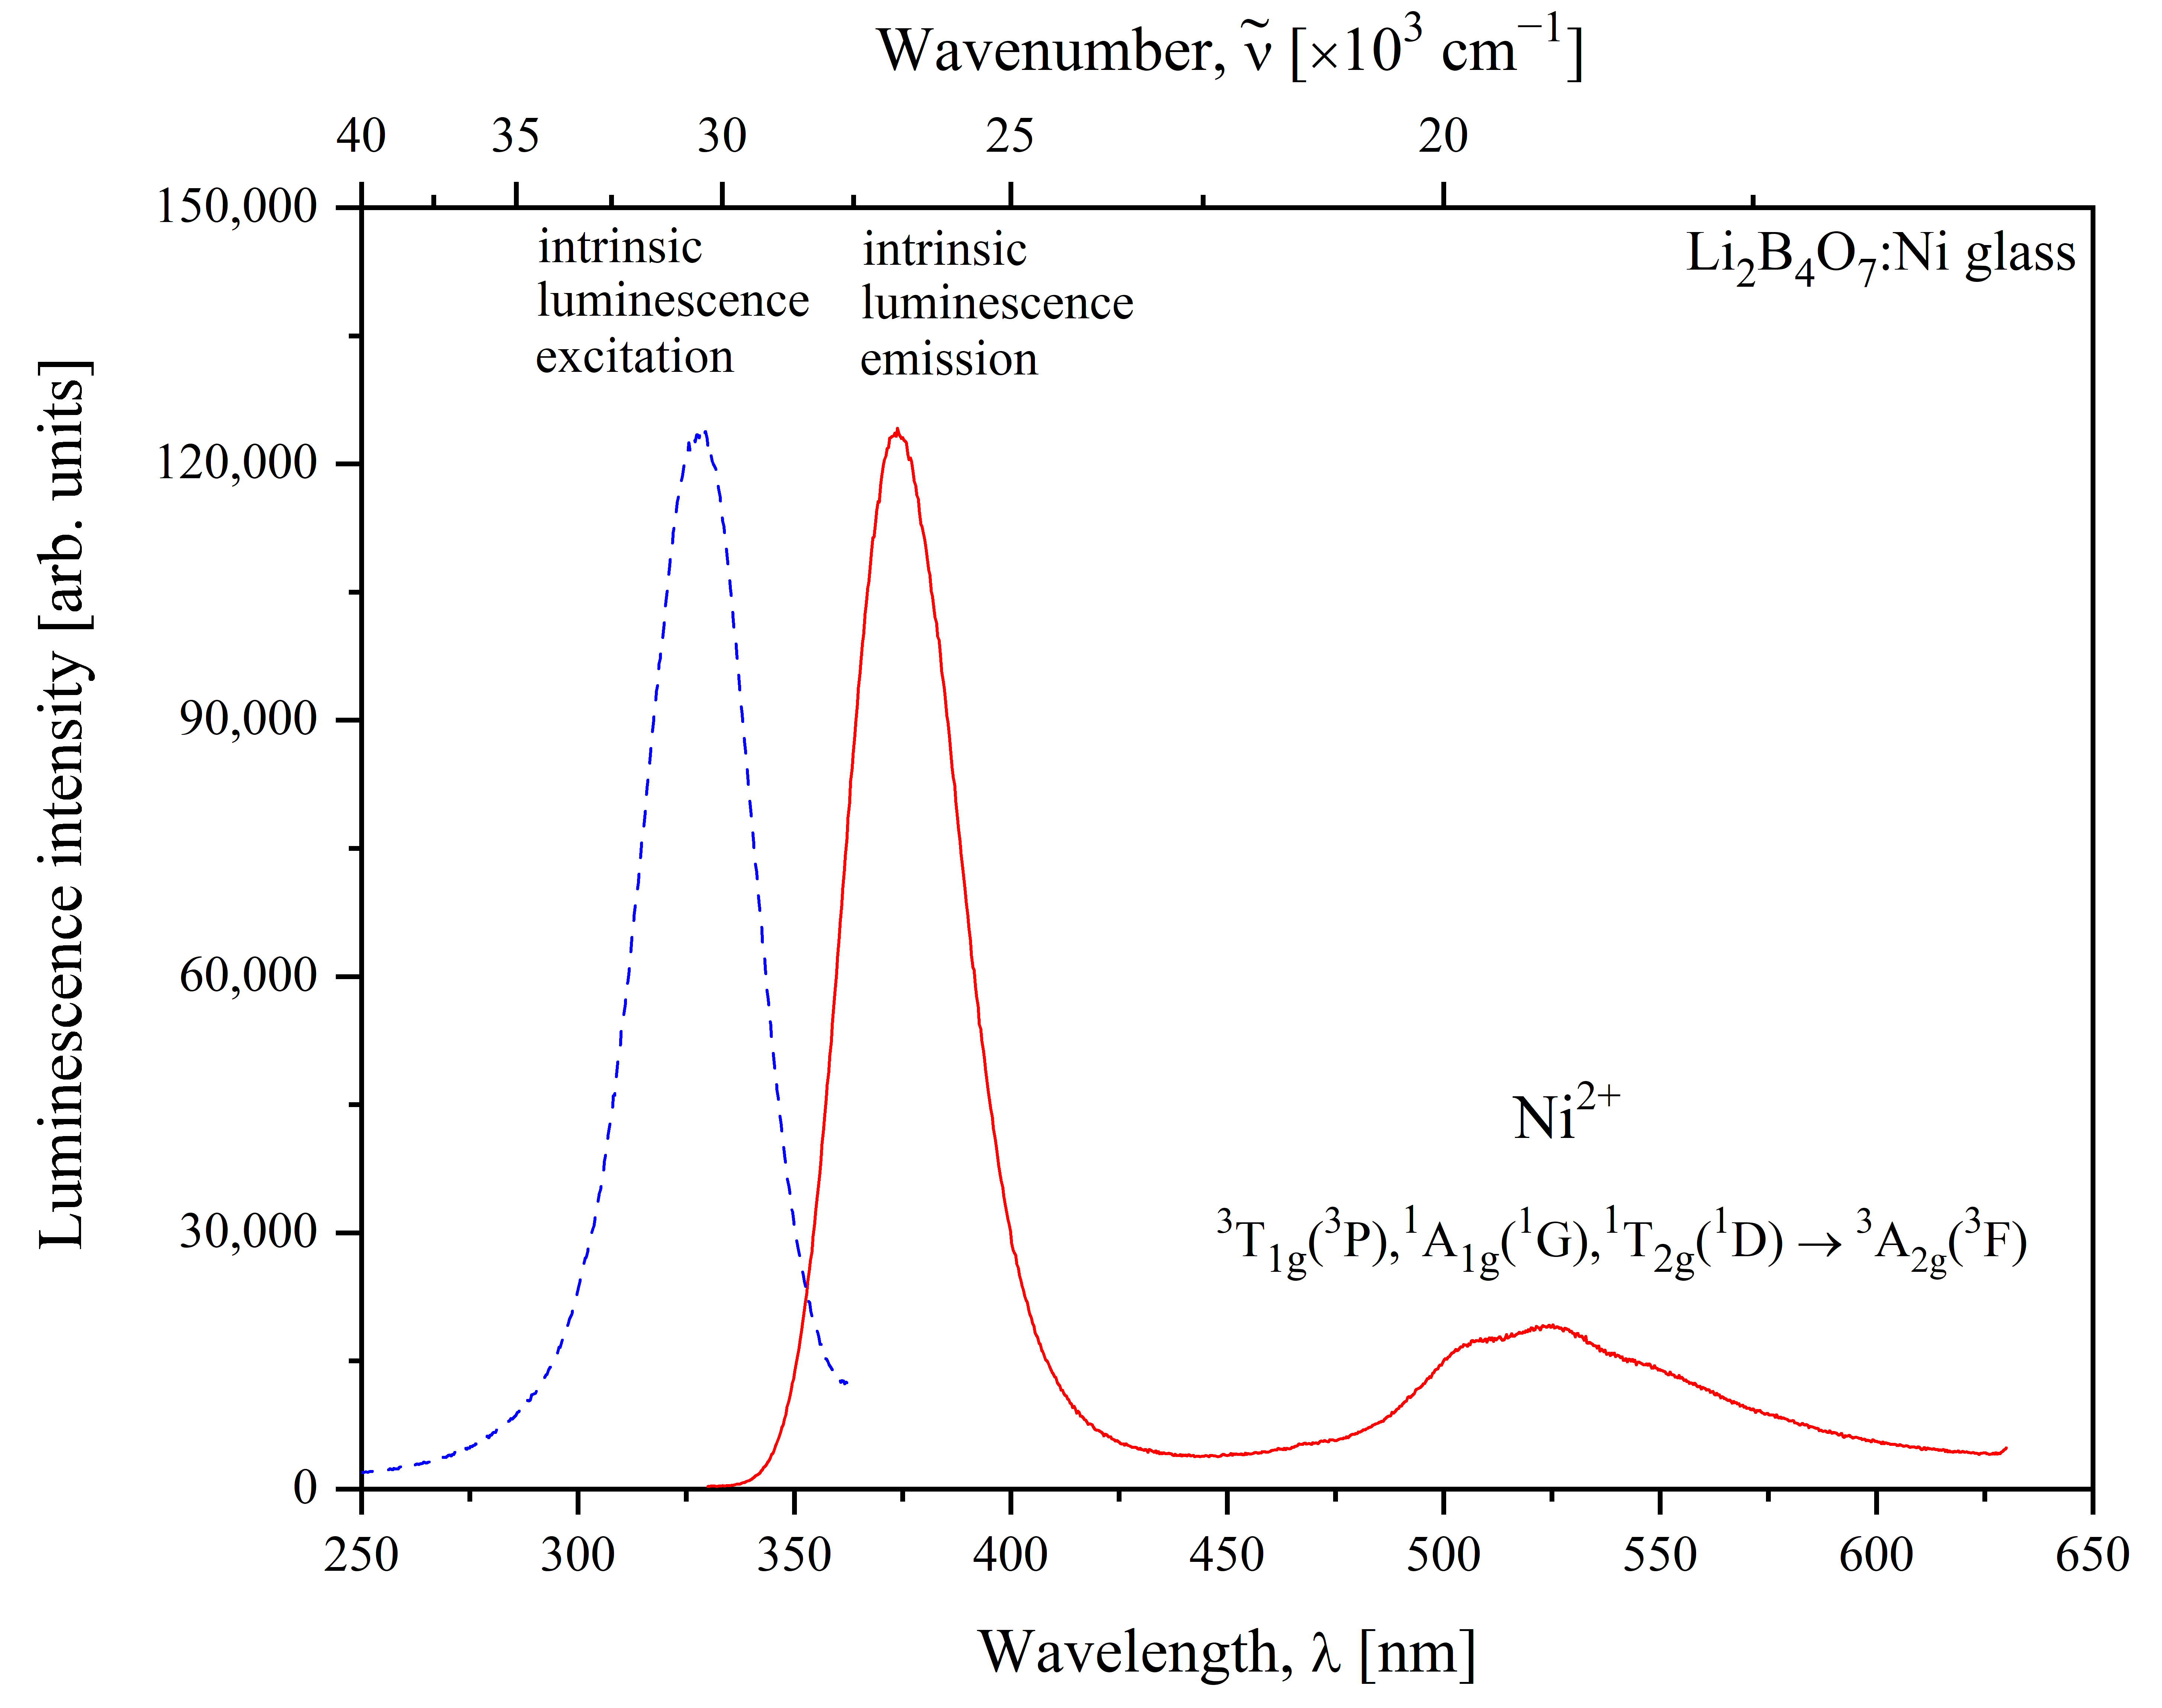
The emission and excitation spectra of the intrinsic luminescence caused by the band-to-band electron-hole recombination are given in Figure 4. The results obtained for the Li2B4O7:Ni glass are very similar to those reported by us for undoped borate glasses in [24]. In particular, the undoped borate glasses with Li2B4O7, LiKB4O7, CaB4O7, and LiCaBO3 compositions exhibit a luminescence band in the 360–400 nm spectral region with very fast decay kinetics upon excitation at 310–340 nm [24]. The emission spectrum of the Li2B4O7:Ni glass given in Figure 4 shows the intrinsic host-related emission band at 374 nm and the Ni2+ emission band at 525 nm. The presence of Ni2+ luminescence under excitation in the host absorption region is consistent with energy transfer from the glass network to the nickel impurity.
Figure 4.
Luminescence excitation (blue dashed curve) and emission (red solid curve) spectra associated with the intrinsic luminescence in the Li2B4O7:Ni glass.
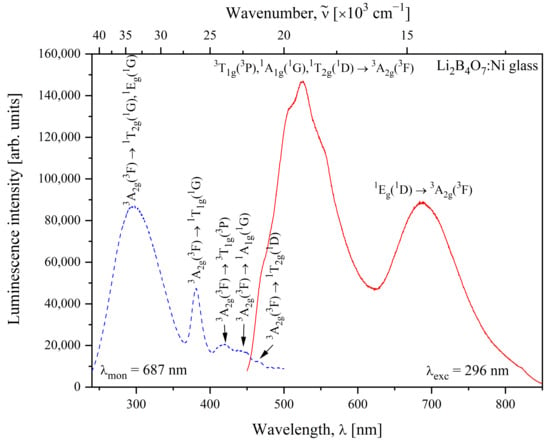
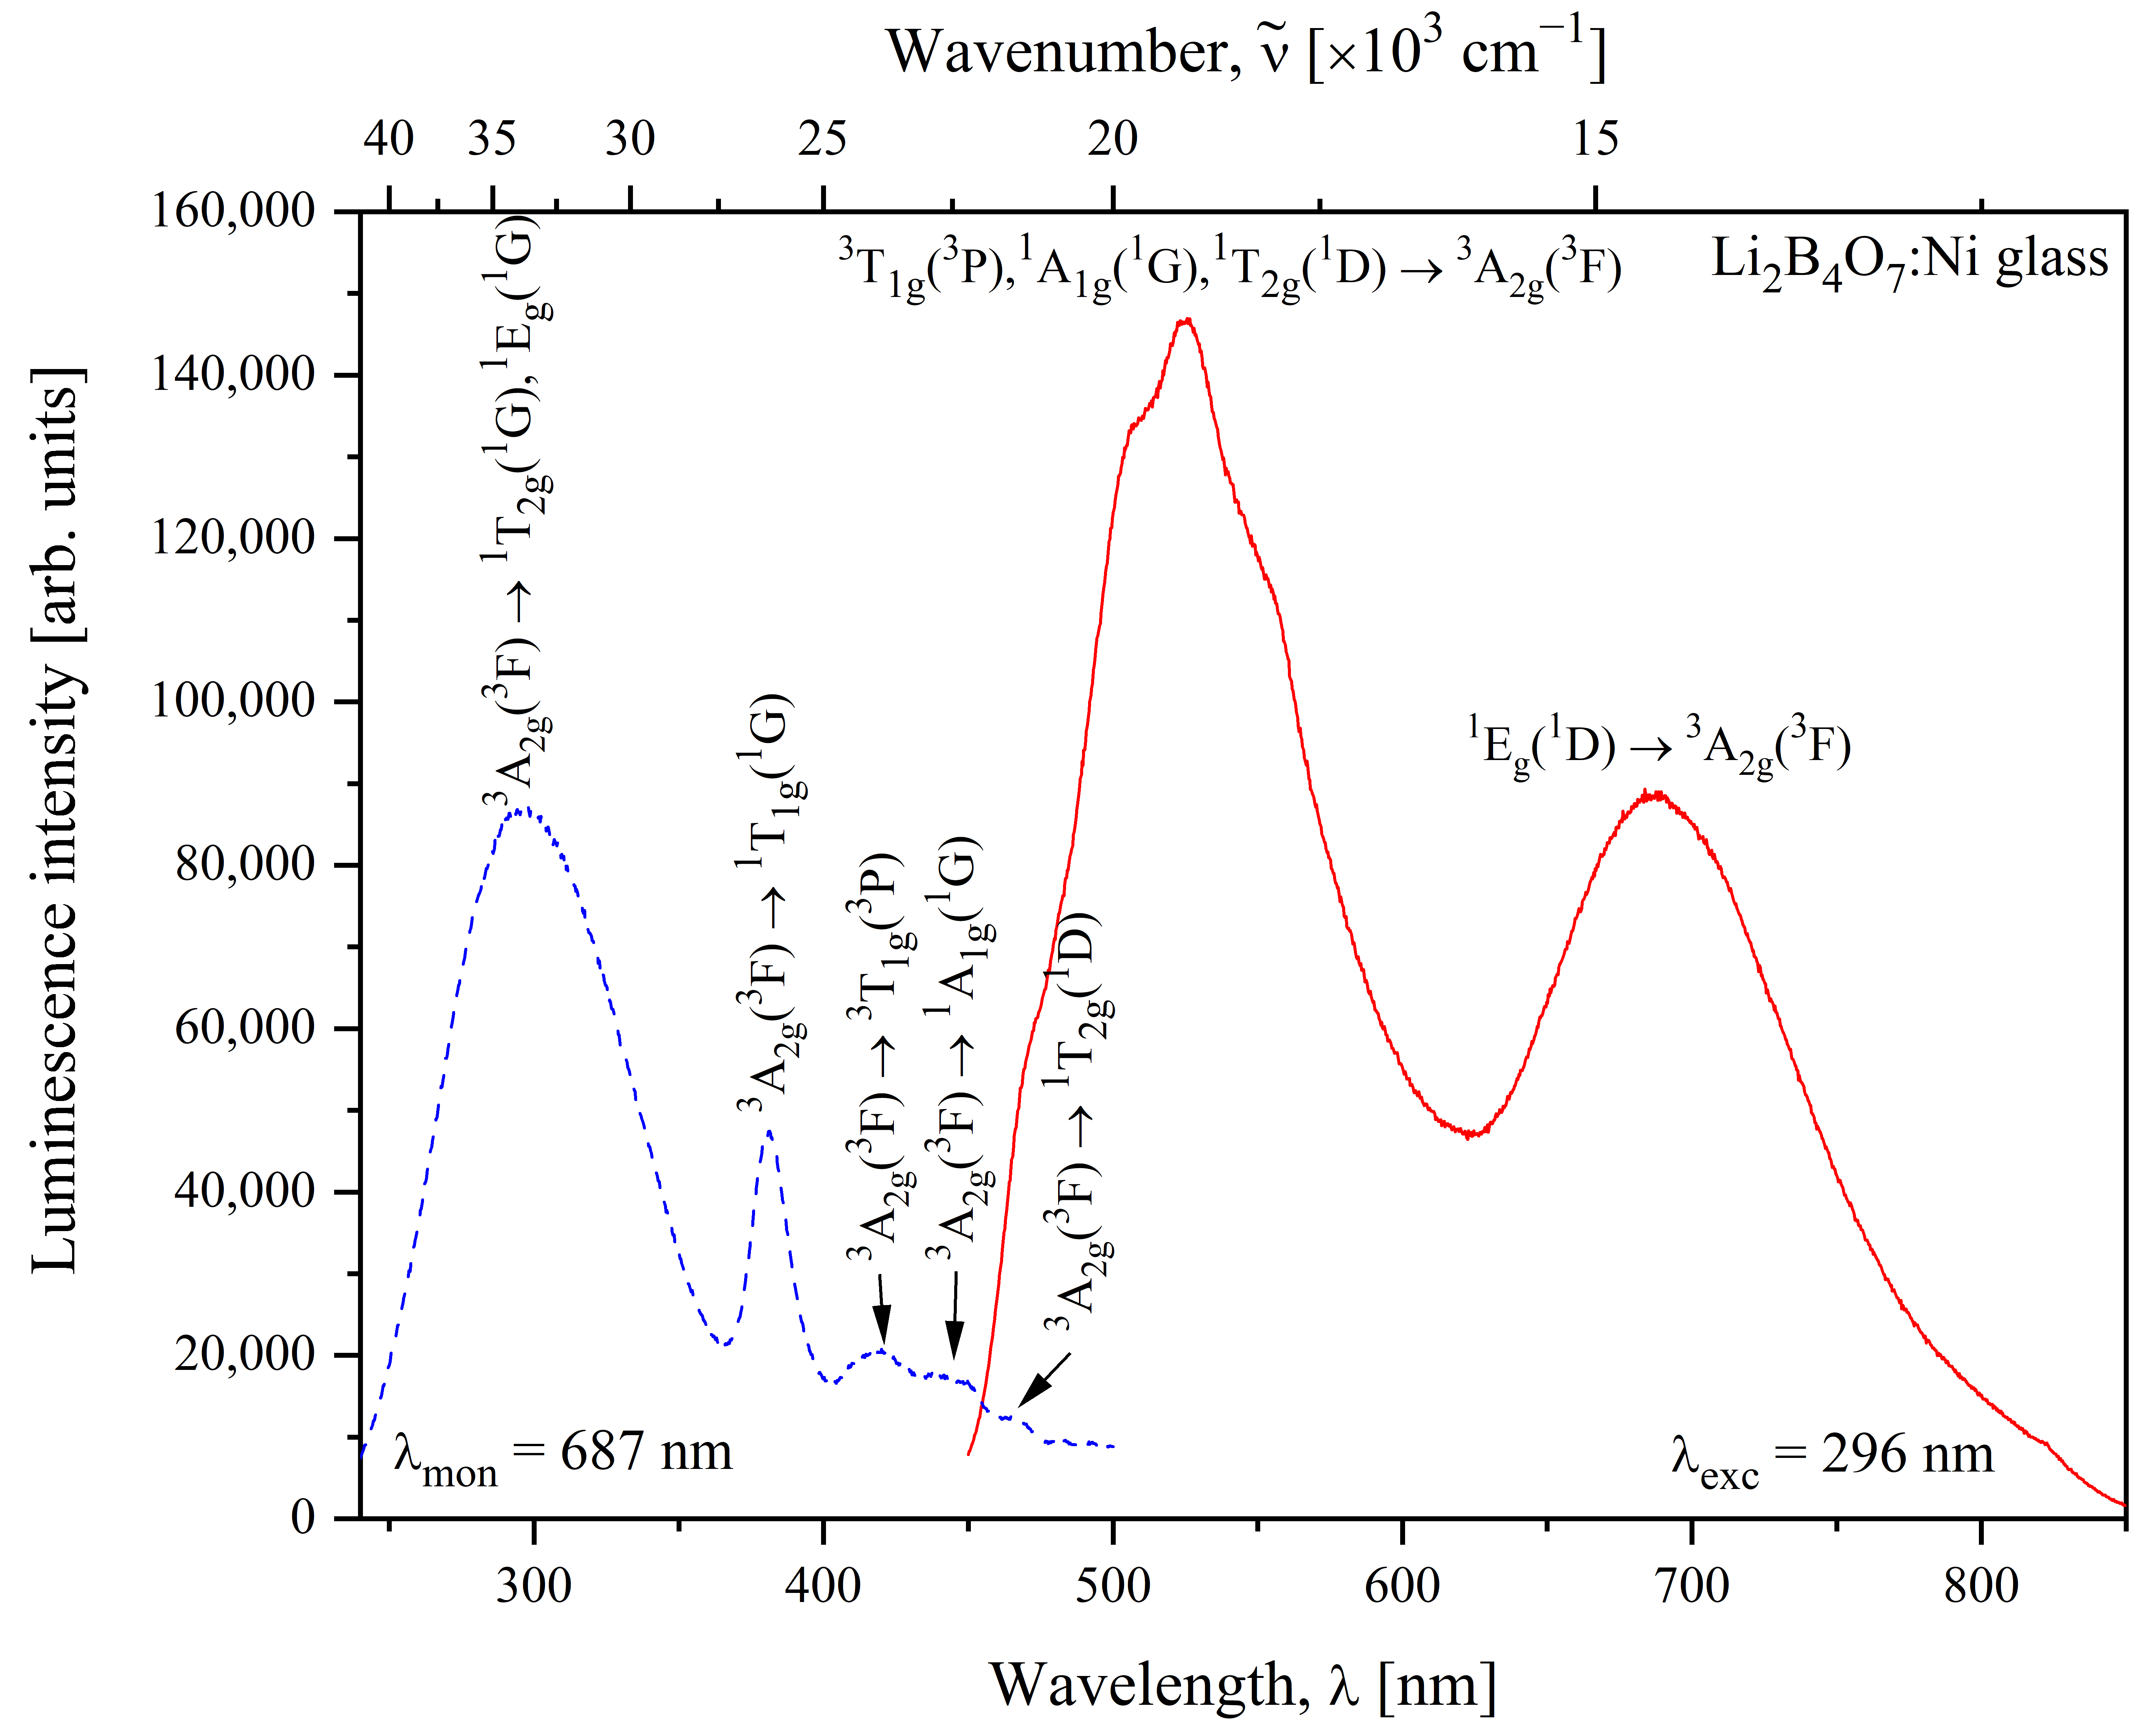
In addition to the green luminescence, the Li2B4O7:Ni glass also exhibits a weaker red emission. The excitation spectrum of the 1Eg (1D) → 3A2g (3F) emission band of Ni2+ ions in the Li2B4O7:Ni glass is shown in Figure 5. It can be seen that the excitation spectrum of the red emission in Figure 5 is different from the excitation spectrum of the green emission given in Figure 3. The excitation spectrum given in Figure 5 consists of an intense broad band at 296 nm, an intense band at 381 nm, and three weak bands in the spectral range of 405–475 nm. The intense broad band with a maximum at 296 nm (33,784 cm−1) and FWHM of 78 nm (8665 cm−1) corresponds to the 3A2g (3F) → 1Eg (1G) and 3A2g (3F) → 1T2g (1G) transitions of Ni2+ ions. The broad nature of this band can also be caused by the influence of the band-to-band transition of the glass host. The band peaked at 381 nm (26,247 cm−1) with FWHM of 22 nm (1547 cm−1) belongs to the 3A2g (3F) → 1T1g (1G) transition of Ni2+ ions. Finally, the three weak bands in the spectral range of 405–475 nm belong to the 3A2g (3F) → 3T1g (3P), 3A2g (3F) → 1A1g (1G), and 3A2g (3F) → 1T2g (1D) transitions of Ni2+ ions. The relative enhancement of the red emission under UV excitation compared with violet-blue excitation is consistent with the increased contribution of higher-lying singlet states to the excitation pathways of the red emission.
Figure 5.
Luminescence excitation (blue dashed curve) and emission (red solid curve) spectra of the Li2B4O7:Ni glass, registered under excitation at λexc = 296 nm and by monitoring λmon = 687 nm, respectively.
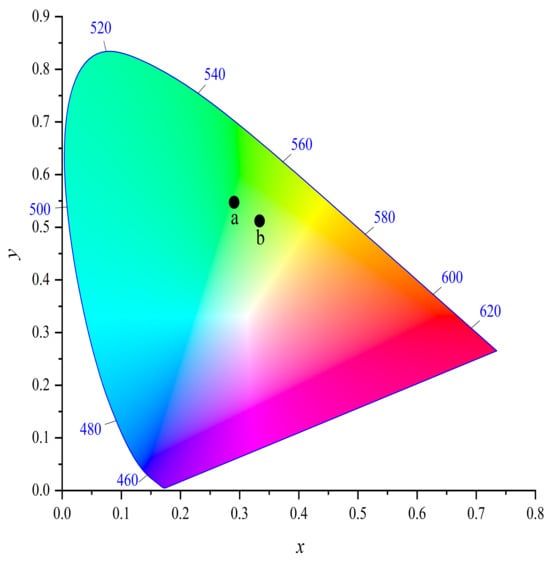
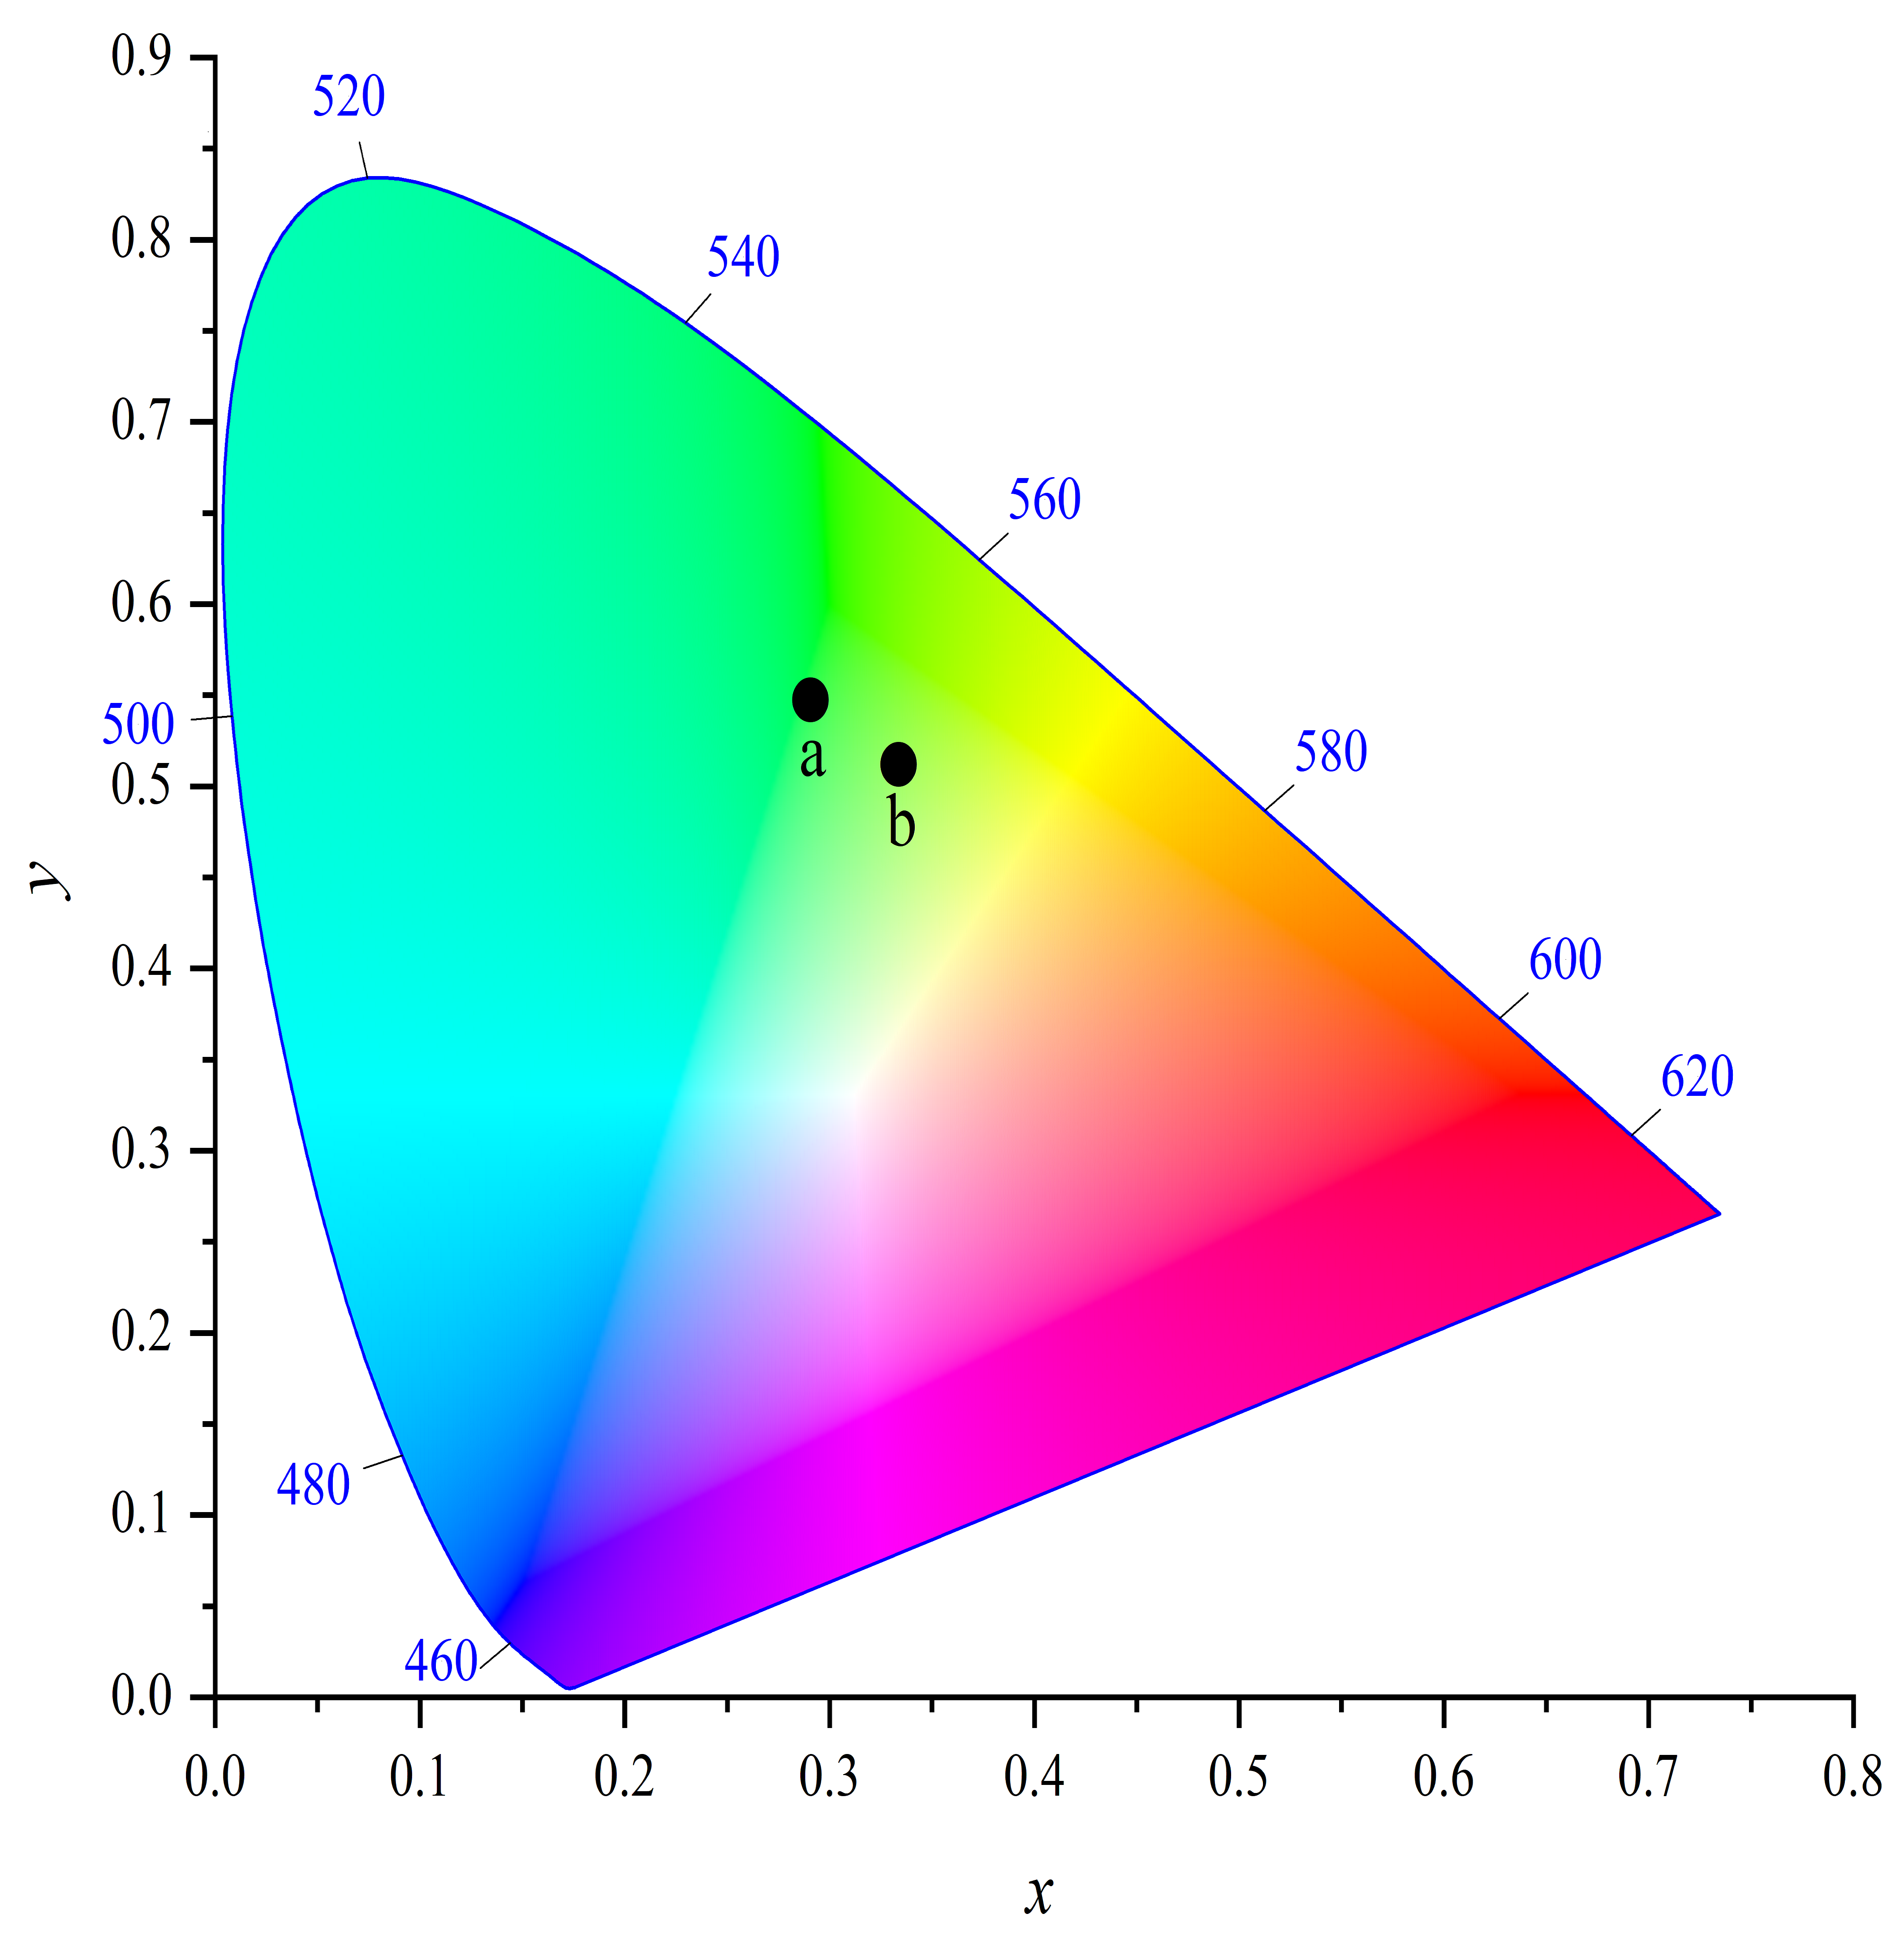
The CIE chromaticity diagram of the Li2B4O7:Ni glass is given in Figure 6. The chromaticity coordinates were determined using the CIE 1931 standard colourimetric system [25] with the 2° standard observer. First, the CIE tristimulus values (X, Y, and Z) were calculated by integrating the spectral data multiplied by the colour-matching functions. Then, the chromaticity coordinates (x, y) were calculated from these tristimulus values. Further details of the calculation procedure can be found elsewhere [26]. The emission colour of the investigated glass under excitation at 419 nm and 296 nm is represented by the symbol “•” marked by (a) and (b), respectively. It can be seen that the emission colour of the Li2B4O7:Ni glass under the UV and violet-blue excitation is quite similar. Only a slight shift from the green to the yellowish-green spectral region can be observed due to the increase in intensity of the red Ni2+ emission under UV excitation.
Figure 6.
CIE diagram showing the emission colour coordinates of the Li2B4O7:Ni glass upon excitation at 419 nm (marked with “•” and labelled as (a)) and 296 nm (marked with “•” and labelled as (b)).
3.4. Luminescence Emission Spectra in the NIR Range
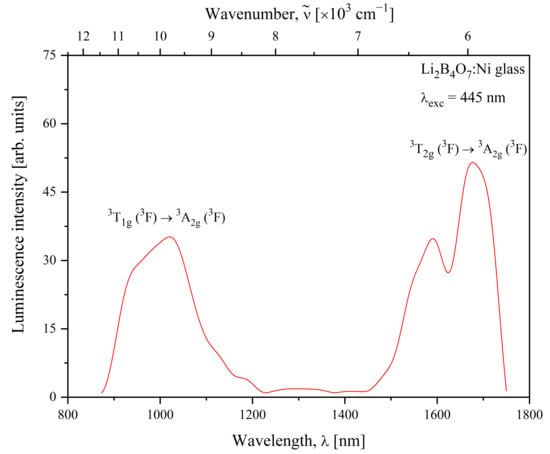
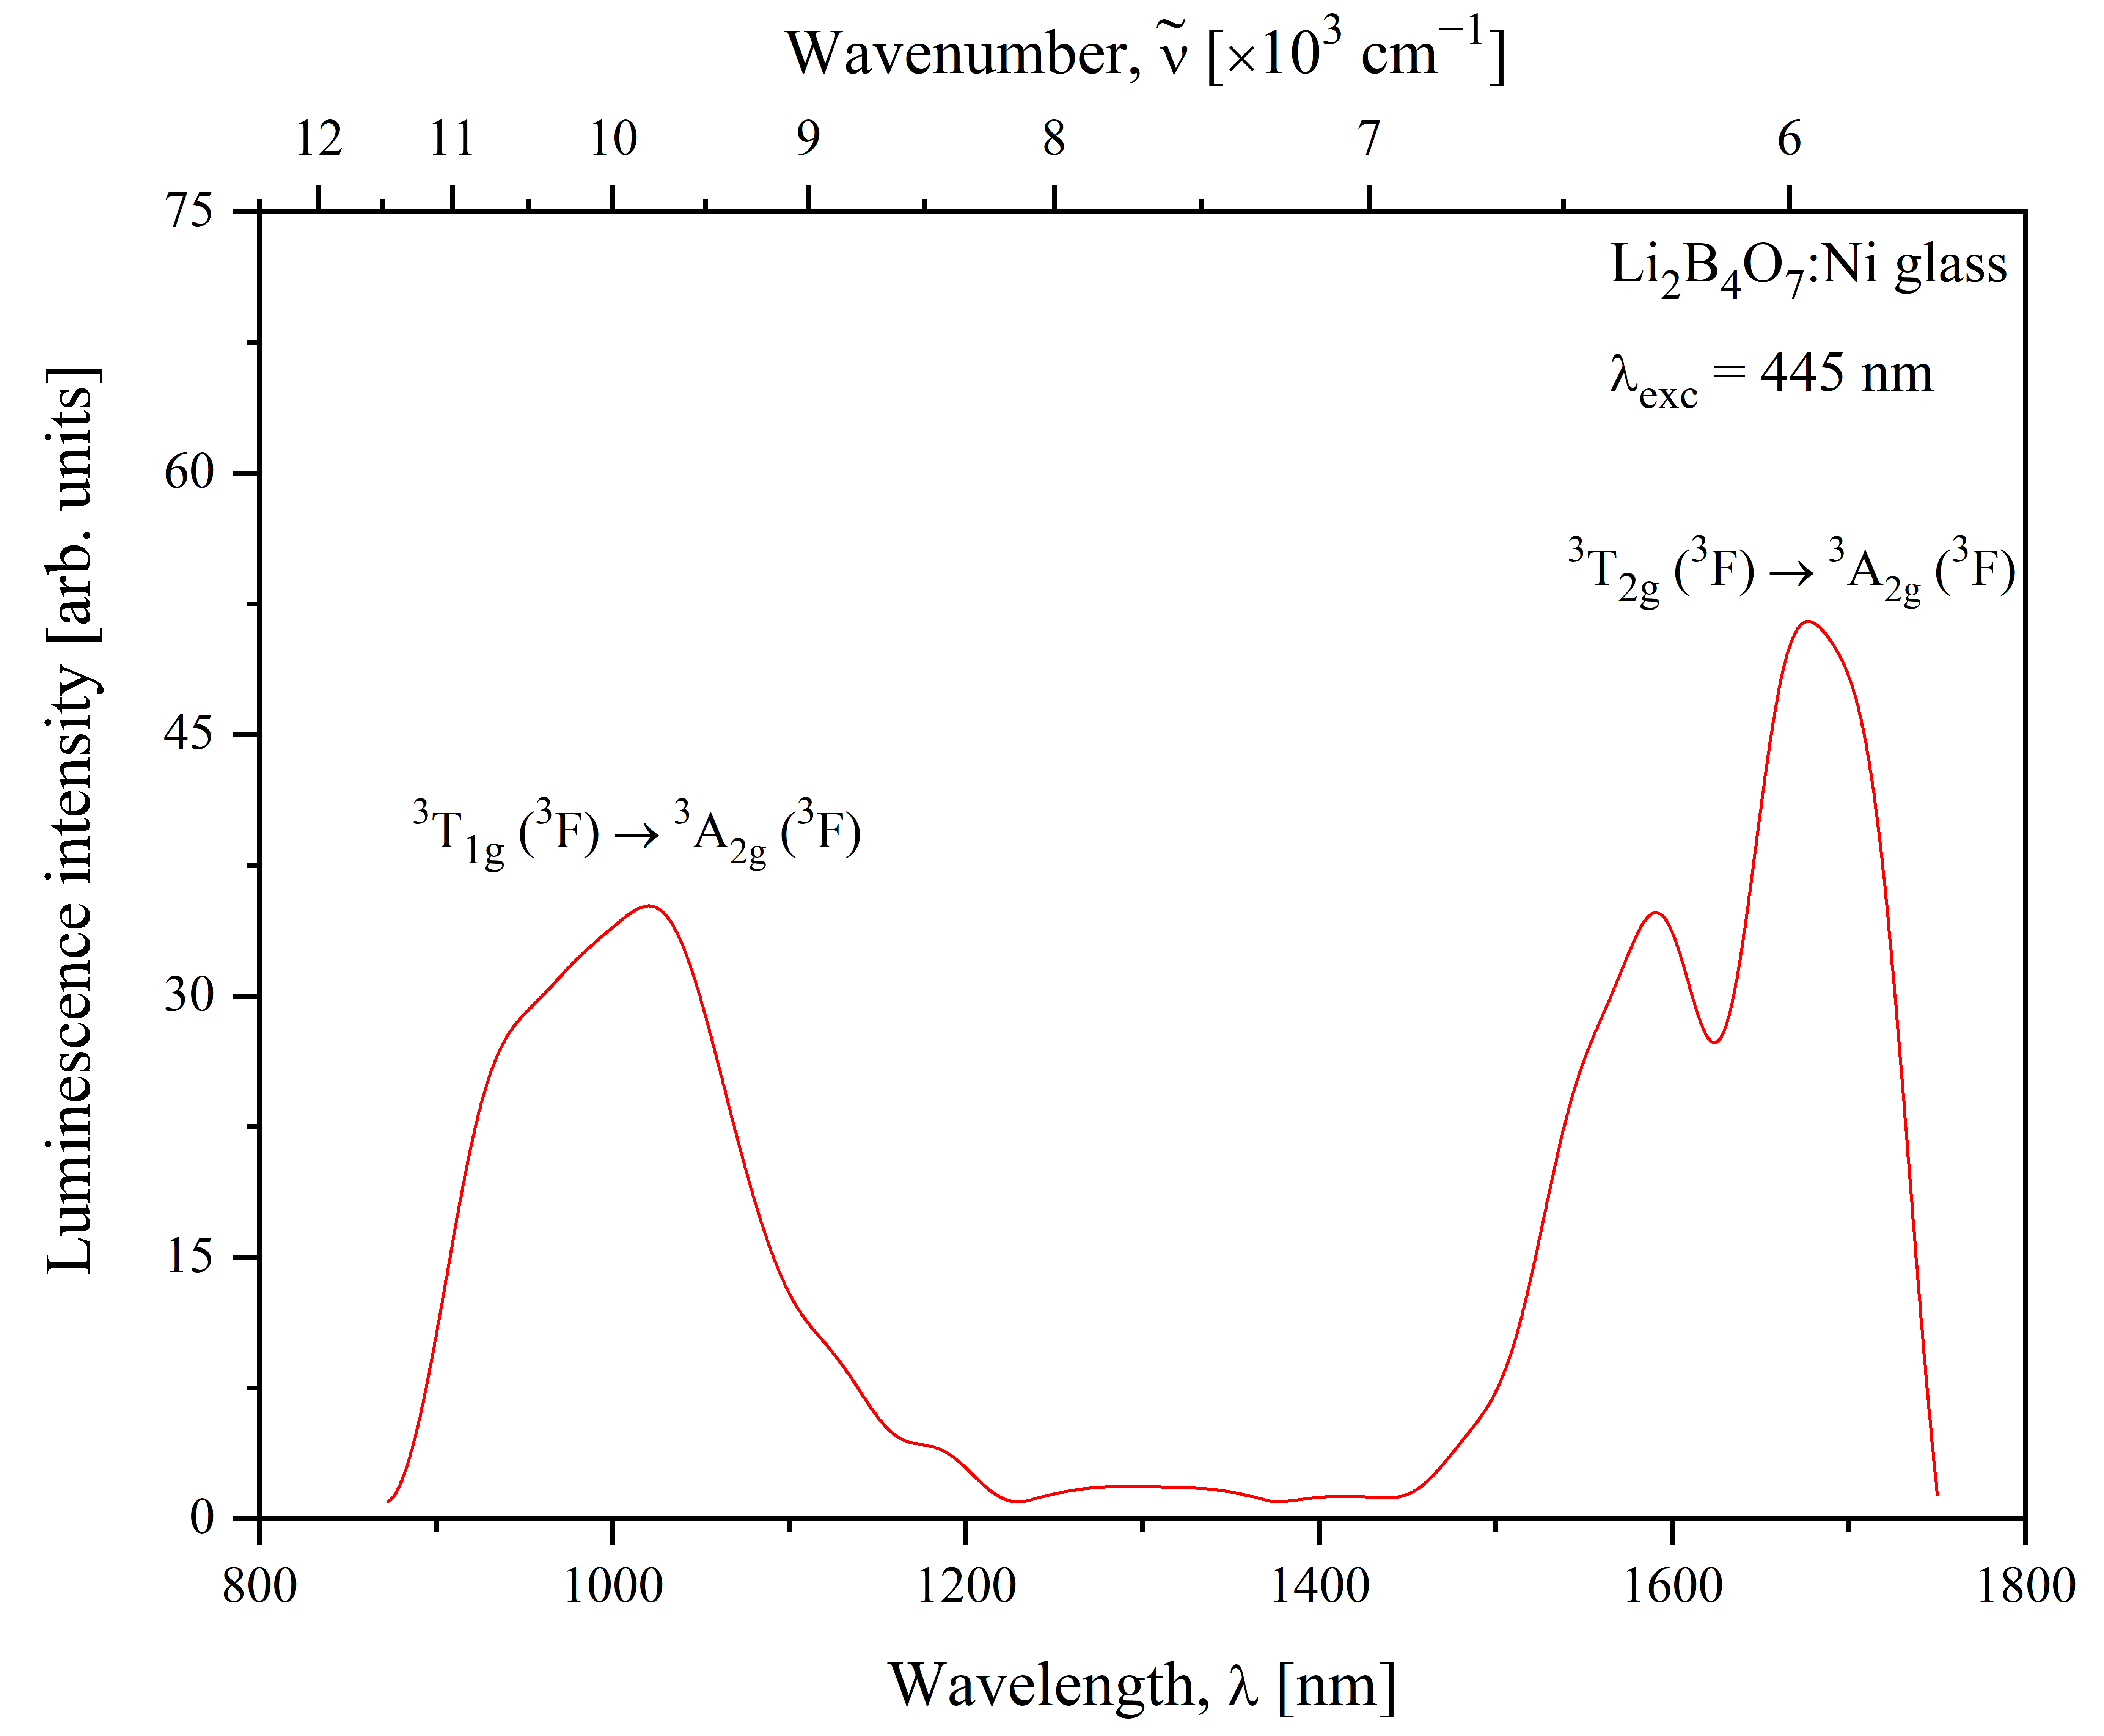
The NIR emission spectrum of the Li2B4O7:Ni glass registered upon excitation at 445 nm using an LED source is shown in Figure 7. The spectrum consists of two bands in the spectral ranges of 900–1100 nm and 1500–1750 nm. The first band, with a peak at 1020 nm and a shoulder near 940 nm, can be ascribed to the spin-allowed 3T1g (3F) → 3A2g (3F) transition. The second band with a main peak at 1677 nm and an additional peak at 1591 nm can be ascribed to the spin-allowed 3T2g (3F) → 3A2g (3F) transition.
Figure 7.
Luminescence emission spectrum of the Li2B4O7:Ni glass, registered in the NIR spectral range under excitation at λexc = 445 nm using an LED source.
Considering the shapes of the absorption and emission bands, one can observe varying degrees of band splitting, which is particularly pronounced for some bands, while others show only weak evidence of this feature. Two main mechanisms may account for this splitting: (1) distortion of the octahedral coordination environment (Oh symmetry) to shortened and/or elongated octahedra with lower D4h symmetry, and (2) spin–orbit coupling of double (E) and triple (T) degenerate states. Among the observed absorption and emission bands, the NIR emission bands exhibit the most pronounced deviations from a simple Gaussian profile. In our opinion, the shape of the NIR emission bands is associated with distortion of the octahedral coordination environment rather than with spin–orbit splitting. In particular, for the shortened and/or elongated octahedra, the 3A2g (3F) ground state transforms to the 3B1g state, the 3T2g (3F) state splits into the 3Eg and 3B2g states, and the 3T1g (3F) state splits into the 3A2g and 3Eg states. Thus, the considered splitting of the 3T2g (3F) and 3T1g (3F) states into two tetragonal states well describes the shape of the NIR emission bands consisting of two spectral components. In the case of spin–orbit splitting, three components are expected for the triply degenerate 3T2g (3F) and 3T1g (3F) crystal field states, which do not correlate well with the doublet structure of the observed NIR emission bands. Nevertheless, the contribution of spin–orbit splitting in the Li2B4O7:Ni glass cannot be entirely excluded, taking into account the relatively large spin–orbit coupling constant of Ni2+ ions and the possibility that inhomogeneous broadening may obscure the individual spin–orbit components. It is quite possible that the electronic states initially split by the lowering of symmetry may undergo additional splitting due to spin–orbit coupling. Similar to observed NIR emission bands, the splitting or asymmetry observed in some of the other absorption and emission bands may also arise primarily from distortions of the octahedral coordination environment, although contributions from spin–orbit coupling may also be present.
The intensity of the observed luminescence in the NIR spectral region is significantly weaker than that in the visible spectral region. However, a quantitative comparison is very complicated because the luminescence shown in Figure 3, Figure 5 and Figure 7 was registered using different instruments with different detector types. The weaker intensity of the NIR emission can be attributed to the increasing of non-radiative processes caused by multiphonon relaxation.
Near-infrared emission from Ni2+ centres in glasses has been reported only in a limited number of studies. An intense Ni2+ emission near 1300 nm was observed in glass ceramics containing LiGa5O8:Ni2+ nanocrystals [27]. The broadband near-infrared emission band with a peak at 1400 nm and a bandwidth exceeding 300 nm attributed to the 3T2g (3F) → 3A2g (3F) transition of Ni2+ ions was registered in Ni-doped zinc–alumino–silicate glass by the scientists from Japan in [28]. The crystal field strength in the ZnO–Al2O3–SiO2 glass was Dq = 932 cm−1 [28]. This value is higher than the Dq in the Li2B4O7:Ni glass, and consequently the corresponding emission band in [28] has a higher energy in comparison with our result. It was concluded in [28] that Ni-doped glass has the potential to serve as an amplification medium for broadband optical amplifiers and tuneable lasers. In our opinion, further studies are needed in order to evaluate the potential of Ni-doped Li2B4O7 glass for use in the field of optoelectronics.
3.5. Luminescence Decay Kinetics
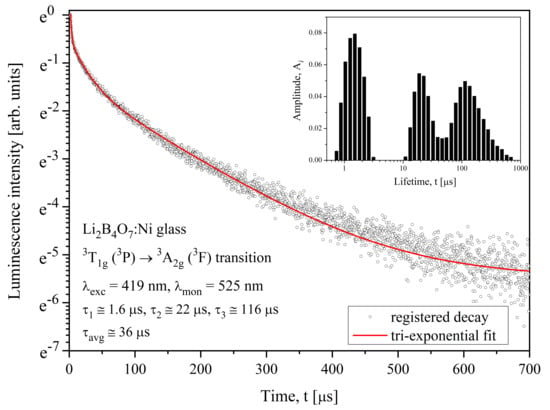
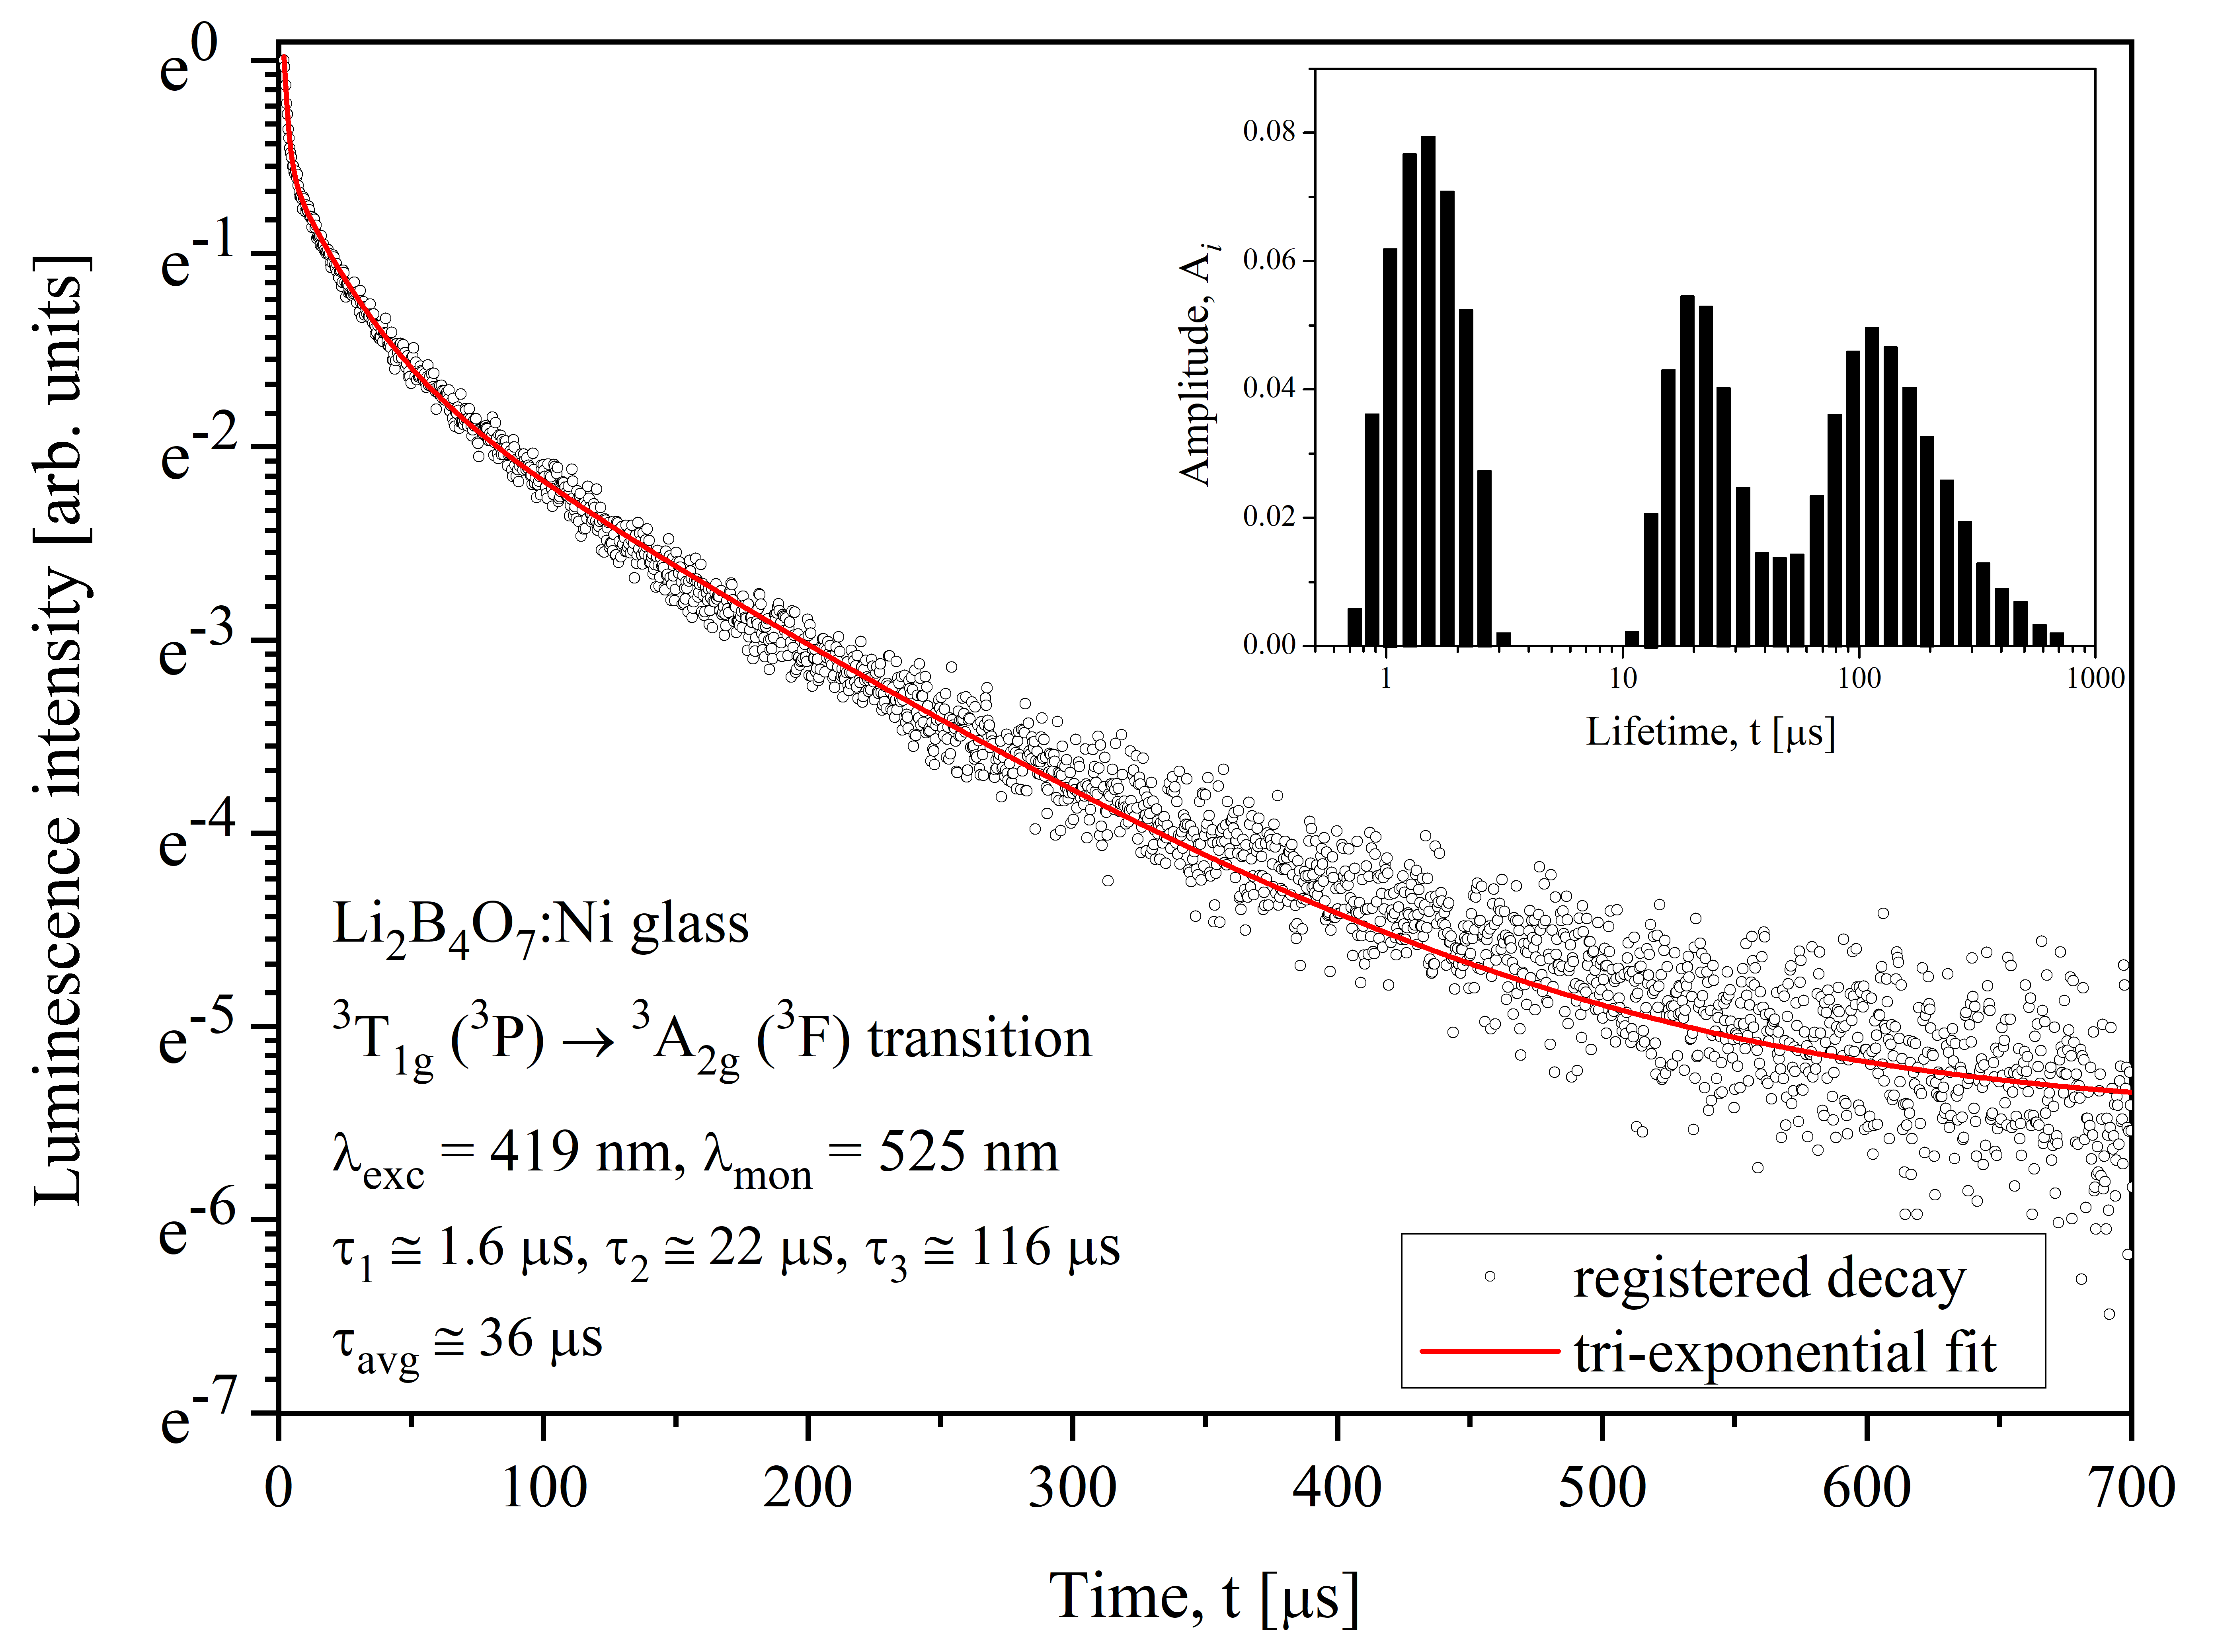
The luminescence decay kinetics of the green Ni2+ emission with a maximum at 525 nm in the Li2B4O7:Ni glass is shown in Figure 8. The decay curve exhibits a pronounced non-exponential character and cannot be adequately described by a single-exponential function. A bi-exponential fit also gives an unsatisfactory description of the experimental data. But, the decay curve is well fitted by a tri-exponential function with lifetimes of 1.6 μs, 22 μs, and 116 μs. The weighted amplitudes (also called fractional or relative amplitudes) of this tri-exponential fit are 0.432, 0.327, and 0.241, respectively. The amplitude-weighted average lifetime (τavg) was calculated using the following formula:
where Ai is the amplitude of the τi lifetime. The evaluated τavg lifetime equals 36 μs.
Figure 8.
Luminescence decay kinetics of the green Ni2+ emission in the Li2B4O7:Ni glass. The experimental decay curve and tri-exponential fit are shown together with the corresponding distribution of luminescence lifetimes in the inset.
The pronounced non-exponential decay behaviour of the green emission band may be attributed to several factors: (1) contributions from different Ni2+ electronic transitions with different radiative and non-radiative relaxation rates; (2) local symmetry lowering, which lifts the degeneracy of Ni2+ electronic states and may lead to their splitting; (3) the distribution of local coordination environments in the glass network. In our opinion, all three decay components of the tri-exponential fit are primarily associated with the spin-allowed 3T1g (3P) → 3A2g (3F) transition. The nearly spectrally located spin-forbidden 1A1g (1G) → 3A2g (3F) and 1T2g (1D) → 3A2g (3F) transitions may affect the measured decay kinetics, causing the lifetime of the 3T1g (3P) → 3A2g (3F) transition to be longer. Nevertheless, it is not possible to unambiguously assign individual components of the tri-exponential fit to these spin-forbidden transitions. Regarding the effect of local symmetry lowering, distortion of the ideal octahedral coordination environment through shortening or elongation may reduce the symmetry from Oh to D4h. This distortion can lift the degeneracy of the 3T1g (3P) emitting state, resulting in two tetragonal states, 3A2g and 3Eg. Their potentially different relaxation rates may give slightly different decay components. In addition, variations in Ni–O bond lengths and local crystal-field strength in the distorted octahedra can produce a distribution of relaxation rates and, consequently, a distribution of lifetimes.
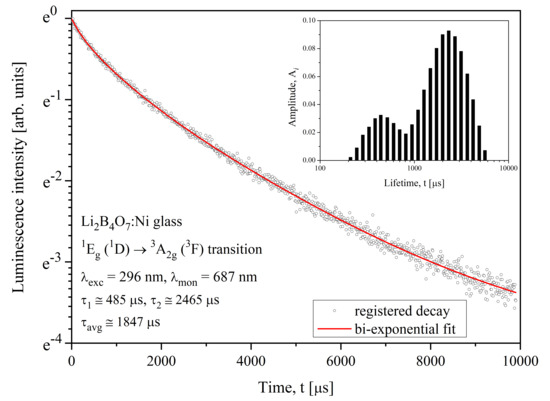
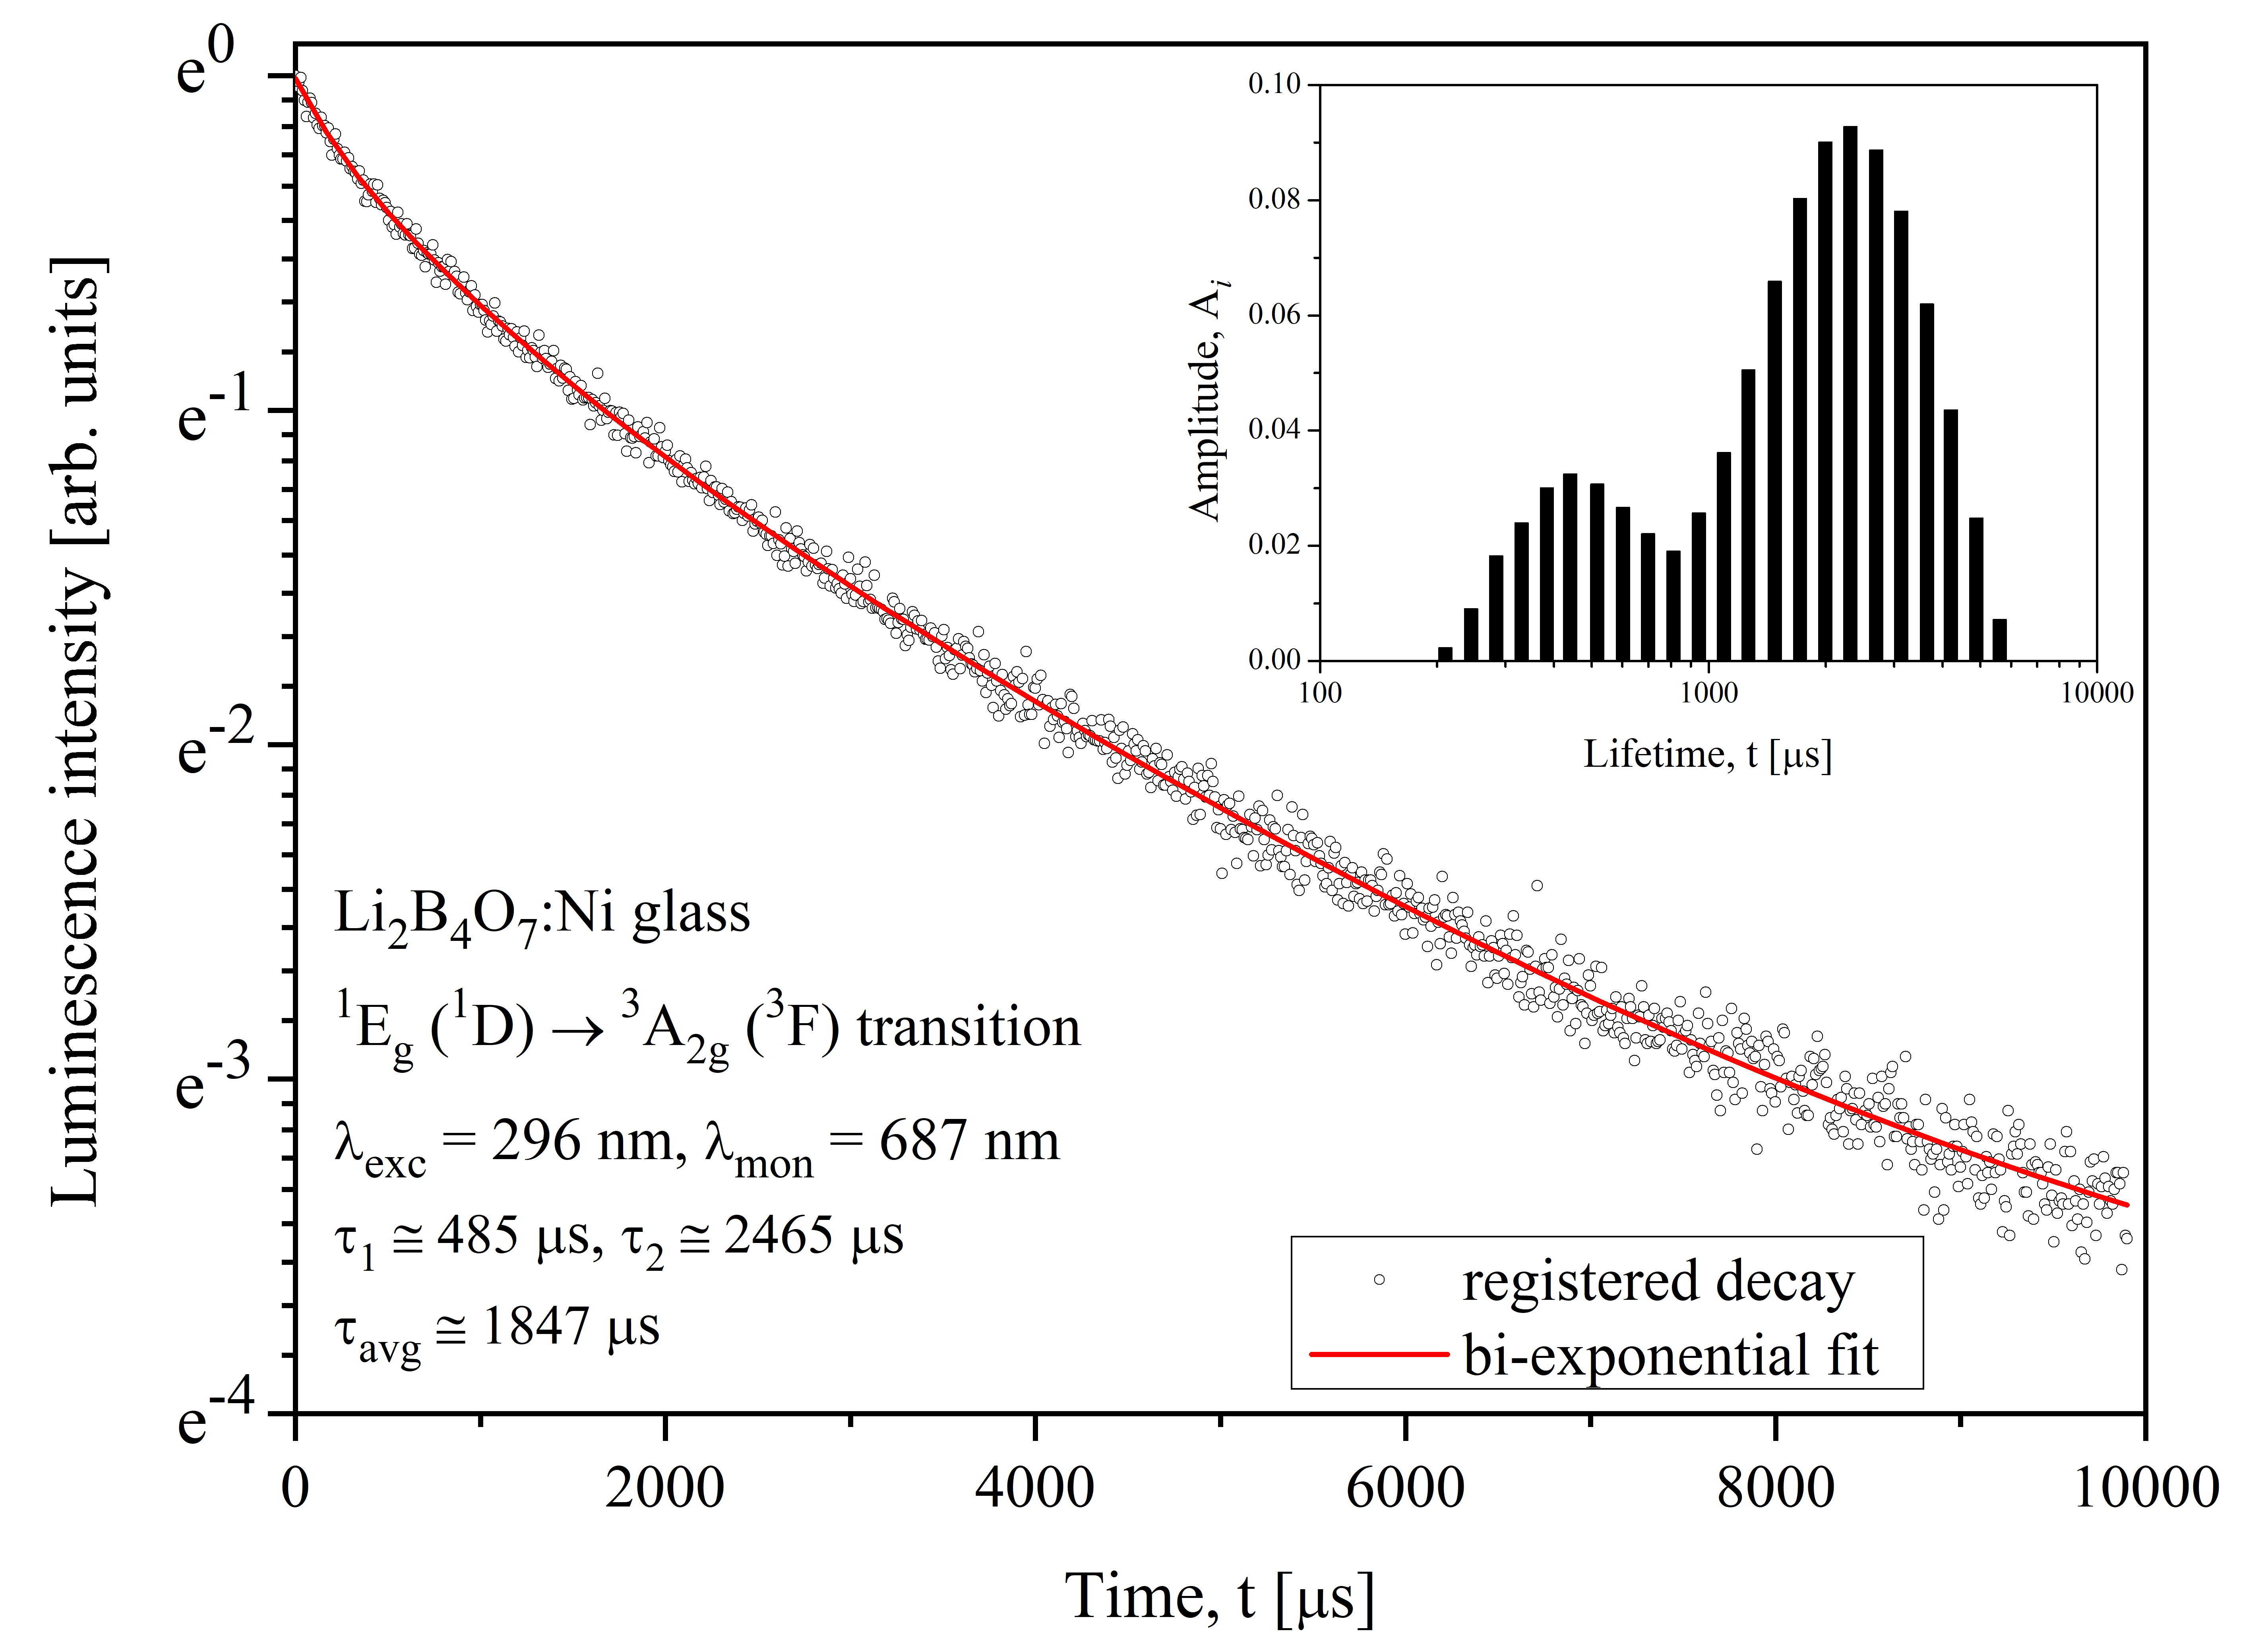
Figure 9 shows the luminescence decay kinetics of the red Ni2+ emission peaked at 687 nm in the Li2B4O7:Ni glass. The decay curve is also non-single exponential, but its deviation from single-exponential behaviour is considerably weaker than that observed for the green Ni2+ emission. The decay curve was well fitted by a bi-exponential function with lifetimes of 485 μs and 2465 μs. The weighted amplitudes of this bi-exponential fit are 0.312 and 0.688, respectively. The amplitude-weighted average lifetime calculated using the Formula (5) equals 1847 μs. The red Ni2+ emission is assigned to the spin-forbidden 1Eg (1D) → 3A2g (3F) transition. Its decay is more than 50 times slower than that of the green emission, which is dominated by the spin-allowed 3T1g (3P) → 3A2g (3F) transition.
Figure 9.
Luminescence decay kinetics of the red Ni2+ emission in the Li2B4O7:Ni glass. The experimental decay curve and bi-exponential fit are shown together with the corresponding distribution of luminescence lifetimes in the inset.
Since there are no other crystal field states located near the 1Eg (1D) state at Dq/B = 0.776 in the Li2B4O7:Ni glass, the contribution of other electronic transitions to the kinetics of the red Ni2+ emission is insignificant. The non-exponential decay behaviour of the red emission may be associated with local symmetry lowering and the distribution of local coordination environments in the glass network. In a tetragonally distorted octahedral coordination environment, the 1Eg (1D) emitting state splits into the 1A1g and 1B1g states. Transitions from these tetragonal states may exhibit slightly different relaxation rates, potentially giving two decay components with slightly different lifetimes. In addition, variations in bond lengths and local crystal-field strength in the distorted octahedra formed by Ni2+ ions and O2− ligands can lead to a distribution of relaxation rates and, consequently, to a distribution of observed lifetimes.
The luminescence lifetimes of the NIR emission bands in the Li2B4O7:Ni glass were found to be in the microsecond range, but the low emission intensity of the NIR luminescence did not allow registration of decay curves of good quality.
To obtain additional information on the distribution of decay kinetics, a continuous lifetime-distribution analysis was performed. It was assumed that the total emission is the result of a superposition of luminescence from a considerable number of Ni2+ luminescence centres, each localised in sites with slightly different local surroundings. Besides this, the continuous distribution of the local crystal field in the Li2B4O7:Ni glass causes a continuous distribution of the lifetimes. The calculated emission intensity can be expressed as follows [29]:
where A(τ) is the distribution function of lifetime τ. The continuous lifetime distribution was approximated by a discrete set of logarithmically spaced lifetimes in order to go from integration to summation and to facilitate the calculation. The amplitudes Ai(τi) associated with logarithmically spaced lifetimes were determined by fitting the calculated decay curve to the experimental data using a least-squares procedure.
The lifetime distributions obtained for the green and red Ni2+ emission are given as insets in Figure 8 and Figure 9, respectively. The obtained distributions support the appropriateness of the tri- and bi-exponential fitting models for the green and red Ni2+ emissions, respectively. The maxima of the distributions correlate very well with the corresponding fitted lifetimes. From the obtained lifetime distribution of the green Ni2+ emission, it can be seen that the luminescence lifetimes are distributed in the time range of 0.7–700 μs. Such wide lifetime distribution is caused by three effects: first, the green emission band contains contributions from both spin-allowed and spin-forbidden Ni2+ transitions with different relaxation rates; second, local symmetry lowering causes splitting of Ni2+ octahedral states into tetragonal states with potentially slightly different relaxation rates; third, structural disorder of the glass produces a distribution of local crystal-field environments and, consequently, a distribution of Ni2+ relaxation rates. For the red emission, the lifetime distribution extends approximately from 200 to 6000 μs and is substantially narrower than that obtained for the green emission. Since the red emission is caused by the single spin-forbidden 1Eg (1D) → 3A2g (3F) transition, this distribution is attributed to the local symmetry lowering and positional disorder of the glass network, which produces a distribution of Ni2+ relaxation rates.
3.6. Tanabe–Sugano Diagram of Ni2+ Ions in the Li2B4O7:Ni Glass
The Tanabe–Sugano diagram describes the dependence of the state energies on the crystal-field strength as the relationship between E/B and Dq/B for a fixed C/B ratio. For the Li2B4O7:Ni glass, the analysis of the optical absorption spectrum give Dq = 720 ± 15 cm−1, B = 929 ± 10 cm−1, and Dq/B = 0.776 ± 0.024. In order to build the Tanabe–Sugano diagram, the C parameter and the C/B ratio must also be determined. The C parameter cannot be calculated from the positions of the spin-allowed transitions used to obtain Dq and B, because their energies are independent of C (see Equations (2)–(4)). To find the C parameter, the energy of a spin-forbidden transition must be used. Obtaining the energy from the emission spectrum is less reliable because the emission energy can be affected by the Stokes shift between absorption and emission. Consequently, obtaining the energy from the excitation spectrum is a better option. Analysis of the excitation spectra given in Figure 3 and Figure 5 suggests that the 3A2g (3F) → 1T1g (1G) transition is the best candidate for calculation of the C parameter. The corresponding band with a maximum at 381 ± 1 nm (26,247 ± 69 cm−1) has a relatively high intensity and does not overlap with other identified Ni2+ transitions. From the Tanabe–Sugano theory, the theoretical energy of the 1T1g (1G) state can be analytically determined to be equal to:
As a result, the Racah parameter C and the C/B ratio in the Li2B4O7:Ni glass equal 3950 ± 170 cm−1 and 4.25 ± 0.23, respectively. The uncertainties were calculated using the law of uncertainty propagation.
E(1T1g(1G)) = 10Dq + 12B + 2C.
It is important to compare the obtained Racah parameters B = 929 ± 10 cm−1 and C = 3950 ± 170 cm−1 with the corresponding values B0 and C0 for free Ni2+ ions. According to reference [30], free Ni2+ ions exhibit B0 = 1030 cm−1 and C0 = 4850 cm−1. The B/B0 and C/C0 ratios equal 0.9019 ± 0.0097 and 0.814 ± 0.035, respectively, and indicate a reduction in the interelectronic repulsion parameters in the glass relative to the free Ni2+ ion. The obtained β = B/B0 ratio is typical for oxygen ligands in the context of the nephelauxetic effect. It should be noted that in [31] slightly different values B0 = 1068 cm−1 and C0 = 4457 cm−1 for free Ni2+ ions were reported. In this case, the ratios B/B0 = 0.8699 ± 0.0094 and C/C0 = 0.886 ± 0.038 are very similar to each other. Although the absolute ratios depend on the selected free-ion reference values, both sets of parameters indicate a reduction in the Racah parameters relative to the free-ion case.
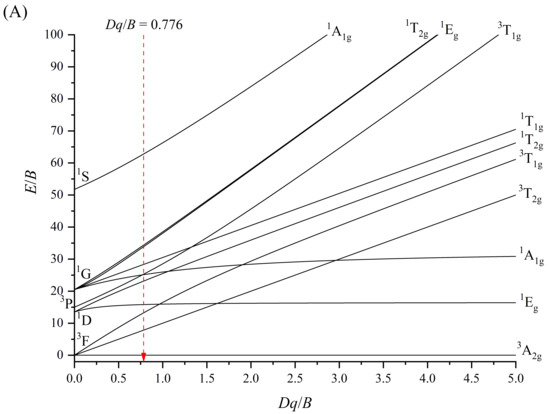
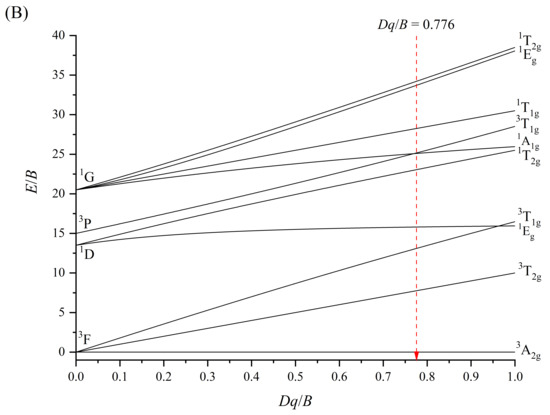
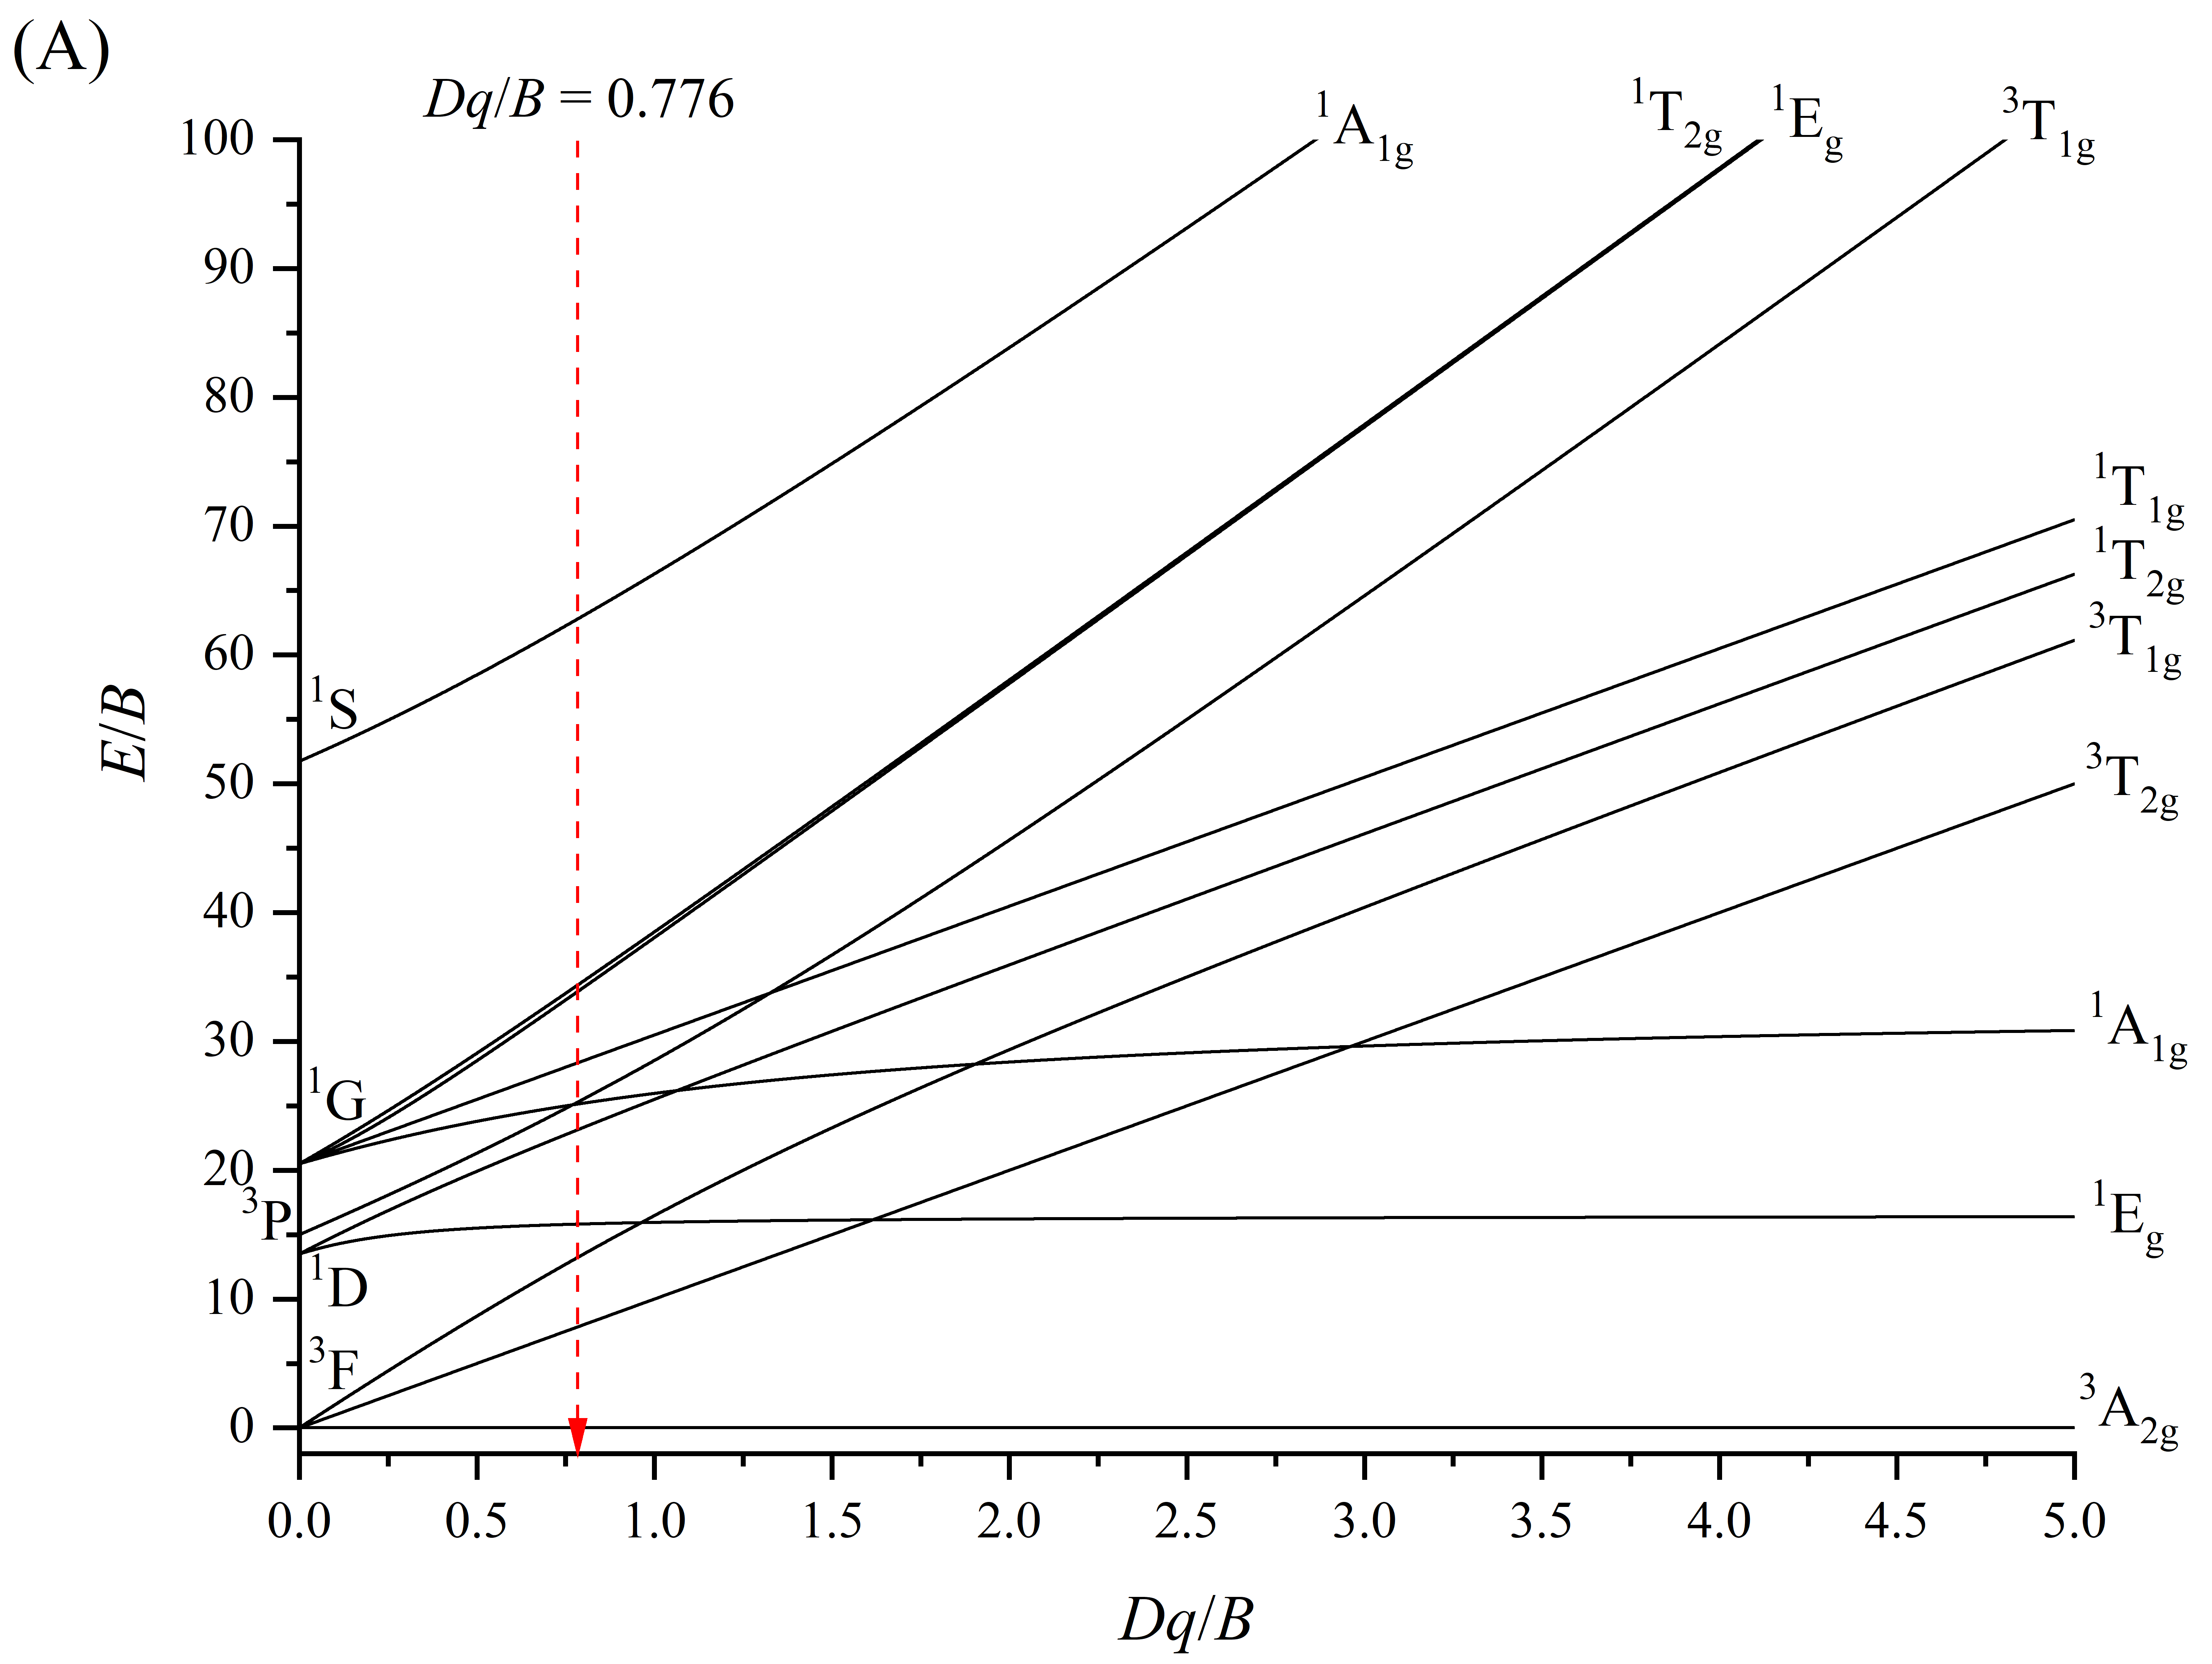
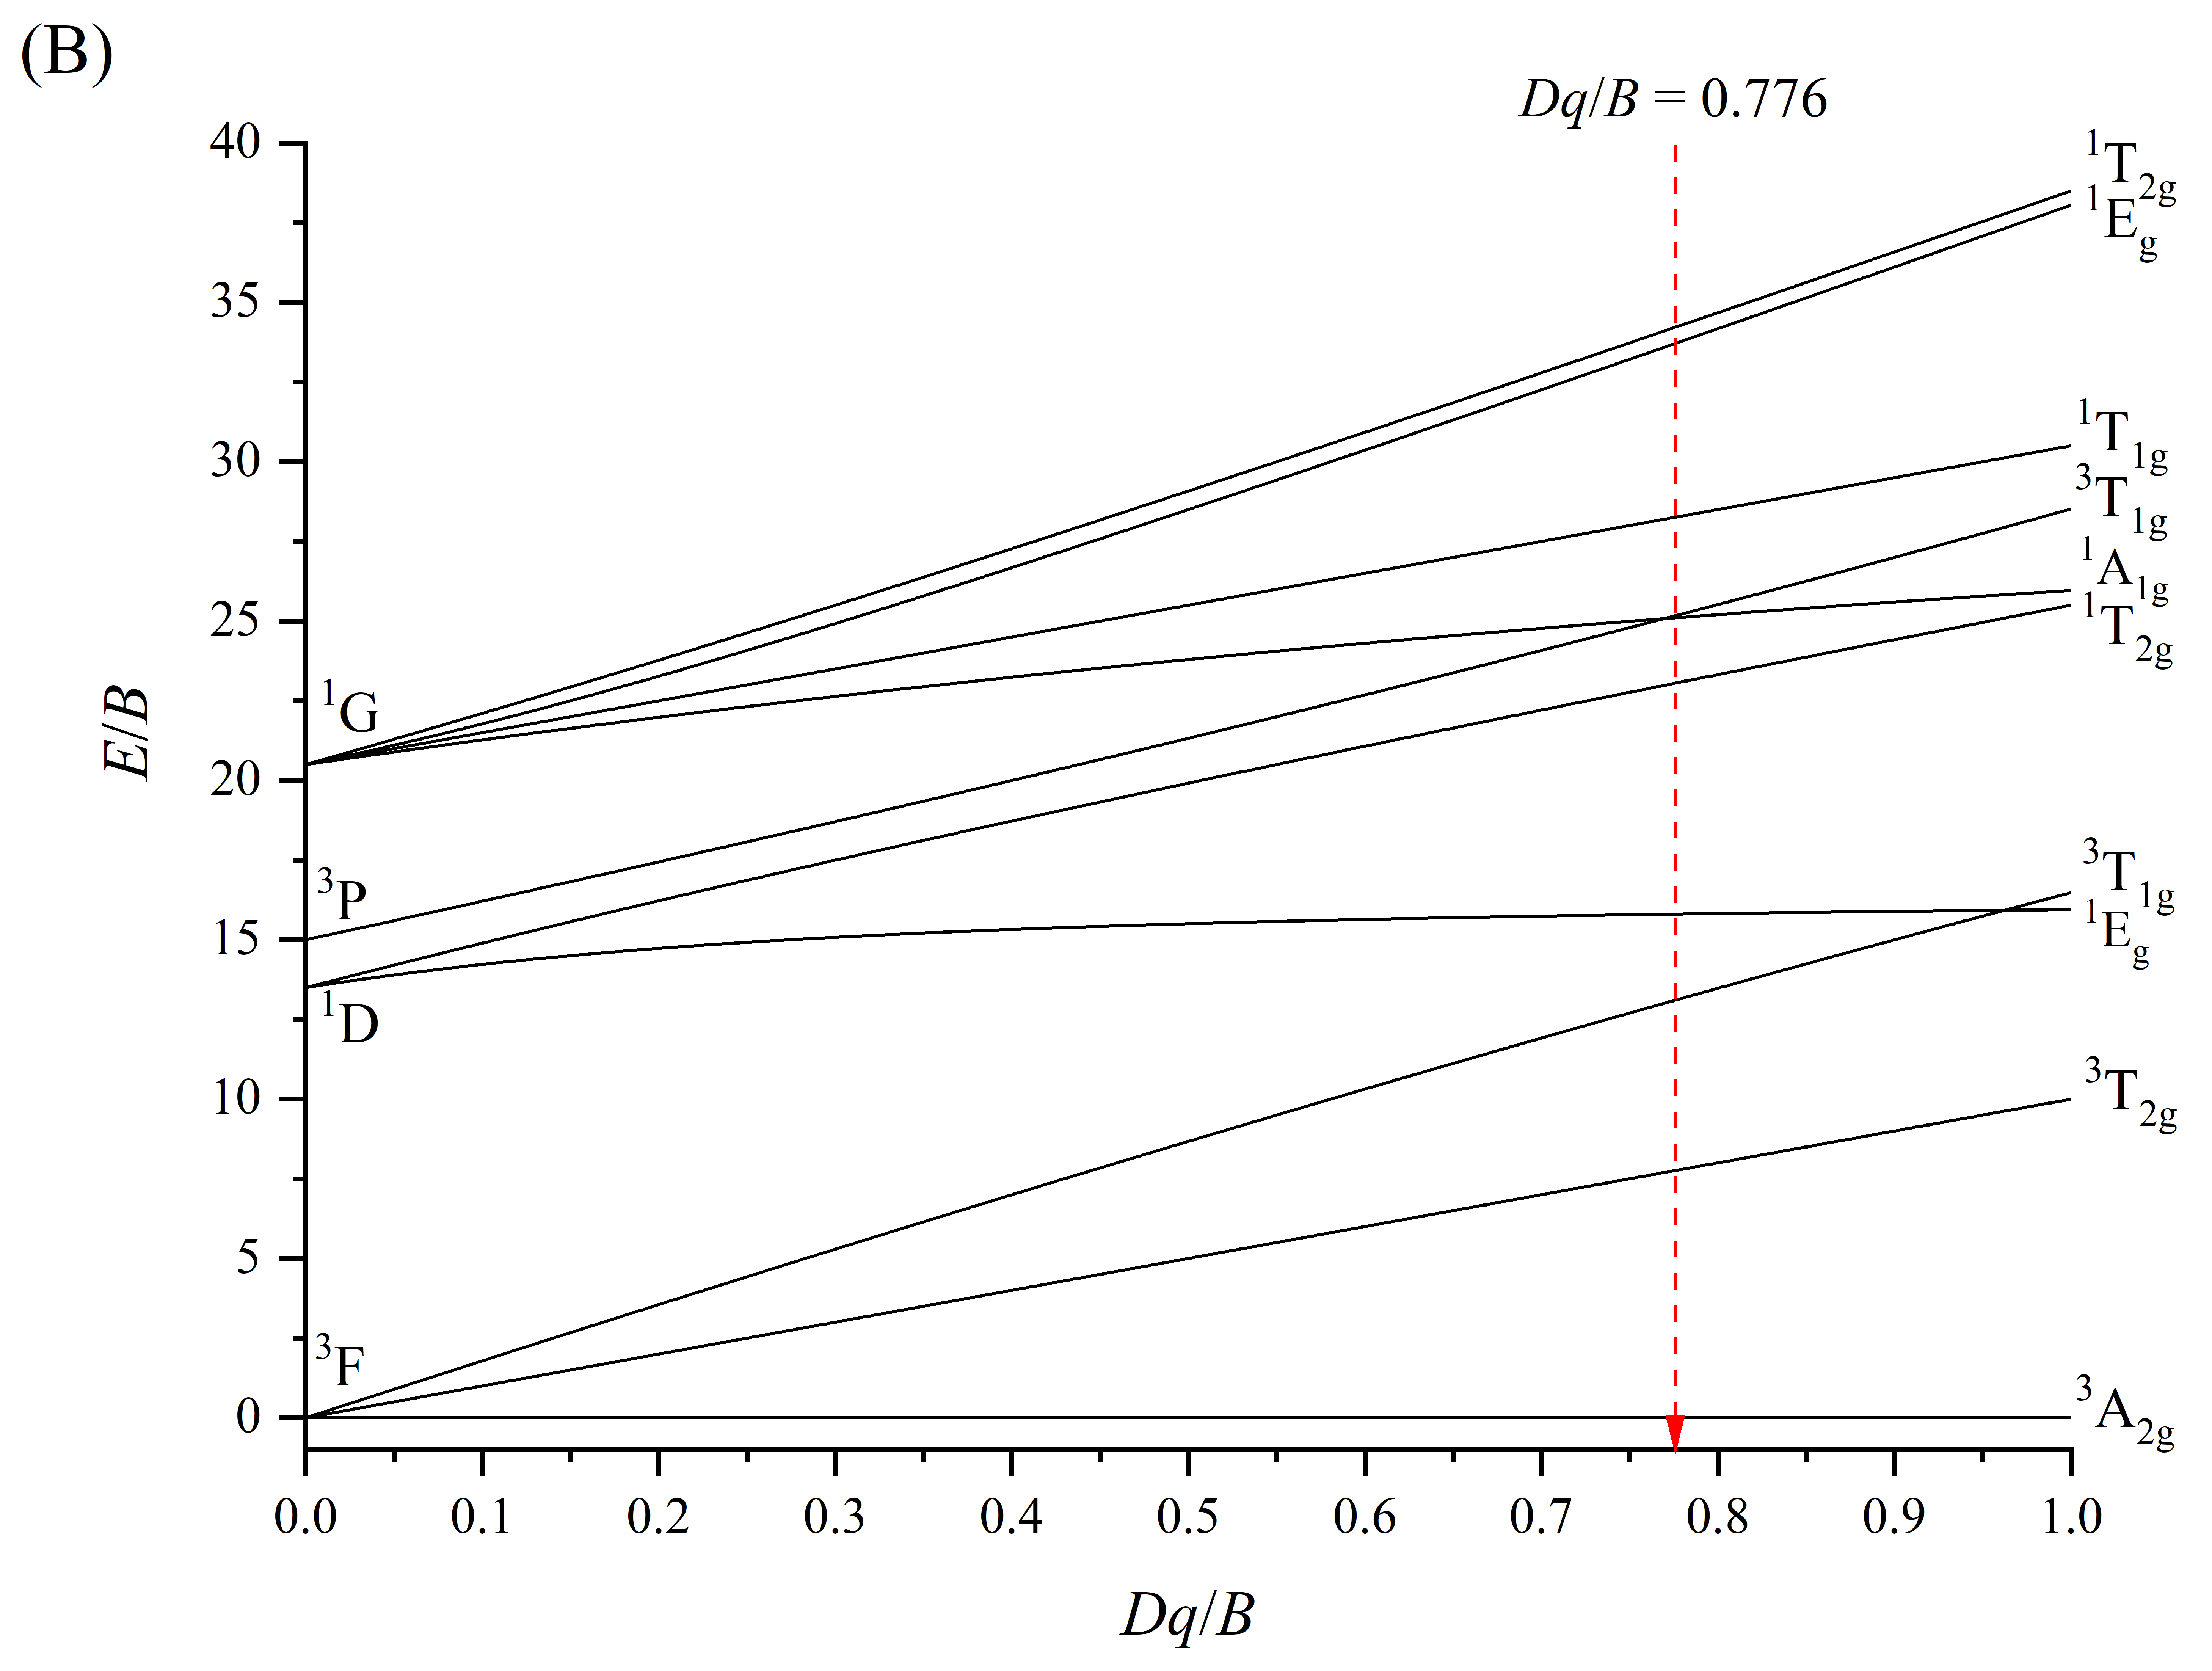
The Tanabe–Sugano diagram for Ni2+ ions in the Li2B4O7:Ni glass plotted for C/B = 4.25 is shown in Figure 10. This diagram allows us to find theoretical E/B values (see Table 1) at the obtained above Dq/B = 0.776. The uncertainty of the E/B ratio was calculated individually for each state from the Tanabe–Sugano diagram plotted, taking into account the uncertainty of the C/B and Dq/B ratios. The dimensionless energies (E/B) of the relevant crystal-field states can be converted into absolute energies E and wavelengths λ using the value of B.
Figure 10.
The Tanabe–Sugano diagram for Ni2+ ions in the Li2B4O7:Ni glass calculated for C/B = 4.25 and plotted in the wide (A) and narrow (B) ranges of the Dq/B values. The vertical position corresponding to the experimentally determined Dq/B = 0.776 is used to identify the relevant Ni2+ crystal-field states and transition energies.
Table 1.
The observed wavelength (λobs) and energy (Eobs) of the transitions between the ground and excited states, as well as the calculated relative energy (E/B), absolute energy (Ecal), and wavelength position (λcal) of the excited Ni2+ crystal field states in the Li2B4O7:Ni glass evaluated using the Tanabe–Sugano model with Dq/B = 0.776 and C/B = 4.25. The superscripts (abs), (exc), and (em) denote transitions observed in the absorption, excitation, and emission spectra, respectively.
The calculated theoretical energies and wavelengths of all crystal field states of Ni2+ ions are listed in Table 1. The uncertainty of theoretical energies and wavelengths was calculated using the law of uncertainty propagation. Table 1 also presents the energies and wavelengths of Ni2+ transitions observed in the Li2B4O7:Ni glass. One can notice a quite good correlation between the observed and calculated wavelengths. Some deviations can be related to the distortion of octahedral geometry in the Li2B4O7:Ni glass.
The Ni2+ ions occupy the Li+ sites of the Li2B4O7 glass. The ionic radius of the B3+ ions is very small, being equal to 0.01 Å and 0.11 Å for three- and four-coordinated B3+ ions, respectively [32]. The ionic radii of Li+ and Ni2+ in the six-fold coordination are quite similar and equal approximately 0.76 Å and 0.69 Å [32], respectively, making substitution of Li+ by Ni2+ structurally plausible. The statement about the incorporation of Ni2+ ions into the Li+ well agrees with work [33], in which it was revealed by extended X-ray absorption fine structure (EXAFS) spectroscopy that rare-earth ions occupy the Li+ sites in the Li2B4O7 glass. The excess positive charges resulting from Ni2+ → Li+ heterovalent substitution in the investigated glass can be compensated by cationic vacancies as a characteristic feature of the glass network.
Based on the obtained results of optical spectroscopy, it is possible to state that the octahedral geometry around Ni2+ ions in the Li2B4O7:Ni glass is significantly distorted. In particular, the considerable spread of Li–O interatomic distances due to the positional disorder of the glass network manifests itself in the formation of distorted octahedra. This distortion is evident in the non-Gaussian shape with an additional weakly observed splitting of some observed optical absorption and emission bands, as well as the non-single-exponential luminescence decay kinetics of the Ni2+ emission.
The comparison of the experimentally observed wavelengths of the spin-allowed Ni2+ transitions in the optical absorption spectrum, the calculated Racah parameters, and the crystal field strength in the investigated Li2B4O7:Ni glass and materials with similar composition is presented in Table 2. The values obtained in the present study are in good agreement with those reported previously for Ni-doped borate glasses [15,16,17,18,34,35,36,37]. It should be noted that Refs. [15,16,17,18,35] report only the results of optical absorption without the analysis of crystal field splitting or determination of the corresponding Racah parameters, which underlines the significance of this work. Hence, the results of this comprehensive study provide valuable information about the structural, optical, and luminescent properties as well as the crystal field analysis of the Ni-doped Li2B4O7 glass.
Table 2.
The comparison of the observed wavelengths (λ1, λ2, λ3) of the 3A2g (3F) → 3T1g (3P), 3A2g (3F) → 3T1g (3F), and 3A2g (3F) → 3T2g (3F) spin-allowed transitions in the optical absorption spectrum, the calculated Racah parameters (B and C) and the crystal field strength (Dq) determined for the Li2B4O7:Ni glass and reported for selected Ni-doped materials. A dash (—) indicates that the corresponding parameter was not reported or could not be determined from the cited study.
4. Conclusions
Based on the analysis of the obtained experimental results, the following conclusions can be proposed:
- •
- The Li2B4O7 (Li2O–2B2O3) glass doped with 1.0 mol.% NiO was successfully synthesised by the conventional melt-quenching method and has been studied in detail using XRD, optical absorption, and photoluminescence (emission and excitation spectra, decay kinetics) techniques.
- •
- The absence of sharp crystalline diffraction peaks in XRD pattern confirms the disordered glassy (vitreous) structure of the investigated material.
- •
- The optical absorption spectrum exhibits three broad bands at 428 nm, 815 nm, and 1417 nm corresponding to the spin-allowed 3A2g (3F) → 3T2g (3F), 3A2g (3F) → 3T1g (3F), and 3A2g (3F) → 3T1g (3P) transitions of Ni2+ (3d8) ions in the ligand field of octahedral geometry.
- •
- In the luminescence spectra, the green emission band with a maximum at 525 nm was assigned to the 3T1g (3P) → 3A2g (3F) transitions with possible contributions from nearby spin-forbidden 1A1g (1G) → 3A2g (3F), and 1T2g (1D) → 3A2g (3F) transitions, whereas the red emission band with a maximum at 687 nm (14,556 cm−1) was ascribed to the 1Eg (1D) → 3A2g (3F) transition of Ni2+ ions. Additionally, two weak emission bands related to the 3T1g (3F) → 3A2g (3F) and 3T2g (3F) → 3A2g (3F) transitions were observed in the spectral ranges of 900–1100 nm and 1500–1750 nm, respectively.
- •
- The excitation spectra of the Li2B4O7:Ni glass reveal several spin-allowed and spin-forbidden 3d–3d transitions of Ni2+ ions.
- •
- The luminescence decay curves of the green and red emission bands are non-single-exponential and are characterised by lifetimes distributed over a relatively wide time range, which is caused by the superposition of Ni2+ transitions, local symmetry lowering, as well as the positional disorder of the Li2B4O7:Ni glass network.
- •
- The octahedral geometry around Ni2+ ions in the Li2B4O7:Ni glass is distorted due to the positional disorder of the glass network. The non-Gaussian shape of some observed optical absorption and emission bands, as well as deviations between the observed and calculated energies of some transitions, are related to the distorted octahedral ligand field.
- •
- Analysis of the crystal field splitting for Ni2+ ions in the Li2B4O7:Ni glass was carried out, and the Racah parameters and the crystal field strength were calculated to be B = 929 ± 10 cm−1, C = 3950 ± 170 cm−1, and Dq = 720 ± 15 cm−1.
- •
- The Tanabe–Sugano diagram for Ni2+ ions in the Li2B4O7:Ni glass was built, and quite good agreement between the observed and calculated wavelengths of the Ni2+ transitions was obtained.
- •
- Overall, the valuable information gathered in this research is useful for understanding the structural and optical properties of Ni2+ ions in borate glasses.
Author Contributions
Conceptualization, I.K. and B.P.; methodology, I.K., B.P., A.D. and R.L.; investigation, I.K., B.P., A.D. and R.L.; formal analysis, I.K.; visualization, I.K.; validation, I.K. and B.P.; writing—original draft preparation, I.K.; writing—review and editing, I.K. and B.P. All authors have read and agreed to the published version of the manuscript.
Funding
This work was supported by the Institute of Physics of the University of Zielona Góra through statutory research funds, the Polish Ministry of Science under the “Regional Excellence Initiative” programme (project No. RID/SP/0050/2024/1), and the Ministry of Education and Science of Ukraine within the framework of research projects Nos. 0124U000979 and 0126U002281.
Data Availability Statement
The original contributions presented in this study are included in the article. Further inquiries can be directed to the corresponding author.
Acknowledgments
The authors thank V.T. Adamiv and I.M. Teslyuk from the O.G. Vlokh Institute of Physical Optics of the Ivan Franko National University of Lviv (Ukraine) for sample preparation as well as Y.O. Kulyk from the Department of Metal Physics of the Ivan Franko National University of Lviv (Ukraine) for performing the XRD measurements.
Conflicts of Interest
The authors declare no conflicts of interest.
References
- Pye, L.D.; Fréchette, V.D.; Kreidl, N.J. (Eds.) Borate Glasses; Plenum Press: New York, NY, USA, 1978. [Google Scholar] [CrossRef] [Scilit]
- Yamane, M.; Asahara, Y. Glasses for Photonics; Cambridge University Press: Cambridge, UK, 2000. [Google Scholar] [CrossRef] [Scilit]
- Padlyak, B.V.; Kindrat, I.I.; Kulyk, Y.O.; Mudry, S.I.; Drzewiecki, A.; Hordieiev, Y.S.; Goleus, V.I.; Lisiecki, R. Local structure, spectroscopic properties and intrinsic photoluminescence of the un-doped lead-containing glasses of different composition. Mater. Sci. Eng. B 2022, 278, 115655. [Google Scholar] [CrossRef] [Scilit]
- Kindrat, I.I.; Padlyak, B.V.; Lisiecki, R.; Adamiv, V.T. Spectroscopic and luminescent properties of the lithium tetraborate glass co-doped with Nd and Ag. J. Alloys Compd. 2021, 853, 157321. [Google Scholar] [CrossRef] [Scilit]
- Samson, B.N.; Pinckney, L.R.; Wang, J.; Beall, G.H.; Borrelli, N.F. Nickel-doped nanocrystalline glass-ceramic fiber. Opt. Lett. 2002, 27, 1309–1311. [Google Scholar] [CrossRef] [Scilit]
- Wu, B.; Jiang, N.; Zhou, S.; Chen, D.; Zhu, C.; Qiu, J. Transparent Ni2+-doped silicate glass ceramics for broadband near-infrared emission. Opt. Mater. 2008, 30, 1900–1904. [Google Scholar] [CrossRef] [Scilit]
- Inoue, H.; Masuno, A.; Yanaba, Y.; Zhou, S.; Kizaki, K.; Watanabe, Y.; Xu, C.; Kitazawa, S. Structure and broadband near-infrared luminescence of transparent Ni2+-doped LiTaO3 aluminosilicate glass–ceramics. Mater. Adv. 2026, 7, 8637–8645. [Google Scholar] [CrossRef] [Scilit]
- Ishii, M.; Kuwano, Y.; Asaba, S.; Asai, T.; Kawamura, M.; Senguttuvan, N.; Hayashi, T.; Koboyashi, M.; Nikl, M.; Hosoya, S.; et al. Luminescence of doped lithium tetraborate single crystals and glass. Radiat. Meas. 2004, 38, 571–574. [Google Scholar] [CrossRef]
- Kindrat, I.I.; Padlyak, B.V.; Drzewiecki, A.; Teslyuk, I.M.; Adamiv, V.T. The impact of silver codoping on Tb3+ luminescence in lithium tetraborate glasses. Luminescence 2025, 40, e70074. [Google Scholar] [CrossRef] [Scilit]
- Kindrat, I.I.; Padlyak, B.V.; Drzewiecki, A.; Kulyk, Y.O.; Adamiv, V.T.; Lisiecki, R. Enhancement of the Sm3+ photoluminescence efficiency in lithium tetraborate glasses via co-activation by Bi3+. Ceram. Int. 2026, 52, 43582–43596. [Google Scholar] [CrossRef] [Scilit]
- Galoisy, L.; Calas, G. Structural environment of nickel in silicate glass/melt systems: Part 1. Spectroscopic determination of coordination states. Geochem. Cosmochim. Acta 1993, 57, 3613–3626. [Google Scholar] [CrossRef] [Scilit]
- Galoisy, L.; Calas, G.; Cormier, L.; Marcq, B.; Thibault, M.H. Overview of the environment of Ni in oxide glasses and relation with the glass coloration. Phys. Chem. Glasses 2005, 46, 394–399. [Google Scholar]
- Galoisy, L.; Calas, G. Role of alkali field strength on the speciation of Ni2+ in alkali borate glasses: Comparison with crystalline Ni-borates. J. Non-Cryst. Solids 2022, 577, 121320. [Google Scholar] [CrossRef] [Scilit]
- Calas, G.; Galoisy, L.; Cormier, L. The color of glass. In Encyclopedia of Glass Science, Technology, History, and Culture; Richet, P., Ed.; John Wiley & Sons: Hoboken, NJ, USA, 2021. [Google Scholar] [CrossRef] [Scilit]
- Terczyńska-Madej, A.; Cholewa-Kowalska, K.; Łączka, M. Coordination and valence state of transition metal ions in alkali-borate glasses. Opt. Mater. 2011, 33, 1984–1988. [Google Scholar] [CrossRef] [Scilit]
- Abul-Magd, A.A.; Morshidy, H.Y.; Abdel-Ghany, A.M. The role of NiO on the structural and optical properties of sodium zinc borate glasses. Opt. Mater. 2020, 109, 110301, Erratum in Opt. Mater. 2025, 163, 117012. [Google Scholar] [CrossRef] [Scilit]
- Thakur, S.; Thakur, V.; Kaur, A.; Singh, L. Structural, optical and thermal properties of nickel doped bismuth borate glasses. J. Non-Cryst. Solids 2019, 512, 60–71. [Google Scholar] [CrossRef] [Scilit]
- Wen, H.; Tanner, P.A.; Cheng, B.-M. Optical properties of 3dN transition metal ion-doped lead borate glasses. Mater. Res. Bull. 2016, 83, 400–407. [Google Scholar] [CrossRef] [Scilit]
- Padlyak, B.V.; Mudry, S.I.; Kulyk, Y.O.; Drzewiecki, A.; Adamiv, V.T.; Burak, Y.V.; Teslyuk, I.M. Synthesis and X-ray structural investigation of undoped borate glasses. Mater. Sci. Pol. 2012, 30, 264–273. [Google Scholar] [CrossRef] [Scilit]
- Radaev, S.F.; Muradyan, L.A.; Malakhova, L.F.; Burak, Y.V.; Simonov, V.I. Atomic structure and electron density of lithium tetraborate Li2B4O7. Kristallografiya 1989, 34, 1400–1407. [Google Scholar]
- Racah, G. Theory of complex spectra. II. Phys. Rev. 1942, 62, 438–462. [Google Scholar] [CrossRef] [Scilit]
- Tanabe, Y.; Sugano, S. On the absorption spectra of complex ions. I. J. Phys. Soc. Jpn. 1954, 9, 753–766. [Google Scholar] [CrossRef] [Scilit]
- Hu, W.; Xie, J.; Chau, H.W.; Si, B.C. Evaluation of parameter uncertainties in nonlinear regression using Microsoft Excel spreadsheet. Environ. Syst. Res. 2015, 4, 4. [Google Scholar] [CrossRef] [Scilit]
- Kindrat, I.I.; Padlyak, B.V.; Drzewiecki, A. Intrinsic luminescence of the un-doped borate glasses. J. Lumin. 2017, 187, 546–554. [Google Scholar] [CrossRef] [Scilit]
- CIE 1931; Colour-Matching Functions of CIE 1931 Standard Colorimetric Observer. International Commission on Illumination (CIE): Vienna, Austria, 2019. [CrossRef] [Scilit]
- Hunt, R.W.G.; Pointer, M.R. Measuring Colour; John Wiley & Sons: Hoboken, NJ, USA, 2011. [Google Scholar] [CrossRef] [Scilit]
- Suzuki, T.; Arai, Y.; Ohishi, Y. Quantum efficiencies of near-infrared emission from Ni2+-doped glass-ceramics. J. Lumin. 2008, 128, 603–609. [Google Scholar] [CrossRef] [Scilit]
- Suzuki, T.; Ohishi, Y. Broadband 1400 nm emission from Ni2+ in zinc–alumino–silicate glass. Appl. Phys. Lett. 2004, 84, 3804–3806. [Google Scholar] [CrossRef] [Scilit]
- Grinberg, M.; Russell, D.L.; Holliday, K.; Wisniewski, K.; Koepke, C. Continuous function decay analysis of a multisite impurity activated solid. Opt. Commun. 1998, 156, 409–418. [Google Scholar] [CrossRef] [Scilit]
- Tanabe, Y.; Sugano, S. On the absorption spectra of complex ions II. J. Phys. Soc. Jpn. 1954, 9, 766–779. [Google Scholar] [CrossRef] [Scilit]
- Brik, M.G.; Camardello, S.J.; Srivastava, A.M.; Avram, N.M.; Suchocki, A. Spin-forbidden transitions in the spectra of transition metal ions and nephelauxetic effect. ECS J. Solid State Sci. Technol. 2016, 5, R3067–R3077. [Google Scholar] [CrossRef] [Scilit]
- Shannon, R.D. Revised effective ionic radii and systematic studies of interatomic distances in halides and chalcogenides. Acta Cryst. 1976, A32, 751–767. [Google Scholar] [CrossRef] [Scilit]
- Kelly, T.D.; Petrosky, J.C.; McClory, J.W.; Adamiv, V.T.; Burak, Y.V.; Padlyak, B.V.; Teslyuk, I.M.; Lu, N.; Wang, L.; Mei, W.-N.; et al. Rare earth dopant (Nd, Gd, Dy, and Er) hybridization in lithium tetraborate. Front. Phys. 2014, 2, 31. [Google Scholar] [CrossRef] [Scilit]
- Sreedhar, B.; Sumalatha, C.H.; Kojima, K. ESR and optical absorption spectra of Ni(II) ions in lithium fluoroborate glasses. J. Mater. Sci. 1996, 31, 1445–1448. [Google Scholar] [CrossRef] [Scilit]
- Rao, R.B.; Gerhardt, R.A. Effect of alkaline earth modifier ion on the optical, magnetic and electrical properties of lithium nickel borate glasses. Mater. Chem. Phys. 2008, 112, 186–197. [Google Scholar] [CrossRef] [Scilit]
- Alsaif, N.A.M.; Al-Ghamdi, H.; El-Refaey, A.M.; Sadeq, M.S.; Shams, M.S.; Shaaban, S.M.; Mesalam, Y.I.; Ahmed, E.M.; Rammah, Y.S.; Salem, A.I.; et al. Synthesis, structural, optical properties and dielectric spectroscopy of nickel-doped lead borate glasses. Opt. Quantum Electron. 2024, 56, 383. [Google Scholar] [CrossRef] [Scilit]
- Reddy, C.V.; Krishna, C.R.; Rao, T.R.; Sathish, D.V.; Rao, P.S.; Ravikumar, R.V.S.S.N. Synthesis and optical properties of Co2+ and Ni2+ ions doped β-BaB2O4 nanopowders. J. Lumin. 2012, 132, 2325–2329. [Google Scholar] [CrossRef] [Scilit]

Disclaimer/Publisher’s Note: The statements, opinions and data contained in all publications are solely those of the individual author(s) and contributor(s) and not of MDPI and/or the editor(s). MDPI and/or the editor(s) disclaim responsibility for any injury to people or property resulting from any ideas, methods, instructions or products referred to in the content. |
© 2026 by the authors. Licensee MDPI, Basel, Switzerland. This article is an open access article distributed under the terms and conditions of the Creative Commons Attribution (CC BY) license.