


Abstract
Ag-SnO2 composites are widely adopted as electrical contact materials in low-voltage apparatuses. Ongoing upgrades of electrical devices impose higher standards for their mechanical strength, machinability, and electrical conductivity, among which the SnO2 volume fraction is a dominant factor regulating material performance. In this work, Ag-SnO2 electrical contact composites are reinforced with 15 μm SnO2 particles at various volume fractions. Increasing SnO2 volume fractions can improve the hardness. The ultimate tensile strength reaches a maximum value of 219.1 MPa at the SnO2 volume fraction of 18.3 vol%. Excessively high SnO2 content (26.5 vol%) leads to the brittle fracture of the composite and a sharp decline in tensile strength. Indirect strengthening dominates the overall mechanical performance, among which grain refinement serves as the primary strengthening mechanism, followed by dislocation multiplication strengthening, while the Orowan looping effect is negligible for coarse 15 μm SnO2 particles. This work clarifies the microstructure–performance correlation and strengthening mechanism of particle-reinforced Ag-SnO2 composites, providing a theoretical and experimental basis for the optimal design and performance optimization of high-performance electrical contact materials.
1. Introduction
Low-voltage electrical contact components rely on silver-based composite materials to sustain frequent cyclic impact, arc thermal shock, and reciprocating friction during long-term service. Sufficient tensile strength, yield strength, and hardness are fundamental to avoid rivet cracking, surface wear, and contact failure, which has positioned the mechanical performance optimization of Ag-SnO2 contacts as a critical research topic in electrical material engineering [1,2]. For decades, Ag-CdO composites dominated the low-voltage contact market due to their excellent comprehensive mechanical and electrical properties, yet cadmium toxicity has led to worldwide policy restrictions on cadmium-containing materials [3]. Ag-SnO2 has become the most promising eco-friendly alternative, but its mechanical behavior and multi-scale strengthening mechanisms remain less systematically quantified compared with other particle-reinforced metal matrix composites (MMCs), such as Al-based and Cu-based composites [4,5].
Extensive studies on aluminum matrix particle-reinforced composites have established a mature theoretical framework for mechanical strengthening, which can be divided into two core categories: direct load transfer from the matrix to rigid ceramic particles and indirect matrix strengthening, including grain refinement, geometrically necessary dislocation multiplication, and Orowan dislocation bypass [6,7]. In Al-based systems, researchers [8,9] have quantitatively separated the contribution of each strengthening pathway through tensile testing, microstructure statistics, and numerical simulation and clarified the evolution law of the strength, ductility, and fracture mode with increasing reinforcement volume fractions. Generally, the yield strength of MMCs rises monotonically with the reinforcement content, while the ultimate tensile strength peaks at a moderate volume fraction; excessive ceramic particles trigger rapid ductility loss and brittle trans-particle fracture, which severely restricts processing formability [10,11]. This universal mechanical evolution law [12] has been well validated in light alloy matrix composites, while relevant systematic quantitative analysis is still lacking for silver-based electrical contact composites.
For Ag-SnO2 composites, existing mechanical research mostly focuses on additives [13] and low volume fraction ranges below 12 wt% SnO2 [14]. Similarly to Al matrix composites, adding rigid oxide particles introduces grain boundary pinning effects and generates massive dislocations caused by thermal and elastic modulus mismatch between the two phases, leading to obvious strength enhancement [15,16]. However, few studies [17] adopt unit cell numerical simulation to quantify the independent contributions of load transfer, grain refinement, dislocation hardening, and Orowan strengthening in Ag-based composites.
Moreover, electrical contact materials require a balance between mechanical strength and electrical conductive performance, which creates unique constraints that are distinct from those in structural metal matrix composites [18]. Although a higher SnO2 volume fraction improves hardness and wear resistance, the proliferation of two-phase interfaces and interfacial dislocations intensifies electron scattering and reduces conductivity [19]. Few studies systematically record the synchronous variation in tensile properties, hardness, and conductivity across a wide SnO2 volume fraction gradient, making it difficult to determine the optimal reinforcement content that satisfies both mechanical processing requirements and electrical service indicators.
Therefore, there is an urgent need to carry out systematic tensile testing, microstructural observation, and finite element numerical simulation to reveal the variation law of the mechanical properties with reinforcement content, decouple the respective contribution of various strengthening mechanisms, and clarify the critical volume fraction corresponding to peak tensile strength and brittle fracture transition, so as to provide a mechanical performance design basis for industrial Ag-SnO2 electrical contact materials.
2. Experimental Section
2.1. Materials and Fabrication
Granular SnO2 particles [20] with a uniform particle size of approximately 15 μm were selected as the reinforcing phase. Ag-SnO2 composite materials were prepared by hot-pressing the composite powders, synthesized via a heterogeneous precipitation method, at 700 °C and 30 MPa for 1 h, and the detailed process was described in our previous work [21]. Three groups of samples with SnO2 volume fractions of 9.5 vol%, 18.3 vol%, and 26.5 vol% (corresponding to mass fractions of 6 wt%, 12 wt%, and 18 wt%) were prepared for a comparative study.
2.2. Characterization Methods
The phase composition of the composites was analyzed by X-ray diffraction (XRD; PW 3040/60, PANalytical B.V., Almelo, The Netherlands). The microstructure and particle distribution of the samples were observed by backscattered electron imaging using field emission scanning electron microscopy (FE-SEM; Ultra Plus, Carl Zeiss AG, Oberkochen, Germany) at an acceleration voltage of 15 kV. For Ag grain size characterization, the etchant was prepared by dissolving 2 g of CrO3 powder in 100 mL of 1.8 mol/L H2SO4. The Vickers hardness and electrical conductivity of the composites were tested via a microhardness tester (401MVD, Volpert Measuring Instruments, Shanghai, China) and a vortex conductivity apparatus (FQR 7501A, Xiamen Tianyan Instrument, Xiamen, China), respectively. Vickers microhardness measurements were conducted under a load of 200 gf applied for 8 s, with ten indents placed at 1 mm intervals across each specimen surface to minimize stress field interactions between neighboring impressions. Uniaxial tensile tests were carried out to obtain the true stress–strain curve of pure Ag, using a universal testing machine (AG-X plus, Shimadzu, Kyoto, Japan) at a strain rate of 0.001 s−1. The as-sintered Ag-based compacts were sectioned and finish-machined into standard dog-bone tensile specimens—featuring an “I”-shaped reduced section, as detailed in Figure S1—for axial tensile characterization.
2.3. Finite Element Simulation Method
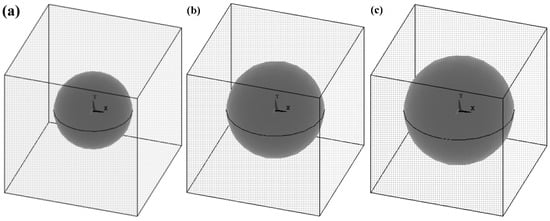
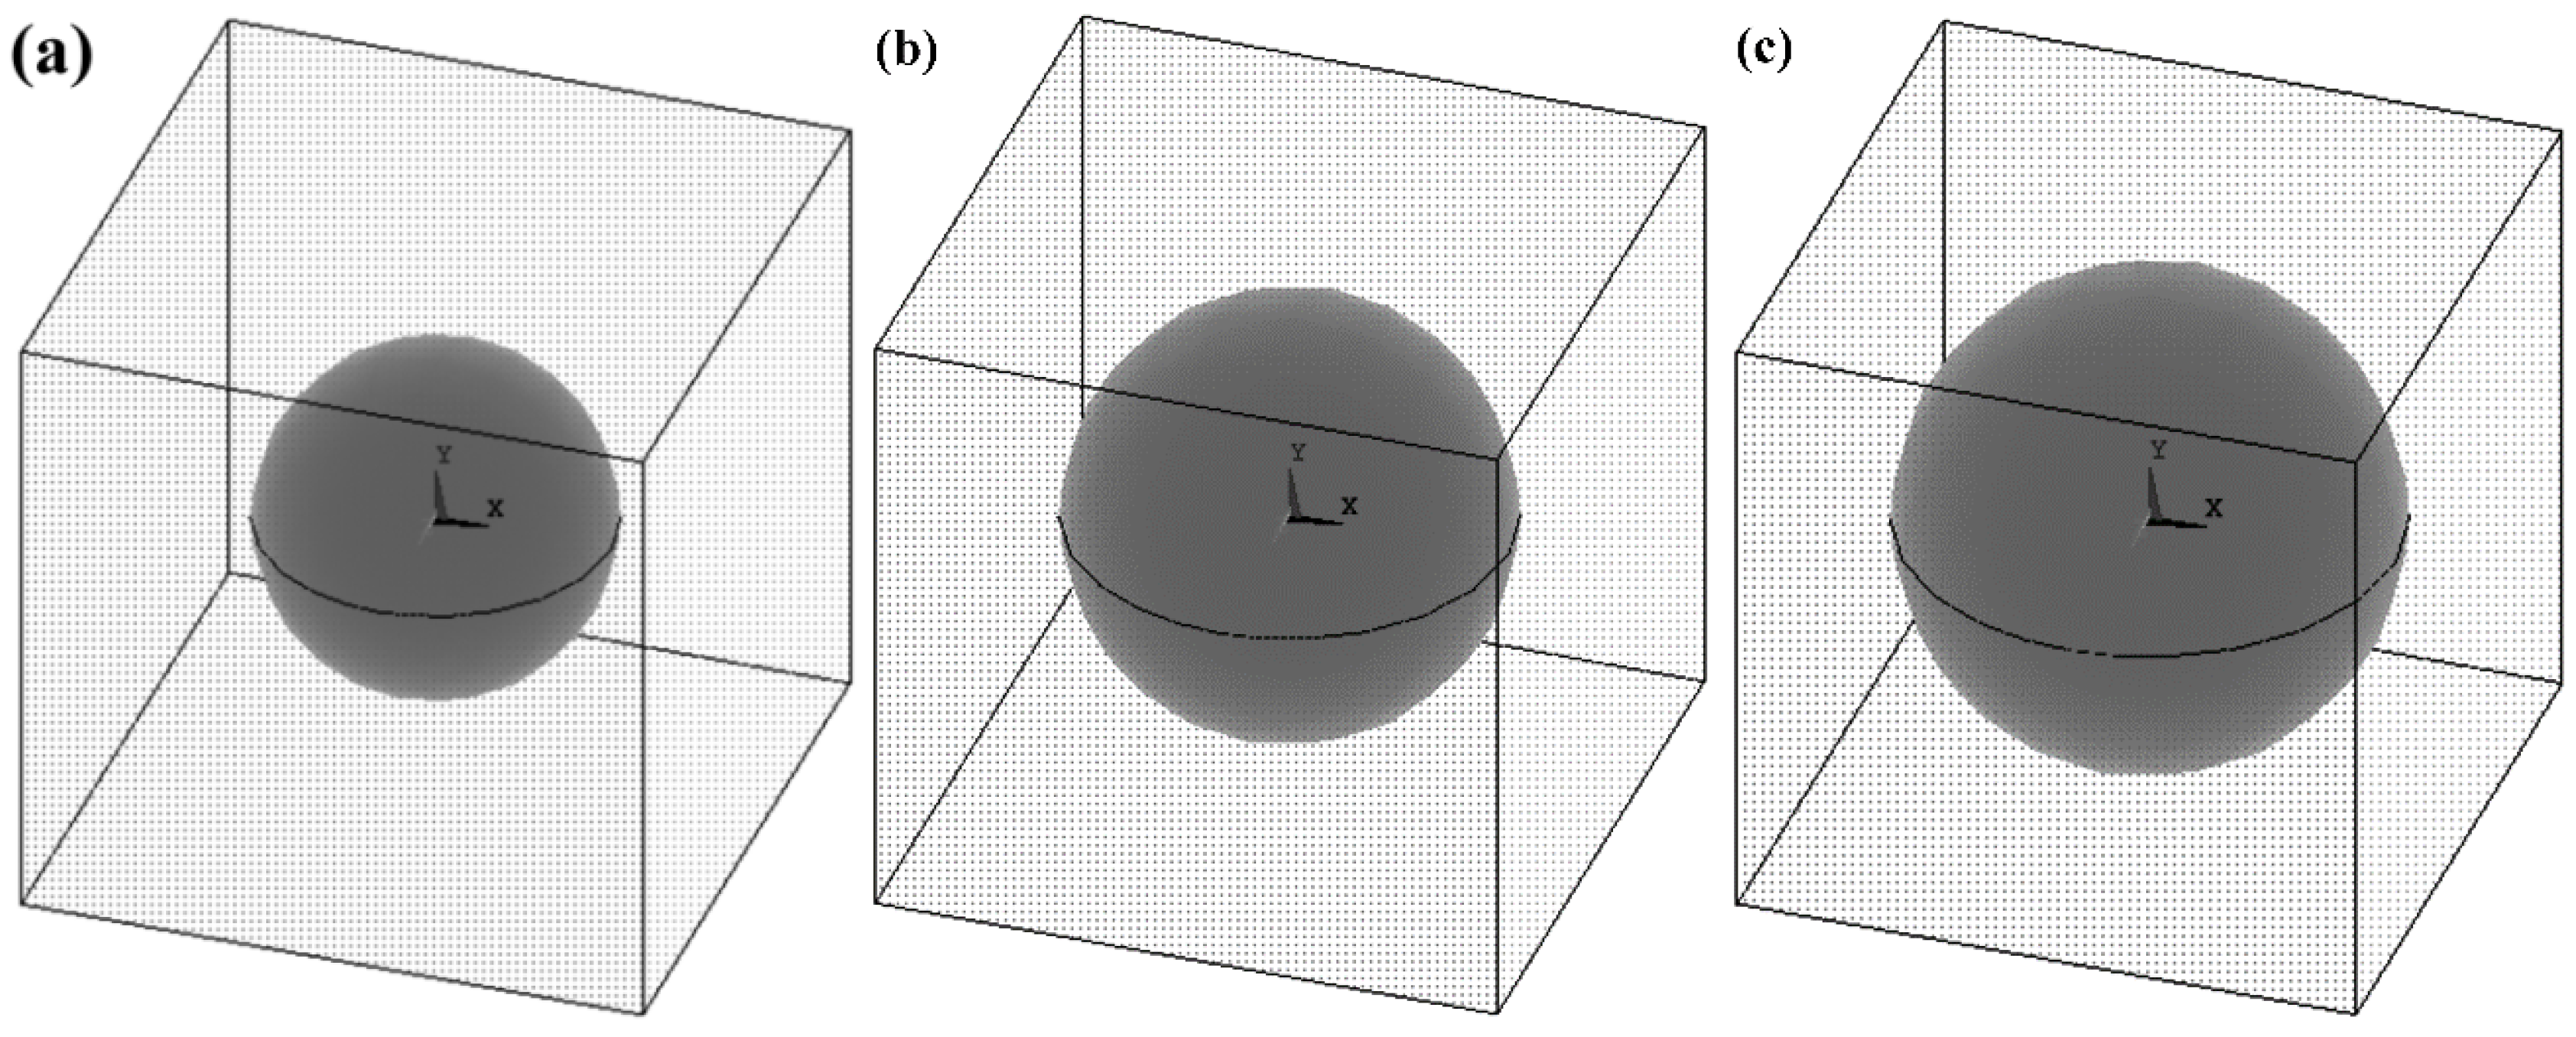
In this work, the ANSYS structural analysis software (V17.0) was employed to conduct finite element simulations to determine the tensile mechanical behavior and internal stress evolution of SnO2 particle-reinforced Ag matrix composites. A top-down solid modeling strategy was adopted in the numerical calculation. Firstly, cubic matrix units and spherical reinforcement primitives were established. To balance calculation efficiency and numerical accuracy, a three-dimensional single-sphere unit cell model was adopted for all simulation cases, as shown in Figure 1. To guarantee the continuity and periodicity of the composite microstructure, coupled boundary conditions were applied on the four side planes parallel to the tensile direction to limit the in-plane displacement and maintain planar flatness. A uniaxial displacement load was applied on the upper and lower surfaces perpendicular to the tensile direction. The whole model was meshed with a uniform mesh size for consistent calculation precision.
Figure 1.
The finite element 3D model of the Ag-SnO2 electrical contact materials reinforced by SnO2 with different volume fractions: (a) 9.5 vol%; (b) 18.3 vol%; (c) 26.5 vol%.
The accuracy of finite element simulation strongly relies on the authentic mechanical response of the pure Ag matrix. In this study, pure silver specimens were hot-pressed at 700 °C for 1 h under 30 MPa pressure and machined into standard tensile specimens. As shown in Figure S1, the measured elastic modulus, yield strength, ultimate tensile strength, and elongation of the as-prepared pure Ag control (Figure S1 in Supplementary Materials) are 82.6 GPa, 51.2 MPa, 105.8 MPa, and 56.8%, respectively. The elastic modulus of silver closely approximates that of pure Ag reported in the literature [22], thereby validating the reliability of the measured stress–strain curve. Consequently, the experimentally obtained curve was employed for subsequent simulations. The basic physical parameters of the Ag matrix and the SnO2 reinforcement used in finite element calculation are listed in Table 1. Considering the ultra-high strength and brittle ceramic characteristics of SnO2 particles, SnO2 was simplified as an ideal linear elastic material without plastic deformation during the whole simulation process.
Table 1.
Physical parameters used for simulation [22].
3. Results and Discussion
3.1. Phase Composition and Microstructure of Ag-SnO2 Composites
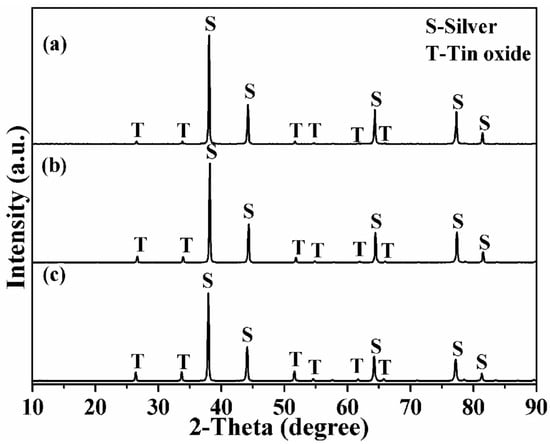
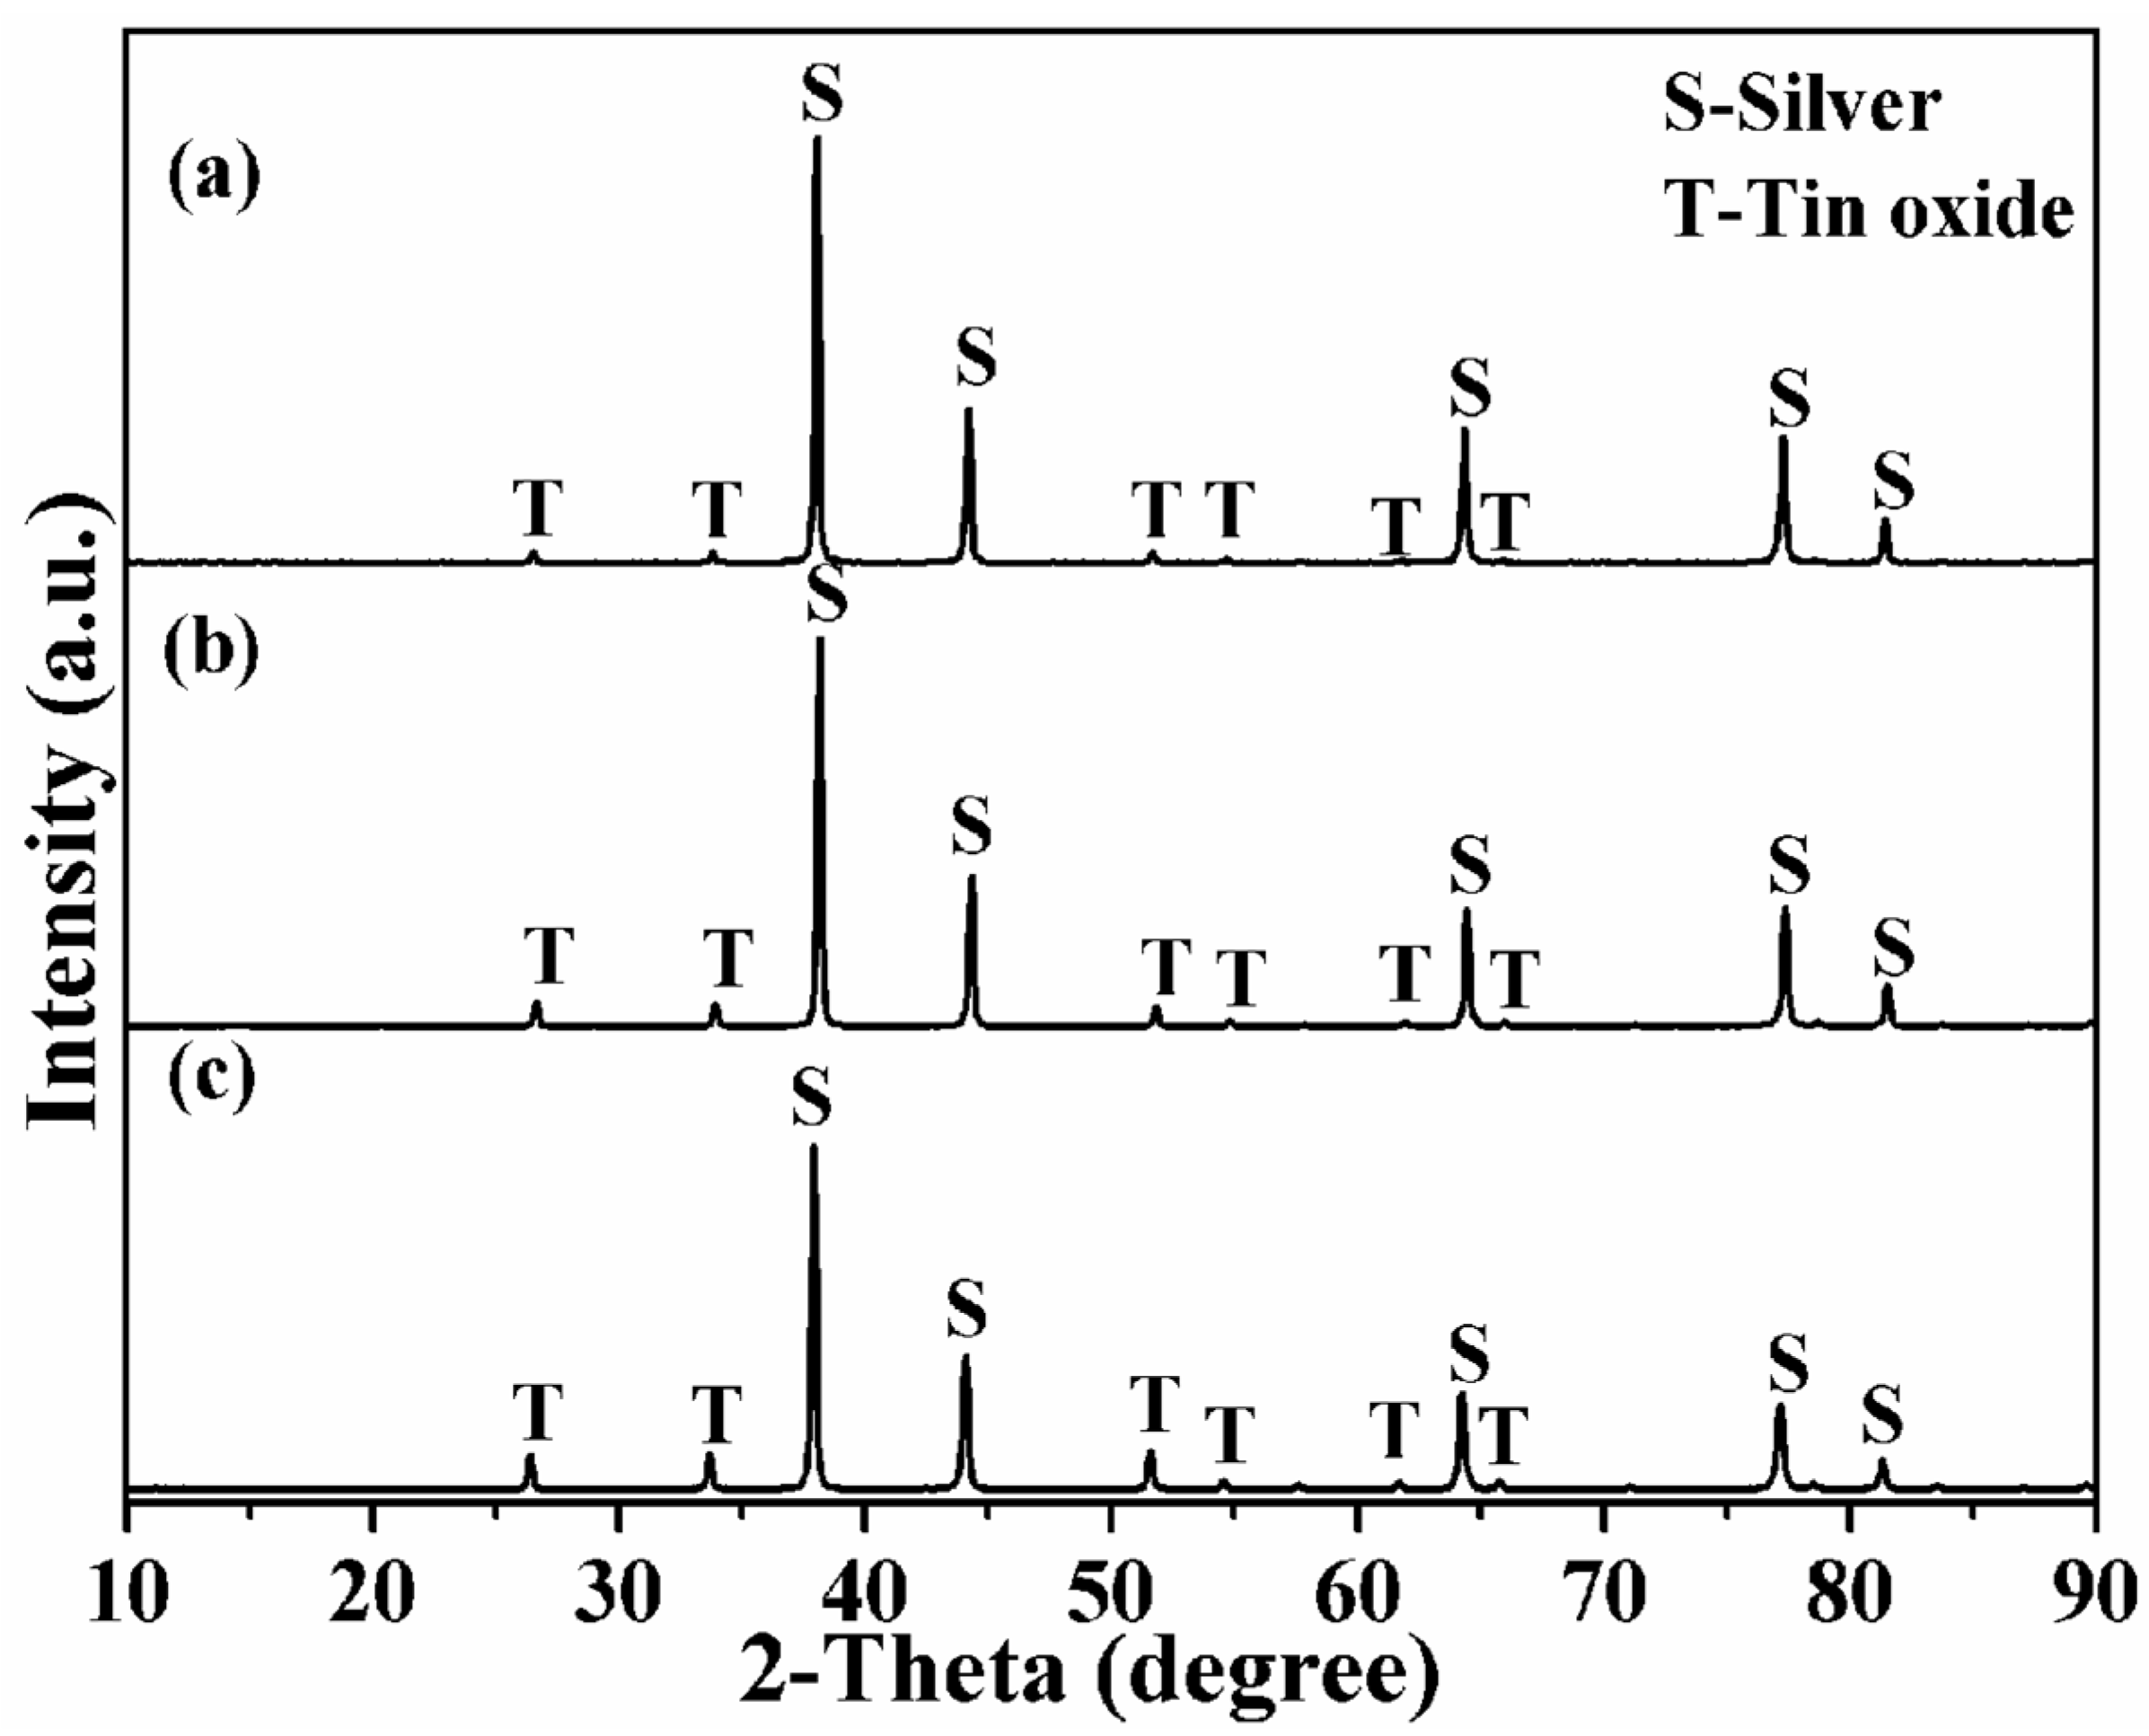
The XRD patterns of Ag-SnO2 composites with different SnO2 volume fractions are displayed in Figure 2. For all samples, we only observed the characteristic diffraction peaks of cubic metallic Ag and tetragonal SnO2, with no impurity peaks detected. With the increase in the SnO2 volume fraction, the relative intensity of the SnO2 diffraction peaks increased gradually relative to the Ag matrix peaks, which was consistent with the variation in reinforcement content.
Figure 2.
XRD patterns of the Ag-SnO2 electrical contact materials reinforced by SnO2 with different volume fractions: (a) 9.5 vol%; (b) 18.3 vol%; (c) 26.5 vol%.
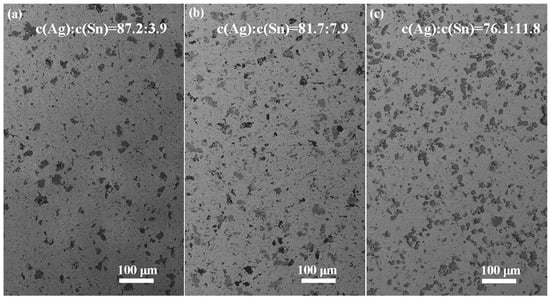
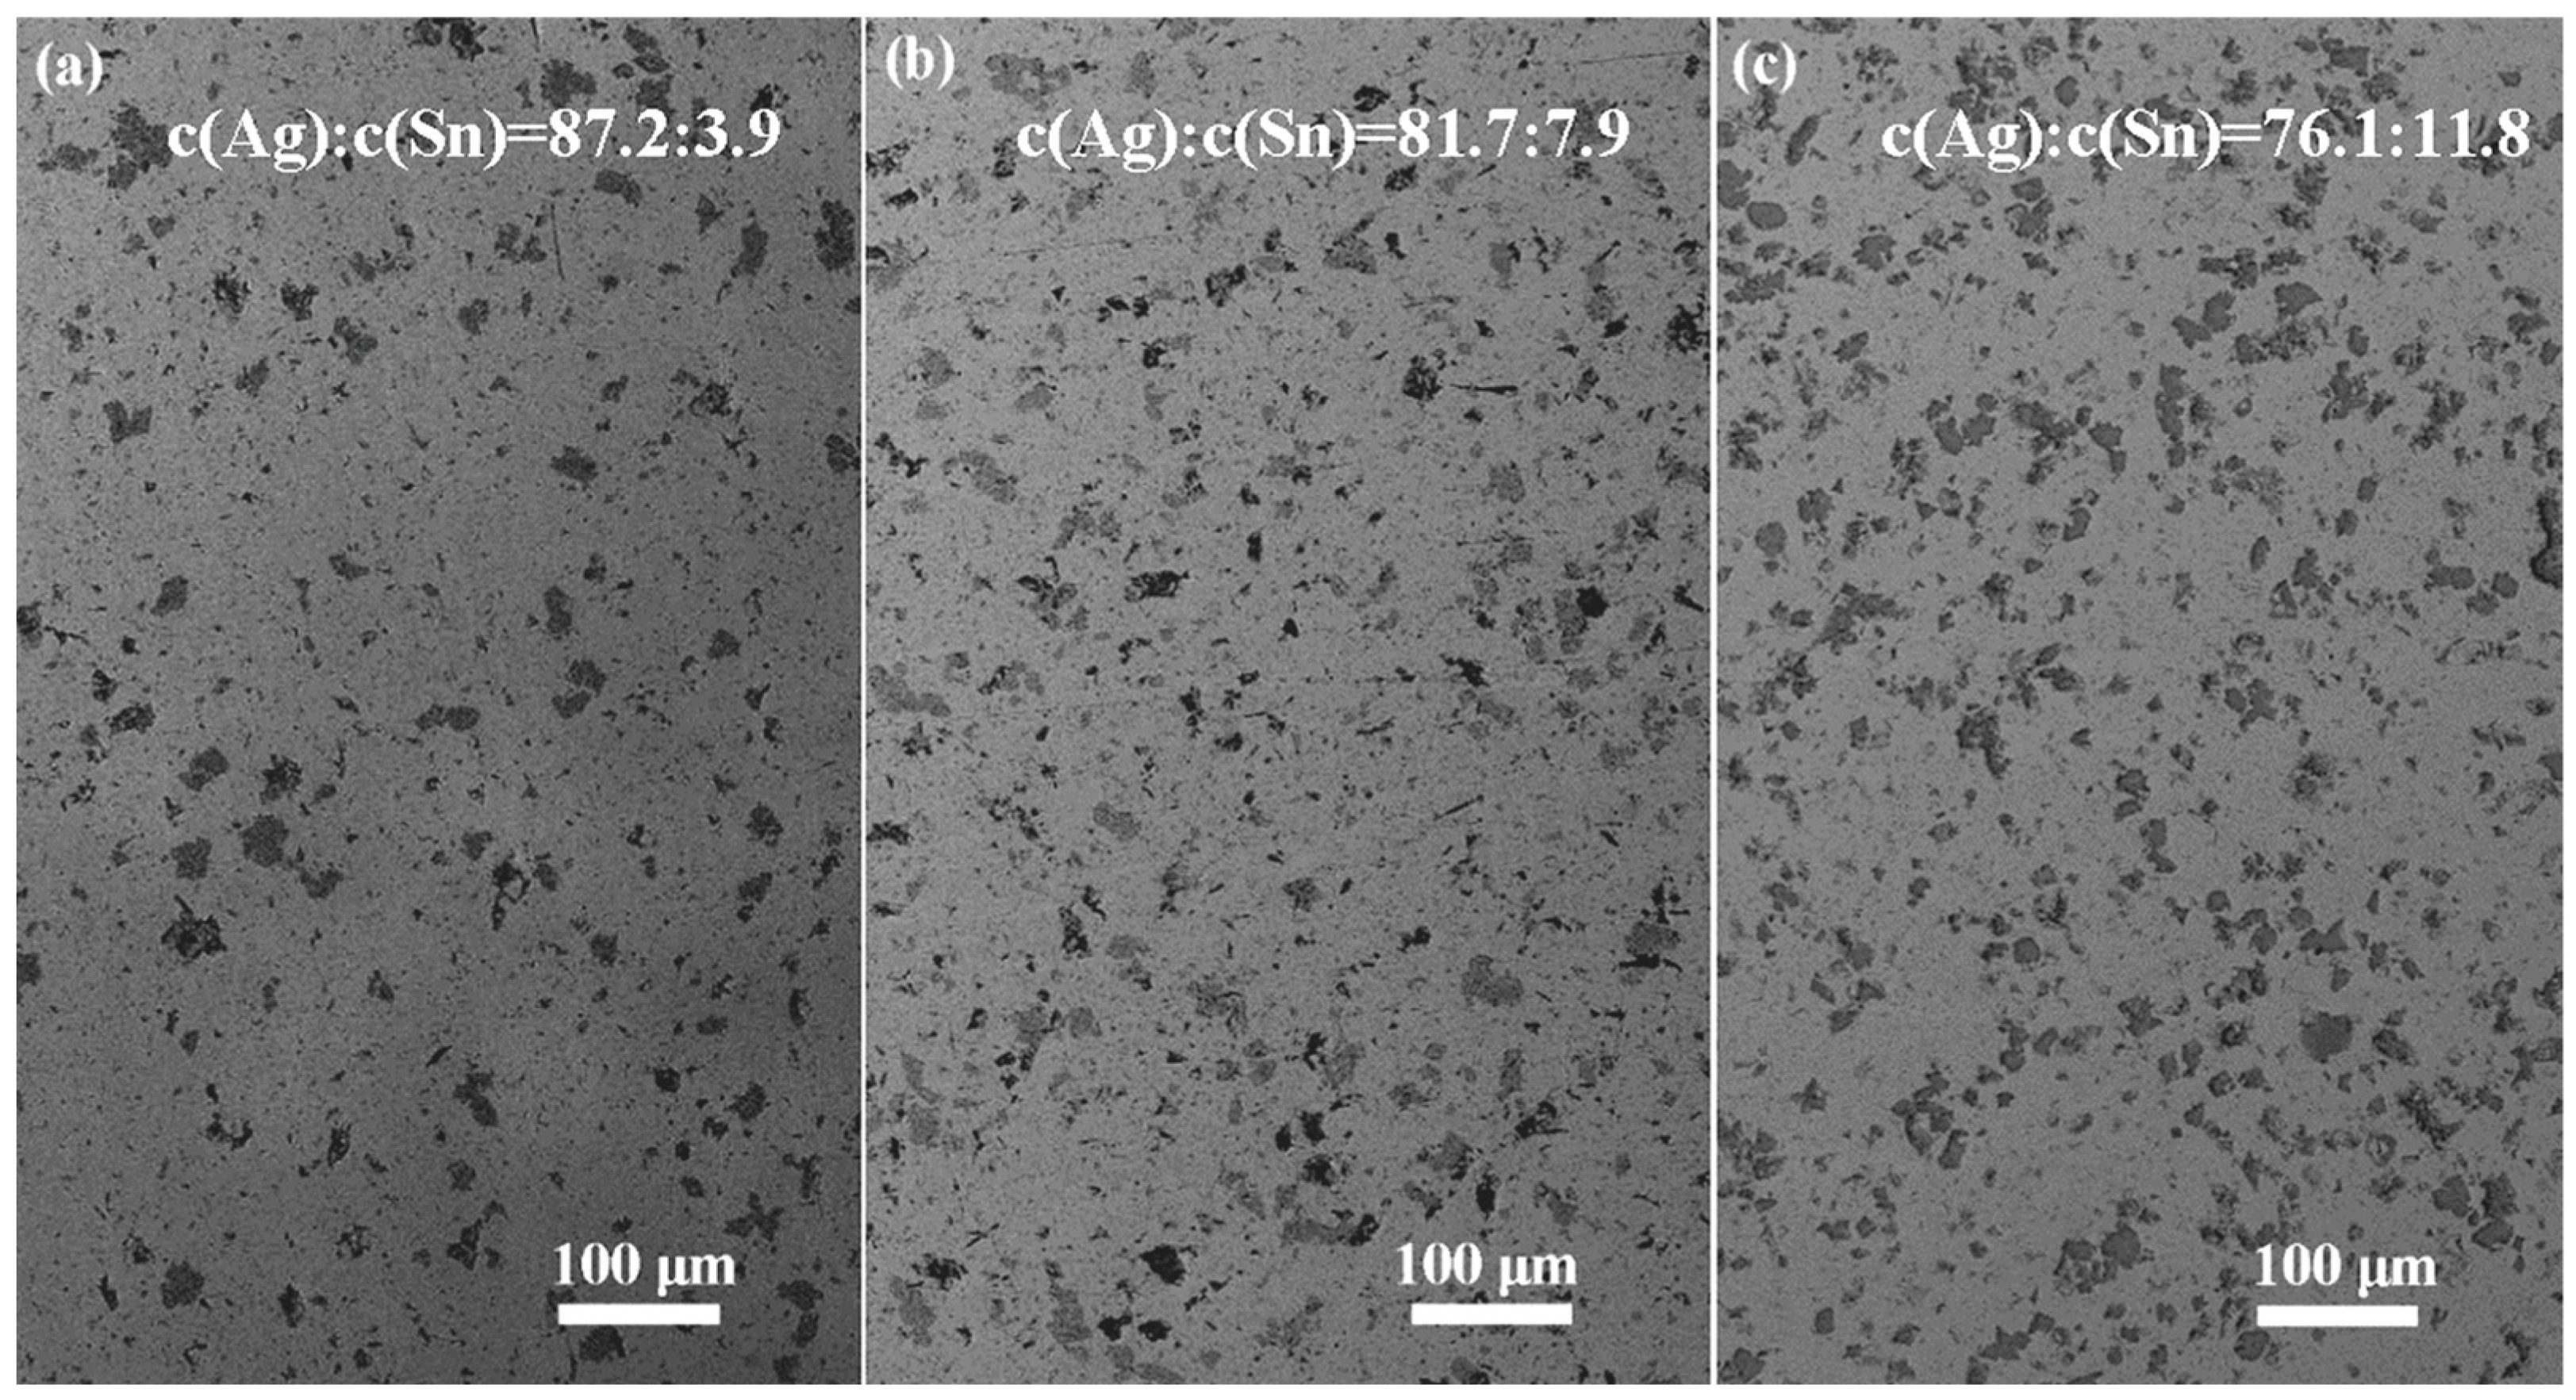
The backscattered electron micrographs of the composites are shown in Figure 3. For all samples, SnO2 particles are uniformly dispersed in the Ag matrix. As the SnO2 volume fraction increases, the average spacing between reinforcing particles decreases gradually. An energy-dispersive X-ray spectroscopy (EDS) analysis was used to confirm the actual SnO2 content in the composites, and the results are labeled in Figure 3. The measured atomic ratio of Ag–Sn agrees well with the designed composition.
Figure 3.
Backscattered electron images of the Ag-SnO2 electrical contact materials reinforced by SnO2 with different volume fractions: (a) 9.5 vol%; (b) 18.3 vol%; (c) 26.5 vol%. Inset: corresponding EDS results.
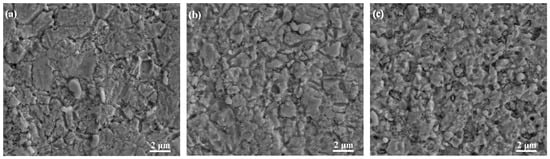
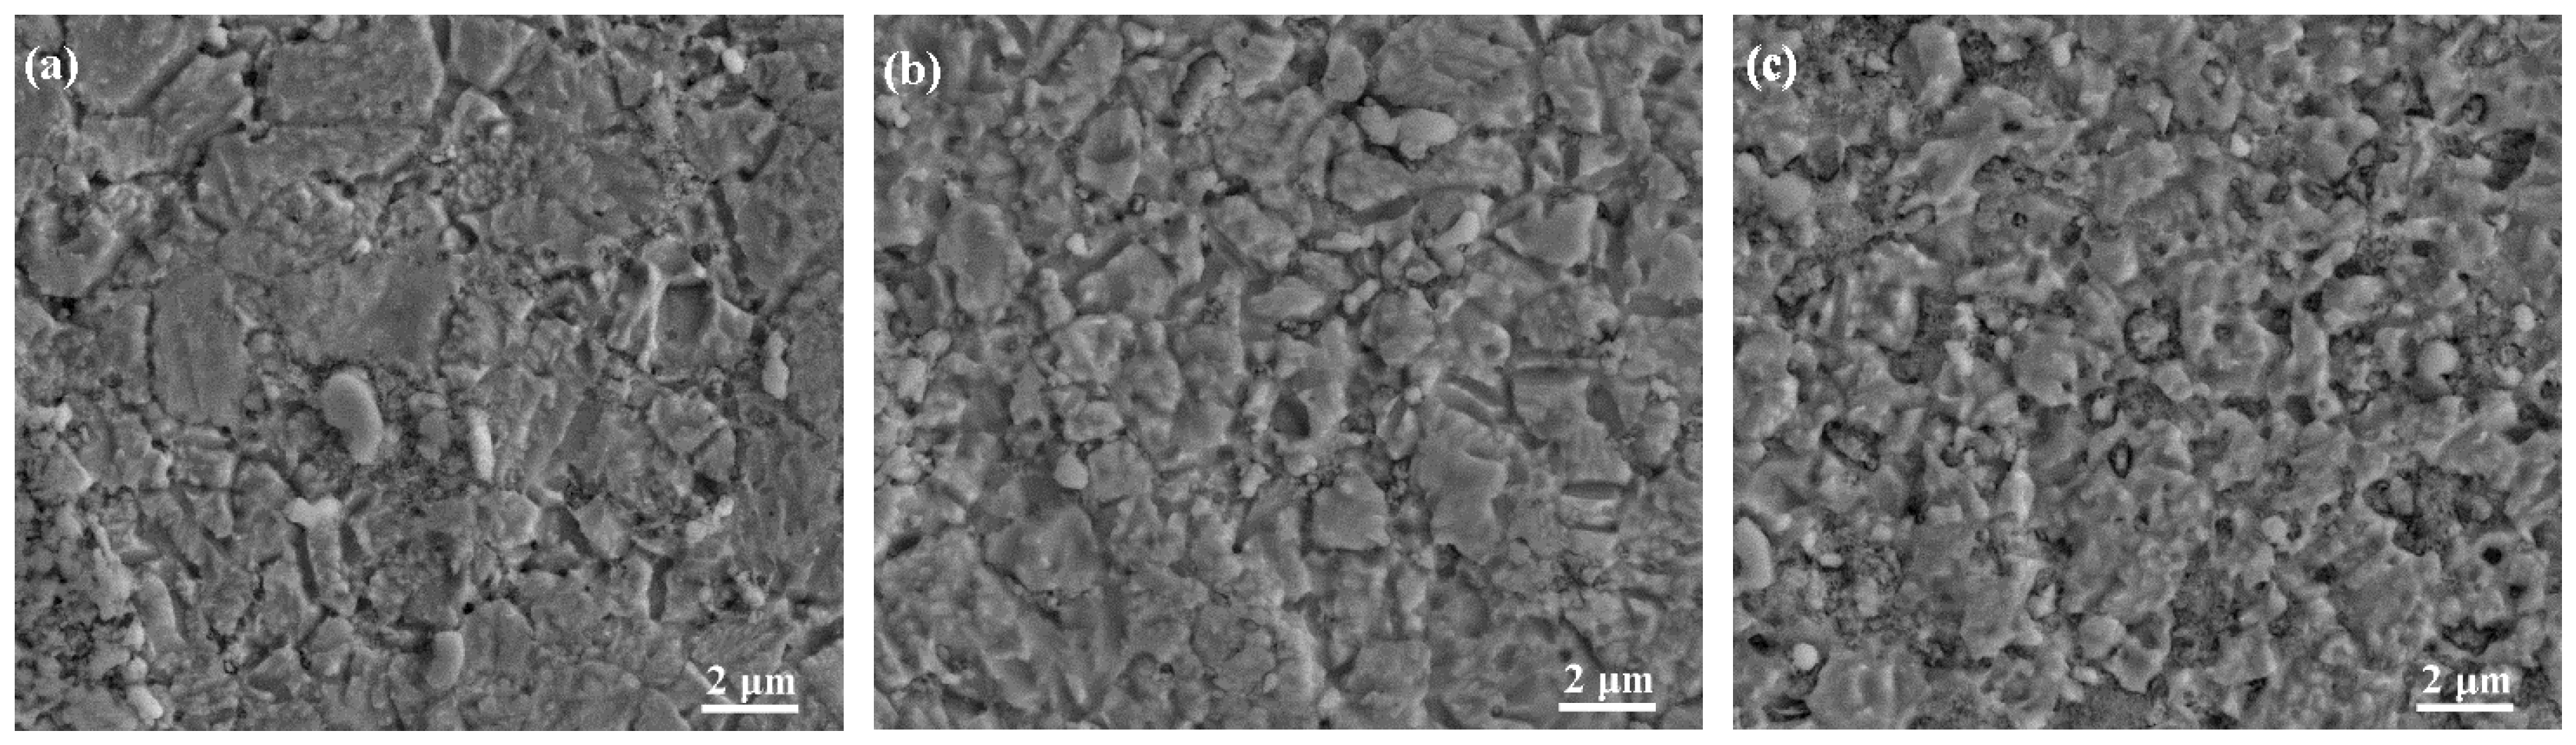
The microscopic morphologies of the Ag matrix grains of composites with different SnO2 content are shown in Figure 4. According to the statistical analysis of the SEM images, the average grain sizes of the Ag matrix in the composites containing 9.5 vol%, 18.3 vol%, and 26.5 vol% SnO2 are 2.3 μm, 1.2 μm, and 1.0 μm, respectively. SnO2 particles pinned at Ag grain boundaries inhibit grain boundary migration and grain growth, resulting in obvious grain refinement.
Figure 4.
Microstructures of the Ag-SnO2 electrical contact materials reinforced by SnO2 with different volume fractions: (a) 9.5 vol%; (b) 18.3 vol%; (c) 26.5 vol%.
3.2. Physical Properties of Ag-SnO2 Composites
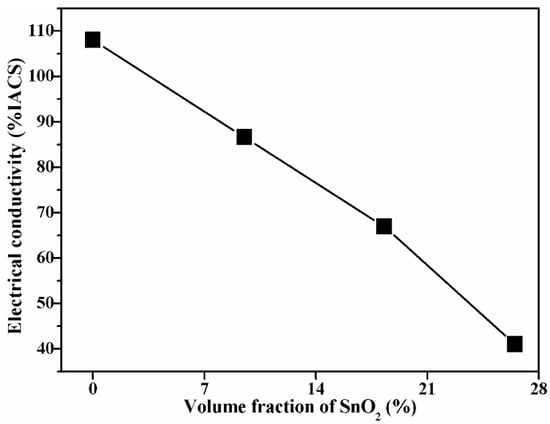
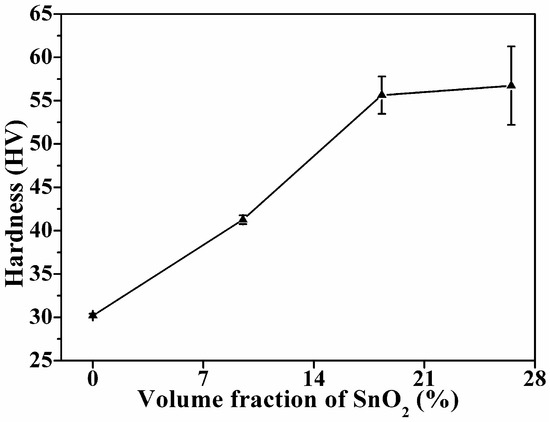
As shown in Table 2, both the Archimedes density and the theoretical density of the sintered Ag-SnO2 composites decrease with increasing SnO2 volume fractions. The introduction of SnO2 reinforcements may induce additional porosity in the composite. As shown in Figure 5, the electrical conductivity of the Ag-SnO2 composites decreases with increasing SnO2 volume fractions. Two dominant electron scattering mechanisms account for the conductivity degradation. The total interfacial area between Ag and SnO2 increases with increasing reinforcement volume fractions, which intensifies interfacial electron scattering, resulting in a continuous decrease in electrical conductivity. The variation in composite hardness is shown in Figure 6. The hardness increases significantly as the SnO2 volume fraction rises from 0 vol% (pure Ag) to 18.3 vol%, while further increasing the SnO2 content brings a negligible hardness improvement. On one hand, a high SnO2 fraction hinders uniform dispersion, and some SnO2 agglomeration can be observed in Figure 3c. Particle agglomeration reduces the number of effective interfaces for load transfer. On the other hand, the large error bar in hardness for samples with high SnO2 fractions (Figure 6) indicates deteriorating microstructural homogeneity. Meanwhile, the relative density decreases continuously with increasing reinforcement content (Table 2). The resulting pores act as micro-defects, offsetting the potential hardening contribution from additional SnO2 particles. Under the combined influence of particle agglomeration, a non-uniform microstructure, and a reduced density, the hardness plateaus at excessive SnO2 volume fractions.
Table 2.
Density of Ag-SnO2 electrical contact materials reinforced by SnO2 with different volume fractions.
Figure 5.
The effect of the SnO2 volume fraction on the electric conductivity of Ag-SnO2 contact materials.
Figure 6.
The effect of the SnO2 volume fraction on the hardness of Ag-SnO2 contact materials.
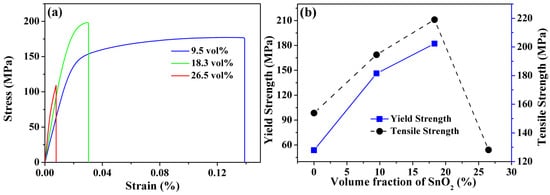
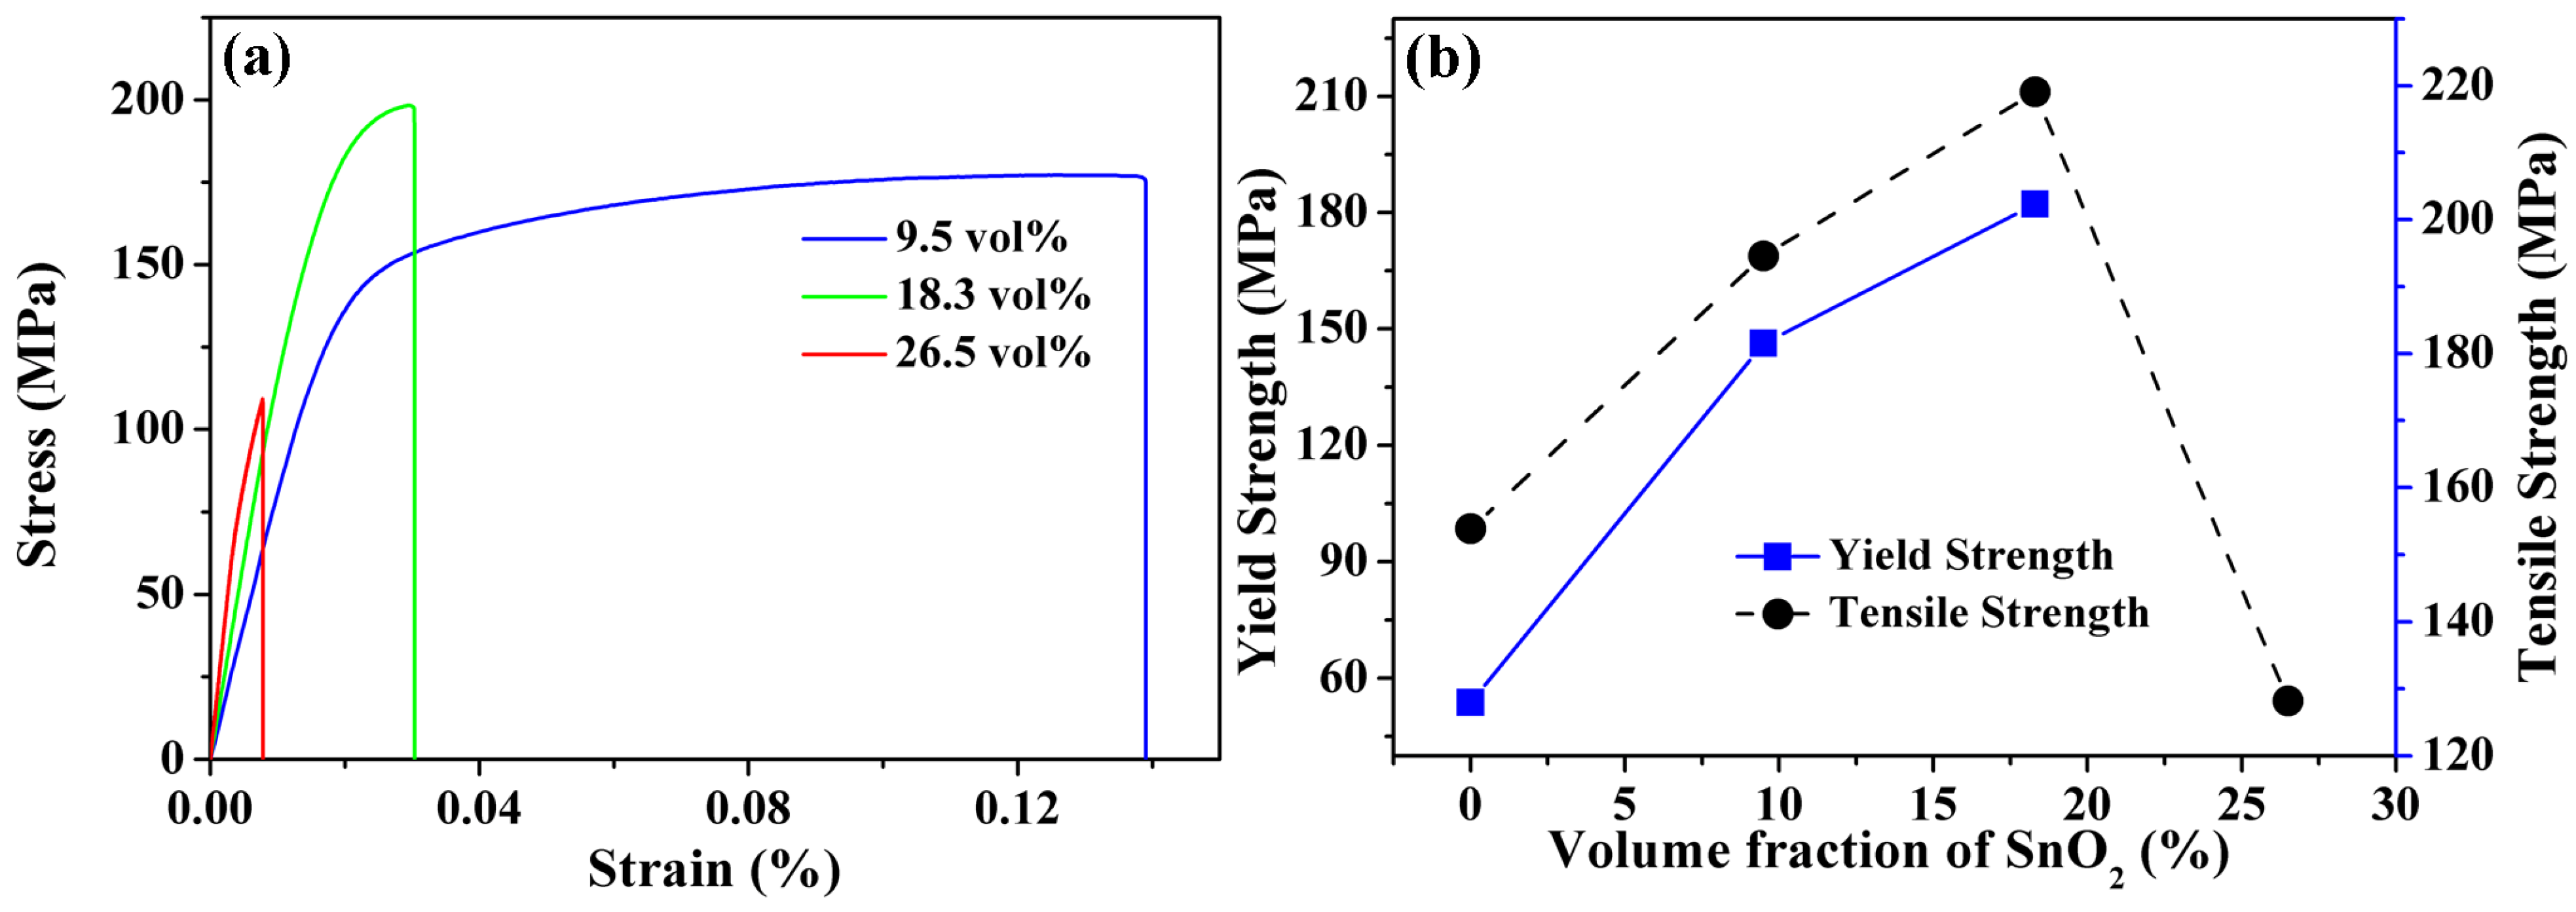
The mechanical properties of Ag-SnO2 composites with different SnO2 volume fractions are presented in Figure 7. The yield and tensile strength of the as-prepared pure Ag are 51.2 and 105.8 MPa, respectively. With increasing SnO2 volume fractions (0~18.3%), the yield strength of the composites increases monotonically. When the SnO2 volume fraction reaches 9.5 vol% and 18.3 vol%, the tensile strength increases significantly to 194.6 MPa and 219.1 MPa, respectively. However, when the SnO2 content increases further to 26.5 vol%, the composite exhibits typical brittle fracture characteristics without obvious plastic deformation, and the tensile strength drops sharply to 128.2 MPa.
Figure 7.
(a) The stress–strain curves of the Ag-SnO2 electrical contact materials reinforced by SnO2 with different volume fractions; (b) the effect of the SnO2 volume fraction on the mechanical properties of the Ag-SnO2 contact materials.
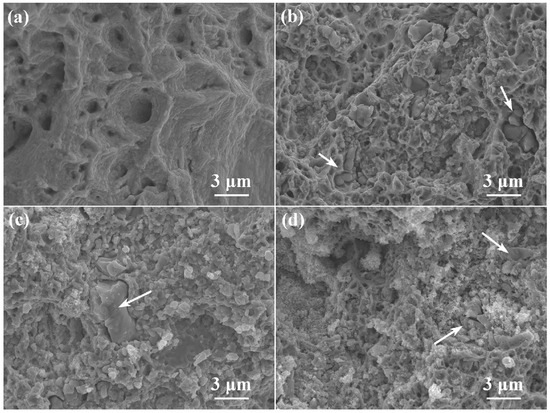
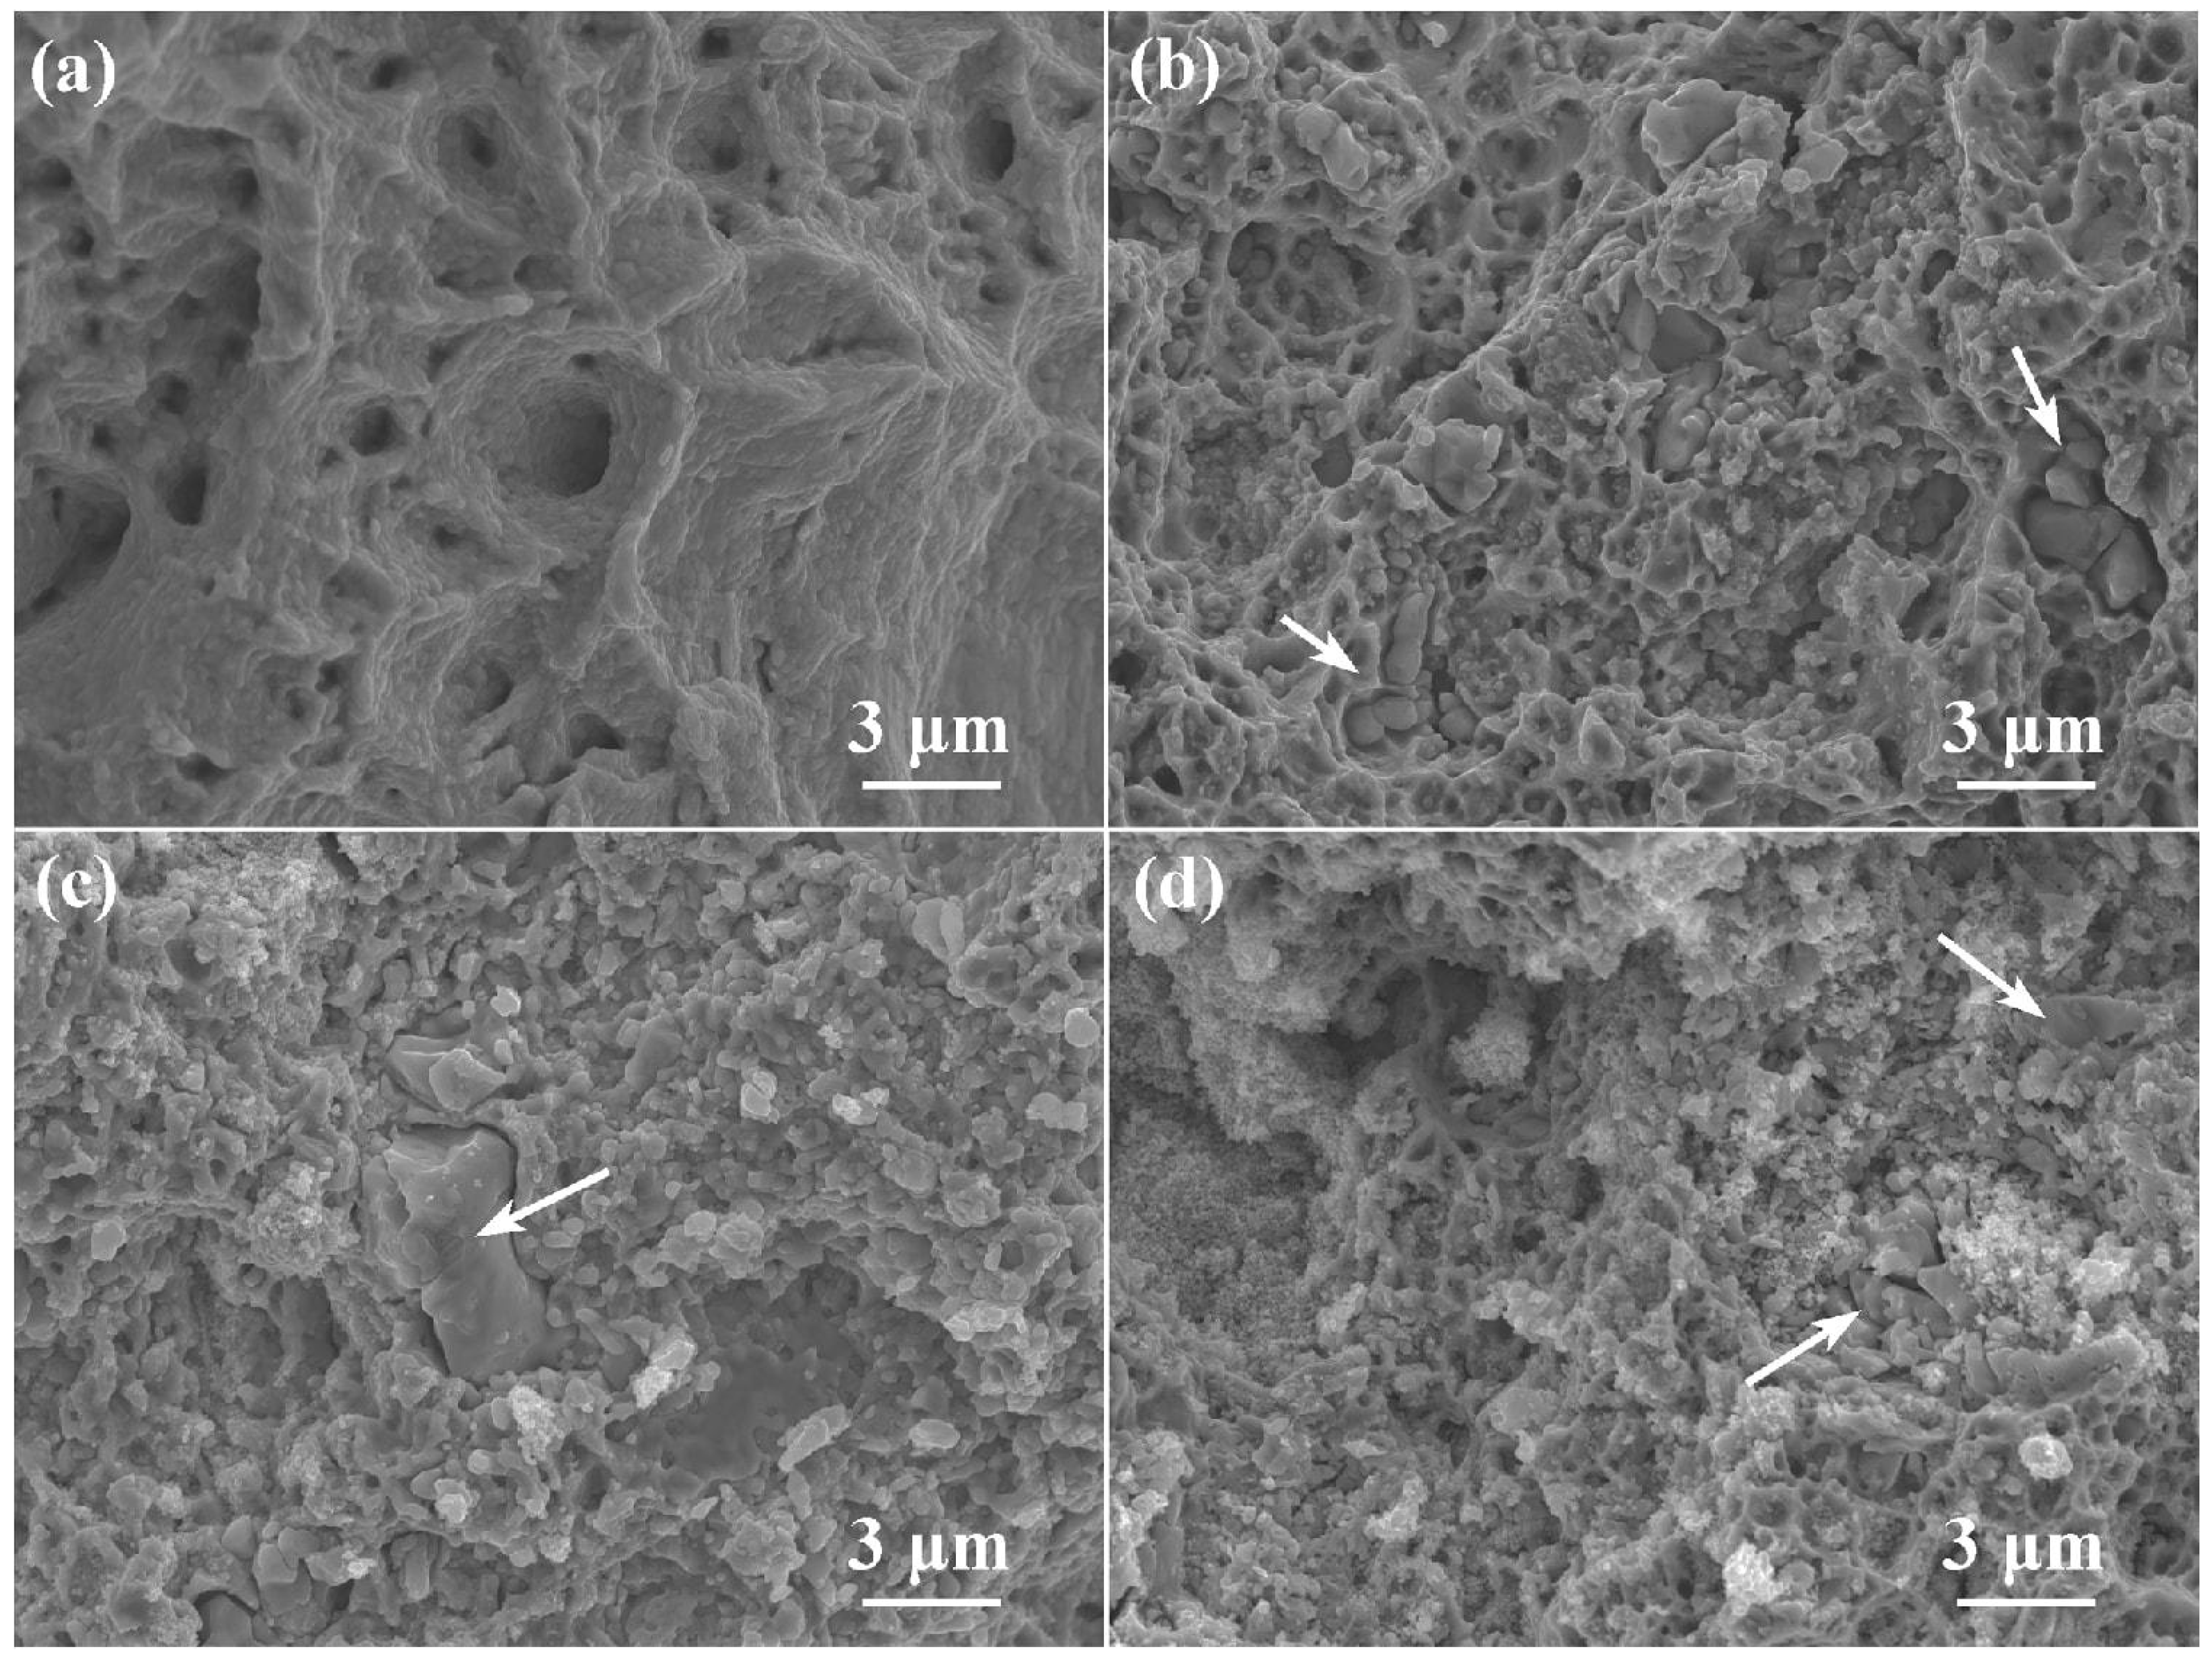
The fracture surfaces of the tensile-tested specimens were examined, as shown in Figure 8. The pure silver sample displayed numerous dimples measuring 1–3 μm in diameter, characteristic of ductile fracture. As the SnO2 volume fraction increases, the dimple dimensions in the composite samples progressively decrease, signifying a gradual transition from ductile to brittle fracture. For the sample reinforced with 26.5 vol% SnO2, the fracture surface exhibits typical brittle characteristics with cleavage facets and minimal plastic deformation, marking the onset of severe brittle fracture.
Figure 8.
The fracture surface images of Ag-SnO2 electrical contact materials with various volume fractions of SnO2: (a) 0, (b) 9.5 vol%, (c) 18.3 vol%, (d) 26.5 vol%. Arrows indicate fragmented SnO2 reinforcements.
3.3. Strengthening Mechanism of Ag-SnO2 Composites
The mechanical property improvement of particle-reinforced metal matrix composites is jointly determined by direct and indirect strengthening mechanisms. Direct strengthening refers to load transfer from the soft Ag matrix to rigid SnO2 particles, while indirect strengthening includes grain refinement, dislocation multiplication, and Orowan bypass strengthening. The quantitative contribution of each mechanism was analyzed via finite element simulation and theoretical calculation.
3.3.1. Direct Load Transfer Strengthening
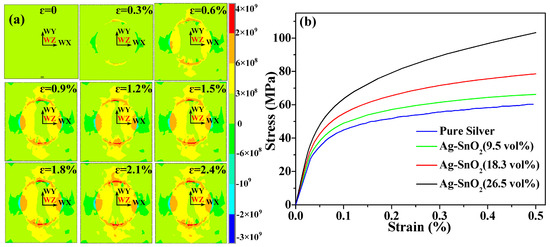
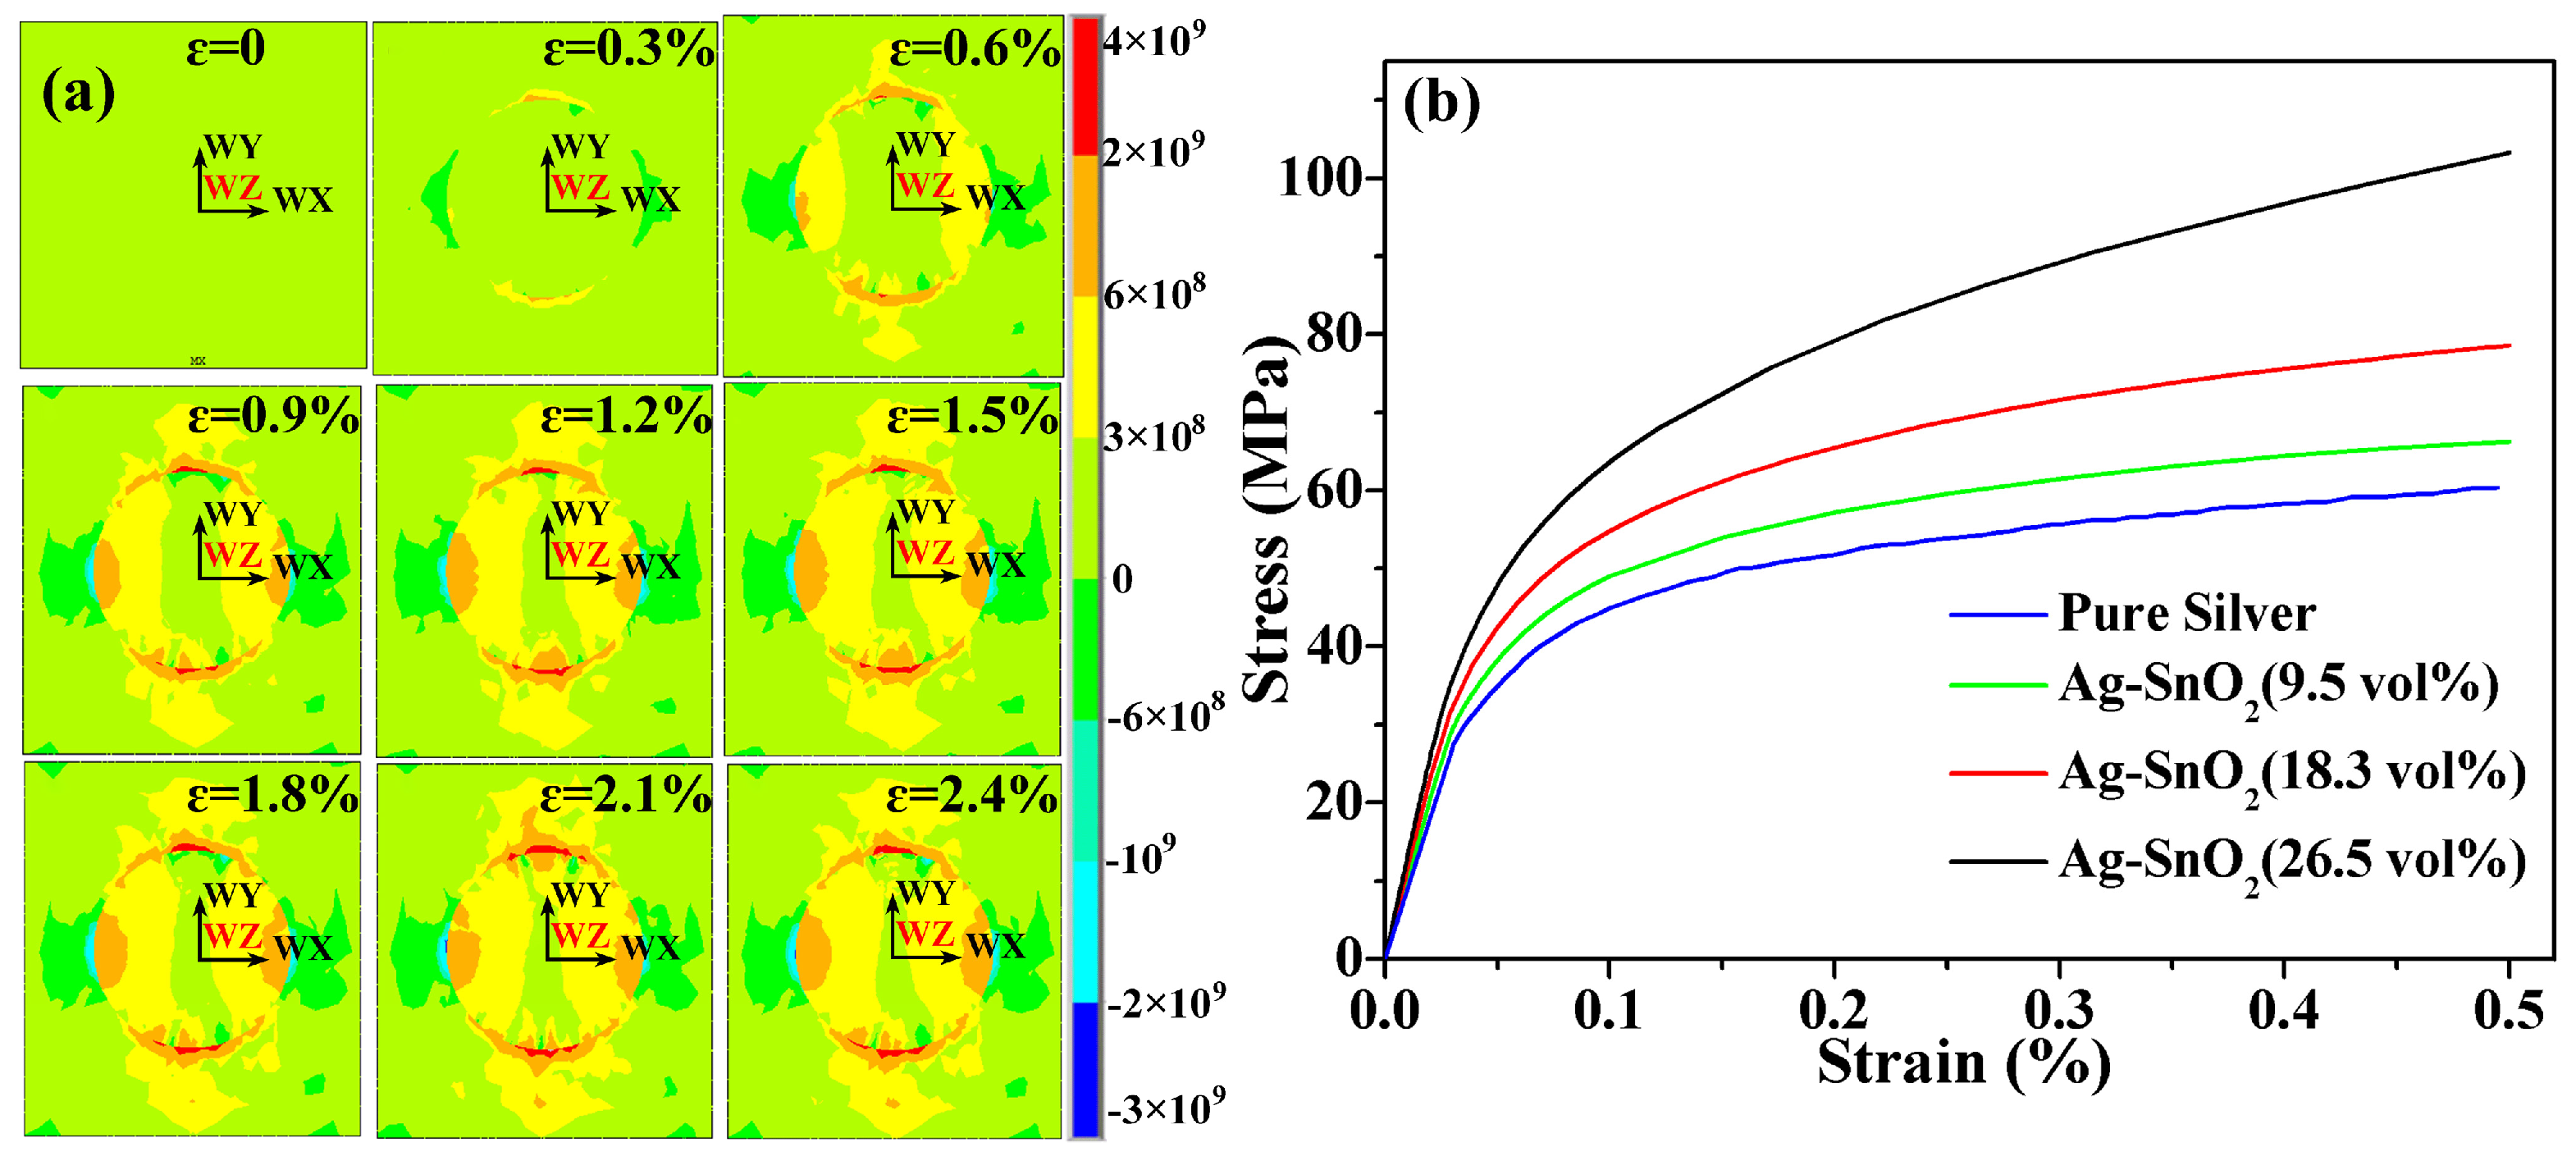
The load transfer strengthening behavior was quantitatively investigated using the finite element simulation method established in Section 2.3. Taking the 9.5 vol% SnO2 composite as a typical case, the sequential stress distribution evolution under continuous tensile strain is presented in Figure 9a. Significant stress concentration occurs at the Ag/SnO2 interface, and rigid SnO2 particles bear a partial tensile load transferred from the Ag matrix. The simulated stress–strain curves for independent direct load transfer strengthening are shown in Figure 9b. The calculated yield strength increments induced by pure load transfer amount to 5.0 MPa, 14.3 MPa, and 30.3 MPa for composites reinforced with 9.5 vol%, 18.3 vol%, and 26.5 vol% SnO2, respectively. Compared with the experimental tensile results, the strengthening contribution of direct load transfer is extremely limited. For the coarse 15 μm SnO2 particles used in this work, the effective load-bearing capacity of the reinforcements is insufficient, demonstrating that direct strengthening is not the dominant reinforcing mechanism in the fabricated Ag-SnO2 composites.
Figure 9.
(a) Simulated stress nephograms of Ag-SnO2 (9.5 vol% SnO2) electrical contact materials under different tensile strains and (b) simulated stress–strain curves of Ag-SnO2 composites with different SnO2 volume fractions under the single direct strengthening mechanism.
3.3.2. Indirect Load Transfer Strengthening
The addition of SnO2 significantly changes the microstructural characteristics of the Ag matrix, producing multiple indirect strengthening effects. Indirect strengthening mechanisms include grain boundary strengthening via Hall–Petch refinement, strain hardening arising from dislocation multiplication and entanglement, and Orowan strengthening. In this section, these three typical indirect strengthening mechanisms are quantitatively calculated and decoupled based on classical composite strengthening theories and experimental microstructure parameters.
Grain refinement strengthening follows the classic Hall–Petch formula, which is the primary strengthening mechanism of the prepared Ag-SnO2 composites [23]:
where σg is the yield strength of the pure silver matrix, σ0 is the yield strength of a pure silver single crystal (24 MPa [24]), dm is the grain size of the silver matrix, and ky is the Hall–Petch slope constant of pure silver (1.69 MPa·cm1/2 [24]). Based on the Hall–Petch equation and the average grain size data summarized in Table S1, the predicted strength increments attributable to grain refinement in Ag-SnO2 composites containing 9.5 vol%, 18.3 vol%, and 26.5 vol% SnO2 are 82.3 MPa, 123.2 MPa, and 135.8 MPa, respectively.
In Ag-SnO2 composites, the significant differences in the elastic modulus and thermal expansion coefficient between rigid SnO2 particles and the ductile Ag matrix produce prominent strain mismatch at the phase interfaces, generating abundant geometrically necessary dislocations (GNDs) and statistically stored dislocations (SSDs) and resulting in dislocation strengthening. The yield strength enhancements induced by these two types of dislocations can be quantitatively evaluated according to the Taylor dislocation strengthening relationship reported in the literature [23].
In addition, the Orowan bypass strengthening effect was calculated based on the modified Orowan equation [25]. The results show that the strength increment caused by the Orowan mechanism is only 1.3–2.1 MPa for all samples. The negligible strengthening effect is attributed to the large size of the SnO2 particles, which leads to large interparticle spacing and a weak interaction between particles and dislocations.
3.3.3. Coupled Mixed Strengthening Model
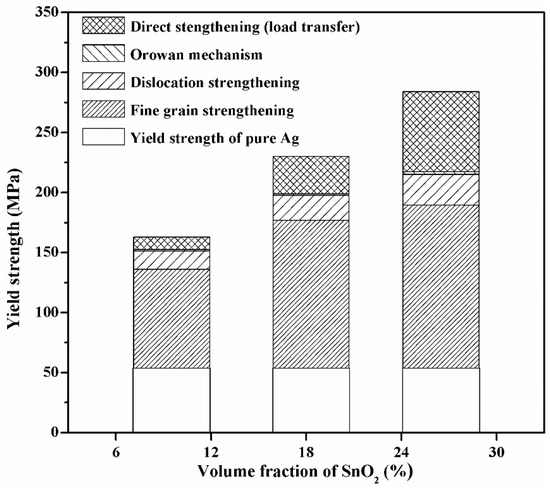
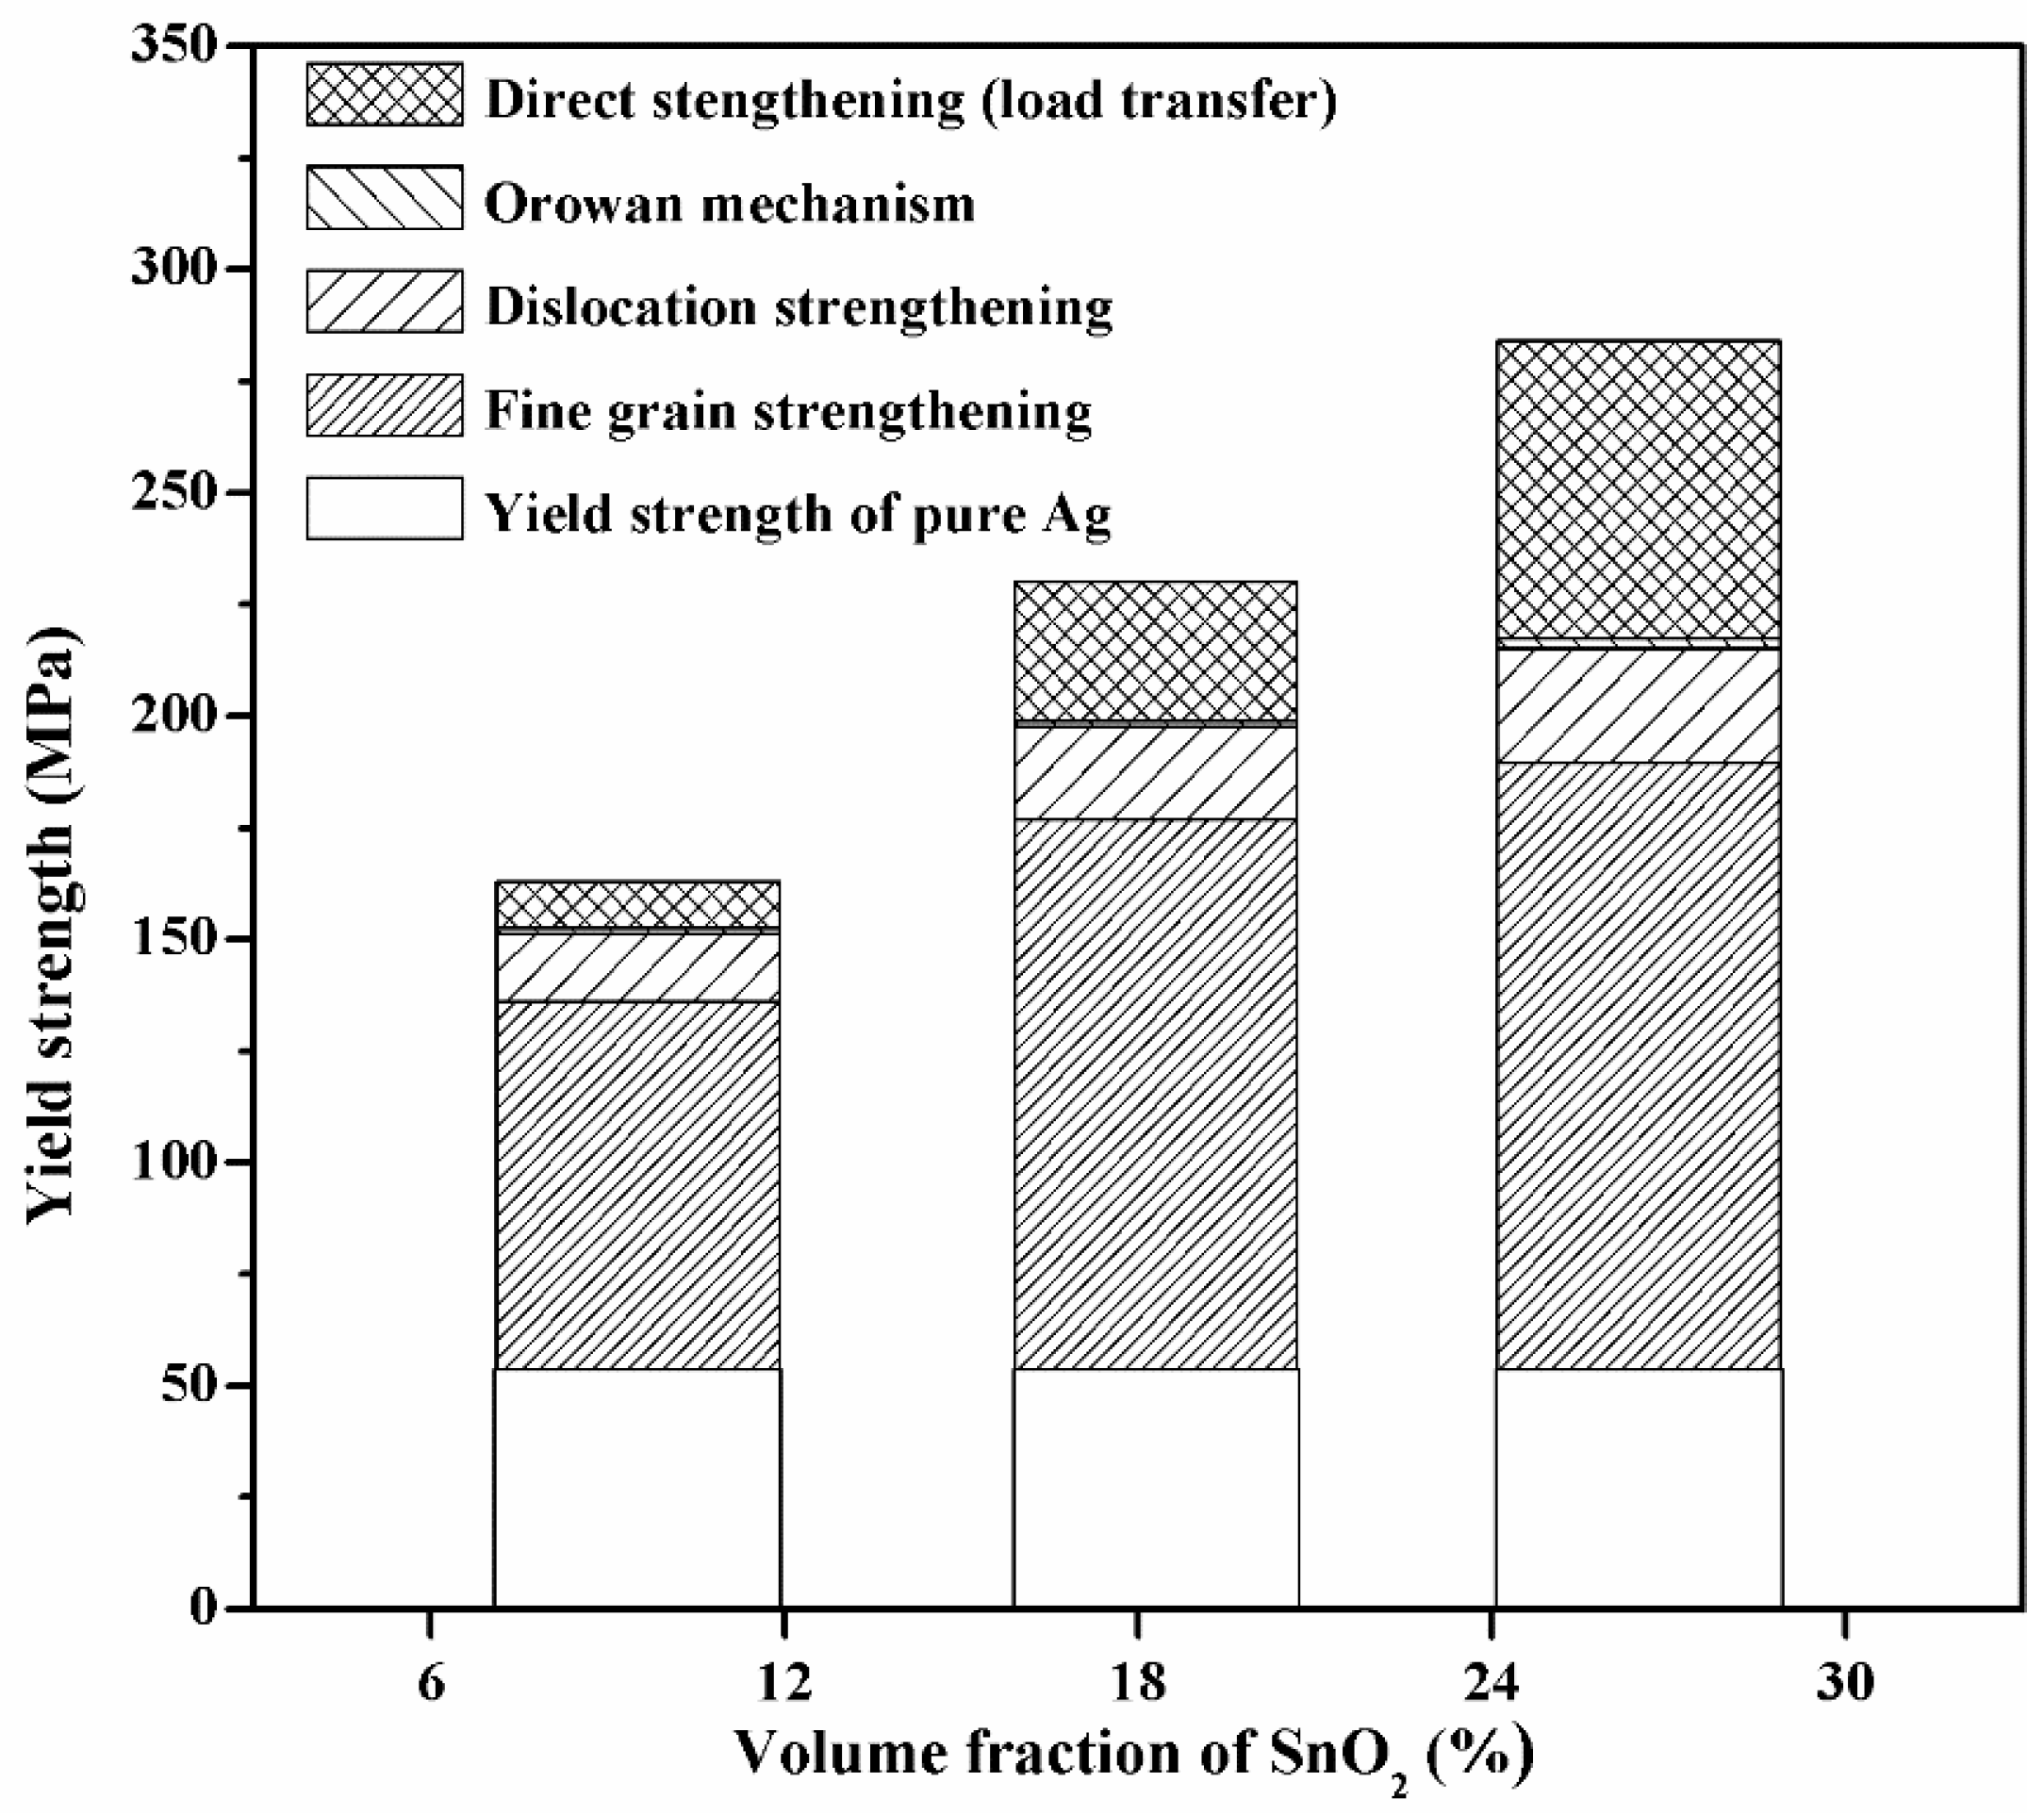
The macroscopic mechanical properties of Ag-SnO2 composites arise from the synergistic coupling of all strengthening mechanisms. The modified matrix yield strength considering multiple indirect strengthening effects was substituted into the finite element load transfer model to establish a mixed strengthening prediction model. The contribution proportions of each strengthening mechanism are displayed in Figure 10. The simulated yield strength of the mixed model is highly consistent with the experimental data. The slight deviation between the simulation and experiment is caused by interfacial debonding and the local fracture of SnO2 particles during tensile deformation, which partially releases local stress concentration and thereby reduces the macroscopic strength of the composites.
Figure 10.
The simulated yield strength of Ag-SnO2 electrical contact materials reinforced by SnO2 with the different volume fraction contributions of each mechanism.
4. Conclusions
In this work, Ag-SnO2 electrical contact composites with different SnO2 volume fractions were fabricated. With increasing SnO2 volume fractions, the hardness of the composites increases continuously, while the electrical conductivity decreases. For SnO2 content ranging from 0 to 18.3 vol%, the composite yield strength increases monotonically with increasing SnO2 content. The ultimate tensile strength first increases and then decreases, with optimal comprehensive mechanical performance obtained at 18.3 vol% SnO2, reaching the maximum tensile strength of 219.1 MPa. An excessively high SnO2 volume fraction (26.5 vol%) induces the brittle fracture of the composites, resulting in a sharp decline in tensile strength and no significant improvement in hardness. The mechanical reinforcement of Ag-SnO2 composites depends on the synergistic effect of direct and indirect strengthening mechanisms. Indirect strengthening dominates the mechanical performance, with grain refinement being the primary mechanism, dislocation multiplication being the secondary mechanism, and the Orowan strengthening effect being negligible for the 15 μm coarse SnO2 particle reinforcements.
Supplementary Materials
The following supporting information can be downloaded at https://www.mdpi.com/article/10.3390/ma19163545/s1. Figure S1. Schematic diagram of the “I-shape” sample workpiece. Figure S2. Stress–strain curve of the identically processed Ag control hot-pressed at 700 °C and 30 MPa for 1 h. Figure S3. Three-dimensional models of different mesh sizes: (a) mesh size 1 and (b) mesh size 3. Figure S4. (a) The stress–strain curves of the composite and (b) the yield strength of the composite under different mesh sizes. Figure S5. Microstructure of the pure Ag reference. Table S1. Average Ag matrix grain sizes of Ag-SnO2 composites with different SnO2 fractions.
Author Contributions
Conceptualization, Z.L. and X.S.; methodology, Z.L.; software, Z.L.; validation, Z.L. and B.L.; formal analysis, Z.L.; investigation, Z.L.; resources, X.S.; data curation, Z.L.; writing—original draft preparation, Z.L.; writing—review and editing, Z.L. and B.L.; visualization, B.L.; supervision, X.S.; project administration, X.S.; funding acquisition, X.S. All authors have read and agreed to the published version of the manuscript.
Funding
This research was funded by the Fujian Province University–Industry–Research Joint Innovation Project (No. 2025H6032).
Data Availability Statement
The original contributions presented in this study are included in the article/Supplementary Materials. Further inquiries can be directed to the corresponding authors.
Conflicts of Interest
The authors declare no conflicts of interest.
References
- Gao, K.; Wang, H.J.; Li, H.Y.; Cao, Q.G.; Li, J. Enhancement of arc erosion and welding resistance in Ag-SnO2 contacts through WO3 and Ag2WO4 additives. Adv. Eng. Mater. 2025, 27, 2501048. [Google Scholar]
- Mao, T.C.; Wang, J.; Wang, Z.; Fang, C.; Mao, Z.S.; Lv, H.P.; Zhang, S.; Chang, Y.L.; Zhu, J.B.; Kuang, B.; et al. Towards understanding the synergistic reinforcement of erosion and impact resistance mechanisms in Ag-SnO2-CuO contacts by composite nanofibres. Ceram. Int. 2025, 51, 49928–49941. [Google Scholar] [CrossRef] [Scilit]
- Wang, M.; Chen, Z.F.; Song, W.; Hong, D.Z.; Huang, L.; Li, Y.H. A review on cadmium exposure in the population and intervention strategies against cadmium toxicity. Bull. Environ. Contam. Toxicol. 2021, 106, 65–74. [Google Scholar] [CrossRef] [Scilit] [PubMed]
- Xia, Y.X.; Sun, Y.T.; Zhu, P.; Li, W.T.; Hu, J.R.; Hao, L.L.; Liu, Y.; Ju, B.Y.; Yang, W.S.; Wu, G.H. Revealing the compatible deformatoin mechanism of metal particles reinforced aluminum matrix composites. Mat. Sci. Eng. A-Struct. 2025, 936, 148418. [Google Scholar] [CrossRef] [Scilit]
- Tang, J.C.; Omar, M.Z.; Jiang, R.P.; Mohamed, I.F. Effect of TiB2 on the Microstructure and Mechanical Properties of TiB2/Al-5Cu Matrix Composites. JOM 2025, 77, 1064–1078. [Google Scholar] [CrossRef] [Scilit]
- Jiang, M.Y.; Zhang, X.Z.; Mei, H.; Xu, S.; Liu, L.S. The coupled effects of grain boundary strengthening and orowan strengthening examined by dislocation dynamics simulations. Comput. Mater. Sci. 2024, 231, 112602. [Google Scholar] [CrossRef] [Scilit]
- Shen, C.Y.; Ye, Y.Q.; Chen, F.; Zhuo, Y.M.; Zhang, J.M.; Mao, J.W.; Le, J.W.; Han, Y.F.; Lu, W.J. Evading strength-ductility trade-off in titanium matrix composites via high-critical resolved shear stress dislocation promotion and grain subdivision. Rare Met. 2026, 45, e70389. [Google Scholar] [CrossRef] [Scilit]
- Liu, Y.; Zan, Y.N.; Wang, D.; Song, M.; Shao, X.H.; Hao, H.L.; Jin, Q.Q.; Wang, W.G.; Xiao, B.L.; Ma, Z.Y. Temperature mechanical properties: Multimechanism synergistic strengthening strategy. Nano Lett. 2024, 24, 10244–10250. [Google Scholar] [CrossRef] [Scilit] [PubMed]
- Chen, Y.; Jian, Z.Y.; Ren, Y.M.; Li, K.; Dang, B.; Guo, L.X. Influence of TiB2 volume fraction on SiCp/AlSi10Mg composites by LPBF: Microstructure, mechanical, and physical properties. J. Mater. Res. Technol. 2023, 23, 3697–3710. [Google Scholar] [CrossRef] [Scilit]
- Gao, X.; Lu, X.N.; Zhang, X.X.; Qian, M.F.; Li, A.B.; Geng, L.; Wang, H.; Liu, C.; Ouyang, W.T.; Peng, H.X. Effect of particle strength on SiCp/Al composite properties with network architecture design. Materials 2024, 17, 597. [Google Scholar] [CrossRef] [Scilit] [PubMed]
- Qayyum, F.; Chiu, C.C.; Tseng, S.; Rustamov, U.; Berndorf, S.; Shen, F.H.; Guk, S.; Chao, C.K.; Prahl, U. Local strain heterogeneity and damage mechanisms in zirconia particle-reinforced TRIP steel MMCs: In situ tensile testing with digital image processing. J. Mater. Sci. 2024, 59, 18882–18900. [Google Scholar] [CrossRef] [Scilit]
- Hussein, O.; Mishin, Y. Self-pinning mechanism for grain boundary stabilization. Acta Mater. 2026, 314, 122358. [Google Scholar] [CrossRef] [Scilit]
- Qi, D.R.; Li, G.J.; Han, X.L.; Fang, X.Q.; Feng, W.J.; Tian, R.L. Effect of the in-situ formed CuO additive on the fracture behaviour and failure mechanism of Ag-SnO2 composites. Eng. Fract. Mech. 2023, 284, 109240. [Google Scholar] [CrossRef] [Scilit]
- Qi, Z.X.; Li, L.H.; Yi, H.; Liang, W.G.; Liu, J.Q.; Wei, M.C. Effect of SnO2 particulate characteristics on mechanical properties of Ag/SnO2 electrical contact materials. Int. J. Solids Struct. 2025, 314, 113338. [Google Scholar] [CrossRef] [Scilit]
- Zhou, Y.J.; Zhou, J.Y.; Zhang, W.W.; Fan, J.L.; Wu, S.; Li, X.Q.; Wei, S.Z. Improvement the thermal stability and mechanical properties of ODS Cu alloy by forming composite oxide dispersion. Mater. Charact. 2025, 229, 115552. [Google Scholar] [CrossRef] [Scilit]
- Liu, K.; Su, Y.S.; Wang, X.Z.; Cai, Y.P.; Cao, H.; Ouyang, Q.B.; Zhang, D. Achieving simultaneous enhancement of strength and ductility in Al matrix composites by employing the synergetic strengthening effect of micro- and nano-SiCps. Compos. Part B-Eng. 2023, 248, 110350. [Google Scholar] [CrossRef] [Scilit]
- Fu, X.Q.; Liang, L.H.; Wei, Y.G. Modeling of atomistic scale shear failure of Ag/MgO interface with misfit disocation network. Comput. Mater. Sci. 2019, 170, 109151. [Google Scholar] [CrossRef] [Scilit]
- Ding, Y.H.; Jiang, Q.W.; Lin, H.Z.; Liu, X.Y.; Zhou, J.D.; Tang, D.L.; Yi, J.J.; Feng, J. Laminated architecture with interpenetrating 3D-Gr enhancement of strength and electrical conductivity in Cu matrix composites. J. Alloys Compd. 2025, 1044, 184543. [Google Scholar] [CrossRef] [Scilit]
- Wang, J.; Li, D.M.; Wang, Y.P. Microstucture and properties of Ag-SnO2 materials with high SnO2 content. J. Alloys Compd. 2014, 582, 1–5. [Google Scholar] [CrossRef] [Scilit]
- Lin, Z.J.; Liang, Y.C.; Sang, Y.H.; Chen, S.; Chen, X.; Sun, X.D.; Liu, H.; Dai, P.Q. Morphology-dependent highly active microcrystalline stannous oxalate photocatalysts with selectively exposed facets and low specific surface areas. Appl. Surf. Sci. 2020, 525, 146347. [Google Scholar] [CrossRef] [Scilit]
- Lin, Z.J.; Liang, Y.C.; Zeng, Y.M.; Chen, X.; Liu, M.M.; Dai, P.Q.; Chen, J.L.; Sun, X.D. Morphology-tunable synthesis and formation mechanism of SnO2 particles and their application in Ag-SnO2 electrical contact materials. Ceram. Int. 2022, 48, 6052–6061. [Google Scholar] [CrossRef] [Scilit]
- Cao, L.; Yao, J.; Qian, S.G.; Huang, J.F. Stress-fields numerical simulation of particle reinforced Ag matrix composite material. Sci. Techol. Eng. 2010, 10, 208–212. [Google Scholar]
- Dai, L.H.; Ling, Z.; Bai, Y.L. Size-dependent inelastic behavior of particle-reinforced metal-matrix composites. Compos. Sci. Technol. 2001, 61, 1057–1063. [Google Scholar] [CrossRef] [Scilit]
- Aldrich, J.W.; Armstrong, R.W. The grain size dependence of the yield, flow an fracture stress of commercial purity silver. Metall. Trans. 1970, 1, 2547–2550. [Google Scholar] [CrossRef] [Scilit]
- Schmid, E.; Walter, B. Kristallplastizitāt: Mit Besonderer Berücksichtigung der Metalle; Springer: Berlin/Heidelberg, Germany, 1935; pp. 15–58. [Google Scholar]

Disclaimer/Publisher’s Note: The statements, opinions and data contained in all publications are solely those of the individual author(s) and contributor(s) and not of MDPI and/or the editor(s). MDPI and/or the editor(s) disclaim responsibility for any injury to people or property resulting from any ideas, methods, instructions or products referred to in the content. |
© 2026 by the authors. Licensee MDPI, Basel, Switzerland. This article is an open access article distributed under the terms and conditions of the Creative Commons Attribution (CC BY) license.