Abstract
In order to accurately characterize the temperature dependence of the high-temperature performance of asphalt pavement surface layer materials, this paper studies the effects of temperature, load, and number of actions on the high-temperature anti-rutting performance of asphalt pavement surface layer materials (AC-13 and AC-16 mixtures), based on indoor rutting tests, and constructs a high-temperature performance temperature-dependent model and rutting prediction model for surface layer materials. The results show that as the temperature increases, the dynamic stability of the mixture decreases in an S-shaped curve, and the rut depth increases exponentially. The temperature-dependent model transition temperatures for the dynamic stability of 70#, 50#, 30#, SBS, and HMB asphalt mixtures are 39 °C, 44 °C, 46 °C, 56 °C, and 56 °C, respectively. The dynamic stability of modified asphalt mixtures is significantly higher than that of base asphalt mixtures. The depth of wheel ruts is affected by temperature, load, and the number of actions. The variation ranges of the load index kP, the temperature index kT, and the number of actions index kN are 0.727–1.222, 1.926–2.177, and 0.133–0.295, respectively. The correlation coefficients of the wheel rut prediction model are all above 0.95, and the depth of wheel ruts can be predicted by the model.
1. Introduction
In the context of global warming, data concerning extremely high temperatures worldwide are being updated with increasing frequency, with occurrences of temperatures exceeding 40 °C becoming notably prevalent and occasionally approaching approximately 45 °C [1,2]. These temperature extremes have profound implications for the utilization and performance of road traffic infrastructure [3]. The surface layer of asphalt pavement, owing to its direct exposure to environmental conditions, is particularly susceptible to the effects of elevated temperatures [4,5]. Empirical evidence demonstrates that the surface temperature of asphalt pavement can increase by 15 to 25 degrees Celsius above ambient temperatures. Consequently, when ambient temperatures surpass 40 °C, the pavement surface temperature may reach between 65 and 75 °C, thereby significantly elevating the risk of pavement distress, such as rutting, deformation, and diminished load-bearing capacity [6]. Furthermore, research identifies temperature as the principal factor contributing to non-load-related distress in asphalt pavements [7,8,9]. When the internal temperature of asphalt pavement exceeds the asphalt’s softening point, the mixture’s fluidity increases, resulting in heightened shear stress within the pavement structure and consequently increasing the likelihood of rutting damage [10,11]. The combination of elevated temperature and excessive loading markedly intensifies the risk of damage to the asphalt mixture, culminating in pronounced rutting deformation [12,13]. Comparative studies indicate that, relative to conventional base asphalt, SBS-modified asphalt, and rubber asphalt, high-viscosity asphalt and lower-grade asphalt demonstrate superior resistance to high-temperature rutting [14,15]. Moreover, the permanent deformation of asphalt mixtures escalates with increasing load and temperature, with the synergistic effects of these factors adversely affecting the mixture’s deformation resistance [16,17].
To quantitatively evaluate the influence of various factors on the high-temperature rutting resistance of asphalt mixtures and to predict rutting progression, Mu et al. [18] conducted prolonged rutting tests on three distinct asphalt mixture types across a spectrum of temperature conditions. This methodology facilitated the derivation of temperature-dependent rutting rates that more precisely represent the high-temperature stability of the mixtures. Shang et al. [19] examined variations in dynamic stability and rutting deformation of interlayer mixtures subjected to different temperature regimes and asphalt binder types. Additionally, they developed a temperature-dependent model to characterize rutting behavior, thereby providing a scientific basis for optimizing asphalt pavement design and enhancing rutting resistance. Javilla et al. [20] carried out rutting experiments on asphalt mixtures to investigate the effects of multiple stress loads on rutting development, subsequently formulating a multi-stress analysis model and establishing pertinent rutting performance indicators. Through rutting and dynamic modulus testing, Sun et al. [21] demonstrated that high-modulus asphalt mixtures possess superior resistance to deformation, rutting, and high-temperature instability, while exhibiting low sensitivity to variations in traffic loading. Xu et al. [22] explored the anti-rutting performance and underlying mechanisms of three different asphalt mixtures under varying high-temperature and load conditions, finding a linear decrease in anti-rutting performance across all mixtures with increasing temperature and load. Li et al. [23] analyzed the impact of rutting progression on the high-temperature performance of individual asphalt pavement layers. Guo et al. [24] investigated factors influencing the rutting resistance of asphalt pavements, concluding that elevated temperatures and load levels correspond to diminished rutting resistance in asphalt mixtures. Zhang et al. [25] assessed the effects of climate change on rut recovery capacity in selected representative cities, revealing that failure to incorporate climate change considerations in asphalt pavement rutting design leads to insufficient recovery capabilities. Zhao et al. [26] proposed a robust methodology for accurately predicting the rutting resistance of asphalt mixtures and pavement surfaces by integrating laboratory experiments with finite element modeling techniques. Huang et al. [27] developed a viscoelastic–plastic damage constitutive model tailored for asphalt mixtures to evaluate permanent deformation under cyclic loading. Their results indicated that cumulative deformation of the asphalt layer increased progressively with the number of loading cycles, although the rate of increase diminished over time.
The studies reviewed have substantially enhanced the comprehension of factors influencing the high-temperature behavior of asphalt mixtures. Nonetheless, existing predictive models in the literature typically address only one or two key variables—namely, temperature, load magnitude, or loading cycles—while a comprehensive constitutive model that concurrently integrates all three factors remains lacking. Additionally, the characteristic sigmoidal decline in dynamic stability as a function of temperature has not been sufficiently captured by traditional functional forms. To address these gaps, the present study makes two significant contributions that set it apart from prior research. Firstly, it introduces an innovative application of the Boltzmann function to precisely characterize the temperature dependence of dynamic stability, thereby facilitating accurate identification of performance transition temperatures across various asphalt types. Secondly, it develops a unified rutting prediction model that holistically incorporates the interactive effects of temperature, load magnitude, and the loading number. This integrated framework offers a more robust predictive tool and yields enhanced insights into the performance of asphalt mixtures under complex operational conditions.
2. Research Approach
2.1. Raw Material
2.1.1. Asphalt
The asphalt materials used in this study included 70# base asphalt from Jingbo Corporation, Binzhou, China. 50# and 30# base asphalt from Jiangsu Tiannuo Road Materials Co., Ltd., Zhenjiang, China. SBS-modified asphalt from Maoming Xinlu Building Materials Technology Co., Ltd. Maoming, China, and HMB high-modulus asphalt supplied by Zhongli Company, Pinghu, China. Their technical specifications are listed in Table 1 and Table 2, respectively.

Table 1.
Technical properties of base asphalt.

Table 2.
Properties of SBS-modified asphalt and HMB high-modulus asphalt technology.
2.1.2. Mineral Aggregate
- (1)
- Coarse Aggregate
The coarse aggregates used are basalt crushed stones produced by Shaanxi Rongxin Mining Development Co., Ltd., Shangluo, China. Their specifications are 16–19 mm, 13.2–16 mm, 9.5–13.2 mm, and 4.75–9.5 mm. The technical properties of each specification of aggregates are shown in Table 3.

Table 3.
Technical properties of coarse aggregates.
- (2)
- Fine Aggregate
The fine aggregate is made from limestone manufactured sand produced by Shanxi Rongxin Mining Development Co., Ltd., Shangluo, China. Its technical properties are shown in Table 4.

Table 4.
Fine aggregate technical properties.
- (3)
- Mineral Powder
The mineral powder is made from limestone produced by Shanxi Rongxin Mining Development Co., Ltd., Shangluo, China. Its technical properties are shown in Table 5.

Table 5.
Technical properties of the mineral powder.
2.2. Research Approach
The types of asphalt adopted were 70# base asphalt, 50# base asphalt, 30# base asphalt, SBS-modified asphalt, and HMB high-modulus asphalt.
The mineral aggregate gradation included an AC-13 mixture and an AC-16 mixture. The test items included track depth (RD) and dynamic stability (DS). The test load was as follows: 0.5 MPa, 0.7 MPa, 0.9 MPa, and 1.1 MPa. The test temperature was as follows: 15 °C, 30 °C, 45 °C, 60 °C, 65 °C, and 75 °C.
2.3. Experimental Procedure and Specifications
The rutting tests were performed in strict compliance with the Chinese standard “Standard Test Methods of Bitumen and Bituminous Mixtures for Highway Engineering (JTG E20-2011)” [28]. The detailed methodology is outlined as follows:
Temperature Control and Monitoring: Specimens were conditioned within a temperature-controlled chamber until a uniform and stable temperature was achieved throughout the entire volume, a condition verified prior to the initiation of loading. The chamber maintained the target test temperature with a precision of ±0.5 °C. The actual temperature of each test specimen was continuously monitored and confirmed using calibrated thermometers or thermocouples.
Load Application Simulation: Repeated loading was simulated employing a standard automatic wheel tracking tester, Beijing Aerospace Keyu Test Instrument Co., Ltd., Beijing, China. The standard contact pressure was set at 0.7 MPa with a tolerance of ±0.05 MPa. For the purposes of this investigation, additional load levels of 0.5 MPa, 0.9 MPa, and 1.1 MPa were also applied. The loading wheel reciprocated along a fixed path on the specimen surface at a frequency of 42 passes per minute. The total number of load cycles was automatically recorded by the data acquisition system integrated within the testing apparatus.
Specimen Conditioning: Specimens were placed in the environmental chamber, Beijing Aerospace Keyu Test Instrument Co., Ltd., Beijing, China. at the designated test temperature for a minimum duration of five hours to ensure thermal equilibrium throughout each specimen. This procedure was implemented to eliminate internal thermal gradients that could potentially compromise the accuracy and reliability of the test outcomes.
3. Influence of Test Temperature on the Dynamic Stability of Asphalt Pavement Surface Layer Materials
Figure 1 illustrates the dynamic stability of the asphalt surface layer material under various test conditions, while Table 6 presents the relative values of maximum dynamic stability, using 1.1 MPa dynamic stability as the reference. The specimen dimensions are 300 mm × 300 mm × 50 mm.
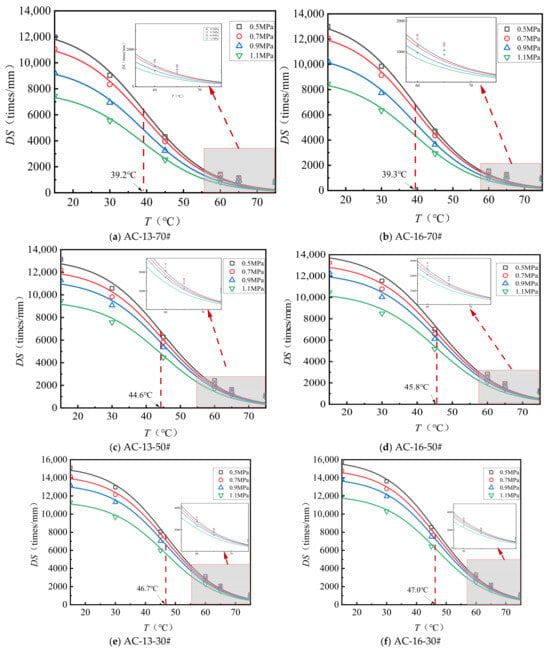
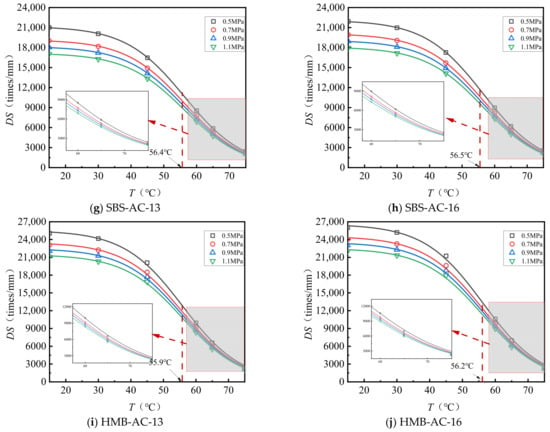
Figure 1.
Relationship between DS and T of surface layer materials.

Table 6.
Relative values of the maximum dynamic stability DSmax of surface layer materials.
As shown in Figure 1 and Table 6, (1) temperature significantly influences the mixture’s dynamic stability. As temperature increases, dynamic stability decreases following an S-shaped curve. At 15 °C, dynamic stability can be more than ten times higher than at 75 °C. (2) Lower temperatures amplify the effects of load and nominal maximum particle size on dynamic stability. At 15 °C, dynamic stability decreases markedly with increasing load, whereas at 75 °C, mixtures with the same asphalt type and mineral gradation tend to stabilize at a certain dynamic stability value. (3) At 15 °C, under a 0.5 MPa load, the dynamic stability of the AC-13 and AC-16 mixtures ranges from 1.19 to 1.61 times and 1.18 to 1.54 times, respectively, compared to that under 1.1 MPa. The 70# asphalt mixture shows greater sensitivity to load at 15 °C, while the HMB mixture is the least sensitive under the same conditions.
To guarantee the reliability and reproducibility of the experimental outcomes, each rutting test was performed with a minimum of three replicates under each testing condition. The coefficient of variation (Cv) was employed to evaluate the reliability of the test data, as shown in Table 7. Cv is defined as the ratio of the standard deviation to the mean value, expressed as a percentage. A lower Cv value signifies greater consistency and reduced variability among the replicate tests. In the present study, Cv for all test data remained below 10%, thereby confirming the high reproducibility and reliability of the experimental results.

Table 7.
Summary of the coefficient of variation for dynamic stability.
4. Research on the Temperature-Dependent Model of Dynamic Stability of Surface Layer Materials for Asphalt Pavement
From the relationship between dynamic stability and temperature, it can be shown that dynamic stability follows an inverse S-shaped curve trend, decreasing with temperature. Therefore, a temperature-dependent model of dynamic stability is proposed to be constructed using the Boltzmann function form. The fitting formula is shown in Equation (1), and the fitting parameters are presented in Table 8.
where DS is the predicted dynamic stability, times/mm; DSmax is the maximum dynamic stability, times/mm; T0 is the temperature at which the slope of the dynamic stability curve attains its maximum value, °C; and T is the testing temperature, °C.

Table 8.
Fitting coefficients of the temperature-dependent model for dynamic stability.
As presented in Table 8, Equation (1) provides an effective representation of the relationship between dynamic stability and temperature. The observed decline in dynamic stability with increasing temperature occurs in three distinct phases. Under identical loading conditions, the maximum dynamic stability (DSmax) values for various asphalt types, ranked from lowest to highest, are as follows: 70# < 50# < 30# < SBS < HMB. Notably, the DSmax values for SBS and HMB are substantially greater than those of the base asphalt. For a given asphalt type, DSmax decreases markedly with increasing load, with the reduction being more pronounced in the base asphalt compared to SBS and HMB. When considering the same asphalt type and mineral aggregate gradation, the transition temperatures of dynamic stability exhibit minimal variation across different load levels. The sequence of dynamic stability transition temperatures for the different asphalt types, from lowest to highest, is 70# < 50# < 30# < SBS < HMB. This transition temperature correlates with the asphalt’s softening point, such that a lower softening point corresponds to a lower transition temperature. SBS and HMB demonstrate the highest transition temperatures, indicating that mixtures incorporating these asphalts possess superior resistance to deformation under elevated temperature conditions.
Figure 2 illustrates the relationship between the estimated dynamic stability values (DS’) and the experimentally measured values (DS). By substituting the fitted parameters into the corresponding fitting function, predicted dynamic stability values at various temperatures are calculated. These predicted values are then compared with the observed measurements to assess the accuracy of the model.
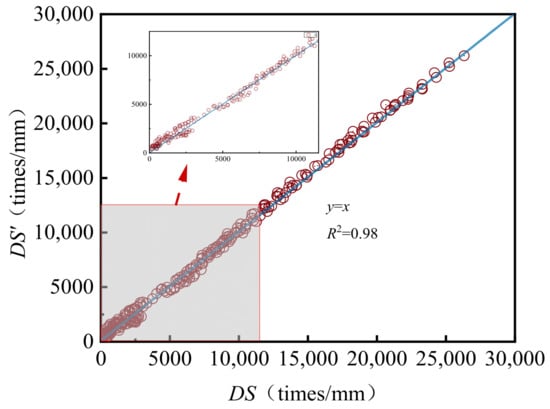
Figure 2.
The relationship between DS’ and DS.
As shown in Figure 2, the measured values and the predicted values of the dynamic stability are both close to the y = x line, and the correlation coefficient reaches 0.98, which proves that the fitting accuracy of the temperature dependence of the dynamic stability using Equation (1) is quite high.
The parameter T0, obtained from the Boltzmann function, serves not merely as a fitting constant but as a critical indicator of the thermal susceptibility of asphalt binders. From a physical perspective, T0 denotes the pivotal transition temperature at which the asphalt binder experiences a fundamental rheological transformation, shifting from a glassy or viscoelastic solid state to a predominantly viscous fluid state. This transition is inherently associated with the binder’s compositional and structural characteristics. The observed ascending sequence of T0 values (70# < 50# < 30# < SBS < HMB) corresponds directly to increasing stiffness and enhanced elastic recovery properties of the binders. Asphalt binders with lower penetration grades (e.g., 30#) and polymer modifications (such as the SBS and HMB) exhibit more resilient internal structures that effectively resist thermal degradation, thereby preserving sufficient stiffness to maintain aggregate interlock at elevated temperatures. Accordingly, a higher T0 value indicates an expanded service temperature range for the asphalt mixture prior to experiencing a critical decline in dynamic stability, thus providing a quantitative criterion for material selection in high-temperature environments.
5. Factors Affecting Rutting Depth in Asphalt Pavement Surface Layer Materials
5.1. The Progression Behavior of Rut Depth in Surface Layer Materials of Asphalt Pavements
Figure 3 and Figure 4 present the test results pertaining to the rut depth progression characteristics of various surface layer materials.
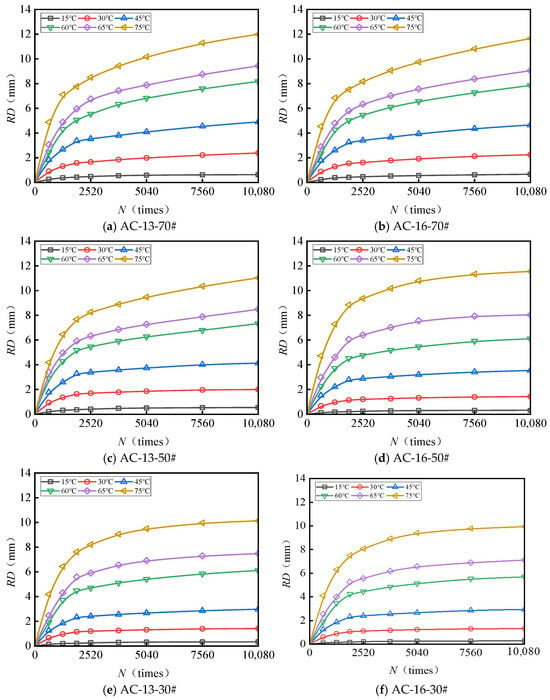
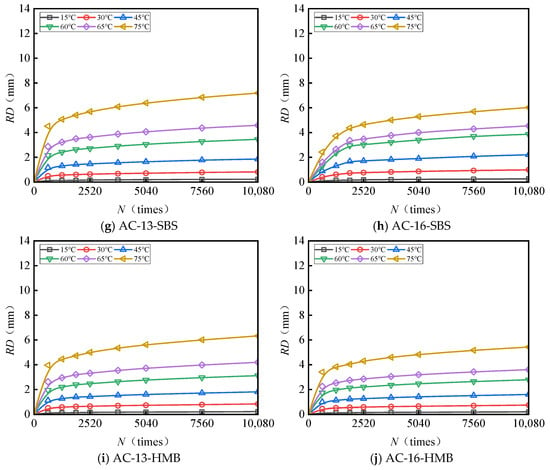
Figure 3.
Variations in the rutting behavior of AC-13 and AC-16 subjected to a load of 0.7 MPa.
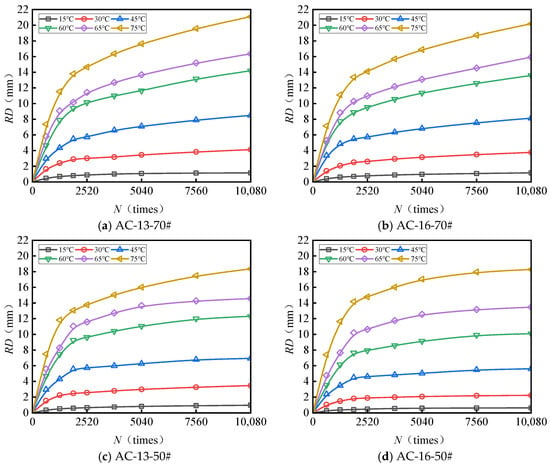
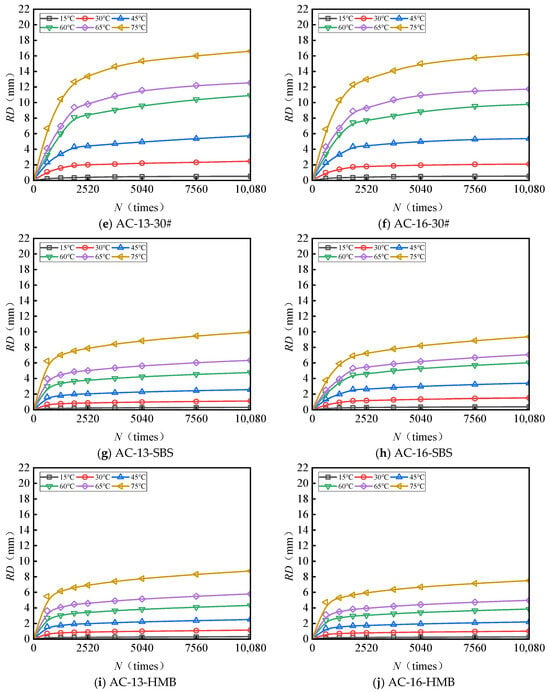
Figure 4.
Variations in the rutting behavior of AC-13 and AC-16 subjected to a load of 1.1 MPa.
Figure 3 and Figure 4 demonstrate that rut deformation escalates with increasing temperature (T), applied load (P), and the number of load cycles (N). Under consistent testing conditions, elevated temperatures significantly amplify rut depth. Likewise, higher applied loads correspond to a pronounced increase in rut depth, indicating that rut deformation is influenced by both temperature and load magnitude. The rut progression curve of the mixture reveals an initial phase characterized by rapid growth, followed by a subsequent stage of a more gradual and stable increase. After compaction to the standard density using a wheel roller, the mixture experiences additional compaction attributable to the rutting load. The rut deformation measured one hour prior to load application (equivalent to 42 × 60 = 2520 load cycles) is ascribed to compaction deformation. This suggests that before reaching 2520 load cycles, rut depth increases sharply, whereas beyond this threshold, rut deformation predominantly arises from shear deformation within the mixture.
5.2. Investigation into the Effect of Test Temperature on the Rutting Depth of Asphalt Pavement Surface Layer Materials
Figure 5 and Figure 6 illustrate the rutting deformation curves of AC-13 and AC-16 at various temperatures following 10,080 loading cycles applied at 0.7 MPa and 1.1 MPa. The observed deformation trends correspond closely to a power function. The experimental data were fitted and analyzed using Equation (2), yielding the fitting coefficients for temperature and rutting deformation, as presented in Table 9.
where RD is the predicted rutting deformation, mm; P is the load magnitude, MPa; and a and b are the fitting coefficients.
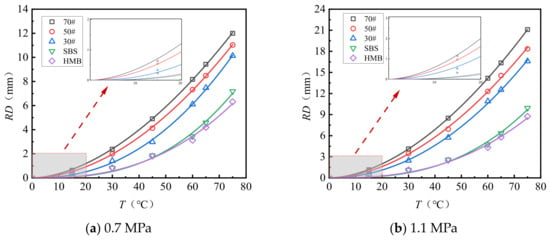
Figure 5.
Temperature versus rutting deformation: curve fitting analysis (AC-13).
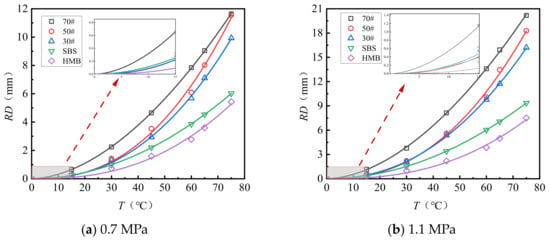
Figure 6.
Temperature versus rutting deformation: curve fitting analysis (AC-16).

Table 9.
Regression coefficients for the relationship between temperature and rut deformation.
As demonstrated in Figure 5 and Figure 6 and Table 9, the relationship between temperature and rutting deformation can be accurately modeled using a power function, with all fitting coefficients approaching 0.99. Under consistent gradation types and load magnitudes, this temperature–rutting relationship depends on the type of asphalt. The constant parameter “a” in the fitting equation shows an inverse correlation with the asphalt softening point, with values for 70# asphalt being 46 to 80 times greater than those for HMB asphalt. In contrast, the exponent “b” increases as the softening point rises, with HMB asphalt exhibiting values 1.4 to 1.5 times higher than those of 70# asphalt. Both parameters, “a” and “b”, significantly influence rutting behavior. At a test temperature of 90 °C under a load of 0.7 MPa, the predicted rut depth for 70# asphalt AC-13 is 29.2 mm, whereas HMB asphalt AC-13 demonstrates enhanced performance, with a predicted rut depth of only 16.3 mm, corresponding to 55.8% of the deformation observed in 70# asphalt.
5.3. An Investigation into the Impact of Load on the Rutting Depth of Asphalt Pavement Surface Layer Materials
Figure 7 and Figure 8 illustrate the rutting deformation curves of AC-13 and AC-16 following 10,080 load applications under varying load conditions. The observed deformation trends correspond closely to a power function. The experimental data were fitted and analyzed using Equation (2), yielding the fitting coefficients relating load to rutting deformation, which are presented in Table 10.
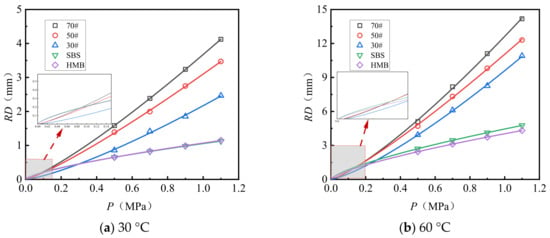
Figure 7.
Load versus rut deformation fitting curve (AC-13).
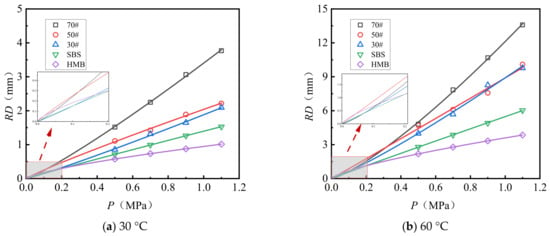
Figure 8.
Load versus rut deformation fitting curve (AC-16).

Table 10.
Coefficients of the regression model relating load to rut deformation.
Analysis of Figure 7 and Figure 8 and Table 10 reveals the following observations: (1) The relationship between load and rut deformation can be accurately modeled using an exponential function, with fitting coefficients consistently approximating 0.97. (2) Under conditions of identical gradation type and test temperature, the load–rut deformation relationship is influenced by the asphalt type. Specifically, both the constant parameter (a) and the exponent (b) in the fitting function decrease as the asphalt’s softening point increases. Notably, compared to HMB asphalt, the constant a for 70# asphalt is approximately 3.1 to 3.6 times greater, while the exponent b is about 1.6 to 1.8 times higher. Assuming a test load of 1.5 MPa, representing an overload condition, the predicted rut depths for 70# asphalt AC-13 at test temperatures of 30 °C and 60 °C are 6.0 mm and 21.1 mm, respectively. In contrast, the predicted rut depths for HMB asphalt AC-13 under the same conditions are 1.4 mm and 5.4 mm, corresponding to only 23.3% and 25.6% of the rut depths observed for 70# asphalt.
5.4. An Investigation into the Impact of the Frequency of Load Applications on the Rutting Depth of Asphalt Pavement Surface Layer Materials
At a testing temperature of 60 °C, the correlation between the number of loading cycles and the rut depth for the AC-13 and AC-16 mixtures under varying load conditions (0.7 MPa and 1.1 MPa) is illustrated in Figure 9 and Figure 10. The observed trends in the experimental data exhibit a pattern consistent with a power function. The results were subsequently fitted and analyzed using Equation (2), yielding the fitting coefficients related to load and rut deformation, which are presented in Table 11.
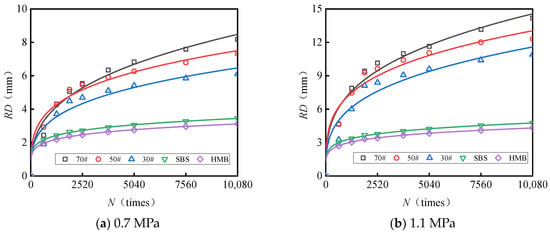
Figure 9.
Fitting curve depicting the relationship between the number of loads and rut deformation (AC-13).
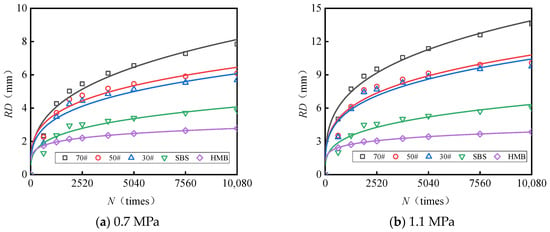
Figure 10.
Fitting curve depicting the relationship between the number of loads and rut deformation (AC-16).

Table 11.
Correlation coefficient between the number of actions and rutting deformation.
Analysis of Figure 9 and Figure 10 and Table 11 reveals the following observations: (1) The relationship between the number of load cycles and rutting deformation can be accurately modeled using a power function, with correlation coefficients exceeding 0.86 in all cases. (2) When both the gradation type and load magnitude are held constant, the relationship between load repetitions and rut deformation is significantly affected by the asphalt type. Specifically, the fitting parameter a increases as the asphalt softening point rises; for HMB asphalt, the parameter a is 1.1 to 1.9 times greater than that of #70 asphalt. Conversely, the exponent b decreases with an increasing asphalt softening point; the exponent b for #70 asphalt is 1.8 to 2.1 times higher than that for HMB asphalt. Under the conditions of one million load applications, a test temperature of 60 °C, and a load of 0.7 MPa, the predicted rut depth for the AC-13 mixture containing #70 asphalt is 41 mm, whereas for AC-13 with HMB asphalt, the predicted rut depth is 7 mm, representing only 17% of the rut depth observed with #70 asphalt.
The observed power-law correlation between rut depth and variables such as temperature, load magnitude, and number of load repetitions can be mechanistically attributed to the progressive deterioration of the internal structure of the asphalt mixture. At the initial stages, characterized by a low number of load cycles, the rapid increase in rut depth predominantly results from densification (compaction) and minor rearrangements within the aggregate skeleton. As loading persists, the dominant deformation mechanism transitions to shear flow. Elevated temperatures, by inducing binder softening, as previously described, substantially diminish the shear strength of the asphalt mastic. Simultaneously, increased vertical loads generate higher shear stresses within the pavement layer. When the combined effect of reduced shear strength and elevated shear stress surpasses a critical threshold, the aggregate skeleton becomes destabilized, leading to particle displacement and a loss of interlocking. This synergistic interaction accelerates irreversible shear deformation, which corresponds to the stable rutting growth phase. The markedly lower rut depths observed in mixtures incorporating high-softening-point binders, such as SBS and HMB, under comparable conditions highlight their superior capacity to preserve mastic stiffness and aggregate interlock, thereby effectively resisting shear flow-induced deformation.
6. Temperature-Dependent Model for Rutting Depth of Asphalt Pavement Surface Layer Materials
Based on the analysis of the test results, it is evident that temperature, load, and the number of load applications are the primary factors affecting the rutting depth of the mixture, with their relationship to rutting depth following a power function. Consequently, the rutting prediction model for the mixture is proposed in Equation (3).
where RD is the predicted rutting deformation, mm; P is the testing load magnitude, MPa; T is the testing temperature, °C; N is the loading number, times; and k0, kP, kT, and kN are regression coefficients.
Using Equation (3), the parameters of the rutting prediction model for the surface layer mixture were fitted, with the results shown in Table 12.

Table 12.
Fitting parameters of the rutting prediction model for surface layer mixtures.
The data indicate a strong fit between the model and Equation (3), with correlation coefficients exceeding 0.95. The coefficient kP, representing the load index, varies among asphalt mixture types from 0.727 to 1.222; mixtures with higher asphalt softening points tend to have lower kP values. The temperature index kT ranges from 1.926 to 2.177, with mixtures containing asphalt of higher softening points exhibiting slightly higher kT values. The coefficient kN, related to the number of load applications, ranges from 0.133 to 0.295. Higher values of kP, kT, and kN indicate weaker resistance to rutting. The load variation ranges from approximately 0.7 to 1.5 MPa, the temperature variation spans roughly 15 to 80 °C, and the action variation range is nearly infinite. The kT value is slightly higher than that of asphalt with a high softening point (N), but the kP value is considerably lower than that of asphalt with a low softening point. During the initial loading phase, kP and kT have a greater impact on rutting depth. However, as the number of loads increases, the influence of kN gradually becomes more significant, indicating that the rutting depth of the HMB asphalt mixture is notably lower than that of the 70# asphalt mixture in the later stages of loading.
The parameters of the unified rutting model (kP, kT, kN) provide significant insights into the rutting resistance of asphalt mixtures from both rheological and mechanical perspectives. A reduction in the load index (kP) with an increasing asphalt softening point is attributable to the enhanced stiffness and elasticity of the binder. Mixtures containing stiffer mastics, such as those with SBS and HMB modifiers, demonstrate a more linear elastic response under load, resulting in deformation that is less sensitive to increasing stress levels and thus yielding kP values closer to unity. Conversely, softer base asphalts tend to exhibit nonlinear plastic flow and shear deformation, which accelerates rutting progression under load and corresponds to kP values exceeding one. The temperature index (kT), which is the largest among the indices, clearly indicates that temperature is the predominant factor influencing rutting behavior. The magnitude of kT reflects the temperature sensitivity of the binder’s viscosity, with a slight increase observed in modified asphalts likely due to the greater temperature dependence of their complex modulus within the high-temperature range tested. Lastly, the action index (kN), which decreases as binder performance improves, quantifies the mixture’s resistance to the accumulation of plastic deformation under repeated loading. The low kN values observed in modified asphalts align with their enhanced elastic recovery, which mitigates the net accumulation of permanent strain per load cycle. Collectively, these indices characterize the material’s performance, where reductions in kP and kN indicate a transition from viscous–plastic to more favorable elastic–solid behavior, a transition directly attributable to the high-softening-point and polymer-modified binders.
The advancement of predictive models for rutting in asphalt mixtures has progressed through a series of distinct methodological frameworks. Zhu et al. [29] enhanced indoor rutting prediction by utilizing parameters derived from the dynamic modulus, thereby establishing significant correlations between wheel tracking tests and full-scale accelerated testing. Wang et al. [30] applied grey relational analysis to systematically assess the influence of testing conditions—such as load, temperature, air void content, and moisture—on rut depth measurements obtained from the Asphalt Pavement Analyzer, leading to the development of a tailored prediction model specific to this device. Ziari et al. [31] focused on fundamental constitutive properties by formulating a flow number-based predictive model that mathematically links mix design parameters and gyratory compaction slope to dynamic creep test outcomes. Deng et al. [32] adopted two mechanistic–empirical models that were rigorously calibrated and validated through integrated laboratory testing under moving loads and finite element simulations. Complementing these methodologies, Ji et al. [33] advanced our theoretical understanding by introducing a second-order modified Burgers rheological model for rutting prediction.
Compared to existing methodologies, the present study offers distinct advantages through the development of a unified constitutive framework. While prior models have contributed valuable insights within their specific contexts, they frequently demonstrate limitations in concurrently addressing the interrelated effects of temperature, load magnitude, and loading cycles. The model proposed herein effectively integrates these three critical factors into a single constitutive formulation, thereby overcoming the fragmentation characteristic of earlier approaches. Moreover, the incorporation of the Boltzmann function facilitates a more physically meaningful representation of the temperature-dependent behavior of dynamic stability, surpassing the descriptive capacity of traditional empirical fittings. Furthermore, although the model parameters have well-defined physical interpretations, their estimation relies on standardized laboratory tests, which may impose certain constraints on their applicability in engineering applications [34]. This integrated methodology not only improves predictive accuracy but also affords a clearer mechanistic understanding of rutting phenomena while preserving practical applicability through parameters that can be obtained via standard laboratory testing. Consequently, the framework constitutes a significant advancement in reconciling theoretical rigor with engineering practicality in the evaluation of asphalt mixture performance.
The practical implementation of the integrated rutting prediction model requires further enhancement. While the proposed framework demonstrates validity within controlled laboratory settings, its verification across a wider spectrum of field conditions remains insufficient, particularly concerning real-world factors such as environmental aging and moisture influences. Moreover, although the model parameters are founded on well-defined physical principles, their calibration predominantly depends on standardized laboratory testing procedures, which may limit their applicability in field scenarios. Notably, the exclusive reliance on the wheel tracking test—despite its standardization and direct relevance to rutting performance—restricts a comprehensive evaluation of the material’s full viscoelastic properties. Furthermore, the maximum experimental temperature of 75 °C does not encompass higher temperature extremes that may occur in severe climatic conditions, thereby limiting the model’s practical relevance.
7. Conclusions
This research, grounded in controlled indoor rutting experiments, examined the dynamic stability and key influencing factors of asphalt pavement surface layer materials. Furthermore, it proposed a temperature-dependent model to describe the high-temperature performance of these materials, alongside a predictive model for rutting behavior. The principal findings of this study are summarized as follows:
(1) The investigation into the impact of temperature on the dynamic stability of asphalt pavement surface layer materials revealed that dynamic stability diminishes with increasing temperature, following an S-shaped curve. Notably, the dynamic stability at 15 °C exceeds that at 75 °C by more than an order of magnitude. At lower temperatures, dynamic stability is more sensitive to variables such as applied load and nominal maximum particle size. Specifically, at 15 °C, an increase in load results in a significant decline in dynamic stability, whereas at 75 °C, mixtures with identical asphalt types and mineral aggregate gradations exhibit dynamic stability values that tend to plateau.
(2) A temperature-dependent dynamic stability model was developed utilizing the Boltzmann function, effectively capturing the relationship between dynamic stability and temperature. The observed decrease in dynamic stability with rising temperature follows a three-phase pattern characterized as “slow–fast–slow.” The transition temperatures identified for the dynamic stability models of 70#, 50#, 30#, SBS, and HMB asphalt mixtures are 39 °C, 44 °C, 46 °C, 56 °C, and 56 °C, respectively.
(3) This study further explored the determinants of rut depth in asphalt pavement surface layer materials and established a predictive model for rutting. The analysis demonstrated that rut deformation increases with temperature (T), applied load (P), and the number of load repetitions (N). By introducing indices for load (kP), temperature (kT), and load frequency (kN), rut prediction models were developed for asphalt surface layer mixtures under diverse operational conditions. These indices range from 0.727 to 1.222 for kP, 1.926 to 2.177 for kT, and 0.133 to 0.295 for kN. The models exhibit correlation coefficients exceeding 0.95, indicating a high level of accuracy and robustness in predicting rut depth in asphalt mixtures.
(4) The transition temperatures (e.g., 56 °C for SBS/HMB versus 39 °C for 70#) offer a clear, quantitative basis for selecting asphalt binders tailored to specific regional climate conditions. The rutting prediction model and its indices (kP, kT, kN) can be integrated into mechanistic–empirical pavement design methods to forecast rutting depth under various combinations of traffic load and temperature. This integration aids in optimizing pavement layer thickness and planning long-term maintenance schedules.
Future work will systematically address the current limitations through three primary avenues. Firstly, dynamic modulus testing and repeated creep testing will be utilized to thoroughly characterize the full viscoelastic properties of asphalt mixtures, thereby providing a more comprehensive understanding beyond the findings obtained from the existing wheel tracking tests. Secondly, extended monitoring of pavement performance will provide a dependable field validation dataset to support subsequent model verification. Thirdly, temperature-controlled testing protocols will be extended to 80 °C and higher in order to directly assess the performance of mixtures under extreme thermal conditions.
Author Contributions
Conceptualization, J.Y. and Y.J.; methodology, G.L. and Y.J.; validation, J.Y.; formal analysis, J.Y.; investigation, Y.C., Y.W. and S.Z.; resources, J.Y.; data curation, J.Y. and G.L.; writing—original draft preparation, J.Y., G.L., Y.C., Y.W. and S.Z.; writing—review and editing, J.Y., Z.Y. and Y.J.; visualization, Z.Y., S.Z. and Y.J.; supervision, Y.C. and Y.J.; project administration, J.Y., G.L. and Y.J.; funding acquisition, J.Y. All authors have read and agreed to the published version of the manuscript.
Funding
This study was sponsored in part by the Shaanxi Province Innovation Ability Support Plan Project, under grant 2022TD-06, the Key Science and Technology Projects in Transportation Industry, under grant 2021-MS1-011, and the Fundamental Research Funds for the Central Universities, under grant 300102213401.
Institutional Review Board Statement
Not applicable.
Informed Consent Statement
Not applicable.
Data Availability Statement
The original contributions presented in this study are included in this article. Further inquiries can be directed to the corresponding author.
Conflicts of Interest
Jincai Yang was employed by the company Nanyang Communications Construction Investment Group Co., Ltd. Guanqing Li and Yantao Chen were employed by the company Nanyang Fangzao Highway Co., Ltd. The remaining authors declare that this research was conducted in the absence of any commercial or financial relationships that could be construed as a potential conflict of interest.
References
- Zhao, R.; Luo, Y.L.; Ouyang, J.; Wang, J.J. Global temperature change: New trend prediction and analysis of influencing factors. Environ. Eng. Manag. J. 2024, 23, 157–167. [Google Scholar] [CrossRef]
- Shen, P. Method for extracting temperature distribution characteristics of municipal asphalt pavement construction in high-temperature weather under compaction quality constraint. Int. J. Pavement Eng. 2024, 25, 2356758. [Google Scholar] [CrossRef]
- Gong, Z.; Zhang, L.; Wu, J.; Xiu, Z.; Wang, L.; Miao, Y. Review of regulation techniques of asphalt pavement high temperature for climate change adaptation. J. Infrastruct. Preserv. Resil. 2022, 3, 9. [Google Scholar] [CrossRef]
- Liu, T.; Yang, S.; Zhu, L.; Liao, B.; Zhang, Q. Influence of climate change on asphalt binder selection in China. Int. J. Pavement Eng. 2023, 24, 2252145. [Google Scholar] [CrossRef]
- Chen, X.; Wang, H. Impact of warming temperature on asphalt pavement overlay performance and cost: Case study in New Jersey. Road Mater. Pavement Des. 2021, 23, 2886–2899. [Google Scholar] [CrossRef]
- Du, Y.; Chen, J.; Han, Z.; Liu, W. A review on solutions for improving rutting resistance of asphalt pavement and test methods. Constr. Build. Mater. 2018, 168, 893–905. [Google Scholar] [CrossRef]
- Riyad, R.H.; Jaiswal, R.; Muhit, I.B.; Shen, J. Optimizing modified asphalt binder performance at high and intermediate temperatures using experimental and machine learning approaches. Constr. Build. Mater. 2024, 449, 138350. [Google Scholar] [CrossRef]
- Hamdi, A. Effect of temperature on service life of flexible pavement using finite element analysis. Geomech. Eng. 2023, 32, 513–521. [Google Scholar]
- Rajapaksha, M.C.; Athukorallage, B.; Senadheera, S.; James, D. Temporal and spatial temperature predictions for flexible pavement layers using numerical thermal analysis and verified with large datasets. Case Stud. Constr. Mater. 2023, 18, e02008. [Google Scholar] [CrossRef]
- Luan, Y.; Ma, Y.; Ma, T.; Wang, C.; Xia, F. Research on the effects of asphalt performance on rutting resistance and its correlation with rutting performance indicators. Constr. Build. Mater. 2023, 400, 132773. [Google Scholar] [CrossRef]
- Tan, Y.; Jiang, Y.; Bai, C.; Zhang, H.; Liang, Y.; Lou, W.; Chen, Z. Rutting behavior of dual-layer asphalt pavements subjected to variable temperature. Materials 2025, 18, 2603. [Google Scholar] [CrossRef]
- Pan, Y.; Guo, H.; Guan, W.; Zhao, Y. A laboratory evaluation of factors affecting rutting resistance of asphalt mixtures using wheel tracking test. Case Stud. Constr. Mater. 2023, 18, e02148. [Google Scholar] [CrossRef]
- Radhakrishnan, V.; Ramya Sri, M.; Sudhakar Reddy, K. Evaluation of asphalt binder rutting parameters. Constr. Build. Mater. 2018, 173, 298–307. [Google Scholar] [CrossRef]
- Li, H.; Wang, H.; Lin, J.; Yang, J.; Yao, Y. Study on the effect of SBS/HVA/CRM composite-modified asphalt on the performance of recycled asphalt mixtures. Polymers 2024, 16, 3226. [Google Scholar] [CrossRef]
- Huang, G.; Zhang, J.; Hui, B.; Zhang, H.; Guan, Y.; Guo, F.; Li, Y.; He, Y.; Wang, D. Analysis of modulus properties of high-modulus asphalt mixture and its new evaluation index of rutting resistance. Sustainability 2023, 15, 7574. [Google Scholar] [CrossRef]
- Hao, Y.; Ye, Y.; Zhuang, C.; Hou, F. Research on High-Temperature Evaluation indexes and performance of qingchuan rock-sbs composite modified asphalt. Materials 2022, 15, 7455. [Google Scholar] [CrossRef]
- Li, P.; Ding, Z.; Rao, W. Evaluation of deformation properties of asphalt mixture using aggregate slip test. Int. J. Pavement Eng. 2015, 17, 542–549. [Google Scholar] [CrossRef]
- Mu, Y.; Fu, Z.; Liu, J.; Li, C.; Dong, W.; Dai, J. Evaluation of high-temperature performance of asphalt mixtures based on climatic conditions. Coatings 2020, 10, 535. [Google Scholar] [CrossRef]
- Shang, K.; Wan, C.; Guo, M.; Zhou, C.; Jiang, Y.; Ren, J. Temperature-dependent model of rutting behavior for connected layer mixtures in flexible base asphalt pavement. Materials 2025, 18, 808. [Google Scholar] [CrossRef] [PubMed]
- Javilla, B.; Mo, L.; Hao, F.; Shu, B.; Wu, S. Multi-stress loading effect on rutting performance of asphalt mixtures based on wheel tracking testing. Constr. Build. Mater. 2017, 148, 1–9. [Google Scholar] [CrossRef]
- Sun, Y.; Gu, B.; Gao, L.; Li, L.; Guo, R.; Yue, Q.; Wang, J. Viscoelastic mechanical responses of hmap under moving load. Materials 2018, 11, 2490. [Google Scholar] [CrossRef] [PubMed]
- Xu, S.; Ruan, P.; Lu, Z.; Liang, L.; Han, B.; Hong, B. Effects of the high temperature and heavy load on the rutting resistance of cold-mix emulsified asphalt mixture. Constr. Build. Mater. 2021, 298, 123831. [Google Scholar] [CrossRef]
- Li, N.; Zhan, H.; Yu, X.; Tang, W.; Yu, H.; Dong, F. Research on the high temperature performance of asphalt pavement based on field cores with different rutting development levels. Mater. Struct. 2021, 54, 70. [Google Scholar] [CrossRef]
- Guo, R.; Nian, T.; Zhou, F. Analysis of factors that influence anti-rutting performance of asphalt pavement. Constr. Build. Mater. 2020, 254, 119237. [Google Scholar] [CrossRef]
- Zhang, C.; Tan, Y.; Gao, Y.; Fu, Y.; Li, J.; Li, S.; Zhou, X. Resilience assessment of asphalt pavement rutting under climate change. Transp. Res. Part D Transp. Environ. 2022, 109, 103395. [Google Scholar] [CrossRef]
- Zhao, K.; Meng, D.; Wang, D. Investigation of rutting performance of asphalt mixture and pavements based on mesostructured finite element simulation. Int. J. Pavement Eng. 2024, 25, 2364295. [Google Scholar] [CrossRef]
- Huang, Y.; Liu, J.; Yang, X.; Liu, Z. Characterization of permanent deformation of asphalt pavement with rigid base. Constr. Build. Mater. 2025, 460, 139808. [Google Scholar] [CrossRef]
- JTG E20-2011; Standard Test Methods of Bitumen and Bituminous Mixtures for Highway Engineering. Ministry of Transport of the People’s Republic of China: Beijing, China, 2011.
- Zhu, J.W.; Sun, L.J.; Wang, Y.; Li, H.; Liu, L.P. Development and calibration of shear-based rutting model for asphalt concrete layers. Int. J. Pavement Eng. 2017, 18, 937–944. [Google Scholar] [CrossRef]
- Wang, H.; Tan, H.Q.; Qu, T.; Zhang, J.P. Effects of Test Conditions on APA Rutting and Prediction Modeling for Asphalt Mixtures. Adv. Mater. Sci. Eng. 2017, 2017, 2062758. [Google Scholar] [CrossRef]
- Ziari, H.; Divandari, H. Presenting asphalt mixtures flow number prediction model using gyratory curves. Int. J. Civ. Eng. 2013, 11, 125–133. [Google Scholar]
- Deng, Y.; Zhang, Y.; Shi, X.J.; Hou, S.G.; Lytton, R.L. Stress-strain dependent rutting prediction models for multi-layer structures of asphalt mixtures. Int. J. Pavement Eng. 2022, 23, 2728–2745. [Google Scholar] [CrossRef]
- Ji, J.; Chen, M.; Suo, Z.; Wei, J.M.; Wang, J.N.; Chen, L. Rutting Prediction Model of Asphalt Mixture Based on the Triaxial Repeated Load Test. Adv. Civ. Eng. 2021, 2021, 5238680. [Google Scholar] [CrossRef]
- Jin, D.Z.; Mohammadi, S.; Xin, K.; Yin, L.; You, Z.P. Laboratory performance and field demonstration of asphalt overlay with recycled rubber and tire fabric fiber. Constr. Build. Mater. 2024, 438, 136941. [Google Scholar] [CrossRef]
Disclaimer/Publisher’s Note: The statements, opinions and data contained in all publications are solely those of the individual author(s) and contributor(s) and not of MDPI and/or the editor(s). MDPI and/or the editor(s) disclaim responsibility for any injury to people or property resulting from any ideas, methods, instructions or products referred to in the content. |
© 2025 by the authors. Licensee MDPI, Basel, Switzerland. This article is an open access article distributed under the terms and conditions of the Creative Commons Attribution (CC BY) license (https://creativecommons.org/licenses/by/4.0/).