Article

Greenhouse Gas and CO2-Equivalent Emissions Analysis of SI Engine Fueled by Hydrogen-Enriched Compressed Natural Gas (HCNG)

1
School of Vehicle and Mobility, National Key Laboratory of Intelligent Green Vehicles and Transportation, Tsinghua University, Beijing 100084, China
2
Institute of Dual Carbon Industry, Shanxi University of Finance and Economics, Taiyuan 030006, China
3
Beijing Hydrogen Energy Technology Co., Ltd., Beijing 100084, China
4
Zhongyuan Electric Laboratory, Xuchang 461111, China
*
Authors to whom correspondence should be addressed.
Energies 2026, 19(9), 2131; https://doi.org/10.3390/en19092131
Submission received: 10 February 2026 / Revised: 4 March 2026 / Accepted: 16 March 2026 / Published: 29 April 2026
(This article belongs to the Special Issue Advancements in Hydrogen Energy for Combustion Engine Applications)

Abstract

Internal combustion engines fueled by fossil fuels are major contributors to greenhouse gas (GHG) emissions. This study analyzes and predicts GHG emissions from hydrogen-enriched compressed natural gas (HCNG)-fueled spark-ignition (SI) engines. Experiments were conducted under stoichiometric conditions, and emissions before and after the three-way catalytic converter (TWC) were analyzed by varying hydrogen fraction (0–50%), EGR ratio (0–23%), engine speed (900 rpm–1500 rpm), engine load (25–75%), and spark timing (8–49 °CA bTDC). Before the TWC, increasing the hydrogen fraction from HCNG0% to HCNG40% at 1500 rpm, 50% load, and 23% EGR reduced total GHG emissions from 184.3 to 65.17 g/kWh. Similarly, for HCNG20% at 900 rpm and 30% load, the TWC reduced the CO2-equivalent emissions of CO, CH4, and NOx from 18.531, 8.149, and 9.057 g C O 2 e q /kWh to 7.013, 1.626, and 0.429 g C O 2 e q /kWh, respectively. Pearson correlation analysis revealed strong linear relationships between operating parameters and GHG emissions. Furthermore, emissions were predicted using four Gaussian process regression (GPR) models: Squared, Exponential, Matern 5/2, and Rational. Among these, the Exponential GPR demonstrated the highest predictive accuracy, achieving RMSE values of 0.098, 0.022, and 0.035, with corresponding R2 values of 0.999, 0.807, and 0.996 for CO, CH4, and NOx, respectively. The findings of this study offer valuable insights into GHG emissions and support the development of cleaner, more efficient HCNG engines.

1. Introduction

The rapid growth of global vehicle usage has significantly increased fossil fuel consumption, particularly gasoline and diesel, due to their high energy density and economic viability. However, large-scale combustion of these fuels generates substantial greenhouse gas (GHG) emissions and harmful air pollutants, contributing to environmental degradation, stricter emission regulations, and serious risks to public health [1]. Globally, energy production accounts for approximately 73.2% of total GHG emissions, with the transportation sector responsible for 16.2% of that share. Specifically, road transport contributes 11.9% of global emissions, rising to 19.4% in the European context [2]. Major pollutants from automobile exhaust include carbon monoxide (CO), carbon dioxide (CO2), methane (CH4), and nitrogen oxides (NOx) [3], all of which contribute to the greenhouse effect and pose significant health hazards [4]. These concerns highlight the urgent need for cleaner combustion strategies and alternative fuels that can reduce both GHG emissions and regulated pollutants from road transport systems.
Among GHGs and air pollutants, CO2 and CH4 are classified as direct GHGs due to their substantial heat-trapping potential [5]. In contrast, CO and NOx act as indirect climate forcers, influencing atmospheric chemistry by altering the concentrations and lifetimes of more potent GHGs such as tropospheric ozone and methane. CO reacts with hydroxyl (OH) radicals, reducing the atmosphere’s oxidative capacity and promoting ozone formation, particularly in NOx-rich environments [6]. Similarly, NOx emissions, which consist of nitric oxide (NO) and nitrogen dioxide (NO2), contribute to ozone formation and photochemical smog, especially in the presence of higher hydrocarbons [7,8]. To evaluate both direct and indirect climate impacts, emissions are commonly expressed as CO2-equivalent ( C O 2 e q ) using the global warming potential (GWP) metric. Over a 100-year horizon, CH4 and N2O exhibit warming potentials 27.9 and 273 times greater than CO2, respectively [9,10]. However, GWP has recognized limitations for short-lived and reactive species, such as NOx, whose indirect climate effects depend on emission source, location, atmospheric conditions, and time horizon [11,12,13,14]. Accordingly, C O 2 e q provides a more comprehensive representation of the overall climate impact of engine exhaust emissions.
To comply with increasingly stringent emission regulations, three main strategies are employed: the use of advanced fuels, in-cylinder purification, and exhaust after-treatment, often supported by engine modifications and fuel property optimization [15,16]. Among advanced fuels, hydrogen-enriched compressed natural gas (HCNG) offers notable environmental benefits, including lower GHG emissions, renewability, and compatibility with existing engines [17]. However, hydrogen-fueled engines may emit slightly higher levels of NOx compared to conventional fossil fuels [18]. To further mitigate NOx emissions, particularly during engine cold starts when emissions are most pronounced, researchers have explored strategies such as reducing the excess air ratio (λ) and delaying injection timing [19,20]. Exhaust Gas Recirculation (EGR) also remains highly effective in reducing NOx formation, offering the added benefit of lowering throttling losses in spark-ignition engines, which contributes to cost and efficiency optimization [21]. Although EGR is effective in reducing NOx emissions, excessive rates can negatively affect engine performance [22]. To comply with emission regulations, after-treatment technologies such as DPF, SCR, and especially TWC are widely employed. These systems can reduce exhaust emissions by up to 90%, with TWC playing a crucial role in achieving regulatory NOx limits [23,24,25]. Accordingly, integrating HCNG combustion with optimized EGR and effective after-treatment systems represents a promising approach for achieving future emission targets without major engine redesign.
Hydrogen is increasingly recognized as a key transitional fuel for reducing GHG emissions from the transportation sector due to its carbon-free combustion properties. In line with this transition, future regulations such as EURO VII aim to tighten limits on NOx and CO2 emissions, targeting reductions of 15% by 2025 and 37.5% by 2030 relative to 2021 levels [26]. Several investigations have also highlighted the trade-off between reduced CO2/HC emissions and increased NOx under hydrogen-enriched operation [27,28,29,30,31,32,33]. In parallel, advanced modeling and machine learning approaches have been widely applied for predicting engine performance and emissions under varying operating conditions. Models such as support vector machines (SVM) and Gaussian process regression (GPR) have demonstrated high prediction accuracy for NOx, fuel consumption, and combustion stability in HCNG-fueled engines [34,35,36,37,38]. Nevertheless, despite the extensive progress in combustion improvement and emission prediction techniques, the combined assessment of GHG emissions and C O 2 e q impacts under realistic HCNG operating conditions remains insufficiently addressed.
Based on the reviewed literature, while many studies have explored alternative fuels and emission control strategies, no study has comprehensively evaluated GHG emissions and C O 2 e q climate impacts from HCNG engines across a wide range of operating conditions. Therefore, the primary objective of this study is to bridge this knowledge gap by quantifying the direct and indirect climate impacts of HCNG combustion through a C O 2 e q framework. Specifically, this work addresses three key limitations in the current state of knowledge: (1) the lack of comprehensive C O 2 e q -based assessment of HCNG emissions, (2) the limited understanding of the combined influence of hydrogen fraction, EGR, engine load, speed, and spark timing on GHG emissions, and (3) the absence of predictive models integrating engine-out emissions with and without a TWC under realistic conditions. To achieve this, HCNG blends (0–50%) were systematically investigated at varying engine speeds (900–1500 rpm), loads (25–75%), and EGR ratios (0–23%), with emissions measured before and after TWC. Gaussian Process Regression (GPR) models were utilized to predict CO, CH4, and NOx emissions, while the Pearson correlation coefficient quantified relationships between engine parameters and emissions. From a practical application perspective, the results of this study provide a calibration framework for engine manufacturers to optimize HCNG strategies for compliance with emission standards. Furthermore, the developed predictive models offer a tool for reducing development time and cost by simulating emission trade-offs without extensive physical testing, ultimately supporting the deployment of cleaner, more efficient heavy-duty engines aligned with global decarbonization targets.

2. Methodology

2.1. Experimental Setup

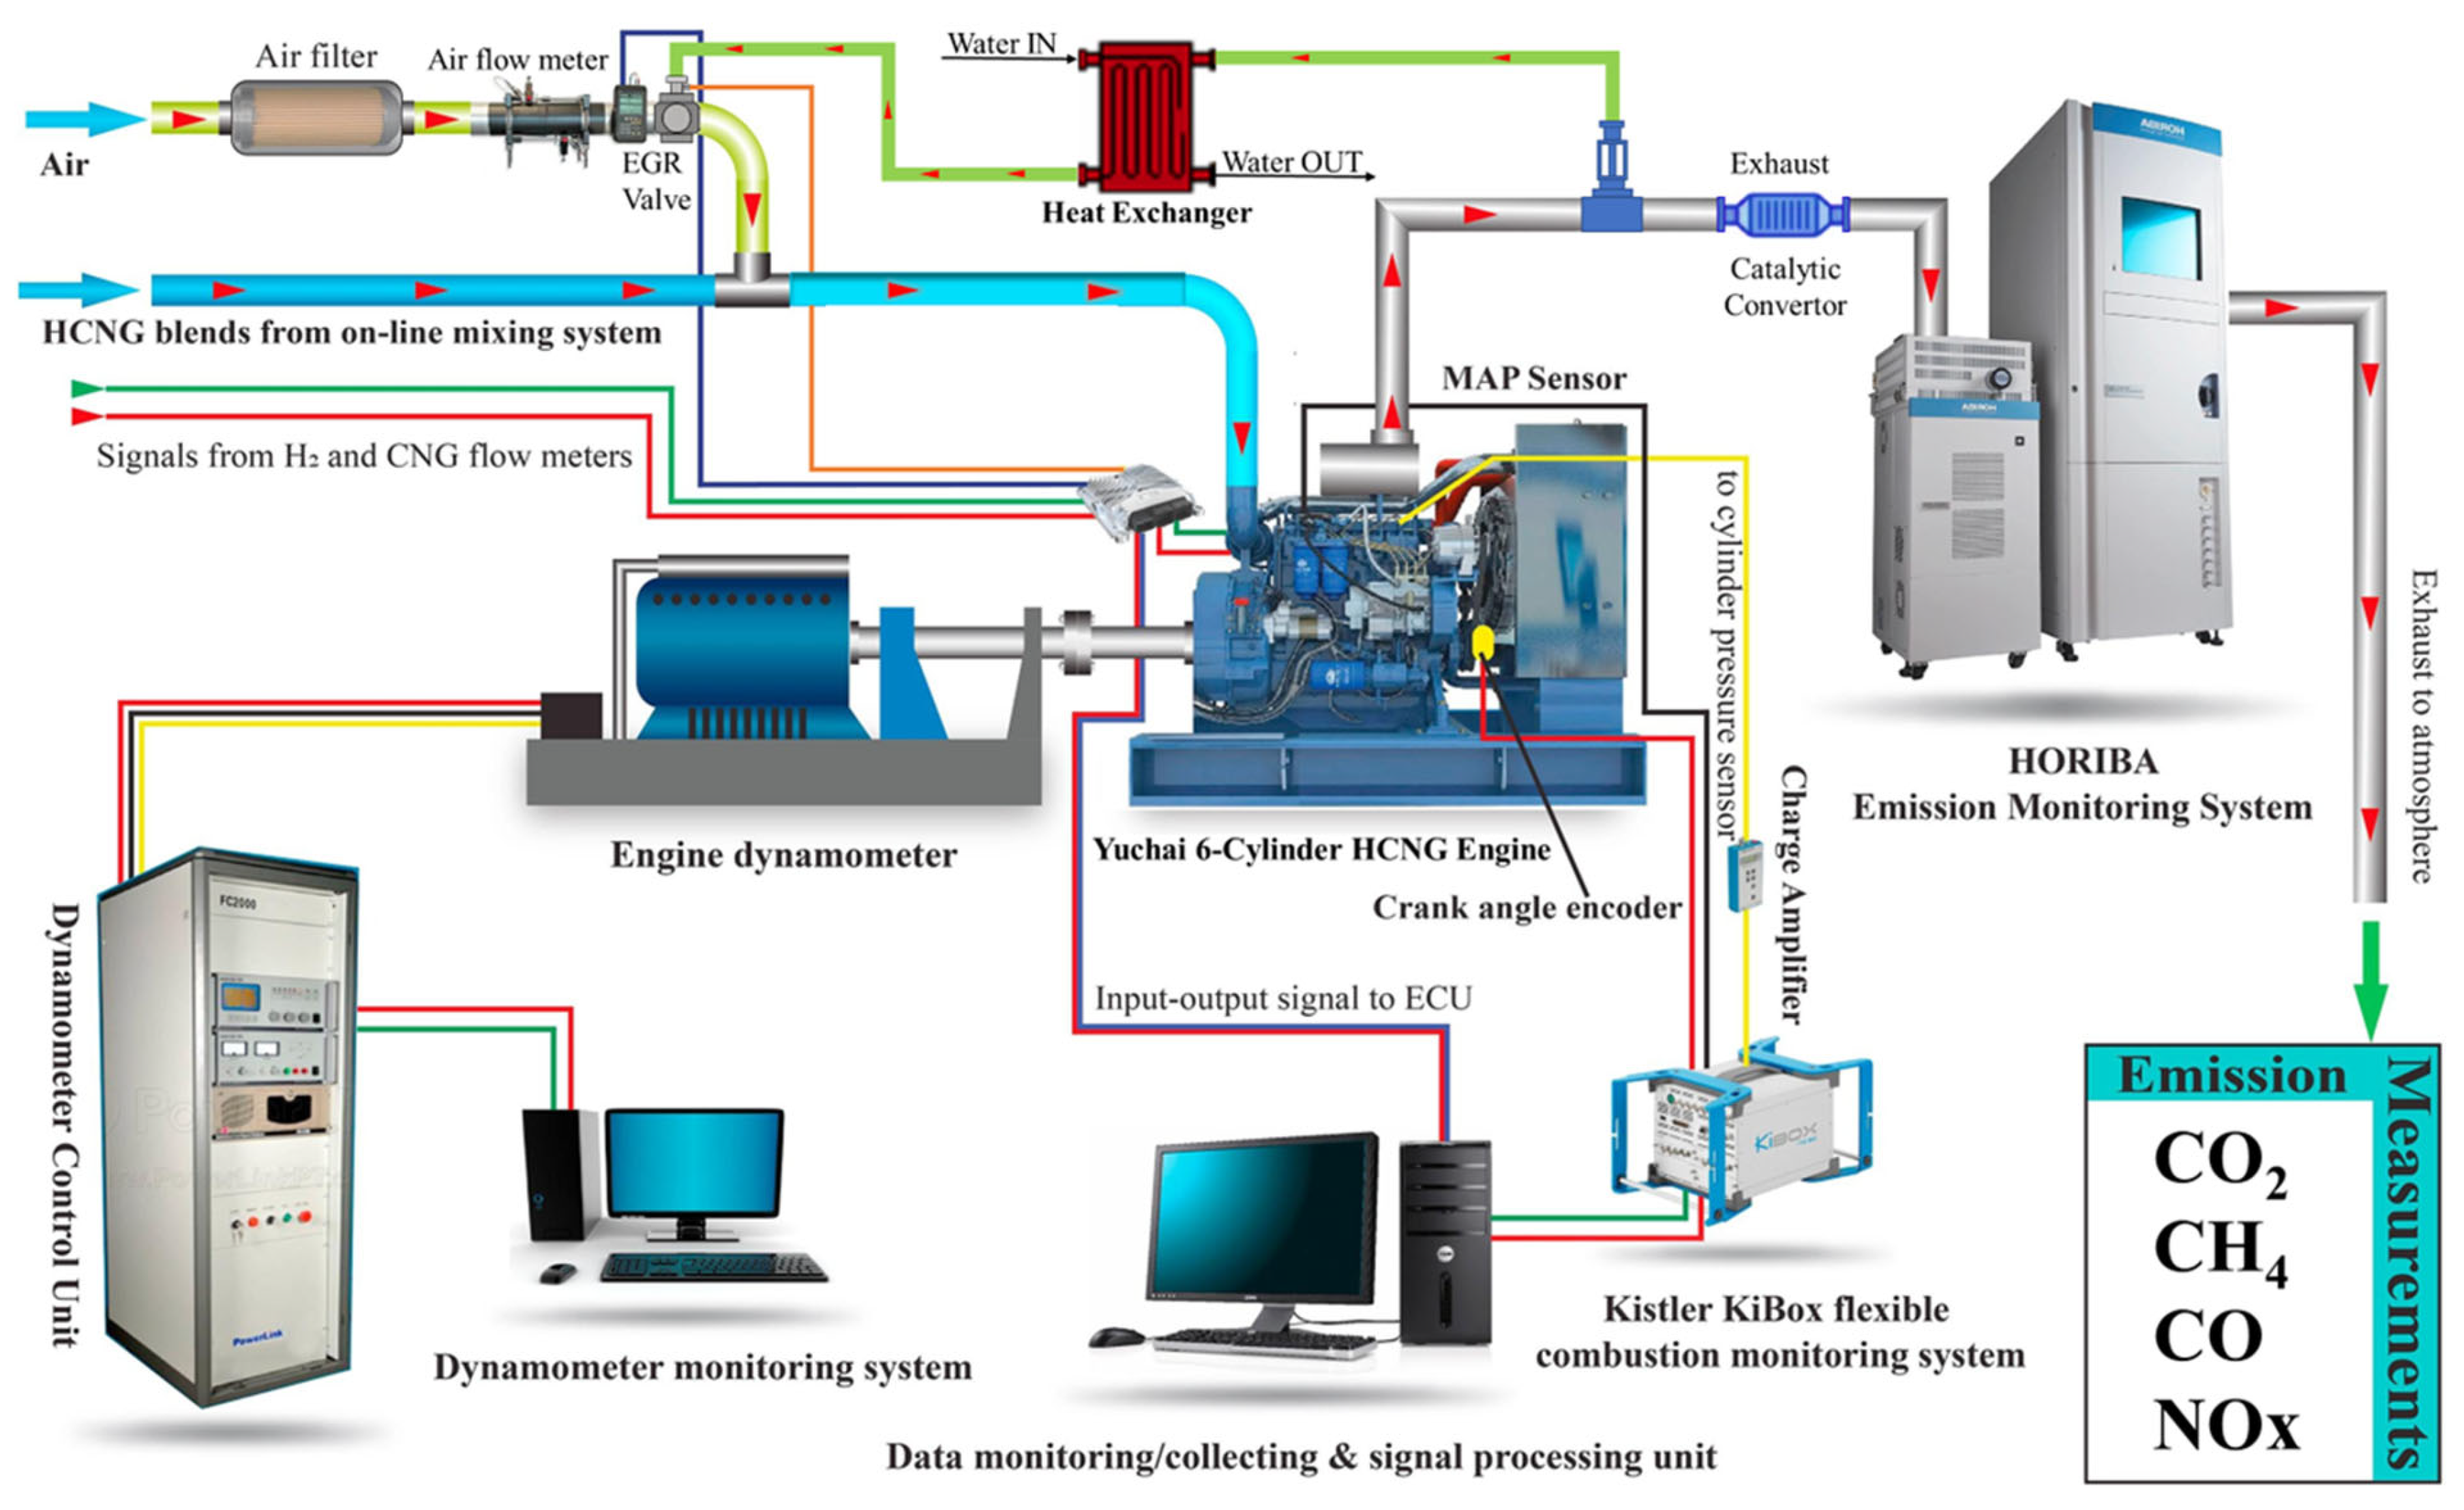
The experimental investigations were conducted on a YCK11360N-60 heavy-duty six-cylinder spark-ignition (SI) engine (Guangxi Yuchai Machinery Co., Ltd., Yulin, China) coupled with an eddy current dynamometer. A Kistler 2613B crank angle encoder (Kistler, Winterthur, Switzerland) was used to precisely monitor the crankshaft position (sensitivity 0.1–6, operating speed range 1–2 × 10⁴ rpm). A Kistler 6117 N piezoelectric pressure transducer (Kistler, Winterthur, Switzerland) was used to record in-cylinder pressure over 101 cycles (measurement range 0–20 MPa, sensitivity −16.8 pC/bar, and resolution 0.1 °CA). Exhaust emissions were analyzed using a HORIBA MEXA-7100 analyzer (HORIBA Ltd., Kyoto, Japan). To regulate exhaust gas recirculation, a Mitsubishi EGR valve (Mitsubishi Electric, Tokyo, Japan) was employed, while a water-to-air heat exchanger was incorporated to reduce exhaust gas temperature prior to recirculation. A patented dual-fuel supply system (China Patent No. ZL00710175797.9) enabled accurate online blending of hydrogen with compressed natural gas, with hydrogen flow controlled by an ALICAT valve (Alicat Scientific, Tucson, AZ, USA) (capacity 0.5 (S) CCM–1500 (S) LPM, accuracy ±0.4% at a 98.5% confidence level). Fuel flow rates were measured using a Coriolis-based Micro Motion mass flow meter (Micro Motion, Emerson, Boulder, CO, USA), whereas intake air flow was quantified with a Toceil 20N100114LI thermal flow meter (Toceil, China) (operating range 0–1000 Nm3/h, accuracy ±1%). The complete schematic of the experimental facility is presented in Figure 1. The technical specifications of the YCK11360N-60 engine are presented in Table 1, whereas the operating parameters adopted in this study (Table 2 and Table 3) were selected according to the engine’s functional limits and manufacturer-recommended operating window. These constraints were used to develop a design of experiments (DOE), ensuring that all test conditions remained within the actual operating range of the SI engine.
Permissible hydrogen concentration limits (0–50%) were defined based on material and design constraints of CNG engines reported in the literature. Studies indicate that conventional CNG engine configurations employing ferritic steels and standard elastomeric seals are generally restricted to hydrogen contents below 20% by volume to prevent hydrogen embrittlement and permeation under typical operating pressures. Higher concentrations, up to approximately 30% H2, are permissible only when engines incorporate material upgrades such as austenitic stainless-steel components, hydrogen-resistant injectors, and fluoropolymer seals. This material-dependent framework, established in prior studies, was therefore used to justify the allowable HCNG blend ranges adopted in this investigation [39,40,41].

2.2. Machine Learning Approach

Engine emissions were predicted using MATLAB R2023b with multiple regression techniques implemented through the Regression Learner App (RLA). Gaussian Process Regression was applied through the RLA to predict the emissions. The input features included engine speed, load, EGR ratio, HCNG blending ratio, and spark timing to ensure effective emission prediction.

2.2.1. Gaussian Process Regression (GPR)

Gaussian Process Regression is a non-parametric, kernel-based approach for modeling complex datasets. The training dataset is defined as x i , y i ; i = 1,2 , … , n ,   w h e r e   x i ∈ R 5   r e p r e s e n t s   t h e   i n p u t   v e c t o r   a n d   y i ∈ R is the corresponding output. The GPR model is expressed as
y = x T β + ∈
where β is the regression coefficient vector and ∈ denotes Gaussian noise. The covariance matrix K   ( X , X ) is constructed using the kernel function k   ( x i , x j ) :
        k X , X = k ( x 1 , x 1 ) … k ( x 1 , x n ) ⋮ ⋱ ⋮ k ( x n , x 1 ) … k ( x n , x n )
Squared Exponential GPR
The squared exponential kernel is a smooth radial basis function commonly used in GPR:
k   ( x i , x j θ )   =   σ f 2 e x p − 1 2 ( x i − x j ) T   ( x i − x j ) σ l 2
It assumes infinitely differentiable functions and performs well for modeling smooth variations.
Matern 5/2 GPR
The Matern 5/2 kernel provides controlled smoothness:
k   ( x i , x j )   =   σ f 2 1 +   5 r σ l +   5 r 2 3 σ l 2 e x p −   5 r σ l
It is less smooth than the squared exponential kernel and is suitable for modeling moderately rough functions.
Exponential GPR
The exponential kernel corresponds to the Matern family with v = 1/2:
k   ( x i , x j θ )   =   σ f 2 e x p −   r σ l
It produces continuous but non-differentiable functions, allowing flexibility for irregular variations.
Rational Quadratic GPR
The rational quadratic kernel can be interpreted as a scale mixture of squared exponential kernels with different length scales:
k   x i , x j θ =   σ f 2 1   +   r 2 2 α σ l 2   − α
It is particularly effective for datasets exhibiting multi-scale variability.
In this study, x i   a n d   x j denote input vectors, and r = x i − x j T ( x i − x j ) represents the Euclidean distance between these points. The characteristic length scale is denoted by σ l , while σ f corresponds to the signal standard deviation. For the rational quadratic kernel, α is a positive shape parameter that controls the relative weighting of different length scales [42].

2.3. Pearson Correlation Coefficient (PCC)

The Pearson correlation coefficient was employed to evaluate the linear relationship between input variables and emissions across the operating conditions listed in Table 3. Its value ranges from −1 to 1, where a coefficient of 1 represents a perfect positive linear correlation, 0 denotes the absence of any linear relationship, and −1 indicates a perfect negative linear correlation. The sign of the coefficient is determined by the slope of the regression line: a positive slope reflects a direct relationship, whereas a negative slope reflects an inverse relationship between the variables [43].
P C C = C o v a r i e n c e   ( x ,   y ) σ x σ y
In this formula, Covariance (x, y) represents the covariance between the input and output variables, while σ x and σ y denote the standard deviations of the input and output variables, respectively.

3. Results and Discussions

This study is divided into two main parts: the first analyzes GHG emissions under a wide range of operating conditions (Table 2 and Table 3), and the second predicts GHG emissions using GPR (Table 4) while evaluating relationships via the Pearson correlation coefficient (PCC) (Table 5). By combining experimental analysis with machine learning predictions, this research aims to enhance GHG emissions control in HCNG-fueled engines and contribute to the development of cleaner, more efficient heavy-duty engines.

3.1. GHG Emissions Before Catalytic Converter

3.1.1. CH4 Emissions

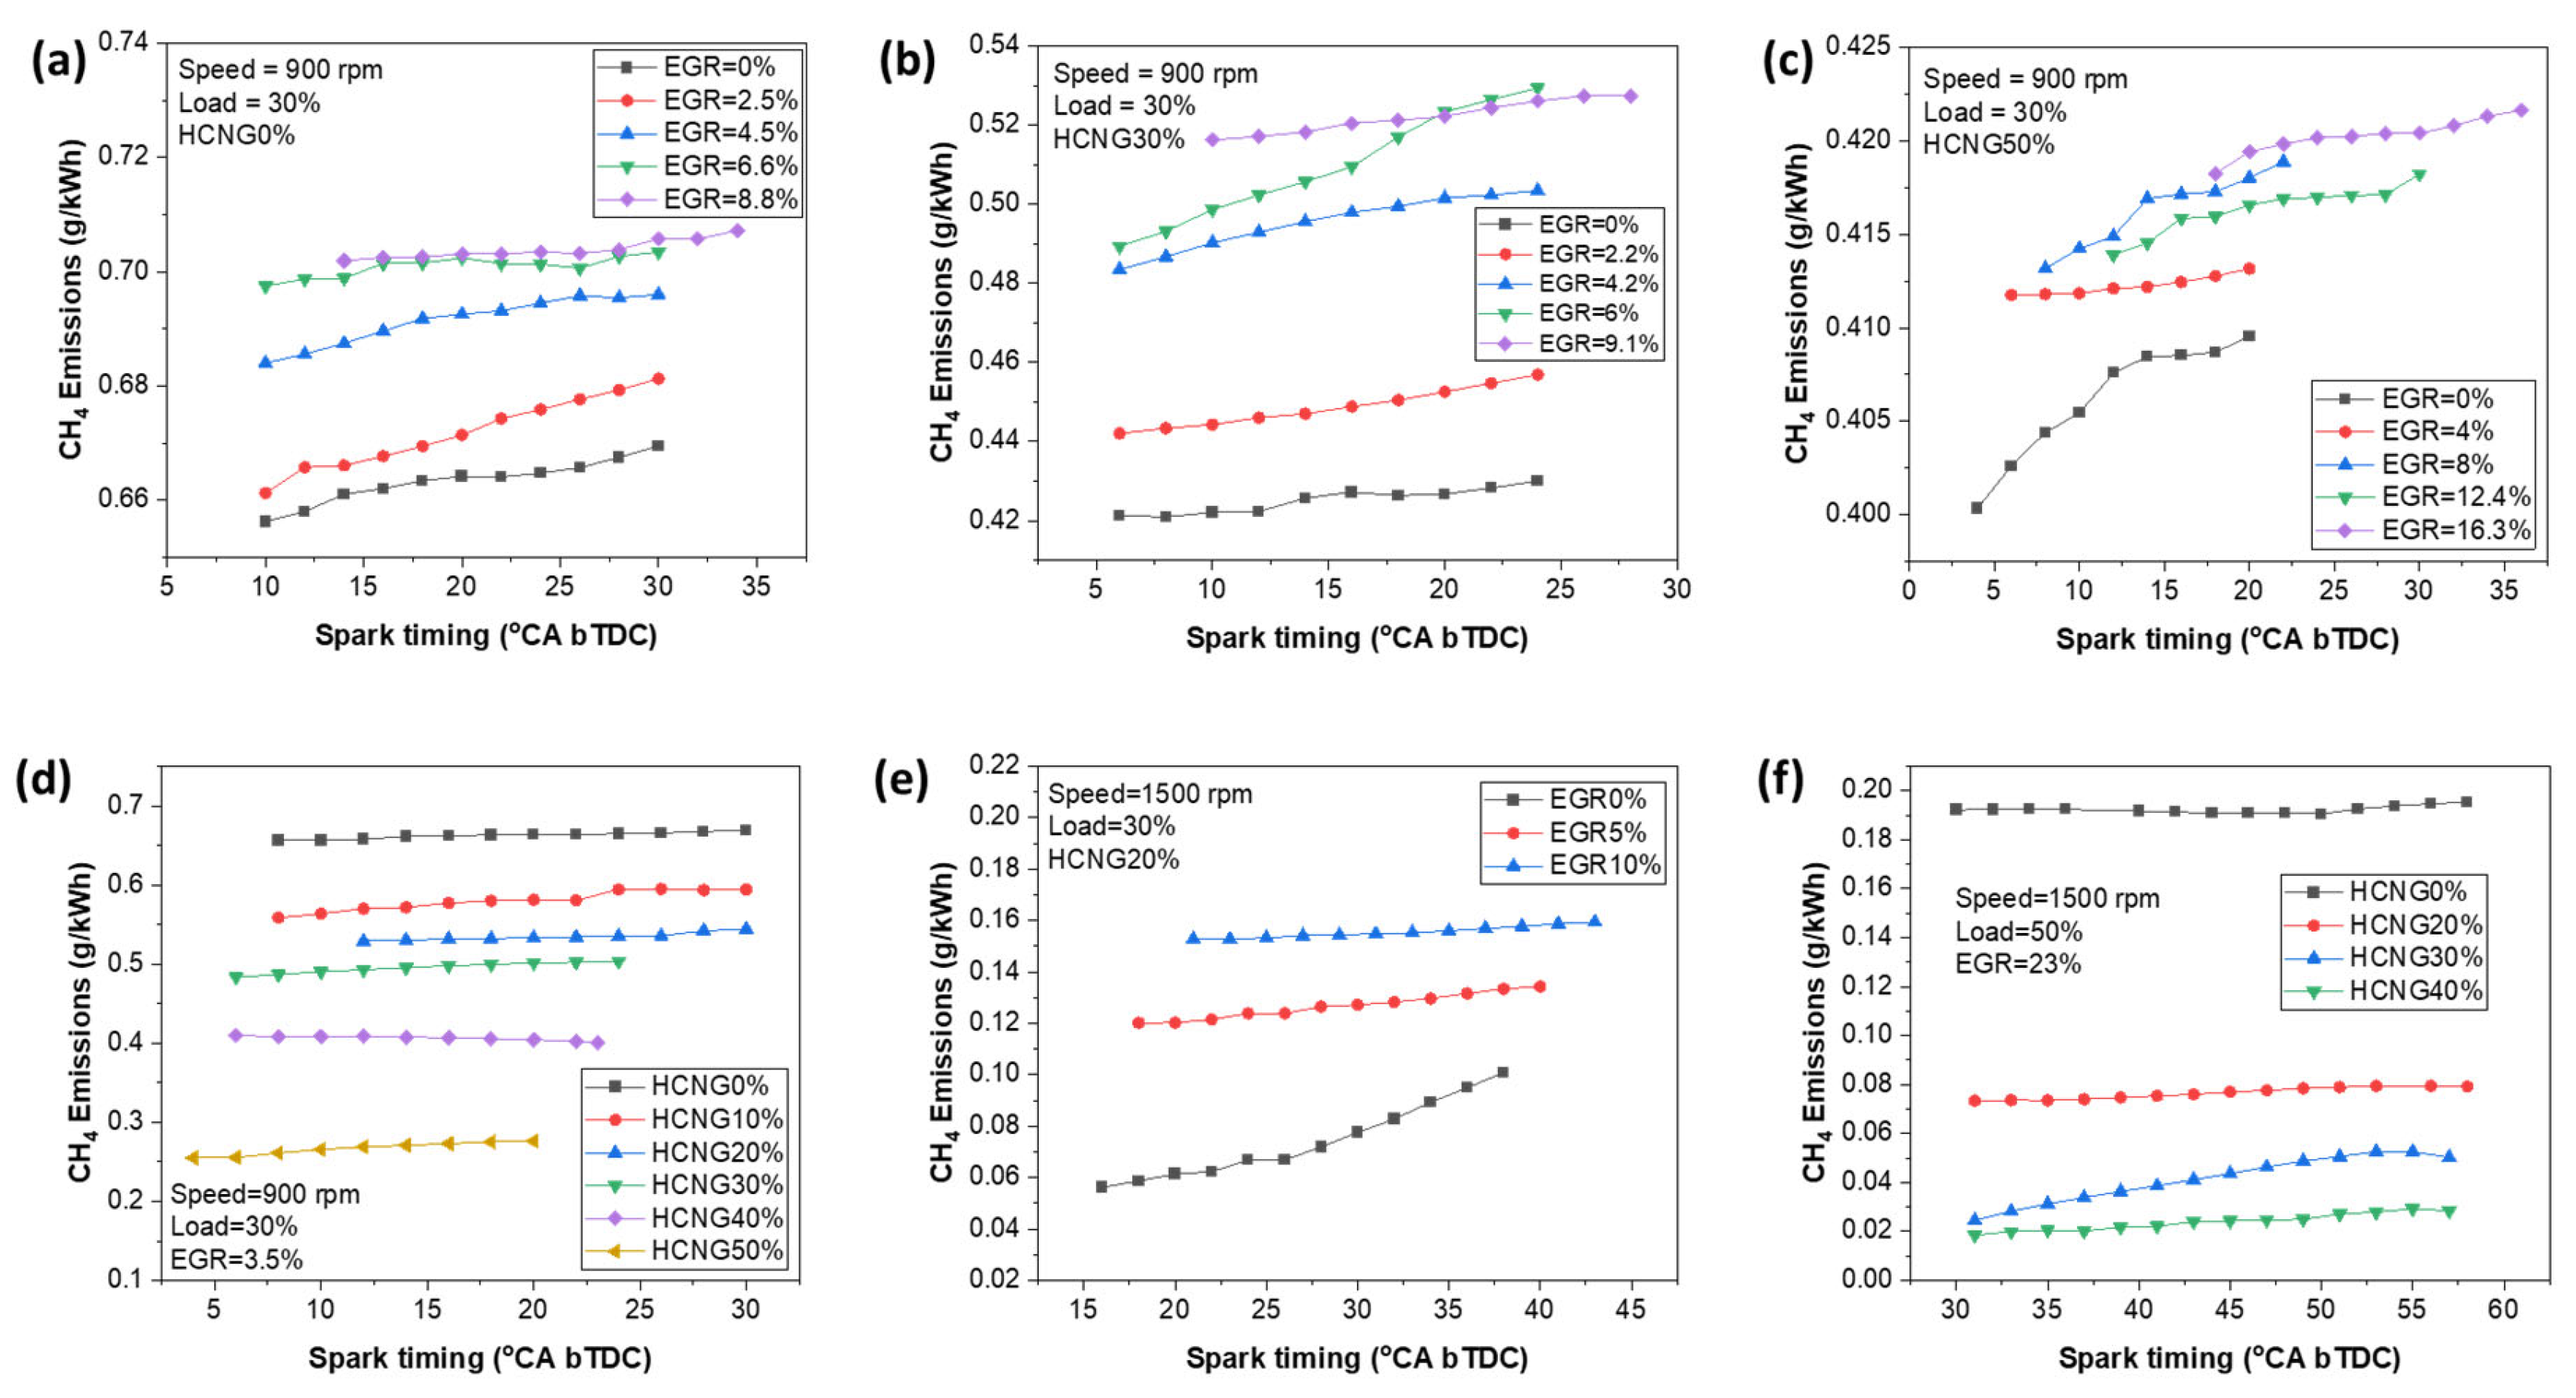
Figure 2 presents CH4 emissions as a function of hydrogen fraction, spark timing, and exhaust gas recirculation (EGR) ratio under 30% and 50% load conditions. In Figure 2a, for HCNG0% at 900 rpm and 30% load, CH4 emissions increase with advancing spark timing. This behavior is attributed to incomplete methane oxidation caused by premature combustion phasing, which shifts peak pressure and temperature to occur before top dead center (bTDC), thereby reducing the effective expansion stroke and limiting post-flame oxidation of methane. At a fixed spark timing of 14 °CA bTDC, increasing the EGR ratio from 0% to 2.5%, 4.5%, 6.6%, and 8.8% increases CH4 emissions from 0.661 to 0.666, 0.687, 0.698, and 0.702 g/kWh, respectively, corresponding to a net increase of 5.81% as EGR is increased from 0% to 8.8%.
A similar trend is observed in Figure 2b for HCNG30% at 900 rpm and 30% load. At 14 °CA bTDC, increasing the EGR ratio from 0% to 2.2%, 4.2%, 6%, and 9.1% increases CH4 emissions from 0.425 to 0.447, 0.496, 0.506, and 0.518 g/kWh, respectively, yielding an overall increase of 17.86% across the 0–9.1% EGR range. The higher sensitivity of CH4 emissions to EGR at this hydrogen fraction is attributed to enhanced charge dilution and reduced in-cylinder temperatures, which slow methane oxidation kinetics.
For HCNG50%, as shown in Figure 2c, overall CH4 emissions are lower than those observed for HCNG0% and HCNG30% due to the improved combustion characteristics associated with hydrogen enrichment, including higher flame speed and enhanced mixture reactivity. However, increasing EGR and advancing spark timing still promote higher CH4 slip. At 900 rpm and 30% load with a spark timing of 20 °CA bTDC, EGR ratios of 0%, 4%, 8%, 12.4%, and 16.3% correspond to CH4 emissions of 0.409, 0.413, 0.418, 0.416, and 0.419 g/kWh, respectively, representing an overall increase of 2.35% as EGR increases from 0% to 16.3%.
In contrast, Figure 2d shows that at 900 rpm, 30% load, and 3.5% EGR (at 14 °CA bTDC), increasing the hydrogen fraction from 0% to 10%, 20%, 30%, 40%, and 50% progressively reduces CH4 emissions from 0.661 to 0.571, 0.530, 0.495, 0.407, and 0.271 g/kWh, respectively. Consequently, HCNG50% operation achieves a 59.03% reduction in CH4 emissions relative to HCNG0%. This reduction is primarily attributed to hydrogen-assisted enhancement of flame propagation and oxidation kinetics, which significantly suppresses methane slip.
Figure 2e presents CH4 emission characteristics for HCNG20% at 1500 rpm and 30% load. CH4 emissions increase with advancing spark timing; however, the application of EGR effectively suppresses methane emissions at the selected timing. At 24 °CA bTDC, EGR ratios of 0%, 5%, and 10% reduce CH4 emissions from 0.668 to 0.124 and 0.153 g/kWh, respectively, corresponding to a reduction of 56.22% relative to the 0% EGR condition.
Finally, Figure 2f illustrates the combined effects of hydrogen enrichment and high EGR at 1500 rpm, 50% load, and an EGR ratio of 23%. At 43 °CA bTDC, increasing the hydrogen fraction from 0% to 40% substantially reduces CH4 emissions from 0.191 to 0.024 g/kWh, corresponding to a significant reduction of 87.40%. Overall, the combined application of hydrogen enrichment and EGR exhibits a limited additional influence on CH4 emissions beyond the dominant effects of improved combustion and charge dilution. Similar CH4 emission trends have been reported in previous studies [22,44,45,46].

3.1.2. CO Emissions

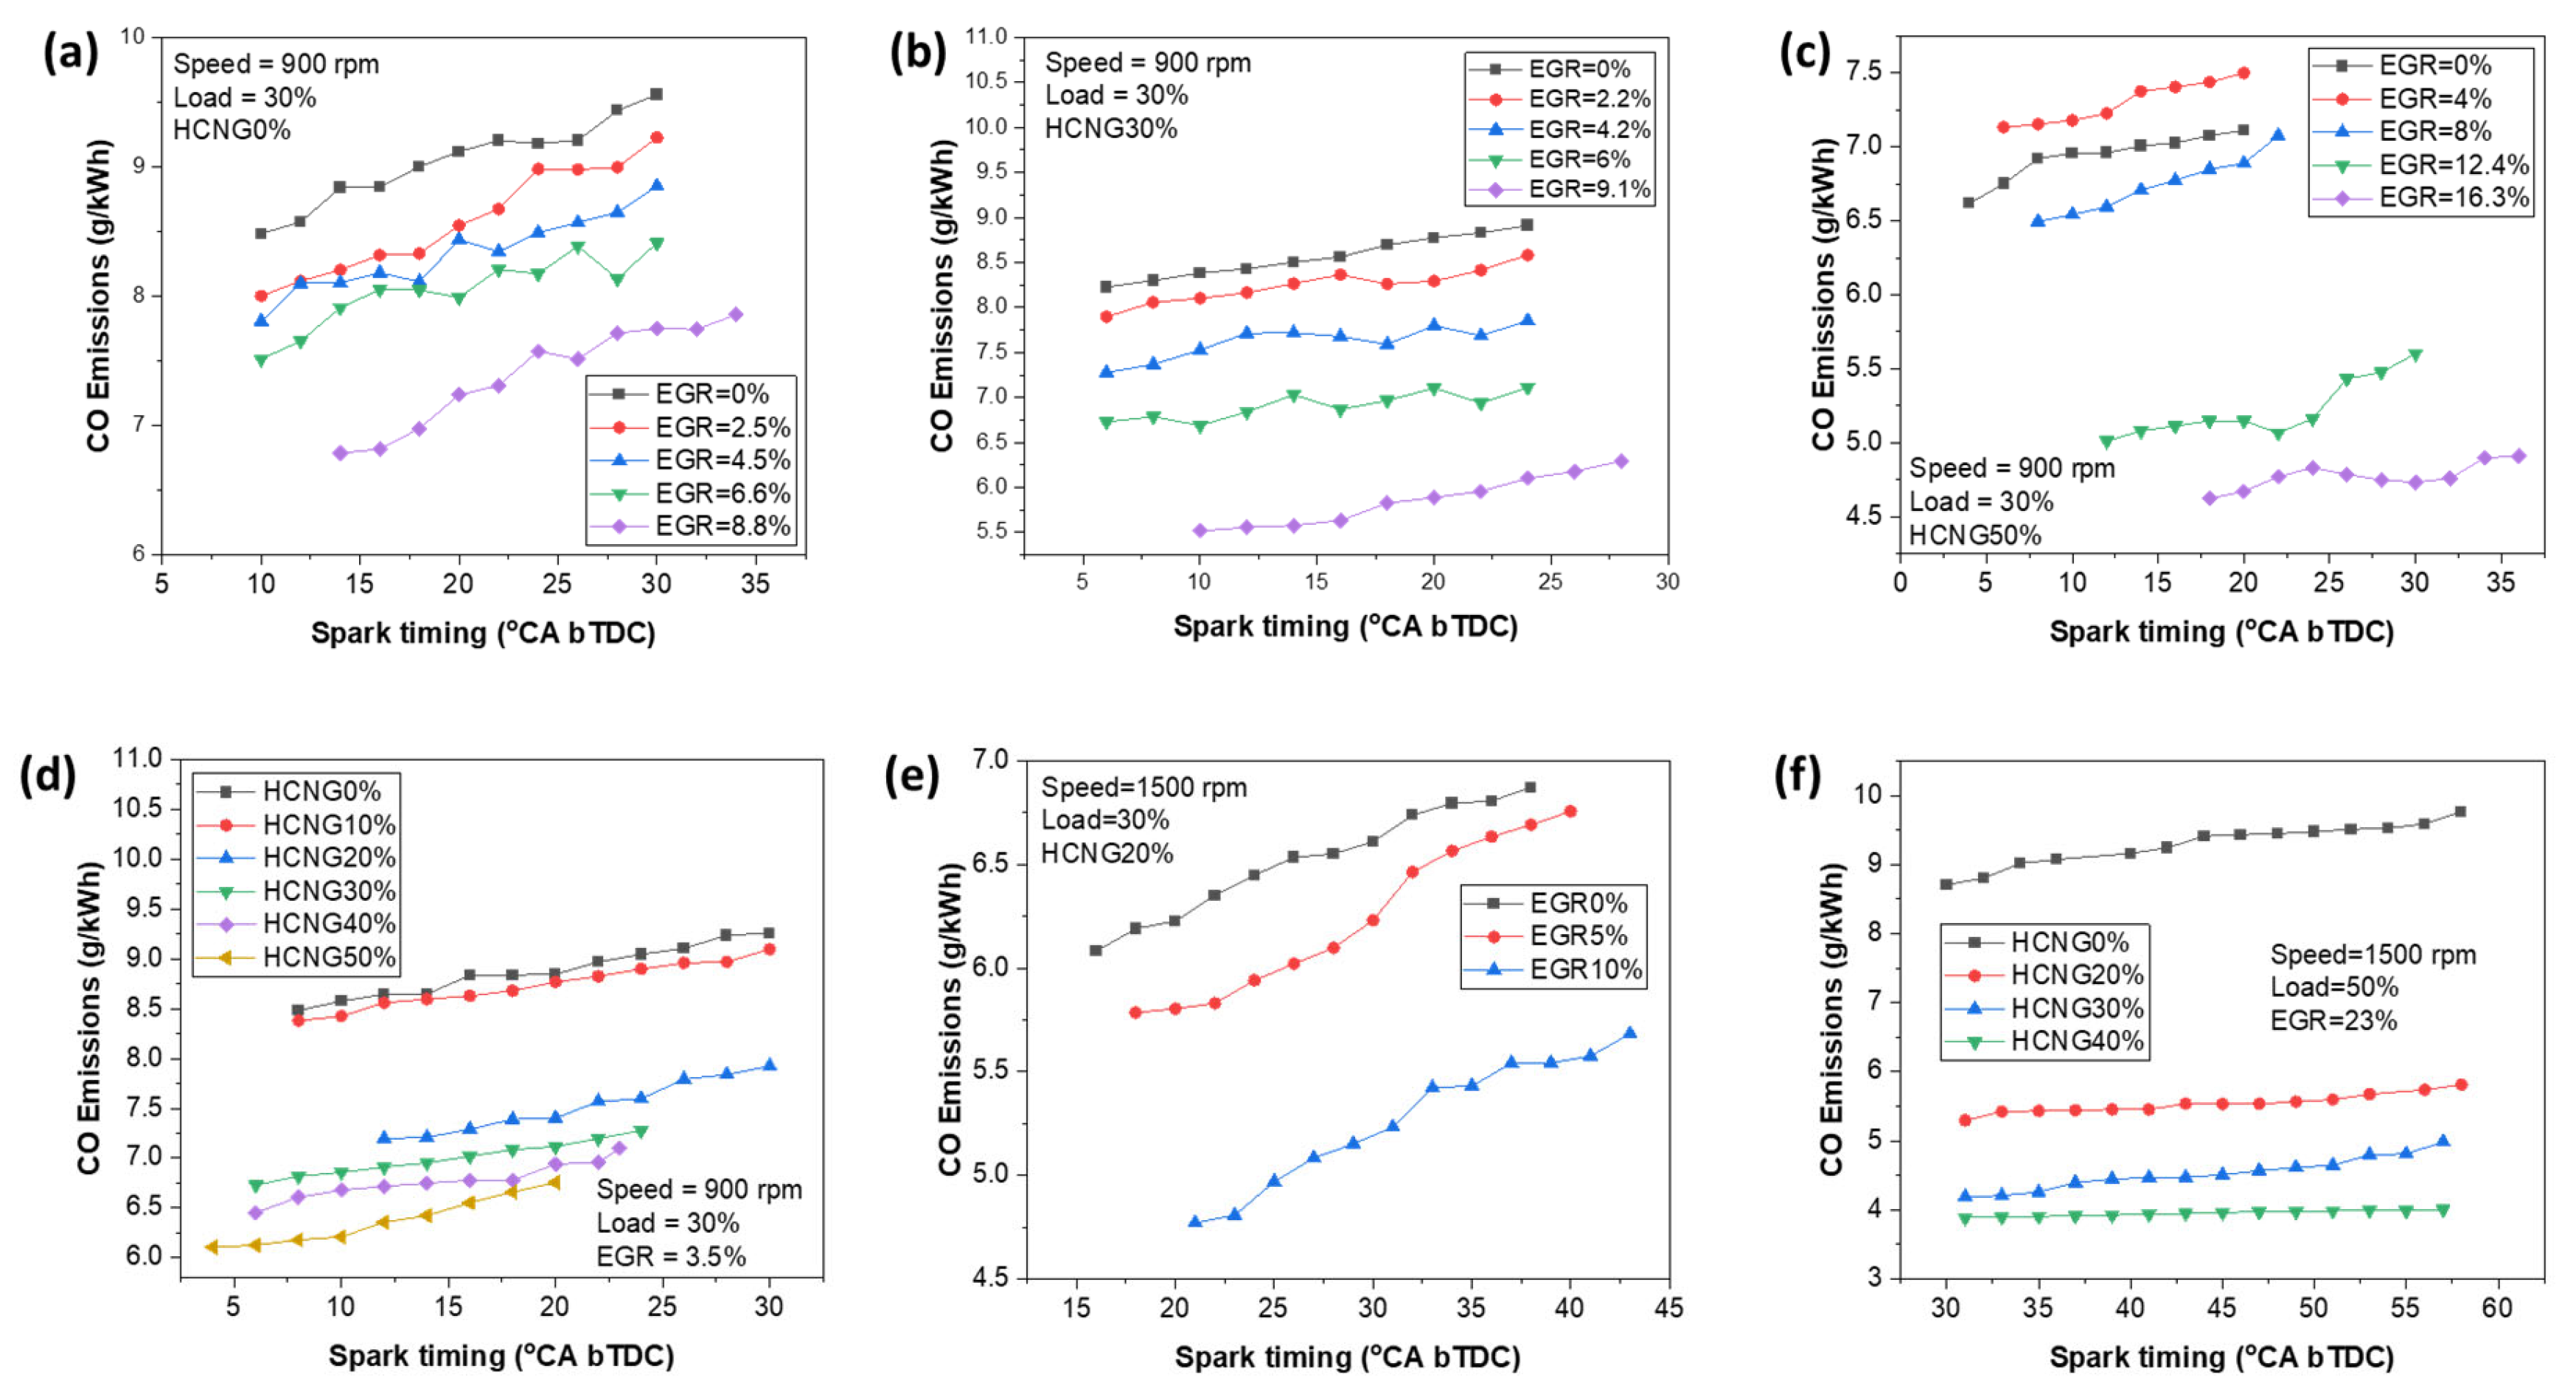
Figure 3 illustrates the variation in CO emissions with hydrogen fraction, spark timing, and exhaust gas recirculation (EGR) ratio under 30% and 50% load conditions. In Figure 3a, for HCNG0% at 900 rpm and 30% load, CO emissions increase with advancing spark timing. This trend is attributed to reduced oxygen availability and shortened combustion duration, which limit the complete oxidation of CO to CO2. At a fixed spark timing of 14 °CA bTDC, increasing the EGR ratio from 0% to 2.5%, 4.5%, 6.6%, and 8.8% decreases CO emissions from 8.838 to 8.203, 8.103, 7.910, and 6.788 g/kWh, respectively, corresponding to a net reduction of 23.19% as EGR increases from 0% to 8.8%.
A similar trend is observed in Figure 3b for HCNG30% at 900 rpm and 30% load. At a fixed spark timing of 14 °CA bTDC, increasing the EGR ratio from 0% to 2.2%, 4.2%, 6%, and 9.1% reduces CO emissions from 8.504 to 8.266, 7.717, 7.029, and 5.577 g/kWh, respectively, yielding an overall reduction of 34.41% across the 0–9.1% EGR range.
For HCNG50%, as shown in Figure 3c, CO emissions exhibit a generally decreasing trend with increasing EGR ratio at 900 rpm and 30% load. At a spark timing of 20 °CA bTDC, EGR ratios of 0%, 4%, 8%, 12.4%, and 16.3% correspond to CO emissions of 7.112, 7.501, 6.889, 5.147, and 4.669 g/kWh, respectively, representing an overall reduction of 34.33% as EGR increases from 0% to 16.3%. The slight increase at low EGR is attributed to reduced oxygen concentration, whereas higher EGR levels promote improved oxidation through enhanced mixing and longer effective oxidation duration.
The reduction in CO emissions with hydrogen enrichment (0–50%) is primarily attributed to the decreasing carbon-to-hydrogen (C/H) ratio of the fuel blend, which reduces the amount of carbon available for CO formation and enhances combustion completeness.
In contrast, Figure 3d shows that at 900 rpm, 30% load, and 3.5% EGR, advancing the spark timing from 8° to 30° CA bTDC increases CO emissions. This behavior is caused by incomplete combustion associated with excessive spark advance, which shifts peak cylinder pressure and temperature further before top dead center (bTDC), thereby shortening the effective expansion stroke and limiting CO oxidation. At 14 °CA bTDC, hydrogen fractions of 0%, 10%, 20%, 30%, 40%, and 50% yield CO emissions of 8.646, 8.596, 7.209, 6.953, 6.749, and 6.424 g/kWh, respectively. Consequently, HCNG50% operation results in a 25.71% reduction in CO emissions relative to HCNG0%.
At a higher engine speed, Figure 3e presents CO emission characteristics for HCNG20% at 1500 rpm and 30% load. CO emissions increase with advancing spark timing; however, the application of EGR effectively mitigates this increase. At 24 °CA bTDC, EGR ratios of 0%, 5%, and 10% reduce CO emissions from 6.449 to 5.942 and 5.808 g/kWh, respectively, corresponding to a reduction of 25.45% relative to the 0% EGR condition.
Finally, Figure 3f illustrates the combined effects of hydrogen enrichment and high EGR at 1500 rpm, 50% load, and an EGR ratio of 23%. Under these conditions, at 43 °CA bTDC, increasing the hydrogen fraction from 0% to 40% reduces CO emissions from 9.414 to 3.951 g/kWh, corresponding to a 58.03% decrease. Overall, the results show that hydrogen enrichment, especially when coupled with high EGR, effectively suppresses CO emissions by lowering carbon availability and enhancing combustion efficiency, consistent with previous studies [22,44,45,46]. Although CO is not a direct greenhouse gas, it remains important due to its air-quality impacts and its role as an indirect climate forcer. Since CO levels reflect combustion completeness, the observed variations with hydrogen fraction, EGR rate, and spark timing offer valuable insights into HCNG combustion behavior.

3.1.3. NOx Emissions

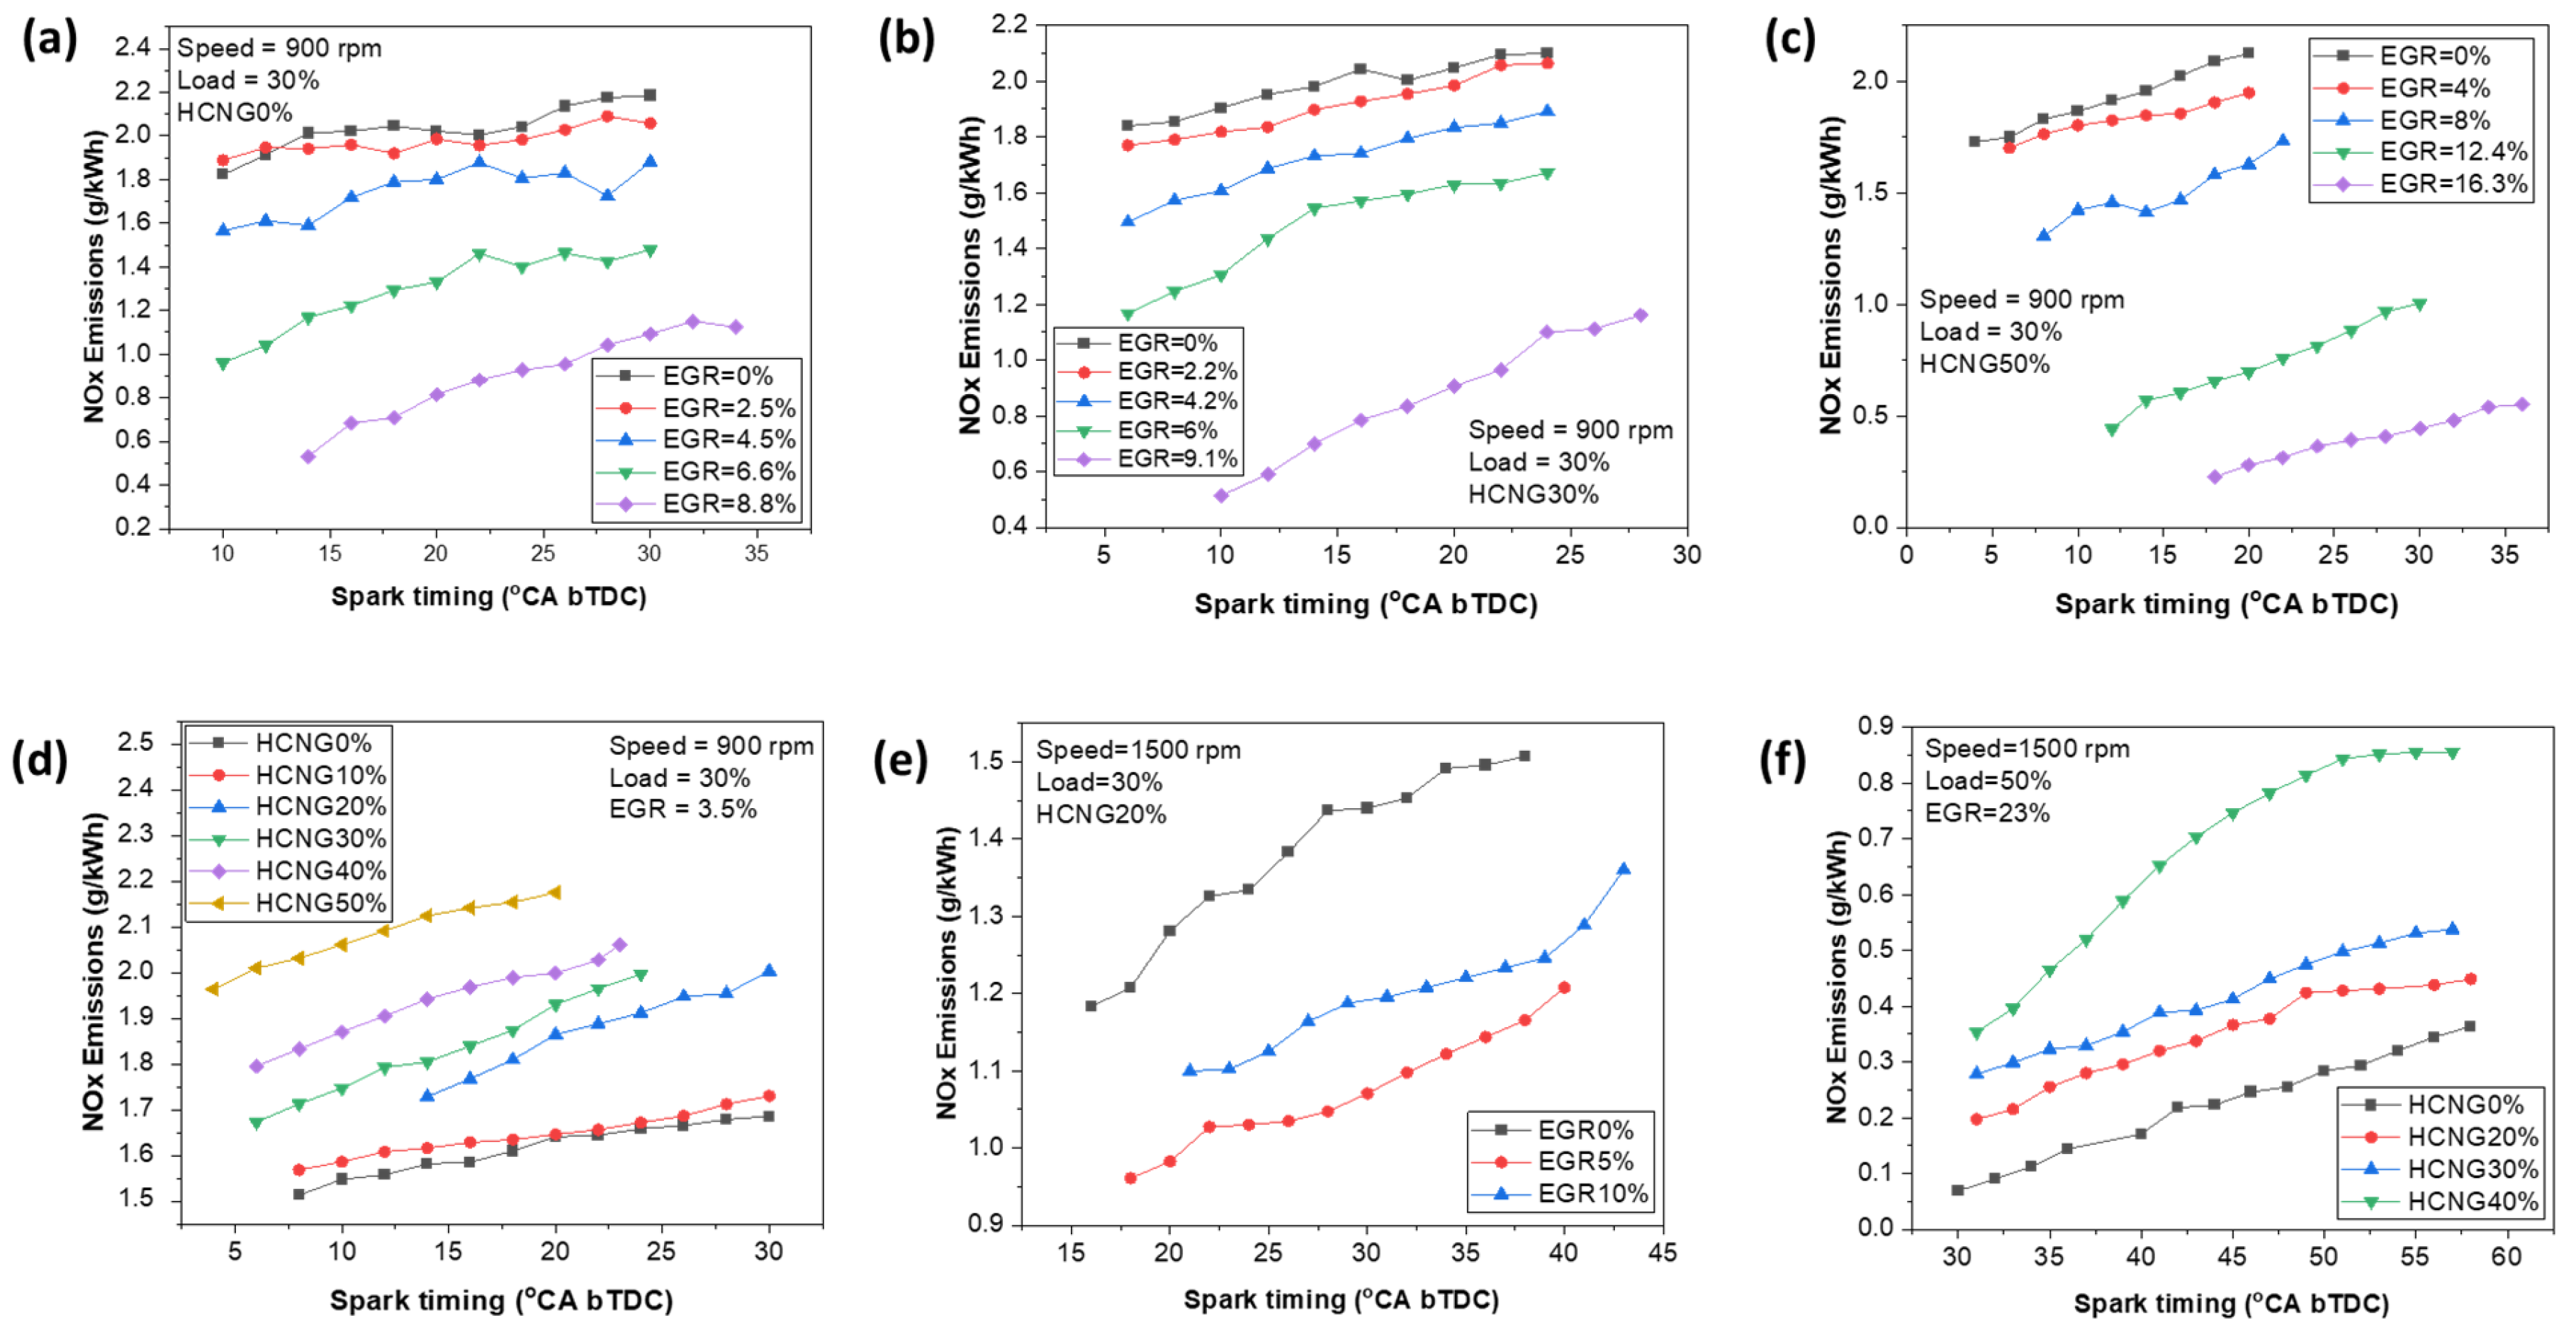
Figure 4 presents NOx emissions as a function of hydrogen fraction, spark timing, and exhaust gas recirculation (EGR) ratio under 30% and 50% load conditions. In Figure 4a, for HCNG0% at 900 rpm and 30% load, NOx emissions increase with advancing spark timing. This behavior is attributed to the combined effects of increased in-cylinder temperature, extended residence time at elevated temperatures, and higher oxygen availability, which are the primary factors governing thermal NOx formation [47,48]. At a fixed spark timing of 14 °CA bTDC, increasing the EGR ratio from 0% to 2.5%, 4.5%, 6.6%, and 8.8% reduces NOx emissions from 2.013 to 1.941, 1.591, 1.169, and 0.532 g/kWh, respectively, corresponding to a substantial reduction of 73.56% as EGR increases from 0% to 8.8%.
A similar trend is observed in Figure 4b for HCNG30% at 900 rpm and 30% load. At 14 °CA bTDC, increasing the EGR ratio from 0% to 2.2%, 4.2%, 6%, and 9.1% decreases NOx emissions from 1.981 to 1.897, 1.731, 1.544, and 0.699 g/kWh, respectively, yielding an overall reduction of 64.69% across the applied EGR range.
For HCNG50%, as shown in Figure 4c, NOx emissions exhibit an even stronger sensitivity to EGR dilution. At 900 rpm and 30% load with a spark timing of 20 °CA bTDC, increasing the EGR ratio from 0% to 4%, 8%, 12.4%, and 16.3% reduces NOx emissions from 2.124 to 1.948, 1.627, 0.697, and 0.279 g/kWh, respectively, corresponding to a pronounced reduction of 86.81%. This enhanced NOx suppression is attributed to the combined effects of charge dilution, increased specific heat capacity, and reduced peak combustion temperature at higher EGR rates.
In contrast, Figure 4d shows that at 900 rpm, 30% load, and 3.5% EGR (at 14 °CA bTDC), increasing the hydrogen fraction from 0% to 10%, 20%, 30%, 40%, and 50% increases NOx emissions from 1.580 to 1.616, 1.728, 1.805, 1.943, and 2.124 g/kWh, respectively. Consequently, HCNG50% operation results in a 25.56% increase in NOx emissions relative to HCNG0%. This increase is primarily caused by hydrogen-induced enhancement of flame speed and combustion temperature, which promotes thermal NOx formation in the absence of EGR dilution.
Figure 4e presents NOx emissions for HCNG20% at 1500 rpm and 30% load. NOx emissions increase with advancing spark timing and hydrogen fraction; however, the application of EGR effectively suppresses NOx formation. At 24 °CA bTDC, EGR ratios of 0%, 5%, and 10% reduce NOx emissions from 1.334 to 1.029 and 1.102 g/kWh, respectively, corresponding to a reduction of 17.39% relative to the 0% EGR condition.
Finally, Figure 4f illustrates the combined effects of hydrogen enrichment and high EGR at 1500 rpm, 50% load, and an EGR ratio of 23%. At 43 °CA bTDC, increasing the hydrogen fraction from 0% to 20%, 30%, and 40% increases NOx emissions from 0.223 to 0.337, 0.392, and 0.704 g/kWh, respectively, corresponding to an increase of 68.32%. Although hydrogen enrichment tends to increase NOx formation due to elevated flame temperatures and enhanced N2O-related reaction pathways, the overall influence of hydrogen on NOx emissions remains limited under high EGR conditions. This is because the dominant EGR-induced dilution effect significantly reduces peak combustion temperature and oxygen availability, thereby suppressing thermal NOx, N2O, and HCN formation mechanisms. As a result, when hydrogen enrichment is combined with high EGR rates, the net change in NOx emissions remains relatively small. Similar emission trends have been reported in earlier studies [22,44,45,46].
In H2/CNG-fueled combustion, hydrogen does not react directly with molecular nitrogen under low or moderate temperature conditions because of the strong N≡N bond. However, at high in-cylinder flame temperatures above approximately 1800 K, nitrogen can participate in radical-mediated pathways. Hydrogen enrichment increases the pool of reactive H radicals, which promotes the formation of NNH through reactions such as N2 + H → NNH. Although NNH is a highly transient intermediate, it plays a key role in prompt NO formation and subsequent nitrogen chemistry. Additionally, under fuel-rich and high-temperature conditions, nitrogen-containing intermediates such as HCN and HNCN may form through interactions between hydrocarbon fragments from CNG and nitrogen radicals. Increasing hydrogen content enhances flame speed and peak temperature, thereby increasing the likelihood of N2 activation through radical pathways rather than direct molecular reactions. Consequently, higher hydrogen blending can increase the contribution of prompt-NO-related mechanisms, even when overall equivalence ratios are controlled [48].

3.1.4. CO2 Emissions

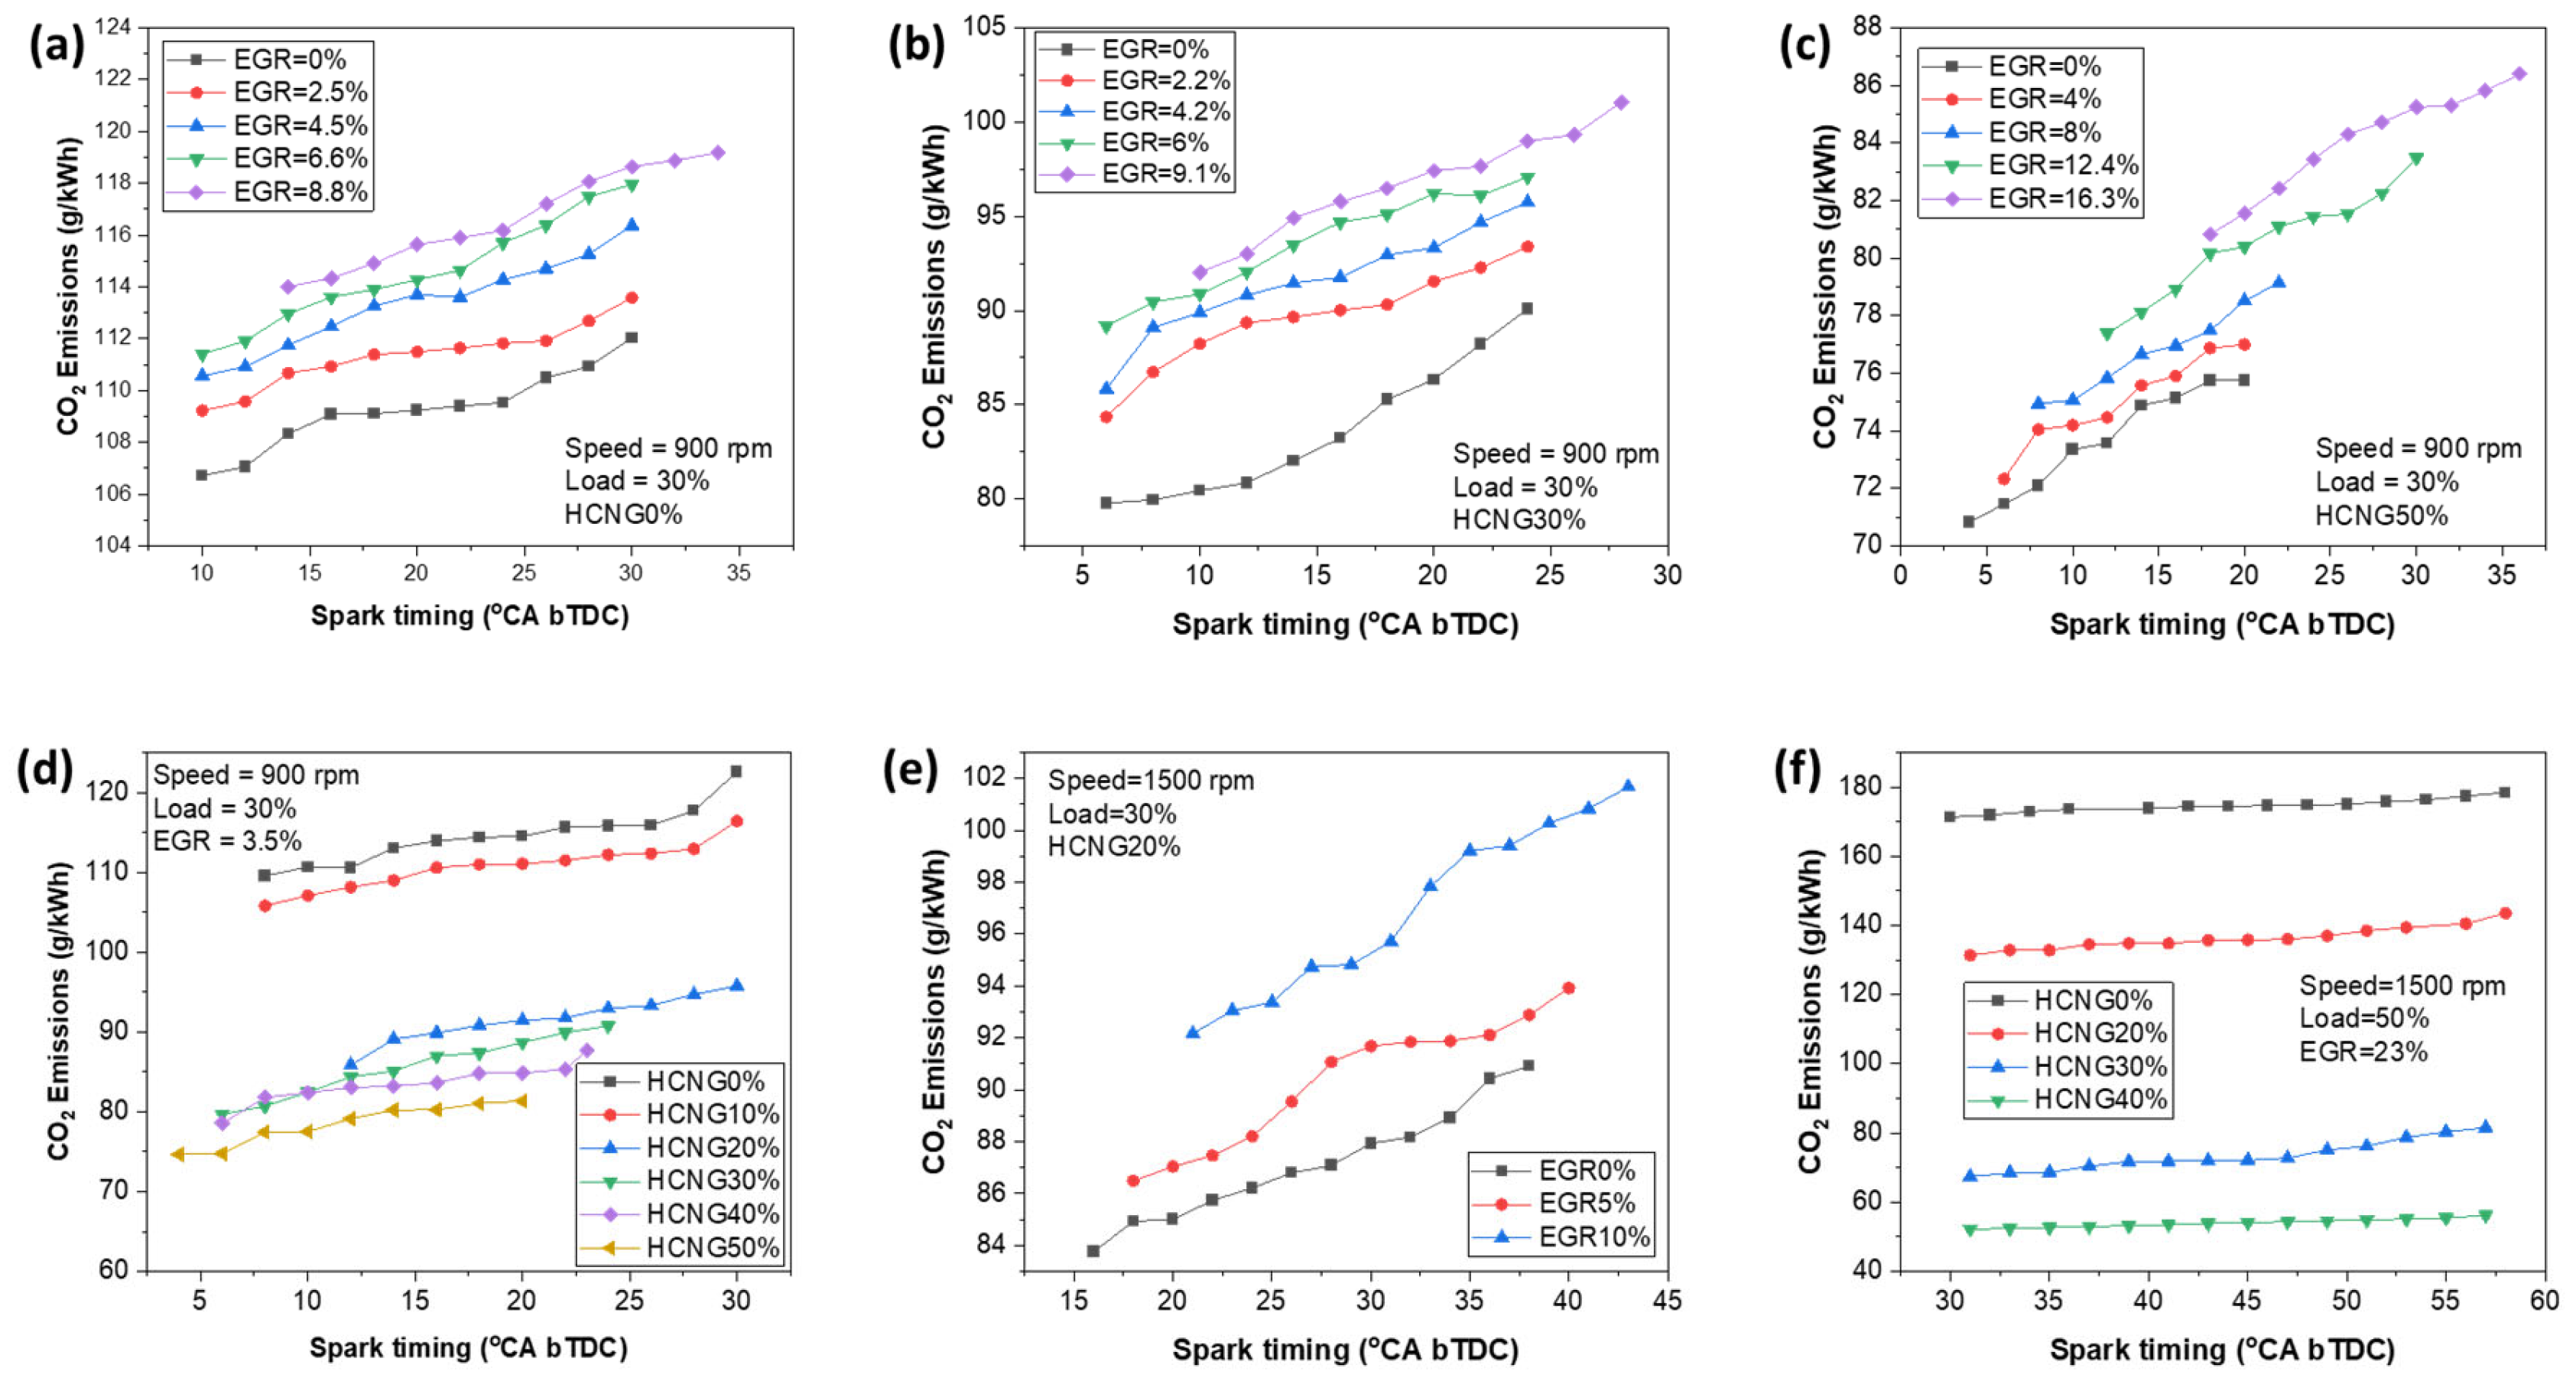
Figure 5 presents CO2 emissions as a function of hydrogen fraction, spark timing, and EGR ratio under 30% and 50% load conditions. For HCNG0% at 900 rpm and 30% load (Figure 5a), CO2 emissions increase with advancing spark timing due to improved combustion completeness, while EGR further enhances CO2 formation by promoting post-flame oxidation of CO and unburned hydrocarbons through extended combustion duration despite reduced peak temperatures. At a fixed spark timing of 14 °CA bTDC, increasing the EGR ratio from 0% to 2.5%, 4.5%, 6.6%, and 8.8% increases CO2 emissions from 108.33 to 110.67, 111.75, 112.95, and 114.01 g/kWh, respectively, corresponding to a net increase of 4.97% as EGR is increased from 0% to 8.8%.
A similar trend is observed in Figure 5b for HCNG30% at 900 rpm and 30% load. At 14 °CA bTDC, increasing the EGR ratio from 0% to 2.2%, 4.2%, 6%, and 9.1% increases CO2 emissions from 82.03 to 89.65, 91.45, 93.48, and 94.89 g/kWh, respectively, yielding an overall increase of 13.54% across the 0 to 9.1% EGR range. However, despite this increase, overall CO2 emissions remain lower than those observed for HCNG0%, primarily due to the reduced carbon content of the hydrogen-enriched fuel.
For HCNG50%, as shown in Figure 5c, CO2 emissions are further reduced compared to HCNG0% and HCNG30% owing to the lower carbon-to-hydrogen ratio of the fuel and the enhanced combustion characteristics associated with hydrogen enrichment, including higher flame speed and improved mixture reactivity. At 900 rpm and 30% load with a spark timing of 20 °CA bTDC, EGR ratios of 0%, 4%, 8%, 12.4%, and 16.3% correspond to CO2 emissions of 75.75, 77.01, 78.52, 80.40, and 81.56 g/kWh, respectively, representing an overall increase of 7.12% as EGR increases from 0% to 16.3%.
In contrast, Figure 5d shows that at 900 rpm, 30% load, and 3.5% EGR (at 14 °CA bTDC), increasing the hydrogen fraction from 0% to 10%, 20%, 30%, 40%, and 50% progressively reduces CO2 emissions from 113.05 to 108.97, 89.09, 85.10, 83.22, and 80.22 g/kWh, respectively. Consequently, HCNG50% operation achieves a 29.03% reduction in CO2 emissions relative to HCNG0%. This reduction is primarily attributed to the substantial decrease in carbon content per unit energy input with hydrogen enrichment, which outweighs the improved oxidation efficiency associated with faster combustion.
Figure 5e presents CO2 emission characteristics for HCNG20% at 1500 rpm and 30% load. CO2 emissions increase with advancing spark timing and with increasing EGR ratio. At 24 °CA bTDC, EGR ratios of 0%, 5%, and 10% increase CO2 emissions from 86.22 to 88.20 and 93.05 g/kWh, respectively, corresponding to a net increase of 7.34% relative to the 0% EGR condition. This trend reflects enhanced oxidation of CO and unburned hydrocarbons under diluted combustion conditions.
Finally, Figure 5f illustrates the combined effects of hydrogen enrichment and high EGR at 1500 rpm, 50% load, and an EGR ratio of 23%. At 43 °CA bTDC, increasing the hydrogen fraction from 0% to 20%, 30%, and 40% reduces CO2 emissions from 174.48 to 135.71, 71.97, and 53.85 g/kWh, respectively, corresponding to a substantial reduction of 69.13% as the hydrogen fraction increases from 0% to 40%. Overall, these results demonstrate that hydrogen enrichment plays a dominant role in reducing CO2 emissions by lowering the carbon content of the fuel, while EGR primarily influences CO2 formation through its effect on combustion completeness. Similar CO2 emission trends have been reported in previous studies [22,35].

3.1.5. GHG Emissions

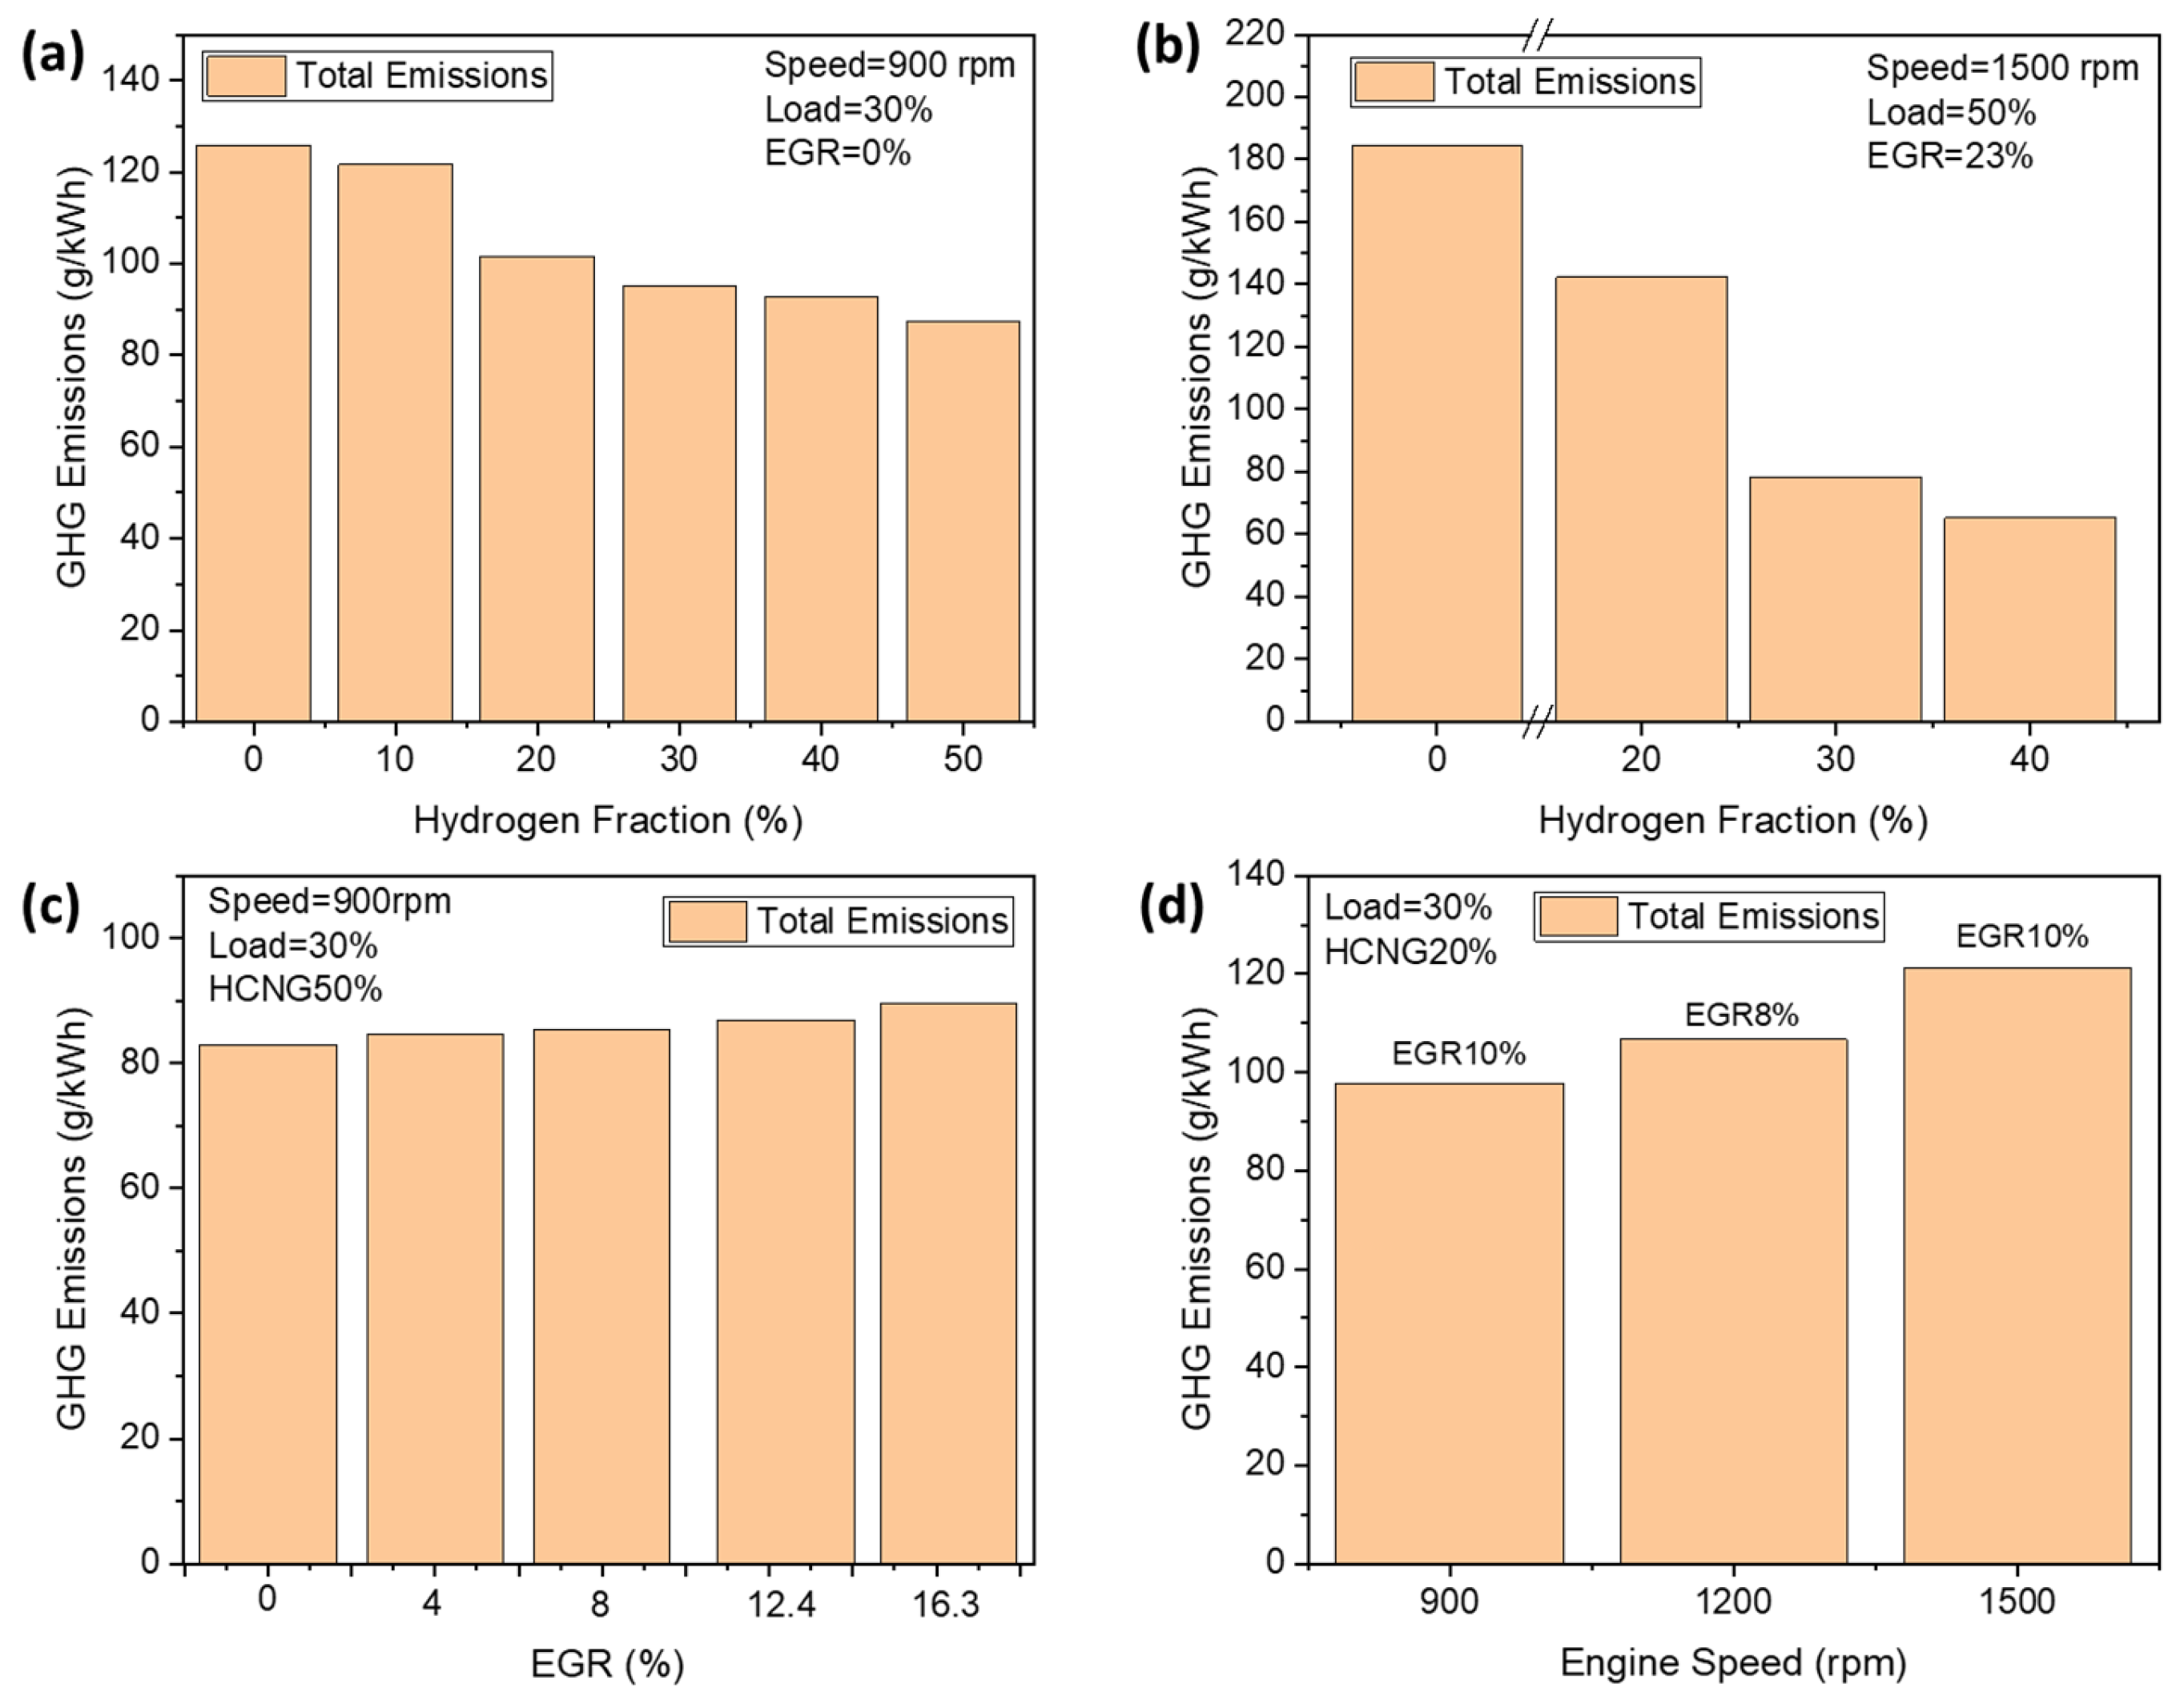
Since the optimal conditions for CO, CO2, CH4, and NOx do not coincide, Figure 2, Figure 3, Figure 4 and Figure 5 are further synthesized into a total GHG assessment (Figure 6) to determine the overall most favorable operating regime. Figure 6 illustrates the combined effects of hydrogen fraction, exhaust gas recirculation (EGR) ratio, and engine speed on total greenhouse gas (GHG) emissions. In this study, total GHG emissions are defined as the sum of CO, CO2, CH4, and NOx emissions, providing a comprehensive metric for evaluating the overall emission performance of the engine under different operating conditions.
Figure 6a shows the effect of hydrogen fraction on total GHG emissions at an engine speed of 900 rpm, a load of 30%, and 0% EGR. Total GHG emissions decrease from 125.6, 121.6, 101.48, 94.93, 92.63, and 87.22 g/kWh for hydrogen fractions of HCNG0%, HCNG10%, HCNG20%, HCNG30%, HCNG40%, and HCNG50%, respectively. This corresponds to an approximate reduction of 30.59% in total GHG emissions when comparing HCNG50% with HCNG0%, highlighting the effectiveness of hydrogen enrichment in reducing overall emissions through reduced fuel carbon content and improved combustion characteristics.
Similarly, Figure 6b illustrates the effect of hydrogen fraction on total GHG emissions at an engine speed of 1500 rpm, a load of 50%, and an EGR ratio of 23%. Under these conditions, total GHG emissions decrease from 184.3 to 142.23, 78.38, and 65.17 g/kWh for hydrogen fractions of HCNG0%, HCNG20%, HCNG30%, and HCNG40%, respectively. This represents an approximate reduction of 64.64% in total GHG emissions when comparing HCNG40% with HCNG0%, demonstrating that the emission reduction potential of hydrogen enrichment becomes more pronounced at higher load and EGR conditions.
Figure 6c presents the combined effect of hydrogen fraction and EGR ratio on total GHG emissions at an engine speed of 900 rpm, a load of 30%, and HCNG50% operation. Total GHG emissions increase from 82.90 to 84.59, 85.48, 86.86, and 89.59 g/kWh as the EGR ratio increases from 0% to 4%, 8%, 12.4%, and 16.3%, respectively. This corresponds to an approximate increase of 7.45% when comparing EGR0% with EGR16.3%. The observed increase is attributed to enhanced oxidation of intermediate species and increased CO2 formation under diluted combustion conditions, despite reductions in NOx emissions.
Figure 6d shows the variation in total GHG emissions with engine speed (900, 1200, and 1500 rpm) at a load of 30% under HCNG20% operation. At 900 rpm, total GHG emissions are 97.81 g/kWh. As engine speed increases to 1200 rpm, emissions rise to 106.63 g/kWh, and a further increase to 1500 rpm results in emissions of 121.32 g/kWh. Compared to 900 rpm, total GHG emissions at 1500 rpm increase by approximately 24.0%. This trend is primarily attributed to higher fuel consumption rates, increased heat release, and reduced residence time at elevated engine speeds.
The reduction in GHG emissions with increasing hydrogen concentration is not solely due to dilution. Hydrogen enrichment modifies the combustion process through several mechanisms. Its higher laminar flame speed, greater thermal diffusivity, wider flammability limits, and smaller quenching distance improve combustion completeness, reducing unburned CH4 and CO formation. Moreover, hydrogen’s carbon-free composition, together with enhanced thermal efficiency at higher H2 fractions, lowers fuel-specific CO2 emissions. These combined effects explain the observed decrease in total GHG and C O 2 e q   emissions with increasing hydrogen content.

3.2. GHG Emissions Comparison Before and After Catalytic Converter

3.2.1. Effect of Hydrogen Fraction on Emissions

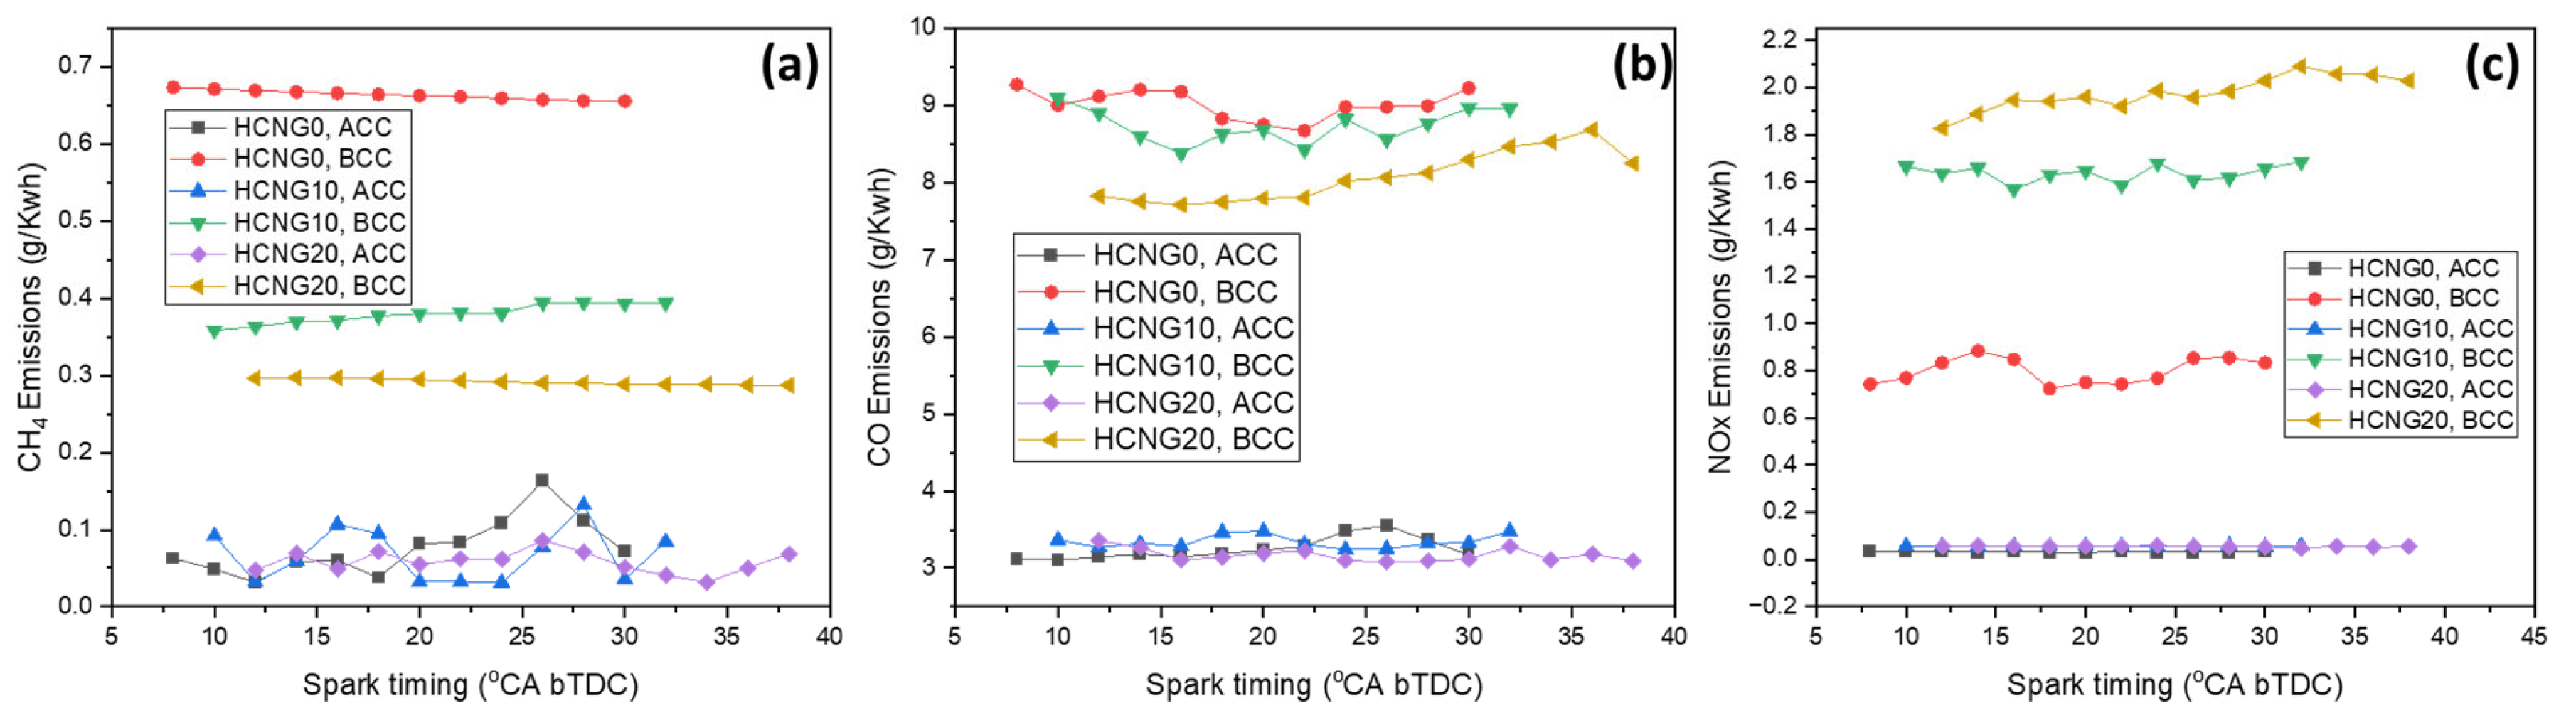
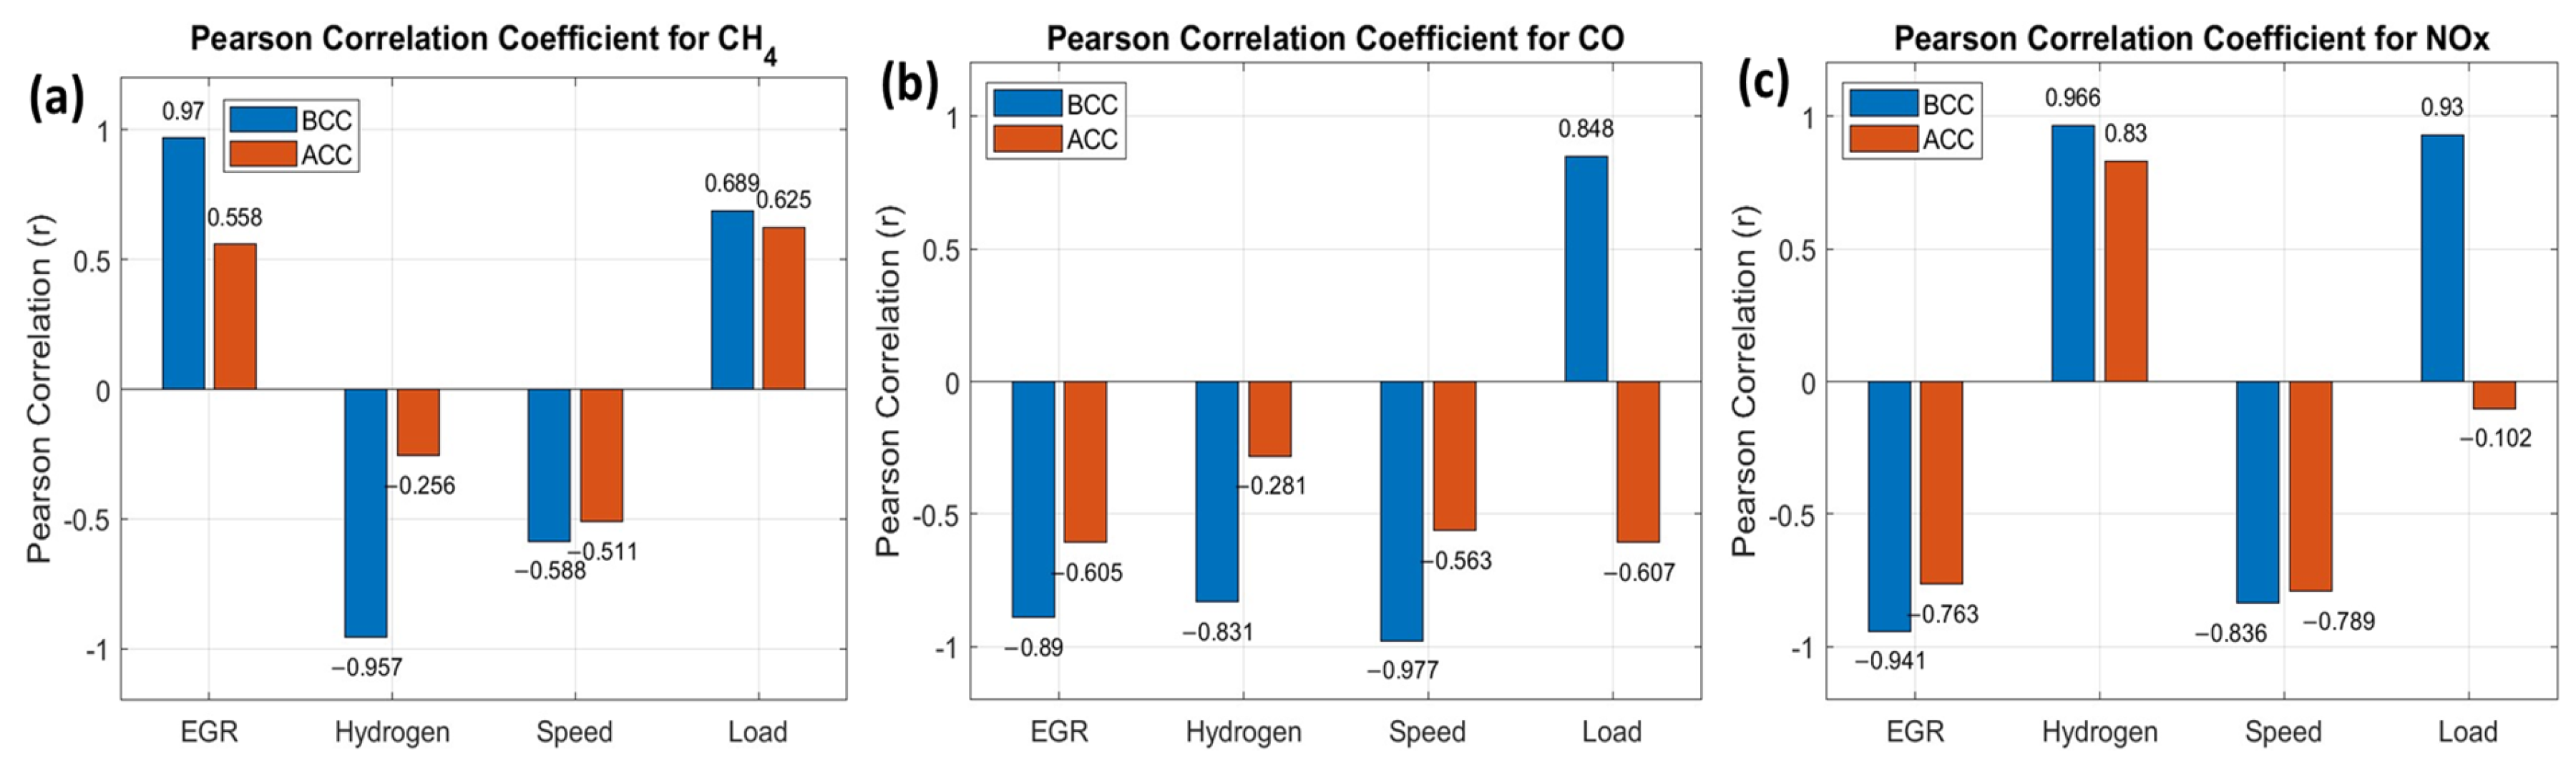
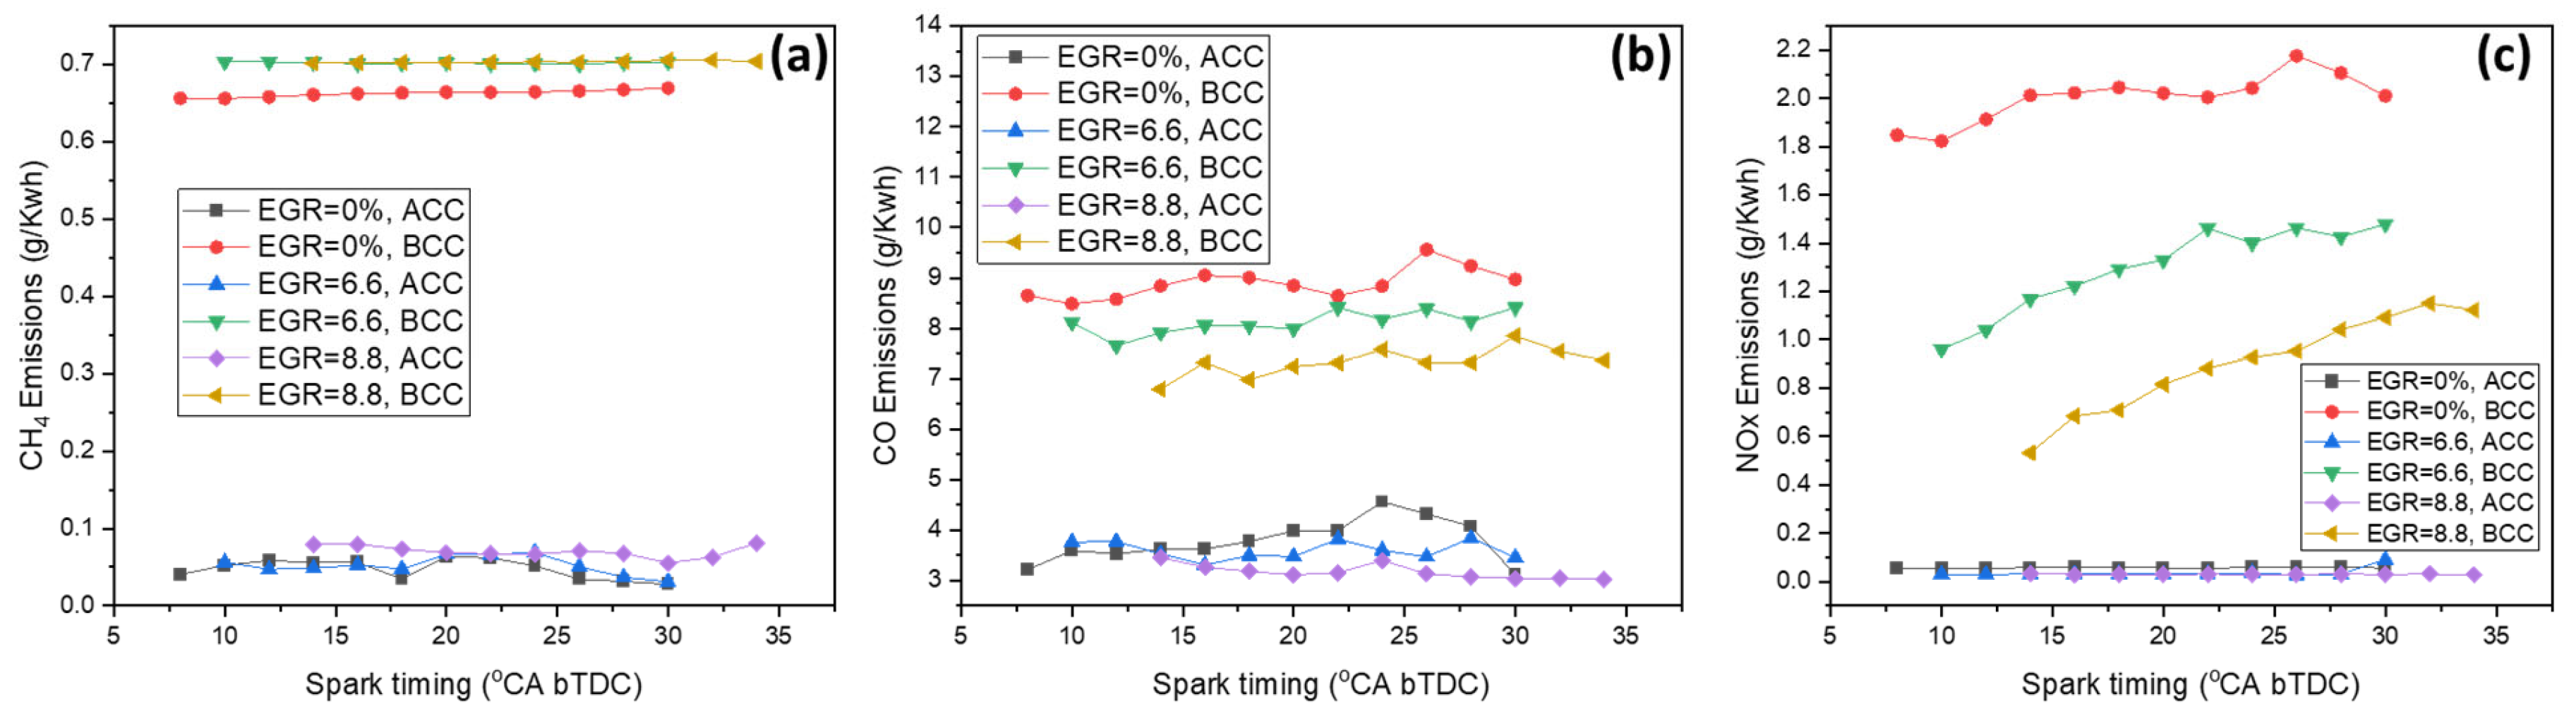
Figure 7 illustrates the effects of hydrogen enrichment, spark timing, and EGR at a speed of 900 rpm on exhaust emissions under a 30% engine load. Figure 7a shows that CH4 emissions decrease with increasing hydrogen content in the CNG fuel, as hydrogen addition enhances combustion efficiency and reduces unburned hydrocarbons (UHC). At 30% load and 30 °CA bTDC, CH4 emissions before the TWC were 0.6557, 0.3934, and 0.2885 g/kWh for 0%, 10%, and 20% hydrogen blends, respectively. After the TWC, these values were further reduced to 0.0717, 0.0356, and 0.0514 g/kWh under the same operating conditions. Moreover, the PCC was applied to assess the effect of hydrogen addition on CH4 emissions and to determine the relationship between the two variables (Figure 8a). The results showed strong negative correlations both before the catalytic converter (BCC) (−0.9566) and after the catalytic converter (ACC) (−0.2557), indicating that CH4 emissions decrease with increasing hydrogen content.
Figure 7b illustrates CO emissions, which decreased with increasing hydrogen content. Hydrogen addition lowers the C/H ratio and promotes complete combustion due to its favorable ignition properties. At 30% load and 30 °CA bTDC, CO emissions before the TWC were 9.922, 8.968, and 8.297 g/kWh for 0%, 10%, and 20% hydrogen blends, respectively. After the TWC, the values declined to 3.172, 3.329, and 3.116 g/kWh under the same test conditions and spark timing. Moreover, the PCC was used to evaluate the correlation between hydrogen content and CO emissions (Figure 8b). The results showed strong negative correlations for both BCC (−0.8309) and ACC (−0.2808), indicating that CO emissions decreased with increasing hydrogen content.
Figure 7c presents NOx emissions under varying hydrogen fractions, spark timings, and EGR ratios. Advancing spark timing and hydrogen enrichment raise in-cylinder temperatures, leading to increased NOx formation. At 30% load and 30 °CA bTDC, NOx emissions before the TWC were 0.8338, 1.6563, and 2.0281 g/kWh for 0%, 10%, and 20% hydrogen blends, respectively. After the TWC, these values dropped significantly to 0.0327, 0.0538, and 0.0543 g/kWh, confirming the converter’s effectiveness under the same operating conditions. The PCC was applied to evaluate the effect of hydrogen addition on NOx emissions (Figure 8c). In contrast to CH4 and CO, the results revealed strong positive correlations for both BCC (0.9664) and ACC (0.8301), indicating that NOx emissions increased with higher hydrogen content.
These results demonstrate that hydrogen enrichment in CNG significantly reduces GHGs by enhancing combustion efficiency. The presence of hydrogen increases the laminar flame speed and reduces ignition delay, promoting faster and more uniform flame propagation throughout the combustion chamber. Since hydrogen contains no carbon, its addition decreases the overall carbon content of the mixture. Consequently, HCNG blends operating at stoichiometric air-fuel ratios achieve cleaner and more efficient combustion with reduced CO and CH4 emissions compared to pure CNG. Furthermore, implementing a three-way catalytic converter further mitigates these emissions through effective oxidation of residual CO and HC, resulting in additional reductions in CH4, CO, and NOx emissions. These trends align with findings from previous studies [22,35,49,50].

3.2.2. Effect of EGR Ratio on Emissions

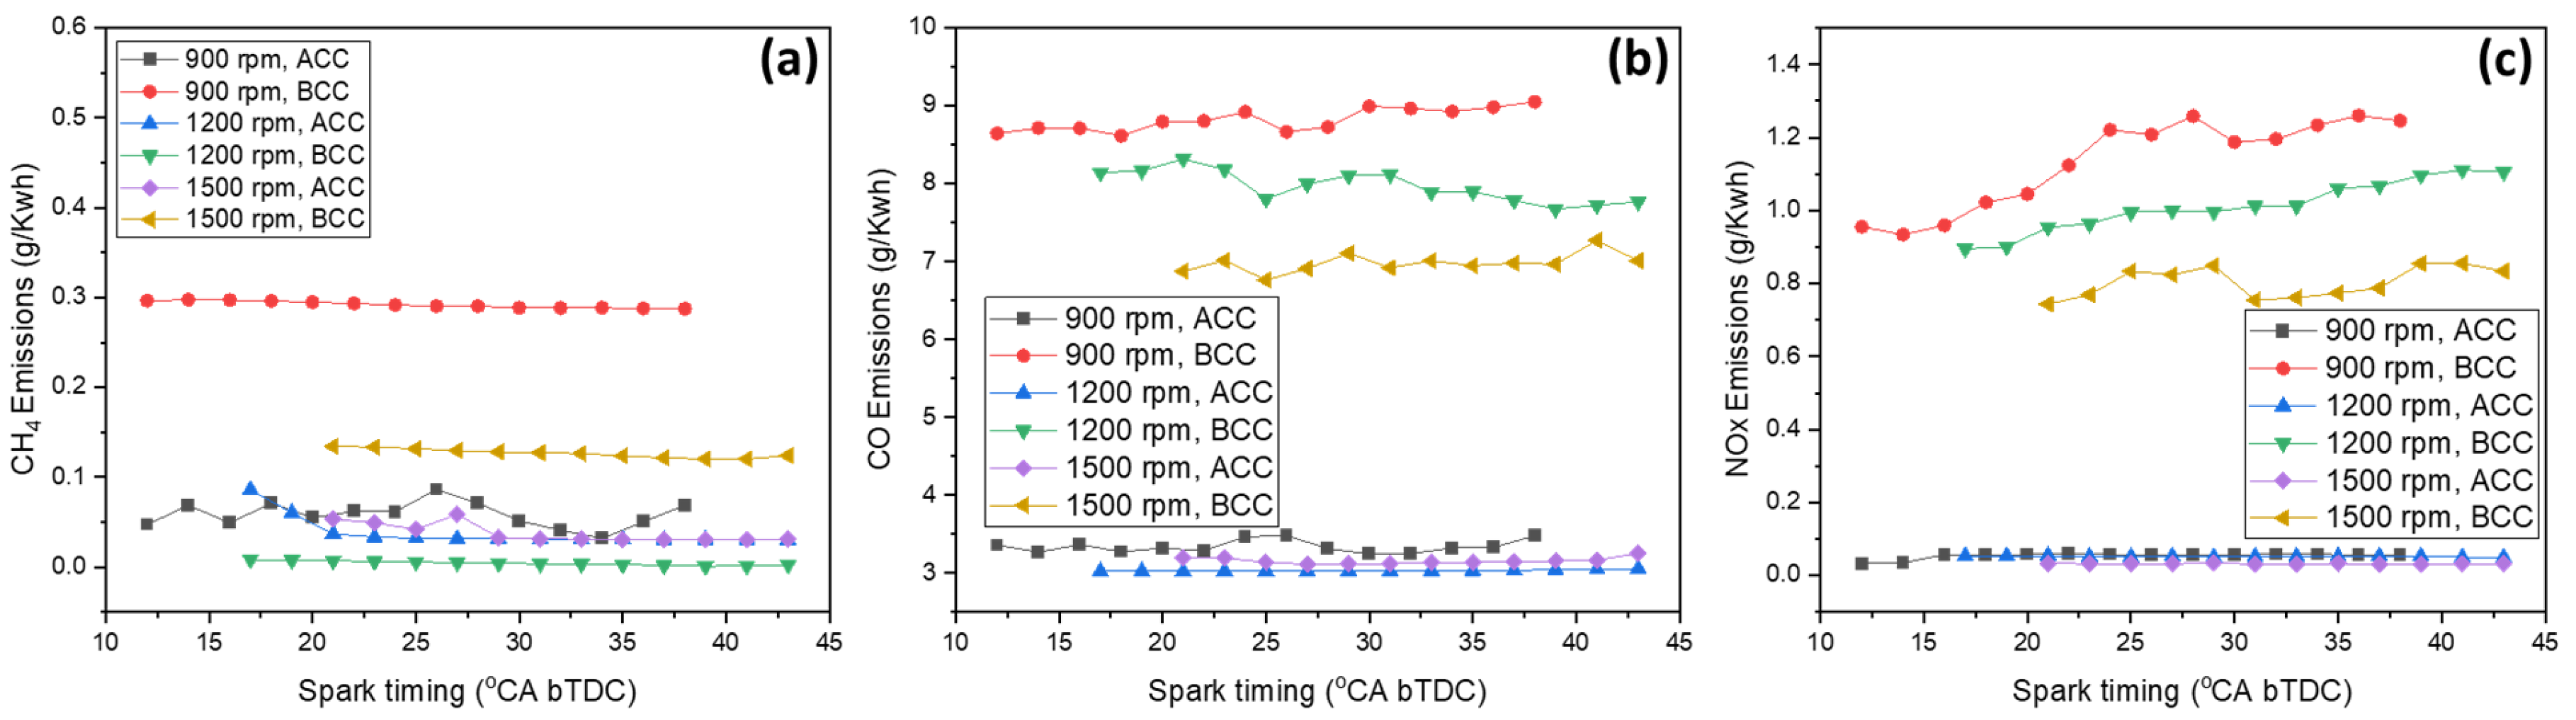
Figure 9 illustrates the effect of varying EGR ratios on emissions at 900 rpm, 30% load, and under different spark timing conditions for pure CNG. Figure 9a presents CH4 emissions, which increased with higher EGR rates due to reduced oxygen availability and lower in-cylinder temperatures, resulting in incomplete combustion. Before the TWC, CH4 emissions were 0.6695, 0.7034, and 0.7058 g/kWh for 0%, 6.6%, and 8.8% EGR, respectively, at 30 °CA bTDC. After the TWC, these values decreased but still exhibited a rising trend, measured at 0.0279, 0.0312, and 0.0555 g/kWh under the same test conditions. Moreover, PCC was used to examine the relationship between EGR and CH4 emissions. The effect of EGR (0%, 6.6%, 8.8%) on CH4 showed a strong positive correlation for BCC (0.9701), while ACC showed a moderately positive correlation (0.5584), as illustrated in Figure 8a. These results indicate that higher EGR levels generally lead to increased CH4 emissions, with a more pronounced effect for BCC.
Figure 9b shows CO emissions under the same test conditions. EGR can affect CO emissions depending on the rate applied. At moderate levels, it may slightly reduce CO formation by lowering peak temperatures and enhancing CO2 stability; however, excessive EGR often leads to incomplete combustion, resulting in elevated CO emissions. Before the TWC, CO emissions at 30 °CA bTDC were 8.9694, 8.4119, and 7.8497 g/kWh for 0%, 6.6%, and 8.8% EGR, respectively, at 30% load. After the TWC, emissions decreased overall compared to untreated exhaust, although a slight upward trend was observed, with values of 3.1144, 3.4592, and 3.0736 g/kWh under the same operating conditions. Moreover, Figure 8b shows that the effect of EGR dilution exhibits strong negative correlations for both BCC (−0.8895) and ACC (−0.6052), indicating reduced CO emissions with increasing EGR ratios, with a stronger effect observed before the catalytic converter.
Figure 9c depicts NOx emissions, which consistently decreased with increasing EGR ratios due to reduced combustion temperatures and oxygen dilution. At 30% load and 30 °CA bTDC, NOx emissions before the TWC were 2.010, 1.479, and 1.0928 g/kWh for 0%, 6.6%, and 8.8% EGR, respectively. After the TWC, these emissions dropped significantly to 0.0568, 0.0918, and 0.0306 g/kWh under the same conditions. The effect of EGR dilution showed very strong negative correlations for both BCC (−0.9407) and ACC (−0.7630), as shown in Figure 8c, indicating a substantial reduction in NOx emissions with increasing EGR, with the effect being more pronounced before the TWC.
The above results demonstrate that increasing the EGR ratio in a CNG-fueled engine reduces GHGs such as CO and NOx by lowering in-cylinder temperature and oxygen availability. EGR achieves this by diluting the intake charge with inert exhaust gases, which slightly slows the combustion rate, reduces oxygen concentration, and limits heat release. This process suppresses NOx formation and minimizes thermal stresses. The presence of hydrogen in the HCNG blend compensates for the slower burn rate caused by EGR, ensuring stable and complete combustion. Consequently, less fuel is required for the same power output, leading to lower carbon emissions. A three-way catalytic converter significantly mitigates overall GHG emissions by oxidizing UHC and CO under the same operating conditions. These findings are comparable to trends documented in previous studies [50,51,52].

3.2.3. Effect of Engine Speed on Emissions

Figure 10a presents CH4 emissions at three engine speeds (900, 1200, and 1500 rpm) under 30% load for HCNG20% fuel with varying EGR ratios. At 29 °CA bTDC, CH4 emissions were relatively higher at 900 rpm (0.2885 g/kWh) due to incomplete combustion, while they decreased at 1200 rpm (0.00432 g/kWh) and 1500 rpm (0.1282 g/kWh) as combustion efficiency improved. These values were recorded before the TWC. After the TWC, CH4 emissions decreased further to 0.0514, 0.0137, and 0.0331 g/kWh under the same operating conditions and spark timing. The effect of engine speed showed negative correlations of −0.5875 (BCC) and −0.5107 (ACC), as illustrated in Figure 8a. CH4 emissions decreased at medium engine speeds due to improved turbulence and combustion efficiency, but increased again at higher speeds as reduced residence time limited complete methane oxidation.
Figure 10b shows CO emissions under the same engine speeds, load, and EGR conditions for HCNG20% fuel. CO emissions decreased with increasing engine speed due to better air-fuel mixing, further supported by hydrogen addition and EGR. At 29 °CA bTDC, before the TWC, CO emissions were 8.9971, 8.1194, and 6.9205 g/kWh at 900, 1200, and 1500 rpm, respectively. After the catalytic converter, CO emissions were further reduced to 3.2435, 3.0270, and 3.1228 g/kWh under the same test conditions. As shown in Figure 8b, the effect of engine speed presented very strong negative correlations (BCC: −0.9772, ACC: −0.5626), indicating that CO emissions decreased significantly with increasing speed, especially before the TWC.
Figure 10c shows NOx emissions under the same test conditions as Figure 10a. NOx emissions decreased with increasing engine speed due to shorter combustion duration and reduced residence time at high temperatures, aided by the moderating effects of hydrogen addition and EGR on peak in-cylinder temperatures. At 29 °CA bTDC, before the TWC, NOx emissions were 1.2585, 0.9966, and 0.8491 g/kWh at 900, 1200, and 1500 rpm, respectively. After the TWC, these values further declined to 0.0561, 0.0502, and 0.0348 g/kWh under the same operating conditions and crank angle. The effect of engine speed also showed negative correlations (BCC: −0.8357, ACC: −0.7891), indicating that increasing speed tended to reduce NOx emissions (see Figure 8c).
Based on the results in Figure 9, CH4 emissions increased at higher engine speeds, while CO and NOx emissions generally decreased, primarily due to enhanced turbulence and combustion efficiency at higher speeds. The presence of hydrogen in the HCNG blend further supports rapid ignition and stable combustion at higher speeds, compensating for reduced residence time. As a result, combustion efficiency increases and carbon-based emissions decrease per unit of energy output. The TWC further mitigated GHGs by oxidizing residual CO and unburned hydrocarbons under similar operating conditions. These findings are consistent with previously reported trends [22,35,50].

3.2.4. Effect of Engine Load on Emissions

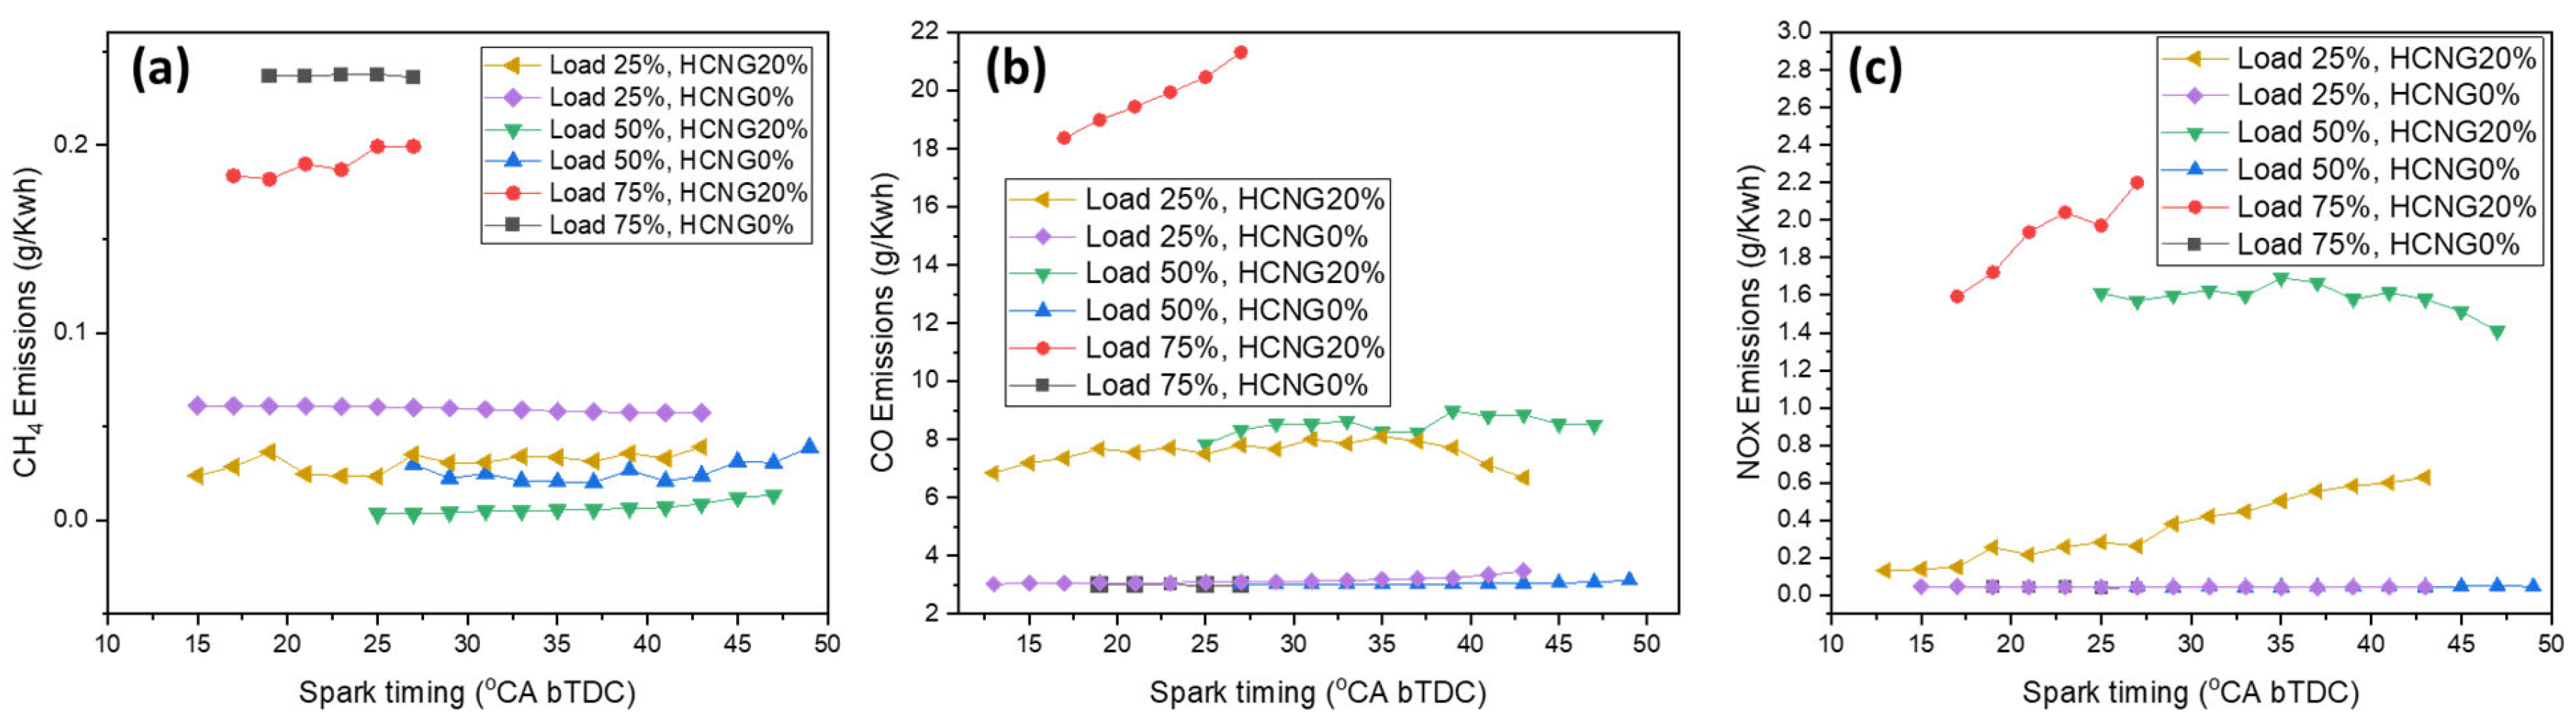
Figure 11a shows the CH4 emission trends at 1200 rpm for both HCNG0% and HCNG20% fuel blends under 25%, 50%, and 75% load conditions. For HCNG20%, before the TWC, CH4 emissions increased from 0.0350 g/kWh to 0.1994 g/kWh as load changed from 25% to 75% at 27 °CA bTDC. In comparison, for HCNG0%, after the TWC, CH4 emissions were 0.0601 g/kWh and 0.2362 g/kWh under the same load and ignition timing. As illustrated in Figure 8a, PCC results showed positive correlations of 0.6893 (BCC) and 0.6248 (ACC), indicating that CH4 emissions tended to increase as engine load increased in both cases.
Figure 11b presents CO emissions under the same engine speed and load conditions as above. CO emissions increased with load for both fuel types due to richer air/fuel mixtures and reduced oxygen availability. For HCNG20%, before the TWC, CO emissions were 7.8054, 8.3230, and 21.3282 g/kWh at 25%, 50%, and 75% loads, respectively, at 27 °CA bTDC. In contrast, for HCNG0%, after the TWC, CO emissions were 3.1079, 3.0205, and 2.9794 g/kWh under the same load and spark timing. As shown in Figure 8b, the PCC analysis revealed a strong positive correlation for BCC (0.8478) but a negative correlation for ACC (−0.6070), suggesting that load increases elevated CO before the three-way catalytic converter but reduced it after.
Figure 11c shows NOx emissions increasing with load due to richer air/fuel mixtures and reduced oxygen availability. For HCNG20%, before the TWC, NOx emissions were 0.2626, 1.5695, and 2.2008 g/kWh at 25%, 50%, and 75% loads, respectively, at 27 °CA bTDC. After the TWC, a significant reduction was recorded; for instance, NOx decreased by approximately 84% at 25% load under the same ignition timing. For HCNG0%, after the TWC, NOx emissions were 0.0418, 0.0441, and 0.0405 g/kWh under the same test conditions. The PCC results showed strong positive correlations for BCC (0.9297) and a weak negative correlation for ACC (−0.1015), as given in Figure 8c, indicating that while load strongly increased NOx before the catalytic converter, the relationship became minimal and slightly negative after catalyst operation.
Overall, the results in Figure 11 indicate that GHG emissions increased with engine load. At higher loads, the in-cylinder temperature and pressure rise, promoting faster and more complete oxidation of fuel components. The presence of hydrogen in the HCNG blend enhances flame speed and ensures stable combustion, minimizing unburned CH4 and CO emissions. Since engine efficiency improves with load, less fuel energy is wasted as heat, leading to lower carbon emissions per unit of power produced. Overall, moderate-to-high load operation in HCNG engines achieves more efficient combustion and lowers total CO and CH4 emissions compared to low-load conditions. The TWC effectively reduced NOx emissions and promoted CO conversion, thereby altering the load–emission relationship observed in ACC compared to BCC. These results align with previously reported trends [35,44,50].

3.2.5. CO2-Equivalent Emissions

The Intergovernmental Panel on Climate Change (IPCC) defines the global warming potential (GWP) of major greenhouse gases, such as CO2, CH4, and N2O, relative to CO2, which has a reference value of 1. In this study, GWP100 values of 27.9 for CH4 [53], 2.1 for CO as an indirect greenhouse gas [54,55], and 7–10 for NOx [14,56] are adopted based on established literature.
C O 2 e q = ∑ E i × GWP i
CO2-equivalent ( C O 2 e q ) emissions are calculated by multiplying the emission amount of each gas ( E i , g/kWh) by its respective GWP100 value. The resulting C O 2 e q expresses the total greenhouse gas impact as the equivalent mass of CO2 that would produce the same warming effect (g C O 2 e q /kWh) [56].
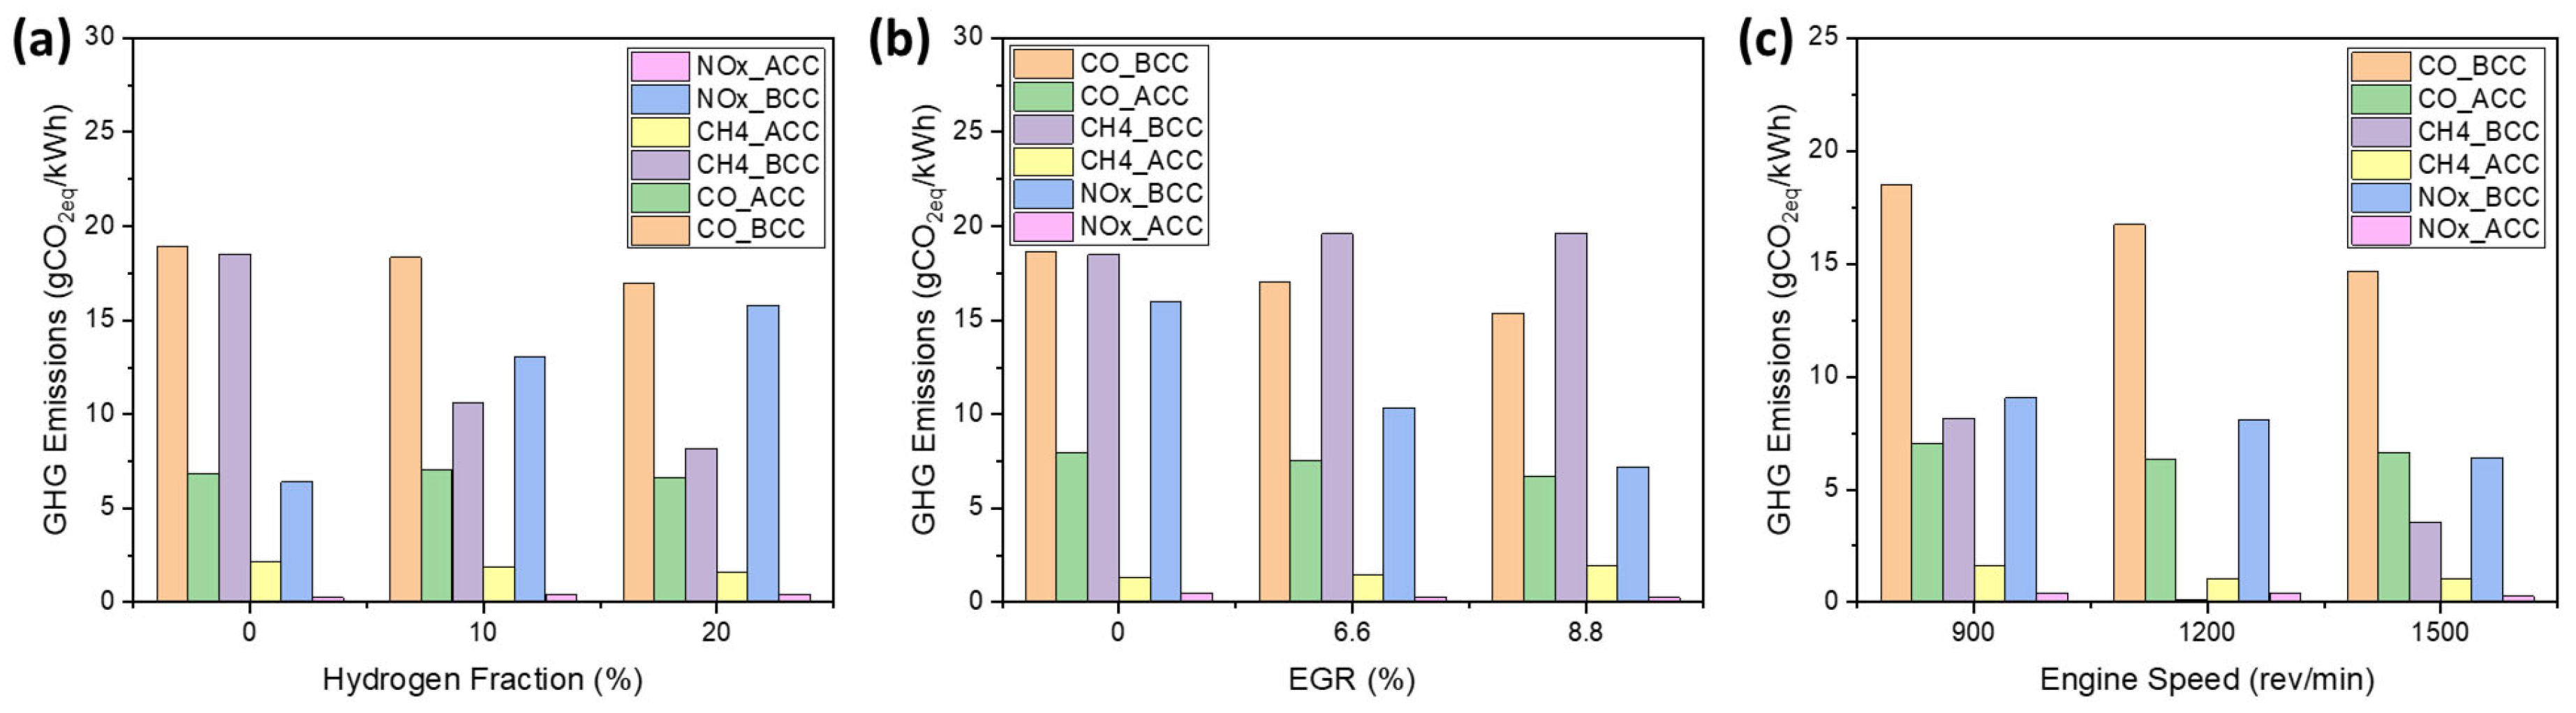
Figure 12 presents the C O 2 e q emissions of CO, CH4, and NOx before and after the three-way catalytic converter (TWC). These values incorporate the respective GWP100 factors; therefore, the results reflect the relative climate-forcing intensities of each emission.
Figure 12a shows that increasing the hydrogen fraction (0–20%) with the TWC significantly influences C O 2 e q emissions. Before the TWC, the C O 2 e q emissions for HCNG0% and HCNG20% are 18.937 and 16.963 g C O 2 e q /kWh for CO, 18.519 and 8.149 g C O 2 e q /kWh for CH4, and 6.406 to 15.809 g C O 2 e q /kWh for NOx. Under the same operating conditions, the emissions after the TWC decrease substantially, ranging from 6.822 to 6.354 g C O 2 e q /kWh for CO, 2.138 to 1.626 g C O 2 e q /kWh for CH4, and 0.258 to 0.441 g C O 2 e q /kWh for NOx at an engine speed of 900 rpm and a load of 30%. For the same scenario as described above, the reductions in C O 2 e q emissions at HCNG20% after the TWC were 60.77%, 80.46%, and 97.20% for CO, CH4, and NOx, respectively.
In Figure 12b, the effects of EGR variation on C O 2 e q emissions for HCNG0% before and after the TWC are presented. Before the TWC, the C O 2 e q emissions for EGR 0% and EGR 8.8% are 18.670 and 15.384 g C O 2 e q /kWh for CO, 18.491 and 19.630 g C O 2 e q /kWh for CH4, and 16.015 to 7.207 g C O 2 e q /kWh for NOx. Under the same operating conditions, the emissions after the TWC decrease substantially, ranging from 7.948 to 6.665 g C O 2 e q /kWh for CO, 1.325 to 1.964 g C O 2 e q /kWh for CH4, and 0.462 to 0.243 g C O 2 e q /kWh for NOx at an engine speed of 900 rpm and a load of 30%. For this scenario, the reductions in C O 2 e q emissions at 8.8% EGR after the TWC were 56.67%, 89.99%, and 96.62% for CO, CH4, and NOx, respectively.
Figure 12c presents the impact of engine speed (900, 1200, and 1500 rpm) on C O 2 e q emissions for HCNG20% before and after the TWC. Before the TWC, the C O 2 e q emissions at 900 rpm and 1500 rpm are 18.531 and 14.663 g C O 2 e q /kWh for CO, 8.149 and 3.536 g C O 2 e q /kWh for CH4, and 9.057 to 6.426 g C O 2 e q /kWh for NOx. Under the same operating conditions, the emissions after the TWC decrease substantially, ranging from 7.013 to 6.627 g C O 2 e q /kWh for CO, 1.626 to 1.053 g C O 2 e q /kWh for CH4, and 0.429 to 0.258 g C O 2 e q /kWh for NOx at a load of 30%. For this scenario, the reductions in C O 2 e q emissions at 900 rpm after the TWC were 62.15%, 80.04%, and 95.26% for CO, CH4, and NOx, respectively.
It is important to note that the CO emitted from HCNG combustion contributes indirectly to GHG emissions. Even though CO emissions decrease with hydrogen enrichment, the remaining CO emissions still influence the total C O 2 e q calculated in this study. To reflect this impact accurately, CO emissions were converted to C O 2 e q values using standard IPCC characterization factors and are incorporated into the GHG analysis presented in the Abstract and Section 3.1.2.

3.3. Prediction Results

Emissions were predicted by splitting the dataset into training (80%) and testing (20%) sets, and by applying Gaussian Process Regression with four different kernels as described in Section 2.2.

3.3.1. CH4 Emissions Prediction

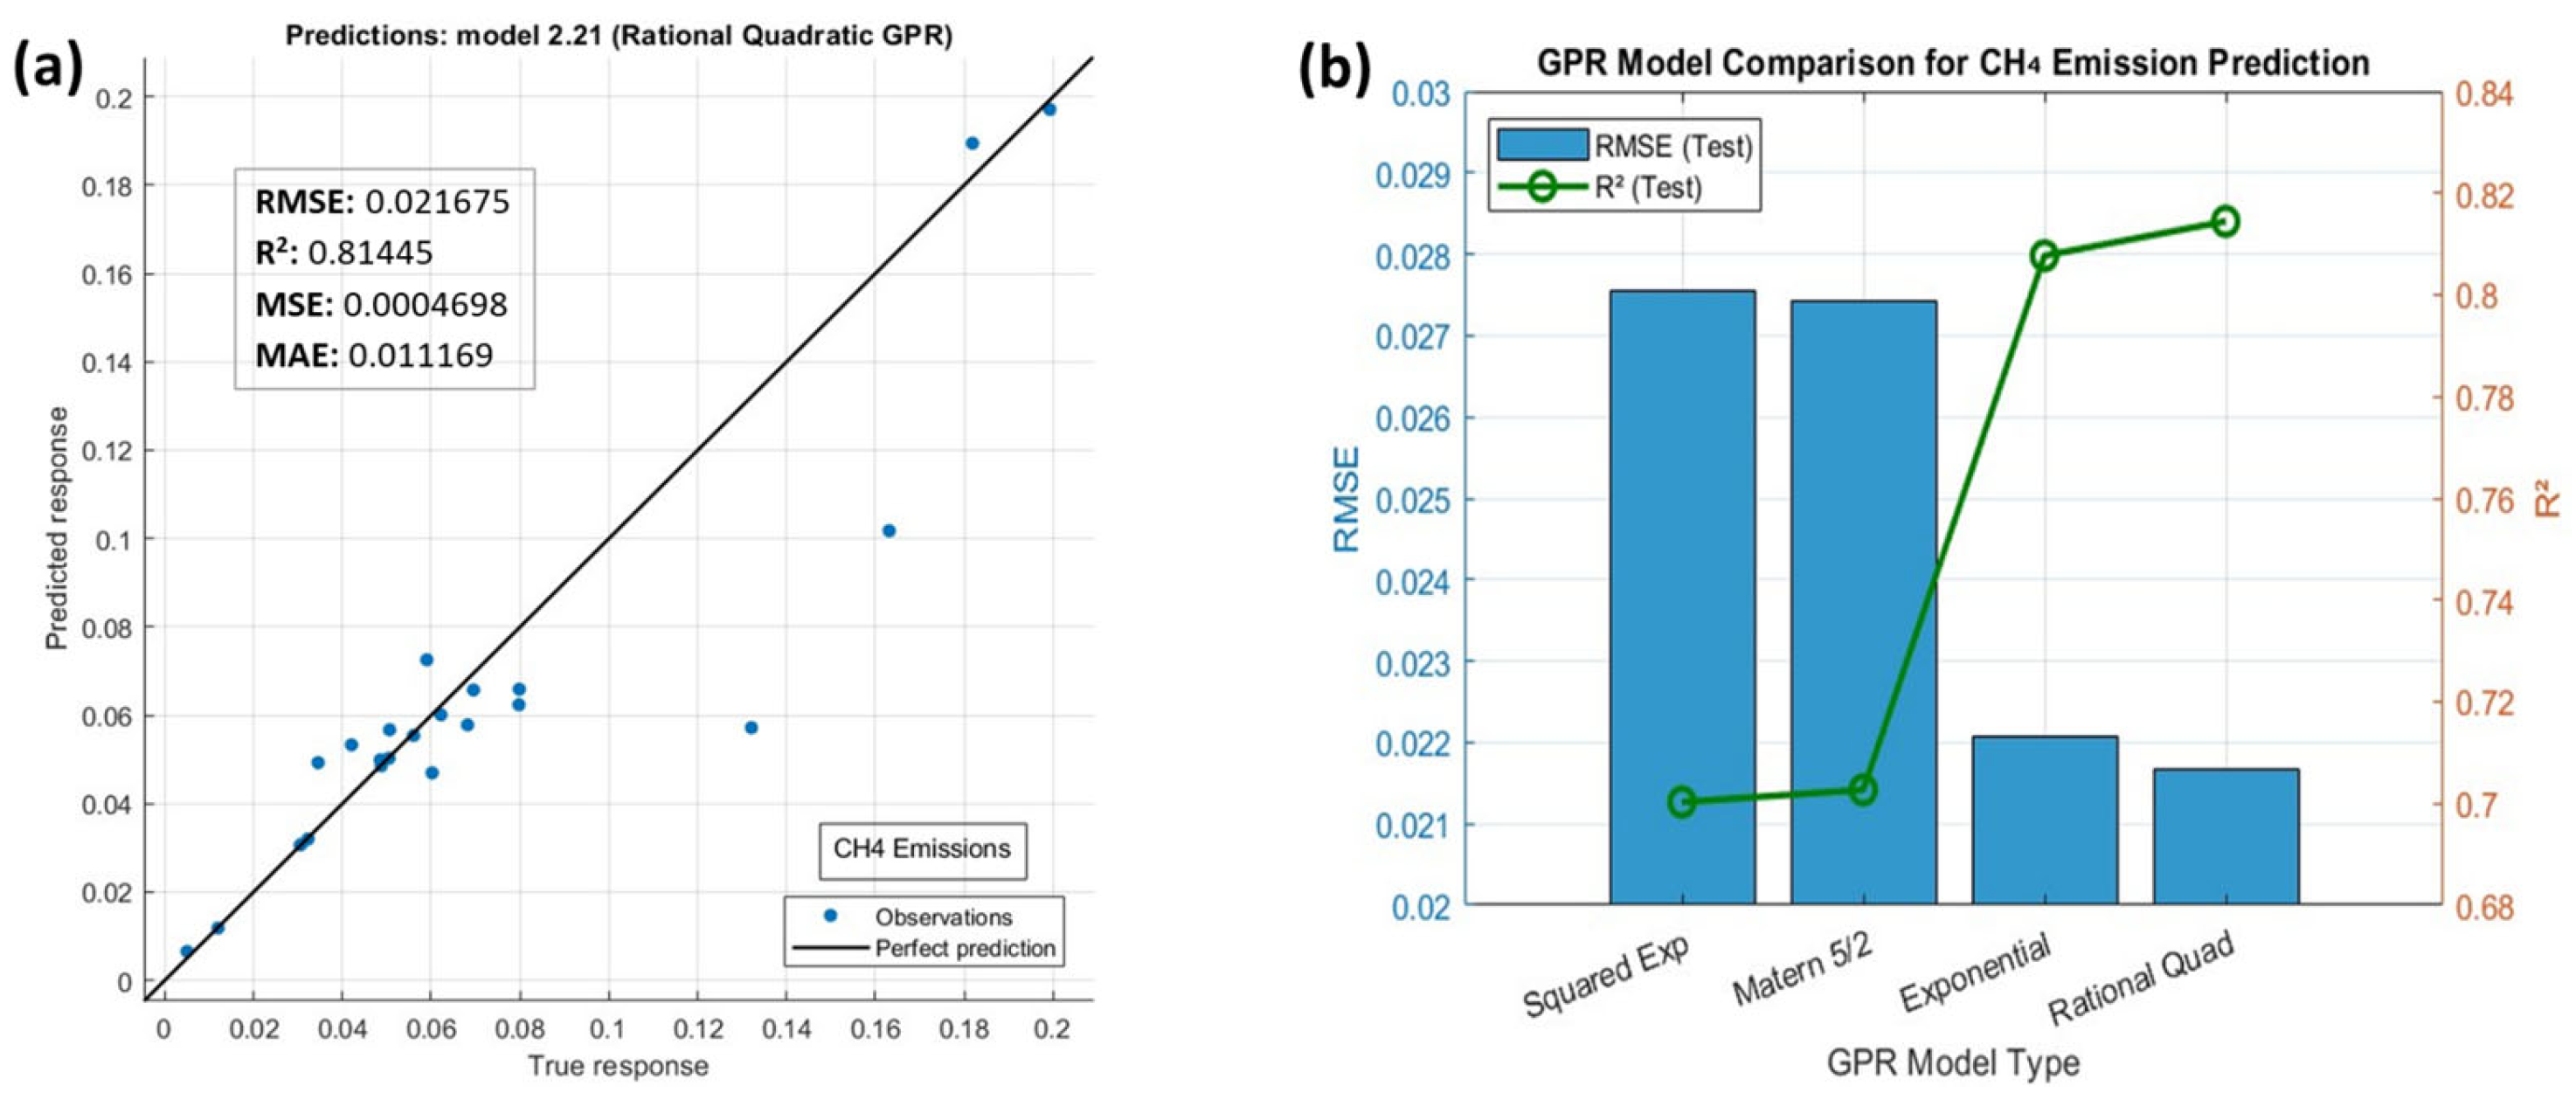
To predict CH4 emission data, GPR kernel models were applied and evaluated using standard statistical metrics, including RMSE, MSE, MAE, and R2. Among them, the Rational Quadratic kernel demonstrated the best predictive performance, achieving the lowest test RMSE (0.021675) and the highest R2 (0.81445), indicating high accuracy and reliability, as illustrated in Figure 13a. The Exponential kernel also showed comparable performance, with a test RMSE of 0.022067 and a slightly lower R2 value of 0.80768, suggesting a marginally reduced model fit, as shown in Figure 13b. In contrast, the Squared Exponential and Matern 5/2 kernels yielded higher RMSE values and lower R2, indicating weaker predictive consistency, as presented in Table 5. Based on these findings, the Rational Quadratic kernel is considered the most suitable for CH4 emission prediction in this analysis.

3.3.2. CO Emissions Prediction

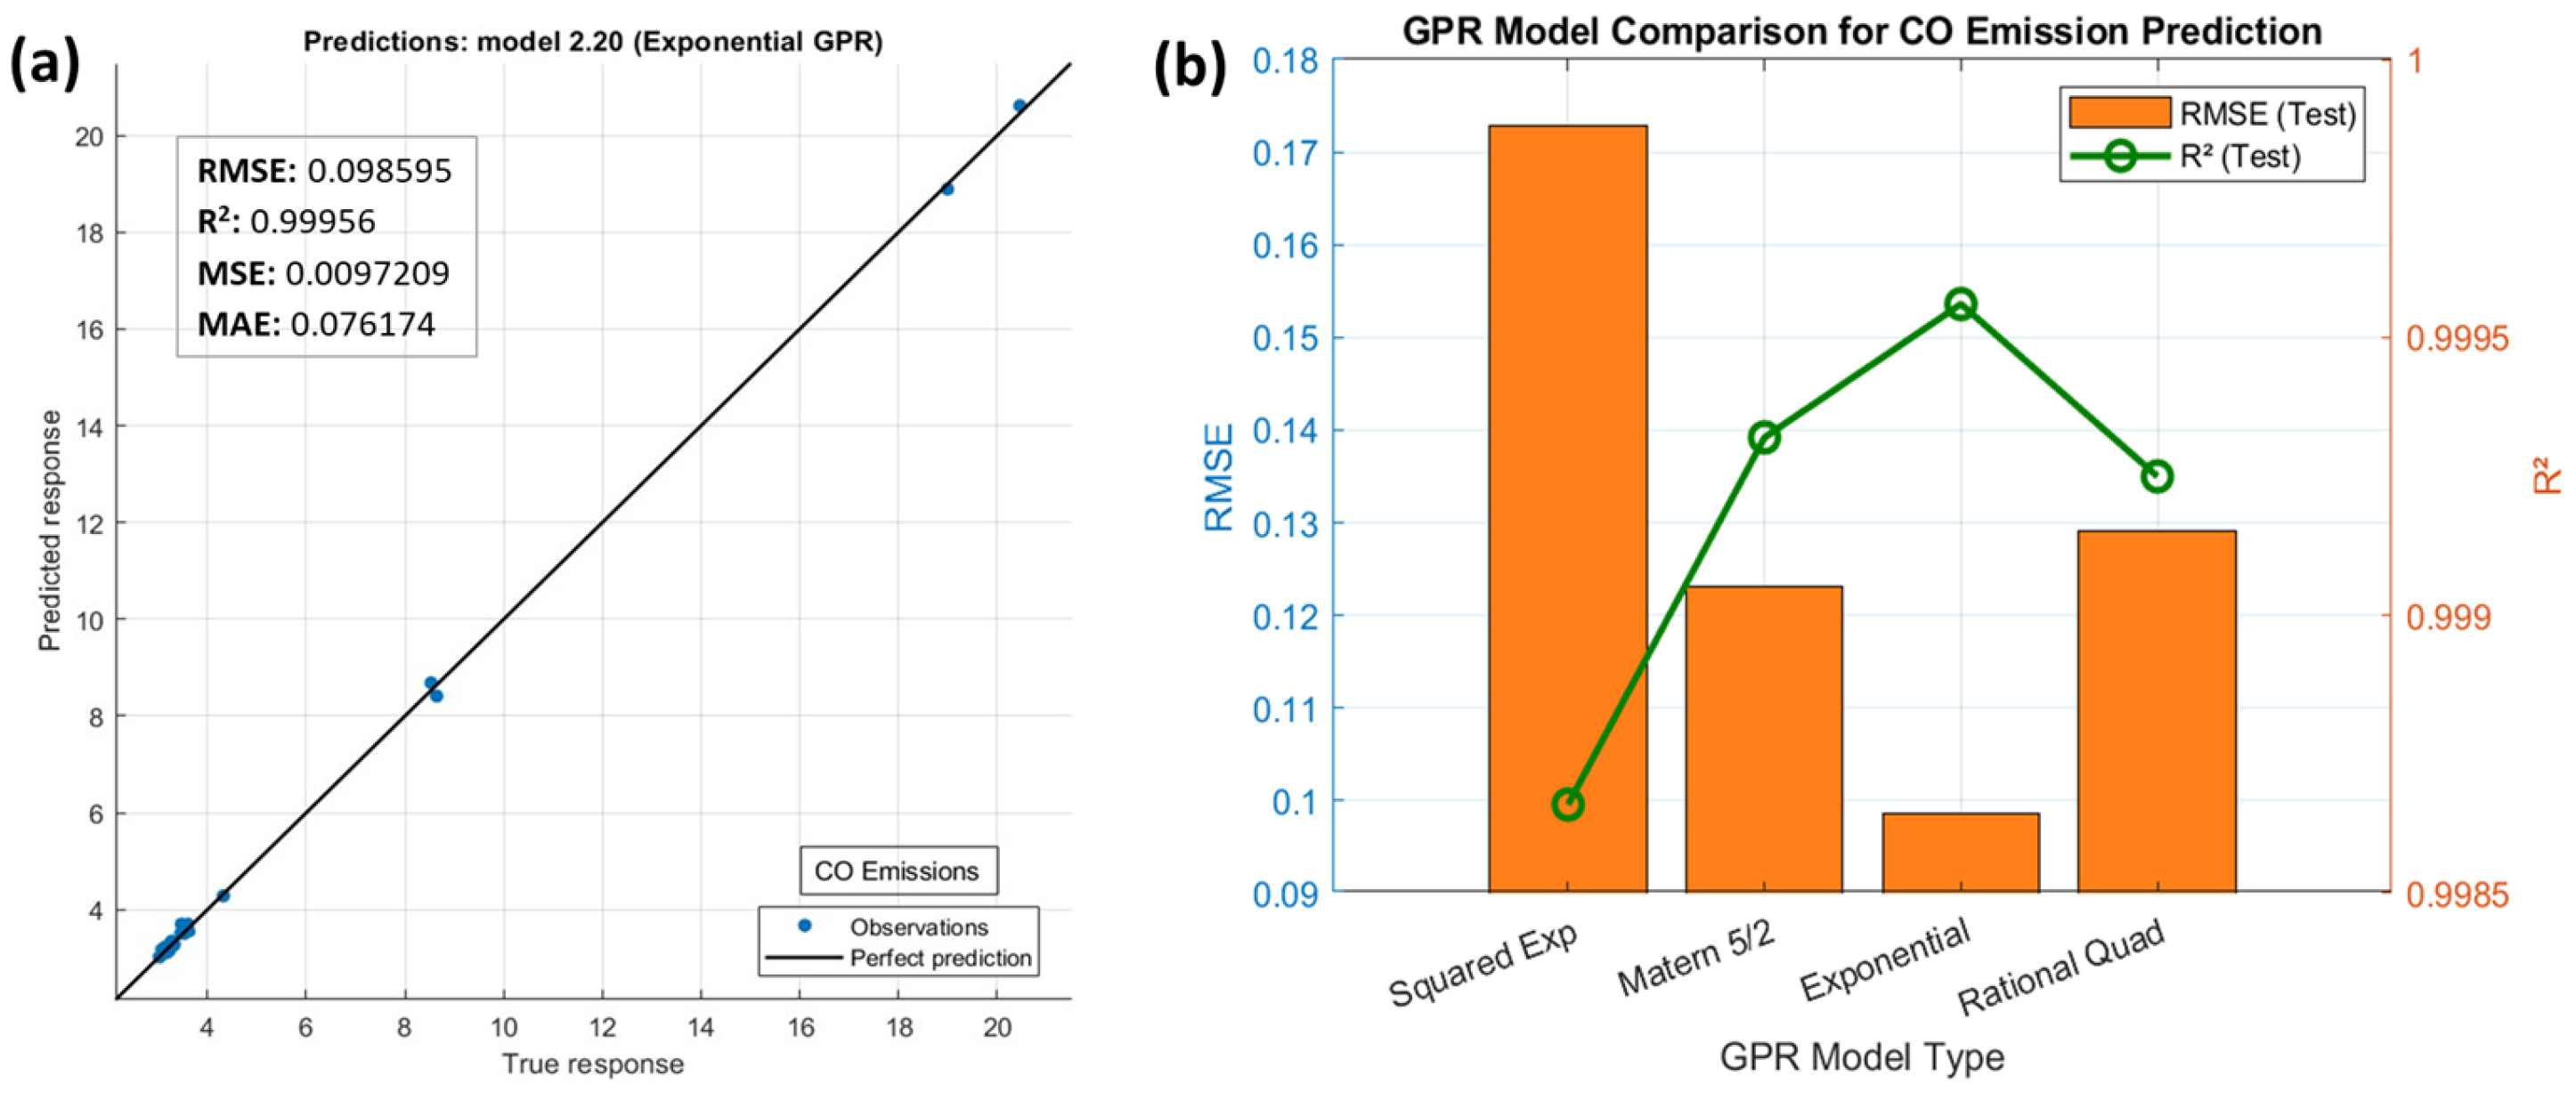
As illustrated in Figure 14, the Exponential kernel demonstrated the best performance for CO emission prediction, achieving the lowest test RMSE (0.098595) and the highest R2 value (0.99956), reflecting a strong model fit. Although the Matern 5/2 kernel showed slightly better validation performance and a competitive test RMSE of 0.12318, its R2 value was marginally lower (0.99932). In contrast, the Squared Exponential and Rational Quadratic kernels resulted in higher RMSEs and slightly reduced R2 values, indicating less reliable predictions, as presented in Table 5. Based on these results, the Exponential kernel is considered the most appropriate for CO emission prediction in this analysis.

3.3.3. NOx Emissions Prediction

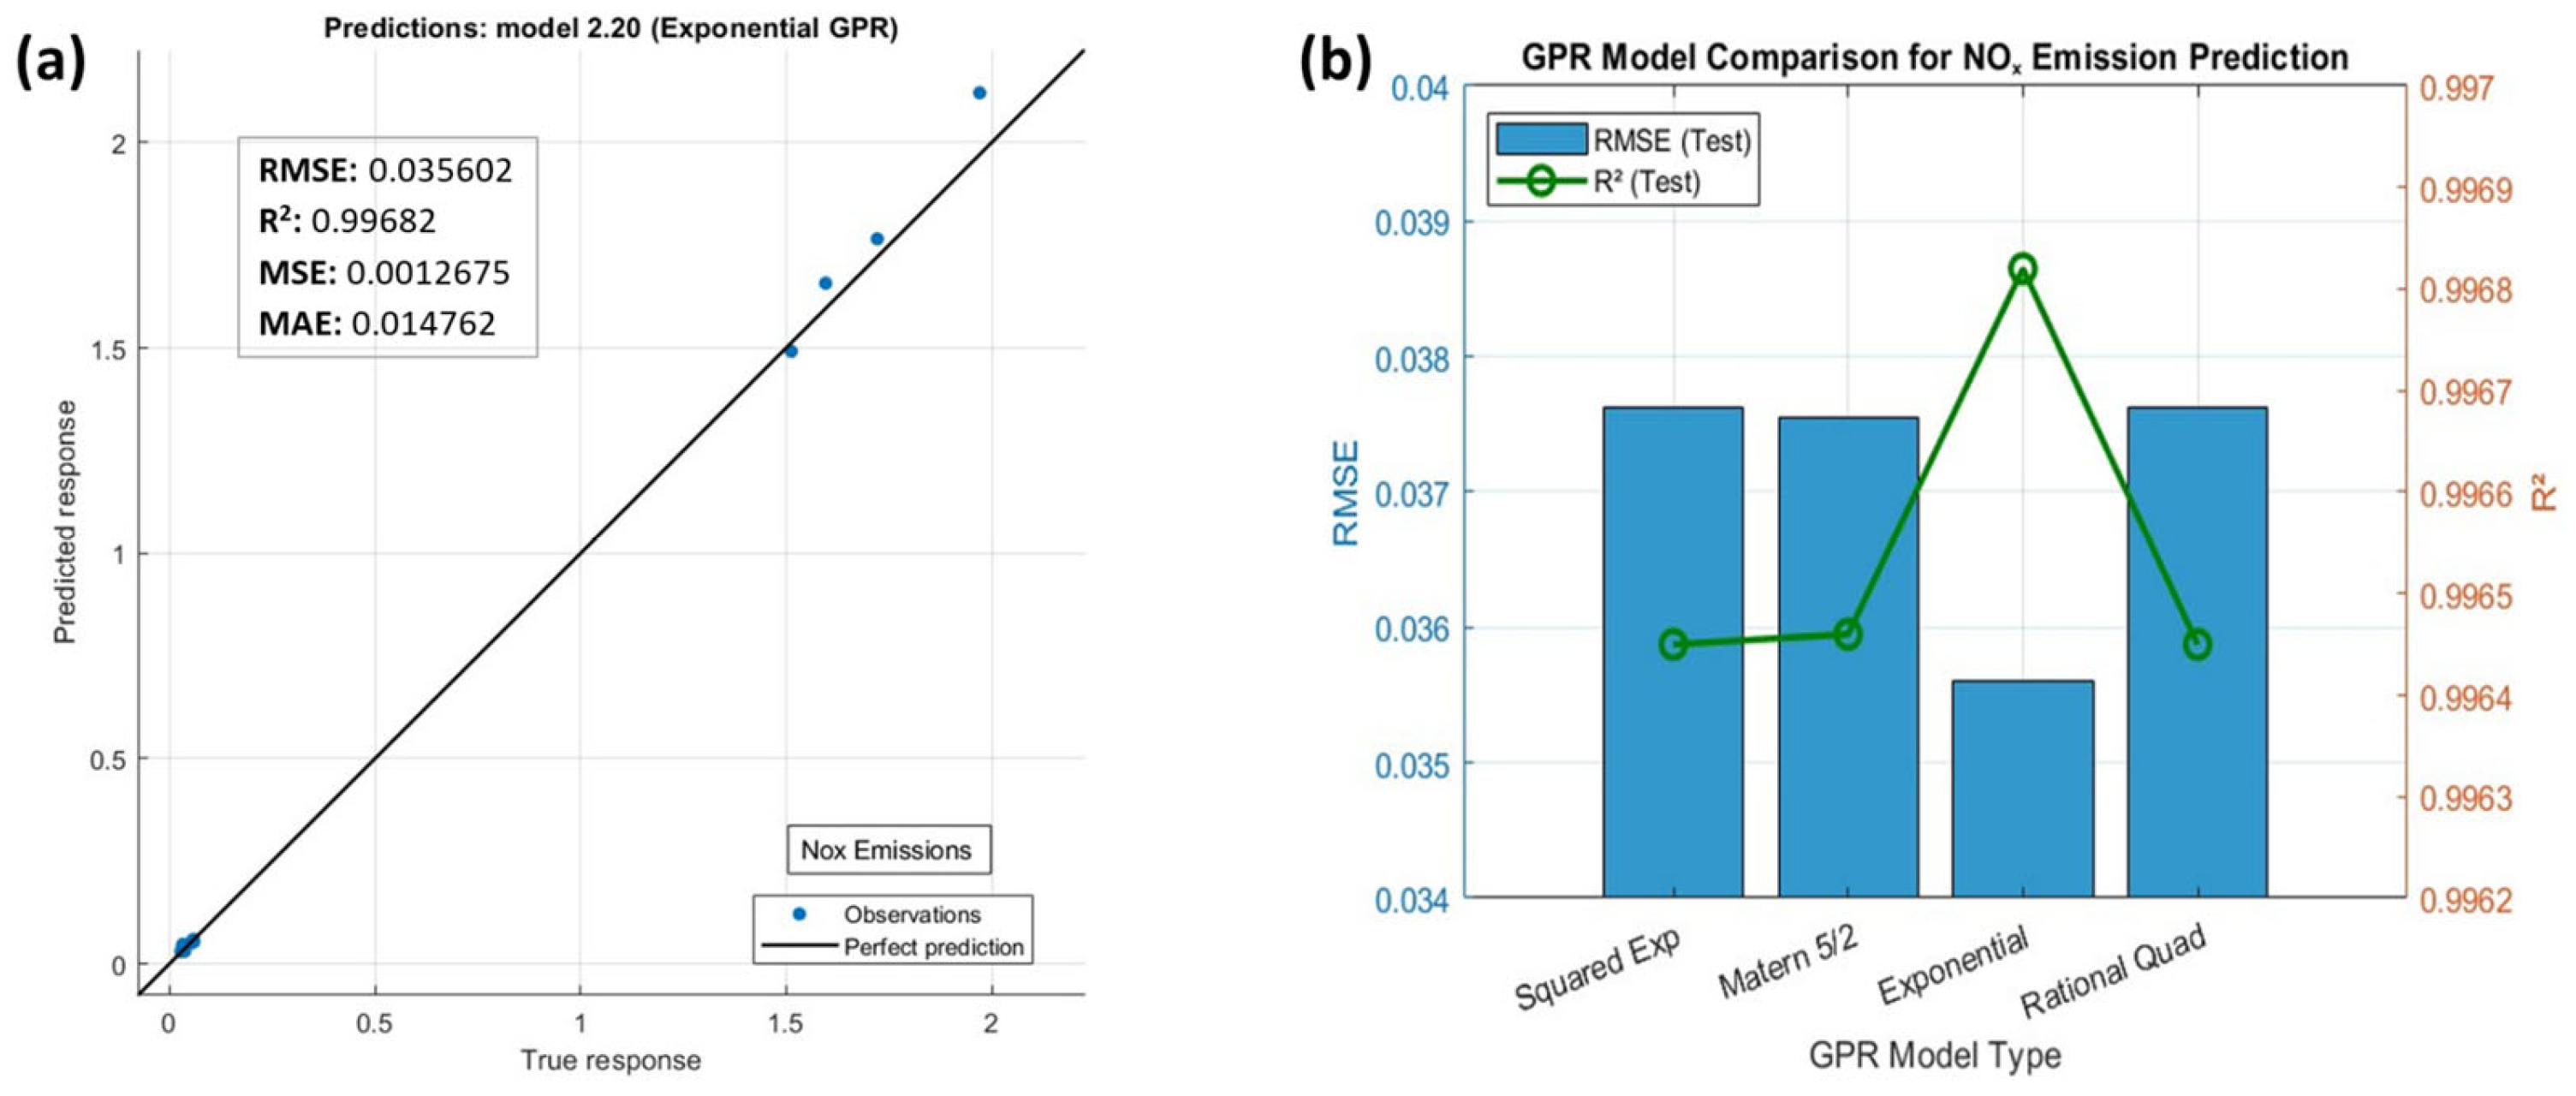
As shown in Figure 15, the Exponential kernel yielded the best performance for NOx emission prediction, with the lowest RMSE (0.035602) and highest R2 (0.99682) on the test data. The Squared Exponential and Rational Quadratic kernels demonstrated identical results, each recording an RMSE of 0.03762 and an R2 of 0.99645, reflecting strong prediction accuracy. The Matern 5/2 kernel exhibited slightly higher errors but maintained reliable predictive capability, as illustrated in Table 5. These findings confirm the effectiveness of the Exponential kernel for modeling NOx emissions across varying engine conditions.

4. Conclusions

This study confirms that hydrogen enrichment in HCNG-fueled engines can significantly reduce greenhouse gas emissions and supports the growing potential of HCNG mixtures as a transitional fuel for low-emission internal combustion engines. The observed trends indicate that optimizing hydrogen fraction, engine operating conditions, and aftertreatment integration can play a significant role in reducing the climate impact of heavy-duty transport applications. The predictive capability of the GPR-based modeling approach further demonstrates its suitability for real-time emission estimation and control, offering opportunities for advanced combustion management strategies in future engine platforms.
The findings also highlight the need for the proper balancing of hydrogen content and EGR ratios to ensure emission reductions. As HCNG engines continue to be developed for practical applications, further research is required to integrate hydrogen enrichment with adaptive control systems, high-efficiency catalytic converters, and optimized dilution strategies. Overall, this study highlights the relevance of hydrogen-enriched natural gas as a viable pathway toward cleaner heavy-duty engine operation, while underscoring the need for continued investigation to fully enable its practical implementation in low-emission transportation systems. Water vapor emissions were not considered in the present study, which represents a limitation. Future work will include the quantification and evaluation of water vapor emissions to provide a more comprehensive assessment of the environmental impacts of HCNG combustion.

Author Contributions

Conceptualization, H.A.S., M.F., G.Z., T.C., M.I.S., A.R. and F.M.; Methodology, H.A.S., M.F., M.I.S., A.R. and F.M.; Software, H.A.S. and M.I.S.; Validation, H.A.S., A.R. and F.M.; Formal analysis, H.A.S., M.F., G.Z., T.C., M.I.S., A.R., L.J., X.L. and F.M.; Investigation, H.A.S., G.Z., L.J., X.L. and F.M.; Resources, H.A.S., T.C., X.L. and F.M.; Data curation, H.A.S. and F.M.; Writing—original draft, H.A.S. and M.F.; Writing—review & editing, H.A.S., M.F. and M.I.S.; Visualization, L.J. and X.L.; Supervision, F.M.; Project administration, F.M.; Funding acquisition, F.M. All authors have read and agreed to the published version of the manuscript.

Funding

This research was funded by the Major Science and Technology Project of the Inner Mongolia Autonomous Region, China (No. 2021ZD0025), and the Zhongyuan Electric Laboratory Project (No. ZN20241103).

Data Availability Statement

The original contributions presented in this study are included in the article. Further inquiries can be directed to the corresponding authors.

Conflicts of Interest

Author L.J. was employed by Beijing Hydrogen Energy Technology Co., Ltd. during conduction of this study. All authors declare that the research was conducted in the absence of any commercial or financial relationships that could be construed as potential conflicts of interest.

References

  1. Fayyazbakhsh, A.; Bell, M.L.; Zhu, X.; Mei, X.; Koutný, M.; Hajinajaf, N.; Zhang, Y. Engine emissions with air pollutants and greenhouse gases and their control technologies. J. Clean. Prod. 2022, 376, 134260. [Google Scholar] [CrossRef] [Scilit]
  2. Molina, S.; Novella, R.; Gomez-Soriano, J.; Olcina-Girona, M. Study on hydrogen substitution in a compressed natural gas spark-ignition passenger car engine. Energy Convers. Manag. 2023, 291, 117259. [Google Scholar] [CrossRef] [Scilit]
  3. Khan, M.A.H.; Brierley, J.; Tait, K.N.; Bullock, S.; Shallcross, D.E.; Lowenberg, M.H. The emissions of water vapour and NOx from modelled hydrogen-fuelled aircraft and the impact of NOx reduction on climate compared with kerosene-fuelled aircraft. Atmosphere 2022, 13, 1660. [Google Scholar] [CrossRef] [Scilit]
  4. Gong, C.; Li, Z.; Sun, J.; Liu, F. Evaluation on combustion and lean-burn limitof a medium compression ratio hydrogen/methanol dual-injection spark-ignition engine under methanol late-injection. Appl. Energy 2020, 277, 115622. [Google Scholar] [CrossRef] [Scilit]
  5. Wang, M.-H.S.; Wang, L.K. Pollutants, Technologies, and Terminologies for Emission Control in Transportation Industry. In Control of Heavy Metals in the Environment; CRC Press: Boca Raton, FL, USA, 2025; pp. 613–634. [Google Scholar]
  6. Jain, C.D.; Singh, V.; Raj, S.A.; Madhavan, B.; Ratnam, M.V.J.A.E. Local emission and long-range transport impacts on the CO, CO2, and CH4 concentrations at a tropical rural site. Atmos. Environ. 2021, 254, 118397. [Google Scholar] [CrossRef] [Scilit]
  7. Brusseau, M.; Matthias, A.; Comrie, A.; Musil, S. Atmospheric pollution. In Environmental and Pollution Science; Elsevier: Amsterdam, The Netherlands, 2019; pp. 293–309. [Google Scholar]
  8. Chen, J.G.; Crooks, R.M.; Seefeldt, L.C.; Bren, K.L.; Bullock, R.M.; Darensbourg, M.Y.; Holland, P.L.; Hoffman, B.; Janik, M.J.; Jones, A.K.J.S. Beyond fossil fuel–driven nitrogen transformations. Science 2018, 360, eaar6611. [Google Scholar] [CrossRef] [Scilit]
  9. Mahlia, T.; Lim, J.; Aditya, L.; Riayatsyah, T.; Pg Abas, A.; Nasruddin. Methodology for implementing power plant efficiency standards for power generation: Potential emission reduction. Clean Technol. Environ. Policy 2018, 20, 309–327. [Google Scholar] [CrossRef] [Scilit]
  10. Smith, C.; Nicholls, Z.R.; Armour, K.; Collins, W.; Forster, P.; Meinshausen, M.; Palmer, M.D.; Watanabe, M. The earth’s energy budget, climate feedbacks, and climate sensitivity supplementary material. In Climate Change. IPCC Sixth Assessment Report; IPCC: Geneva, Switzerland, 2021; pp. 1850–2005. [Google Scholar]
  11. Fuglestvedt, J.S.; Shine, K.P.; Berntsen, T.; Cook, J.; Lee, D.; Stenke, A.; Skeie, R.B.; Velders, G.; Waitz, I. Transport impacts on atmosphere and climate: Metrics. Atmos. Environ. 2010, 44, 4648–4677. [Google Scholar] [CrossRef] [Scilit]
  12. Skowron, A.; Lee, D.S.; De León, R.R. Variation of radiative forcings and global warming potentials from regional aviation NOx emissions. Atmos. Environ. 2015, 104, 69–78. [Google Scholar] [CrossRef] [Scilit]
  13. Fuglestvedt, J.; Isaksen, I.; Wang, W.-C. Estimates of indirect global warming potentials for CH4, CO and NOx. Clim. Change 1996, 34, 405–437. [Google Scholar] [CrossRef] [Scilit]
  14. Lammel, G.; Graßl, H. Greenhouse effect of NOX. Environ. Sci. Pollut. Res. 1995, 2, 40–45. [Google Scholar] [CrossRef] [Scilit]
  15. Ni, P.; Wang, X.; Li, H.J.F. A review on regulations, current status, effects and reduction strategies of emissions for marine diesel engines. Fuel 2020, 279, 118477. [Google Scholar] [CrossRef] [Scilit]
  16. Noor, C.M.; Noor, M.; Mamat, R. Biodiesel as alternative fuel for marine diesel engine applications: A review. Renew. Sustain. Energy Rev. 2018, 94, 127–142. [Google Scholar] [CrossRef] [Scilit]
  17. Shi, C.; Chai, S.; Wang, H.; Ji, C.; Ge, Y.; Di, L. An insight into direct water injection applied on the hydrogen-enriched rotary engine. Fuel 2023, 339, 127352. [Google Scholar] [CrossRef] [Scilit]
  18. Dhyani, V.; Subramanian, K.A. Subramanian, Control of backfire and NOx emission reduction in a hydrogen fueled multi-cylinder spark ignition engine using cooled EGR and water injection strategies. Int. J. Hydrogen Energy 2019, 44, 6287–6298. [Google Scholar] [CrossRef] [Scilit]
  19. Xu, P.; Ji, C.; Wang, S.; Bai, X.; Cong, X.; Su, T.; Shi, L. Realizing low NOx emissions on a hydrogen-fuel spark ignition engine at the cold start period through excess air ratios control. Int. J. Hydrogen Energy 2018, 43, 21617–21626. [Google Scholar] [CrossRef] [Scilit]
  20. Xu, P.; Ji, C.; Wang, S.; Bai, X.; Cong, X.; Su, T.; Shi, L. Realizing low emissions on a hydrogen-fueled spark ignition engine at the cold start period under rich combustion through ignition timing control. Int. J. Hydrogen Energy 2019, 44, 8650–8658. [Google Scholar] [CrossRef] [Scilit]
  21. Alrbai, M.; Qawasmeh, B.R.; Al-Hamamre, Z.; Sari, M.e.S.; Taamneh, Y. Impact of exhaust gas recirculation on performance and emissions of free-piston electrical generator fueled by DME. J. Energy Eng. 2018, 144, 04018027. [Google Scholar] [CrossRef] [Scilit]
  22. Shahid, M.I.; Farhan, M.; Rao, A.; Salam, H.A.; Chen, T.; Li, X.; Ma, F. Performance, emissions and thermodynamic analysis of hydrogen-enriched compressed natural gas engine. Therm. Sci. Eng. Prog. 2025, 63, 103643. [Google Scholar] [CrossRef] [Scilit]
  23. Udhayakumar, N.; Babu, S.R.; Bharathwaaj, R.; Sathyamurthy, R. An experimental study on emission characteristics in compression ignition engine with silver and zinc coated catalytic converter. Mater. Today Proc. 2021, 47, 4959–4964. [Google Scholar] [CrossRef] [Scilit]
  24. Kumar, K.; Kumar, N.; Singh, H. Comprehensive Review of Three Way Catalytic Converter. J. Adv. Res. Innov. Ideas Educ. 2017, 3, 1188–1196. Available online: https://www.researchgate.net/profile/Hardial-Singh/publication/335422101_Comprehensive_Review_of_Three_way_Catalytic_Converter/links/5d64fd95458515d610269d4a/Comprehensive-Review-of-Three-way-Catalytic-Converter.pdf (accessed on 12 July 2025).
  25. Yang, X.; Zuo, Q.; Chen, W.; Guan, Q.; Shen, Z.; Li, Q.; Xie, Y. Improvement of flow field uniformity and temperature field in gasoline engine catalytic converter. Appl. Therm. Eng. 2023, 230, 120792. [Google Scholar] [CrossRef] [Scilit]
  26. Girona, D.M.O. Evaluation of Hydrogen as a Carbon-Free Fuel for Internal Combustion Engines. Ph.D. Thesis, Universitat Politècnica de València, València, Spain, 2025. Available online: https://riunet.upv.es/server/api/core/bitstreams/23f5b73a-4381-4dda-97f1-bf5e5d8fe465/content (accessed on 12 July 2025).
  27. Desantes, J.; Molina, S.; Novella, R.; López-Juárez, M. Comparative global warming impact and NOX emissions of conventional and hydrogen automotive propulsion systems. Energy Convers. Manag. 2020, 221, 113137. [Google Scholar] [CrossRef] [Scilit]
  28. Akansu, S.O.; Kahraman, N.; Çeper, B. Experimental study on a spark ignition engine fuelled by methane–hydrogen mixtures. Int. J. Hydrogen Energy 2007, 32, 4279–4284. [Google Scholar] [CrossRef] [Scilit]
  29. Liu, B.; Huang, Z.; Zeng, K.; Chen, H.; Wang, X.; Miao, H.; Jiang, D. Experimental study on emissions of a spark-ignition engine fueled with natural gas—Hydrogen blends. Energy Fuels 2008, 22, 273–277. [Google Scholar] [CrossRef] [Scilit]
  30. Ma, F.; Wang, J.; Wang, Y.; Wang, Y.; Li, Y.; Liu, H.; Ding, S. Influence of different volume percent hydrogen/natural gas mixtures on idle performance of a CNG engine. Energy Fuels 2008, 22, 1880–1887. [Google Scholar] [CrossRef] [Scilit]
  31. Serrano, D.; Laget, O.; Soleri, D.; Richard, S.; Douailler, B.; Ravet, F.; Moreau, M.; Dioc, N. Effects of Methane/Hydrogen blends on engine operation: Experimental and numerical investigation of different combustion modes. SAE Int. J. Engines 2010, 3, 223–243. [Google Scholar] [CrossRef] [Scilit]
  32. Park, C.; Lim, G.; Lee, S.; Kim, C.; Choi, Y. Effects of the ignition timing retard and the compression ratio on the full-load performance and the emissions characteristics of a heavy-duty engine fuelled by hydrogen–natural-gas blends. Proc. Inst. Mech. Eng. Part D J. Automob. Eng. 2013, 227, 1295–1302. [Google Scholar] [CrossRef] [Scilit]
  33. Moreno, F.; Muñoz, M.; Arroyo, J.; Magén, O.; Monné, C.; Suelves, I. Efficiency and emissions in a vehicle spark ignition engine fueled with hydrogen and methane blends. Int. J. Hydrogen Energy 2012, 37, 11495–11503. [Google Scholar] [CrossRef] [Scilit]
  34. Zhang, N.; Xiong, J.; Zhong, J.; Leatham, K. Gaussian process regression method for classification for high-dimensional data with limited samples. In Proceedings of the 2018 Eighth International Conference on Information Science and Technology (ICIST), Cordoba, Spain, 30 June–6 July 2018; IEEE: New York, NY, USA, 2018. [Google Scholar]
  35. Farhan, M.; Chen, T.; Rao, A.; Shahid, M.I.; Xiao, Q.; Liu, Y.; Ma, F. Performance, emissions and combustion analysis of hydrogen-enriched compressed natural gas spark ignition engine by optimized Gaussian process regression and neural network at low speed on different loads. Energy 2024, 302, 131857. [Google Scholar] [CrossRef] [Scilit]
  36. Farhan, M.; Chen, T.; Rao, A.; Shahid, M.I.; Xiao, Q.; Salam, H.A.; Ma, F. An experimental study of knock analysis of HCNG fueled SI engine by different methods and prediction of knock intensity by particle swarm optimization-support vector machine. Energy 2024, 309, 133165. [Google Scholar] [CrossRef] [Scilit]
  37. Duan, H.; Huang, Y.; Mehra, R.K.; Song, P.; Ma, F. Study on influencing factors of prediction accuracy of support vector machine (SVM) model for NOx emission of a hydrogen enriched compressed natural gas engine. Fuel 2018, 234, 954–964. [Google Scholar] [CrossRef] [Scilit]
  38. Salam, H.A.; Farhan, M.; Shahid, M.I.; Chen, T.; Rao, A.; Li, X.; Ma, F. Experimental and predictive analysis of performance, emission, and combustion of a heavy-duty HCNG fueled spark-ignition engine by optimized support vector machine. Energy 2025, 335, 138134. [Google Scholar] [CrossRef] [Scilit]
  39. Shahid, M.I.; Rao, A.; Farhan, M.; Liu, Y.; Salam, H.A.; Chen, T.; Ma, F. Hydrogen production techniques and use of hydrogen in internal combustion engine: A comprehensive review. Fuel 2024, 378, 132769. [Google Scholar] [CrossRef] [Scilit]
  40. Farhan, M.; Salam, H.A.; Shahid, M.I.; Chen, T.; Xiao, Q.; Jiang, L.; Rao, A.; Li, X.; Ma, F. Experimental and predictive advancements in hydrogen enriched compressed natural gas spark ignition engines: A critical review. Fuel 2026, 407, 137248. [Google Scholar] [CrossRef] [Scilit]
  41. Zareei, J.; Rohani, A. Optimization and study of performance parameters in an engine fueled with hydrogen. Int. J. Hydrogen Energy 2020, 45, 322–336. [Google Scholar] [CrossRef] [Scilit]
  42. Williams, C.; Rasmussen, C. Gaussian Processes for Machine Learning; MIT Press: Cambridge, MA, USA, 2006. [Google Scholar]
  43. Azeem, N.; Beatrice, C.; Vassallo, A.; Pesce, F.; Gessaroli, D.; Biet, C.; Guido, C. Experimental study of cycle-by-cycle variations in a spark ignition internal combustion engine fueled with hydrogen. Int. J. Hydrogen Energy 2024, 60, 1224–1238. [Google Scholar] [CrossRef] [Scilit]
  44. Gong, C.; Si, X.; Liu, F. Combined effects of excess air ratio and EGR rate on combustion and emissions behaviors of a GDI engine with CO2 as simulated EGR (CO2) at low load. Fuel 2021, 293, 120442. [Google Scholar] [CrossRef] [Scilit]
  45. Evro, S.; Oni, B.A.; Tomomewo, O.S. Carbon neutrality and hydrogen energy systems. Int. J. Hydrogen Energy 2024, 78, 1449–1467. [Google Scholar] [CrossRef] [Scilit]
  46. Nande, A.M.; Szwaja, S.; Naber, J. Impact of EGR on combustion processes in a hydrogen fuelled SI engine. In Proceedings of the SAE World Congress & Exhibition, Detroit, MI, USA, 14–17 April 2008; SAE Technical Paper; SAE International: Warrendale, PA, USA, 2008. [Google Scholar]
  47. Dwyer, H.A.; McCaffrey, Z.; Miller, M. Analysis and prediction of in cylinder NOx emissions for lean burn CNG/H2 transit bus engines. In Proceedings of the SAE Fuels & Lubricants Meeting & Exhibition, Toulouse, France, 8–10 June 2004; SAE Technical Paper; SAE International: Warrendale, PA, USA, 2004. [Google Scholar]
  48. Rao, A.; Mehra, R.K.; Duan, H.; Ma, F. Comparative study of the NOx prediction model of HCNG engine. Int. J. Hydrogen Energy 2017, 42, 22066–22081. [Google Scholar] [CrossRef] [Scilit]
  49. Manigandan, S.; Gunasekar, P.; Poorchilamban, S.; Nithya, S.; Devipriya, J.; Vasanthkumar, G. Effect of addition of hydrogen and TiO2 in gasoline engine in various exhaust gas recirculation ratio. Int. J. Hydrogen Energy 2019, 44, 11205–11218. [Google Scholar] [CrossRef] [Scilit]
  50. Shahid, M.I.; Chen, T.; Farhan, M.; Rao, A.; Salam, H.A.; Xiao, Q.; Ma, F.; Li, X. Experimental study of emissions and conversion efficiency analysis of hydrogen-enriched compressed natural gas engine before and after catalytic converter and predicted by improved particle swarm optimization in conjunction with back propagation neural network (IMPSO-BPNN). Energy 2025, 315, 134409. [Google Scholar] [CrossRef] [Scilit]
  51. Rao, A.; Wu, Z.; Mehra, R.K.; Duan, H.; Ma, F. Effect of hydrogen addition on combustion, performance and emission of stoichiometric compressed natural gas fueled internal combustion engine along with exhaust gas recirculation at low, half and high load conditions. Fuel 2021, 304, 121358. [Google Scholar] [CrossRef] [Scilit]
  52. Ingo, C.; Tuuf, J.; Björklund-Sänkiaho, M. Potential for Lowering Greenhouse Gas Emissions with the Addition of Hydrogen or Ammonia to Different Natural Gas Compositions—Application in Internal Combustion Engines. Energy Sci. Eng. 2025, 13, 405–415. [Google Scholar] [CrossRef] [Scilit]
  53. Johnson, C.; Derwent, R. Relative radiative forcing consequences of global emissions of hydrocarbons, carbon monoxide and NOx from human activities estimated with a zonally-averaged two-dimensional model. Clim. Change 1996, 34, 439–462. [Google Scholar] [CrossRef] [Scilit]
  54. Ramaswamy, V.; Boucher, O.; Haigh, J.; Hauglustaine, D.; Haywood, J.; Myhre, G.; Nakajima, T.; Shi, G.Y.; Solomon, S. Radiative Forcing of Climate Change. In IPCC Third Assessment Report (TAR); Srinivasan, F.J.J., Ed.; Cambridge University Press: Cambridge, UK, 2018; pp. 1–68. [Google Scholar]
  55. Codema. Submission to the Consultation on Developing a Hydrogen Strategy for Ireland. Dublin’s Energy Agency. 2022. Available online: https://www.codema.ie/wp-content/uploads/2024/09/Codema_Submission_on_Hydrogen_Strategy_Consultation.pdf (accessed on 12 July 2025).
  56. Ministère de L’environnement, de La Lutte Contre les Changements Climatiques de la Faune et des Parcs (Melccfp). Greenhouse Gas Emissions Quantification Guide; Direction Générale de L’expertise en Transition Climatique et Énergétique: Québec City, QC, Canada, 2025; p. 122. ISBN 978-2-555-00460-3.
Figure 1. Schematic of the experimental setup for HCNG.
Energies 19 02131 g001
Figure 2. Effect of hydrogen fraction and EGR ratio on CH4 emissions. (a) HCNG0%, 900 rpm; (b) HCNG30%, 900 rpm; (c) HCNG50%, 900 rpm; (d) EGR 3.5%, 900 rpm; (e) HCNG20%, 1500 rpm; (f) EGR 23%, 1500 rpm.
Energies 19 02131 g002
Figure 3. Effect of hydrogen fraction and EGR ratio on CO emissions. (a) HCNG0%, 900 rpm; (b) HCNG30%, 900 rpm; (c) HCNG50%, 900 rpm; (d) EGR 3.5%, 900 rpm; (e) HCNG20%, 1500 rpm; (f) EGR 23%, 1500 rpm.
Energies 19 02131 g003
Figure 4. Effect of hydrogen fraction and EGR ratio on NOx emissions. (a) HCNG0%, 900 rpm; (b) HCNG30%, 900 rpm; (c) HCNG50%, 900 rpm; (d) EGR 3.5%, 900 rpm; (e) HCNG20%, 1500 rpm; (f) EGR 23%, 1500 rpm.
Energies 19 02131 g004
Figure 5. Effect of hydrogen fraction and EGR ratio on CO2 emissions. (a) HCNG0%, 900 rpm; (b) HCNG30%, 900 rpm; (c) HCNG50%, 900 rpm; (d) EGR 3.5%, 900 rpm; (e) HCNG20%, 1500 rpm; (f) EGR 23%, 1500 rpm.
Energies 19 02131 g005
Figure 6. Effect of hydrogen fraction, EGR, and engine speed on total GHG emissions. (a) EGR 0%, 900 rpm; (b) EGR 23%, 1500 rpm; (c) HCNG50%, 900 rpm; (d) HCNG20%, 900, 1200, and 1500 rpm.
Energies 19 02131 g006
Figure 7. Impact of hydrogen fraction on emissions before and after the TWC. (a) CH4; (b) CO; (c) NOx emissions.
Energies 19 02131 g007
Figure 8. Pearson correlation coefficient before and after TWC. (a) CH4; (b) CO; (c) NOx emissions.
Energies 19 02131 g008
Figure 9. Impact of EGR ratio on emissions before and after TWC. (a) CH4; (b) CO; (c) NOx emissions.
Energies 19 02131 g009
Figure 10. Impact of engine speed on emissions before and after the TWC. (a) CH4; (b) CO; (c) NOx emissions.
Energies 19 02131 g010
Figure 11. Impact of engine load on emissions before and after TWC. (a) CH4; (b) CO; (c) NOx emissions.
Energies 19 02131 g011
Figure 12. CO 2 e q emissions of CO, CH4, and NOx before and after three-way catalytic converter. (a) Hydrogen fraction; (b) EGR rate; (c) Engine speed variation.
Energies 19 02131 g012
Figure 13. GPR performance for CH4 prediction: (a) Predicted vs. observed CH4 (Rational Quadratic GPR); (b) Kernel comparison.
Energies 19 02131 g013
Figure 14. GPR performance for CO prediction: (a) Predicted vs. observed CO (Exponential GPR); (b) Kernel comparison.
Energies 19 02131 g014
Figure 15. GPR performance for NOx prediction: (a) Predicted vs. observed NOx (Exponential GPR); (b) Kernel comparison.
Energies 19 02131 g015
Table 1. Specifications of 6-cylinder, 4-stroke SI engine.
ModelYCK11360N-60
Type of injectionPort fuel injection
Speed range700/1700 rpm ( ± 50 )
Compression ratio12:1
Maximum power260 kW
Bore123 mm
Firing order1-5-3-6-2-4
Stroke154 mm
Table 2. Operating parameters before catalytic converter.
OP.RPMLoad%H2%EGR%
19003000
2 2.5
3 4.5
4 6.6
5 8.8
690030300
7 2.2
8 4.2
9 6
10 9.1
1190030500
12 4
13 8
14 12.4
15 16.3
169003003.5
17 10
18 20
19 30
20 40
21 50
22150030200
23 5
24 10
25150050023
26 20
27 30
28 40
Table 3. Operating parameters before and after catalytic converter.
OP.RPMLoad%H2%EGR%
19003004.5
2 106
3 208
49003000
5 6.6
6 8.8
790030208
81200 8
91500 10
101200250 & 2010
11 50 20
12 75 20
Table 4. Gaussian Process Regression (GPR) results of emissions before and after TWC.
ModelRMSER2MSEMAE
CH4
Squared Exponential GPR0.027540.700280.0007580.01412
Matern 5/2 GPR0.027430.702690.0007520.01404
Exponential GPR0.022060.807680.0004860.01137
Rational Quadratic GPR0.021670.814450.0004690.01116
CO
Squared Exponential GPR0.172880.998660.029880.11576
Matern 5/2 GPR0.123180.999320.015170.08081
Exponential GPR0.098590.999560.009720.07617
Rational Quadratic GPR0.129080.999250.016660.08451
NOx
Squared Exponential GPR0.037620.996450.0014150.01544
Matern 5/2 GPR0.037550.996460.0014100.01494
Exponential GPR0.035600.996820.0012670.01476
Rational Quadratic GPR0.037620.996450.0014150.01544
Table 5. Pearson correlation coefficient outcomes across various operating conditions.
ConditionsEmissionsHydrogenEGRSpeedLoad
Before Catalytic ConverterCH4−0.95660.9701−0.58750.6893
CO−0.8309−0.8895−0.97720.8478
NOx0.9664−0.9407−0.83570.9297
After Catalytic ConverterCH4−0.25570.5584−0.51070.6248
CO−0.2808−0.6052−0.5626−0.6070
NOx0.8301−0.7630−0.7891−0.1015
Disclaimer/Publisher’s Note: The statements, opinions and data contained in all publications are solely those of the individual author(s) and contributor(s) and not of MDPI and/or the editor(s). MDPI and/or the editor(s) disclaim responsibility for any injury to people or property resulting from any ideas, methods, instructions or products referred to in the content.