


Abstract
The rapid growth of residential photovoltaic (PV) installations has increased interest in electrical storage units (ESUs) as a means of enhancing self-consumption and reducing surplus electricity fed into the grid. However, in temperate climates characterized by strong seasonal variability in solar generation, the economic viability of residential battery storage remains uncertain. This study examines whether ESUs provide measurable financial benefits under such climatic conditions, particularly after the transition from net-metering to net-billing schemes. The analysis combines empirical household electricity consumption data with simulation-based modeling of PV–battery operation. Periods of surplus energy production during high solar generation were taken into account, as well as periods of increased energy demand in the winter season and technical limitations related to energy storage, including the difference between actual and nominal capacity of energy storage systems. The results indicate that although battery storage increases self-consumption and reduces grid injection during peak generation periods, its economic performance is limited by the seasonal mismatch between electricity production and demand. Consequently, under net-billing conditions, residential ESUs do not automatically ensure economic profitability in temperate climates.
1. Introduction
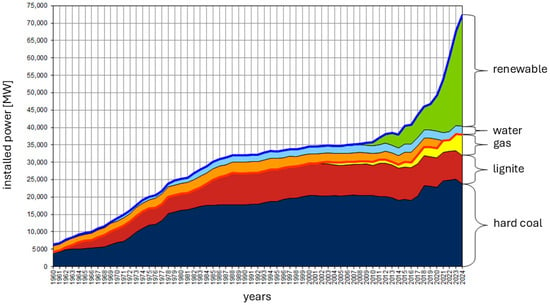
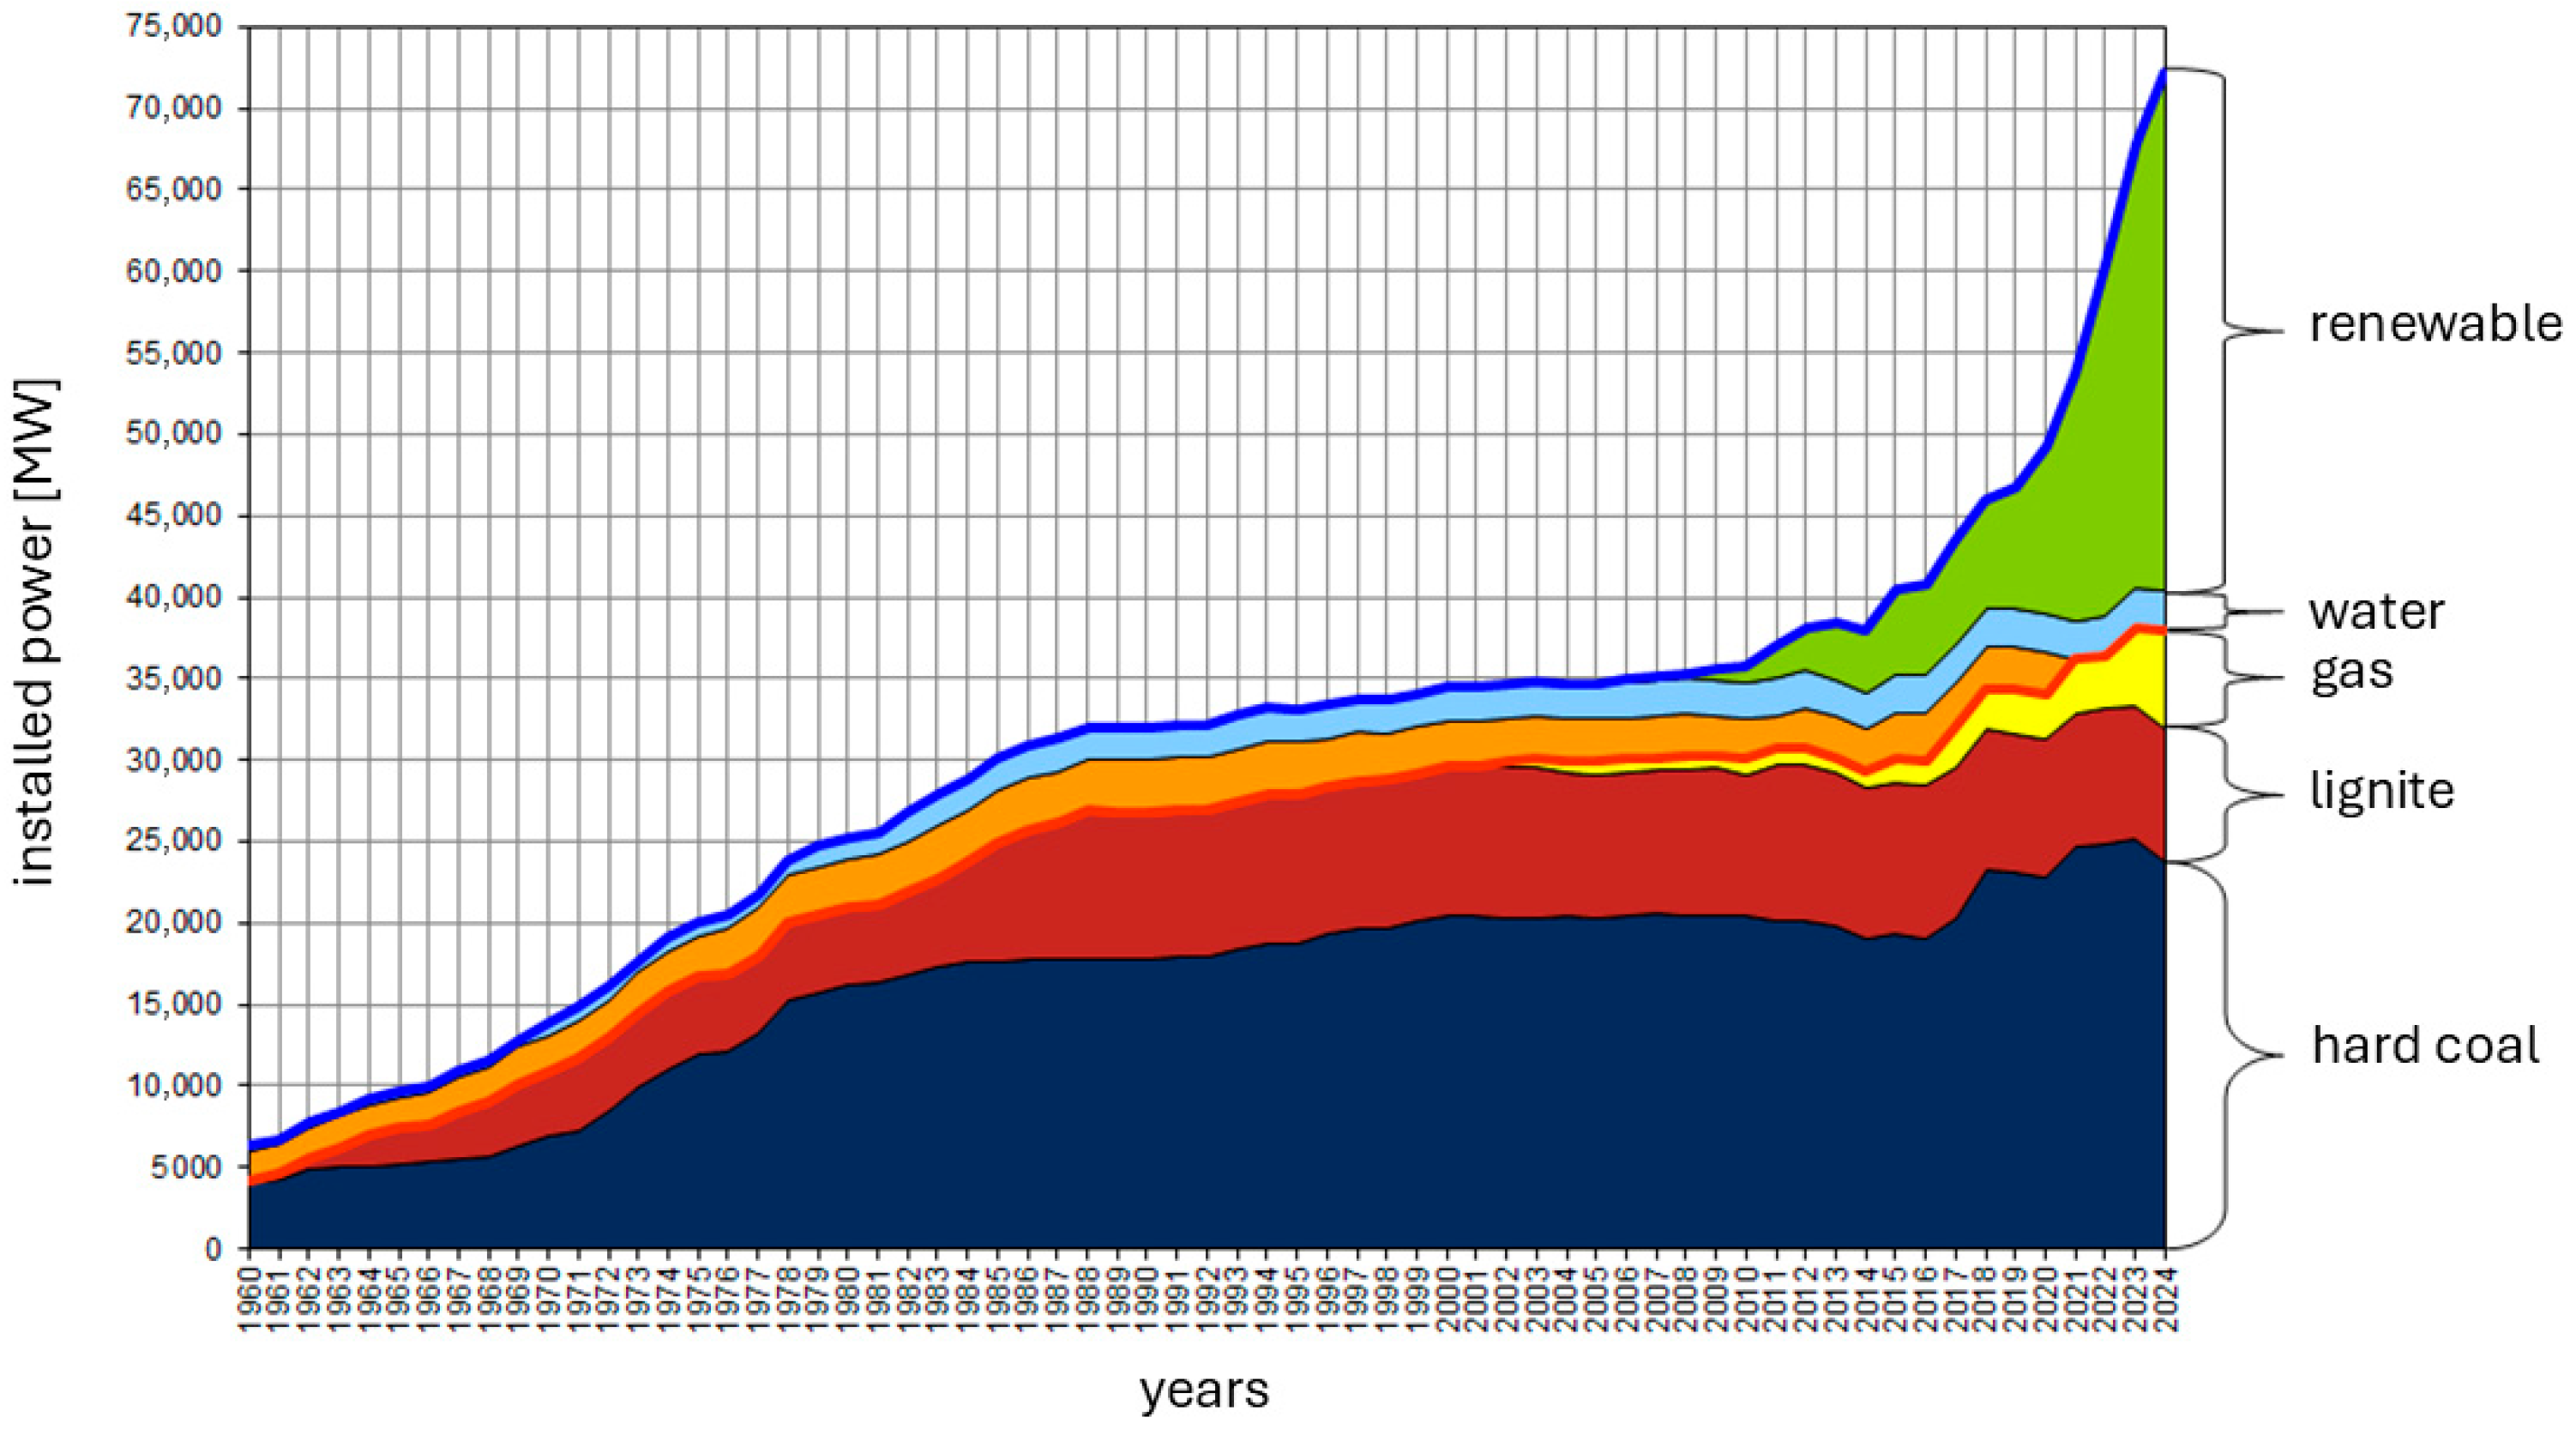
Over the past decade, Poland has experienced rapid growth in photovoltaic (PV) installations, driven by climate policy, rising electricity prices, and government support programs for prosumers. As shown in Figure 1, the structure of installed capacity in the Polish energy sector has changed significantly between 1960 and 2024. In 2024, renewable energy sources (RES) accounted for more than 44.08% of the total installed capacity [1]. Among RES technologies, photovoltaic micro-installations constitute a substantial share. As of 31 December 2024, more than 1.5 million PV micro-installations were operating in Poland, with a total installed capacity exceeding 12.7 GW [2]. Despite this rapid expansion, PV generation remains highly dependent on weather conditions and solar irradiation. Electricity production typically occurs during periods that do not coincide with peak demand, particularly during winter and nighttime hours. The structure of the installed capacity also differs markedly from the structure of actual electricity generation. In 2024, coal-fired power plants (hard coal and lignite) remained responsible for 62.85% of total electricity production (Table 1). Although their contribution is gradually decreasing, coal-based units continue to play a crucial role in maintaining system stability due to the variability of renewable energy generation [3,4].
Figure 1.
Dynamics of changes in installed capacity in the Polish energy sector over the years 1960–2024. Source: own elaboration based on [1].
Table 1.
Installed capacity and electricity production by source as of 31 December 2024. Source: own elaboration based on [1].
Another limitation concerns residential PV systems. Electricity production occurs mainly during daytime hours, when household demand is relatively low. As a result, self-consumption rates remain limited, typically ranging between 15% and 25% [5,6,7]. Although some market reports indicate higher values (20–40%), empirical observations suggest that these estimates may be overstated. Consequently, a large share of surplus electricity is injected into the grid, which may lead to local voltage increases and curtailment during periods of high solar output [5,8,9].
To increase self-consumption, the installation of residential energy storage units (ESUs) has been increasingly promoted, including through public subsidy programs [9,10,11]. The integration of energy storage enables the surplus electricity generated during daytime hours to be shifted to evening and nighttime consumption, thereby significantly improving energy utilization and reducing dependence on the grid [12,13,14].
The economic viability of residential photovoltaic systems combined with battery storage is strongly influenced by local market conditions, electricity prices, and regulatory frameworks [15,16]. While storage systems can mitigate grid-related issues, such as voltage fluctuations and the variability of renewable generation [17,18], their financial performance is often limited in the absence of external support mechanisms.
Studies conducted in European countries indicate that the integration of battery storage can significantly increase self-consumption and reduce electricity exchange with the grid, thereby improving overall system efficiency [19,20]. However, the profitability of such systems remains highly dependent on policy support mechanisms, as demonstrated in the United Kingdom, where subsidies and tariff structures play a decisive role in investment attractiveness [21]. Additionally, techno-economic analyses in Southern Europe confirm that, although PV systems are increasingly cost-effective, the inclusion of storage still requires careful optimization to achieve financial benefits [22].
Overall, residential energy storage enhances the operational performance of PV systems; however, its economic justification remains context-dependent. Consequently, although energy storage improves the technical performance of residential PV systems, its profitability is strongly influenced by regulatory and economic conditions.
This study evaluates the technical and financial performance of residential ESUs under Polish climatic conditions. Due to significant climatic differences, the results should not be directly generalized to regions with substantially different solar resources, such as Scandinavian or Mediterranean countries.
2. Materials and Methods
2.1. Case Study Description and Building Characteristics
The analyzed installation was located in a medium-sized single-family house equipped with a 7.5 kW air-source heat pump for domestic hot water and space heating via a low-temperature underfloor system. The air temperature in the house was set to 22 degrees C, and the domestic hot water temperature was set to 45 degrees C. The 6.5 kWp PV installation was mounted on a south-facing sloped roof.
The building exhibits high thermal efficiency, with minimized external surface-to-volume ratio, no thermal bridges, 20 cm external insulation, and mechanical ventilation with heat recovery. All household processes are electricity-based.
2.2. Measurement System and Data Sources
The electricity production was monitored over three years; 2023 was selected for detailed analysis as the first year of the simultaneous operation of the PV system and heat pump. Data were obtained directly from the electricity supplier’s online metering system. Table 2 presents the energy production (EP) and self-consumption (ESC) in the years 2023–2025 in the analyzed house.
Table 2.
Annual energy production (EP) and self-consumption (ESC) of the residential PV system in the analyzed case, 2023–2025.
2.3. Energy Balance Under Polish Climatic Conditions
Poland has four distinct seasons with substantial variation in temperature and solar irradiation. Production peaks from April to September, while electricity demand peaks from November to February, due to heating needs. These climatic characteristics significantly affect the PV performance and storage feasibility.
3. Energy Storage Modeling
3.1. Concept of an Ideal Energy Storage Unit (IES)
A potential solution to the imbalance between electricity production and consumption would be an energy storage system with a capacity corresponding to electricity demand during the colder half of the year—approximately 5 MWh in this case. Residential ESUs typically have capacities ranging from 5 to 20 kWh and operate primarily in a day–night cycle. To evaluate the theoretical limits of storage performance, a conceptual model of an ideal energy storage unit (IES) was introduced.
The IES satisfies the following assumptions:
- Sufficient capacity to store daily energy surpluses,
- Ability to release stored energy with the necessary delay depending on energy demand,
- Operation without energy losses.
The calculation of self-consumption in case of Ideal Energy Storage (IES) was performed for each month separately by balancing the monthly energy production with the monthly energy demand, according to Formula (1):
where ESCm—self-consumption in month, EPm—monthly energy production, and EDm—monthly energy demand.
3.2. Operational Constraints of Residential Energy Storage
Residential battery energy storage systems are subject to several key operational constraints that affect their performance and longevity. One of the most important parameters is the round-trip efficiency (RTE), which indicates how much of the stored energy can be effectively retrieved [23]. The marketed nominal capacity differs from the usable capacity, which typically does not exceed 80% of the nominal capacity [24,25,26]. Another limitation is self-discharge, the gradual loss of stored energy over time, which—although relatively low in lithium-ion batteries—can increase under unfavorable conditions such as high ambient temperatures [27]. Temperature itself plays a critical role, as batteries operate most efficiently within a moderate range of approximately 15–35 °C [28,29]. Deviations from this range can reduce efficiency, limit usable capacity, and accelerate degradation, highlighting the importance of proper thermal management in residential energy storage systems.
The analysis indicates that energy storage is ineffective in winter due to insufficient surplus production. During warmer months, storing large surpluses is also inefficient, because nighttime demand is minimal and does not guarantee the full utilization of the stored energy.
3.3. Simulation Assumptions and Storage Capacity Variants
To evaluate realistic storage scenarios, two ESU variants were simulated:
- ESU 5 (nominal capacity 5 kWh, usable capacity 4 kWh),
- ESU 20 (nominal capacity 20 kWh, usable capacity 16 KWh).
These were compared with the ideal storage scenario (IES).
Based on real data for daily energy production and consumption, the operation of an energy storage unit (ESU) was simulated. Both production and consumption represent net values, meaning that the level of self-consumption observed in reality—i.e., without the use of energy storage—has already been taken into account.
The operation of the storage system depends on the surplus energy generated on the preceding day and the potential consumption on the following day. If production exceeds the storage capacity, the surplus is fed into the grid. On the other hand, if energy consumption is lower than the amount of stored energy, the storage unit will not be fully discharged, and its effective (usable) capacity will be reduced. When the electricity production is lower than the storage capacity, the storage unit operates below its maximum potential.
The possible operating cases are discussed in detail in Section 4.
4. Results
4.1. Seasonal Mismatch Between PV Generation and Household Demand
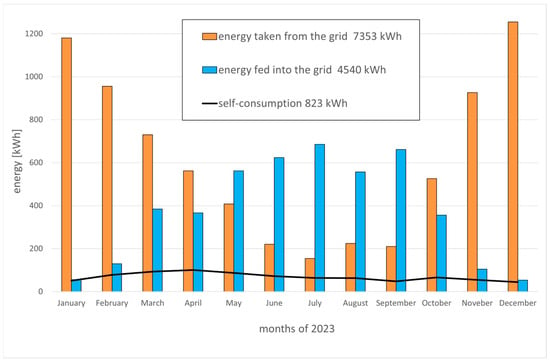
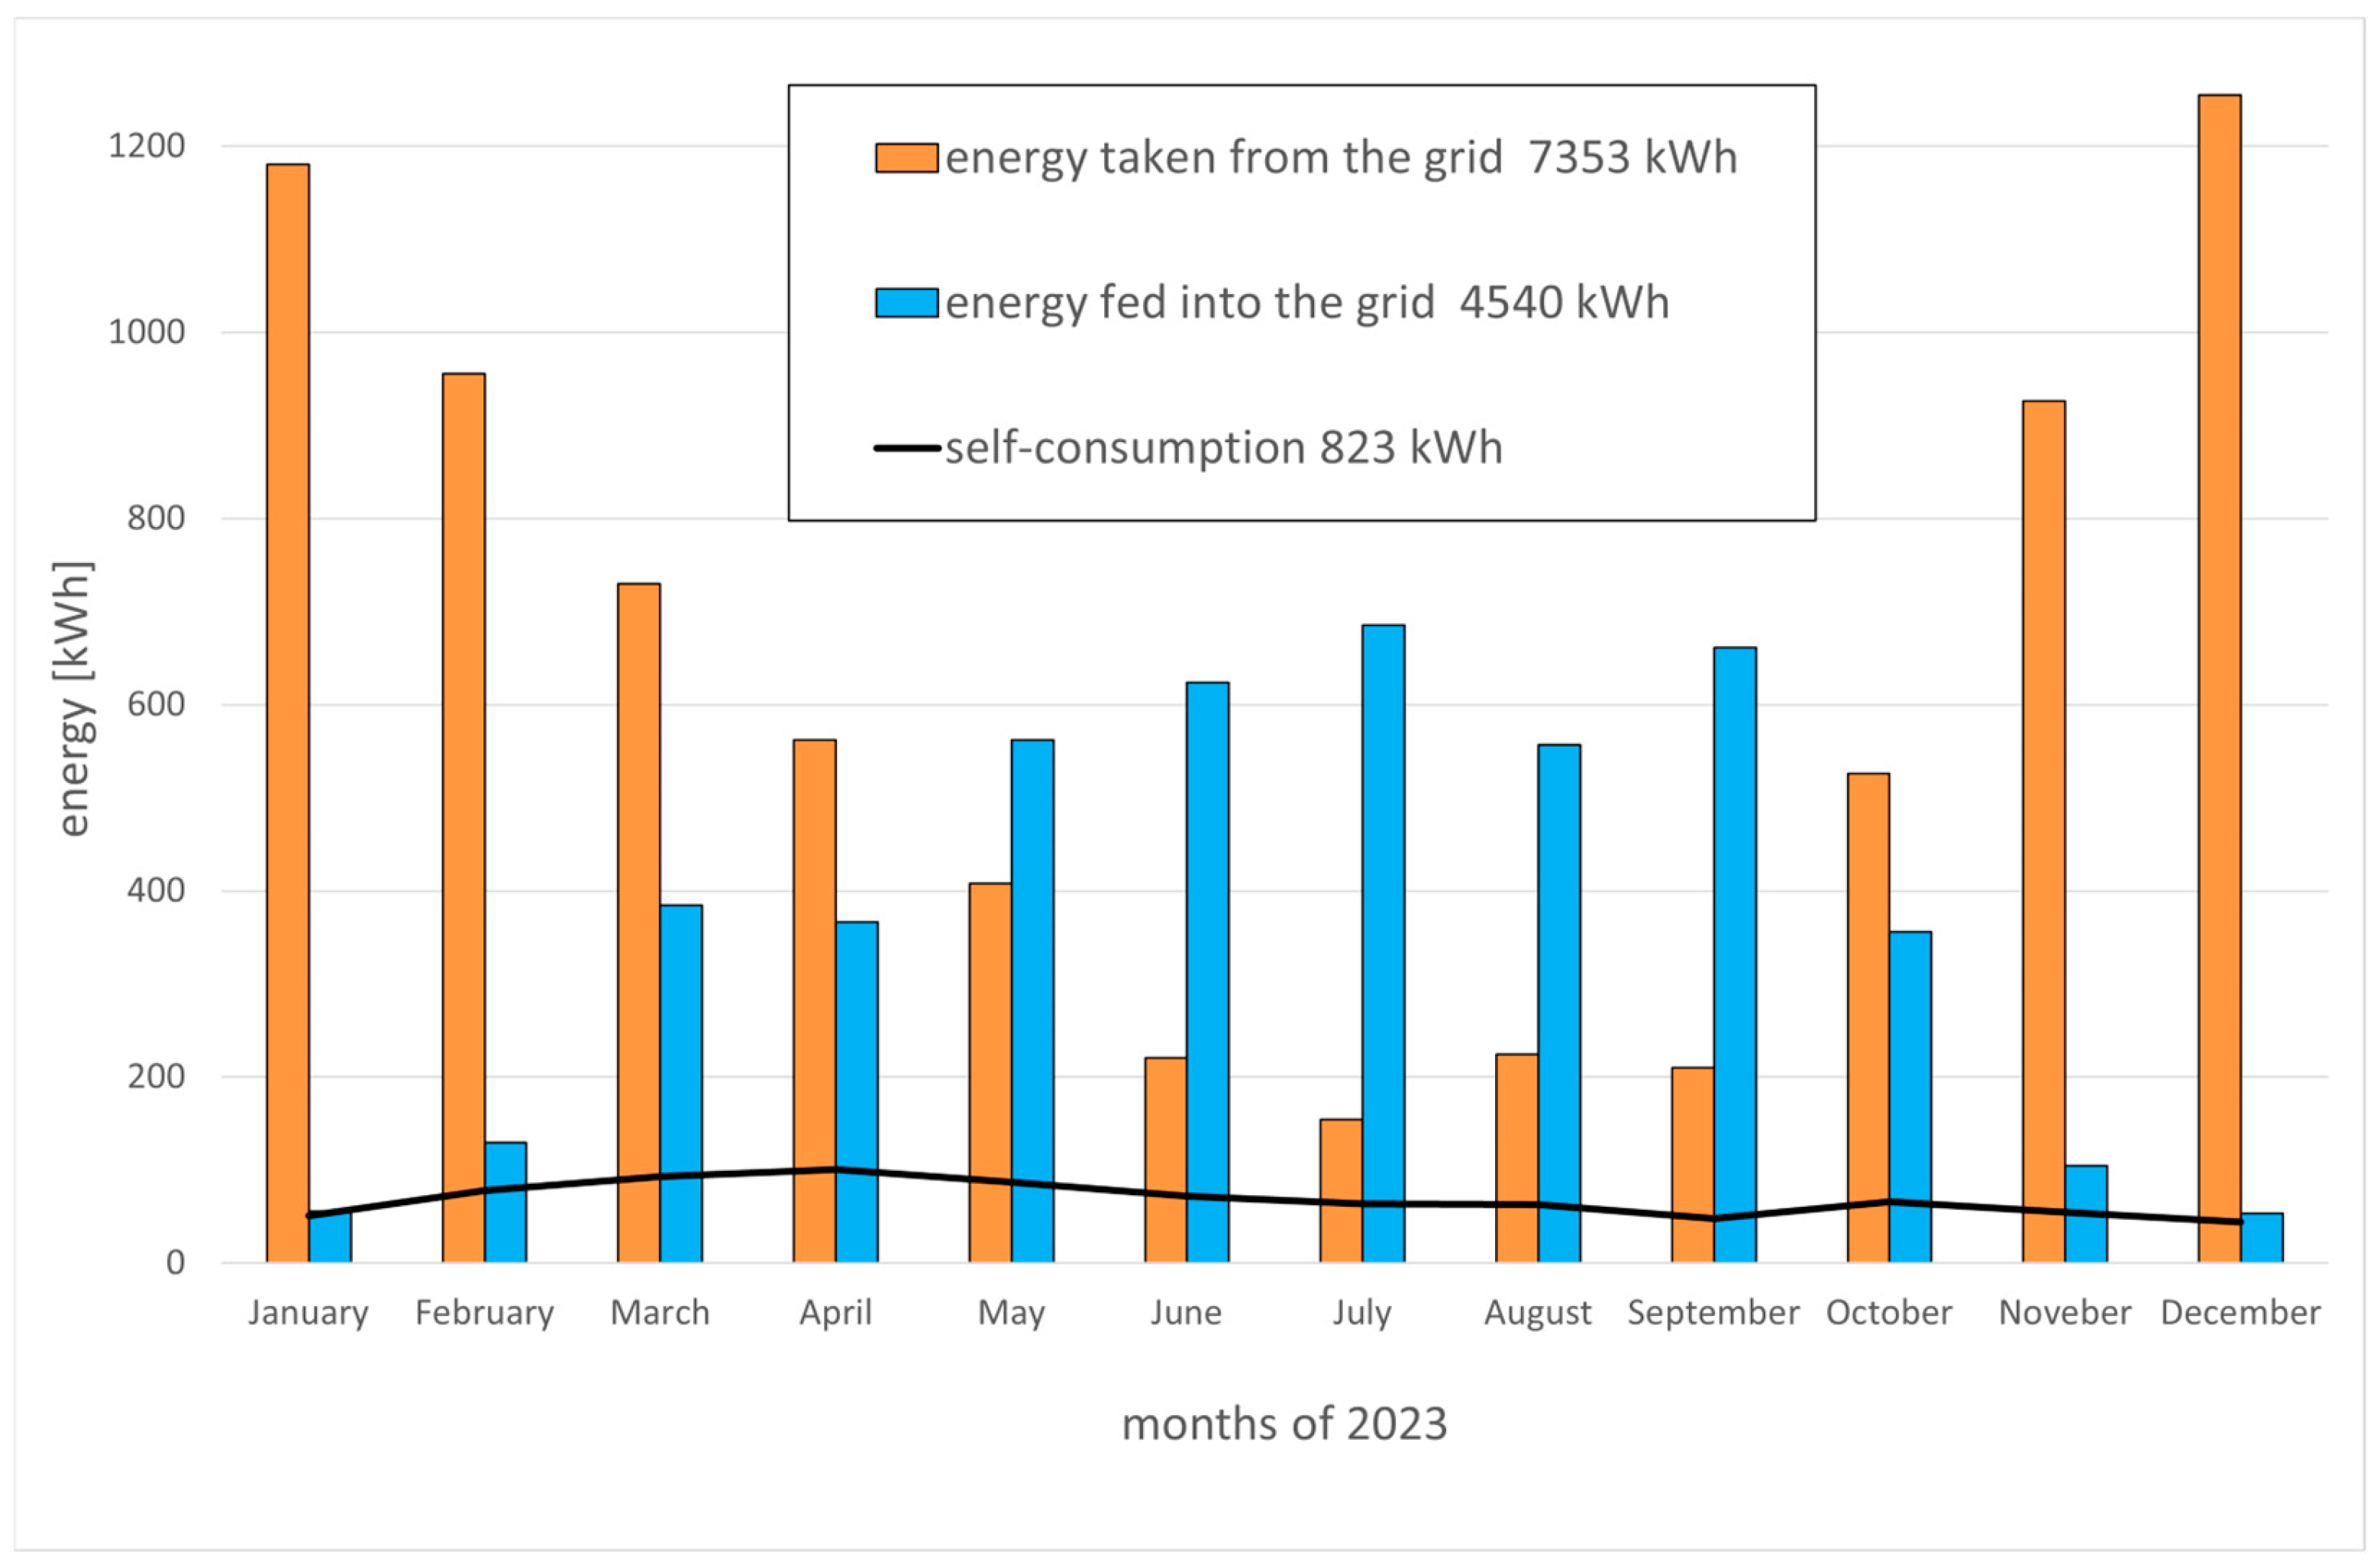
Figure 2 demonstrates a clear six-month phase shift between peaks of electricity production and demand.
Figure 2.
Annual balance of electricity consumption and production in a single-family house with a 6.5 kWp PV installation and a 7.5 kW heat pump in 2023.
The production and consumption peaks are shifted by approximately six months. The highest electricity consumption occurs during the winter months (November to February). During this period, electricity is used for space heating and domestic hot water. Meanwhile, the highest electricity generation from photovoltaic (PV) installations—due to extended daylight duration and favorable solar incidence angles—occurs during the summer months (June and July). During this period, the building does not require space heating, and the use of artificial lighting is significantly reduced. The demand for domestic hot water is also considerably lower than in winter. In summer, the building is cooled using air conditioning systems, which operate primarily during daytime hours when PV electricity generation is at its peak. This contributes to increased self-consumption; however, it does not significantly affect the level of electricity drawn from the grid.
With the specified system parameters, 7353 kWh of electricity was drawn from the grid during the year. During the same period, the PV installation produced 5363 kWh, of which 823.6 kWh was used on-site. After balancing, 4540 kWh was fed into the grid. Notably, annual self-consumption was only 823.6 kWh, representing 15.4% of total PV production.
The highest level of self-consumption occurs primarily during the months of March to May and in October. These are transitional periods during which space heating is still required, while at the same time, significant electricity generation from the PV installation is observed. This effect will be discussed in Section 4.4 and illustrated in the there (Figure 6).
4.2. Simulation of Ideal Storage Performance
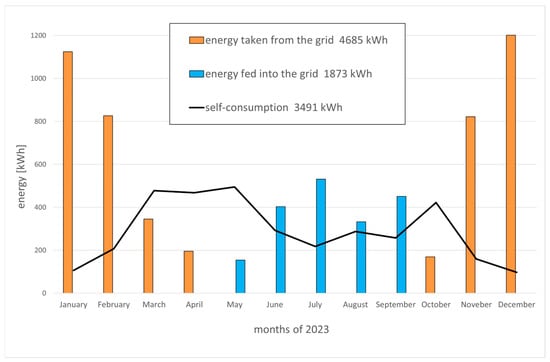
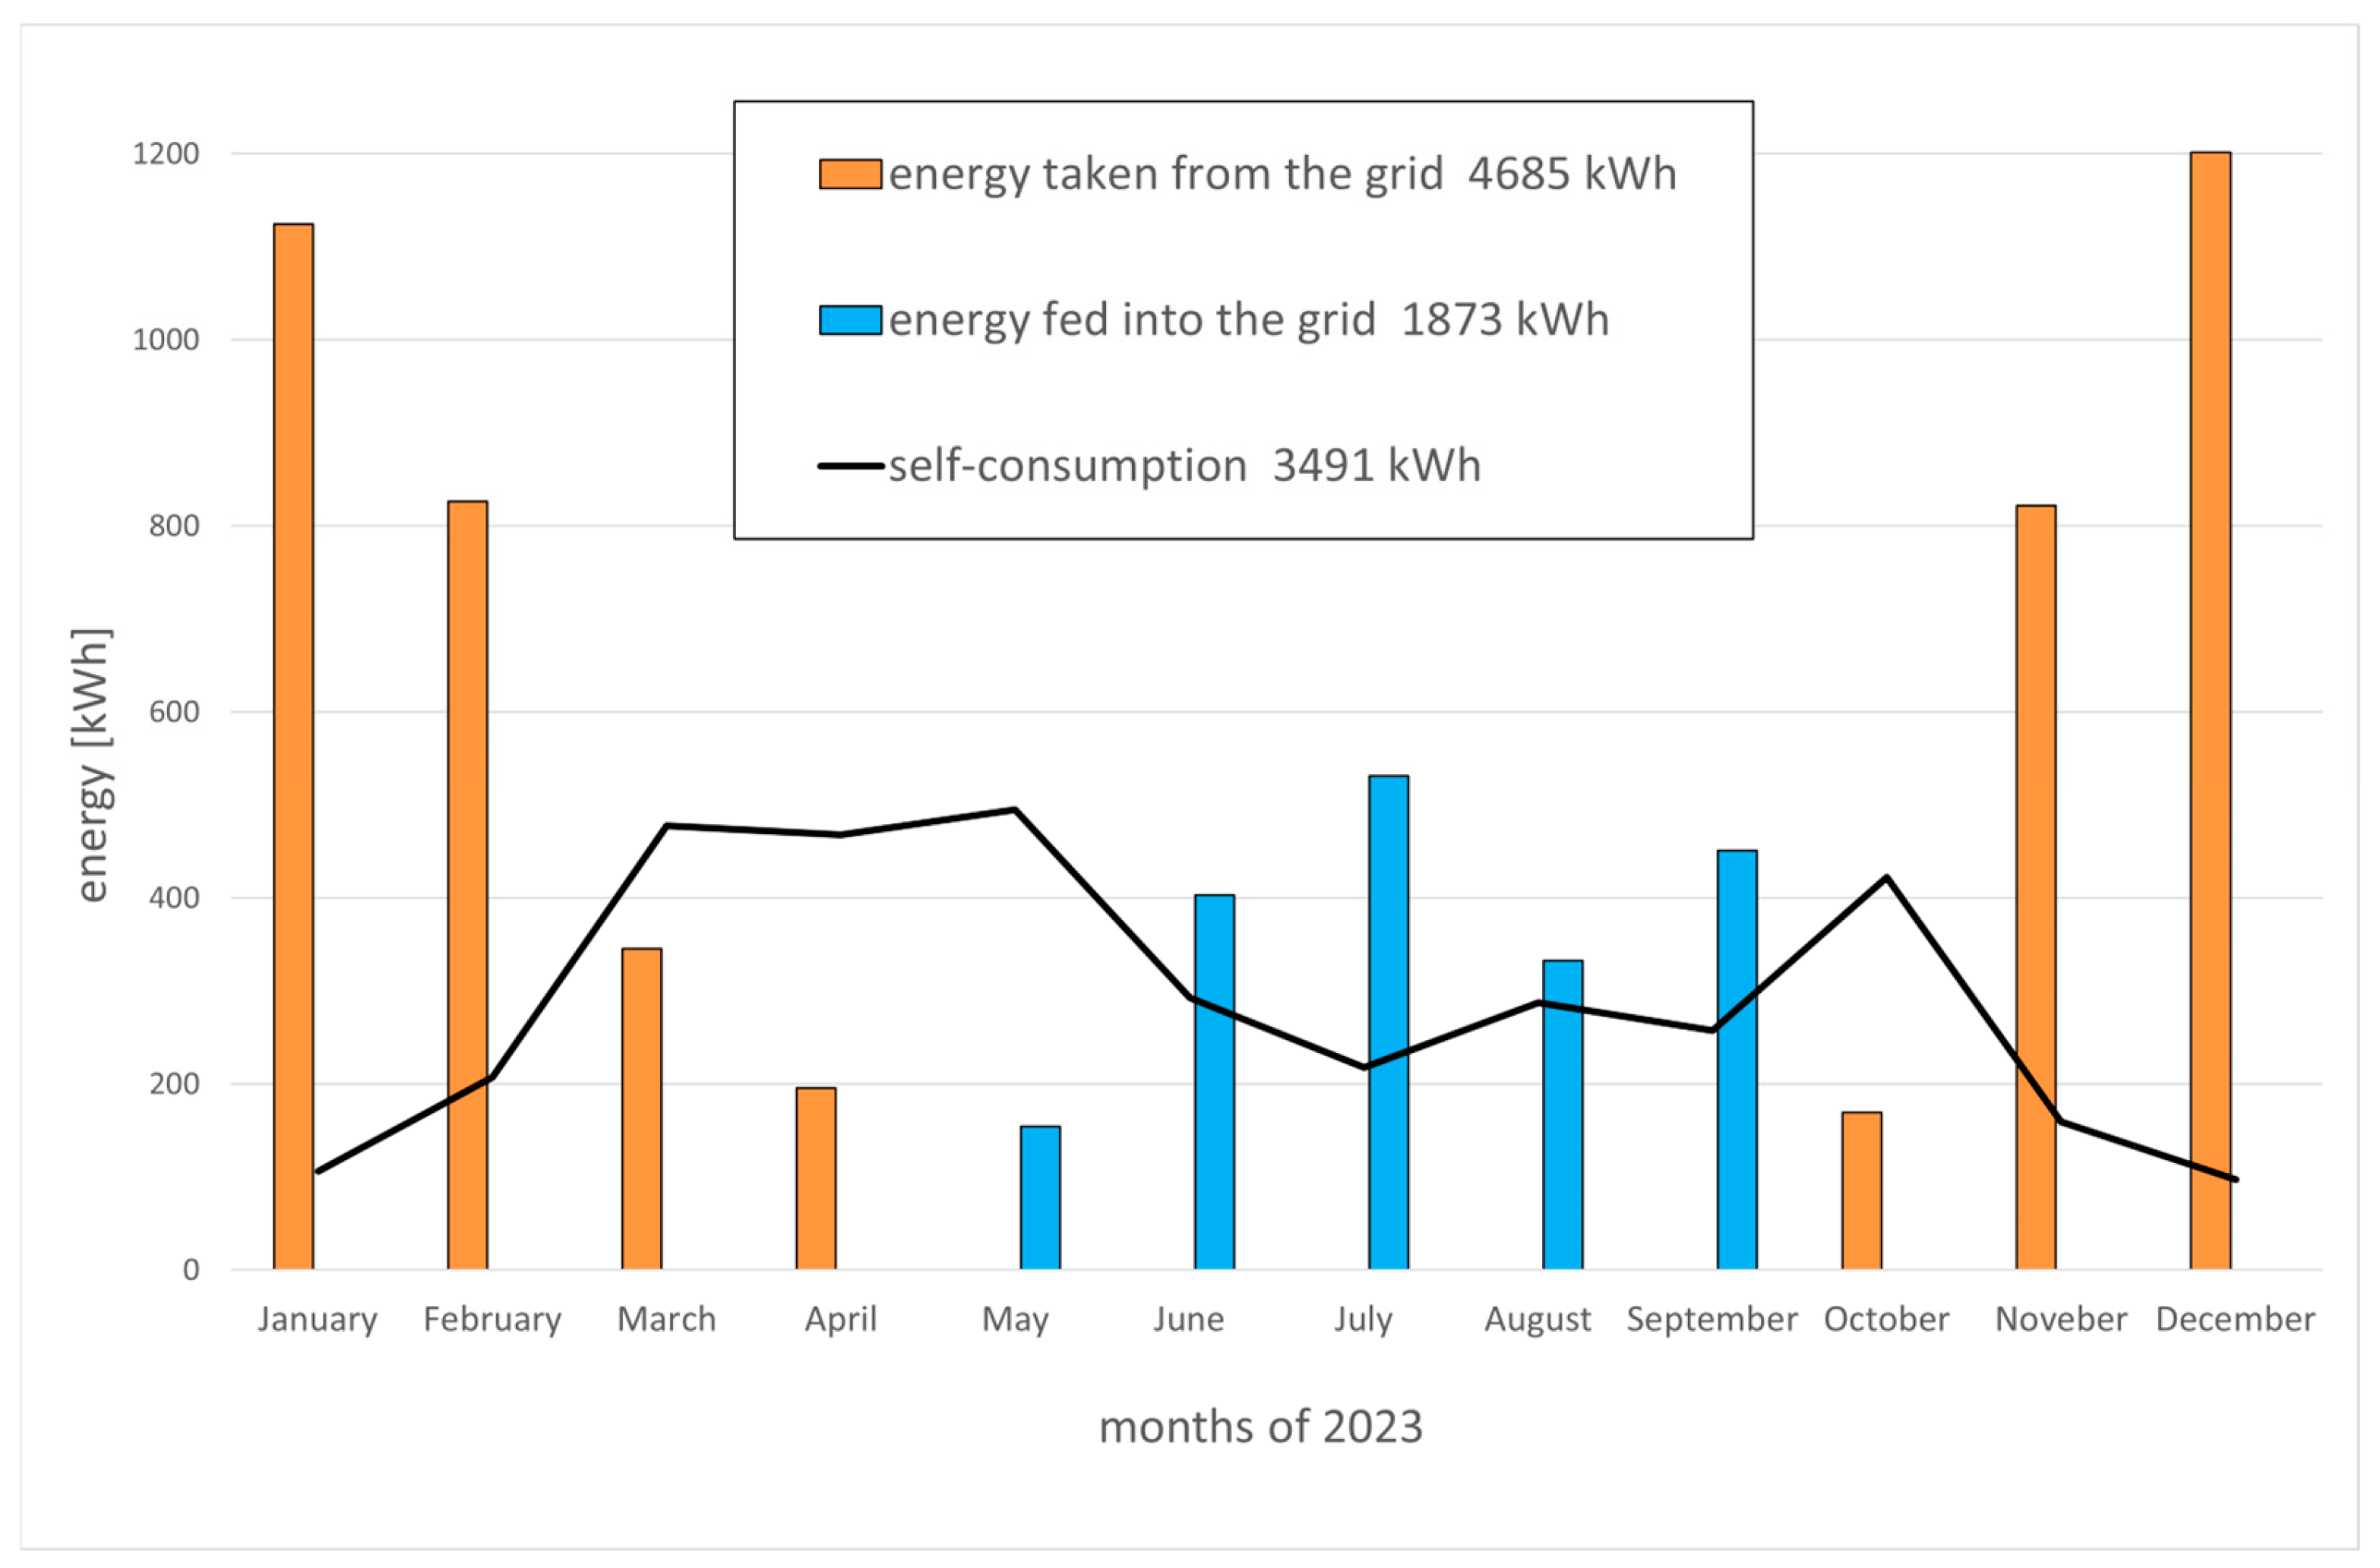
Figure 3 illustrates the annual energy balance assuming ideal storage conditions.
Figure 3.
Simulated annual energy balance resulting from the use of an ideal energy storage unit (IES).
The electricity produced in the winter months was fully utilized on-site, and during summer, the demand previously met by grid electricity was covered by PV production. A slight reduction in winter grid consumption and summer grid exports is visible. However, two peaks remain: maximum winter consumption and maximum summer overproduction. During colder months, 4685 kWh of electricity still had to be drawn from the grid, while 1873 kWh was exported during warmer months. Annual self-consumption increased from 823 kWh to 3497 kWh, corresponding to an increase from 15.7% to 65.1%. The graph reveals an important pattern: the highest theoretical self-consumption is achieved in months when production and consumption are relatively balanced (March–May and October). Self-consumption remains low in winter (November–February) and summer (June–September). The 65.1% level represents the theoretical upper limit of self-consumption.
4.3. Daily Energy Balance Under Contrasting Climatic Conditions
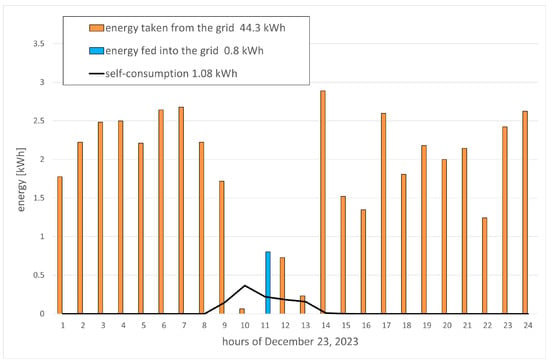
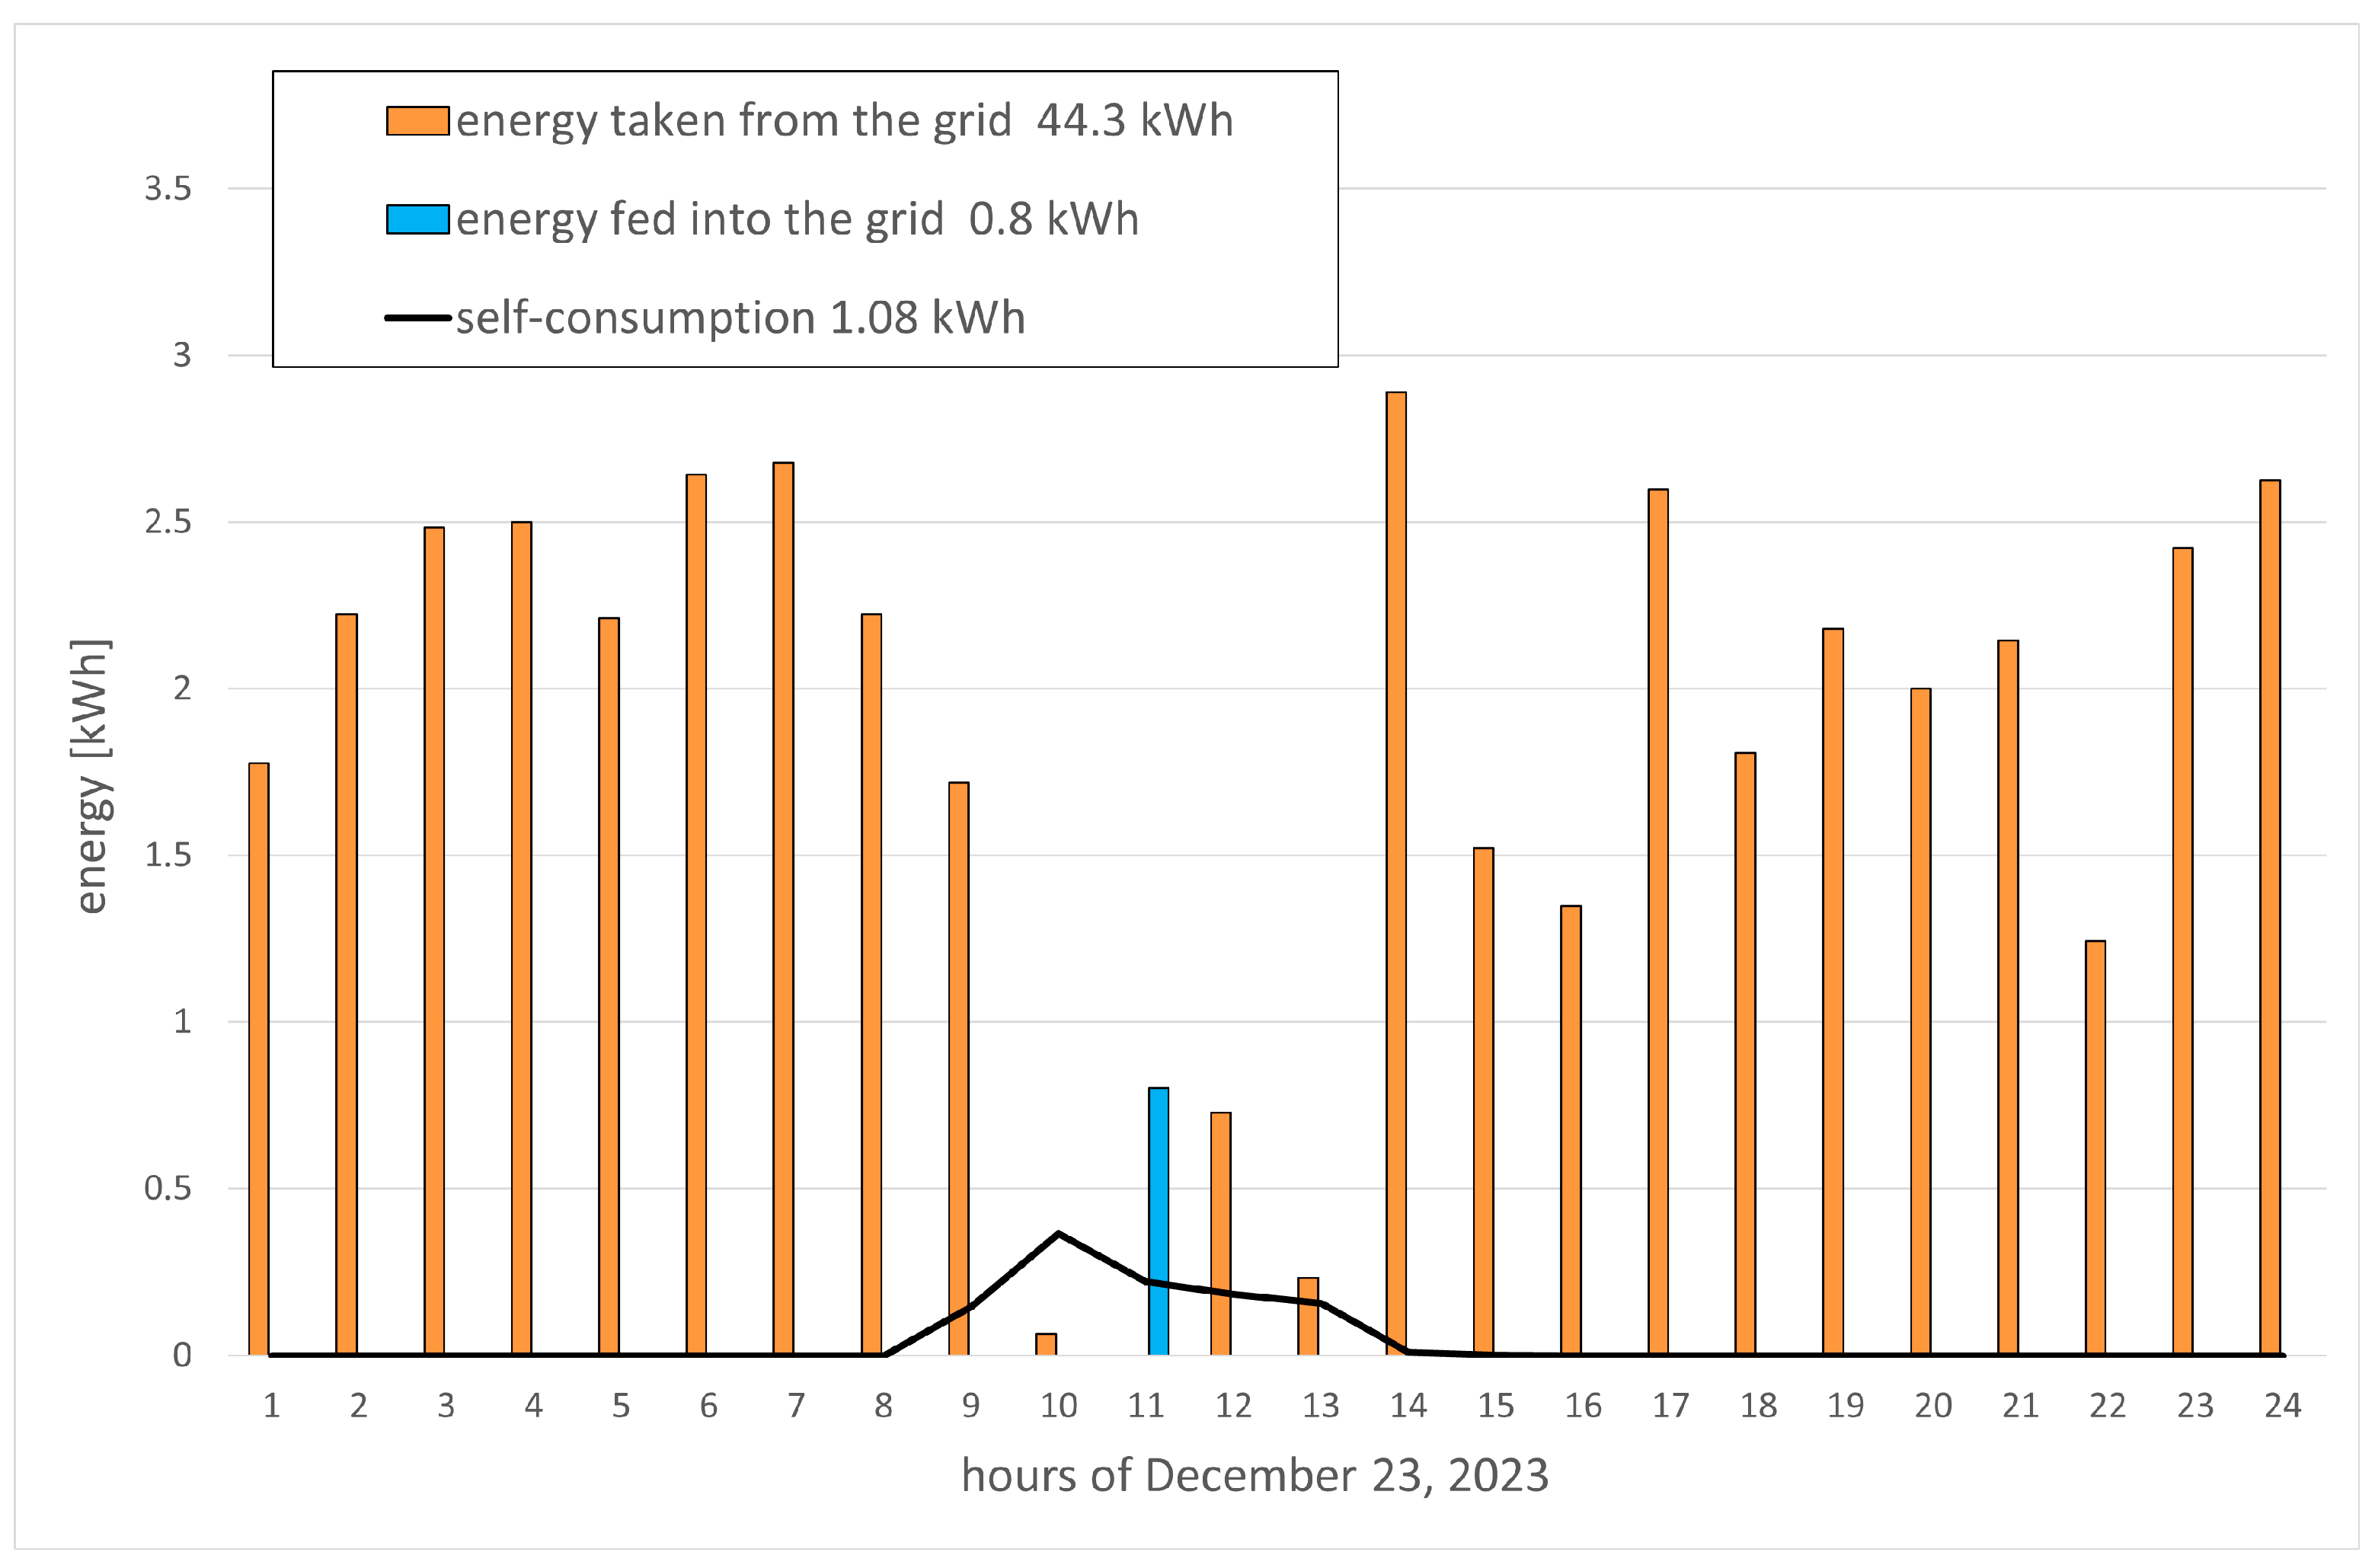
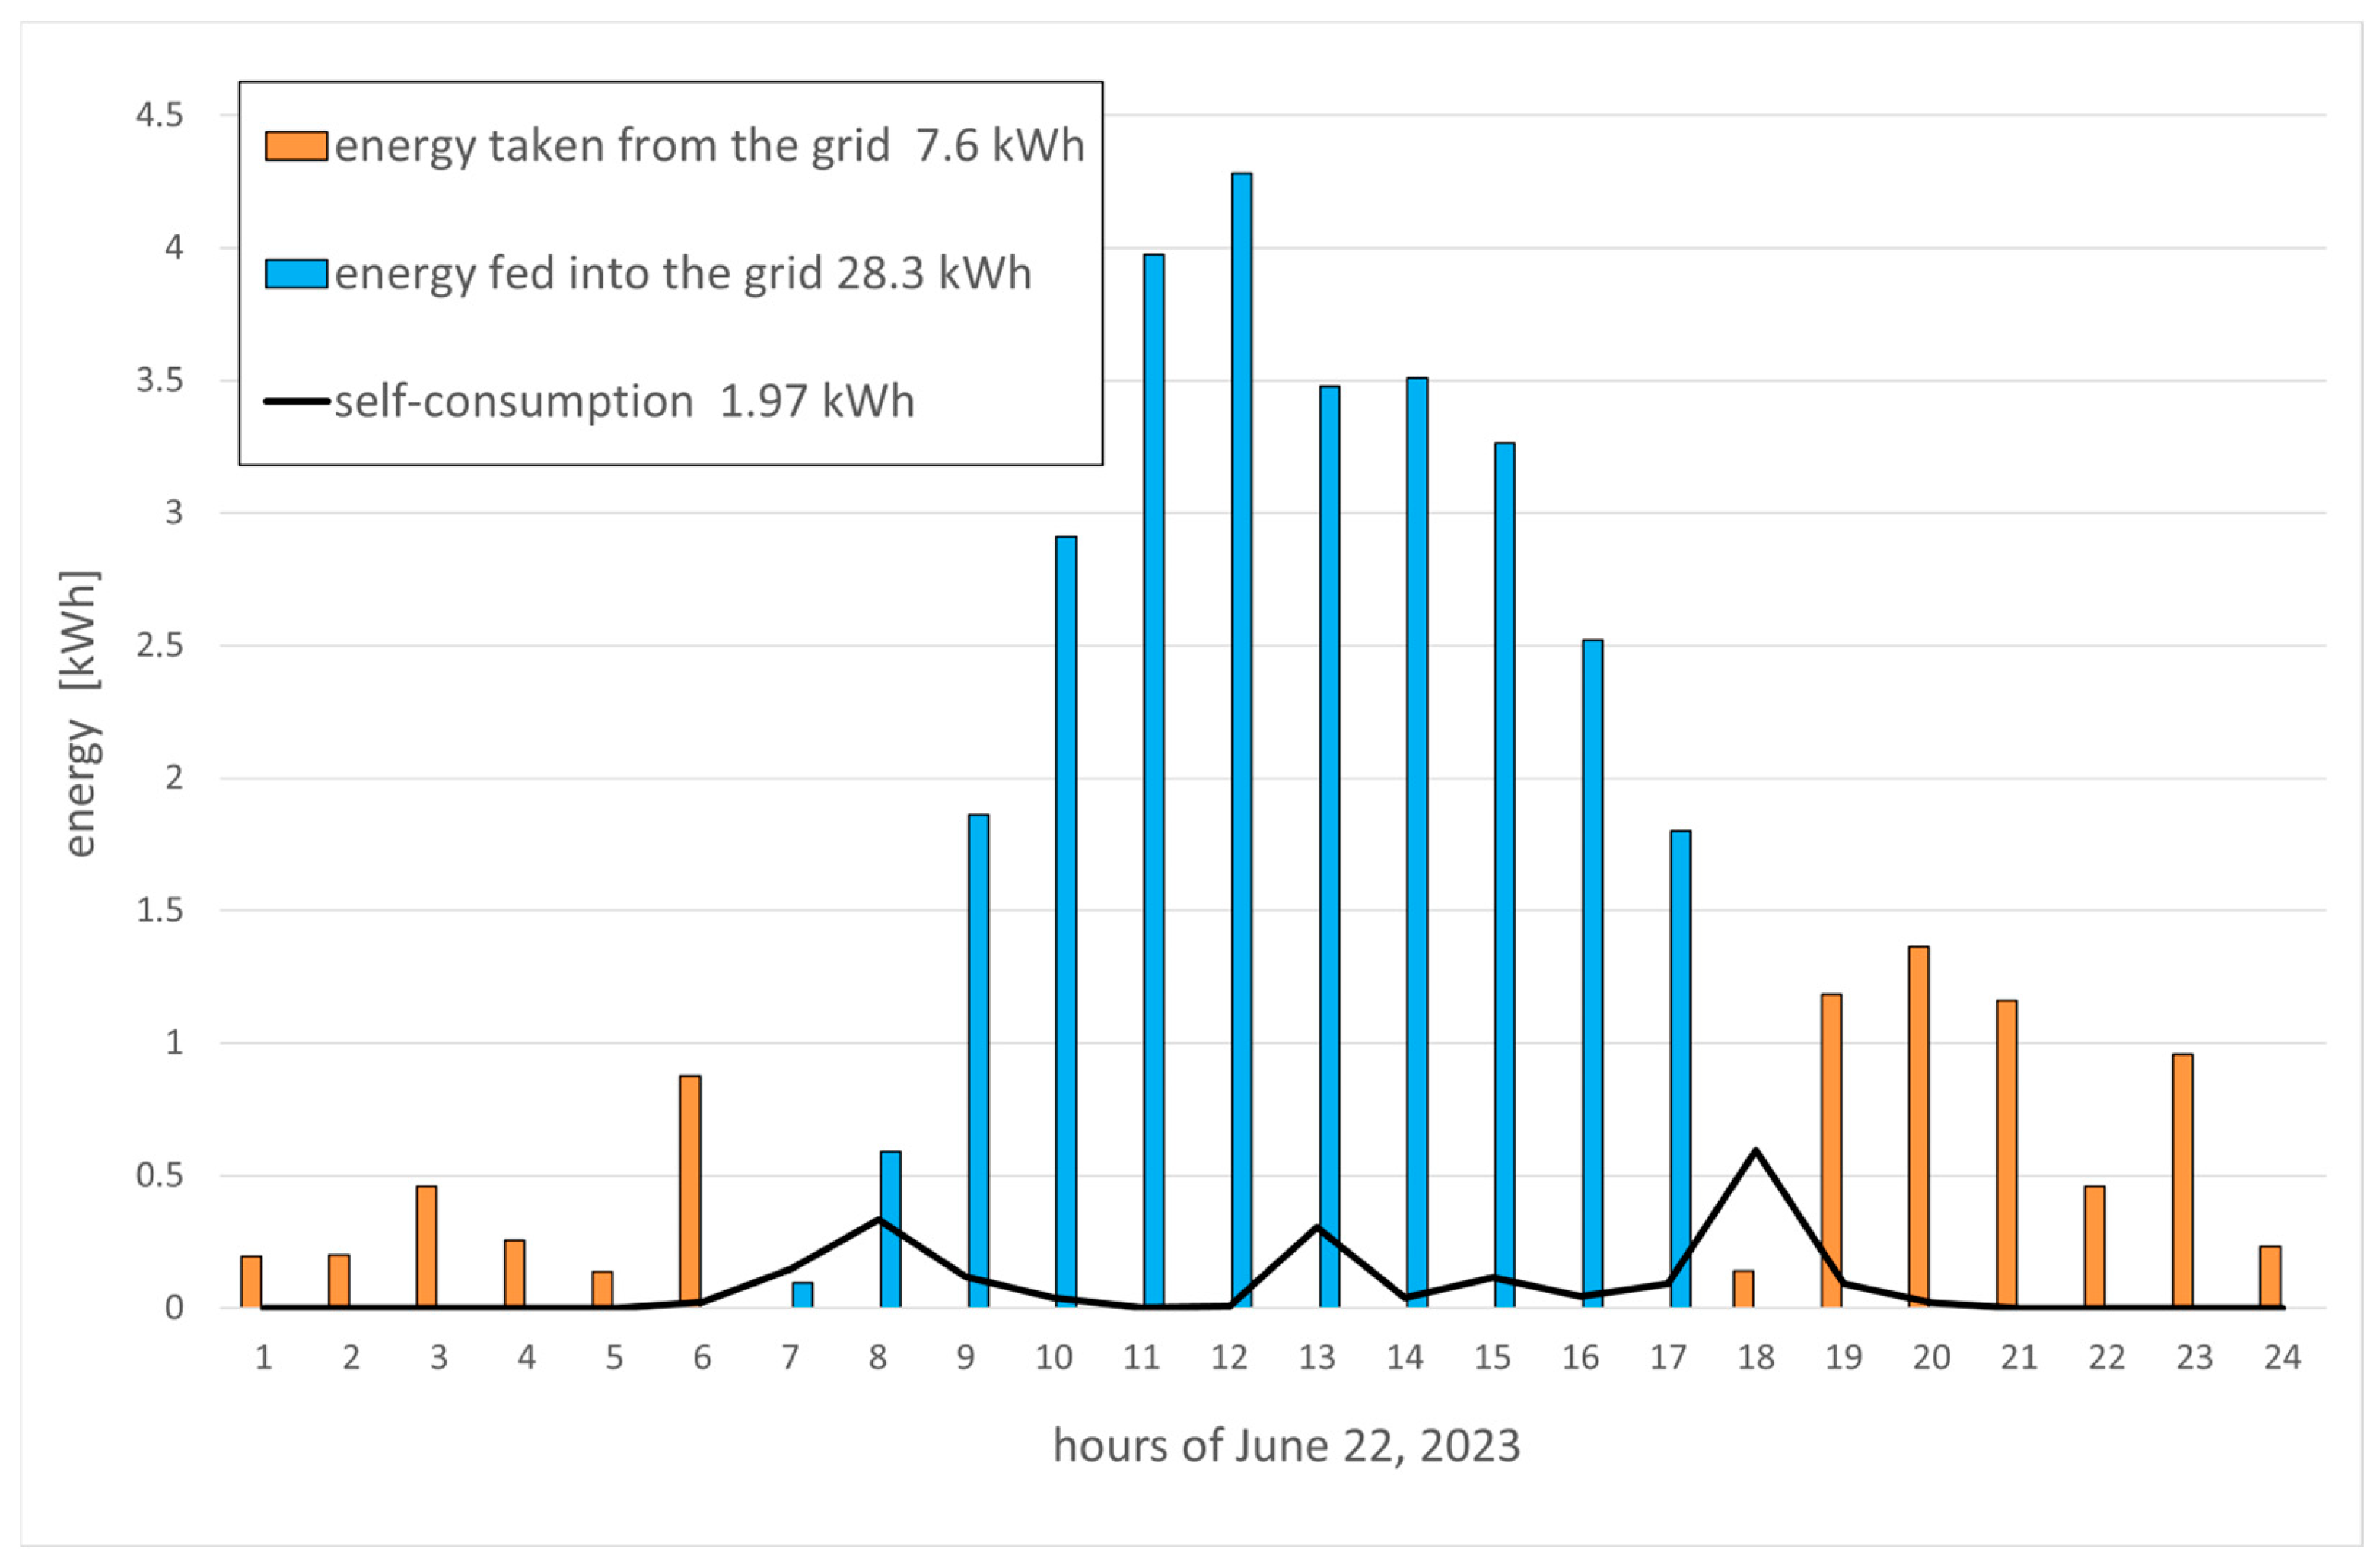
Figure 4 and Figure 5 illustrate the natural barriers limiting ESU performance under contrasting climatic conditions, presented for 23 December and 22 June 2023.
Figure 4.
Energy consumption, delivery, and self-consumption on 23 December 2023.
Figure 5.
Energy consumption, delivery, and self-consumption on 22 June 2023.
In December, PV production occurred between 10:00 a.m. and 1:00 p.m., slightly reducing grid consumption. Despite high demand, 0.8 kWh was exported. Due to low air temperature, the heat pump operated continuously, and the total daily consumption reached 44.3 kWh. Self-consumption amounted to only 1.08 kWh. On 22 June, the daily consumption was 7.6 kWh, while 28.3 kWh was exported. Despite high production, the self-consumption was 1.97 kWh, nearly identical in absolute terms to December. In December, 1.08 kWh represented 57.4% of total production; in June, 1.97 kWh represented only 6.5%. Storage limitations arise not only from low production (winter) but also from low demand (summer). Both conditions reflect extreme imbalance.
4.4. Storage Performance in Transitional Months and Months with the Largest Sunlight Differences
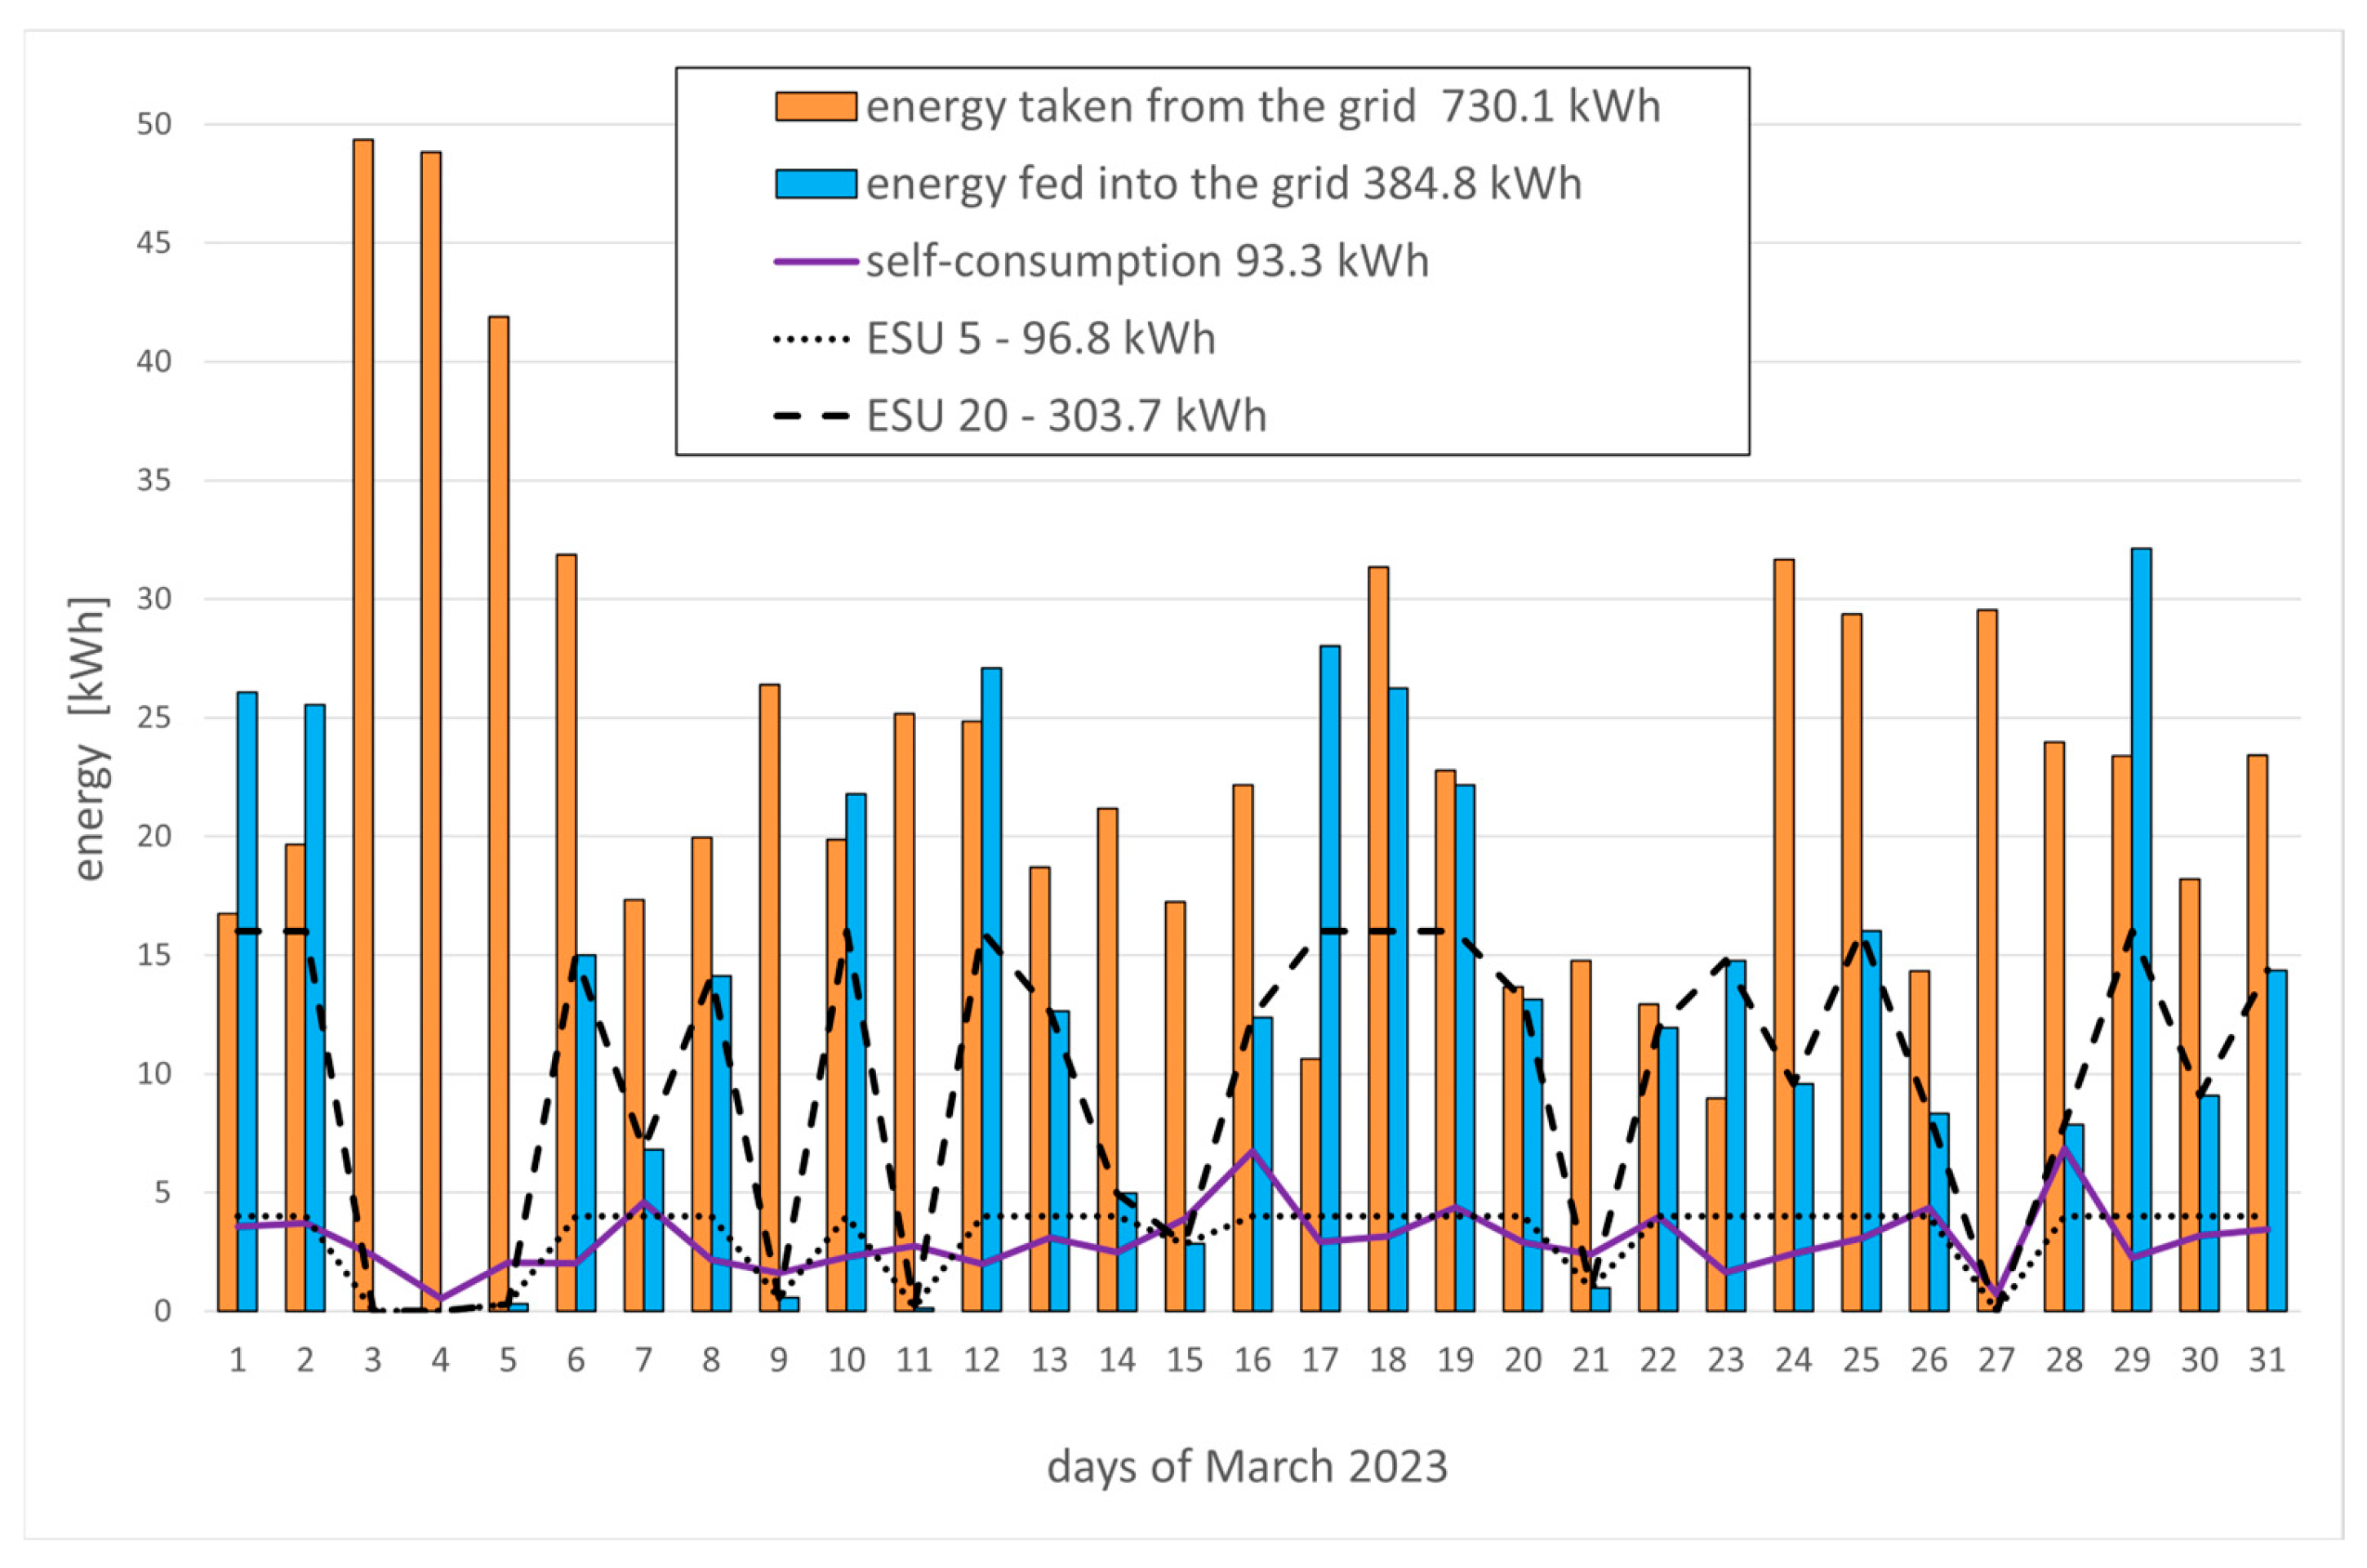
In March, 730.1 kWh was drawn from the grid, and 384.8 kWh was delivered. Self-consumption totaled 93.3 kWh (19.5% of 478.1 kWh production).
The dashed lines in the graph illustrate the daily energy storage capacity for storage system variants with real capacities of 4 kWh and 16 kWh. With daily surplus energy values ranging from a few to nearly 35 kWh, the ESU 5 storage system cannot absorb more than 4 kWh of the total daily surplus. If such a storage system operated without losses, the monthly self-consumption ratio would increase from 19.5% to 39.8% (Table 3). The utilization of surplus energy is significantly better in the ESU 20 variant. The energy utilized in this case amounts to a total of 303.7 kWh, which corresponds to an increase in self-consumption to 83% (Table 3).
Table 3.
Monthly actual energy self-consumption (ESC) and simulated self-consumption under three storage variants: ESC ESU 5, ESC ESU 20, and ideal energy storage (ESC IES), 2023 (kWh and %).
In order to identify certain issues related to energy storage, it is worth examining the graph in Figure 6 more closely. In the first days of March, the daily surplus exceeds 25 kWh. If the storage system, regardless of the variant, were fully charged, it would be unable to absorb additional energy on the following day, and the entire surplus from March 2 would have to be fed into the grid. On March 3, a high energy demand occurs; however, the energy stored on March 2 during the day was consumed during the night of March 2/3. From March 3 to March 5, the storage system remains empty, as no surplus energy suitable for storage occurs during this period. In the presented example, the ME 5 storage variant is essentially incapable of storing surplus generated energy, as these surpluses almost daily exceed its capacity. Even in the ESU 20 variant, not all surplus energy could be stored.
Figure 6.
Energy consumption and delivery balance in March 2023.
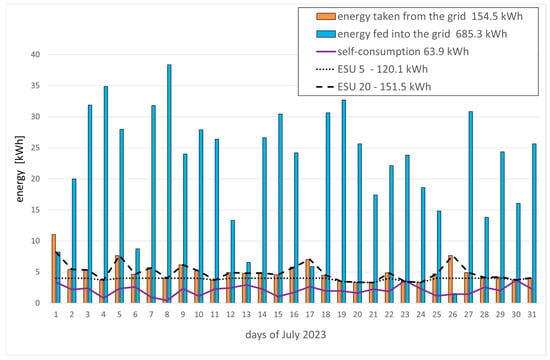
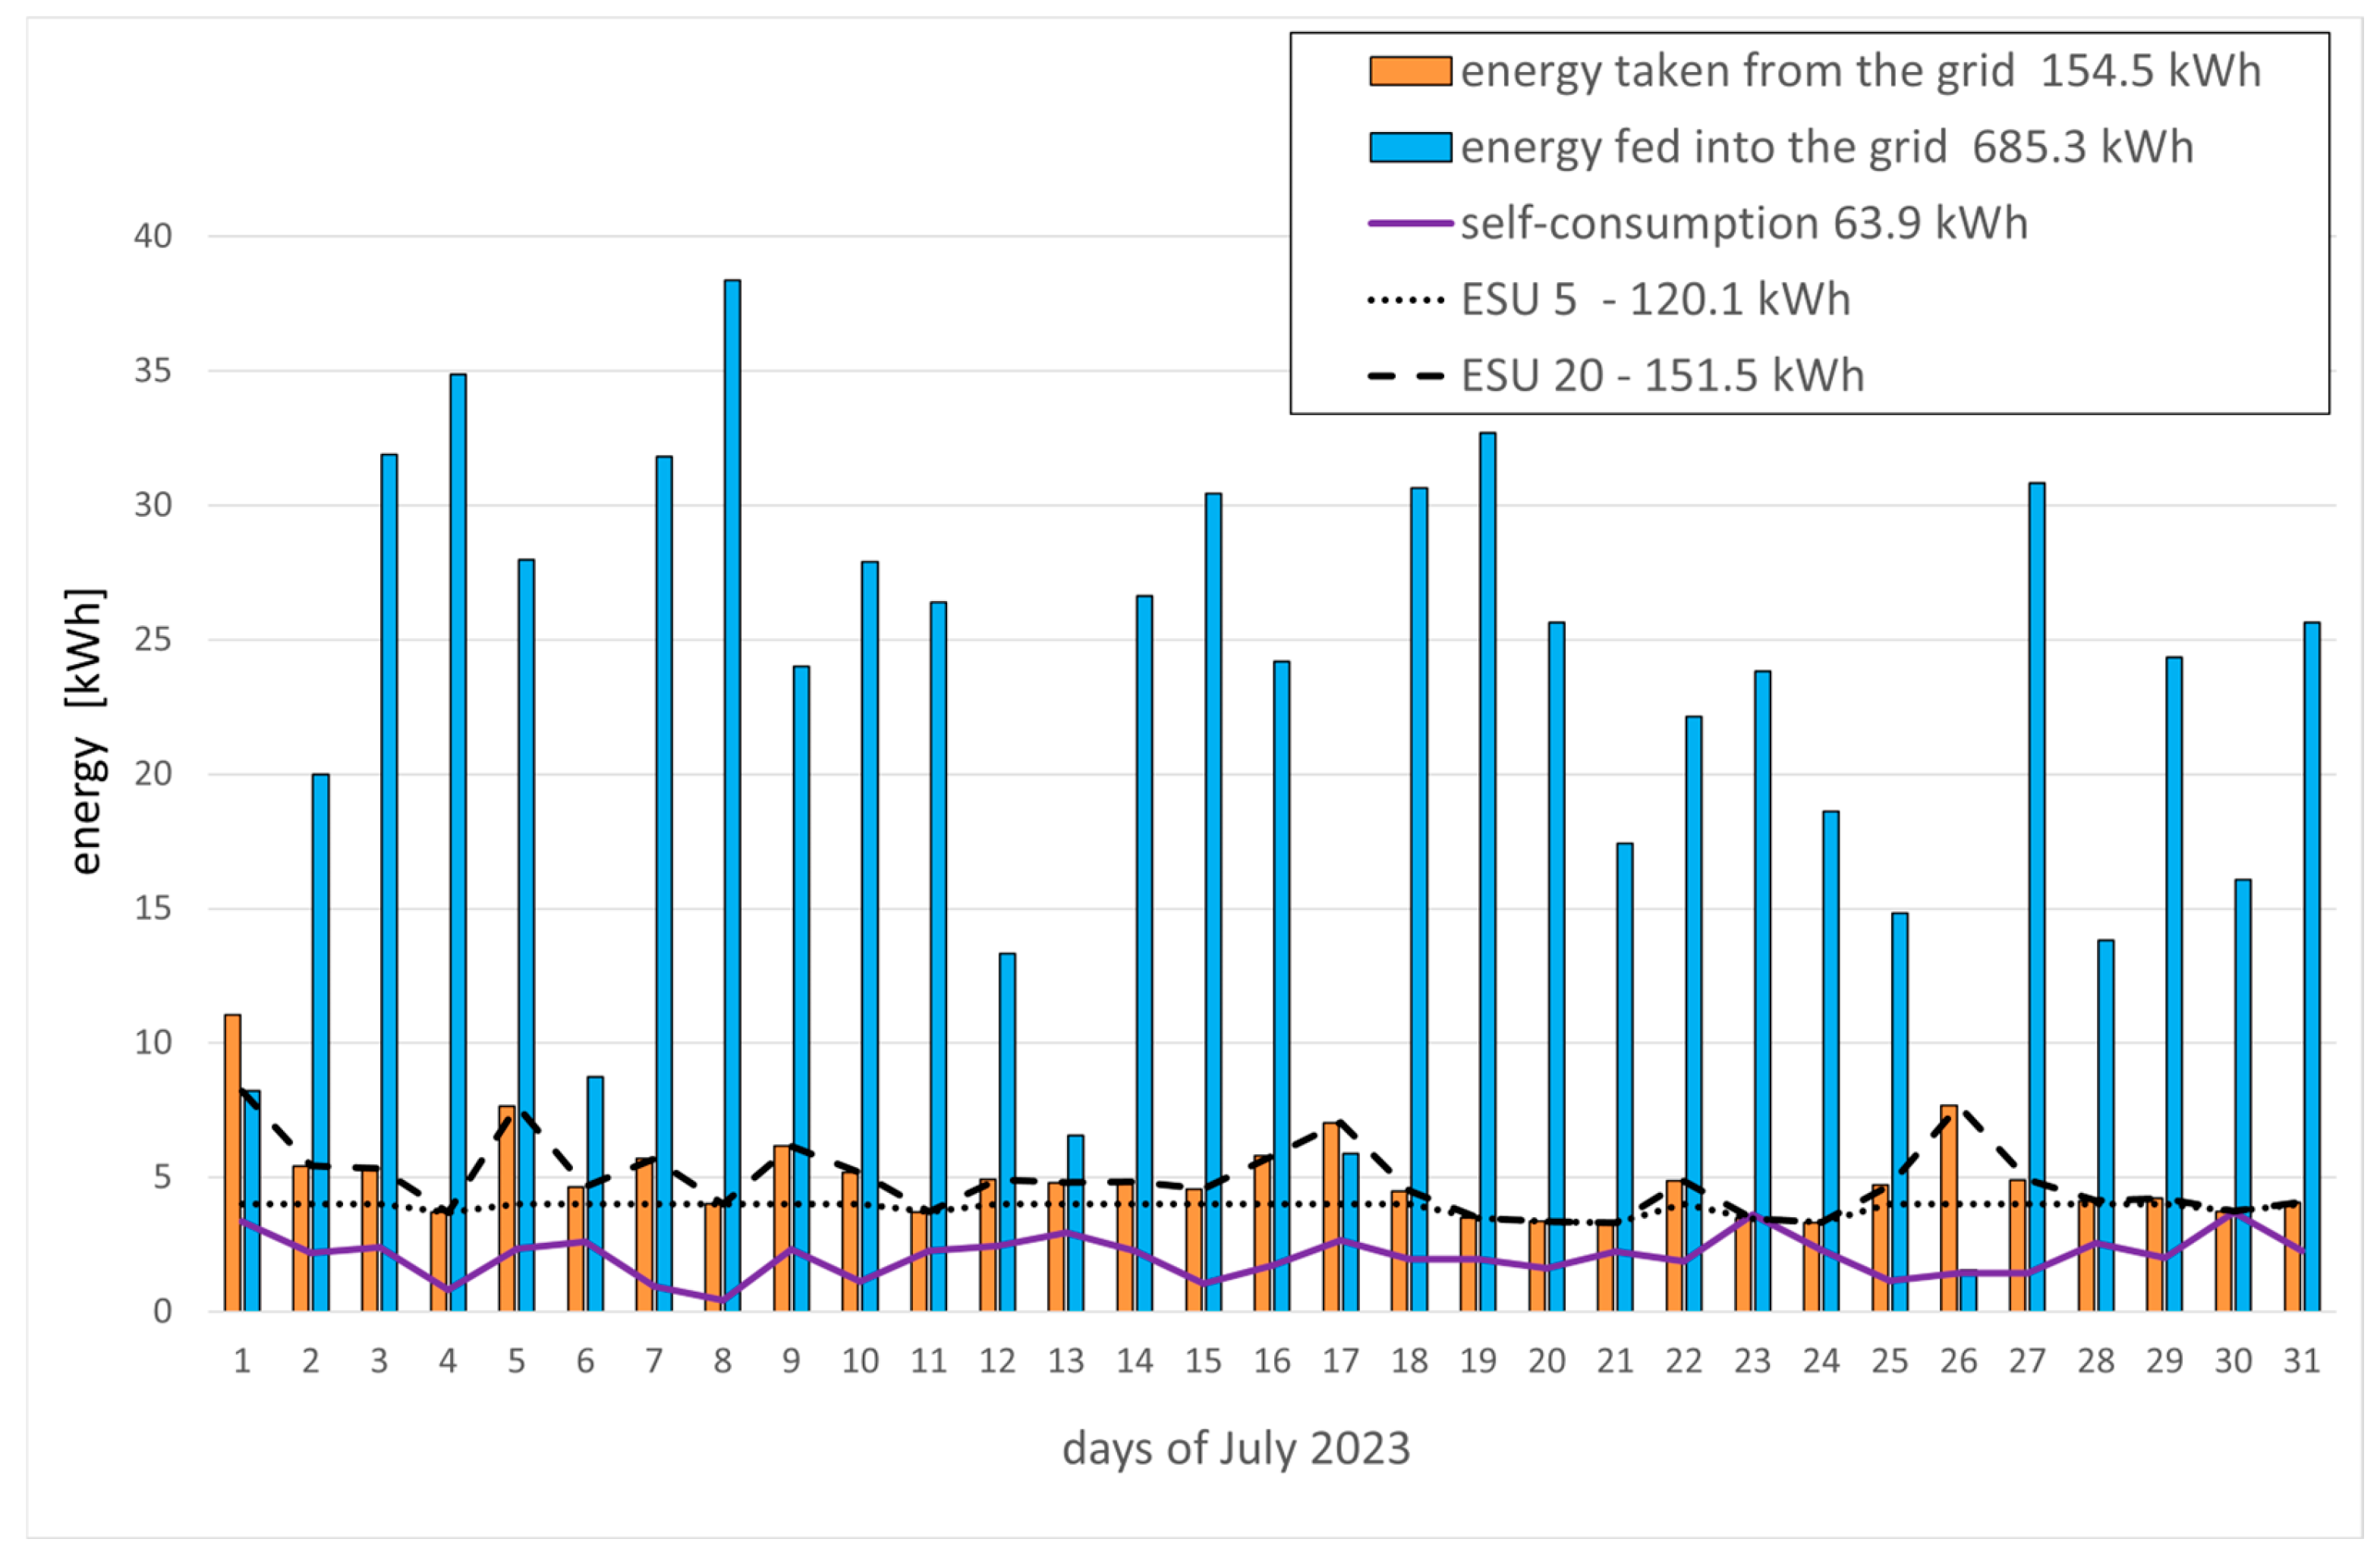
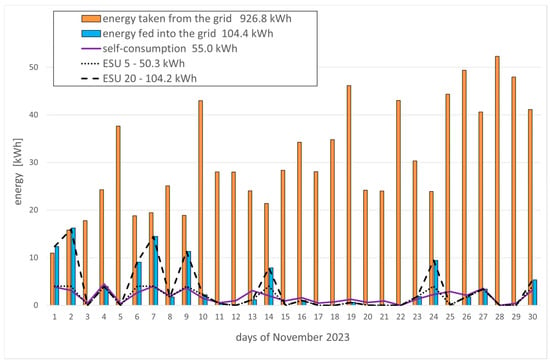
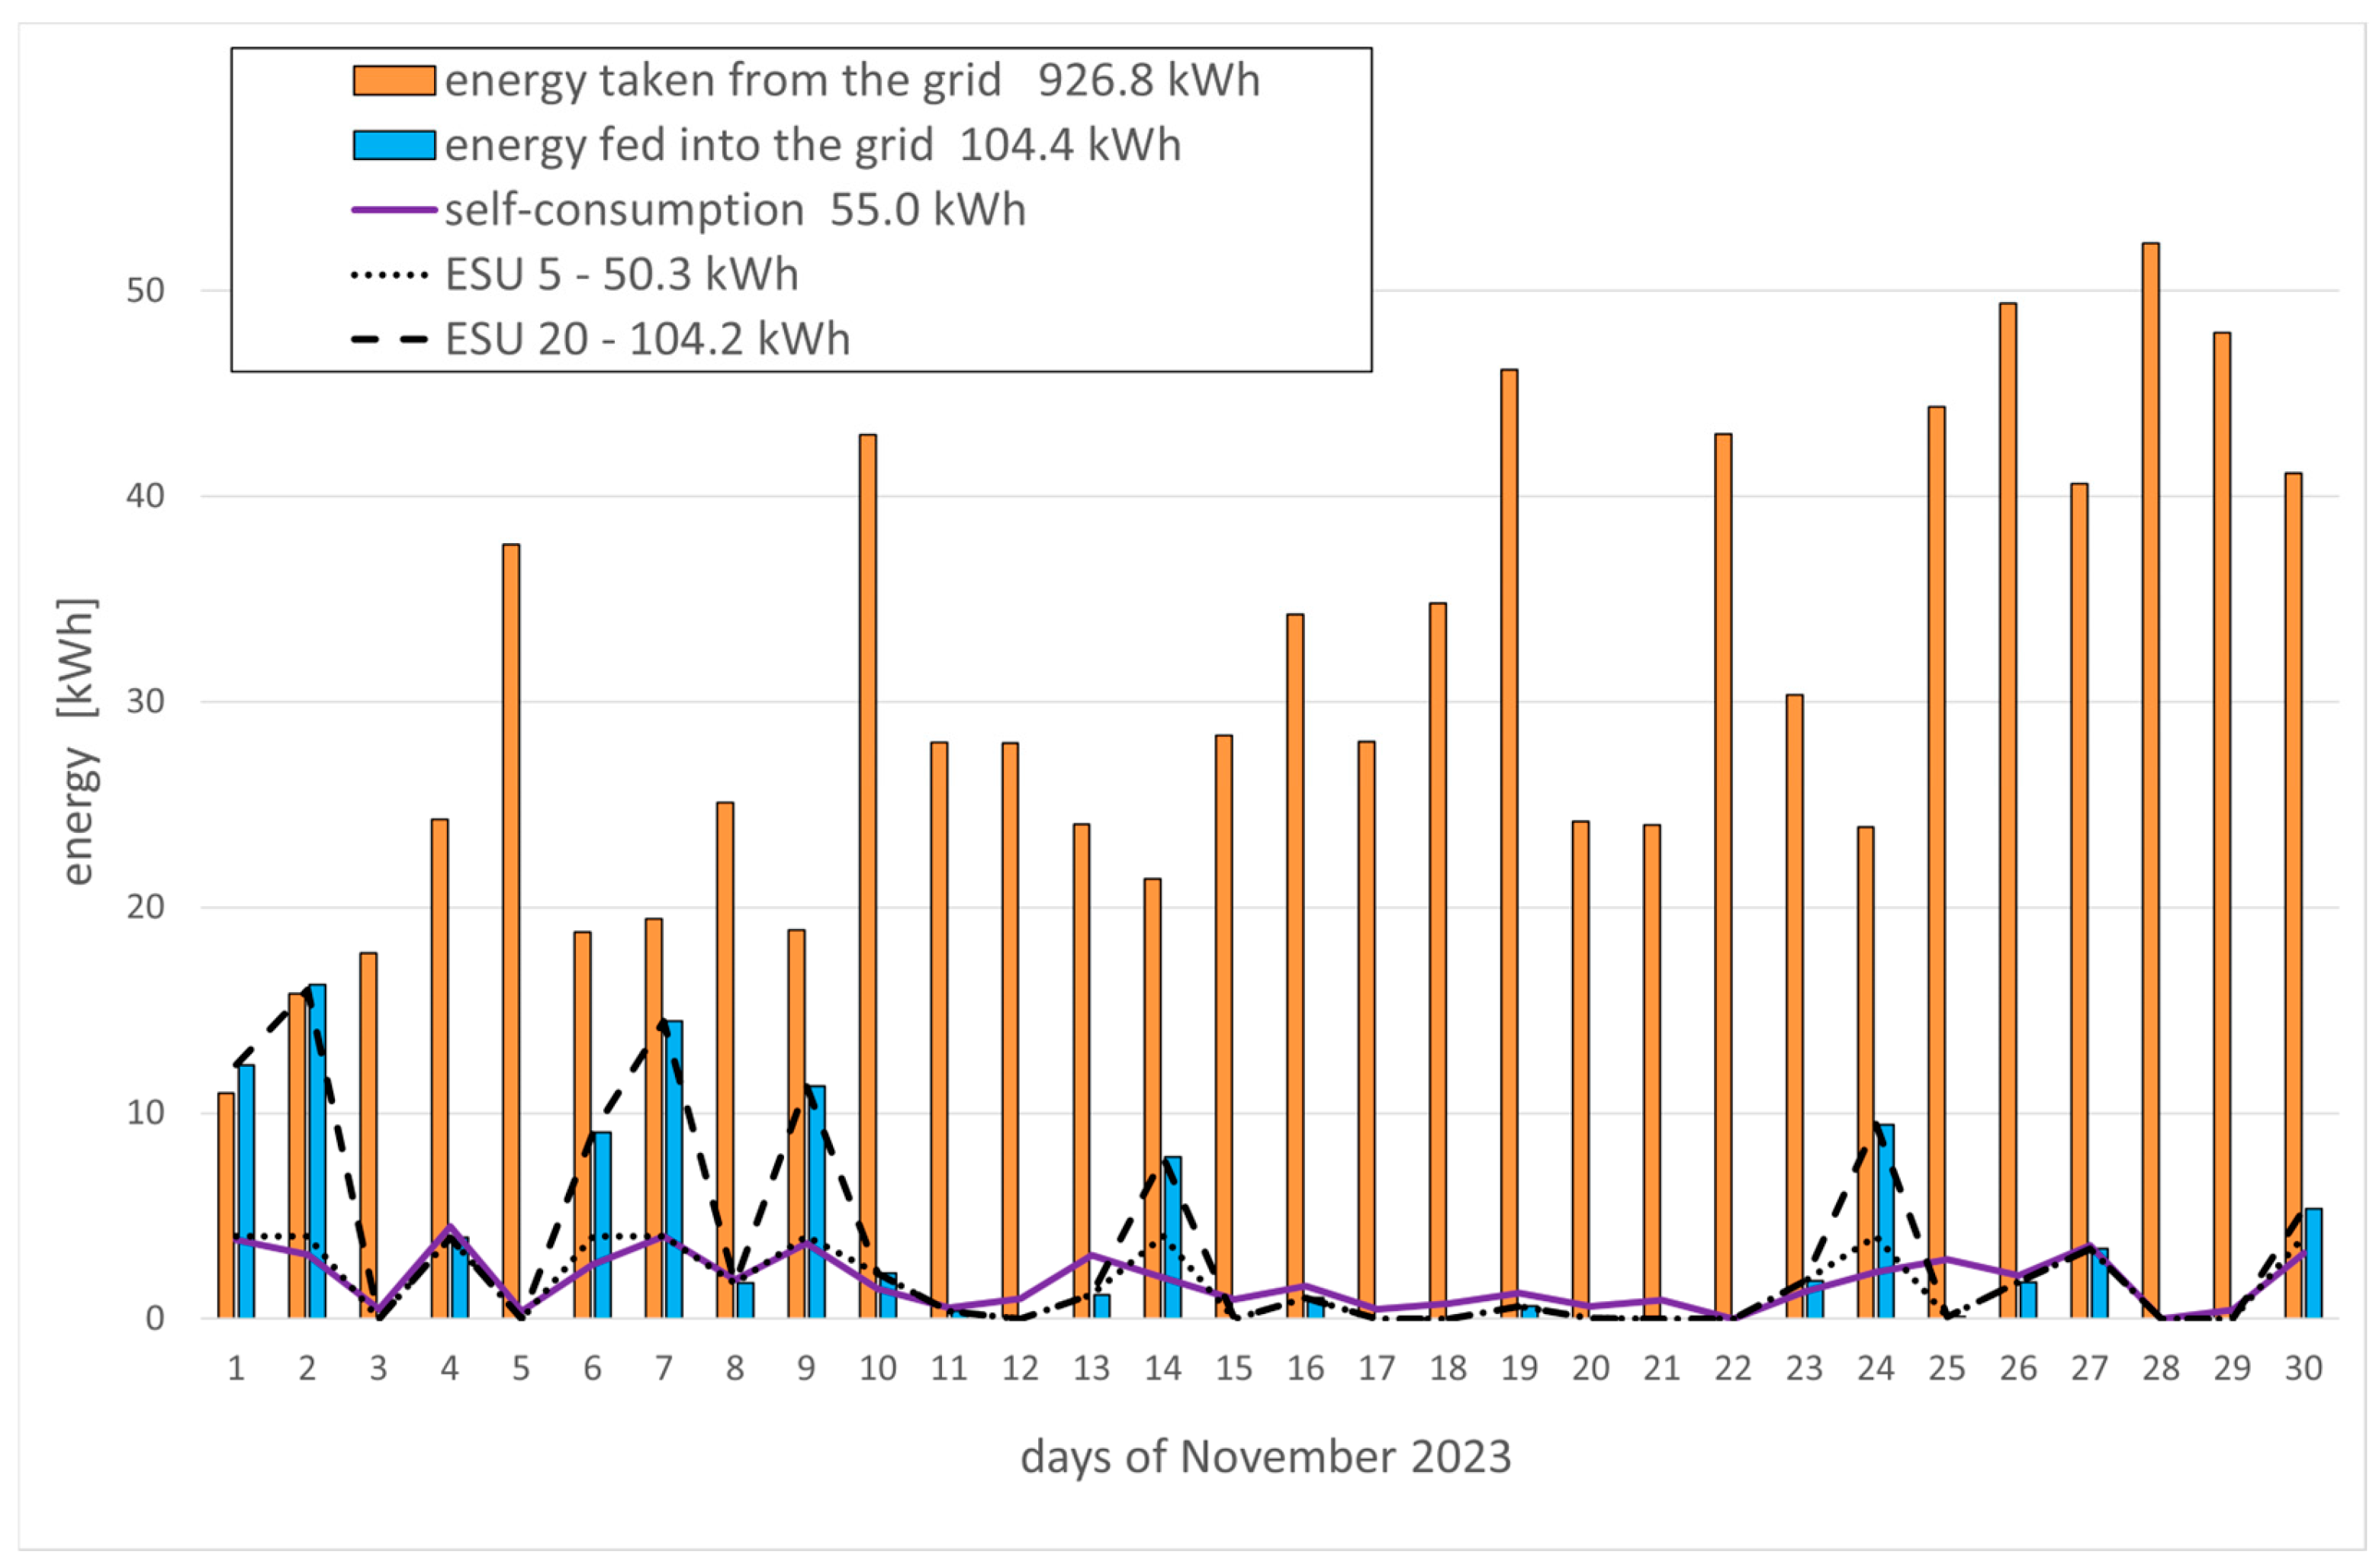
Despite these limitations, March represents favorable storage conditions (Figure 6). In contrast in July, 154.5 kWh was drawn from the grid, and 151.5 kWh was self-consumed (8.5% of 749.2 kWh production). ESU 5 increased self-consumption to 24.6%, and ESU 20 to 28.7%. The limiting factor was low demand (Figure 7). In November, consumption reached 929.8 kWh, while only 159.4 kWh was produced. Self-consumption was 34.5%. ESU 5 increased it to 66.1%, and ESU 20 to 99.9%. However, the daily surpluses were small; so, ESU 20 utilized only a fraction of its capacity (Figure 8). Effective storage requires relative balance between production and consumption. July and November represent extreme imbalances, whereas transitional months—March, April, May, October provide optimal conditions.
Figure 7.
Energy consumption and delivery balance in July 2023.
Figure 8.
Energy consumption and delivery balance in November 2023.
4.5. Annual Self-Consumption Under Different Storage Scenarios
Table 3 summarizes the actual level of energy self-consumption (ESC) observed in the analyzed household, as well as the simulated self-consumption of electricity generated by the PV installation in cooperation with energy storage under three variants: ESU 5 (ESC ESU 5), ESU 20 (ESC ESU 20), and the ideal energy storage unit (ESC IES). The results are presented on a monthly basis for 2023.
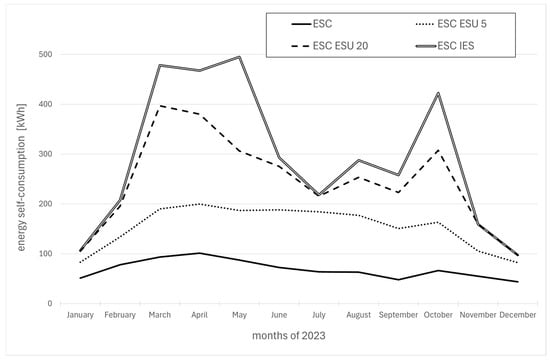
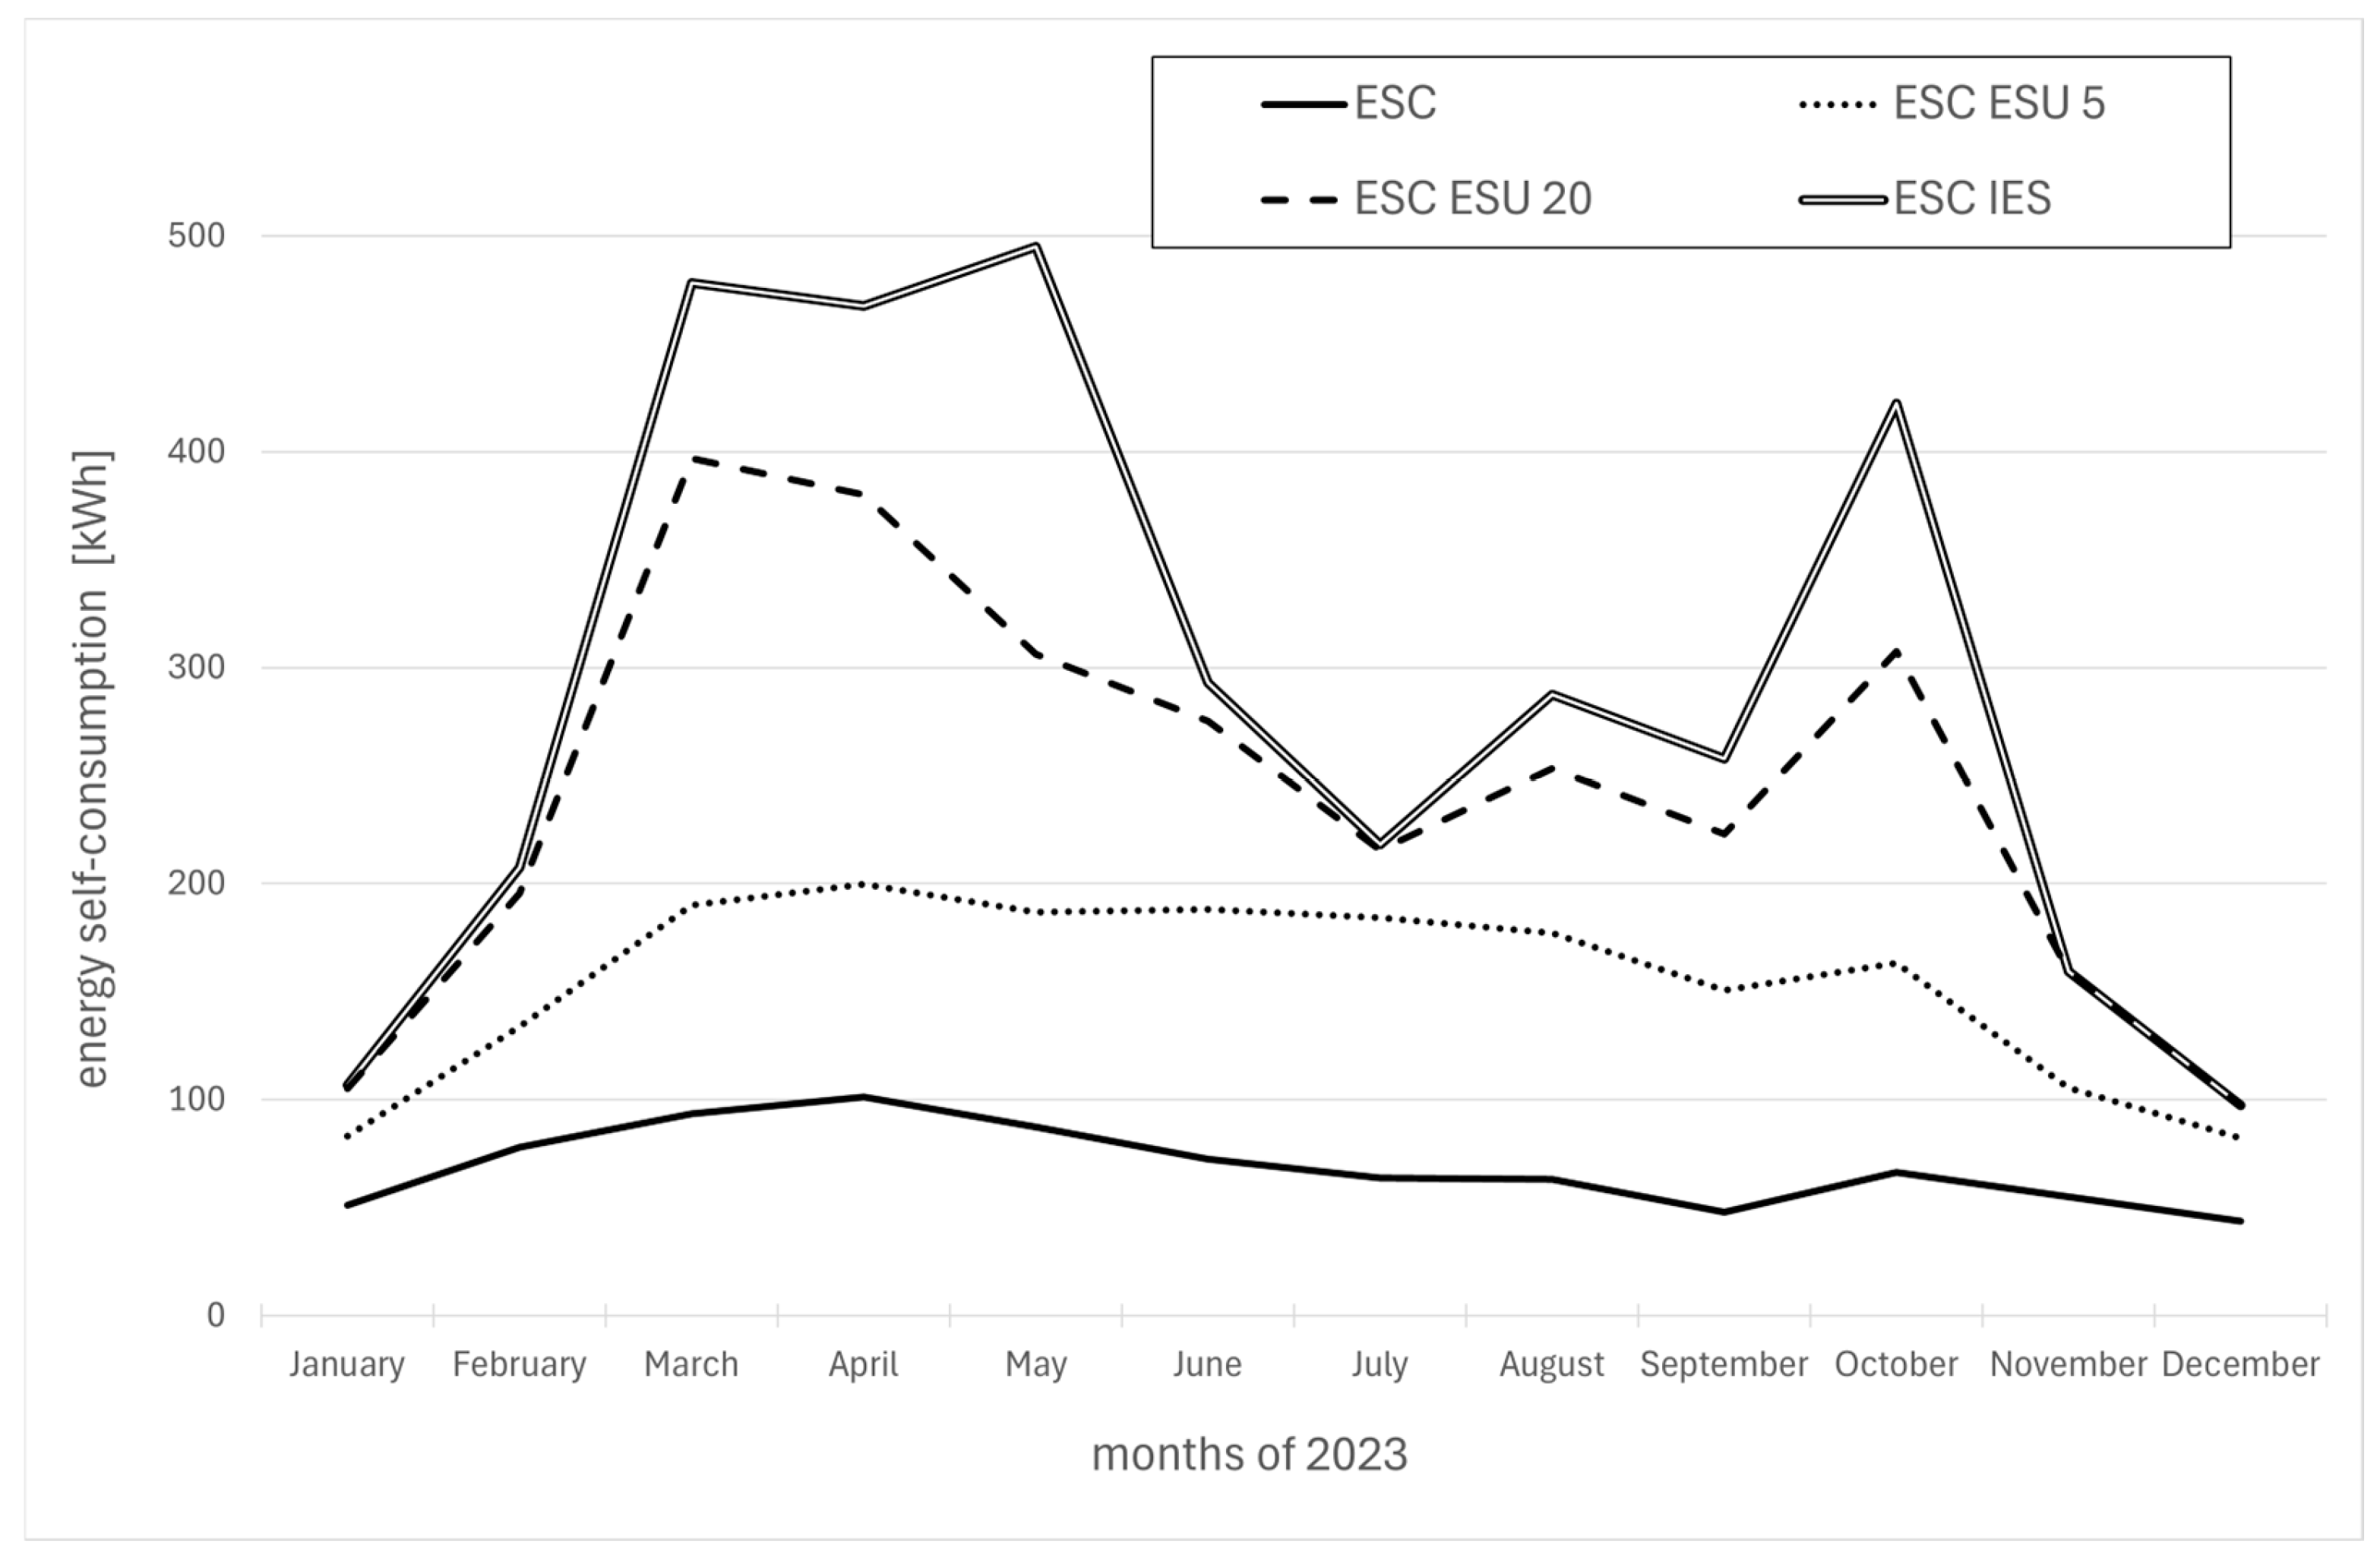
Figure 9 presents the simulation results of energy storage for the ESU 5, ESU 20, and ideal energy storage (IES) variants across all months of the year. The solid line represents the level of actual self-consumption calculated on the basis of the measured data (ESC) (Table 3).
Figure 9.
Monthly volume of energy stored and utilized under ESU 5, ESU 20, and ideal energy storage (IES) variants compared with actual self-consumption (ESC) without storage (kWh).
On an annual basis, self-consumption in the ESU 5 variant reaches 34.4%, representing more than a twofold increase compared to the no-storage scenario (15.4%). In the ESU 20 variant, self-consumption increases to 54.3%. The theoretical upper limit of self-consumption is determined by the ideal energy storage (IES) scenario, reaching 65.1%.
5. Economic Assessment of Residential Energy Storage
5.1. Financial Evaluation Methodology
The technical analysis presented in the previous sections demonstrates that residential energy storage increases self-consumption but does not eliminate the seasonal mismatch between PV generation and household demand. Therefore, an economic assessment is required to determine whether such systems can be financially justified under current market conditions. Investment efficiency is commonly evaluated using indicators such as the Net Present Value (NPV) and the Internal Rate of Return (IRR). However, these indicators are primarily designed for commercial projects and may be difficult to interpret in the context of small-scale residential investments. Therefore, a simplified financial assessment approach conceptually derived from the NPV framework was adopted in this study. It was assumed that the investment would be financed through a bank loan repaid in equal annual instalments. Under this amortization structure, annual payments remain constant, with an increasing principal component and decreasing interest payments over time. These annual instalments can be directly compared with the net annual savings resulting from the installation of an energy storage unit (ESU). An investment is considered financially viable if the annual savings exceed the annual loan instalment. Otherwise, the project generates a negative cash flow and requires additional financial contributions from the investor. Thus, the latter notion has been named “minimum annual savings required (M)” and is calculated according to the following formula.
where
- M = minimum annual savings required,
- CAPEX = capital expenditures, here, the initial investment for ESU purchasing and installation,
- r = discount year,
- n = life cycle—years of.
It is a simplified use of one of the consequences of the NPV model in which future cash flows are discounted and compared to the initial investment. In such cases the following formula is used:
where
- NPV = net present value,
- CFt = net cash flow in a given period,
- r = discount rate,
- t = time period (in this article—year),
- n = total number of periods (years),
- CAPEX = initial investment, here, for ESU purchasing and installation.
The above given formula is correct only if CAPEX is spent in the opening period (year zero) and all subsequent flows result from the operation. The case under consideration meets this requirement. If so, CAPEX can be unwinded using a constant installment pattern like in (2) and presented as a set of periodic cash outflows instead of one payment matching inflows from the savings on electricity expenditures. If the latter ones are considered equal in every year, which can also be the case, it is justified to compare just one annual set of cash flows consisting of (1) annual savings and (2) annual instalment resulting from CAPEX, which equals the minimum annual savings required to justify the investment.
Application of this methodology requires the determination or estimation of the following parameters:
- Net annual savings;
- Investment period, assumed to be equal to the ESU life cycle;
- Total investment outlays for ESU purchase and installation, including integration with existing systems;
- The discount rate.
The net annual savings were calculated using the data presented in Table 3. First, the volume of electricity shifted in time due to storage operation was determined (Table 4). On an annual basis, the amount of stored electricity equals 1020 kWh for the small ESU, 2091 kWh for the large ESU, and 2667 kWh for the ideal storage unit.
Table 4.
Calculation of electricity volume transferred due to application of ESUs under analysis.
Because the ideal energy storage construct (IES) represents a theoretical concept not available on the market, reliable data regarding investment costs and life cycle are unavailable. Therefore, it was excluded from further financial analysis.
5.2. Electricity Price Assumptions and Settlement Schemes
The monetary effects of storage can be expressed as the net monetary gain from storage and withdrawal operations. This monetary gain results from the difference between the following:
- (1)
- Gross monetary gain = savings from the replacement of energy originally purchased from a grid with one coming from storage,
- (2)
- Sales back revenue lost = value of electricity originally provided to a grid directly from PVs, which is stored when an ESU is operating.
The monetary effects of storage were calculated using 2025 electricity prices while maintaining 2023 as the reference year for energy production and consumption data. In Poland, two electricity settlement schemes remain relevant for prosumers: the former net-metering system and the newer net-billing system. Calculations were performed for both schemes (Table 5 and Table 6). Under the net-metering scheme, residential users effectively recover approximately 80% of the electricity fed into the grid, as 80% of the exported electricity can be deducted from grid consumption [30,31,32]. Under the net-billing scheme, prosumers receive the market price for exported electricity. This price corresponds to the monthly average REMc value published by the Polish transmission system operator (PSE) [31,33,34,35]. This rule applies to installations connected before 1 July 2024; later installations are settled using hourly prices. For simplicity, the monthly REMc prices were applied in this study. The retail electricity price was based on the Tauron G11 tariff as of December 2025, which specifies a constant rate of 0.98117 PLN/kWh. This value consists of an energy price of 0.62115 PLN/kWh and variable distribution charges of 0.360021 PLN/kWh [36]. The actual REMc prices used in the analysis are presented in Table 6.
Table 5.
Net savings from storage and increased self-consumption under the net-metering scheme.
Table 6.
Net proceedings from storage and increased self-consumption under the net-billing scheme.
Savings under the net-billing scheme are nearly four times higher than under the net-metering scheme. Under the latter system, savings are minimal, indicating that prosumers operating under net-metering contracts have little economic incentive to install residential energy storage.
5.3. Energy Storage Cost and Lifetime Assumptions
Estimating the life cycle of energy storage systems is challenging because the durability depends on several factors, including the battery chemistry, manufacturing quality, operating conditions, and temperature [24,25,26,37]. Lithium-ion batteries dominate the residential storage market, although several different chemistries are used. Alternative technologies such as sodium-ion batteries are also emerging. The battery lifetime is often expressed either in calendar years or in charge–discharge cycles, which further complicates comparisons. Unlike many conventional devices, batteries rarely fail abruptly. Instead, their storage capacity gradually decreases over time. Replacement decisions therefore depend on the capacity threshold considered acceptable by the system owner. Beltran et al. (2020) investigated battery degradation using different end-of-life thresholds [38]. At a remaining capacity of 70%, the battery life ranged from 5.61 to 15 years, whereas at a 60% threshold the range extended from 7.44 to 18.37 years [39]. Considering these results, a life span of 5–15 years was adopted in the present study depending on the assumed quality class of the ESU. It must be also noted that the financial method used here allows comparing different life spans directly. The annualization technique uses a standardized year, and variations in time frame are automatically reflected in the value of annual payments—if a period is shorter, then the corresponding payment becomes larger, and oppositely, an expanding life-time results in lower annual payments. The investment costs were estimated using two data sources. Device prices were obtained from the sun.store platform [40], which reports average monthly prices per kWh of nominal storage capacity across three quality categories: high-voltage premium, high-voltage performance, and low-voltage units for residential and commercial markets. Classification to specific groups has not been explicitly disclosed by sun.store [40]. Typically, high voltage means at least 60 V, although such batteries can provide 100 V. Inclusion either to the premium or to the performance of specific brands remains confidential. Data for residential systems as of December 2025 were used. Installation and system integration costs were based on the information obtained from a large installation company. When price ranges were available, representative values were selected consistently with the assumed quality classes. The discount rate also required determination. In commercial projects, analysts often use the Weighted Average Cost of Capital (WACC) or comparable investment opportunities. Such approaches are less suitable for residential investments. In practice, household investments are financed either from personal savings or through loans. These options represent opposite ends of the interest-rate spectrum: bank deposits typically offer very low returns, whereas consumer loans often exceed 10%. The authors consider mortgage loans to be the most appropriate benchmark, as such financing instruments may also be used to fund improvements to residential properties, including energy systems [26].
5.4. Financial Results
The results of the financial analysis are presented in Table 7. Financial viability requires that annual savings equal or exceed the annual instalment of the hypothetical loan financing the ESU investment. Financial efficiency is reflected as a relation between the estimated savings and the minimal annual savings required expressed in percentages. Results above 100% indicate that a project is viable, while the difference between the results below this threshold’s value (100%) shows the gap to be covered via external factors like subsidies.
Table 7.
Financial efficiency of investment in ESU under different assumptions.
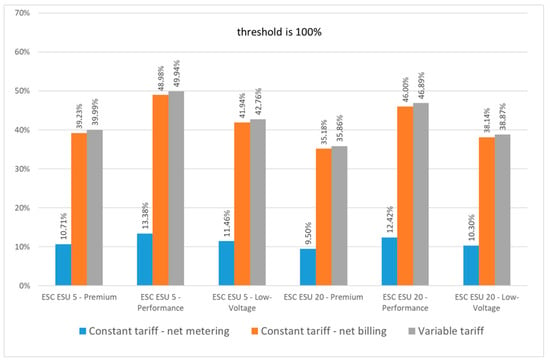
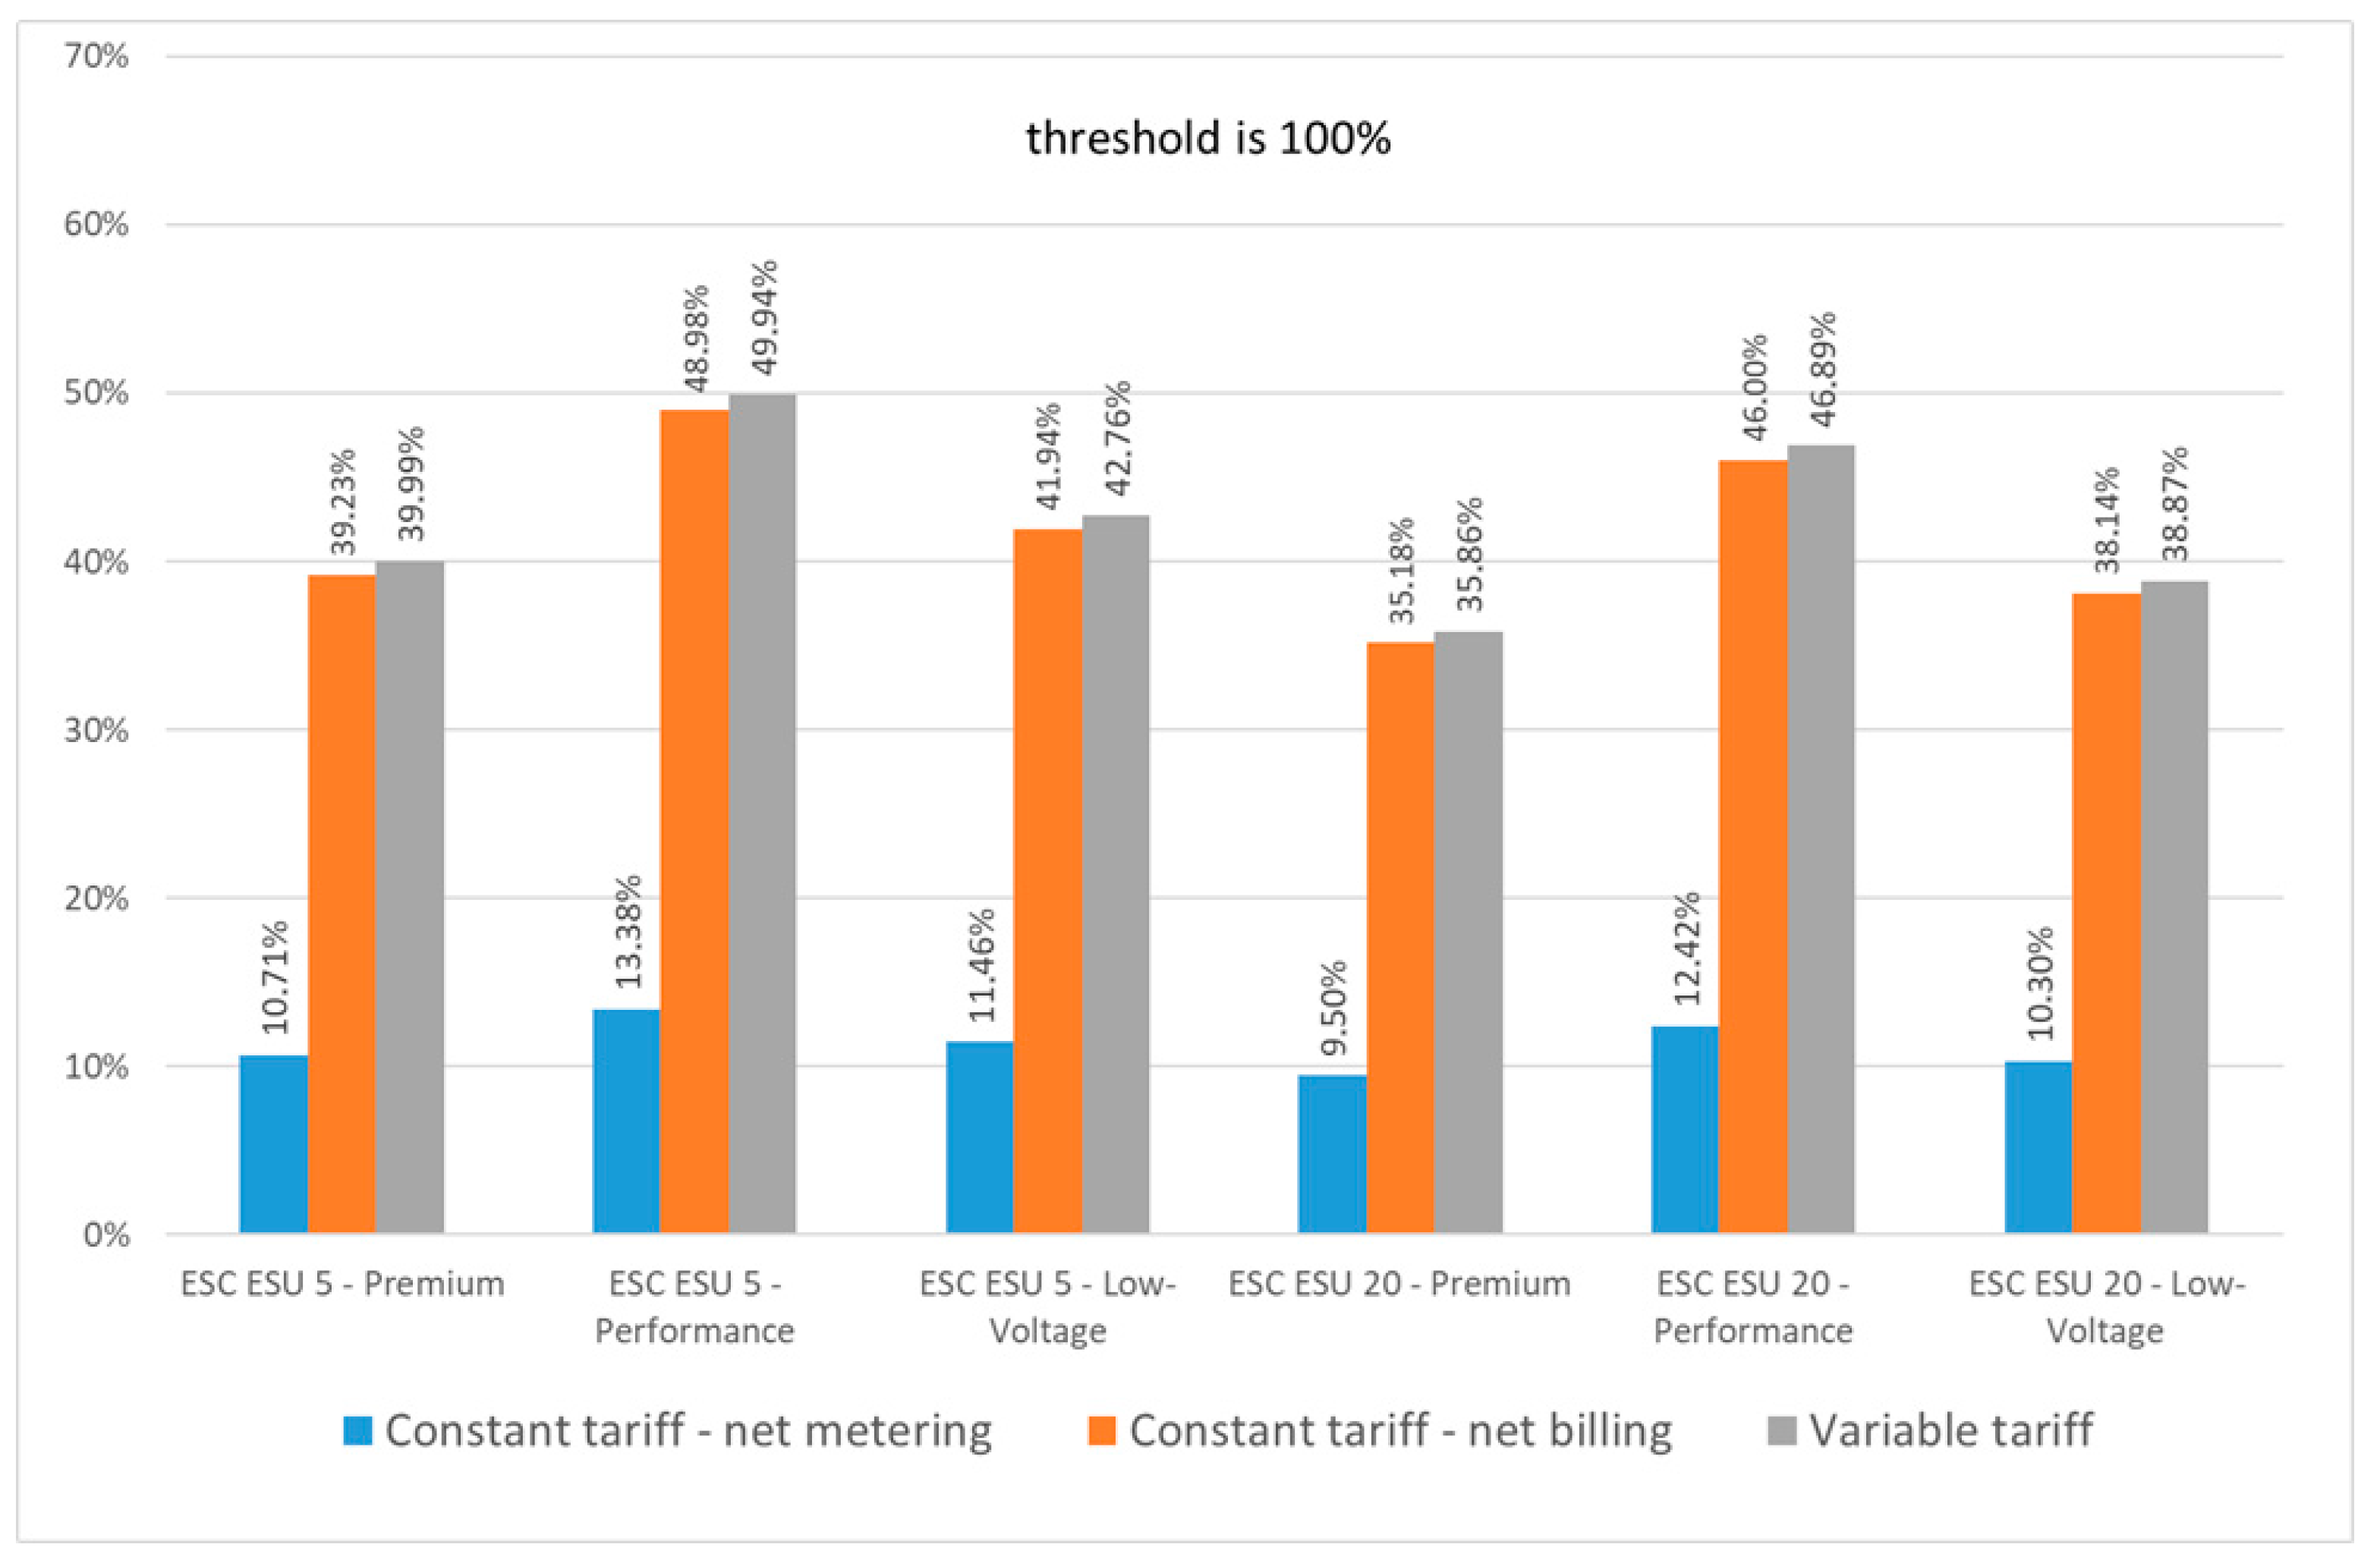
The differences in annual instalments across quality levels are relatively small compared with the differences in the total investment costs, as higher equipment prices are partially compensated by longer life spans. As expected, prosumers operating under the net-metering scheme achieve savings corresponding to only slightly more than 10% of the annualized investment cost. Even under the net-billing scheme, the results remain insufficient to justify the investment. The most favorable scenario—high-voltage performance ESU with a five-year life cycle assumption—covers slightly less than 50% of the annualized investment cost. These results indicate that residential battery storage currently provides limited economic value under Polish market conditions.
5.5. Sensitivity Analysis: Time-of-Use Tariffs
Potential improvements in investment profitability may arise from the use of time-of-use tariffs. Under such tariffs, energy stored during off-peak periods may be discharged during peak-price periods. However, assuming that 100% of stored electricity is discharged during peak periods would be unrealistic. In the G12W tariff, weekends are treated entirely as off-peak periods. Consequently, a significant share of self-consumption occurs at lower electricity prices. In addition, household electricity demand often increases during weekends, when energy-intensive activities such as washing or ironing are performed. Table 8 and Table 9 present calculations for the net-billing scheme using the G12W tariff. The peak electricity price equals 1.214871 PLN/kWh, while the off-peak price equals 0.482682 PLN/kWh. A 70/30 distribution between peak and off-peak consumption was assumed.
Table 8.
Net proceedings from storage and increased self-consumption under the net-billing scheme and applying on/off-peak tariff.
Table 9.
Financial efficiency of investment in ESU under different assumptions and applying on/off-peak tariff.
Figure 10 summarizes the financial results for all analyzed scenarios. Although time-of-use tariffs slightly improve the financial performance, the overall effect remains limited, because higher peak prices are largely offset by lower off-peak prices.
Figure 10.
Comparison of financial efficiency across the analyzed scenarios.
In addition to the above presented analyses, for the variable tariff scenario, a classical NPV was calculated based on Formula (4), in which CAPEX is included in the annual cash flow.
To keep consistency in all cases, a 30-year-long lifetime period was considered. This assumption implied that the number of investments was different depending on the lifetime of a given ESU class. For the premium class only one renewal was needed, in the 15th year; so, the number of investments was assumed to be two. Based on similar logic, for the performance class it was three, and for low-voltage, it was six. Renewal investments were assumed to be equal to the original ones. In practice, some old elements of setting can be kept and reused, but on the other hand, the removal costs of the deinstalled components should have been added. In Table 10, NPVs are presented for all six combinations. Consistent with the previous results, the NPV is always negative, which indicates that none of the options is financially viable. As the variable tariff investing in ESU was the most efficient (or, more precise, least inefficient), calculations for the remaining tariffs were omitted. It must be also underlined that NPV is not a relative measure; therefore, it cannot be used for ranking various solutions, e.g., the fact that NPV is the least negative in the case of ESC ESU 5 in the performance class does not imply it is the best option.
Table 10.
NPV calculations for investment in ESU under applying on/off-peak tariff.
5.6. Limitations of the Financial Model
The modeling approach presented above has several limitations. Assumptions likely to reduce investment efficiency are marked (–), whereas those potentially improving efficiency are marked (+):
- (–) ESU capacity degradation during the life cycle was not explicitly modeled.
- (–) Energy losses during charging and discharging were omitted.
- (–) ESU maintenance costs were not included.
- (–) Transaction and opportunity costs borne by the household were not considered.
- (+) Subsidies and other forms of public financial support were omitted.
- (–) End-of-life disposal costs were not included.
- (+) Under time-of-use tariffs, ESUs may store not only PV-generated electricity but also off-peak electricity from the grid, enabling limited price arbitrage.
These simplifications indicate that significant public subsidies or major changes in tariff structures would likely be required to make residential ESU investments economically attractive under current conditions.
6. Discussion: Structural Limitations of Residential PV–Battery Systems
The findings reveal structural constraints affecting the effectiveness of residential PV–battery systems under Central European climatic conditions. First, the strong seasonal mismatch between photovoltaic generation and household electricity demand significantly limits the potential of short-term storage technologies. PV production is concentrated in late spring and summer, while electricity demand in residential buildings remains relatively stable throughout the year and increases during the winter months. Similar seasonal imbalances have been reported in previous studies on PV self-consumption in residential buildings (e.g., [5]). As a consequence, battery storage systems designed for daily cycling are unable to compensate for long-term deficits in solar generation. Second, the practical limitations of commercially available energy storage systems further reduce their effective contribution to increasing self-consumption. Real batteries operate with non-ideal efficiencies, limited usable capacity, and gradual degradation over time. The usable capacity of lithium-ion storage systems typically represents only a fraction of their nominal capacity due to operational safety limits and battery management strategies. These technological constraints are widely discussed in the literature on stationary battery storage systems [24,26]. Third, the results confirm that increasing the storage capacity beyond typical residential ranges produces diminishing returns. While larger storage units improve self-consumption during transitional months, their effectiveness remains limited during both winter periods with insufficient solar production and summer periods characterized by large surpluses and relatively low nighttime demand. Similar observations regarding the limited system-level benefits of residential battery expansion have been highlighted in analyses of prosumer energy systems and storage economics. Overall, the results suggest that the effectiveness of residential PV-battery systems is not determined solely by technological parameters or storage capacity. Instead, their performance is fundamentally constrained by climatic conditions, seasonal solar availability, and the temporal structure of household electricity demand.
7. Conclusions
The results of this study demonstrate that the effectiveness of residential PV–battery systems in Central European climatic conditions is structurally constrained by the seasonal mismatch between photovoltaic generation and household electricity demand. Even under optimistic technical assumptions, energy storage significantly improves the short-term self-consumption but cannot compensate for long-term seasonal imbalances. Simulation results show that increasing the battery capacity from 5 kWh to 20 kWh substantially raises the annual self-consumption levels; however, the marginal benefits decline, as the storage capacity grows. The theoretical upper bound represented by the ideal energy storage scenario indicates that even lossless storage with extended discharge capability cannot eliminate the fundamental seasonal gap between production and demand. The economic analysis further indicates that, under current investment costs and electricity pricing structures, residential battery systems remain difficult to justify purely on financial grounds. While the transition from net-metering to net-billing slightly improves the value of self-consumed electricity, the resulting savings are generally insufficient to offset the investment and replacement costs within typical battery lifetimes. Overall, the findings suggest that residential battery storage should not be interpreted as a universal solution for maximizing photovoltaic self-consumption in climates characterized by strong seasonal variability. Instead, improving the systemic value of distributed PV may require a broader portfolio of measures, including demand-side flexibility, sector coupling (e.g., electrified heating and mobility), and grid-level storage solutions capable of addressing seasonal energy imbalances.
Author Contributions
Conceptualization, W.N. and R.U.; methodology, W.N. and R.U.; data collection, W.N.; simulations, W.N.; financial analysis, R.U.; writing and final editing, W.N. and R.U. All authors have read and agreed to the published version of the manuscript.
Funding
This research project was supported by the program “Excellence initiative—research university” for the AGH University of Krakow.
Data Availability Statement
The original contributions presented in this study are included in the article. Further inquiries can be directed to the corresponding author.
Conflicts of Interest
The authors declare no conflicts of interest.
Abbreviations
The following abbreviations are used in this manuscript:
| PV | Photovoltaic installation |
| ESU | Energy storage unit |
| IES | Ideal energy storage |
| ESC | Energy self-consumption |
| ESC ESU | Energy self-consumption using energy storage unit |
| ESC IES | Energy self-consumption using ideal energy storage |
References
- Report KSE 2025—Report About Polish National Energy System in 2024. Available online: https://www.pse.pl/dane-systemowe/funkcjonowanie-kse/raporty-roczne-z-funkcjonowania-kse-za-rok/raporty-za-rok-2024 (accessed on 15 October 2025).
- URE 2025—Urząd Regulacji Energetyki—Polish Energy Regulatory Office. Available online: https://www.ure.gov.pl (accessed on 15 October 2025).
- Widera, M.; Naworyta, W.; Urbański, P. Polish Energy sector’s dependence on lignite mining: The process of transition. J. Sustain. Min. 2024, 23, 397–406. [Google Scholar] [CrossRef] [Scilit]
- Naworyta, W.; Urbański, P. Lignite in the Polish energy industry—A premature goodbye. Geologos 2025, 31, 61–71. [Google Scholar] [CrossRef] [Scilit]
- Luthander, R.; Widén, J.; Nilsson, D.; Palm, J. Photovoltaic Self-Consumption in Buildings: A Review. Appl. Energy 2015, 142, 80–94. [Google Scholar] [CrossRef] [Scilit]
- Quoilin, S.; Kavvadias, K.; Mercier, A.; Pappone, I.; Zucker, A. Quantifying Self-Consumption Linked to Solar Home Battery Systems: Statistical Analysis and Economic Assessment. Appl. Energy 2016, 182, 58–67. [Google Scholar] [CrossRef] [Scilit]
- Figgener, J.; Stenzel, P.; Kairies, K.-P.; Haberschusz, D.; Wessels, O.; Angenendt, G.; Stolten, D.; Sauer, D.U. The development of stationary battery storage systems in Germany—A market review. J. Energy Storage 2020, 29, 101153. [Google Scholar] [CrossRef] [Scilit]
- Schill, W.-P.; Zerrahn, A.; Kunz, F. Prosumage of Solar Electricity: Pros, Cons, and System Perspective. Econ. Energy Environ. Policy 2017, 6, 7–32. [Google Scholar] [CrossRef] [Scilit]
- O’Shaughnessy, E.; Jesse, C.; Kaifeng, X. Solar PV Curtailment in Changing Grid and Technological Contexts: Preprint; NREL/CP-6A20-74176. National Renewable Energy Laboratory: Golden, CO, USA, 2021. Available online: https://www.nrel.gov/docs/fy21osti/74176.pdf (accessed on 25 February 2026).
- Child, M.; Breyer, C. The Role of Energy Storage Solutions in a 100% Renewable Finnish Energy System. Energy Procedia 2016, 99, 25–34. [Google Scholar] [CrossRef] [Scilit]
- Narodowy Fundusz Ochrony Środowiska i Gospodarki Wodnej. Program Mój Prąd—Zasady Dofinansowania; NFOŚiGW: Warsaw, Poland, 2024. [Google Scholar]
- Weniger, J.; Tjaden, T.; Quaschning, V. Sizing of residential PV battery systems. Energy Procedia 2014, 46, 78–87. [Google Scholar] [CrossRef] [Scilit]
- Nguyen, S.; Peng, W.; Sokolowski, P.; Alahakoon, D.; Yu, X. Optimizing rooftop photovoltaic distributed generation with battery storage for peer-to-peer energy trading. Appl. Energy 2018, 228, 2567–2580. [Google Scholar] [CrossRef] [Scilit]
- Motamedisedeh, O.; Omrani, S.; Karim, A.; Drogemuller, R.; Walker, G. A comprehensive review of optimum integration of photovoltaic-based energy systems. Renew. Sustain. Energy Rev. 2025, 207, 114935. [Google Scholar] [CrossRef] [Scilit]
- Hoppmann, J.; Volland, J.; Schmidt, T.S.; Hoffmann, V.H. The economic viability of battery storage for residential solar photovoltaic systems. Renew. Sustain. Energy Rev. 2014, 39, 1101–1118. [Google Scholar] [CrossRef] [Scilit]
- Hassan, A.S.; Cipcigan, L.; Jenkins, N. Optimal battery storage operation for PV systems with tariff incentives. Appl. Energy 2017, 203, 422–441. [Google Scholar] [CrossRef] [Scilit]
- Tonkoski, R.; Turcotte, D.; El-Fouly, T.H.M. Impact of high PV penetration on voltage profiles in residential neighborhoods. IEEE Trans. Sustain. Energy 2012, 3, 518–527. [Google Scholar] [CrossRef] [Scilit]
- Beaudin, M.; Zareipour, H.; Schellenberglabe, A.; Rosehart, W. Energy Storage for Mitigating the Variability of Renewable Electricity Sources. Energy Sustain. Dev. 2010, 14, 302–314. [Google Scholar] [CrossRef] [Scilit]
- Han, X.; Garrison, J.; Hug, G. Techno-economic analysis of PV-battery systems in Switzerland. Renew. Sustain. Energy Rev. 2022, 158, 112028. [Google Scholar] [CrossRef] [Scilit]
- Koskela, J.; Rautiainen, A.; Järventausta, P. Using electrical energy storage in residential buildings—Sizing of battery and photovoltaic panels based on electricity cost optimization. Appl. Energy 2019, 239, 1175–1189. [Google Scholar] [CrossRef] [Scilit]
- Gardiner, D.; Schmidt, O.; Heptonstall, P.; Gross, R.; Staffell, I. Quantifying the impact of policy on the investment case for residential electricity storage in the UK. J. Energy Storage 2020, 27, 101140. [Google Scholar] [CrossRef] [Scilit]
- Saez, R.; Marino, C.; Nofuentes, G.; Almonacid, G. Techno-economic analysis of residential rooftop photovoltaics in Spain. Renew. Sustain. Energy Rev. 2023, 188, 113788. [Google Scholar] [CrossRef] [Scilit]
- Safoutin, M.; Cherry, J.; McDonald, J.; Lee, S. Effect of Current and SOC on Round-Trip Energy Efficiency of a Lithium-Iron Phosphate (LiFePO4) Battery Pack. In SAE 2015 World Congress & Exhibition; SAE Technical Paper 2015-01-1186; SAE International: Warrendale, PA, USA, 2015. [Google Scholar] [CrossRef] [Scilit]
- Jülch, V. Comparison of Electricity Storage Options Using Levelized Cost of Storage (LCOS) Method. Appl. Energy 2016, 183, 1594–1606. [Google Scholar] [CrossRef] [Scilit]
- Xu, B.; Oudalov, A.; Ulbig, A.; Andersson, G.; Kirschen, D.S. Modeling of Lithium-Ion Battery Degradation for Cell Life Assessment. IEEE Trans. Smart Grid 2018, 9, 1131–1140. [Google Scholar] [CrossRef] [Scilit]
- Hesse, H.; Schimpe, M.; Kucevic, D.; Jossen, A. Lithium-Ion Battery Storage for the Grid—A Review of Stationary Battery Storage System Design Tailored for Applications in Modern Power Grids. Energies 2017, 10, 2107. [Google Scholar] [CrossRef] [Scilit]
- Beckers, C.; Hoedemaekers, E.; Dagkilic, A.; Bergveld, H.J. Round-Trip Energy Efficiency and Energy-Efficiency Fade Estimation for Battery Passport. arXiv 2023. [Google Scholar] [CrossRef] [Scilit]
- Hesse, H.; Schimpe, M.; Kucevic, D.; Jossen, A. Energy Efficiency Evaluation of a Stationary Lithium-Ion Battery Container Storage System via Electro-Thermal Modeling. Appl. Energy 2018, 210, 211–229. [Google Scholar] [CrossRef] [Scilit]
- Xie, W.; Zhang, L.; Zhao, X.; Zhang, D. Analysis of Thermal Characteristics and Energy Efficiency of Lithium-Ion Batteries under Different Charging Conditions. Therm. Sci. Eng. Prog. 2025, 61, 103577. [Google Scholar] [CrossRef] [Scilit]
- Uberman, R.; Naworyta, W. Economics of Renewables Versus Fossil Fuels 2022–2036: Case Study of an Individual House Applying Investment Project Evaluation Methods. Energies 2025, 18, 6282. [Google Scholar] [CrossRef] [Scilit]
- Darghouth, N.R.; Barbose, G.; Wiser, R. The Impact of Rate Design and Net Metering on the Bill Savings from Distributed PV for Residential Customers in California. Energy Policy 2011, 39, 5243–5253. [Google Scholar] [CrossRef] [Scilit]
- Benalcazar, P.; Kalka, M.; Kamiński, J. Transitioning from Net-Metering to Net-Billing: A Model-Based Analysis for Poland. Sustain. Energy Technol. Assess. 2024, 72, 104073. [Google Scholar] [CrossRef] [Scilit]
- Benalcazar, P.; Andrade, C.; Guamán, W. Prosumer policy options in developing countries: A comparative analysis of feed-in tariffs, net metering, and net billing for residential PV-battery systems. Polityka Energetyczna—Energy Policy J. 2025, 28, 77–98. [Google Scholar] [CrossRef] [Scilit]
- Kurz, D.; Nowak, A. Analysis of the Impact of the Level of Self-Consumption of Electricity from a Prosumer Photovoltaic Installation on Its Profitability under Different Energy Billing Scenarios in Poland. Energies 2023, 16, 946. [Google Scholar] [CrossRef] [Scilit]
- Cieślak, K.J. Profitability Analysis of a Prosumer Photovoltaic Installation in Light of Changing Electricity Billing Regulations in Poland. Energies 2024, 17, 3618. [Google Scholar] [CrossRef] [Scilit]
- PSE 2025—RCEm—Rynkowa Miesięczna Cena Energii Elektrycznej (Monthly Market Electricity Price). Available online: https://www.pse.pl/oire/rcem-rynkowa-miesieczna-cena-energii-elektrycznej (accessed on 1 February 2026).
- Tauron 2025—Tarifs. Available online: https://www.tauron.pl/dla-domu/obsluga-i-pomoc/formularze-i-wnioski/dokumenty-regulaminy-taryfy (accessed on 1 February 2026).
- Beltran, H.; Ayuso, P.; Pérez, E. Lifetime Expectancy of Li-Ion Batteries used for Residential Solar Storage. Energies 2020, 13, 568. [Google Scholar] [CrossRef] [Scilit]
- Ohrelius, M.; Berg, M.; Wreland Lindström, R.; Lindbergh, G. Lifetime Limitations in Multi-Service Battery Energy Storage Systems. Energies 2023, 16, 3003. [Google Scholar] [CrossRef] [Scilit]
- Sun.store 2026. Find, Compare, and Buy PV Equipment and Energy Storage at the Best Price. Available online: https://sun.store/en (accessed on 1 February 2026).

Disclaimer/Publisher’s Note: The statements, opinions and data contained in all publications are solely those of the individual author(s) and contributor(s) and not of MDPI and/or the editor(s). MDPI and/or the editor(s) disclaim responsibility for any injury to people or property resulting from any ideas, methods, instructions or products referred to in the content. |
© 2026 by the authors. Licensee MDPI, Basel, Switzerland. This article is an open access article distributed under the terms and conditions of the Creative Commons Attribution (CC BY) license.