


Abstract
This paper describes the thermal and energy performance of three roof configurations: a conventional concrete slab, a BIPV system, and a BIPV system equipped with passive aluminum fins. Three-dimensional transient finite element simulations were carried out under field-measured 24 h meteorological boundary conditions characteristic of hot climates. The objective of this study is to quantify the impact of PV integration and passive cooling strategies on heat transfer behavior and building energy performance. The BIPV roof achieved a 38.4% lower residual temperature than the concrete slab at 19:00, indicating superior heat dissipation. The addition of passive fins reduced module temperature by up to 10–12 °C and decreased peak roof temperature by up to 12%. This temperature reduction decreased electrical losses from 13.2% to 10.4%, resulting in a 21% relative reduction in temperature-induced losses. The predicted temperature ranges (≈60–75 °C under peak conditions) are consistent with values reported in experimental and numerical studies of BIPV systems in hot climates, supporting the physical realism of the model. Convective heat transfer was represented using effective coefficients, providing a computationally efficient engineering approximation of air-side heat exchange. Despite construction cost increases of up to 38%, PV integration achieved competitive payback periods of approximately 8.5–9 months under hot climate conditions. This economic assessment is based on a simple payback approach using an incremental cost formulation, where the photovoltaic system replaces the conventional concrete roof, reducing the effective investment. This study introduces a reproducible 3D transient FEM methodology for evaluating BIPV roofs under field-measured climatic boundary conditions. The framework explicitly couples geometry-resolved passive cooling, full-day thermal evolution, and temperature-dependent electrical losses, providing a physically consistent basis for assessing BIPV design alternatives in hot climates.
1. Introduction
Fossil fuels currently supply more than 80% of global energy demand, remaining the dominant contributors to greenhouse gas (GHG) emissions [1]. Against this backdrop, the buildings and construction sector accounts for nearly 37% of global energy- and process-related CO2 emissions [2]. Approximately 7% of this share is associated with embodied energy in construction processes, while the remaining 30% arises from the operational performance of buildings and infrastructure [3,4]. Improving the thermal performance of building envelopes has emerged as a strategic priority for reducing energy consumption and enhancing sustainability. As such, understanding heat-transfer mechanisms under realistic, time-dependent operating conditions becomes essential, particularly through transient thermal analysis.
The thermal performance of buildings is primarily governed by the characteristics of the building envelope, which directly influence HVAC energy demand [5]. Passive design strategies such as insulation, solar gain control, natural ventilation, and thermal mass have been shown to substantially reduce HVAC energy demand [6]. However, validating these approaches under realistic operating conditions requires three-dimensional transient simulations capable of capturing complex interactions among materials, geometry, and climatic variability. Although previous studies have investigated systems such as Trombe walls [7], phase change materials (PCMs) [8], and low-conductivity construction assemblies, most of these works rely on steady-state assumptions, thereby limiting their applicability under real dynamic operating conditions. The finite element method (FEM) has been widely applied to evaluate thermal load reduction strategies in building components such as walls and windows. Deng et al. [9] examined the steady-state thermal response of concrete–straw composite walls, reporting a 145% improvement in insulation performance compared to conventional concrete. Similarly, Fan et al. [10,11] optimized alkali-activated slag ceramic insulating blocks and demonstrated that increasing void ratios reduces both the von Mises equivalent stress and the heat-transfer coefficient.
Despite these advances, most FEM-based studies remain restricted to steady-state conditions, resulting in a limited understanding of the thermal response to diurnal and nocturnal fluctuations. This highlights the need for transient analyses capable of more accurately representing the real thermal behavior of building envelopes.
The integration of photovoltaic (PV) systems into buildings, either as building-applied photovoltaics (BAPV) or building-integrated photovoltaics (BIPV), has emerged as a key strategy for enhancing building energy efficiency [12,13]. The thermal behavior of these systems is strongly governed by their coupling with the building envelope, which motivates the use of transient simulations to characterize temperature evolution, identify thermal peaks, and estimate heat dissipation times [14,15]. Nonetheless, further research is required to assess these systems under real climatic conditions and to integrate renewable energy generation technologies into such analyses, thereby optimizing both thermal performance and overall building energy efficiency.
Recent studies have applied transient modeling to analyze the thermal behavior of PV systems. Hamdy et al. [13] employed CFD simulations and showed that higher irradiance leads to increased panel temperatures and reduced electrical efficiency, although cooling mechanisms can mitigate these effects. Cabrera et al. [16] evaluated BAPV assemblies incorporating copper fins and reported significant thermal variations over 24 h cycles; however, their analysis primarily focused on steady-state conditions. Similarly, Sheikh et al. [17,18] demonstrated improved temperature regulation and enhanced PV efficiency through the integration of metallic and organic PCMs, while Harmailil et al. [19] compared passive, active, and hybrid cooling strategies, highlighting the effectiveness of lapped fins in promoting heat dissipation.
Related Work on Passive PV/BIPV Cooling
Passive cooling strategies for PV and BIPV systems include (i) geometry-based heat-spreading devices such as metallic fins that increase effective area and enhance natural convection; (ii) ventilated back cavities that promote air exchange; (iii) selective coatings that reduce effective solar absorptance; (iv) metallic and organic PCMs that attenuate peak temperatures through latent heat storage; and (v) hybrid passive combinations. Reported transient reductions typically range from 8 to 12 °C for finned or ventilated systems, with corresponding 4–6% electrical-efficiency gains at peak. However, many studies operate under steady-state assumptions, insufficient to resolve peak timing, evening dissipation, and thermal-storage dynamics. To address these gaps, this study develops a reproducible 3D transient FEM framework driven by field-measured meteorological inputs, explicitly representing rear-mounted fins and linking thermal performance with temperature-induced electrical losses and economic metrics under hot climate conditions.
Despite progress in the thermal characterization of PV systems and building envelopes, few studies have explored the transient thermal behavior of BIPV configurations using the finite element method (FEM), particularly when coupled with passive cooling devices and evaluated over full 24 h cycles. This gap is especially critical in hot climates, where extreme temperatures degrade PV electrical performance and indoor thermal comfort. Architectural integration in BIPV increases operating temperatures and reduces electrical efficiency [20], whereas active cooling strategies enhance thermal performance but introduce additional system complexity [21]. In contrast, passive measures such as fins and PCMs provide thermal benefits, though their effectiveness remains constrained by climatic conditions and material stability [22,23]. To address this need, the present study develops a three-dimensional transient thermal analysis of three architectural configurations, assessing their energy performance, resulting thermal loads, and environmental and economic implications. The study advances the field through: (i) a fully diurnal 3D transient FEM framework under field-measured boundary conditions; (ii) a geometry-resolved representation of rear-mounted passive aluminum fins; and (iii) an integrated techno-economic assessment linking thermal mitigation, electrical performance, and payback metrics relevant to hot climates.
2. Materials and Methods
2.1. Building Model
The building has an 8 m × 6 m floor plan with a total roof area of 64.5 m2, consistent with national educational-building guidelines. All configurations share an 8° roof tilt along the north–south axis. The conventional roof consists of a 0.10 m reinforced concrete slab, while the BIPV and BIPV+Fins variants replace this slab with photovoltaic modules acting as the exterior roof skin. Material properties and thicknesses for all components are listed in Table 1, ensuring consistent comparison among configurations.
Table 1.
Thermophysical properties used in the transient analysis.
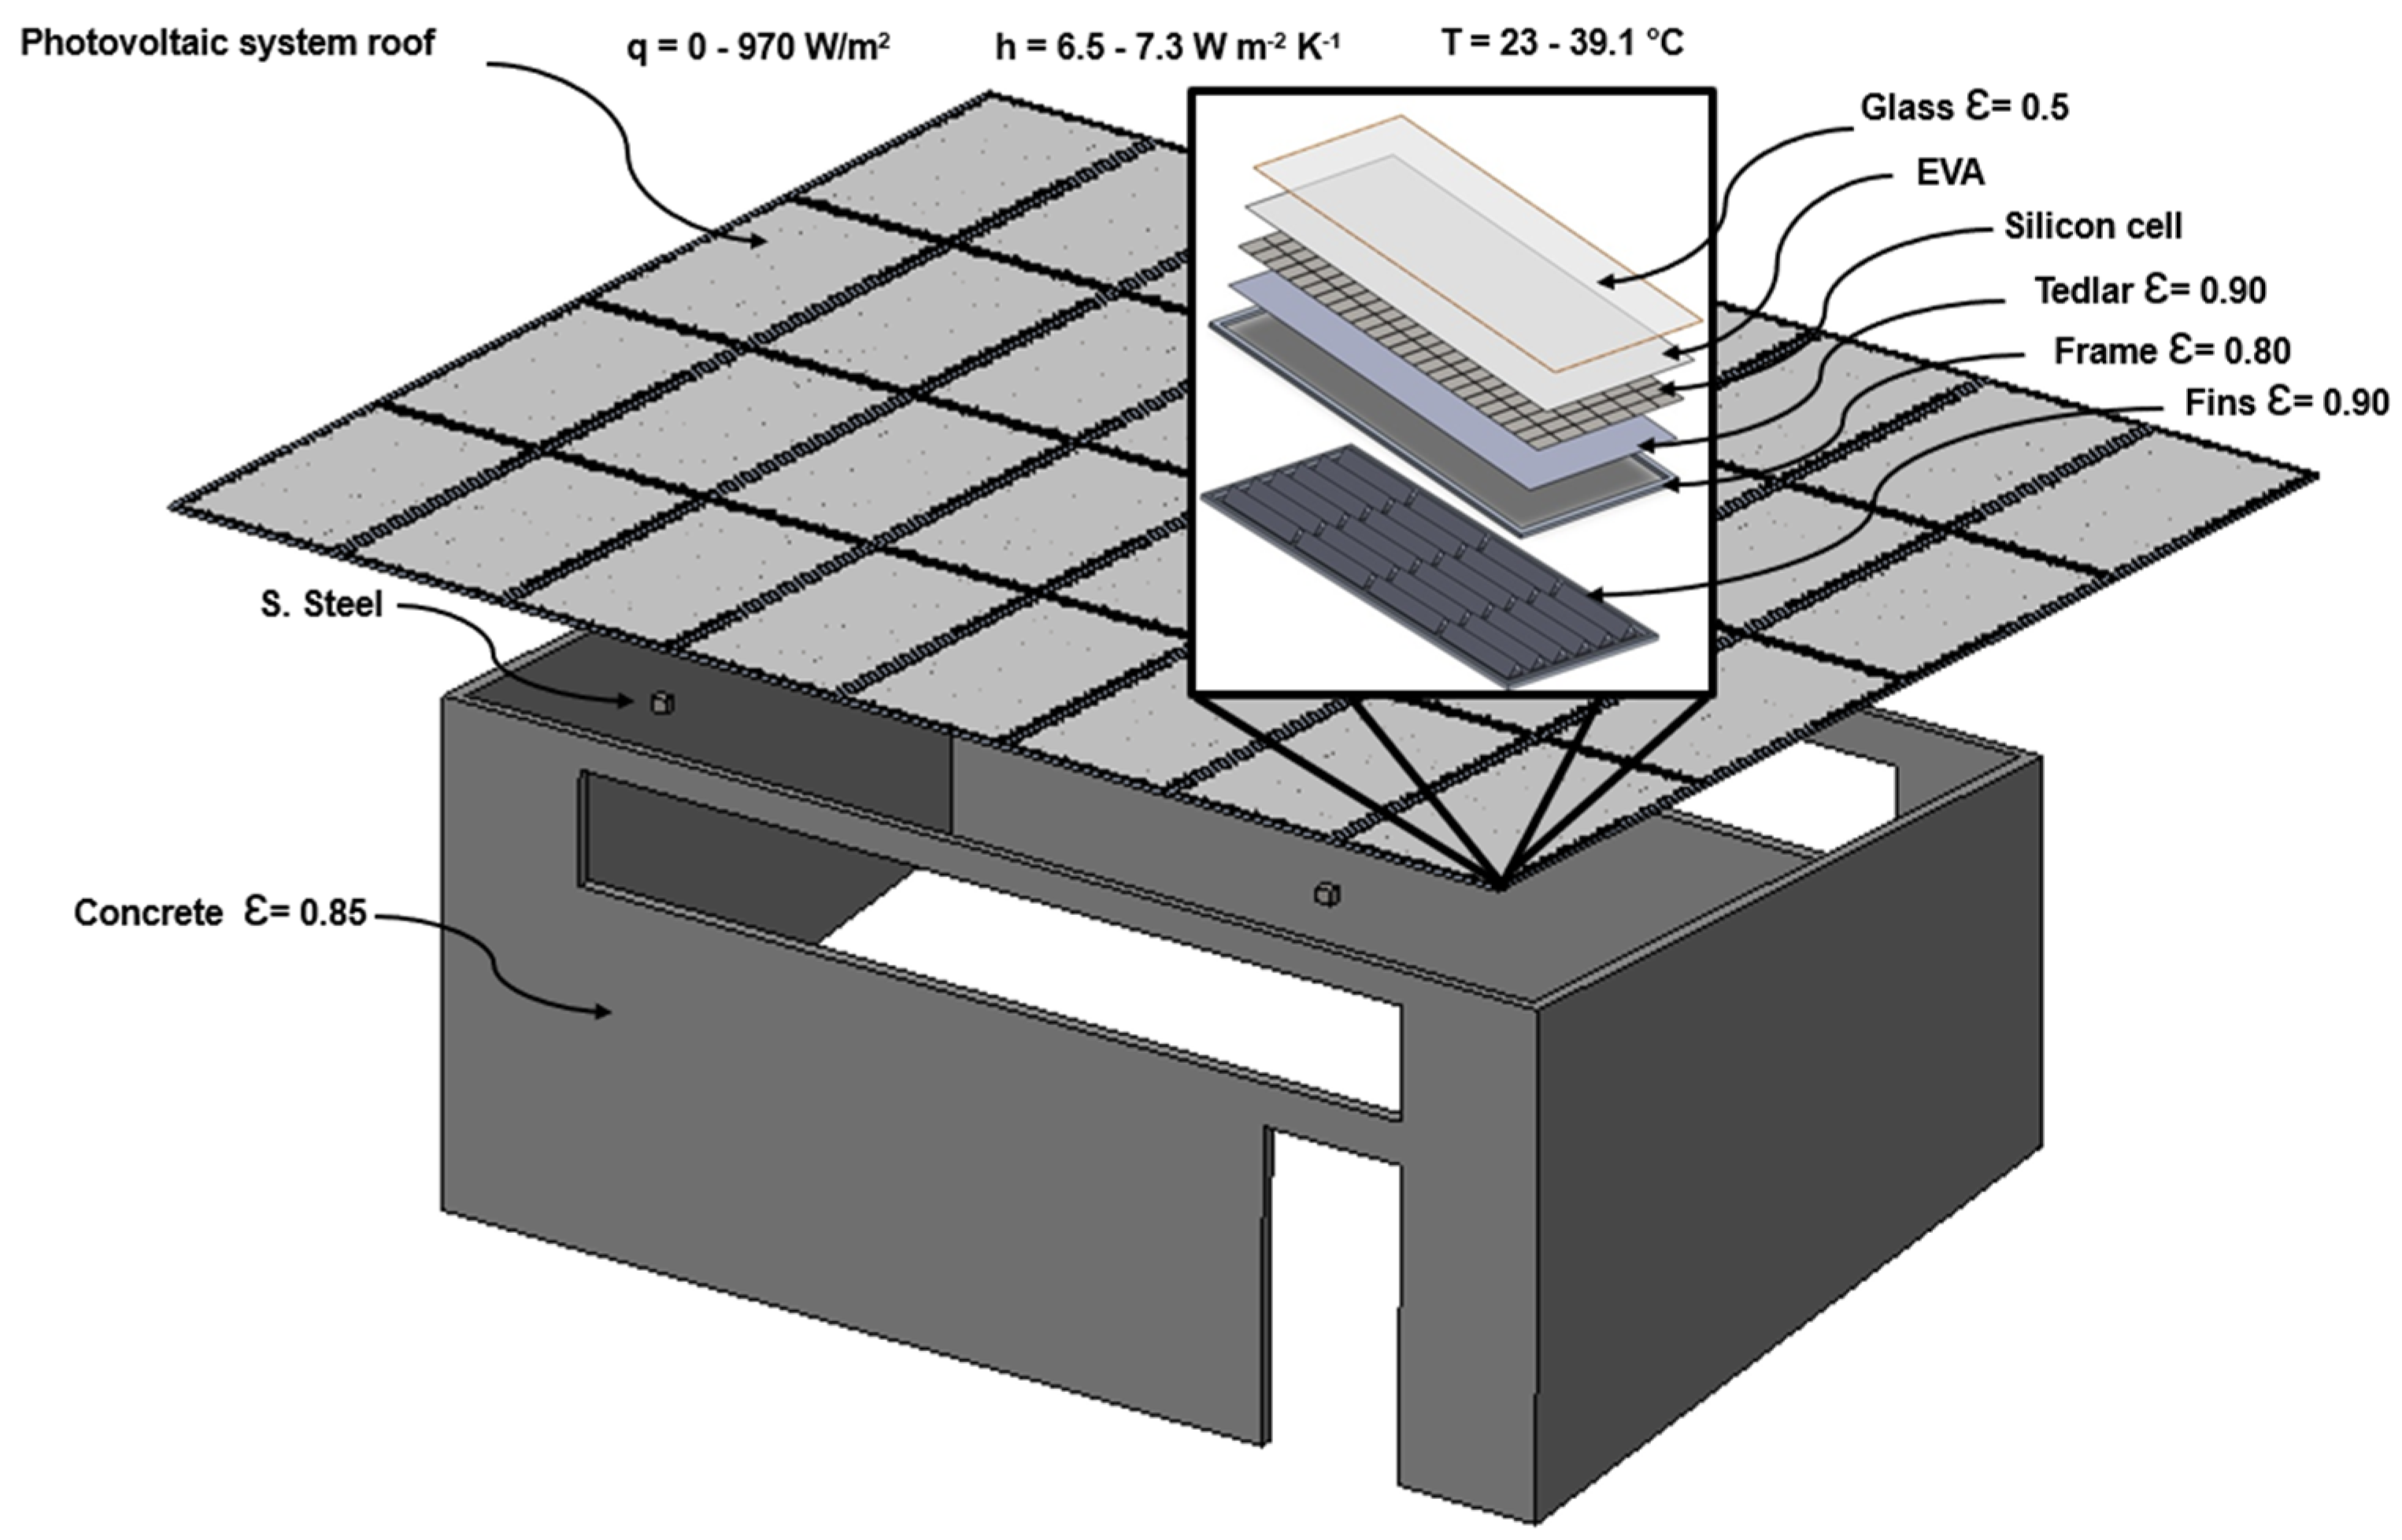
Figure 1 shows themethodological framework and simulation workflow: (i) field-measured meteorological inputs; (ii) 3D geometry and material characterization; (iii) boundary-condition mapping; (iv) numerical solution strategy; and (v) thermal, electrical, and economic outputs.
Figure 1.
Methodological framework.
2.2. PV and BIPV Configurations (Mounting and Geometry)
Three architectural configurations were developed to evaluate their transient thermal behavior using the finite element method (FEM).
Model 1 (conventional) represents a typical building envelope consisting of a reinforced concrete roof slab measuring 10.4 m × 8.4 m, with a thickness of 0.10 m and an inclination of 8° along the north–south axis.
Model 2 (BIPV) replaces the concrete slab with a roof composed of 24 monocrystalline photovoltaic panels rated at 610 W each (2.462 m × 1.214 m × 0.03 m), which simultaneously function as the structural covering and the surface exposed to solar radiation.
Model 3 (BIPV + Fins) builds upon Model 2 by integrating six triangular aluminum fins per module (0.12 m × 0.10 m × 0.226 m, thickness 0.3 mm), uniformly distributed on the rear surface to enhance passive heat dissipation.
A roof inclination of 8° was adopted for all configurations, as this value provides a balance between energy performance and architectural criteria while ensuring representative solar exposure for the study area. All models were simulated under identical boundary and environmental conditions to ensure a consistent and comparable evaluation of their thermal performance.
In both PV-based configurations (BIPV and BIPV+Fins), the modules function as the exterior roof skin and are mounted on aluminum rails that create a continuous rear ventilated cavity between the backsheet and the roof structure. This cavity is open at both the eave and the ridge, enabling buoyancy-driven natural convection. In the BIPV+Fins configuration, triangular aluminum fins are attached to the rear surface of each module, increasing the effective heat-transfer area and enhancing upward airflow through the cavity.
Electrical specifications (BIPV). Each monocrystalline module is rated at 610 W (nameplate), yielding a total installed DC capacity of 14.6 kWp for the array. The temperature coefficient of power is −0.40% per °C (IEC-type), and the nominal module dimensions are 2.462 m × 1.214 m × 0.03 m. These parameters are used to translate simulated module temperature into temperature-related electrical losses in Section 3.
2.3. Boundary Conditions and Material Properties
Figure 2 shows the complete 24 h meteorological forcing used in the transient simulations. Material properties for concrete, glass, silicon, EVA, PVF/Tedlar, and aluminum were assigned from values from the literature and assumed temperature-independent within the simulated range. Were defined using field-measured meteorological data collected in Cunduacán, Tabasco, Mexico (hot, humid climate) over a continuous 24 h period. Incident solar irradiance ranged from 0 to 970 W m−2. Convective heat transfer was calculated based on hourly meteorological conditions, with a baseline heat transfer coefficient of 6.5 W m−2 °C−1, which increased to 7.3 W m−2 °C−1 during periods of elevated air–surface temperature gradients. Ambient temperature varied from an initial 23 °C to a maximum of 39.1 °C. The adopted convective heat transfer coefficients fall within the range commonly reported for natural convection over building surfaces and ventilated PV assemblies under low to moderate wind conditions (typically 5–10 W m−2 K−1). This approach provides a simplified but physically representative description of air-side heat exchange driven by buoyancy and ambient conditions. However, it is important to note that the model does not explicitly resolve the detailed airflow within the rear ventilated cavity or around the fins (e.g., through CFD-based Navier–Stokes solutions), and therefore local variations in velocity and heat transfer enhancement are approximated through effective coefficients. This assumption represents a common practice in building-scale transient simulations and allows capturing the dominant thermal behavior while maintaining computational efficiency [24,25]. The thermal properties of the materials (Table 1) were assigned using experimentally validated values reported in the recent literature [26].
Figure 2.
Field-measured 24 h meteorological boundary conditions used in the transient simulations, including irradiance, ambient temperature, and convection coefficients.
2.4. Verification and Validation
The numerical model was verified through (i) mesh-independence and time-step convergence analyses, (ii) energy-balance checks over the full 24 h cycle, and (iii) correlation-based consistency checks for PV module temperature.
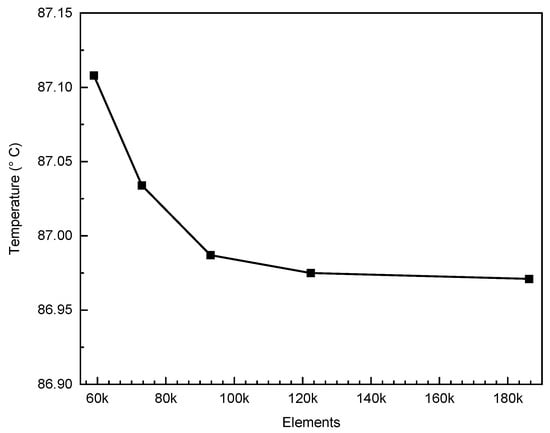
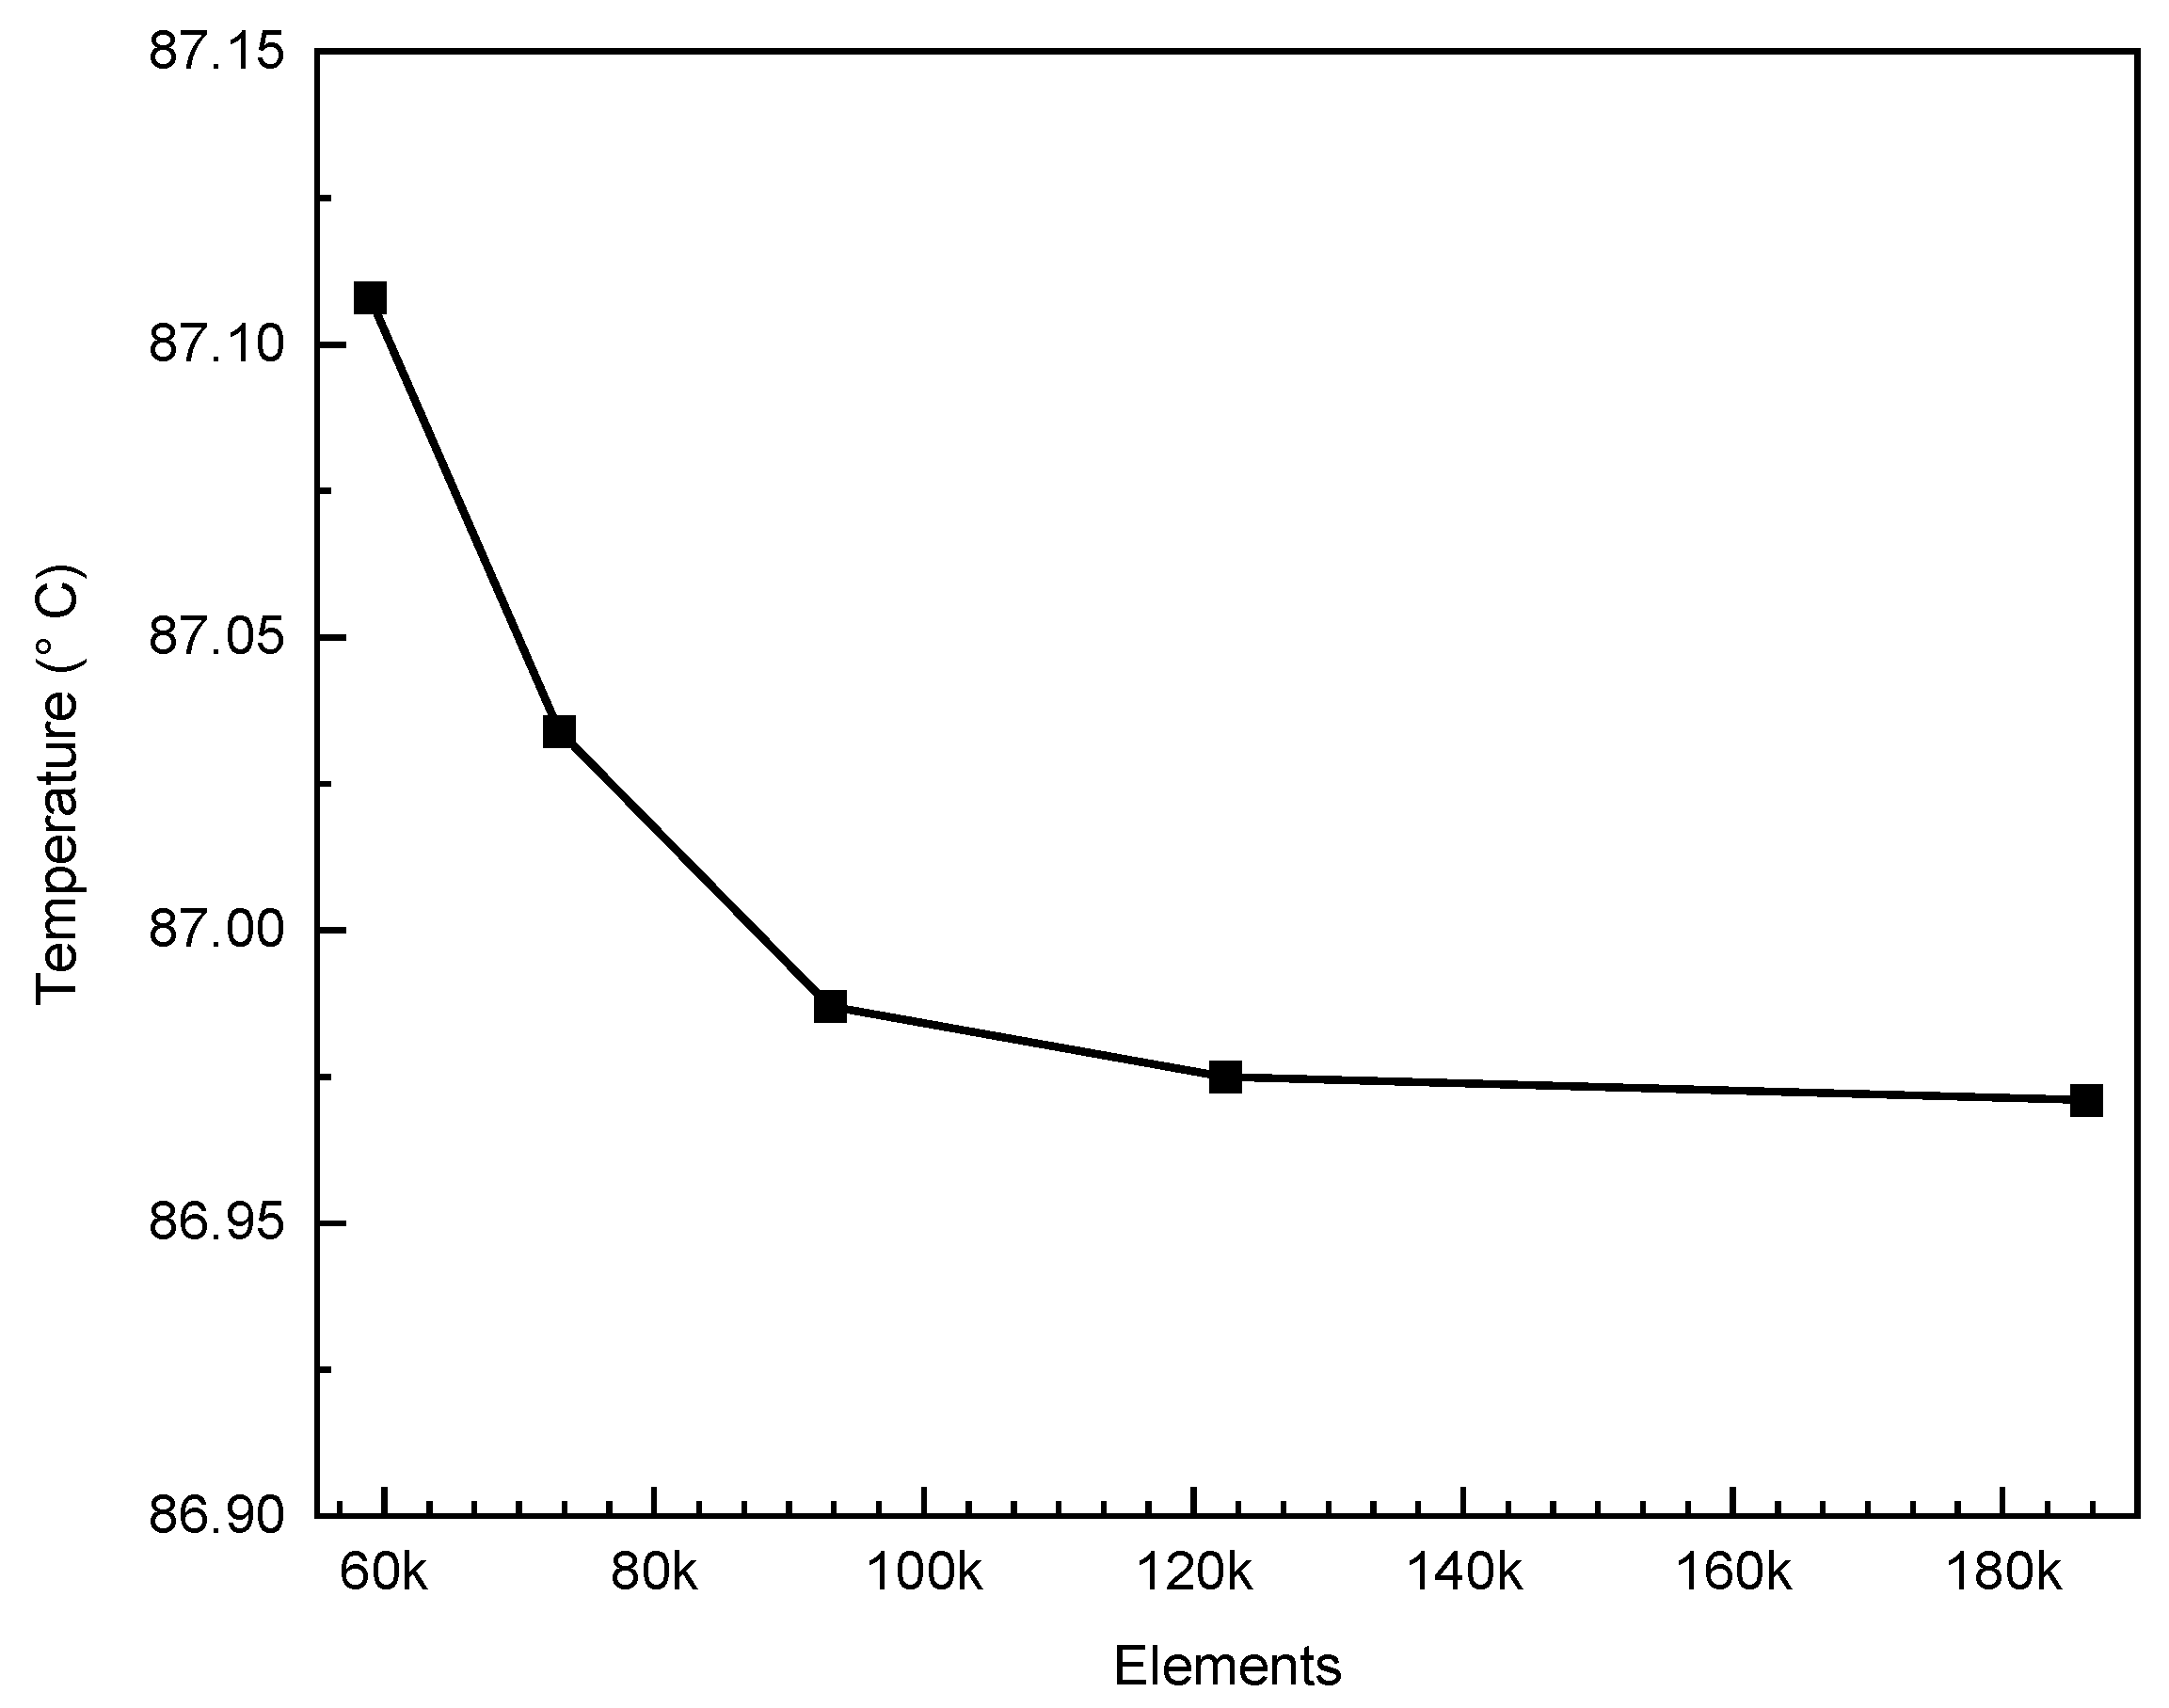
(i) Mesh/time-step independence. Successive mesh refinements and hourly time stepping yielded < 2% variation in surface temperature and stable heat-flux results. A mesh of 120,000 elements and Δt = 3600 s was adopted (see Figure 3).
Figure 3.
Mesh-independence verification showing < 2% variation in surface temperature, confirming numerical convergence.
(ii) Energy balance. Net conductive and convective/radiative exchanges were checked to ensure closure within expected tolerances over the diurnal cycle under the applied boundary conditions.
(iii) Correlation-based consistency. Simulated module temperatures were compared against a standard IEC type cell temperature correlation driven by the same meteorological inputs (irradiance, ambient temperature, convection). Peak timing and amplitudes were consistent within typical uncertainty bands for naturally ventilated modules. Peak timing and amplitudes were consistent within typical uncertainty bands for naturally ventilated modules, supporting the reliability of the transient thermal model [27,28].
2.5. Numerical Methodology
Three-dimensional transient thermal analyses were performed using the finite element method over a 24 h period. The simulations employed three-dimensional thermal solid elements suitable for transient heat-transfer problems. Time integration was carried out using an implicit scheme with 24 time steps of 3600 s each, and a residual convergence tolerance of 10−3 was imposed for all iterations.
The modeled components included reinforced concrete (slab), aluminum (frame and fins), silicon (photovoltaic cells), conductive glass (front cover), ethylene-vinyl acetate (encapsulant), and polyvinyl fluoride (Tedlar backsheet). Thermophysical properties were assumed constant over the evaluated temperature range and were obtained from recent experimentally validated sources.
The 3-D transient thermal model solves standard heat conduction in each solid domain (concrete, aluminum, glass, silicon, EVA, PVF/Tedlar) with temperature-independent properties and perfect thermal contact across layers. Radiative and convective boundary fluxes are driven directly by the measured 24 h meteorology (global irradiance, ambient temperature, and hourly convection coefficients; see Figure 2). Temperature-related electrical losses are obtained from the IEC temperature coefficient (−0.40% per °C) applied to the simulated module-average temperature. Simulations were executed in a commercial finite element platform using implicit time integration (Δt = 3600 s) with a residual tolerance of 10−3 per step. Model reliability is supported by mesh- and time-step-independence checks (<2% variation), a 24 h energy-balance verification, and correlation-based consistency of module temperature with standard IEC-type relations under the same meteorological inputs.
3. Results and Discussion
Thermal loading in all configurations is driven mainly by incident solar radiation, which elevates exterior surface temperatures and induces inward heat conduction. In high thermal mass materials such as concrete, conduction dominates the transient response, producing a delayed but sustained heat flux. In contrast, ventilated regions enhance convective exchange, accelerating thermal gains through warm air entrainment. This combined radiative–convective behavior is consistent with previous transient analyses of roof and BIPV systems [29]. Furthermore, the predicted temperature levels obtained in this study (typically within the range of 60–75 °C under peak conditions) are consistent with experimentally and numerically reported operating temperatures for BIPV systems in hot climates, where module temperatures commonly reach 65–80 °C depending on irradiance and ventilation conditions. This agreement with values from the literature further supports the physical realism of the transient thermal response predicted by the model.
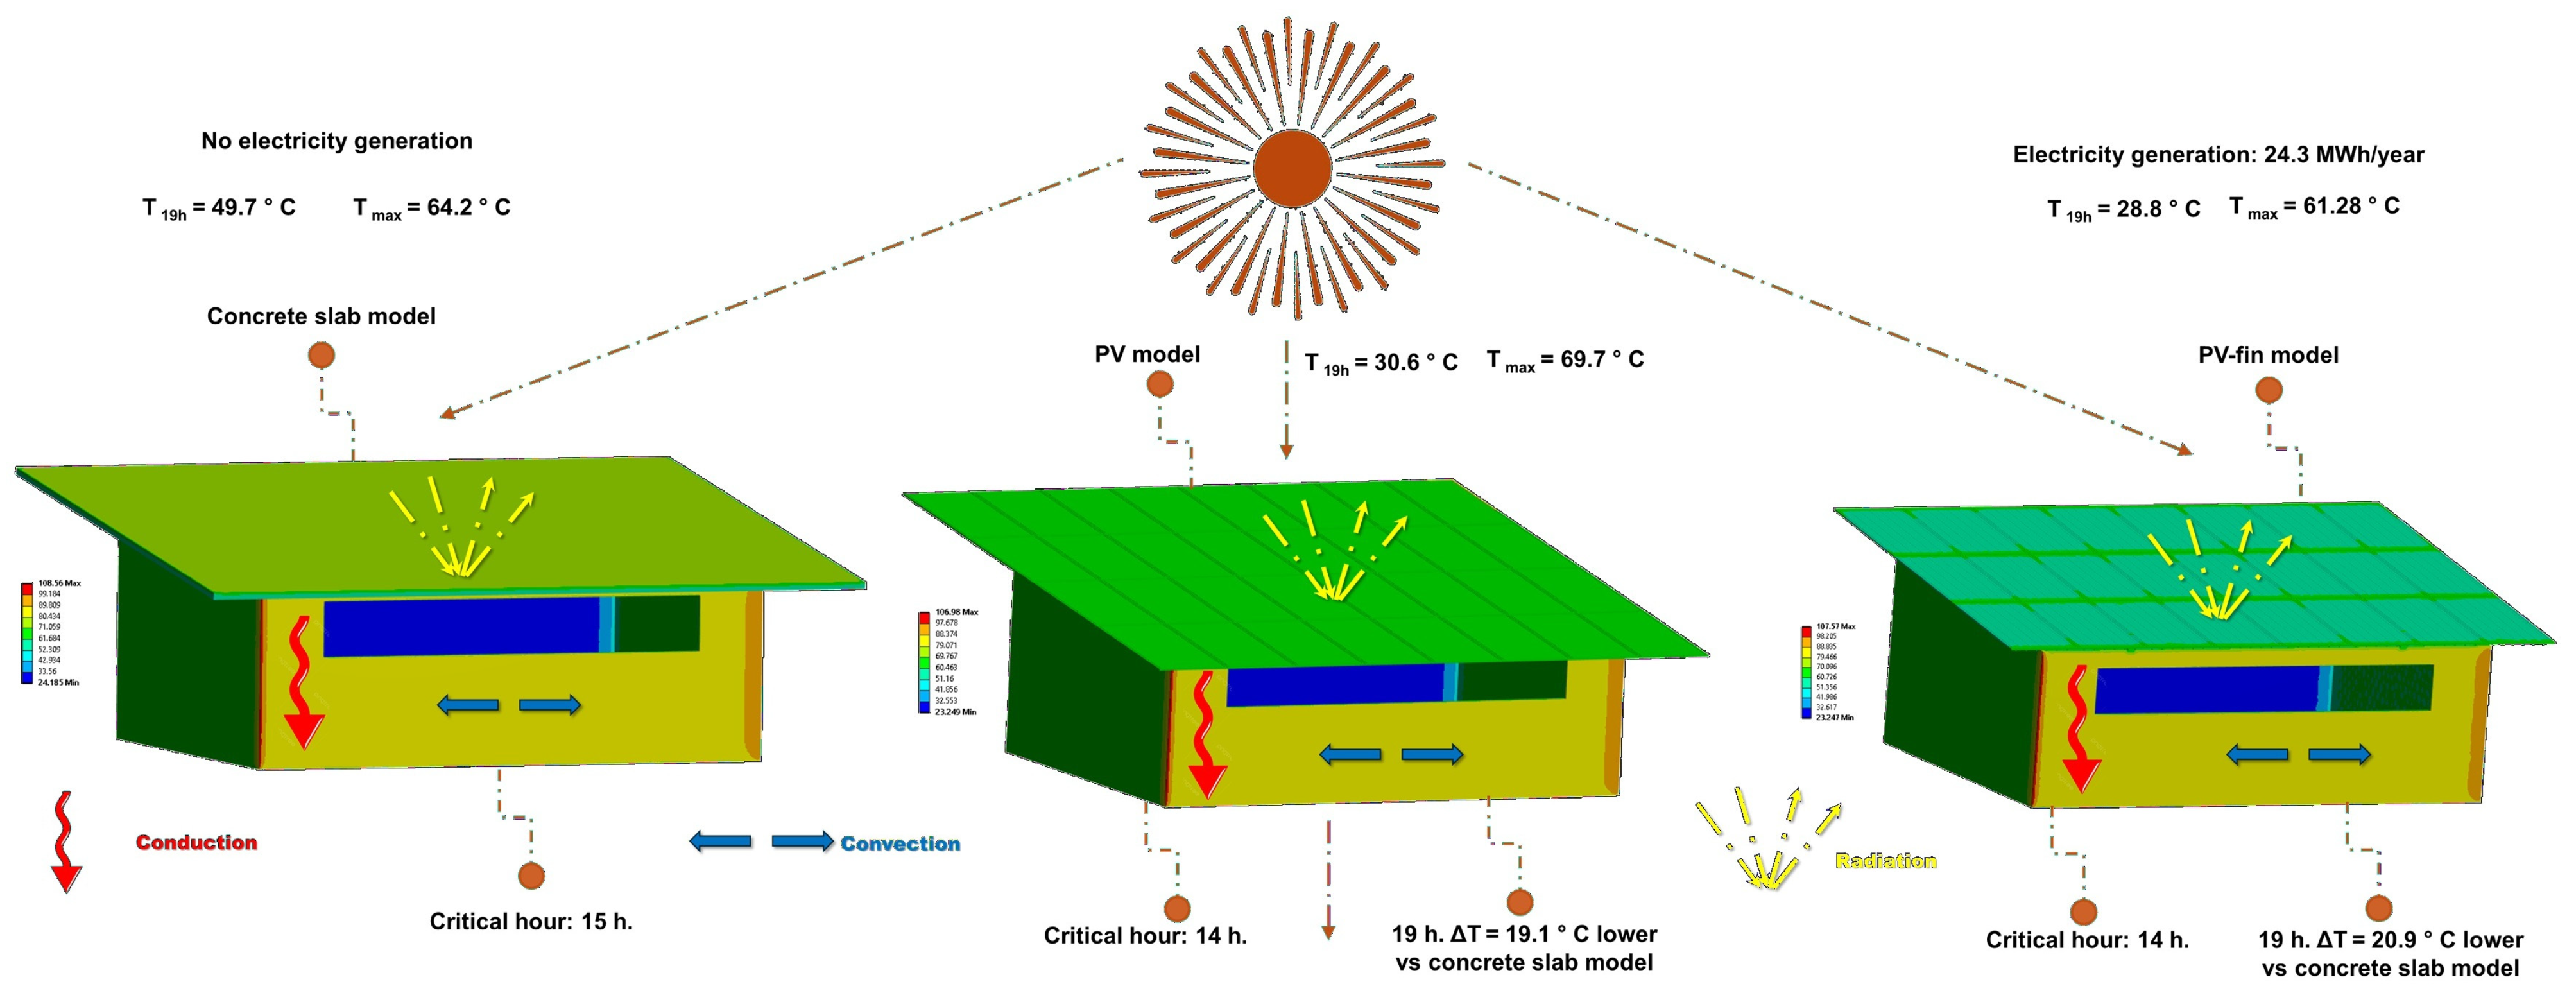
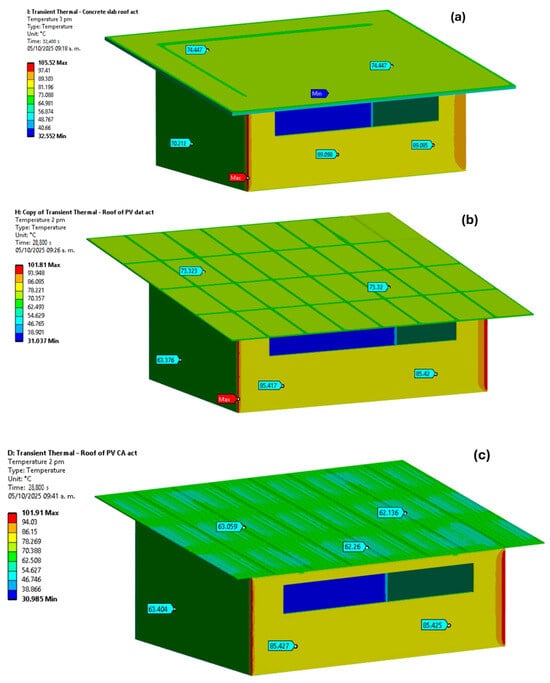
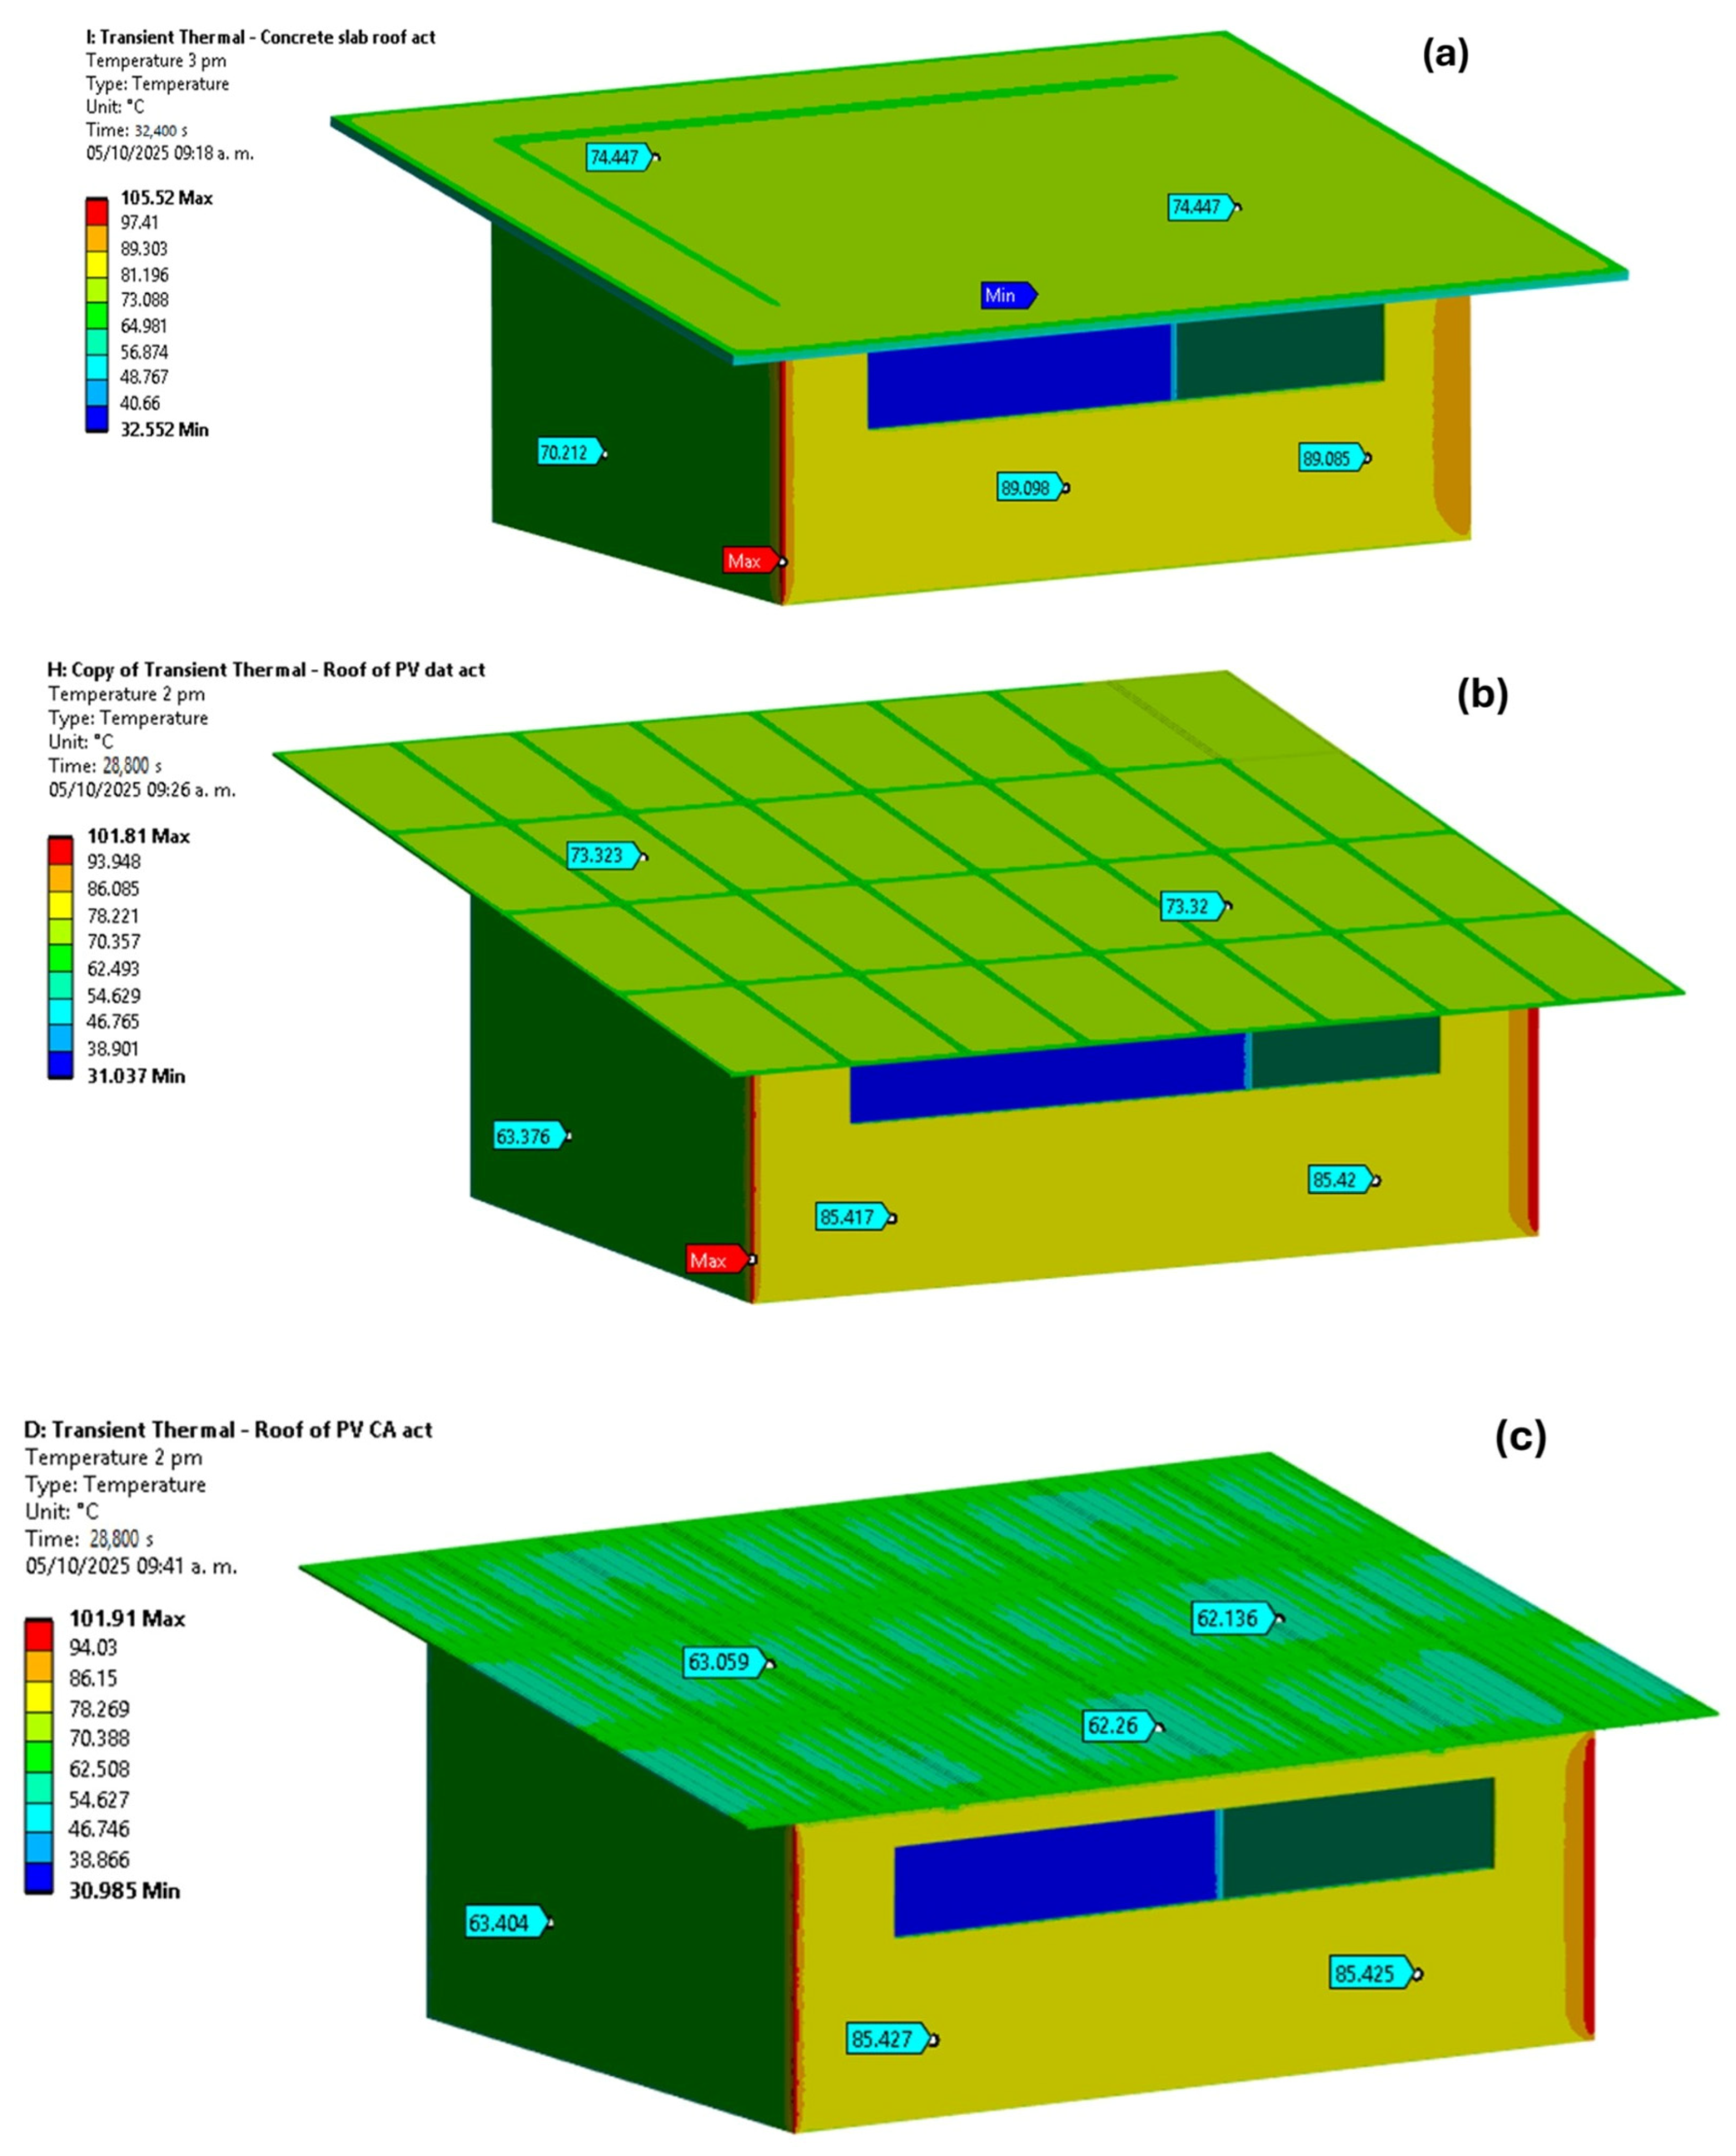
Figure 4 shows the transient thermal evolution of the three configurations and identifies the period of maximum surface-temperature gradient, which marks the peak thermal demand on the envelope. BIPV roofs reach their temperature maxima earlier than the concrete slab, reflecting their lower thermal inertia. The observed peak timing and amplitudes are consistent with the measured 24 h weather forcing (Figure 2), particularly the midday irradiance and high afternoon ambient temperatures.
Figure 4.
Surface temperature distribution at peak thermal demand: (a) Model 1: conventional concrete roof; (b) Model 2: BIPV roof; (c) Model 3: BIPV roof with passive cooling fins.
For Model 1 (concrete slab), the exterior surface reaches its maximum temperature at 15:00 h, with the roof peaking at 74 °C and the walls approaching 70 °C. The south façade attains the highest value (up to 89 °C) due to sustained solar exposure and higher effective absorptance. The high thermal capacitance of concrete leads to a conduction-dominated response, yielding a relatively uniform slab temperature at peak conditions. Similar façade-driven temperature rises under strong irradiance have been documented in experimental and numerical analyses [30].
In Model 2 (BIPV roof), the thermal peak occurs earlier at 14:00 h, with a maximum PV surface temperature of about 73 °C. The low thermal diffusivity of the glass–silicon multilayer structure produces a uniform temperature distribution across the module surface. Wall temperatures are moderately lower than in Model 1 (about 63 °C, south façade about 85 °C), indicating a partial reduction in envelope thermal load. This response aligns with studies showing that PV modules alter radiative and convective heat exchange by acting as semi-reflective and partially ventilated surfaces [31].
Model 3 (BIPV + fins) exhibits a similar peak time at 14:00 h but reaches substantially lower surface temperatures, between 62 and 63 °C, representing a reduction of about 10 °C (13–15%) relative to Model 2. The rear-mounted fins increase the effective heat-transfer area and enhance buoyancy-driven natural convection, thereby improving heat dissipation from the PV modules. This cooling mechanism has been widely reported to reduce PV operating temperatures by 10–15% under comparable conditions [31]. Consequently, among the evaluated configurations, the fin-assisted BIPV system provides the most effective passive strategy for mitigating thermal loads. As the thermal-convection driving depends on ambient temperature and irradiance, fin-assisted cooling is expected to be stronger on clear, high-irradiance days and more moderate under cloudy or diffuse conditions. Beyond the present scope, a follow-up study is being prepared to investigate rapid temperature transients (thermal shocks) and water effects (rainfall, wetting/evaporation) on BIPV thermal behavior and fin performance.
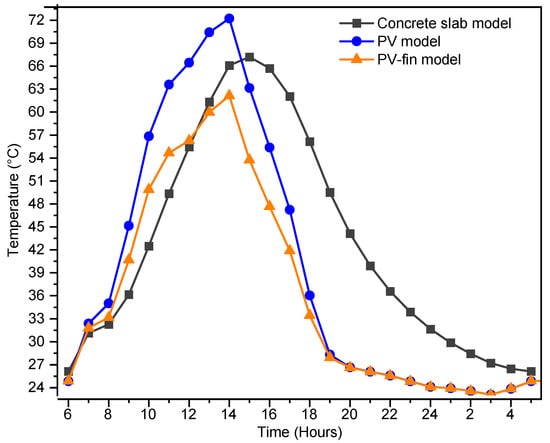
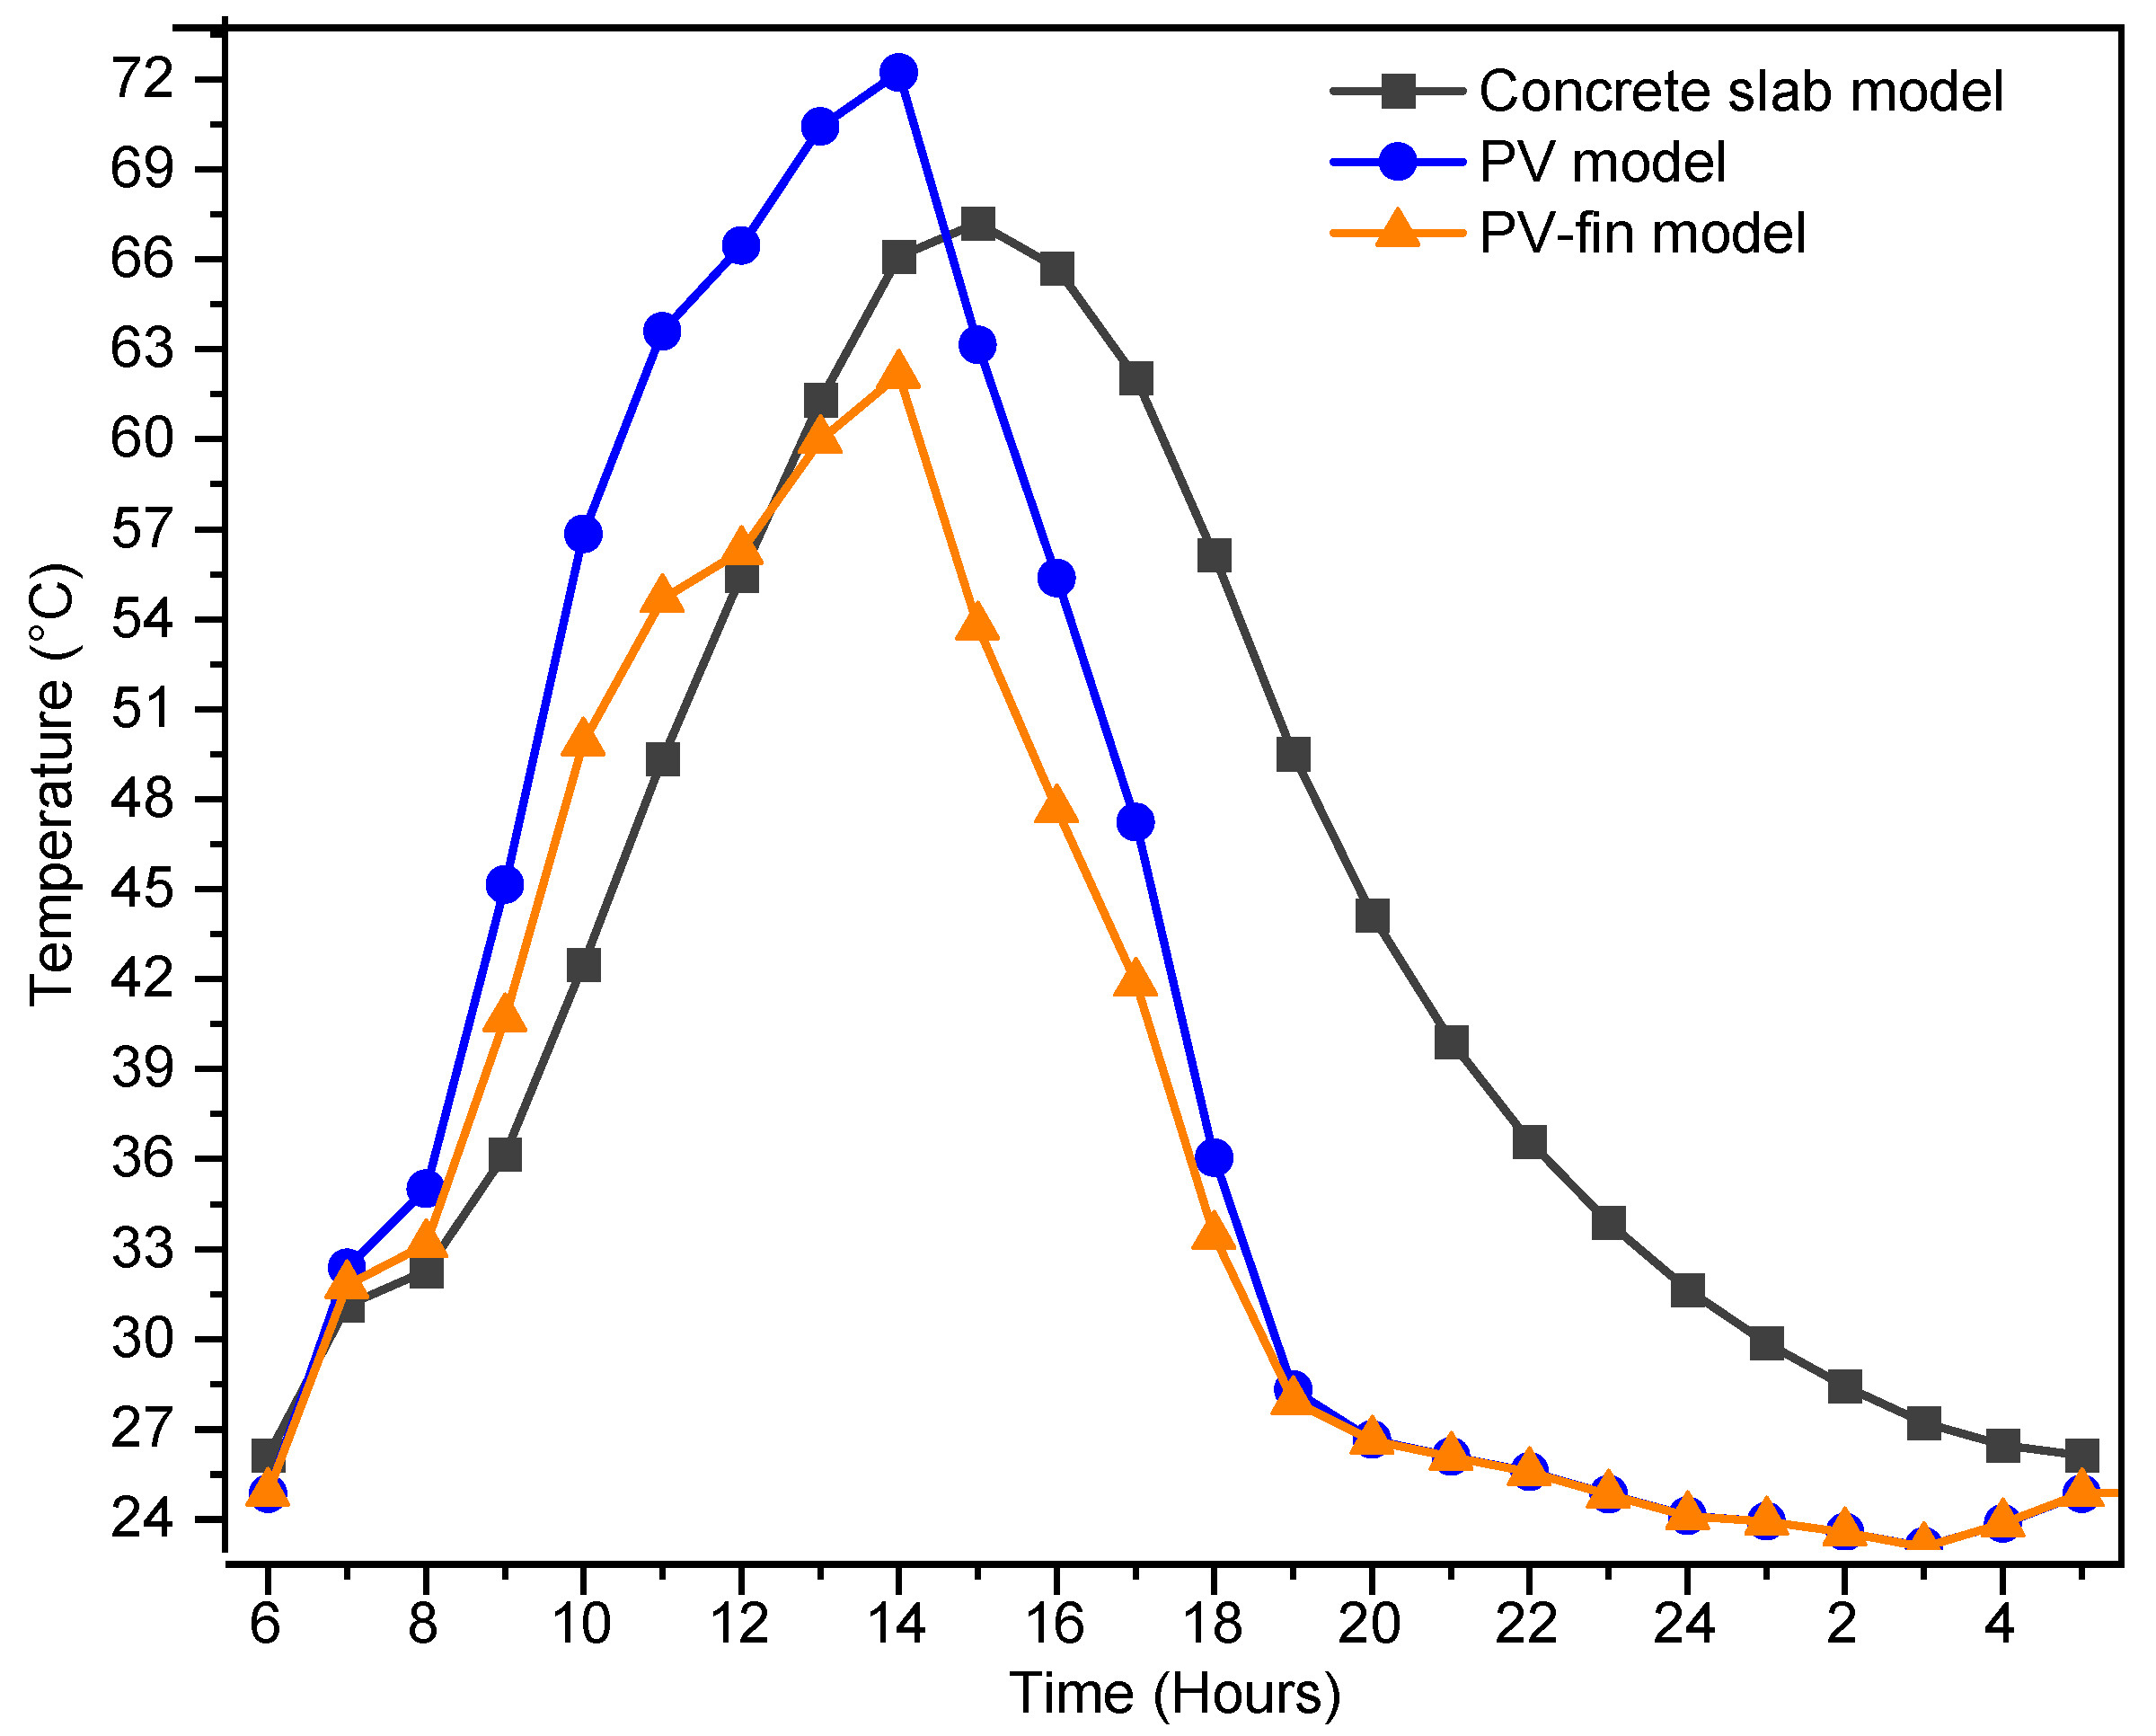
As shown in Figure 5, the BIPV roof (Model 2) exhibits an earlier and hotter response consistent with lower thermal inertia and enhanced air-side convection: it reaches a maximum average roof temperature of 72.2 °C at 14:00 h, whereas the concrete roof (Model 1) is at 66.0 °C at that time; one hour later (15:00 h), Model 1 peaks at 67.2 °C, while Model 2 has already cooled to 63.1 °C, about 6.1% below the concrete configuration at its peak [32].
Figure 5.
Temporal evolution of average roof surface temperature for the three configurations over the 24 h cycle.
After peak conditions, the BIPV configuration cools at a higher rate, reaching 27.9 °C at 19:00 h versus 49.5 °C for concrete (−43.6%). This sustained gap through 06:00 h indicates reduced nocturnal heat storage in the lightweight assembly, consistent with transient analyses of low-inertia systems [32,33].
Among the three configurations, Model 3 consistently reaches the lowest average temperatures. The addition of fins lowers the maximum average temperature at 15:00 h by about 5.1 °C (7.6%) relative to the concrete roof. This reduction results from the increased heat-transfer area and the enhancement of buoyancy-driven natural convection, consistent with studies reporting sustained fin-induced cooling effects [26,34].
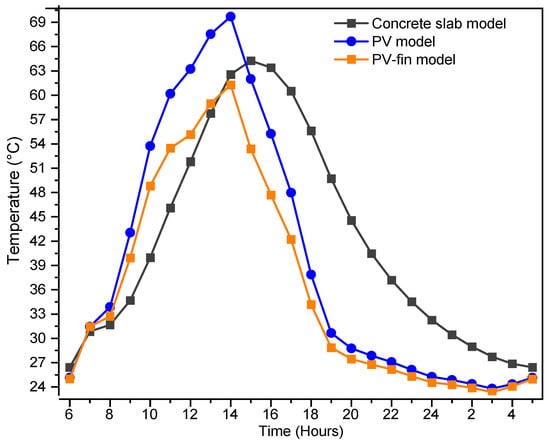
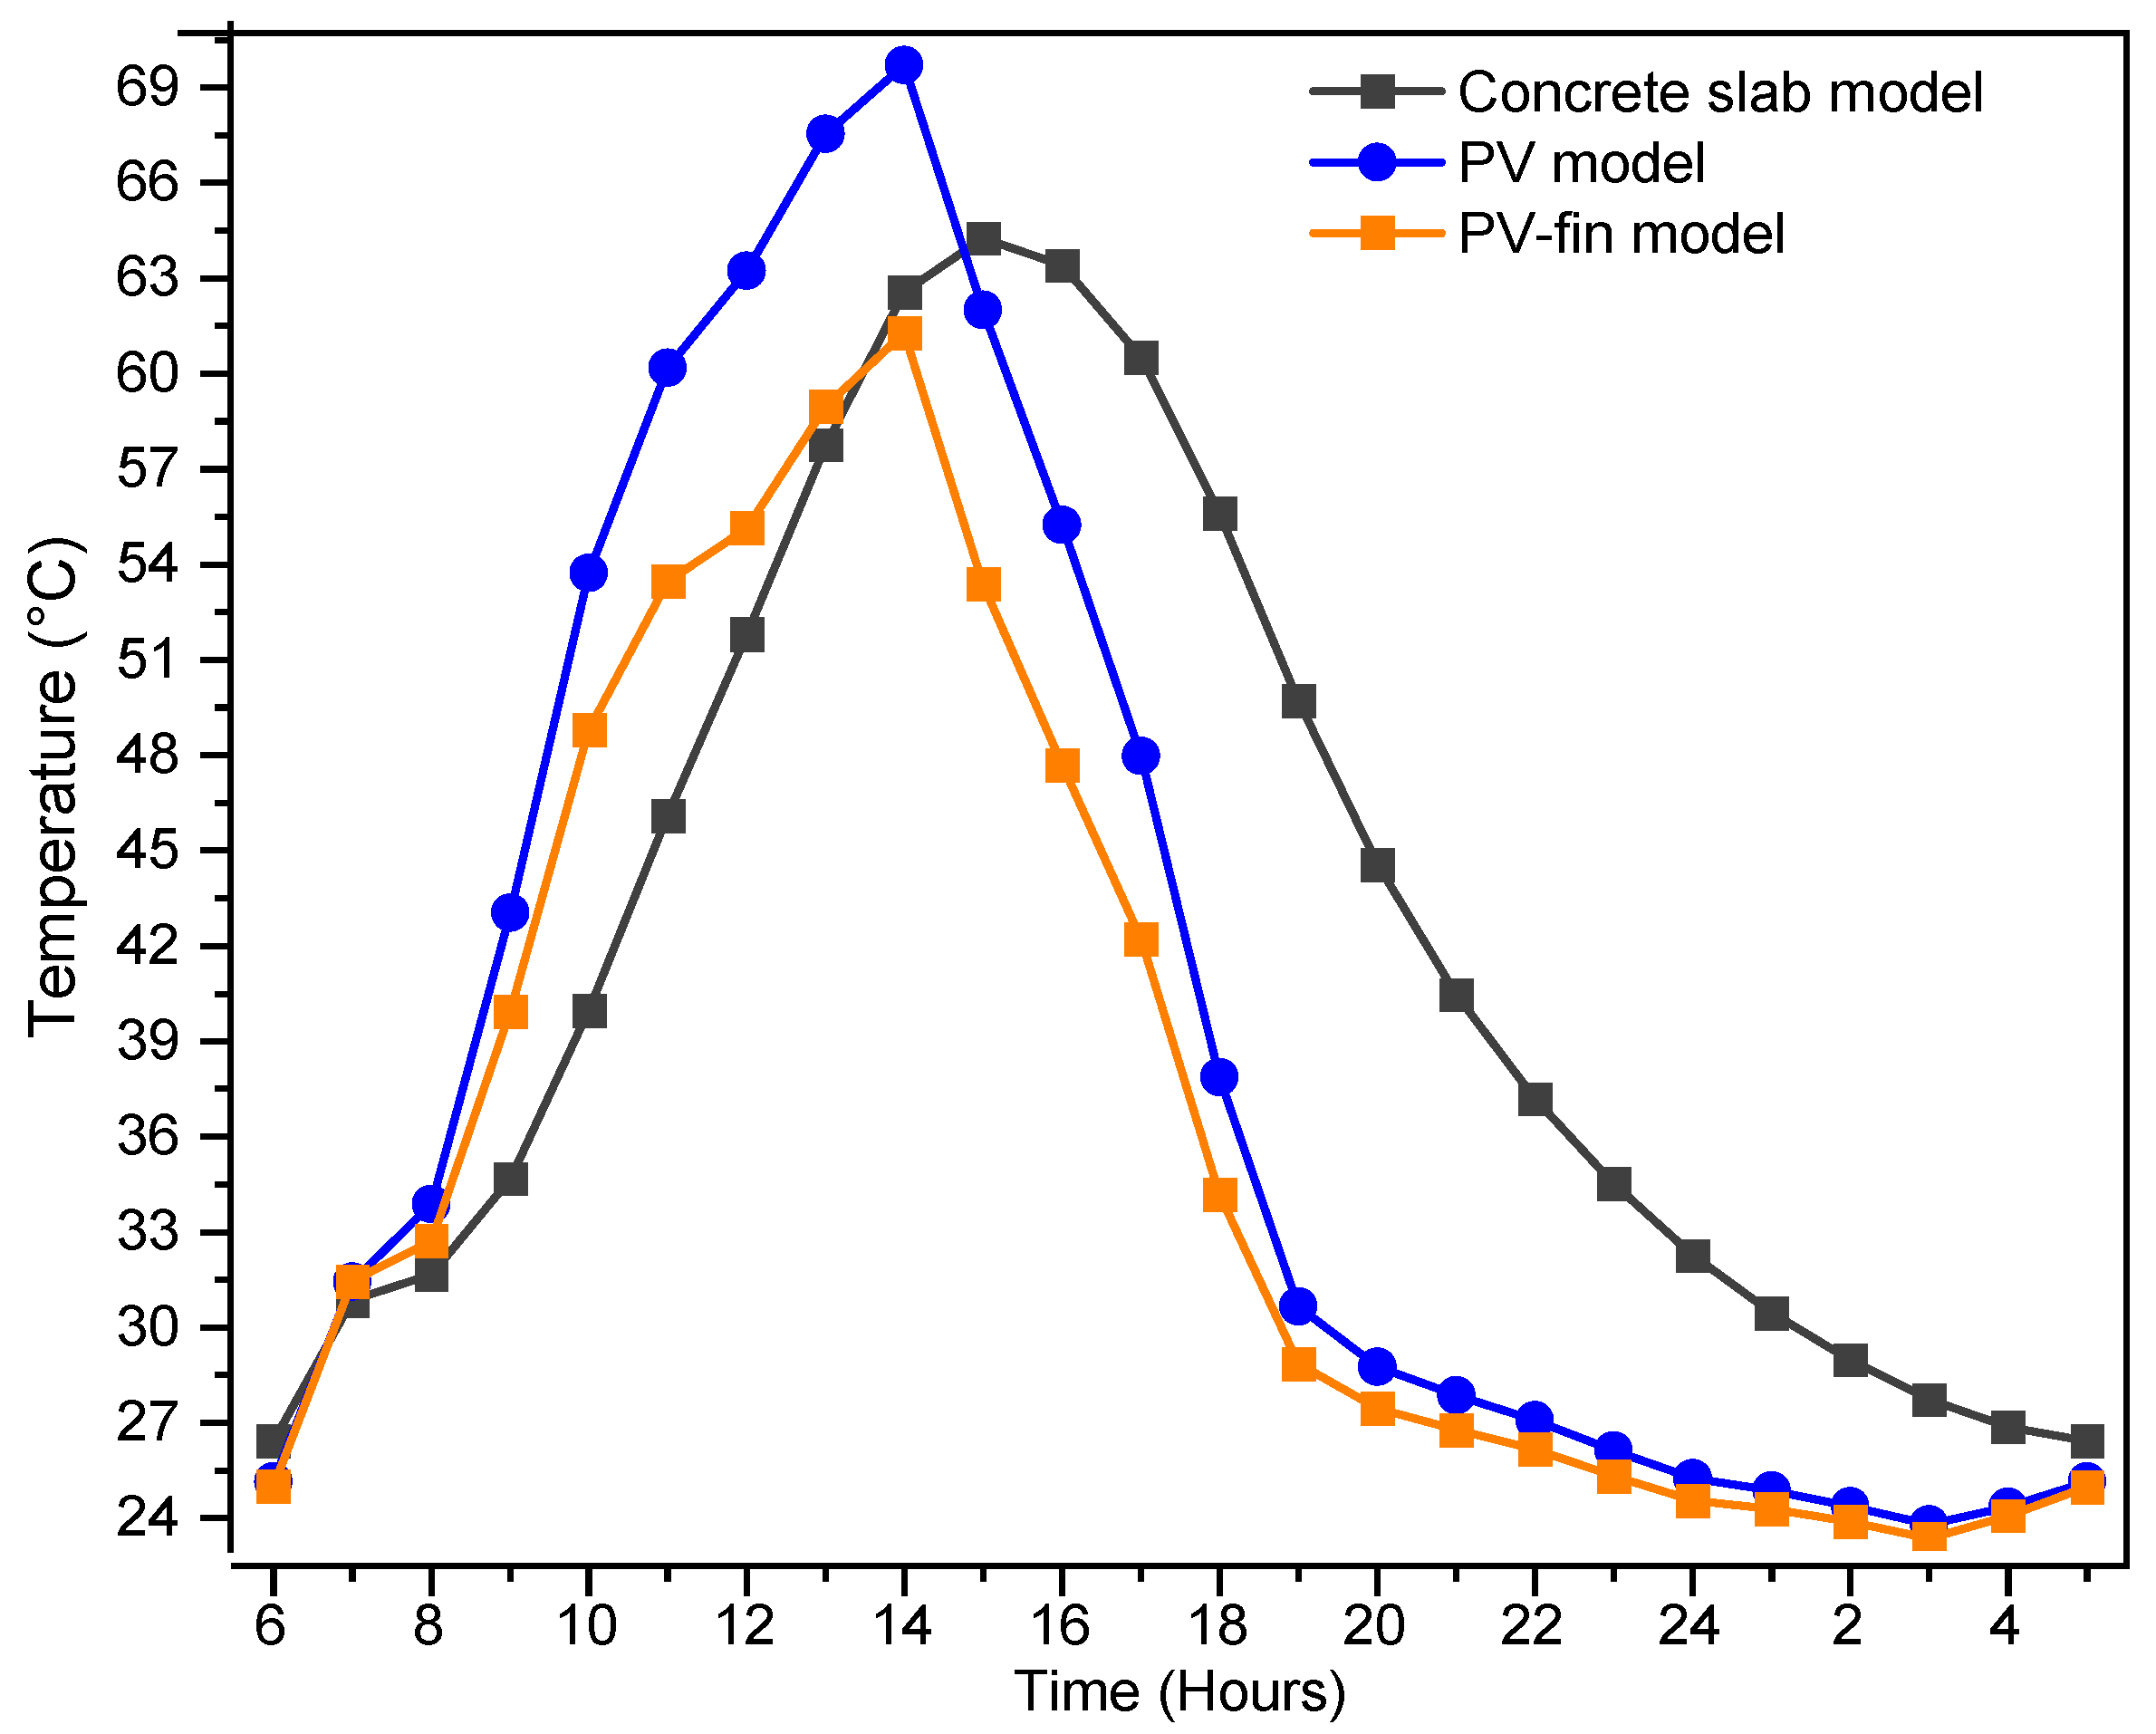
When averaged over the roof and walls, the BIPV configuration shows earlier and higher daytime temperatures than the concrete case, peaking about one hour earlier due to its lower thermal mass and higher effective absorptance. After the peak, temperatures decline markedly as convective heat transfer becomes the dominant mechanism, consistent with the reduced effective thermal capacity of PV-based roofs [30,35]. At 19:00 h, the temperature difference between BIPV and concrete reaches its maximum (19.1 °C; 38–44%, depending on the reference), indicating more efficient nighttime heat dissipation in low-inertia envelope systems [35]. This improvement results primarily from reduced heat capacity and enhanced convective exchange rather than from differences in material conductivity.
As shown in Figure 6, Model 3 reaches a maximum temperature of 61.2 °C under peak conditions, corresponding to a reduction of about 12% relative to the finless BIPV configuration and 4.5–5% relative to the concrete slab. At 19:00 h, Model 3 remains approximately 42% cooler than the concrete roof, consistent with studies reporting sustained temperature reductions driven by fin-induced natural convection [36]. From late afternoon through early morning (15:00–06:00 h), both BIPV configurations remain cooler than concrete, reflecting the combined influence of material properties (heat capacity, diffusivity) and geometry-enhanced natural convection under transient conditions.
Figure 6.
Diurnal profile of envelope-averaged temperature, highlighting earlier peaks and faster evening cool-down for the PV-based configurations.
Table 2 summarizes the average roof temperature for each configuration. The BIPV roof reaches its maximum approximately one hour earlier than the concrete slab due to lower thermal inertia, while the fin-assisted configuration exhibits the lowest peak temperature and the fastest cooling rate toward evening.
Table 2.
Average roof temperature for each configuration.
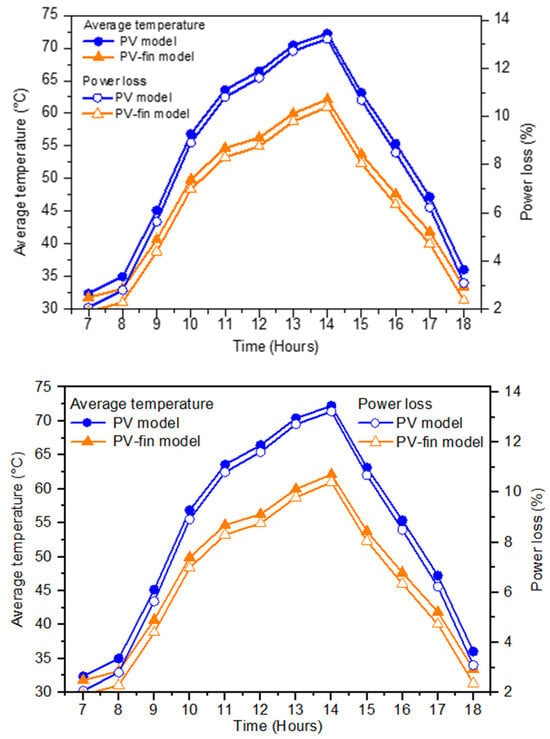
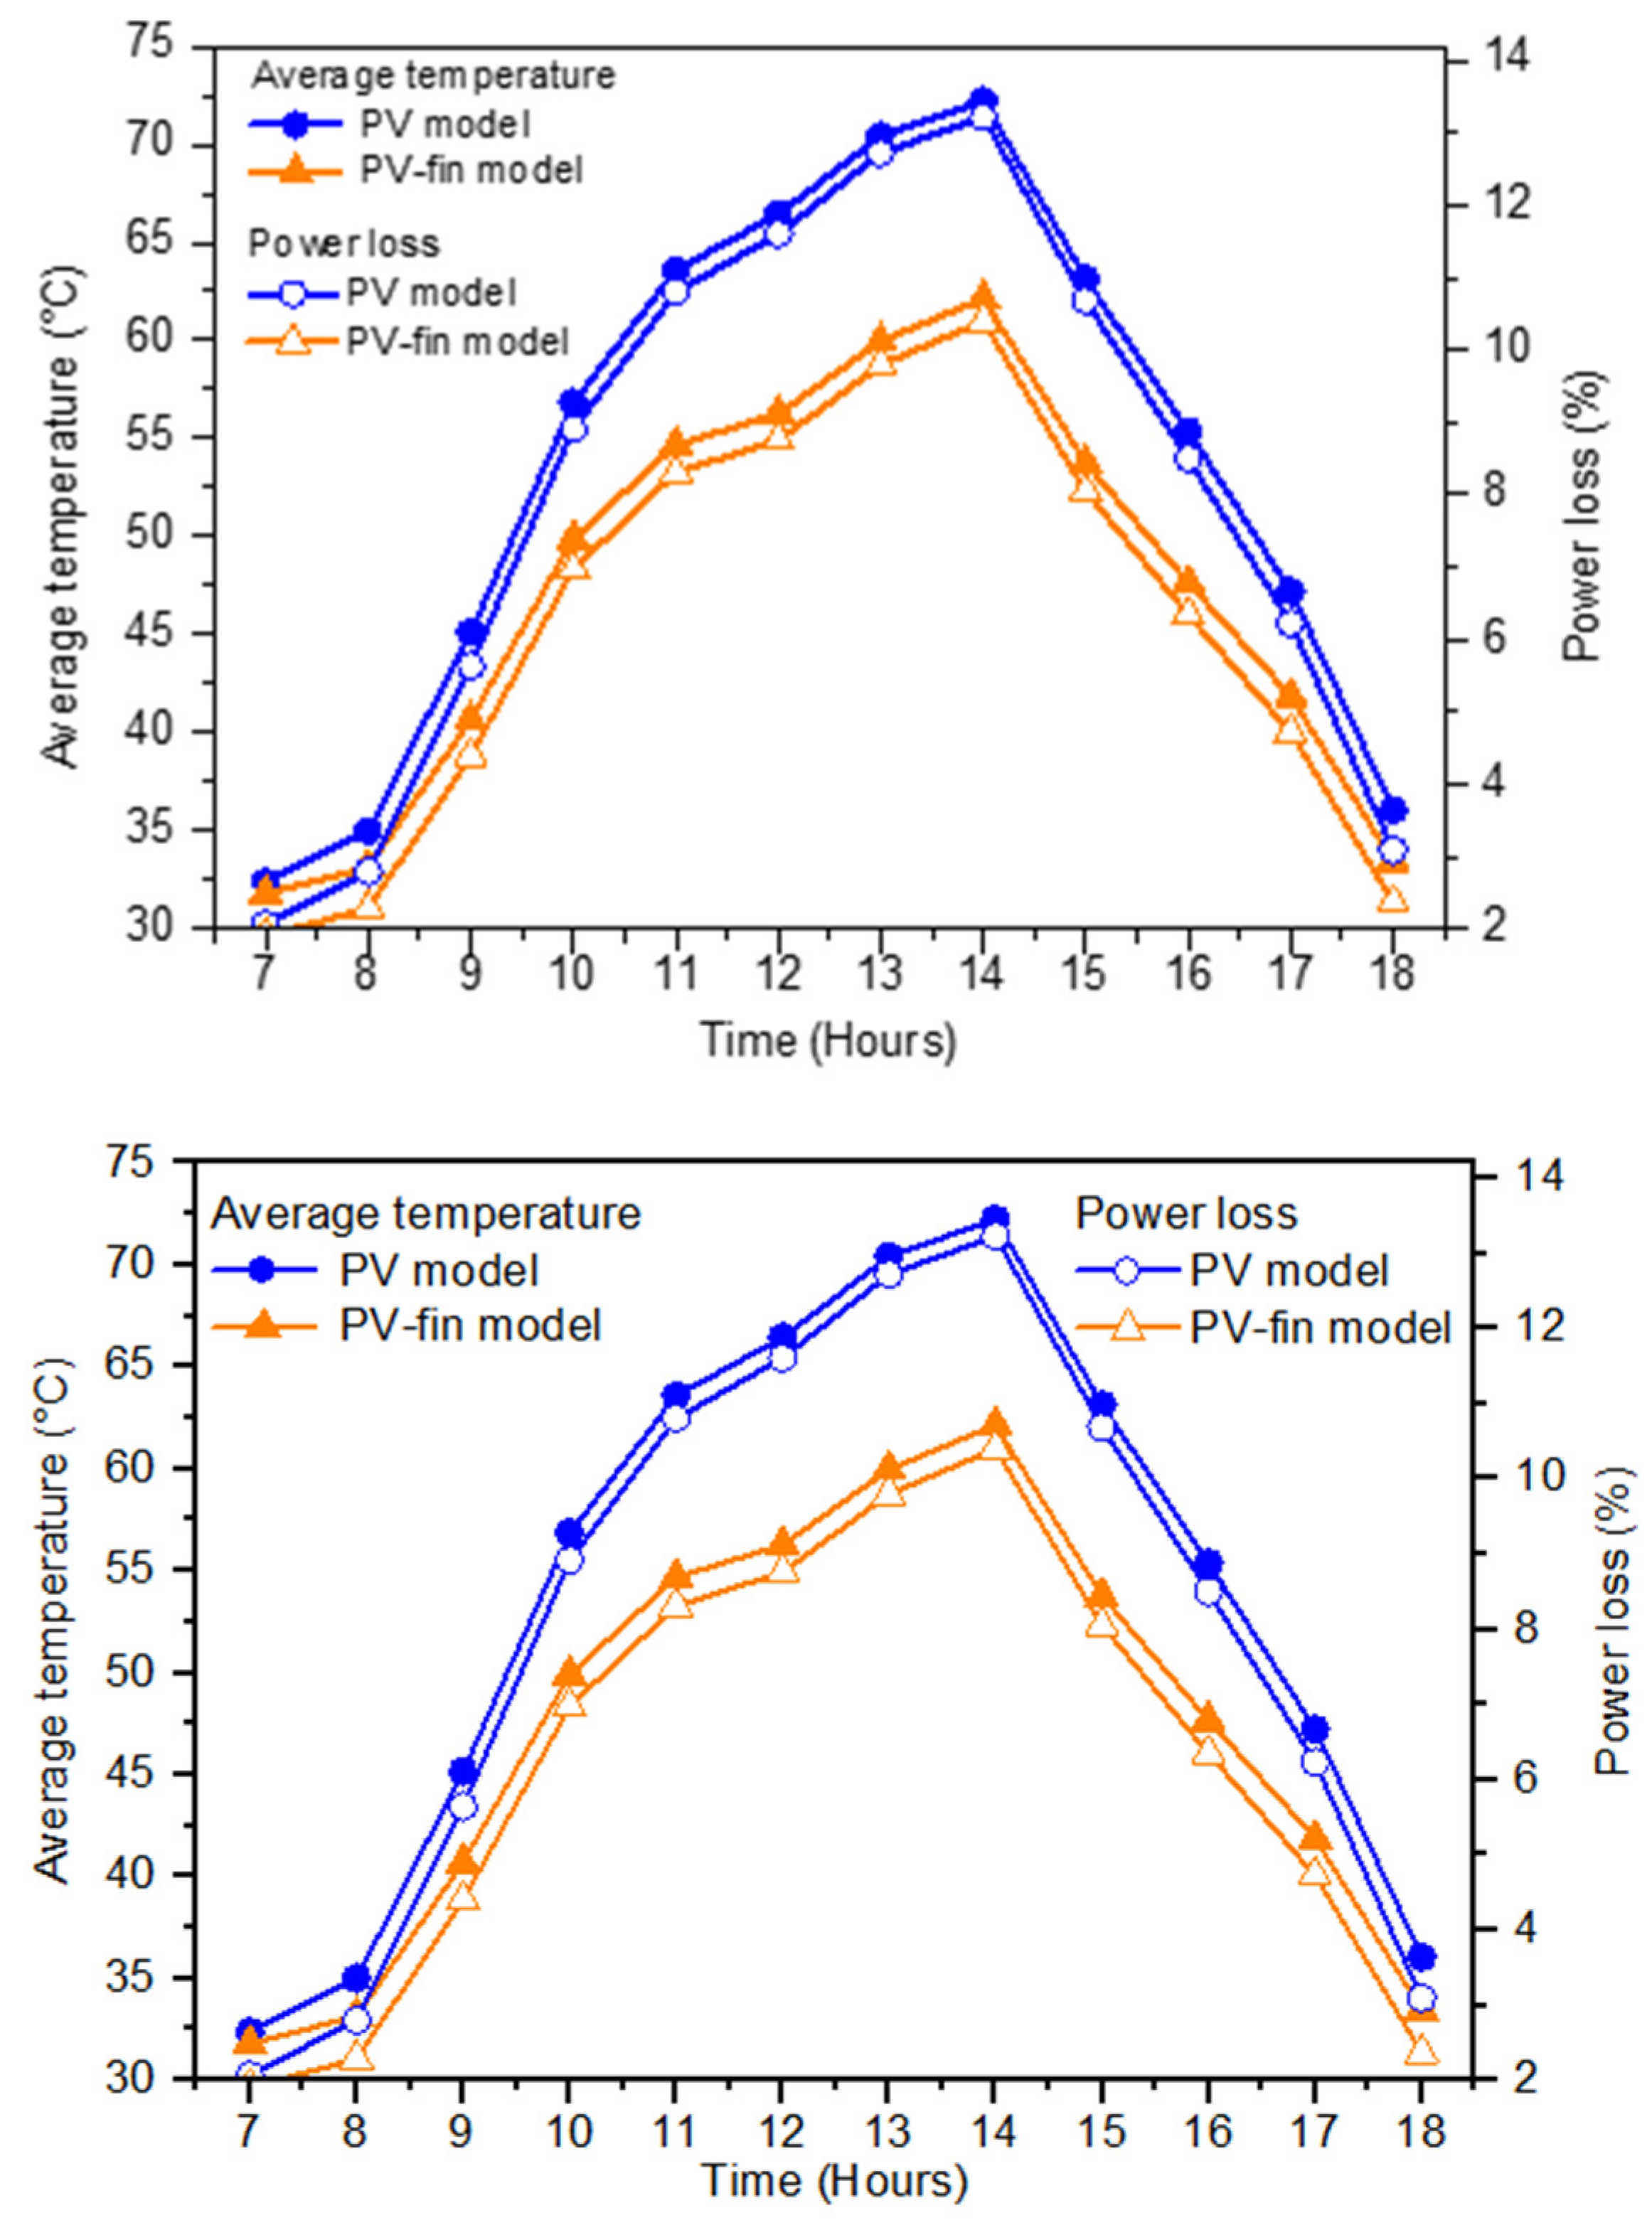
As shown in Figure 7, the electrical performance of Models 2 and 3 (14.6 kWp each) was evaluated using the module temperature coefficient of −0.4% per °C (IEC 61724) to estimate thermally induced power losses from the average surface temperatures with and without fins. At maximum irradiance around 14:00 h, the finless BIPV exhibits its largest temperature-induced loss (13.2%), whereas the finned BIPV limits the loss to 10.4%, representing a relative improvement of 21.2% and consistent with passive cooling reports showing 8–12 °C temperature reductions and 4–6% efficiency gains [26]. The 21% relative efficiency improvement aligns with the measured 8–10 °C decrease in module temperature, consistent with reported sensitivities of 0.3–0.6% efficiency loss per °C under comparable conditions [34].
Figure 7.
Temperature-induced power-loss estimates with and without passive fins using the −0.40% per °C coefficient (IEC-type).
As shown in Figure 7, surface heat-flux magnitude at (a) peak thermal demand and (b) 19:00 h for the three configurations (concrete, BIPV, BIPV+Fins). The maps reveal spatial dissipation patterns and support the 3D transient mechanism underlying the observed temperature reductions in the fin-assisted BIPV.
Overall, reducing PV surface temperature through passive design directly decreases temperature-induced electrical losses while simultaneously lowering envelope thermal loads, thereby supporting improved indoor conditions and higher energy efficiency. These results highlight the need to jointly optimize architectural and energy functions in BIPV systems [29].
The BIPV options increase upfront investment by about 38% (approximately USD 15,800), primarily due to module procurement and integration requirements. However, electricity self-generation and reduced cooling demand improve the overall life cycle balance, consistent with reported LCA trends for BIPV systems in hot climates [37]. The financial parameters used in the economic assessment, including tariff structure, self-consumption ratio, operation and maintenance costs, degradation rate, and discount rate, are summarized in Table 3. These assumptions provide a transparent basis for evaluating long-term economic performance and enable reproducible comparison across the architectural configurations.
Table 3.
Financial parameters used in the economic assessment.
The simple payback reflects site specific hot climate operation with the following inputs (Table 3): an energy price of 0.21 USD/kWh, self consumption of 15%, O&M costs of 18 USD/kWp year, a degradation rate of 0.7%/year, a nominal discount rate of 8% (5.5% real), an array size of 14.6 kWp, and post loss daily generation of 65.8–67.6 kWh/d (from 73.2 kWh/d pre loss). It should be noted that the reported payback corresponds to a simplified economic indicator (simple payback period), which does not account for discounted cash flow, inflation variability, or long-term financial metrics such as net present value (NPV) or levelized cost of energy (LCOE). In addition, the investment cost considered in this study is based on an incremental BIPV approach, where the cost of the photovoltaic system replaces the conventional roof construction. Specifically, the effective investment is calculated as the difference between the photovoltaic system cost (MXN 290,000) and the conventional reinforced concrete roof cost (MXN 179,186.43), resulting in a net investment of MXN 110,813.57. This assumption reflects the dual functional role of BIPV systems as both energy generators and building envelope elements, and is consistent with common economic assessment approaches for building-integrated systems. The relatively short payback obtained in this study is therefore primarily driven by the high solar irradiance conditions, favorable local electricity tariffs, and the reduced incremental investment cost. Under these inputs, the BIPV configurations yield an estimated simple payback of ≈ 8.5–9 months, shorter than the 24–36 months typically reported for BIPV systems in hot climates [38]. Therefore, this value should be interpreted as a site-specific estimate based on incremental cost assumptions rather than a universally generalizable result. Sensitivity note: a ±10–15% change in either tariff or daily yield shifts the payback by a few months, indicating that the short payback reported here is specific to the local tariff and climatic forcing.
Table 3 presents the financial and operational assumptions employed in the economic assessment. The table consolidates key parameters influencing long term cost–benefit performance, including electricity tariffs, self-consumption levels, degradation rates, O&M expenses, discount rates, and system lifetime. By standardizing these inputs, the table ensures methodological transparency and allows consistent comparison of life cycle performance among the BIPV and conventional configurations. It should be noted that the economic evaluation is based on an incremental cost approach, where the BIPV system replaces the conventional roof structure, thereby reducing the effective initial investment considered in the payback calculation. In addition, a sensitivity perspective is considered to evaluate the robustness of the economic outcomes, indicating that moderate variations in key parameters such as electricity price or energy yield (±10–15%) result in proportional shifts in the payback period on the order of a few months. This sensitivity analysis confirms that, although the absolute payback value is dependent on local economic and climatic conditions, the relative performance improvement associated with the fin-assisted configuration remains robust across plausible scenarios.
Discussion
The 3D transient results show earlier peak temperatures for BIPV—due to lower thermal inertia compared to concrete—together with a stronger evening cool down. The fin-assisted configuration provides the largest temperature reduction (≈8–12 °C), consistent with reported ranges for passive fin cooling in PV systems. Unlike steady-state approaches, the full diurnal transient method captures peak timing, phase lag, and nighttime dissipation, all of which strongly influence envelope heat gain. In this context, the use of effective convective heat transfer coefficients represents a standard engineering approximation widely adopted in building-scale thermal simulations, enabling the representation of air-side heat exchange without explicitly resolving complex airflow patterns. While this approach does not capture local flow variations within the ventilated cavity or around the fins, it adequately represents the dominant heat transfer mechanisms governing the observed thermal response. The results support that geometry-based passive cooling improves both thermal load mitigation and electrical performance. Limitations include the use of a single-day boundary dataset and temperature-independent material properties; however, verification through mesh independence and correlation checks supports the robustness of the observed trends. Future work will incorporate seasonal forcing, different climates, and experimental validation of rear cavity convection.
4. Conclusions
This work developed and applied a three-dimensional transient finite element model to quantify the thermal, electrical, and economic performance of PV-integrated roofs in hot climates. Relative to a conventional concrete slab, BIPV roofs exhibited earlier peaks and lower nighttime temperatures (15:00–06:00 h), reflecting lower thermal inertia and stronger air-side convection. The fin-assisted BIPV configuration was the most effective option: it reduced peak temperatures (≈61.2 C) and thermal load by about 42% during periods of maximum difference, decreased envelope heat gain and associated cooling demand, and limited temperature-induced electrical losses (≈21% relative improvement at peak). The predicted temperature ranges and transient behavior were found to be consistent with values reported in experimental and numerical studies of BIPV systems under similar climatic conditions, supporting the physical realism of the proposed model. The use of effective convective heat transfer coefficients enabled a computationally efficient representation of air-side heat exchange, while adequately capturing the dominant thermal mechanisms governing the system response.
Although BIPV increased upfront cost by about 38% (≈USD 15,800) when compared to a conventional roofing solution on a total system basis, electricity self-generation and reduced cooling demand yielded competitive payback, with the fin-enhanced system offering the highest return. However, for the economic evaluation, an incremental cost approach was adopted, in which the photovoltaic system replaces the conventional concrete roof, thereby reducing the effective additional investment considered in the payback calculation. It should be noted that the economic assessment is based on a simple payback approach using this incremental cost formulation. Therefore, the reported payback reflects site-specific conditions and should be interpreted accordingly.
Overall, replacing concrete roofs with BIPV and passive fins constitutes a practical strategy to lower thermal loads, improve PV output, and enhance whole building energy performance. The main contributions are: (i) a reproducible 3D transient FEM framework for envelope–PV evaluation over full diurnal cycles; (ii) quantified benefits of fin-assisted BIPV; and (iii) design-oriented criteria (peak timing, dissipation behavior, and thermal load metrics). Limitations of the study include the use of a single clear sky 24 h boundary condition dataset, temperature-independent material properties, and the use of effective convective coefficients instead of fully resolved airflow modeling. Future work should extend to seasonal horizons, variable climates, and coupled electrothermal control with experimental validation. Future work will extend the 3D transient framework to multiple locations and seasonal weather profiles (clear-sky and cloudy/diffuse regimes) to assess robustness across climates.
Author Contributions
Conceptualization, J.P.D.-D.-J.; Methodology, G.P.-H.; Formal Analysis, R.T.-R.; Data Curation, R.R.-B.; Writing—Original Draft, J.L.-G. and J.D.-D.-S.; Writing—Review and Editing, B.L.P.-E. All authors have read and agreed to the published version of the manuscript.
Funding
This research was funded by Secretaría de Ciencia, Humanidades, Tecnología e Innovación, grant number 1099112. This research was also funded by the Consejo de Ciencia y Tecnología del Estado de Tabasco (CCYTET, Mexico), grant number PRODECTI-2022-01/58.
Data Availability Statement
The original contributions presented in this study are included in the article. Further inquiries can be directed to the corresponding author.
Acknowledgments
The authors gratefully acknowledge the Surface Engineering and Renewable Energy Laboratory, DAIA-UJAT, Tabasco, for their technical support.
Conflicts of Interest
The authors declare no conflicts of interest.
References
- Zheng, Y.; Miao, J.; Yu, H.; Liu, F.; Cai, Q. Thermal analysis of air-cooled channels of different sizes in naturally ventilated photovoltaic wall panels. Buildings 2023, 13, 3002. [Google Scholar] [CrossRef] [Scilit]
- Cao, R.; Hao, Y.; Li, Y.; Liao, W. Emerging trends in lifecycle assessment of building construction for greenhouse gas control: Implications for capacity building. Discov. Appl. Sci. 2025, 7, 398. [Google Scholar] [CrossRef] [Scilit]
- Jiang, Y.; Yang, X.; Shan, M.; Hu, S. Decarbonizing Rural Buildings and Rural Energy System; Springer Nature: Singapore, 2024. [Google Scholar] [CrossRef] [Scilit]
- United Nations Environment Programme. 2023 Global Status Report for Buildings and Construction; United Nations Environment Programme: Nairobi, Kenya, 2024. [Google Scholar] [CrossRef] [Scilit]
- Ye, Q.; Ba, L.; Nguyen, G.T.M.; Absi, R.; Ledésert, B.A.; Dosseh, G.; Hebert, R.L. Experimental and numerical simulation study on the thermal performance of building envelope structures incorporating the solid–solid phase change material. Energy Build. 2025, 348, 116476. [Google Scholar] [CrossRef] [Scilit]
- Zhang, T.; Wang, H.; Ding, J.; Tang, S.; Yuan, D.; Rao, Y. Transient simulation of the thermal performance of a novel phase change material Trombe wall. Coatings 2025, 15, 303. [Google Scholar] [CrossRef] [Scilit]
- Sornek, K.; Papis-Frączek, K.; Calise, F.; Cappiello, F.L.; Vicidomini, M. A review of experimental and numerical analyses of solar thermal walls. Energies 2023, 16, 3102. [Google Scholar] [CrossRef] [Scilit]
- Bulmez, A.M.; Brezeanu, A.I.; Dragomir, G.; Fratu, M.; Iordan, N.F.; Bolocan, S.I.; Rozorea, L.; Popa, E.C.; Năstase, G. CFD analysis for a new Trombe wall concept. Buildings 2024, 14, 579. [Google Scholar] [CrossRef] [Scilit]
- Deng, J.X.; Li, X.; Li, X.J.; Wei, T.B. Research on the performance of recycled-straw insulating concrete and optimization design of matching ratio. Sustainability 2023, 15, 9608. [Google Scholar] [CrossRef] [Scilit]
- Fan, X.; Guo, Y.; Zhao, Q.; Zhu, Y. Structural optimization and application research of alkali-activated slag ceramsite compound insulation block based on finite element method. Mathematics 2021, 9, 2488. [Google Scholar] [CrossRef] [Scilit]
- Gondim, I.A.; Sousa, H.; Bertini, A. Changes in clay hollow block geometry for energy efficiency benefits—Thermal simulation for Brazil. Buildings 2023, 13, 1594. [Google Scholar] [CrossRef] [Scilit]
- Ahmadi Moghaddam, H.; Tkachenko, S.; Yeoh, G.H.; Timchenko, V. A newly designed BIPV system with enhanced passive cooling and ventilation. Build. Simul. 2023, 16, 2093–2107. [Google Scholar] [CrossRef] [Scilit]
- Badi, N.; Laatar, A.H. Improved cooling of photovoltaic panels by natural convection flow in a channel with adiabatic extensions. PLoS ONE 2024, 19, e0302326. [Google Scholar] [CrossRef] [Scilit]
- Abdelrazik, A.S.; Osama, A.; Allam, A.N.; Shboul, B.; Sharafeldin, M.A.; Elwardany, M.; Masoud, A.M. ANSYS-Fluent numerical modeling of the solar thermal and hybrid photovoltaic-based solar harvesting systems. J. Therm. Anal. Calorim. 2023, 148, 11373–11424. [Google Scholar] [CrossRef] [Scilit]
- Ghabuzyan, L.; Pan, K.; Fatahi, A.; Kuo, J.; Baldus-Jeursen, C. Thermal effects on photovoltaic array performance: Experimentation, modeling, and simulation. Appl. Sci. 2021, 11, 1460. [Google Scholar] [CrossRef] [Scilit]
- Cabrera-Escobar, R.; Vera, D.; Cabrera-Escobar, J.; Paredes Godoy, M.M.; Cajamarca Carrazco, D.; Zumba Llango, E.R.; Jurado, F. Finite element analysis method design and simulation of fins for cooling a monocrystalline photovoltaic panel. Clean Technol. 2024, 6, 767–783. [Google Scholar] [CrossRef] [Scilit]
- Sheikh, Y.; Jasim, M.; Qasim, M.; Qaisieh, A.; Hamdan, M.O.; Abed, F. Enhancing PV solar panel efficiency through integration with a passive multi-layered PCMs cooling system: A numerical study. Int. J. Thermofluids 2024, 23, 100748. [Google Scholar] [CrossRef] [Scilit]
- Ahmad, A.; Navarro, H.; Ghosh, S.; Ding, Y.; Roy, J.N. Evaluation of new PCM/PV configurations for electrical energy efficiency improvement through thermal management of PV systems. Energies 2021, 14, 4130. [Google Scholar] [CrossRef] [Scilit]
- Harmailil, I.O.; Sultan, S.M.; Tso, C.P.; Fudholi, A.; Mohammad, M.; Ibrahim, A. The state of the art of photovoltaic module cooling techniques and performance assessment methods. Symmetry 2024, 16, 412. [Google Scholar] [CrossRef] [Scilit]
- Foroutanfar, F.; Tejedor, B.; Casals, M. Rethinking BIPVs: Evaluating the thermal trade-offs of building-integrated photovoltaics. Energy Build. 2025, 348, 116451. [Google Scholar] [CrossRef] [Scilit]
- Alajmi, A.; Zabnienska-Góra, A.; Jouhara, H. Heat pipe PV/T system under hot climate conditions: Experimental and simulation analysis of system performance. Renew. Sustain. Energy Technol. 2025, 1, 3. [Google Scholar] [CrossRef] [Scilit]
- Imik, E.; Yilmaz, M. A numerical investigation on the performance and sustainability analysis of conventional and finned air-cooled solar photovoltaic thermal (PV/T) systems. Sustainability 2025, 17, 10638. [Google Scholar] [CrossRef] [Scilit]
- Laafer, A.; Hammouma, T.; Hmida, A.; Bourouis, M. Comprehensive review of phase change materials for building applications: Passive, active, and hybrid systems (2022–2025). Energies 2026, 19, 1151. [Google Scholar] [CrossRef] [Scilit]
- Ding, K.; Calautit, J.K.; Jimenez-Bescos, C. Significance of external wind conditions on the convective heat transfer coefficients (CHTC) and energy performance in multi-zone high-rise buildings. Energy Build. 2024, 320, 114570. [Google Scholar] [CrossRef] [Scilit]
- Idan, H.A.; Kadhom, H.K.; Faraj, S.R. Experimental and numerical investigation of PV panel cooling using ribbed fin heat exchanger and hybrid generation. Int. J. Heat Technol. 2024, 42, 1406–1416. [Google Scholar] [CrossRef] [Scilit]
- Hudișteanu, S.V.; Țurcanu, F.E.; Cherecheș, N.C.; Popovici, C.G.; Verdeș, M.; Huditeanu, I. Enhancement of PV panel power production by passive cooling using heat sinks with perforated fins. Appl. Sci. 2021, 11, 11323. [Google Scholar] [CrossRef] [Scilit]
- Martín-Chivelet, N.; Polo, J.; Sanz-Saiz, C.; Núñez Benítez, L.T.; Alonso-Abella, M.; Cuenca, J. Assessment of PV module temperature models for building-integrated photovoltaics (BIPV). Sustainability 2022, 14, 1500. [Google Scholar] [CrossRef] [Scilit]
- Yadav, D.; Yadav, S.K.; Varma, V.; Khatoon, S.; Singh, J.; Singh, R.B.; Hasnain, S.M.; Paramasivam, P.; Tufa, M.A. Experimental analysis of elevated temperature and soiling loss on the rooftop PV modules performance under composite climatic conditions. Sci. Rep. 2025, 15, 25846. [Google Scholar] [CrossRef] [Scilit] [PubMed]
- Șirin, C.; Goggins, J.; Hajdukiewicz, M. A review on building integrated photovol-taic/thermal systems for green buildings. Appl. Therm. Eng. 2023, 229, 120607. [Google Scholar] [CrossRef] [Scilit]
- Shahrestani, M.; Yao, R.; Essah, E.; Shao, L.; Oliveira, A.C.; Hepbasli, A.; Biyik, E.; del Caño, T.; Rico, E.; Lechón, J.L. Experimental and numerical studies to assess the energy performance of naturally ventilated PV façade systems. Sol. Energy 2017, 147, 37–51. [Google Scholar] [CrossRef] [Scilit]
- Odeh, S. Thermal performance of dwellings with rooftop PV panels and PV/thermal collectors. Energies 2018, 11, 1879. [Google Scholar] [CrossRef] [Scilit]
- Zhang, Y.; Mu, T.; Xue, Y. External temperature distribution and characteristics of building-integrated photovoltaics (BIPV) under summer high temperature conditions. Buildings 2025, 15, 3415. [Google Scholar] [CrossRef] [Scilit]
- Cornago, I.; Ezquer, M.; Sorbet, F.J.; Kalms, A.; Diarce, G.; Irulegi, O.; Zaversky, F. New approach of PV and thermal modeling to develop feasible cooling solutions for PV in buildings. EPJ Photovolt. 2025, 16, 7. [Google Scholar] [CrossRef] [Scilit]
- Mustafa, J.; Alqaed, S.; Sajadi, S.M.; Aybar, H. Enhancing solar panel cooling effi-ciency: A study on the influence of nanofluid inclusion and pin fin shape during melting and freezing of phase change materials. Front. Energy Res. 2024, 12, 1344061. [Google Scholar] [CrossRef] [Scilit]
- Shboul, B.; Zayed, M.E.; Ashraf, W.M.; Usman, M.; Roy, D.; Irshad, K.; Rehman, S. Energy and economic analysis of building integrated photovoltaic thermal system: Seasonal dynamic modeling assisted with machine learning aided method and multi objective genetic optimization. Alex. Eng. J. 2024, 94, 131–148. [Google Scholar] [CrossRef] [Scilit]
- Razali, S.N.; Ibrahim, A.; Fazlizan, A.; Al Aasam, A.B.; Rahmat, M.A.A.; Ishak, M.A.A.B. Superior thermal dissipation through natural convection in a passive cooling system using multidirectional tapered fin heat sinks (MTFHS). Int. J. Renew. Energy Dev. 2025, 14, 577–587. [Google Scholar] [CrossRef] [Scilit]
- Gonçalves, G.L.; Abrahão, R.; Rotella Junior, P.; Rocha, L.C.S. Economic feasibility of conventional and building integrated photovoltaics implementation in Brazil. Energies 2022, 15, 6707. [Google Scholar] [CrossRef] [Scilit]
- Rodríguez Martínez, Á.; Rodríguez Monroy, C. Economic analysis and modelling of rooftop photovoltaic systems in Spain for industrial self consumption. Energies 2021, 14, 7307. [Google Scholar] [CrossRef] [Scilit]

Disclaimer/Publisher’s Note: The statements, opinions and data contained in all publications are solely those of the individual author(s) and contributor(s) and not of MDPI and/or the editor(s). MDPI and/or the editor(s) disclaim responsibility for any injury to people or property resulting from any ideas, methods, instructions or products referred to in the content. |
© 2026 by the authors. Licensee MDPI, Basel, Switzerland. This article is an open access article distributed under the terms and conditions of the Creative Commons Attribution (CC BY) license.