


Abstract
Reliable last-mile connectivity at the cell edge remains a central challenge for Advanced Metering Infrastructure (AMI) in smart grids. This work addresses how to select between LTE-M and NB-IoT communications under weak-coverage conditions by combining field measurements with distribution-based channel modeling. We analyze multi-month Reference Signal Received Power (RSRP) datasets from three areas of a real AMI deployment (N = 30, 35, and 38 m, respectively) and fit canonical fading surrogates—Rayleigh, Rician, and Nakagami—to the normalized measurements. The principal decision statistic is the probability that RSRP falls below a practical threshold (−105 dBm), obtained from empirical and modeled CDF and translated into the predicted number of meters requiring fallback to NB-IoT. Across areas, Nakagami consistently provides the lowest or near-lowest Root Mean Square Error (RMSE) against empirical CDF and the closest agreement with observed fallback counts at −105 dBm, whereas Rayleigh tends to underestimate deep fade tails and Rician degrades when line-of-sight is weak. A threshold sweep sensitivity study (−110 to −89 dBm) using Area 3 illustrates how the predicted fallback population changes monotonically with the decision threshold and supports policy tuning. Overall, a CDF-anchored, Nakagami-guided rule at −105 dBm aligns technology selection with measured channel statistics, improving the robustness of Cellular IoT (CIoT) last-mile communications.
1. Introduction
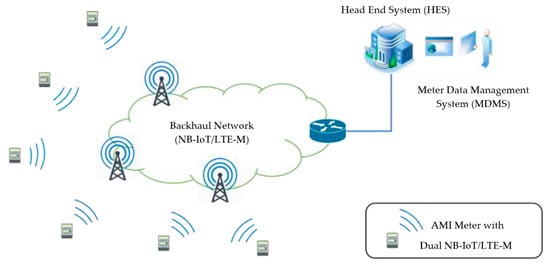
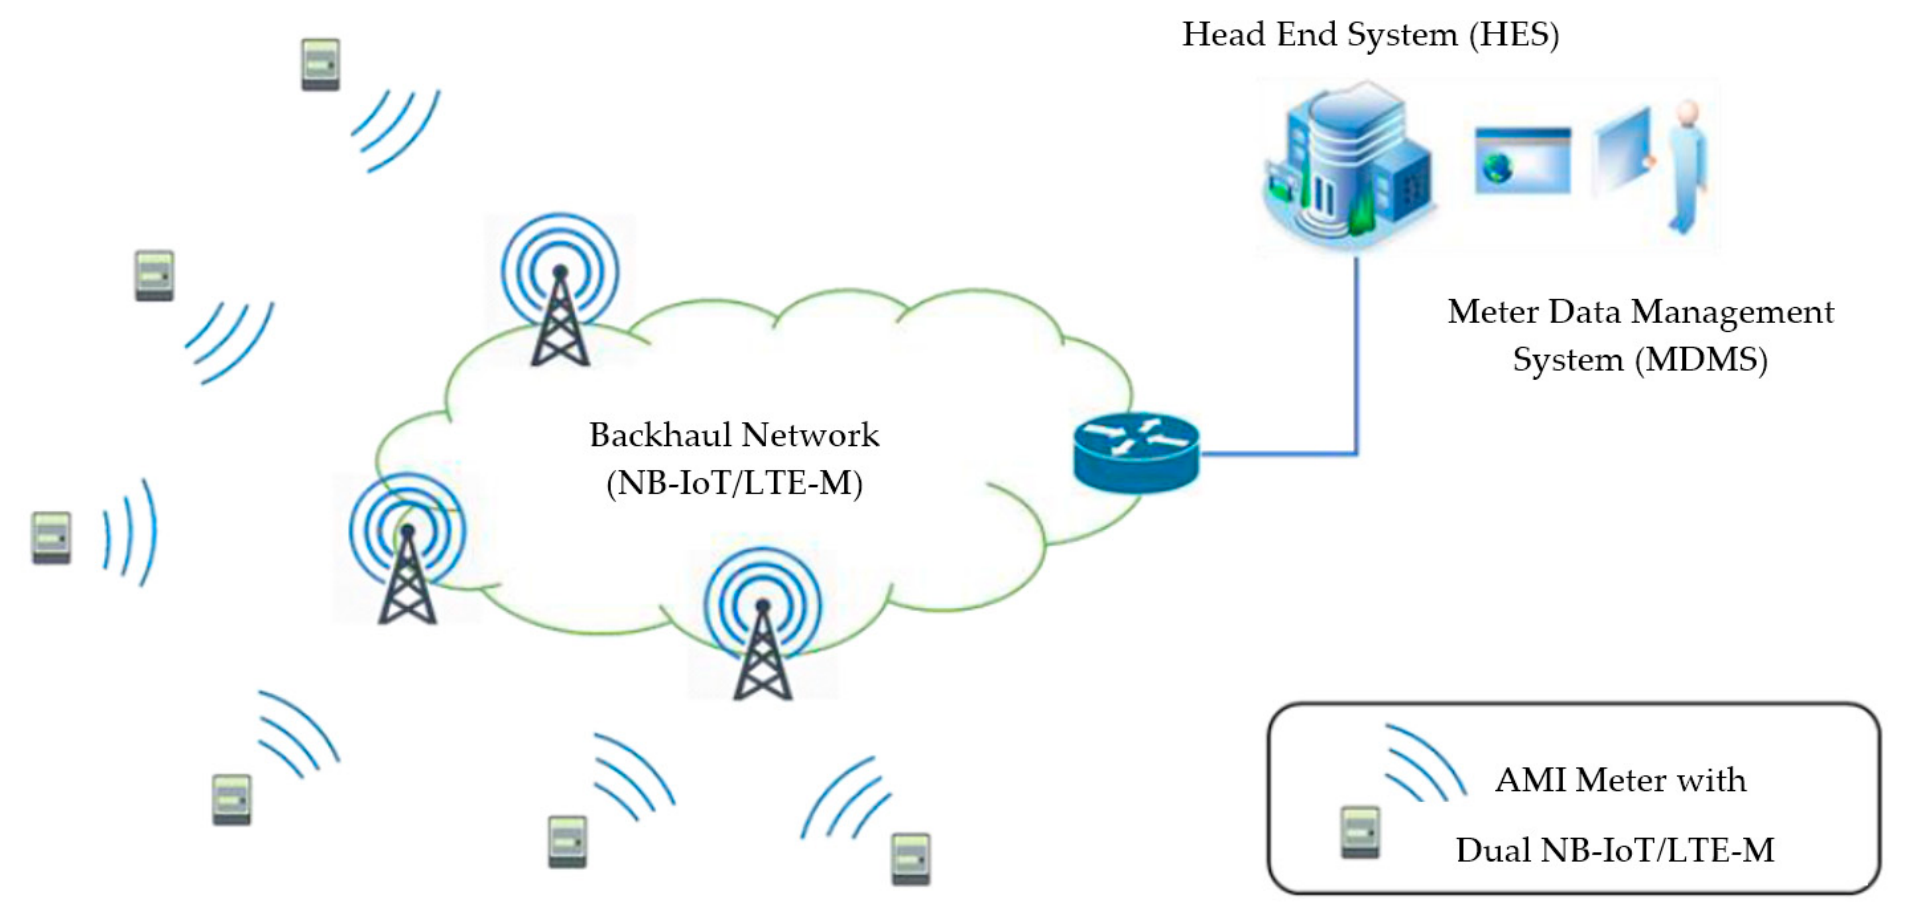
A smart grid is an advanced electricity distribution network that utilizes digital technology to enhance efficiency, reliability, and sustainability in electricity delivery [1]. Incorporating technologies such as smart meters, communication networks, and advanced analytics software, it facilitates bidirectional communication between utilities and customers, optimizing electricity flow management [2]. Central to the smart grid is an advanced metering infrastructure (AMI), a network of smart meters enabling near real-time communication between utilities and individual energy consumers. AMI facilitates remote energy usage monitoring, rapid outage detection and response, and detailed energy consumption feedback for customers. Additionally, AMI supports time-based pricing, aligning electricity rates with fluctuating energy demand [3]. Smart meters are critical components in smart grids, real-time monitoring, data collection, and communication between energy providers and consumers. These meters, when combined with the Internet of Things (IoT) technologies, create a dynamic and responsive grid system capable of adapting to varying energy demands and supply conditions [4]. The increasing adoption of IoT in smart grids, particularly in the context of smart energy meters, underscores the need for robust and scalable communication networks, as shown in Figure 1. Cellular IoT (CIoT) technologies, such as NB-IoT and LTE-M, offer promising solutions for enabling seamless connectivity and data exchange across the smart grid infrastructure. However, the diverse and evolving requirements of smart grid applications, particularly in last-mile communications, necessitate an adaptive approach to selecting the most suitable CIoT technology. This approach must account for factors such as network coverage, latency, power consumption, and cost-effectiveness, which are crucial for ensuring reliable and efficient communication within the smart grid ecosystem.
Figure 1.
Cellular IoT for smart grid last-mile communications network.
Recent works on CIoT for smart grid and smart city applications have investigated the trade-offs between coverage, energy consumption, and latency under weak signal conditions. For example, ref. [5] demonstrated optimization techniques for NB-IoT in smart meter networks, addressing realistic propagation challenges in urban settings. Similarly, ref. [6] compared eMTC (LTE-M) and NB-IoT in terms of energy usage, latency, and device lifetime under poor coverage scenarios, underscoring that the choice of radio access technology must be sensitive to the probability of signal dropout.
In the context of smart grids, last-mile communication poses unique challenges that require not only stable and reliable connectivity but also the ability to adapt to varying environmental conditions and operational demands. In [7], several optimization strategies to enhance the cell selection process in NB-IoT were investigated. These include modifying the cell selection algorithm to account for signal to interference and noise ratio (SINR), network congestion, and device power constraints. Additionally, measurement techniques are introduced to assess network conditions and improve the accuracy of cell selection, ensuring better performance in diverse deployment scenarios. A study [8] reveals that while NB-IoT is designed to provide extensive coverage and deep indoor penetration, its performance can be significantly affected by urban density. High-rise buildings and other structures create physical barriers that reduce signal strength, particularly indoors. Despite this, NB-IoT generally performs better than traditional cellular technologies in terms of maintaining connectivity over long distances and through obstructions. NB-IoT UEs measure Reference Signal Received Power (RSRP) and Reference Signal Received Quality (RSRQ) as indicators for signal strength and link quality, respectively. Analysis [9] shows that LTE-M performs well under varying network conditions, offering strong reliability and consistent data throughput for IoT devices. However, there is a trade-off between data rates and coverage—while the coverage is extended, data transmission rates are lower. In [10], the authors propose an adaptive approach for selecting NB-IoT technologies for smart grid last-mile communications. By considering the impact of power saving measures and other factors affecting network performance, such as coverage and latency, the proposed framework aims to optimize the selection of technologies like NB-IoT, LTE-M, and 4G or 5G. The increasing integration of smart meters in advanced metering infrastructure (AMI) has brought significant advancements in the efficiency and management of modern smart grids. Cellular IoT (CIoT) technologies, particularly Narrowband IoT (NB-IoT), have emerged as a promising solution to support reliable and cost-effective communication in AMI systems. However, ensuring continuous connectivity, especially in areas with poor coverage or signal interference, remains a critical challenge. In [11], the authors address this issue by introducing a dual-SIM NB-IoT modem design, specifically for smart meters, which enhances connectivity by leveraging two SIMs from different network providers. This design allows the meter to switch between networks, ensuring seamless communication and mitigating the risk of disconnection. The QoS metrics (such as packet loss and latency) [12] worsened sharply when signal power frequently fell under operational thresholds. These findings provide external validation that coverage distributions matter for system reliability, which considered variability in coverage and latency to meet deep coverage conditions. Including such adaptive thresholding could further enhance the resilience of CIoT network selection [13].
In the evolving landscape of cellular IoT (CIoT), selecting the most appropriate communication technology for specific applications is a critical challenge, particularly in environments where network coverage and signal propagation conditions vary widely. The 3rd Generation Partnership Project (3GPP) has developed a range of standards to address these challenges, including the TR 38.901 report, which focuses on channel models for evaluating the performance of 5G networks in various scenarios [14]. 3GPP TR 38.901 provides comprehensive models for predicting cellular coverage in environments ranging from rural areas to dense urban settings. These models consider factors such as signal attenuation, diffraction, and scattering, which are essential for accurate coverage prediction, particularly in challenging environments like the last mile of smart grid communications. The 3GPP TR 38.901 models are essential for understanding how cellular IoT technologies such as NB-IoT, LTE-M, and 4G or 5G perform under different environmental conditions.
Recent studies on CIoT networks by [15] proposed a practical decision algorithm Multilink to select between LTE and NB-IoT based on link-quality indicators measured by commercial radio modules (e.g., RSRP/RSRQ/SINR/RSSI), aiming to enable interface selection without adding extra probing transmissions. Their results highlight that lightweight KPI-driven selection can support operational decision-making in realistic deployments, which motivates the use of RSRP-based criteria in CIoT interface/RAT selection for metering and grid-monitoring applications. Real-time adaptive communication has investigated by [16] for smart meters by dynamically adjusting transmission behavior based on observed data changes, targeting energy and packet reduction in LPWAN-based metering (including NB-IoT). Their experimental results demonstrate that adaptive strategies can significantly reduce transmission activity and energy-related overhead while maintaining monitoring functionality, supporting the broader premise that measurement-driven adaptation is essential for scalable metering deployments under constrained conditions. End-to-end energy-efficient and secure communications for smart metering IoT applications by introducing a static context header compression approach, emphasizing that smart metering links must balance constrained-device operation with reliability and security requirements. Their study reinforces that smart grid IoT connectivity is not only a coverage issue, but also a system-level design problem where protocol efficiency and robustness directly affect feasibility in large-scale deployments [17].
Adaptive communication has been widely studied in LPWAN systems to improve reliability and scalability under practical channel impairments. For example, imperfect-orthogonality-aware scheduling has been proposed to enhance LoRa scalability by explicitly accounting for non-ideal spreading-factor orthogonality, thereby mitigating collisions and improving large-scale performance [18]. In addition, mobility-aware link enhancement mechanisms for mobile LoRa networks have been investigated to counter performance degradation caused by movement-induced channel dynamics [19]. While these works target LoRa-based LPWANs rather than cellular CIoT, they share the same overarching principle of adaptation to measured/estimated link conditions. In this study, adaptation is realized at the CIoT network selection layer by using the probability of weak coverage.
2. Cellular IoT Technology
The rapid advancement of the Internet of Things (IoT) technologies has brought significant changes to a wide array of industries, including smart grids, healthcare, transportation, and industrial automation. Central to the success of IoT deployment is the selection of appropriate communication technologies that provide reliable, energy-efficient, and scalable connectivity. Narrowband IoT (NB-IoT) and LTE-M (Category M1), both developed under 3GPP, are two prominent cellular IoT technologies designed to meet these demands in low-power, wide-area (LPWA) networks. NB-IoT, a key LPWA technology, is optimized for low-data-rate applications and offers extensive coverage with deep indoor penetration, making it well suited for use cases such as smart metering, environmental monitoring, and asset tracking. It operates within existing LTE networks but uses narrowband channels, which allows for efficient use of spectrum while ensuring robust performance in environments where traditional cellular signals may struggle to penetrate. On the other hand, LTE-M provides higher data rates compared to NB-IoT, supports voice transmission (VoLTE), and enables better mobility, making it ideal for applications such as connected healthcare devices, wearables, and transportation systems. While both technologies are designed to extend the reach of cellular IoT, their different capabilities in terms of data throughput, latency, and mobility necessitate a careful selection process to ensure optimal deployment for specific IoT applications.
2.1. NB-IoT
Narrowband Internet of Things (NB-IoT) was introduced by 3GPP, the regulatory body responsible for mobile communication network standards [20]. NB-IoT is designed for low-power consumption, with low communication speeds and data transmission frequencies. Devices using NB-IoT operate on the same licensed frequency bands as GSM, 3G, or LTE, which require authorization from regulatory authorities for use. The communication follows a star topology, where data is transmitted to and from the base stations of mobile networks offering NB-IoT services.
NB-IoT utilizes a minimum bandwidth of 180 kHz, which can be implemented in three configurations using a single GSM carrier, operating within the guard band of LTE, or coexisting within an LTE carrier’s frequency block. The technology supports data transmission speeds of up to 250 kbps and provides high sensitivity, exceeding −150 dBm, resulting in significantly extended communication ranges. Compared to traditional GSM and LTE technologies, NB-IoT exhibits a signal sensitivity that is approximately 20 dB higher, offering superior performance in terms of coverage and reliability over long distances.
2.2. LTE-M
LTE-M (Category M1) is a cellular technology designed for low-power, wide-area network (LPWAN) applications, specifically for IoT [21]. It enables low-power, long-range communications over cellular networks, making it ideal for IoT devices with moderate data requirements. It operates within a 1.4 MHz spectrum with a transmission power of 20 dBm, achieving uplink speeds between 200 kbps and 400 kbps. This makes it suitable for applications such as asset tracking, wearable devices, and smart meters, which require more data throughput than NB-IoT but still prioritize power efficiency. In terms of coverage, LTE-M supports both mobility and voice services, adding further versatility in comparison to other LPWAN technologies like NB-IoT, which is more focused on static devices and low-data-rate applications.
2.3. NB-IoT and LTE-M Specification Comparison
The NB-IoT and LTE-M communication technologies according to the 3GPP standards have the specifications listed in Table 1 [22].
Table 1.
NB-IoT and LTE-M specification.
2.4. Cell-Edge Weak Signal Strength
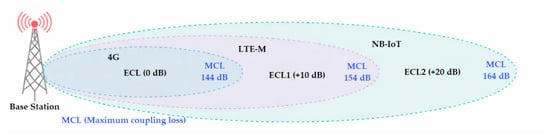
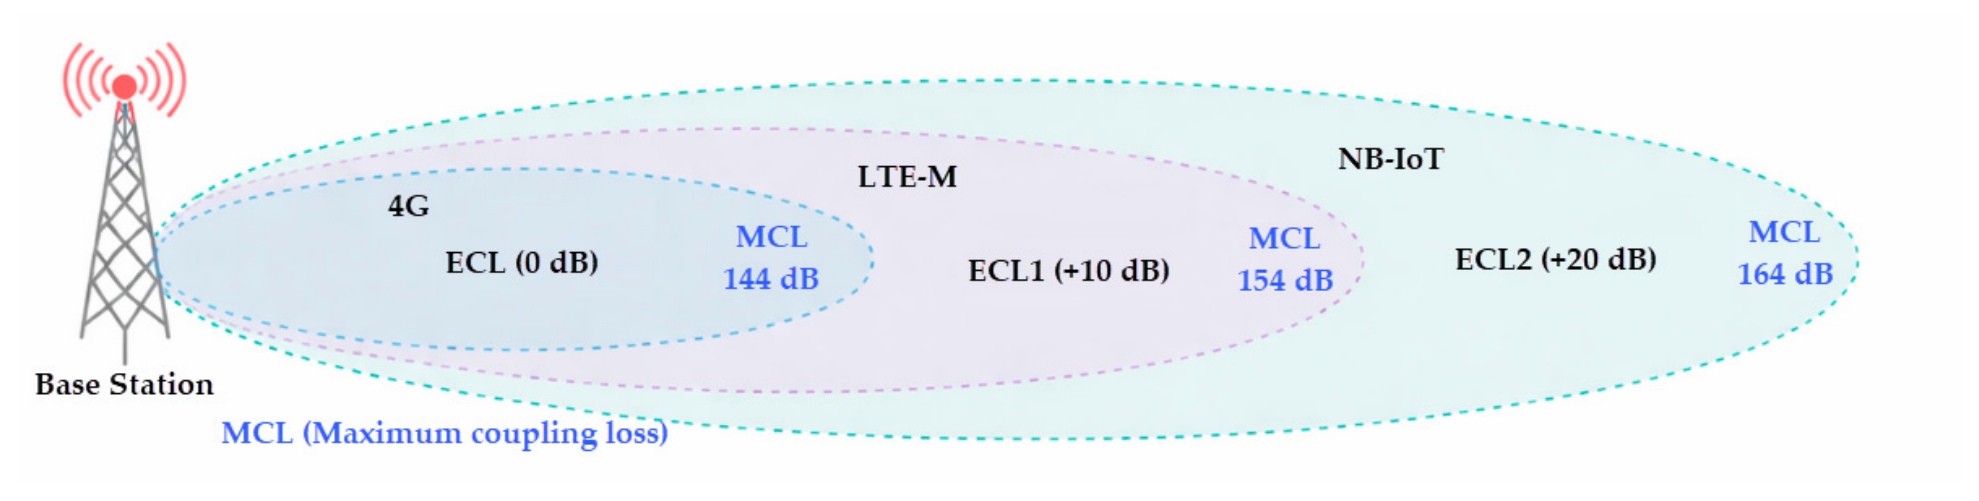
Cell-edge weak signal strength is a critical factor influencing the selection of Narrowband IoT (NB-IoT) and LTE-M communication technologies for IoT applications. Both technologies are designed for low-power, low-data-rate applications, making them ideal for IoT devices that demand long battery life and cost-effective connectivity. However, their performance diverges significantly in areas with weak signal strength, especially near the cell edge [23], as shown in Figure 2, adapted from [24]. NB-IoT, with its narrow bandwidth and low data rates, exhibits superior sensitivity and coverage in weak signal environments. Its design is inherently resistant to interference and signal fading, which are common challenges at the cell edge. By utilizing minimal spectrum resources, NB-IoT can maintain stable connectivity even in areas with poor signal conditions. On the other hand, LTE-M, which operates with a wider bandwidth and supports higher data rates, is more susceptible to signal degradation in low-strength areas. This results in reduced reliability and higher susceptibility to fading at the cell edge. In deployment scenarios where signal strength is limited, NB-IoT offers a more reliable solution for IoT applications due to its ability to maintain robust connections in adverse conditions. Conversely, in areas with strong and stable signal strength, LTE-M may provide enhanced performance with higher data throughput, making it a preferable option for applications that require faster data transmission. Several empirical studies have investigated NB-IoT coverage under diverse environmental scenarios. For example, ref. [25] investigated NB-IoT coverage in indoor, underground, and heavily obstructed settings, revealing substantial degradation in signal levels in enclosed and shielded locations. This supports our emphasis on assessing the empirical RSRP distribution at the cell edge.
Figure 2.
Cell edge area, adapted from [24].
2.5. Cell Selection and Re-Selection
In cellular communication, cell selection plays a critical role in determining the most suitable cell for a User Equipment (UE). The UE initiates a scan of all the E-UTRA Absolute Radio Frequency Channel Numbers (EARFCNs) of the targeted Public Land Mobile Network (PLMN). The UE measures the RSRP from each cell under the highest-scored EARFCN and proceeds to detect key broadcast messages such as the Master Information Block (MIB-NB) and System Information Block 1 (SIB1-NB). The cell with the highest RSRP that meets the predefined thresholds for RSRP and RSRQ as specified in the SIB1-NB, is then selected for camping [8]. However, relying solely on RSRP may not fully reflect the perceived quality of the network from the UE’s perspective. This is because the overall network quality is influenced not only by signal strength but also by other factors such as Signal-to-Interference and Noise Ratio (SINR) and overall interference levels [7].
Once the UE camps on a cell, cell re-selection occurs periodically to ensure that the UE is connected to the cell offering the best possible signal quality [8]. This process involves continuous monitoring and measurement of neighboring cells to identify any that may offer stronger signals than the current serving cell. If such a cell is detected, and it satisfies the relevant criteria, the UE may reselect to this new cell. However, in some cases, particularly with smart meters and other low-power devices used in NB-IoT and LTE-M applications, the need for frequent cell re-selection may be bypassed. As a result, the UE remains camped on the initially selected cell throughout its operational period.
The selection of the appropriate communication technology should therefore be based on the specific requirements of the IoT application, as well as the signal strength characteristics of the deployment environment. For smart grid last-mile communications, where network reliability is paramount, this decision-making process is crucial to ensuring the efficiency and resilience of the system. In smart grids, where last-mile communication plays a critical role in delivering real-time data from distributed smart meters and sensors to the central grid management system, selecting the right technology is crucial. Smart grid communication networks require both reliability and energy efficiency, particularly in rural or challenging environments with limited infrastructure. This article proposes an adaptive approach to selecting between NB-IoT and LTE-M technologies, depending on the specific communication requirements and environmental conditions of smart grid last-mile communication systems. By analyzing factors such as RSRP and SINR, the framework aims to ensure that the most suitable technology is chosen for each deployment scenario, optimizing the performance and scalability of smart grid communications.
3. Channel Modeling Methodology
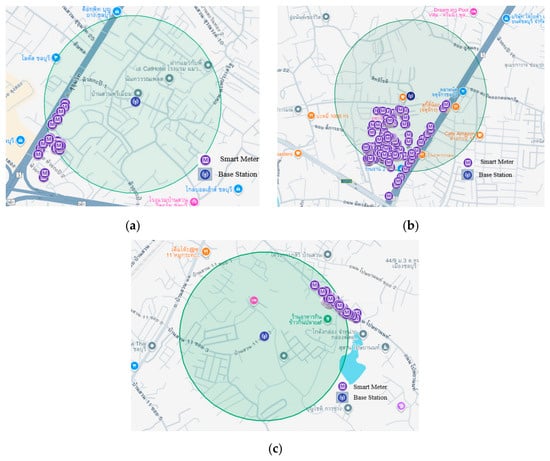
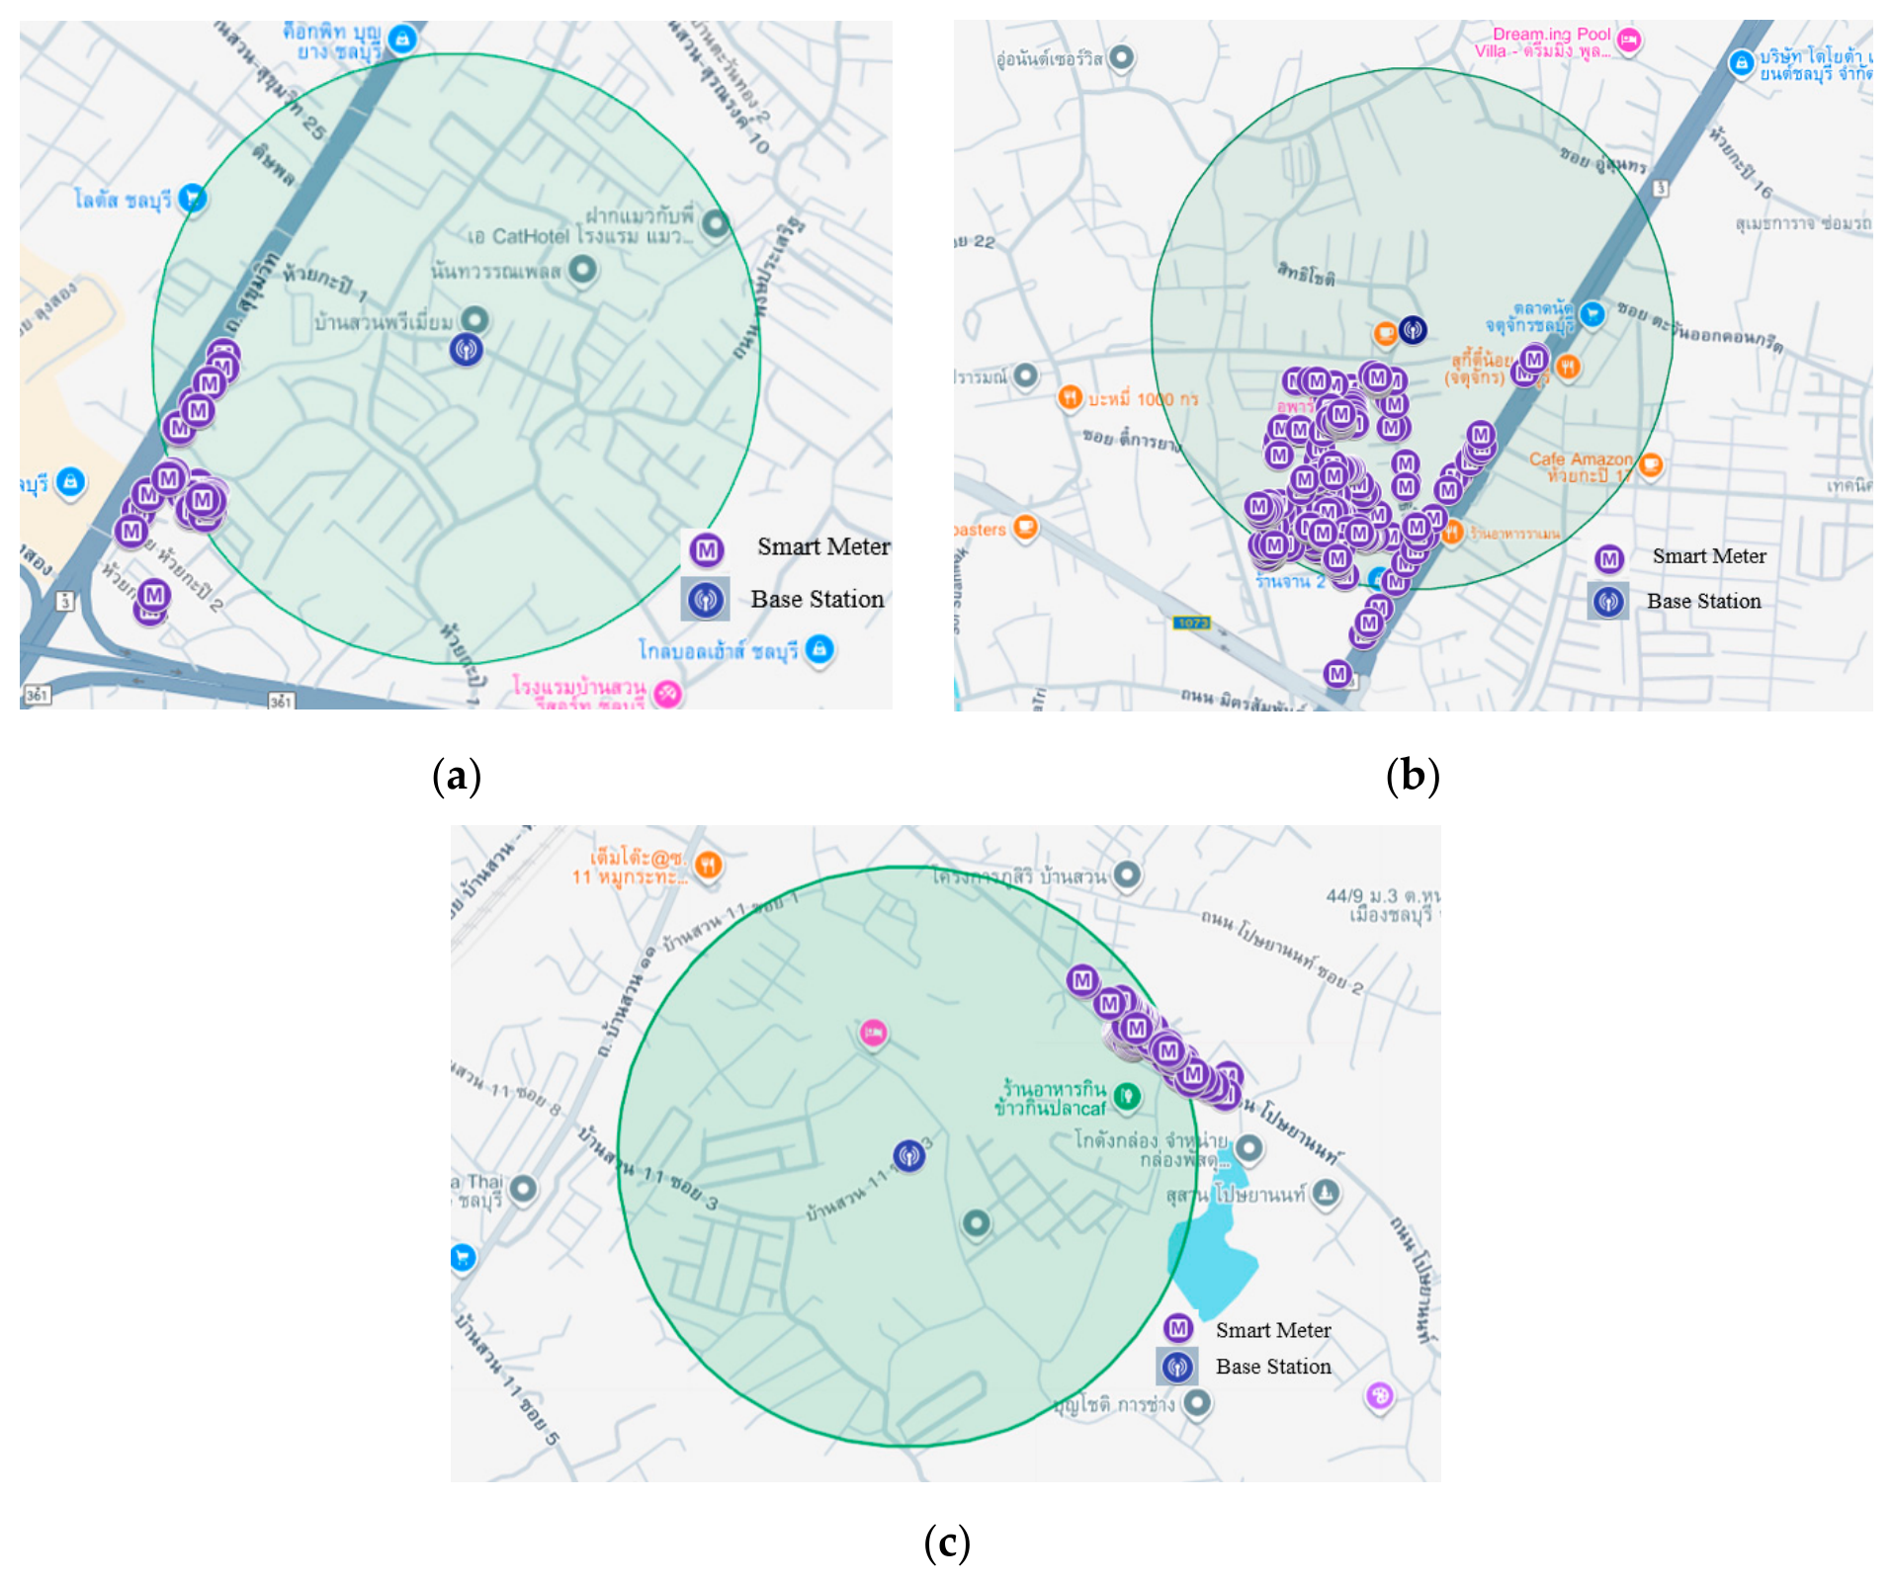
Channel modeling plays a pivotal role in evaluating the performance of CIoT technologies, particularly for smart grid last-mile communications where devices such as smart meters are frequently located near the cell edge, as shown in Figure 3. In these environments, signal degradation and multipath fading significantly influence the reliability of data transmission. To accurately characterize such conditions, statistical fading models were employed and validated against empirical measurements of RSRP collected from field deployments.
Figure 3.
Smart meters are installed in the test area: (a) Area 1; (b) Area 2; (c) Area 3. Adapted from Google Maps (Version 26.10.2) [26].
Three widely adopted fading distributions were selected for this study, including Rayleigh, Rician, and Nakagami fading distributions. Each model provides a distinct perspective on the wireless propagation environment. The Rayleigh distribution represents purely multipath conditions without a dominant line-of-sight (LOS) component, making it appropriate for urban and dense cell-edge scenarios. The Rician distribution incorporates both LOS and scattered multipath components, parameterized by a K-factor, and is suitable for environments with partial LOS conditions. The Nakagami distribution offers greater flexibility through a tunable fading parameter (m), which allows it to approximate both Rayleigh- and Rician-like fading scenarios, making it a general-purpose model for diverse environments.
3.1. Rayleigh Distribution
The Rayleigh distribution is used when there is no dominant LOS component. The probability density function (PDF) of the received signal power can be expressed as:
where is the scale parameter related to the root-mean-square (RMS) of signal strength.
3.2. Rician Distribution
When a direct LOS component coexists with scattered multipath, the Rician distribution is applicable. Its PDF is given by:
where denotes the ratio between the LOS power and the scattered power, is the scale parameter, and is the modified Bessel function of the first kind and order zero.
3.3. Nakagami Distribution
The Nakagami distribution provides the most flexibility by introducing a fading parameter m, which controls the severity of fading. Its PDF is written as:
where m ≥ 0.5 is the fading parameter, is the average received power, and is the Gamma function.
3.4. Empirical Validation Approach
The methodology involved three steps. First, RSRP measurements were collected from smart meters deployed at the cell edge to capture the effects of multipath fading and weak coverage. Second, empirical PDFs were derived from the measurements and compared with theoretical PDFs of Rayleigh, Rician, and Nakagami distributions. Finally, curve fitting and statistical metrics such as Root Mean Square Error (RMSE) were applied to evaluate the goodness of fit of each model.
Preliminary results indicated that the Nakagami distribution exhibited the highest overall agreement with measured RSRP data, confirming the predominance of multipath fading in cell-edge scenarios. The Rayleigh distribution provided reasonable accuracy due to its flexible parameterization, while the Rician distribution performed the poorest because of the limited presence of LOS components in the evaluated environments. Consequently, Nakagami fading was selected as the baseline channel model for subsequent algorithm design, while Rayleigh was retained as a complementary model for generalized fading representation.
3.5. Evaluating Coverage Reliability
In threshold-based decision methods, prior work by [27] demonstrated that the choice of RSRP/SINR thresholds significantly impacts the probability of correct network selection, particularly when RSRP falls below −125 dBm. Their results reinforce the importance of setting an appropriate threshold. Service reliability and performance are at risk when signal quality drops beneath the minimum “Fair” level; thus, providers should maintain at least this standard [28]. Based on collaborative testing with Thai operators, signal-level categories were established as shown in Table 2. Using these categories, the present study applies RSRP-based thresholds—specifically −105 dBm for “Fair”—to select the network capable of delivering reliable service under the given conditions.
Table 2.
CIoT RSRP level.
While the probability density function (PDF) describes the likelihood of observing a specific signal level, the cumulative distribution function (CDF) provides a more practical metric for evaluating coverage reliability. The CDF of the RSRP represents the probability that the received signal falls below or equal to a specified threshold, thereby enabling quantitative assessment of coverage margins in smart grid last-mile deployments.
The CDF provides a direct way to interpret field measurements:
Where F(α) is the probability of receiving RSRP:
- A higher value of F(−105 dBm) indicates that a larger proportion of observed signals fall below the minimum acceptable level, reflecting poor coverage and the need for a technology with stronger link budget, such as NB-IoT.
- Conversely, a lower value of F(−105 dBm) implies that the majority of signals remain above the threshold, allowing the use of LTE-M for higher throughput and lower latency.
This CDF-based formulation is particularly useful for smart meter deployments, as it converts raw signal measurements into a probabilistic indicator of service reliability. Moreover, it aligns with the adaptive selection mechanism described in Section 4, where the CDF at −105 dBm serves as the basis for choosing between NB-IoT and LTE-M technologies.
4. Adaptive Algorithm for CIoT Network Selection
The coverage probability and battery life trade-offs in LTE-M and NB-IoT in realistic MTC deployments [29] illustrate that NB-IoT retains performance only when large portions of signal samples are below established coupling loss or RSRP thresholds. This aligns with our decision rule using CDF at −105 dBm to switch the CIoT network based on weak coverage probability.
Building on the channel modeling framework described in the previous section, this work proposes an adaptive algorithm for selecting between NB-IoT and LTE-M technologies in smart grid last-mile communications. The algorithm employs the cumulative distribution function (CDF) of the RSRP to quantify the probability that the received signal strength falls below a predefined threshold. For this study, the threshold was set to −105 dBm, a value widely recognized in 3GPP and field trials as the boundary between acceptable and weak coverage conditions for CIoT devices. Formally, the CDF of RSRP can be expressed as:
where F(α) is the probability that the RSRP is received, is less than or equal to the threshold α, and is the probability density function (PDF) derived from the validated channel model. In this study, [15].
- RSRP Measurement: Each smart meter periodically records RSRP values from the serving cell.
- Channel Modeling: The measured RSRP values are mapped to a statistical fading model (Rayleigh, Rician and Nakagami) based on the empirical validation presented in Section 3.
- CDF Evaluation: The probability F(−105 dBm) is computed. A high probability indicates that the signal is likely to remain below the threshold, reflecting poor coverage.
- Technology Selection Rule: The decision rule can be summarized as
By explicitly anchoring the decision framework to the −105 dBm threshold, the Algorithm 1 ensures alignment with practical deployment criteria while maintaining adaptability to site-specific fading environments. This threshold-based strategy reduces susceptibility to short term fluctuations and aligns network selection with long-term reliability requirements, particularly in cell-edge smart grid deployments.
| Algorithm 1: Adaptive CIoT Network Selection using CDF of RSRP at −105 dBm |
| Inputs: // RSRP sample (dBm) for // RSRP fair threshold Outputs: //selected network for Procedure: i = 1 While i ≤ N do // 1 to N smart meters if < then = NB-IoT else = LTE-M end if i = i +1 End while return // Repeat every 24 h |
In practical deployments, the proposed selection rule is implemented as a probability-based decision derived from the received signal strength distribution at the cell edge. For each smart meter (or for a target group of edge-of-cell meters), a measurement window of RSRP samples is collected. The decision statistic is the cumulative probability that the measured RSRP falls below the minimum coverage boundary .
Alternatively, (4) can be estimated from the fitted fading-model CDF (Rayleigh, Nakagami, or Rician) when a compact parametric representation is preferred for planning and analysis. The network selection is then determined by comparing against a switching probability threshold, the meter is assigned to NB-IoT to benefit from deeper coverage. LTE-M is selected to retain higher throughput and lower latency. To ensure stable operation and prevent oscillatory switching due to short-term fading, the practical implementation may include a dwell time (or hysteresis) after any CIoT network re-selection, during which the selected CIoT network is held constant before re-evaluation. This mechanism reduces ping-pong behavior and limits unnecessary signaling overhead, which is particularly relevant at the cell edge where RSRP fluctuations are common. Overall, the proposed algorithm can be integrated into AMI operations by periodically updating from logged RSRP measurements and applying the above decision rule to select LTE-M or NB-IoT according to the observed weak coverage probability.
5. Measurement Setup
As illustrated in Figure 3 (adapted from Google Maps [26]), the cell-edge region is defined by a radius of 500 m from the base station. Over a six-month observation period, the RSRP was measured at the locations of 30 smart meters situated along the cell edge. The measured RSRP values consistently fluctuated around the predetermined threshold of −105 dBm, which is considered indicative of moderate signal strength levels [15].
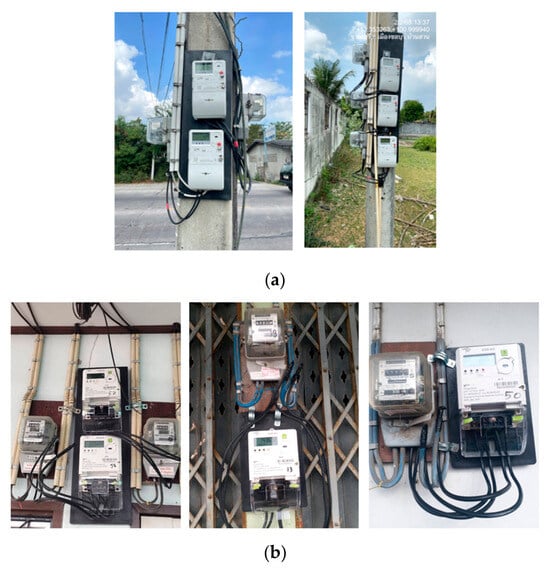
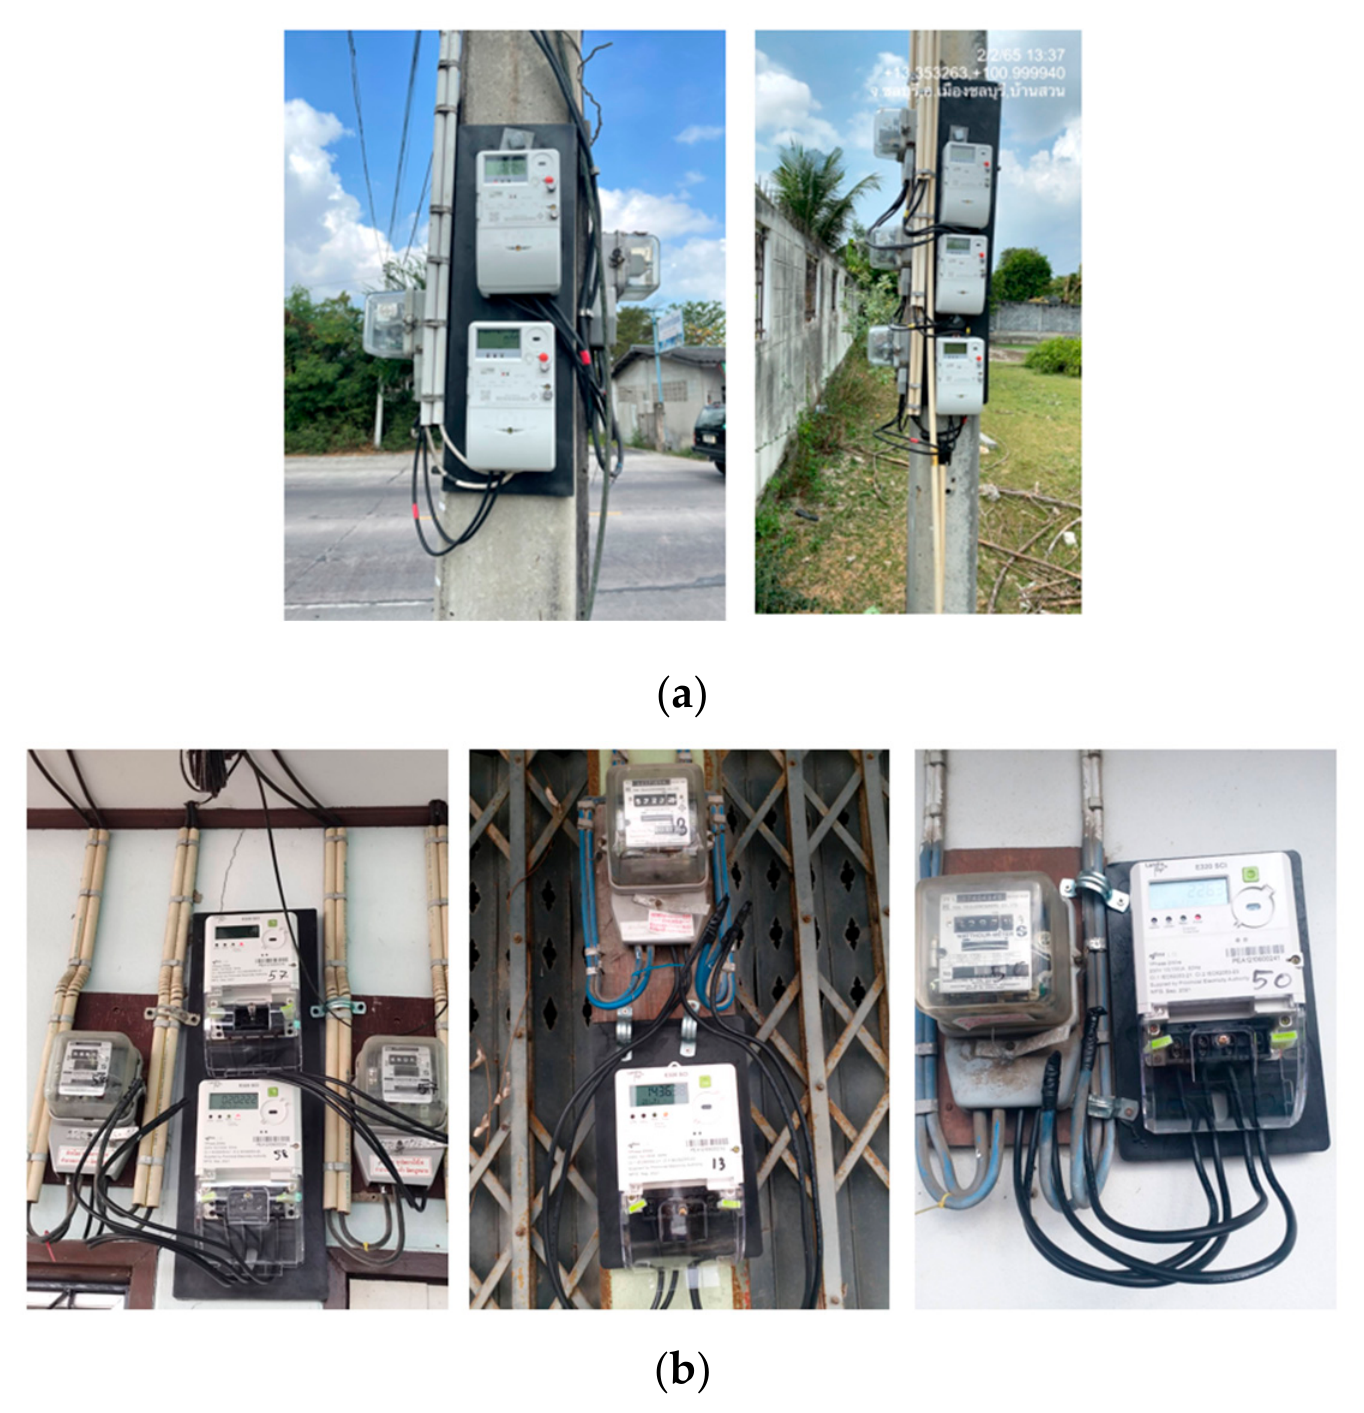
In this study, smart meters were deployed in Chonburi province, Thailand, as shown in Figure 4. In the designated testing area, a telecommunications base station supporting both LTE-M and NB-IoT technologies operates within the 900 MHz frequency band.
Figure 4.
Smart meter installation in the field: (a) smart meter installed on an electric pole; (b) smart meter installed at the customer’s premises in front of their house.
6. Experimental Result and Performance Analysis
To evaluate the proposed algorithm in area 1, the signal measurements were periodically collected over a six-month measurement period from 30 smart meters deployed at the cell edge in a rural test area. Each smart meter was equipped with an LTE-M communication module and configured to log RSRP values over a six-month measurement period. The LTE-M measurements were analyzed to determine the likelihood that a smart meter would experience insufficient coverage at the cell edge. The threshold of −105 dBm was used as the boundary below which LTE-M communication is considered unreliable, prompting a switchover to NB-IoT, which is better suited for deep coverage conditions.
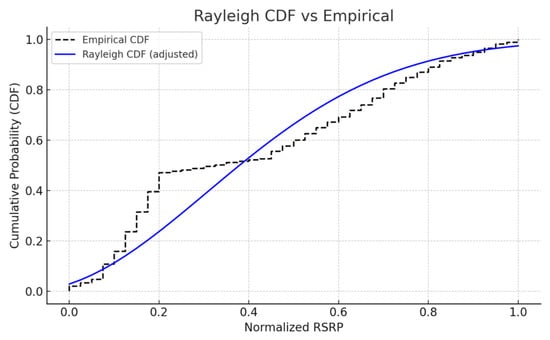
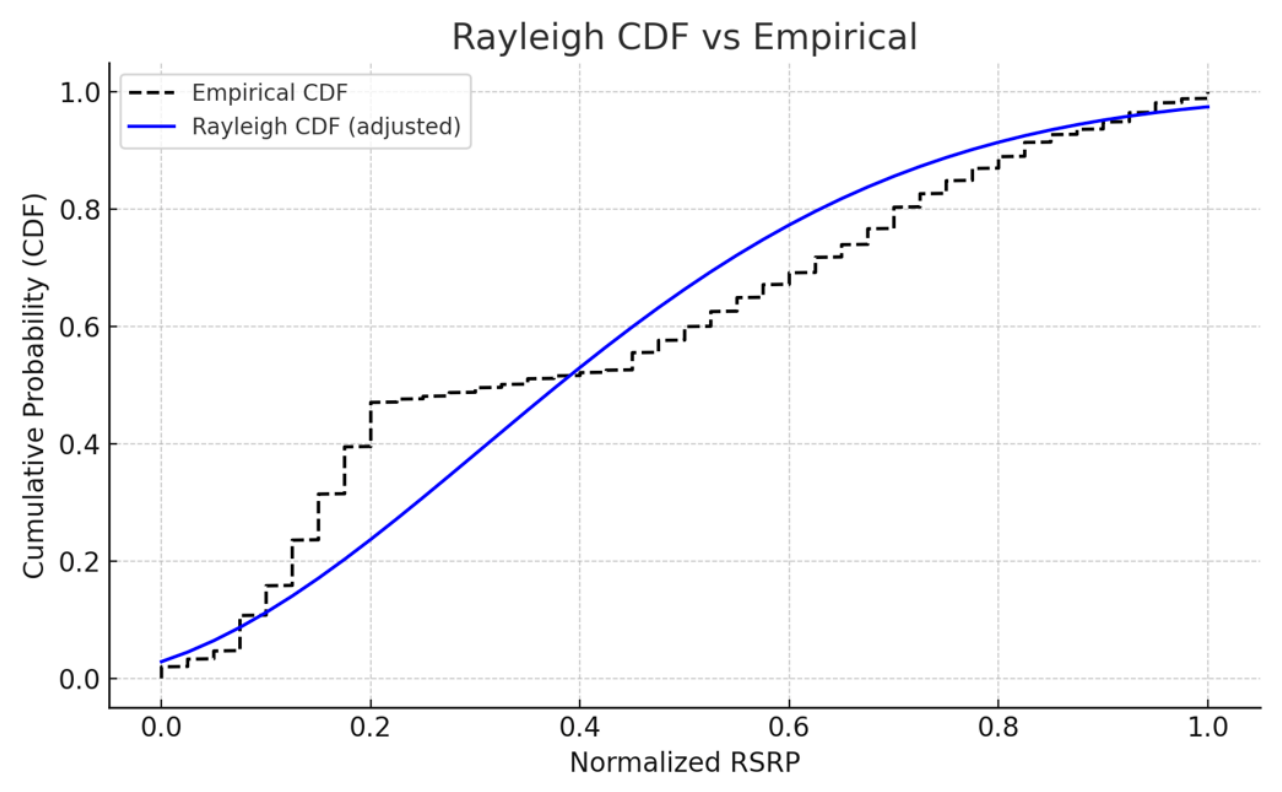
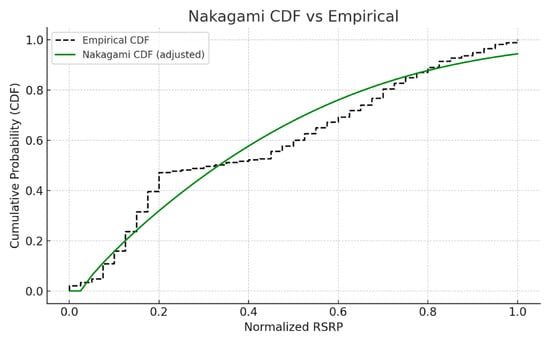
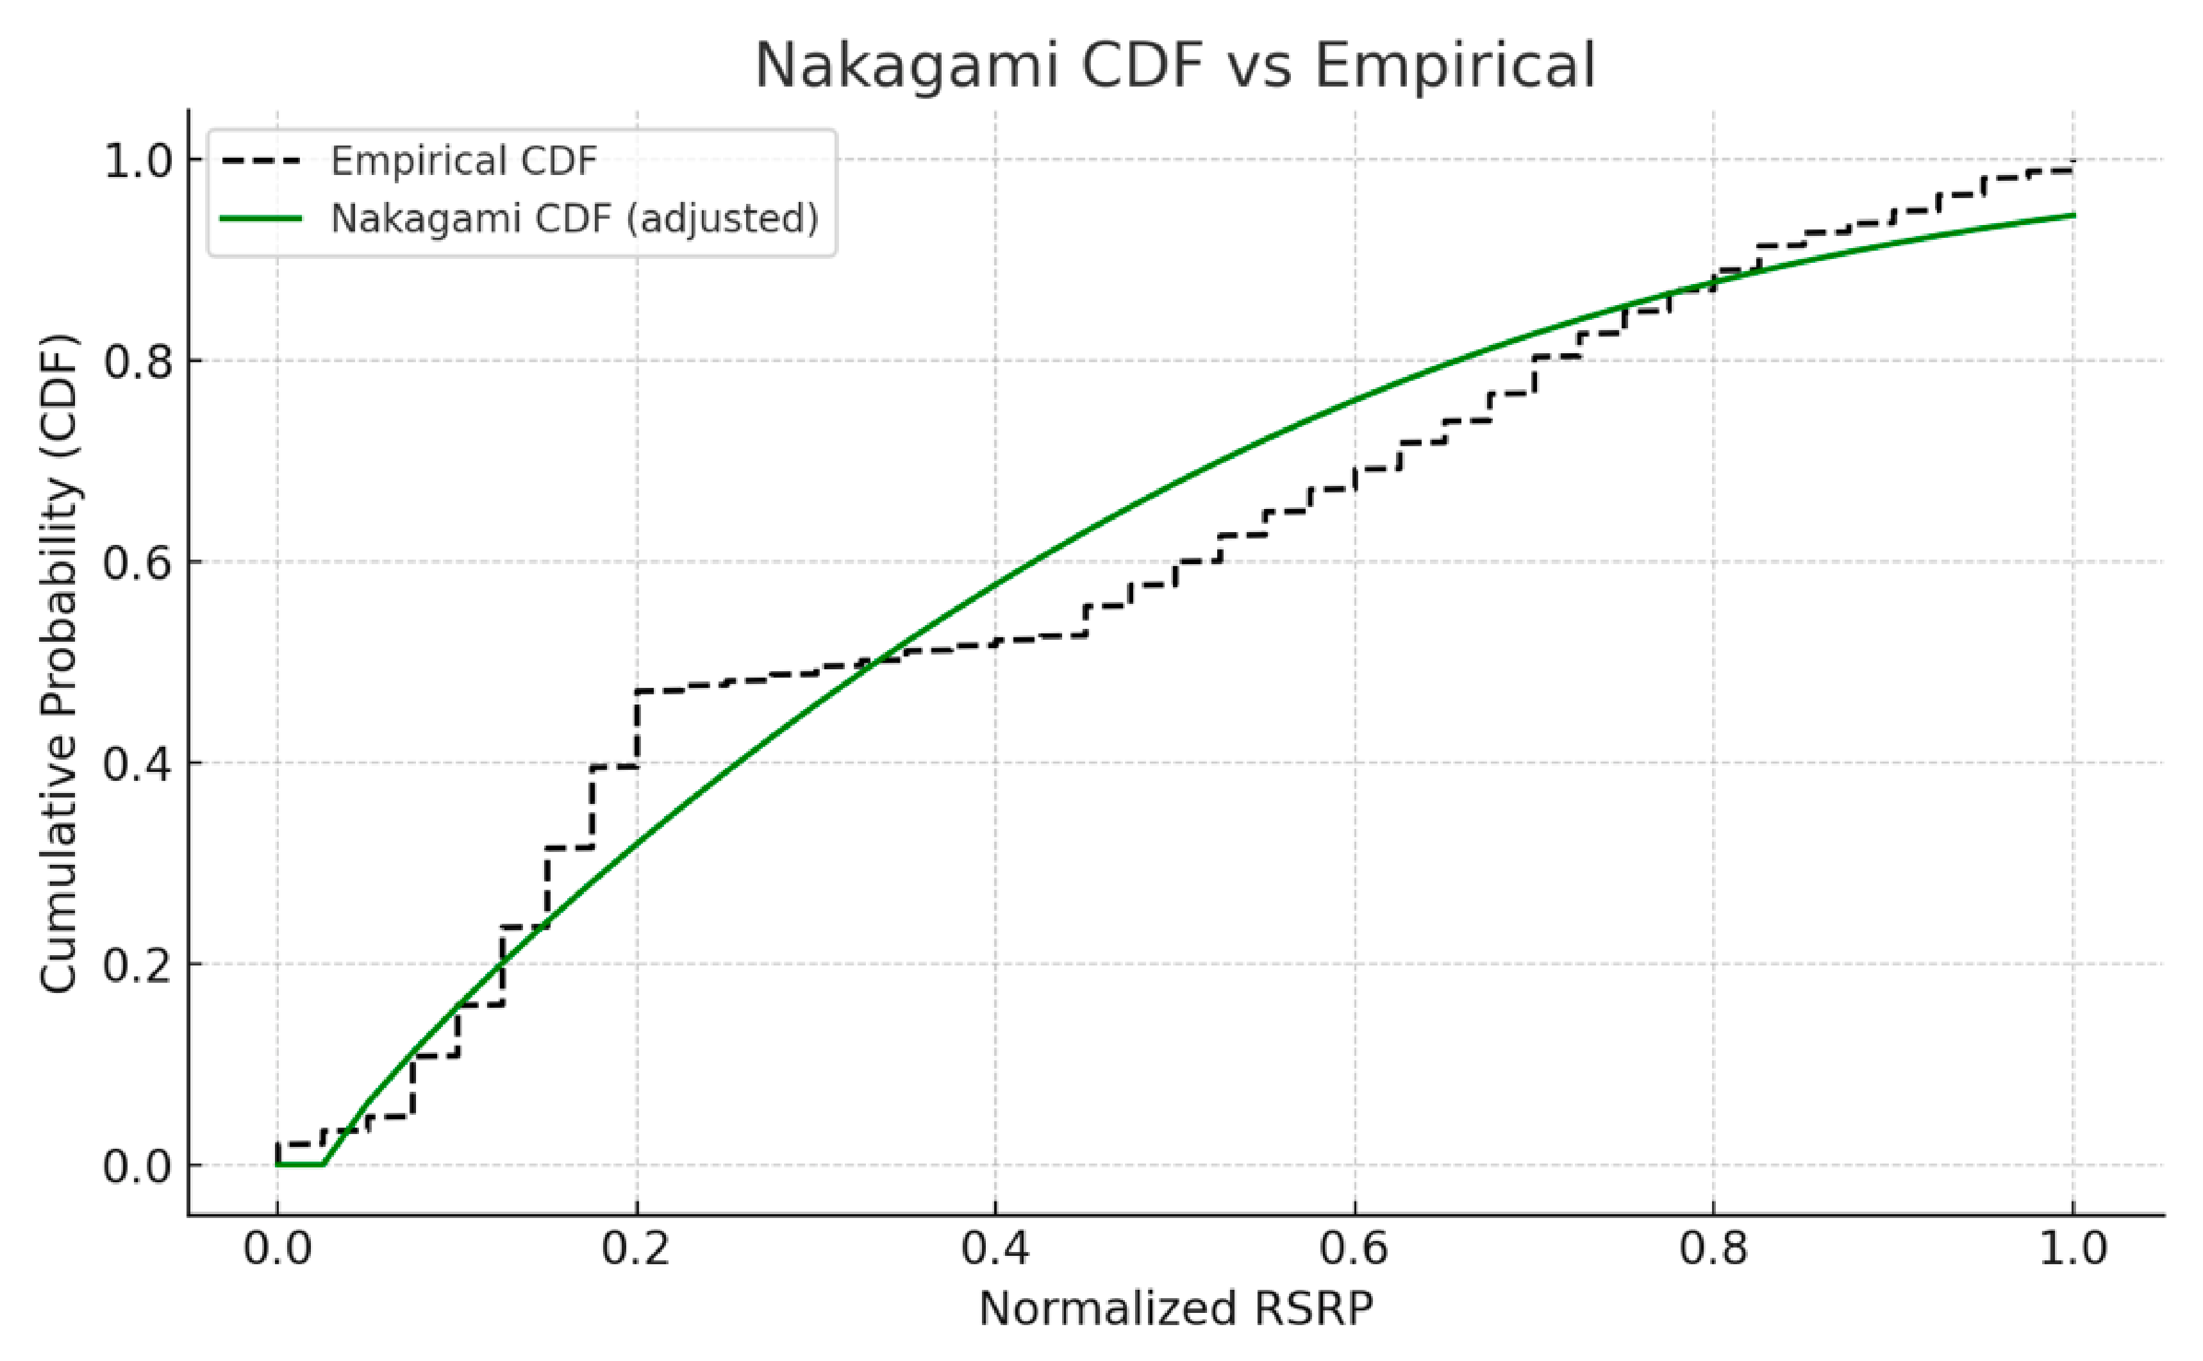
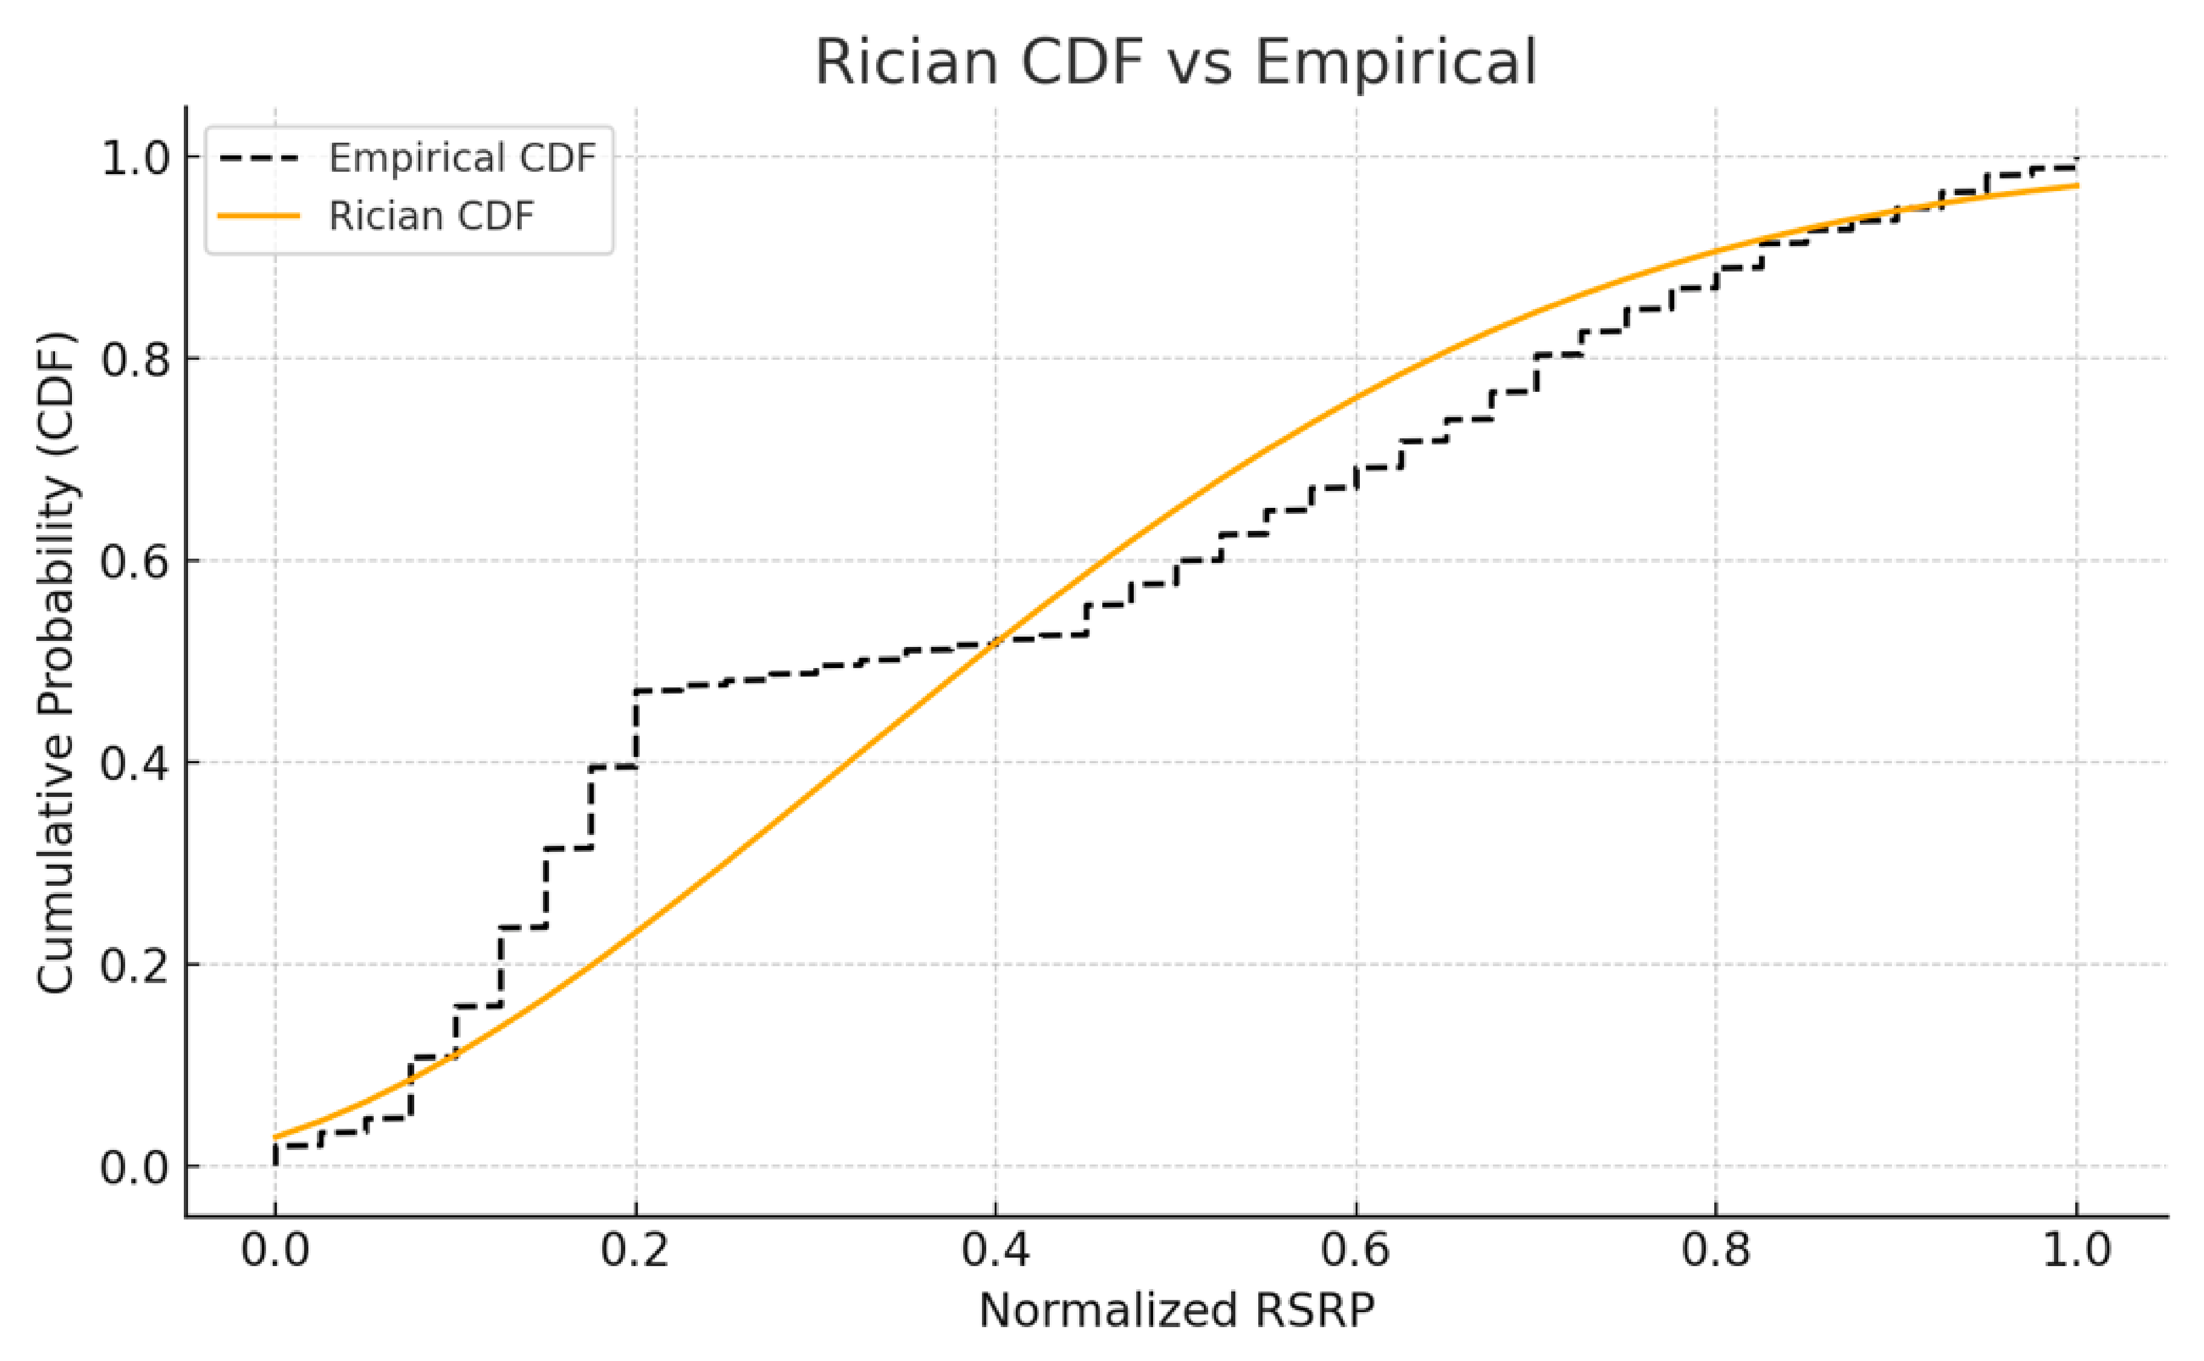
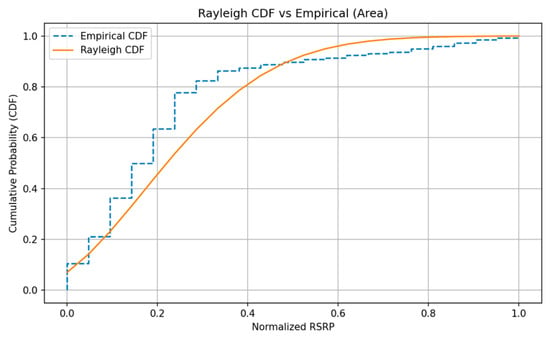
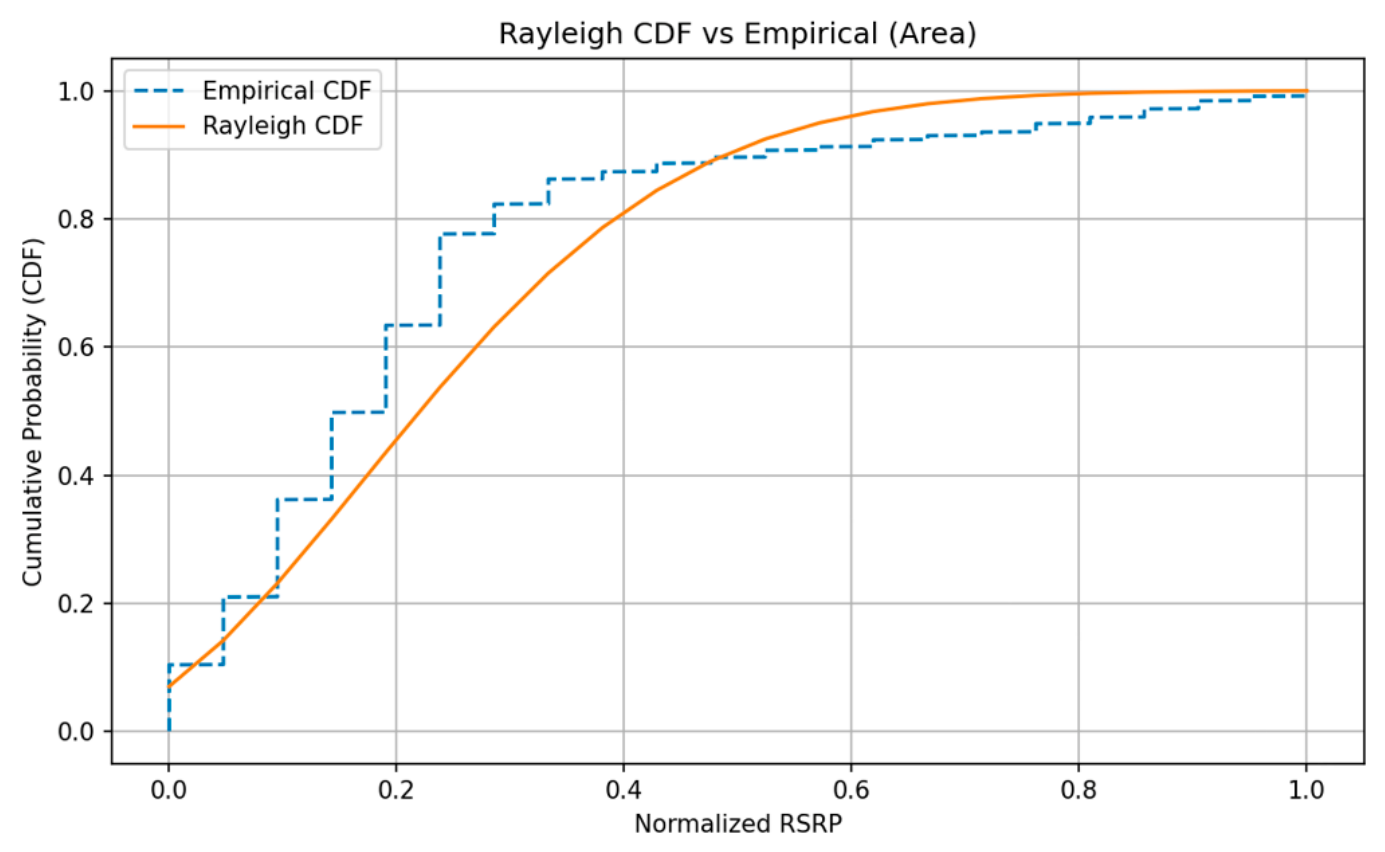
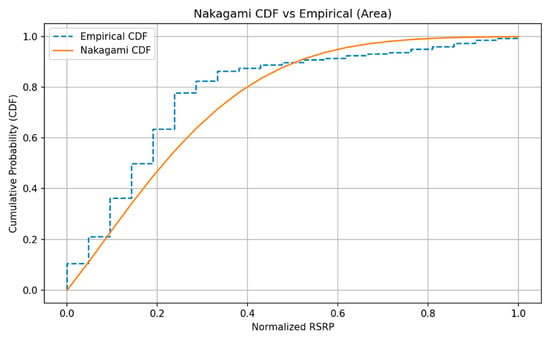
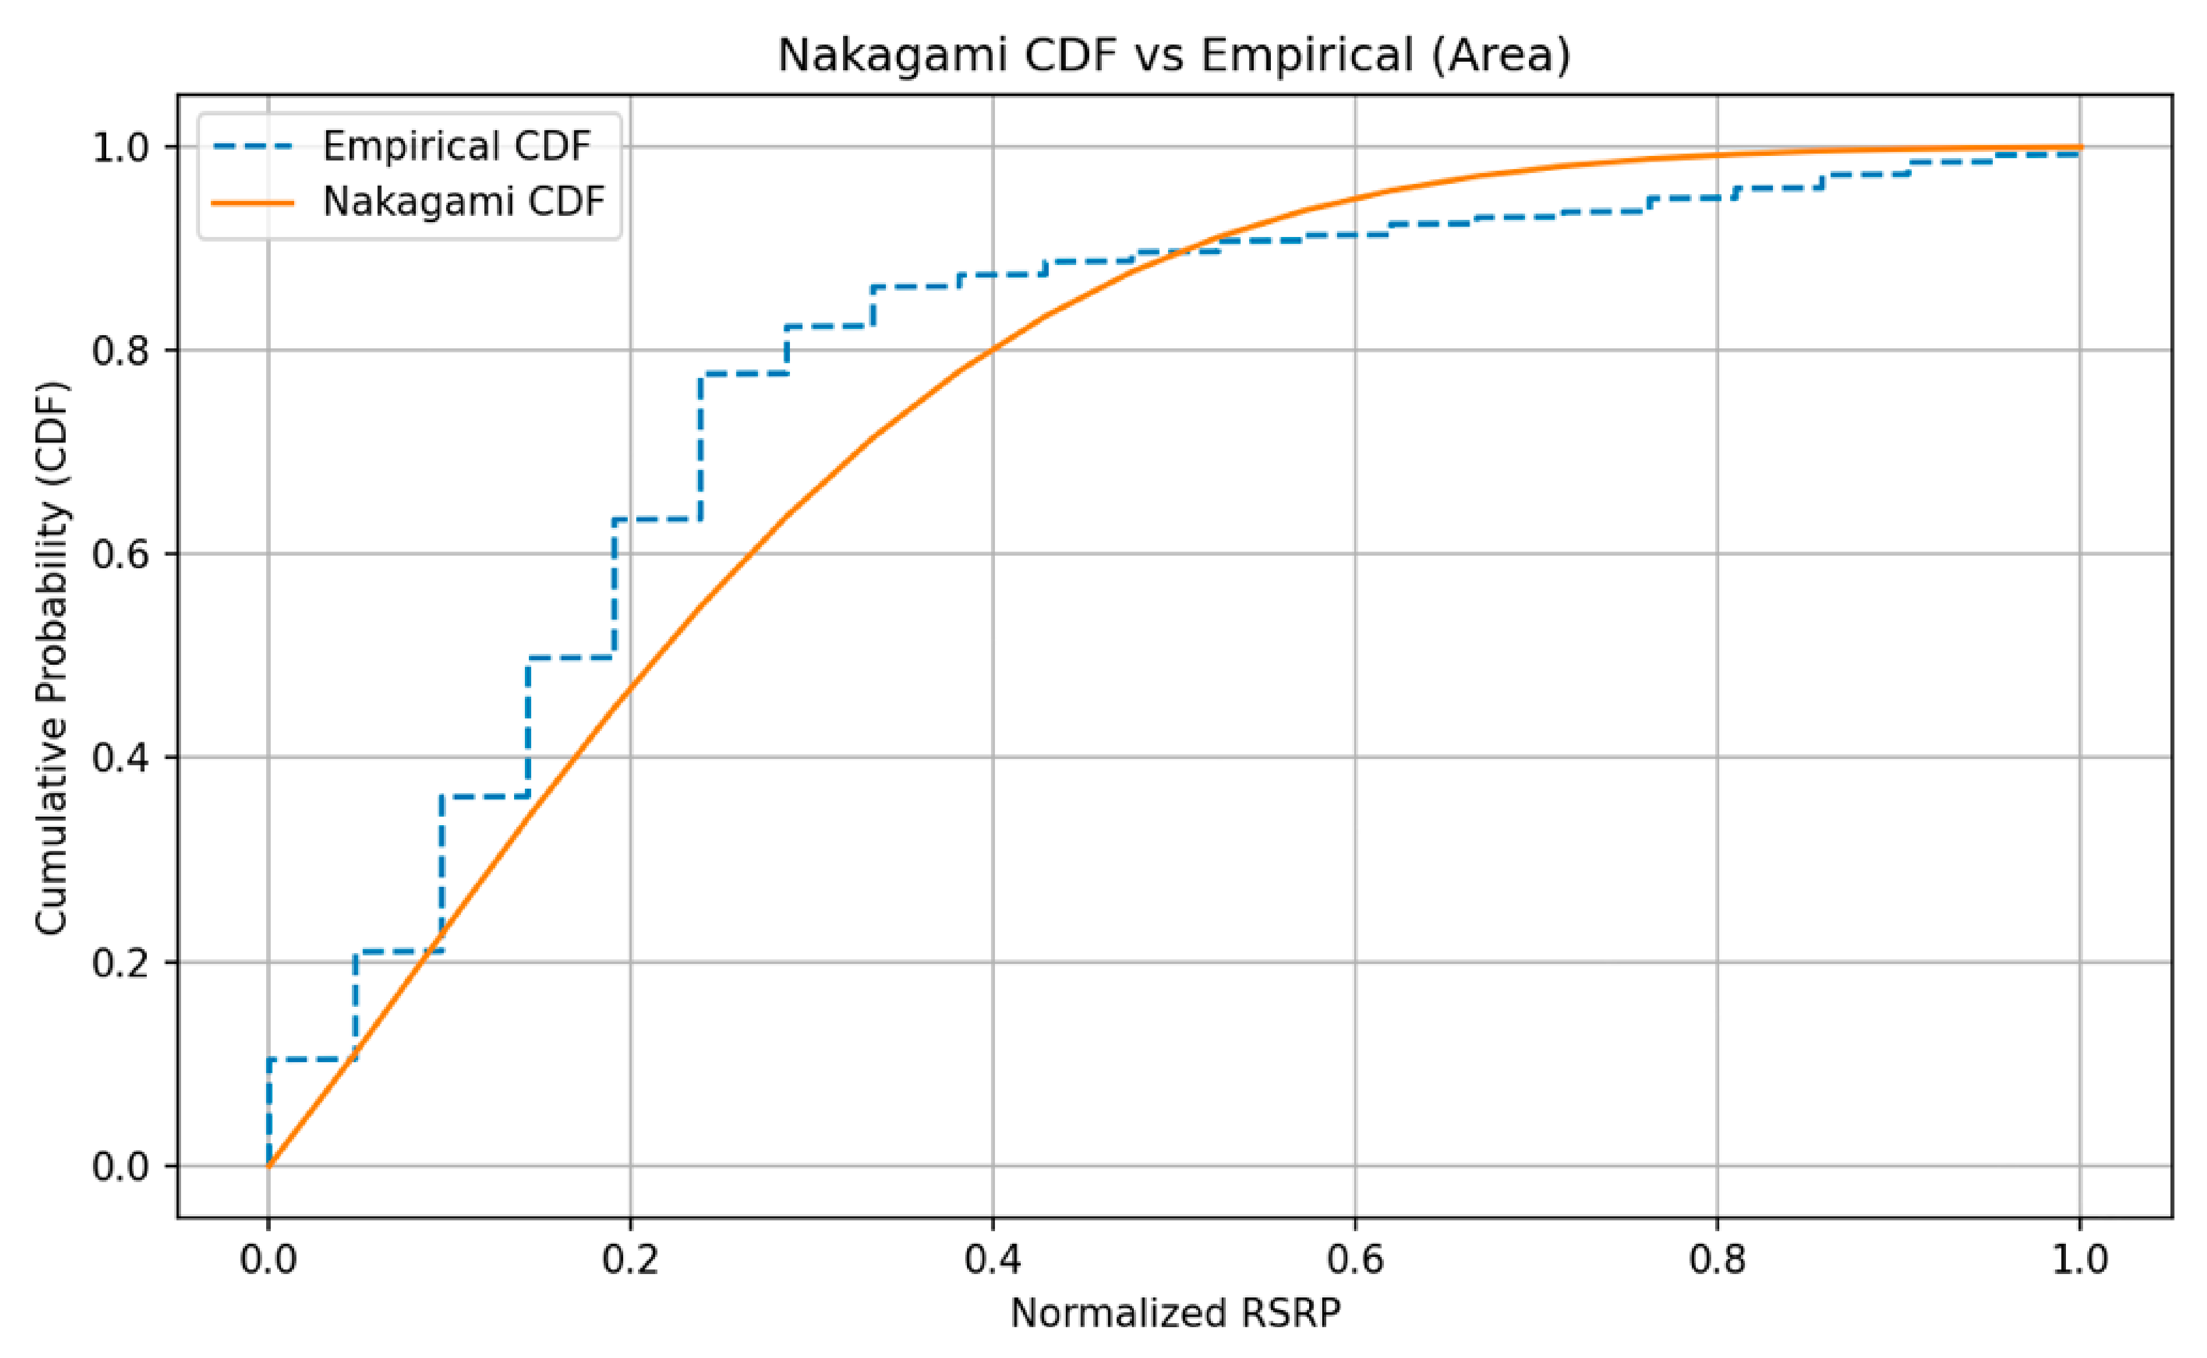
To model the signal behavior statistically, the cumulative distribution function (CDF) of RSRP was calculated using three commonly applied wireless fading models: Rayleigh, Rician, and Nakagami. The normalized RSRP data were used to fit each model, and the resulting CDF values were evaluated at the −105 dBm threshold. Figure 5, Figure 6 and Figure 7 illustrate the comparison between the empirical CDF and each theoretical distribution. The x-axis in Figure 5, Figure 6 and Figure 7 corresponds to the min–max normalized RSRP samples pooled from all smart meters located at the edge of cell.
Figure 5.
Empirical vs. Rayleigh CDF.
Figure 6.
Empirical vs. Nakagami CDF.
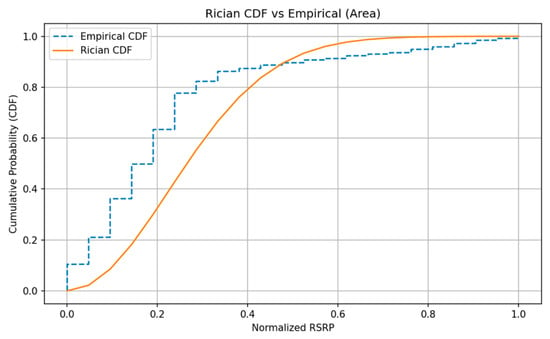
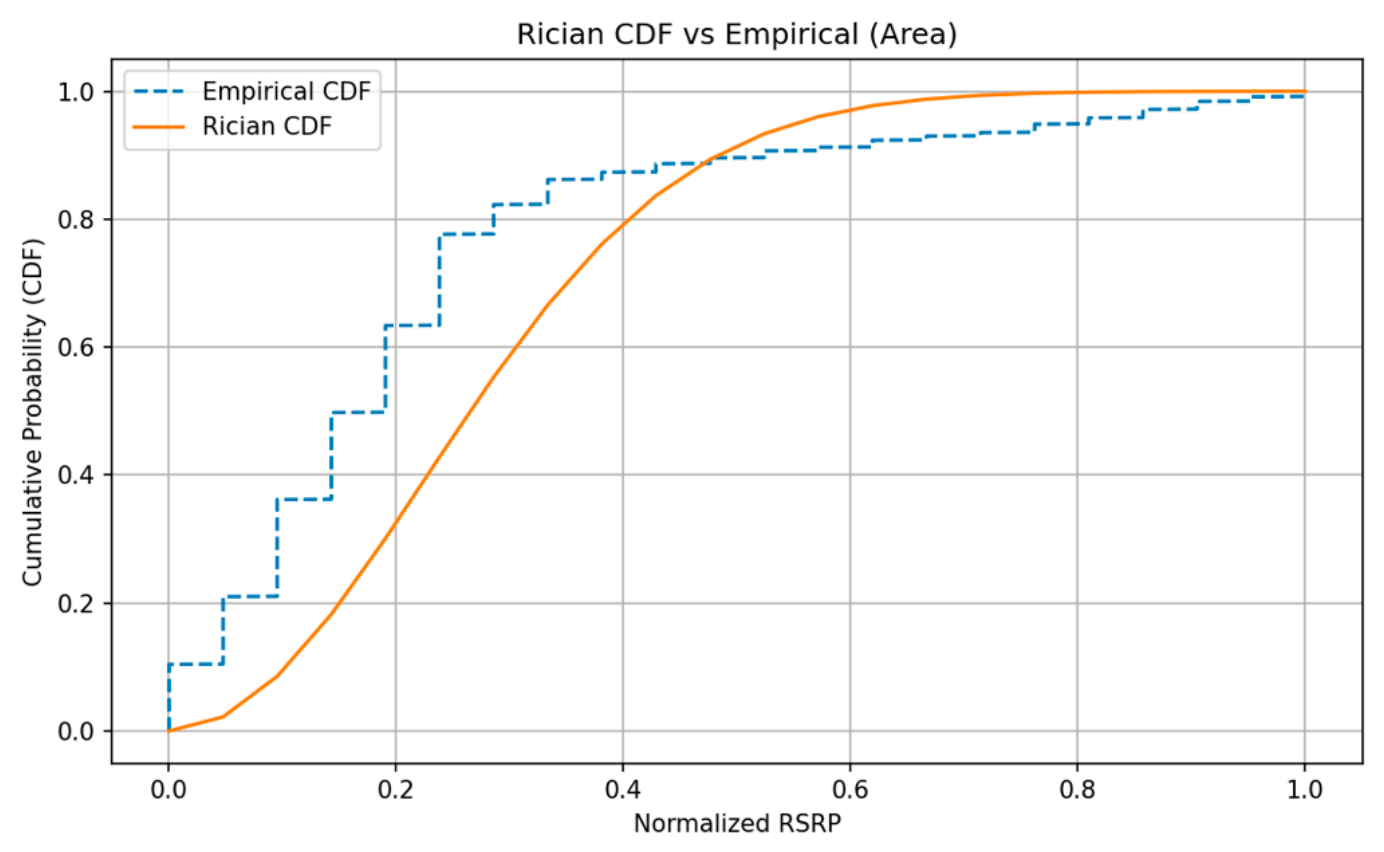
Figure 7.
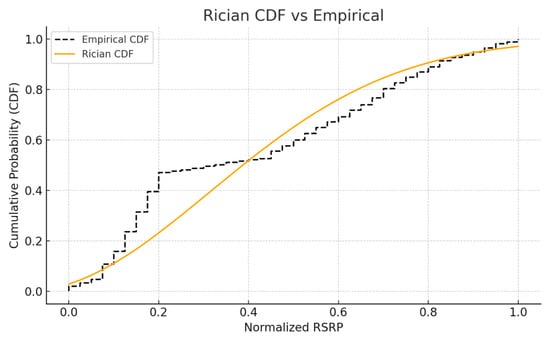
Empirical vs. Rician CDF.
The empirical analysis indicated that 10.76% of the measured RSRP values were below the −105 dBm threshold. The theoretical CDF values computed at this threshold were 8.75% for Rayleigh, 11.15% for Nakagami, and 8.61% for Rician. These results represent the estimated probabilities that any given smart meter in the area would require switching from LTE-M to NB-IoT. To interpret these percentages in practical terms, the estimated number of smart meters (out of 30 total) requiring NB-IoT fallback can be derived by multiplying the CDF values by the total number of meters. Table 3 summarizes this comparison alongside the actual field results, where 14 smart meters were empirically determined to require NB-IoT due to poor LTE-M signal conditions.
Table 3.
CDF (%) and estimated number of smart meters requiring switch at RSRP < −105 dBm.
To further evaluate the accuracy of each statistical model in approximating the empirical distribution, the root mean squared error (RMSE) between the empirical CDF and each theoretical model was calculated across the full range of normalized RSRP values. Table 4 presents the RMSE values for each distribution.
Table 4.
RMSE between empirical and theoretical CDFs.
These findings indicate that the Nakagami model provides the most accurate estimation of the number of smart meters requiring fallback, with only one device difference from the actual field observation (14 smart meters) and the lowest RMSE. Although the Rayleigh and Rician models yield comparable predictions, their higher RMSE and underestimation of fallback device count make them less suitable for threshold-based switching analysis in this particular area.
To further validate the proposed adaptive algorithm, a second experimental area was evaluated. In this setting, 35 smart meters were deployed at the cell edge, each equipped with LTE-M modules and configured to record 48 RSRP samples. The empirical threshold for determining insufficient LTE-M coverage was set at −105 dBm. Field observations revealed that 8 smart meters required fallback to NB-IoT due to consistently weak signal strength.
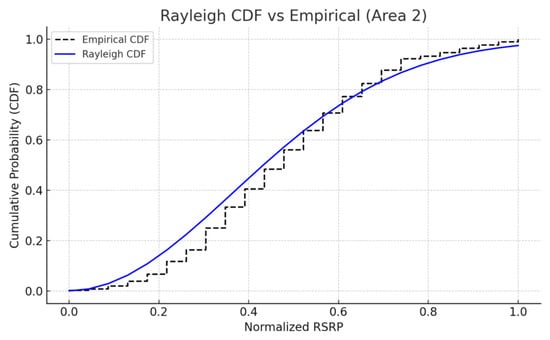
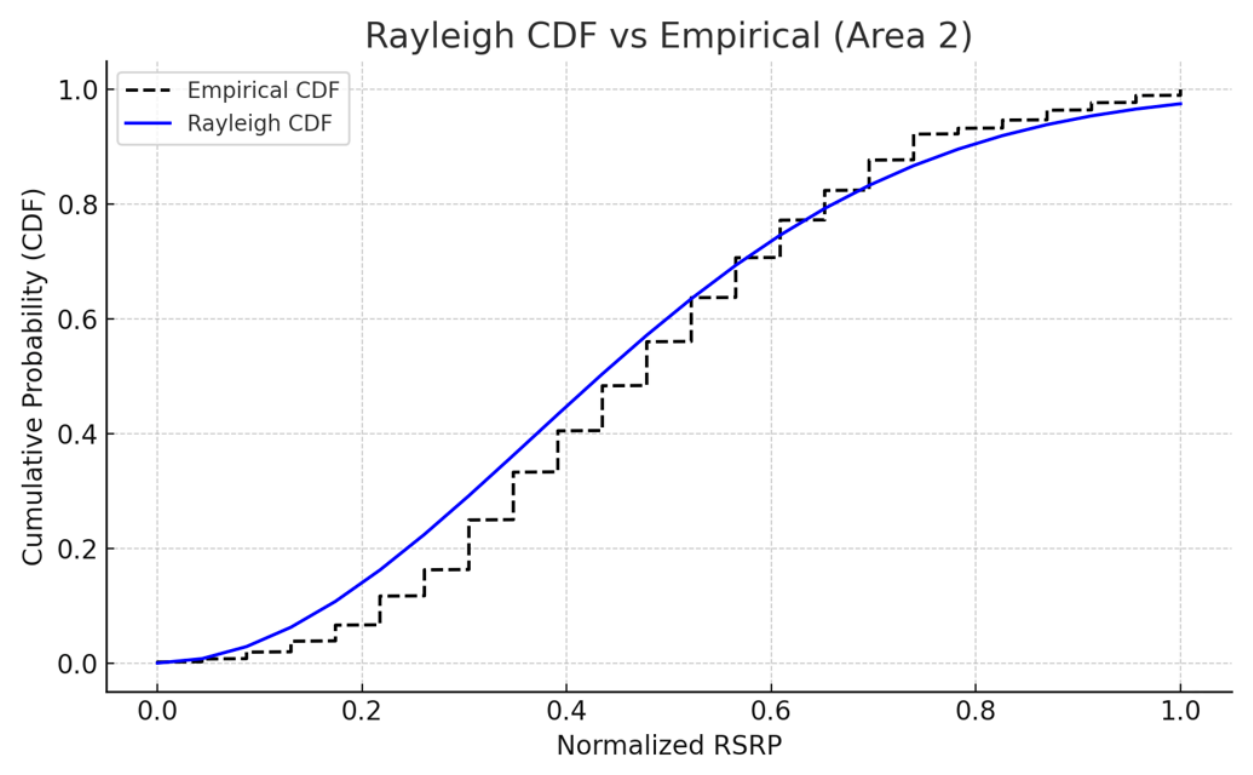
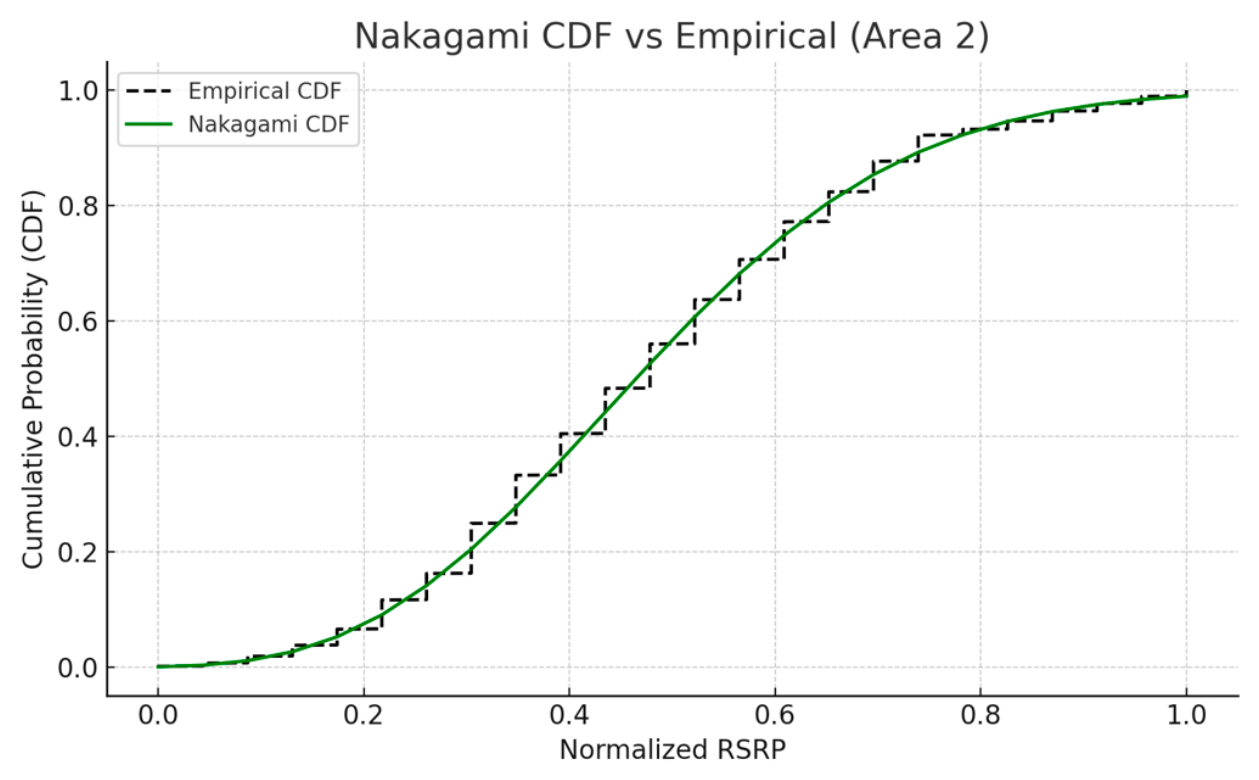
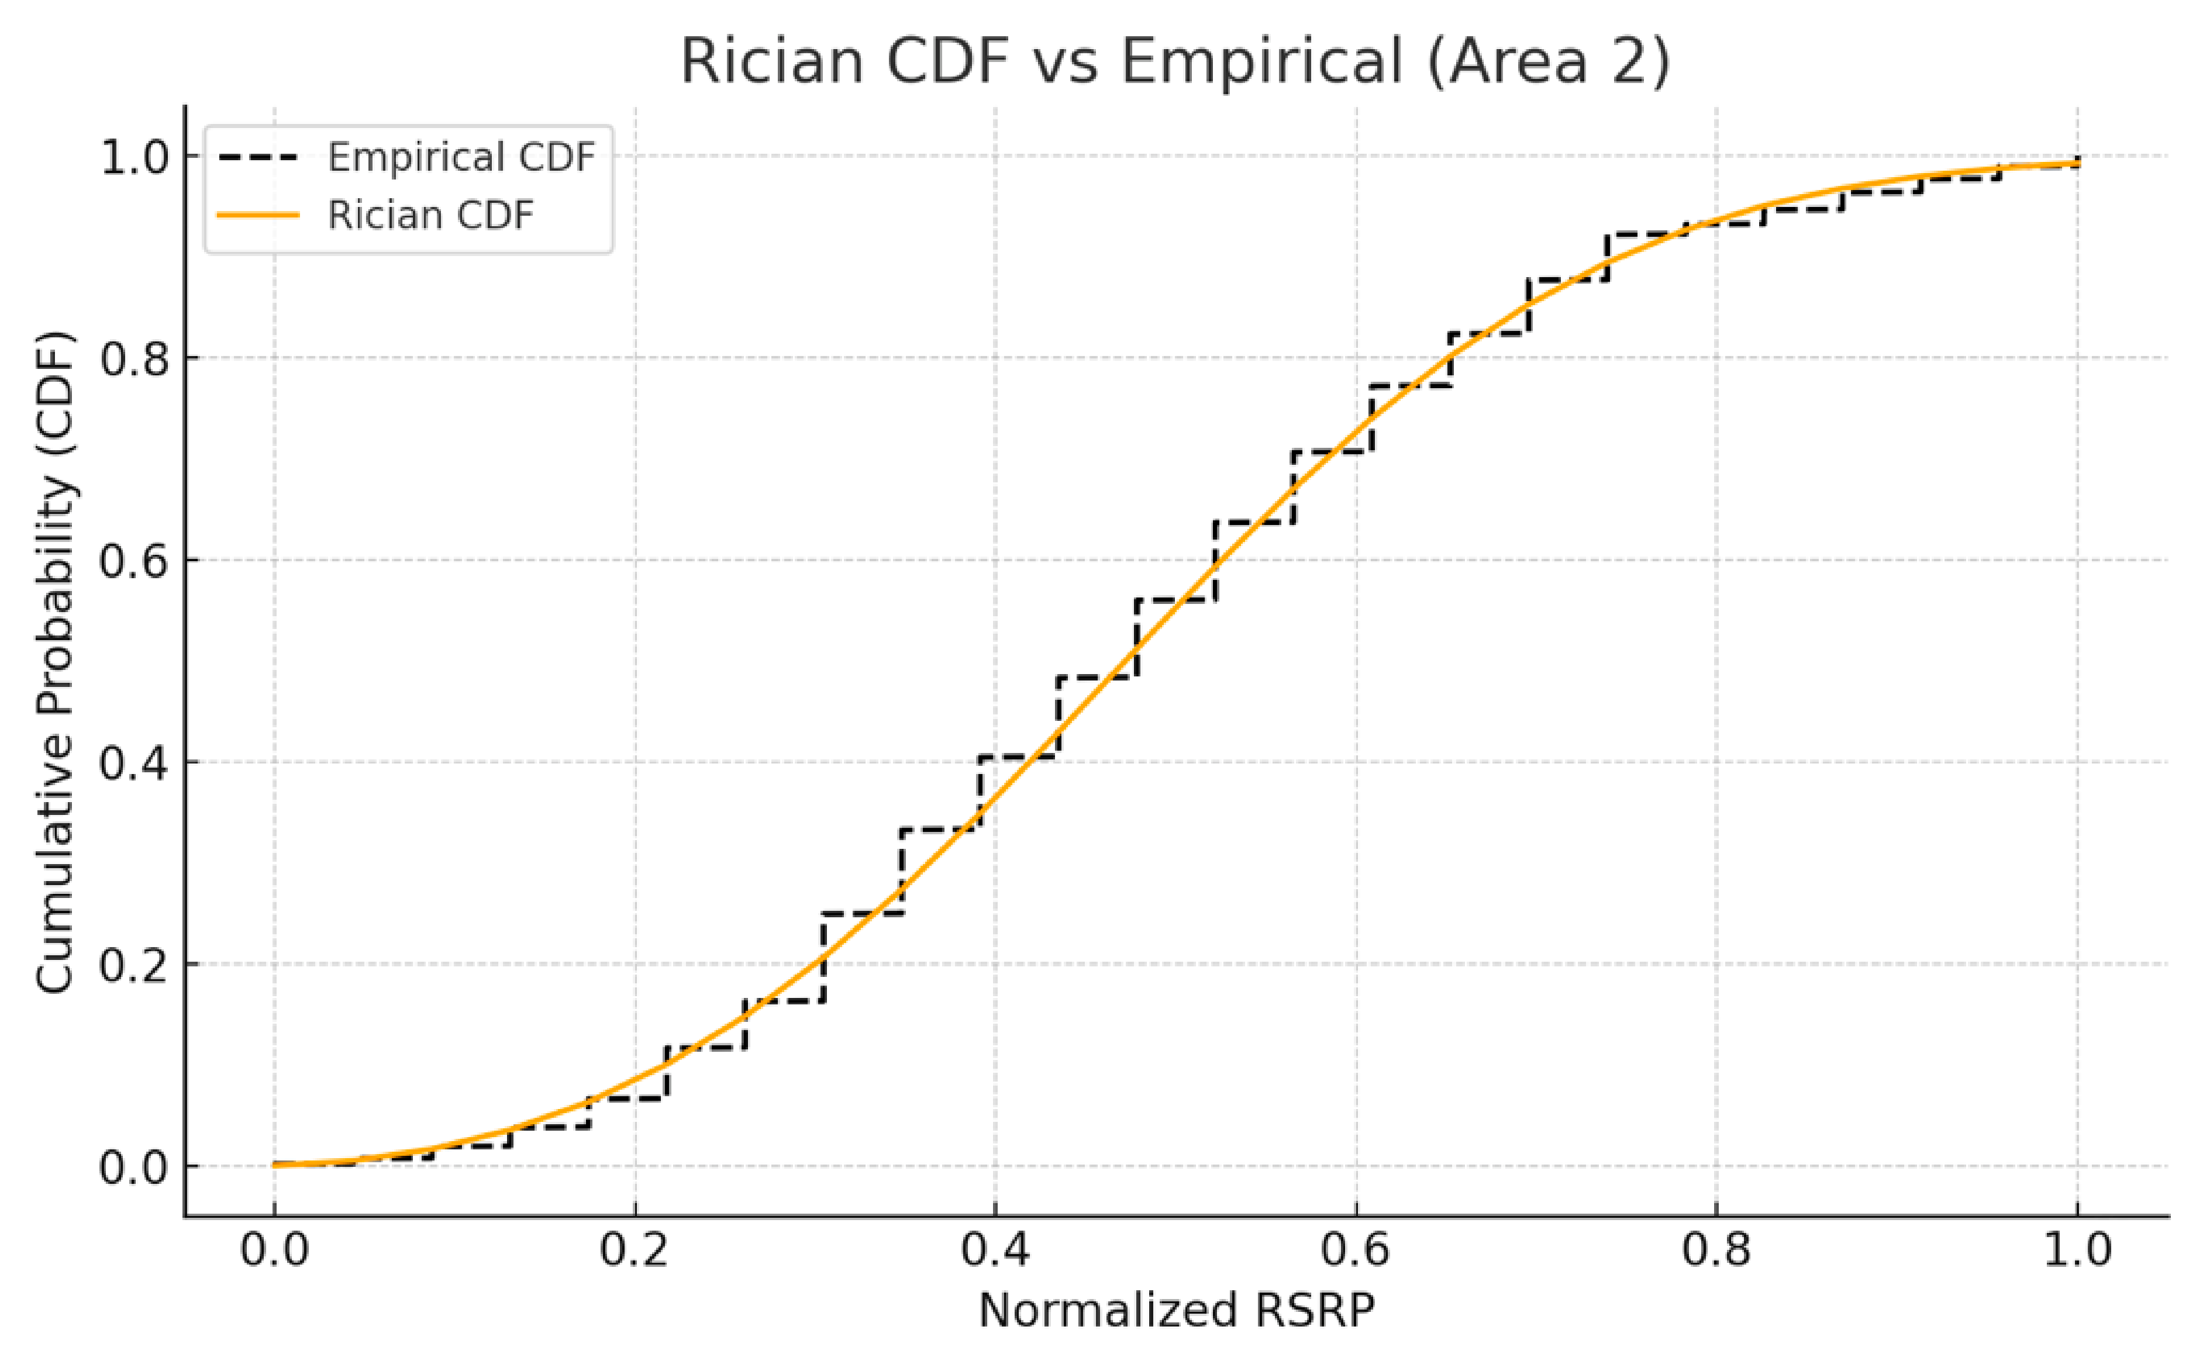
Following the methodology established in Area 1, the cumulative distribution function (CDF) of RSRP was derived from the empirical data and fitted to three fading models: Rayleigh, Nakagami, and Rician. These models were used to estimate the probability that RSRP values would fall below the −105 dBm threshold. Figure 8, Figure 9 and Figure 10 illustrate the CDF comparisons between the empirical measurements and each theoretical model.
Figure 8.
Empirical vs. Rayleigh CDF (Area 2).
Figure 9.
Empirical vs. Nakagami CDF (Area 2).
Figure 10.
Empirical vs. Rician CDF (Area 2).
The estimated probability of RSRP being below −105 dBm, along with the corresponding number of smart meters expected to require fallback to NB-IoT, are summarized in Table 5. This comparison is presented alongside the actual field results, where eight smart meters were empirically determined to require NB-IoT due to poor LTE-M signal conditions.
Table 5.
CDF (%) and estimated number of smart meters requiring switch at RSRP < −105 dBm (Area 2).
To evaluate the model accuracy across the full distribution, the RMSE was calculated between the empirical CDF and each fitted model, as shown in Table 6.
Table 6.
RMSE between empirical and theoretical CDFs (Area 2).
The results indicate that the Nakagami model provides the most accurate fit for the empirical data in Area 2, achieving the lowest RMSE of 0.020. The Rician model also shows good agreement with the field data, with a slightly higher RMSE of 0.021. The Rayleigh model, while estimating the fallback count relatively accurately, exhibits a higher RMSE (0.055), indicating less fidelity in capturing the full empirical distribution. These findings reinforce the utility of using flexible channel modeling in adaptive network selection. While Rayleigh may capture the general tendency toward coverage degradation, Nakagami offers a statistically robust fit, making it more suitable for probabilistic thresholding in last-mile smart grid deployments.
To extend the external validity of the proposed algorithm, a third experimental area was investigated. In this setting, 38 smart meters were deployed at the cell edge, each configured with LTE-M modules and set to collect RSRP. The same decision threshold of −105 dBm was used to indicate insufficient LTE-M coverage and trigger a fallback to NB-IoT. Field operations in Area 3 observed 24/38 devices switching to NB-IoT due to persistently weak LTE-M signal strength. Following the procedure in Areas 1 and 2, the empirical cumulative distribution function (CDF) of RSRP was derived and compared with three fading models. Figure 11, Figure 12 and Figure 13 illustrate the comparison between the empirical CDF and each theoretical distribution.
Figure 11.
Empirical vs. Rayleigh CDF (Area 3).
Figure 12.
Empirical vs. Nakagami CDF (Area 3).
Figure 13.
Empirical vs. Rician CDF (Area 3).
Table 7 reports the CDF at −105 dBm for each model together with the corresponding estimated number of smart meters expected to switch (obtained by multiplying the CDF value by the total number of meters, 38) and the absolute difference against the actual 24 devices that switched in the field.
Table 7.
CDF (%) and estimated number of smart meters requiring switch at RSRP < −105 dBm (Area 3).
To quantify distributional fidelity beyond a single threshold, we computed the RMSE between the empirical CDF and each fitted model over the full support of the normalized RSRP samples. Table 8 summarizes the RMSE results.
Table 8.
RMSE between empirical and theoretical CDFs (Area 3).
The empirical exceedance at the configured threshold (−105 dBm) is 77.63%, implying 30/38 m would fall back, whereas field operations observed 24/38 devices. Among the fitted models, Nakagami yields the smallest absolute error at the threshold, followed by Rayleigh and Rician. Distributionally, Nakagami also attains the lowest RMSE = 0.1037, slightly outperforming Rayleigh (0.1073) and clearly improving over Rician (0.2067). Considering both the operational metric and the global goodness-of-fit (RMSE), the Nakagami model provides the most consistent characterization of Area-3 fading for the threshold-based adaptive algorithm for network selection.
To quantify the sensitivity of fallback recommendations to the decision threshold within the same radio environment, the threshold α was swept from −110 to −89 dBm in 1 dB steps. For each α, the CDF of the fitted models (Rayleigh, Nakagami, Rician) was evaluated and converted to an estimated switch count.
The baseline threshold of −105 dBm previously adopted as the operational criterion for weak/edge-of-cell LTE-M coverage remains highlighted in the table to ensure consistency with Table 9, while the sweep exposes the sensitivity of the recommendation to plausible threshold retuning.
Table 9.
Threshold sweep (Area 3): model CDF and estimated switch count (N = 38).
Table 9 (Threshold-Sweep Sensitivity, −110…−89 dBm) reports, for each threshold, the modeled and the corresponding (5) for Rayleigh, Nakagami, and Rician in Area 3. As expected, increases monotonically as becomes less negative, but the slope differs across models, reflecting differences in tail thickness. Around the operational region near −105 dBm, the Nakagami surrogate typically aligns most closely with observed behavior in Area 3, consistent with its lower RMSE and smaller absolute error at −105 dBm, thereby offering an operationally practical basis for threshold planning.
7. Conclusions
The proposed methodology offers three key contributions. First, it bridges mathematical modeling and field measurements by validating statistical distributions against empirical data. Second, it introduces a CDF-based decision metric that translates raw signal measurements into actionable technology selection rules. Finally, it demonstrates the feasibility of adaptive CIoT selection in real smart grid deployments, enhancing both reliability and efficiency.
Across three field areas, we assessed the suitability of canonical fading models (Rayleigh, Nakagami, and Rician) for edge-of-cell AMI deployments and quantified their operational implications via the CDF of RSRP at −105 dBm. Two criteria were used: (a) closeness of the model-predicted fallback count to the actual number of meters switching LTE-M → NB-IoT, and (b) distributional fidelity measured by RMSE between empirical and model CDFs (Section 6). Summaries for each area are:
Area 1 (N = 30; actual = 14) theoretical estimates are Rayleigh 8.75% (nine units), Rician 8.61% (nine units), and Nakagami 11.15% (13 units). Nakagami produced the closest fallback estimate (13 vs. 14) and the lowest RMSE (≈0.062), indicating flexible modeling better captures moderate to severe fading in this site. Area 2 (N = 35; actual = 8) theoretical estimates are Rayleigh 29.18% (10 units), Nakagami 20.45% (seven units), and Rician 20.62% (seven units). RMSE ranked Nakagami (≈0.020) < Rician (≈0.021) < Rayleigh (≈0.056), suggesting a mild LOS/clustered scatter component that Nakagami accommodates. Area 3 (N = 38; actual = 24) theoretical estimates are Rayleigh 53.73% (20 units), Nakagami 54.84% (21 units), and Rician 42.84% (16 units). RMSE again favored Nakagami (0.1037) < Rayleigh (0.1073) < Rician (0.2067). Although all models underpredict the high empirical exceedance, Nakagami remains the closest at the decision threshold and over the full CDF.
In all areas, Nakagami consistently provides the lowest RMSE and the most accurate threshold-level prediction (or tied), while Rayleigh tends to underestimate deep fade tails and Rician degrades when strong LOS is limited. Thus, for AMI edge deployments with heterogeneous micro-environments, Nakagami is the most reliable general-purpose surrogate for the empirical coverage distribution, with Rayleigh as a conservative baseline. This is consistent with Section 3 and the study’s adaptive decision framework for technology selection.
Future research will focus on integrating machine learning techniques to dynamically adjust fading model parameters and decision thresholds, which could further improve adaptability under varying environmental conditions. These enhancements will strengthen the resilience of CIoT enabled smart grids and support the ongoing digital transformation of power distribution networks.
Author Contributions
Conceptualization, T.S. and C.P.; Methodology, T.S. and C.P.; Software, T.S.; Validation, T.S. and C.P.; Formal analysis, T.S.; Investigation, T.S.; Data curation, T.S.; Writing—original draft, T.S.; Writing—review and editing, C.P.; Visualization, T.S.; Supervision, C.P.; Project administration, T.S.; Funding acquisition, C.P. All authors have read and agreed to the published version of the manuscript.
Funding
This research received no external funding.
Data Availability Statement
The original contributions presented in this study are included in the article. Further inquiries can be directed to the corresponding author.
Conflicts of Interest
The authors declare no conflict of interest.
References
- What Are Smart Grids? Available online: https://www.iea.org/energy-system/electricity/smart-grids (accessed on 20 June 2025).
- Bennett, C.; Highfill, D. Networking AMI Smart Meters. In Proceedings of the IEEE Energy 2030 Conference, Atlanta, GA, USA, 17–18 November 2008; pp. 1–8. [Google Scholar] [CrossRef] [Scilit]
- Kabeyi, M.J.B.; Olanrewaju, O.A. Smart grid technologies and application in the sustainable energy transition: A review. Int. J. Sustain. Energy 2023, 42, 685–758. [Google Scholar] [CrossRef] [Scilit]
- Rind, Y.M.; Raza, M.H.; Zubair, M.; Mehmood, M.Q.; Massoud, Y. Smart Energy Meters for Smart Grids, an Internet of Things Perspective. Energies 2023, 16, 1974. [Google Scholar] [CrossRef] [Scilit]
- Abbas, A.M.; Youssef, K.Y.; Mahmoud, I.I.; Zekry, A. NB-IoT optimization for smart meters networks of smart cities: Case study. Alex. Eng. J. 2020, 59, 4267–4281. [Google Scholar] [CrossRef] [Scilit]
- El Soussi, M.; Zand, P.; Pasveer, F.; Dolmans, G. Evaluating the Performance of eMTC and NB IoT for Smart City Applications. In Proceedings of the IEEE International Conference on Communications (ICC), Paris, France, 21–25 May 2017; pp. 1–7. [Google Scholar] [CrossRef] [Scilit]
- Chang, X.; Zhan, J.; Xing, G.; Huang, J.; Chen, B.; Zhou, L. Measurement-Based Optimization of Cell Selection in NB-IoT Networks. ACM Trans. Sens. Netw. 2022, 18, 65. [Google Scholar] [CrossRef] [Scilit]
- Yau, C.-W.; Jewsakul, S.; Luk, M.-H.; Lee, A.P.Y.; Chan, Y.-H.; Ngai, E.C.-H.; Pong, P.W.T.; Lui, K.-S.; Liu, J. NB-IoT Coverage and Sensor Node Connectivity in Dense Urban Environments: An Empirical Study. ACM Trans. Sens. Netw. 2022, 18, 1–36. [Google Scholar] [CrossRef] [Scilit]
- Coverage Analysis of LTE-M Category-M1. Available online: https://altair.sony-semicon.com/wp-content/uploads/2017/02/Coverage-Analysis-of-LTE-CAT-M1-White-Paper.pdf (accessed on 25 June 2024).
- Jörke, P.; Wietfeld, C. How Green Networking May Harm Your IoT Network: Impact of Transmit Power Reduction at Night on NB-IoT Performance. In Proceedings of the IEEE 7th World Forum on Internet of Things (WF-IoT), New Orleans, LA, USA, 14 June–31 July 2021; pp. 753–758. [Google Scholar] [CrossRef] [Scilit]
- Khan, B.; Pirak, C. Dual-SIM NB-IoT Modem Design for AMI Smart Meter. In Proceedings of the 18th International Conference on Electrical Engineering/Electronics, Computer, Telecommunications and Information Technology (ECTI-CON), Online, 19–22 May 2021; pp. 516–519. [Google Scholar] [CrossRef] [Scilit]
- Matz, A.P.; Fernandez-Prieto, J.A.; Cañada-Bago, J.; Birkel, U. A Systematic Analysis of Narrowband IoT Quality of Service. Sensors 2020, 20, 1636. [Google Scholar] [CrossRef] [Scilit] [PubMed]
- Evaluation of LTE-M Performance Towards 5G IoT Requirements. Available online: https://altair.sony-semicon.com/wp-content/uploads/2019/04/White-Paper-LTE-M-Performance-Towards-5G.pdf (accessed on 10 November 2025).
- Erunkulu, O.O.; Zungeru, A.M.; Lebekwe, C.K.; Chuma, J. Cellular Communications Coverage Prediction Techniques: A Survey and Comparison. IEEE Access 2020, 8, 113052–113077. [Google Scholar] [CrossRef] [Scilit]
- Evolved Universal Terrestrial Radio Access (E-UTRA). Requirements for Support of Radio Resource Management. Available online: https://www.3gpp.org/dynareport/36133.htm (accessed on 10 November 2025).
- Al-Sammak, K.A.; Al-Gburi, S.H.; Marghescu, I.; Drăgulinescu, A.-M.C.; Marghescu, C.; Martian, A.; Al-Sammak, N.A.H.; Suciu, G.; Alheeti, K.M.A. Optimizing IoT Energy Efficiency: Real-Time Adaptive Algorithms for Smart Meters with LoRaWAN and NB-IoT. Energies 2025, 18, 987. [Google Scholar] [CrossRef] [Scilit]
- Dumay, M.; Al Haj Hassan, H.; Surbayrole, P.; Artis, T.; Barthel, D.; Pelov, A. Enabling Extremely Energy-Efficient End-to-End Secure Communications for Smart Metering Internet of Things Applications Using Static Context Header Compression. Appl. Sci. 2023, 13, 11921. [Google Scholar] [CrossRef] [Scilit]
- Xu, Z.; Luo, J.; Yin, Z.; Wang, S.; Chen, C.; Lin, J. Leveraging Imperfect-Orthogonality Aware Scheduling for High Scalability in LPWAN. IEEE Trans. Mob. Comput. 2024, 23, 10111–10129. [Google Scholar] [CrossRef] [Scilit]
- Chen, C.; Xu, Z.; Xiong, R.; Shen, D.; Wang, W.; Luo, J. Enhancing Link Performance for Mobile LoRa Networks. IEEE Trans. Mob. Comput. 2025, 24, 13258–13275. [Google Scholar] [CrossRef] [Scilit]
- Wang, Y.-P.E.; Lin, X.; Adhikary, A.; Grövlen, A.; Yutao, S.; Blankenship, Y.; Bergman, J.; Razaghi, H.S. A Primer on 3GPP Narrowband Internet of Things. IEEE Commun. Mag. 2017, 55, 117–123. [Google Scholar] [CrossRef] [Scilit]
- 3GPP Low Power Wide Area Technologies. Available online: https://www.gsma.com/solutions-and-impact/technologies/internet-of-things/gsma_resources/3gpp-low-power-wide-area-technologies-white-paper (accessed on 7 July 2025).
- Balbach, S.; Dorn, C.; Fraidling, F.; Hagelauer, A. Performance Comparison of the LPWAN Standards NB-IoT and LTE-M Based on Protocols and Message Volumes. In Proceedings of the IEEE MTT-S Latin America Microwave Conference (LAMC), San Juan, PR, USA, 22–24 January 2025; pp. 74–77. [Google Scholar] [CrossRef] [Scilit]
- Abdelrahman, M.; Abouzeid, A. Energy-Saving Solutions for Cellular Internet of Things—A Survey. IEEE Access 2022, 10, 69160–69184. [Google Scholar] [CrossRef] [Scilit]
- NB-IoT and LTE-M Additional Design Considerations. Available online: https://assets.ctfassets.net/obescfmtzvv4/6GFK00kkjR7JpWowhAyqrE/ce19ac80ac55f2642e398d5d6a814599/Professional_Services_NB-IoT_Proposition_Additional_Design_Consideration_v5.pdf (accessed on 18 September 2025).
- Ferreira, B.; Gaspar, B.; Paiva, S.; Santos, A.; Cabral, J. Coverage and Deployment Analysis of NB-IoT Technology under Various Environment Scenarios. In Proceedings of the IEEE 2nd International Conference on Societal Automation (SA), Funchal, Portugal, 9–11 September 2020; pp. 1–7. [Google Scholar] [CrossRef] [Scilit]
- SM Location. Available online: https://www.google.com/maps/d/u/0/edit?mid=1QUUdNF5s0CYXWeYRGWjZWrQIOG-zq2Q&usp=sharing (accessed on 10 September 2025).
- Burczyk, R.; Czapiewska, A.; Gajewska, M.; Gajewski, S. LTE and NB-IoT Performance Estimation Based on Different Threshold Values. Electronics 2022, 11, 2892. [Google Scholar] [CrossRef] [Scilit]
- RSRP and RSRQ. Available online: https://wiki.teltonika-networks.com/view/RSRP_and_RSRQ (accessed on 10 November 2025).
- Lauridsen, M.; Kovács, I.Z.; Mogensen, P.; Sorensen, M.; Holst, S. Coverage and Capacity Analysis of LTE-M and NB-IoT in a Realistic MTC Deployment. In Proceedings of the IEEE Vehicular Technology Conference (VTC-Fall), Montreal, QC, Canada, 18–21 September 2016; pp. 1–5. [Google Scholar] [CrossRef] [Scilit]

Disclaimer/Publisher’s Note: The statements, opinions and data contained in all publications are solely those of the individual author(s) and contributor(s) and not of MDPI and/or the editor(s). MDPI and/or the editor(s) disclaim responsibility for any injury to people or property resulting from any ideas, methods, instructions or products referred to in the content. |
© 2026 by the authors. Licensee MDPI, Basel, Switzerland. This article is an open access article distributed under the terms and conditions of the Creative Commons Attribution (CC BY) license.