


Abstract
Fault-controlled reservoirs are characterized by strong heterogeneity and diverse flow types. Existing water-coning calculation methods cannot accurately describe the complex oil–water distribution within reservoirs exhibiting a distinct “core–damage zone” architecture. To address this limitation, the main goal of this study is to develop a zonal water-coning calculation framework tailored to these highly heterogeneous structures. Methodologically, the Forchheimer equation is utilized to describe the entire reservoir system, with region-specific simplifications applied based on dominant flow mechanisms: in the high-velocity core zone, the viscous term is ignored; in the low-velocity damage zone, the inertial term is neglected; and the transition zone employs the complete Forchheimer formulation. The results indicate that the water-coning curves in the core and transition zones are significantly steeper as the radial distance decreases compared to the damage zone. Specifically, in a field application at the Fuman Oilfield, the calculated theoretical critical production rate of the core zone (5.39 × 10⁻² m3/s) is three orders of magnitude higher than that of the damage zone (1.45 × 10⁻⁵ m3/s). In conclusion, this massive zonal disparity demonstrates the severe bottleneck effect of the high-permeability core under a unified wellbore pressure drawdown, theoretically validating the necessity of deploying segmented completions and targeted water-control strategies to prevent premature water breakthrough.
1. Introduction
Carbonate reservoirs are an important source of global hydrocarbon resources, and their storage space is commonly composed of pores, fractures, vugs, and caverns with strongly varying connectivity and flow capacity [1,2]. In ultra-deep fault-controlled carbonate reservoirs, especially those developed in the Tarim Basin, the coexistence of multiple storage media, strong structural segmentation, and pronounced heterogeneity makes fluid flow behavior substantially more complex than that in conventional porous reservoirs [1,3]. Under bottom-water drive, water coning in vertical wells and water ridging in horizontal wells are among the most critical production challenges, because once water channels along dominant seepage pathways rapidly, oil production can decline sharply and water cut may rise abruptly [4,5,6,7]. Therefore, establishing a reliable method for describing and predicting water-coning behavior is essential for production optimization and water-control design in such reservoirs.
Considerable progress has been made in analytical and semi-analytical studies of bottom-water coning and ridging; however, most conventional methods were developed for relatively homogeneous reservoirs and usually rely on simplified assumptions regarding flow regime, reservoir architecture, and bottom-water geometry [4]. For fractured–vuggy bottom-water reservoirs, several studies have extended classical coning theory by introducing simplified geological zoning or distinguishing different flow regions. For example, Lu et al. proposed a critical production model for fractured–vuggy reservoirs with bottom water [5], Lv et al. developed a method for determining water-coning shape in fractured–vuggy layered reservoirs [6], and Cheng et al. established a critical production calculation method for horizontal wells in bottom-water reservoirs by decomposing the near-well flow field into different regions [7]. In addition, Yuan et al. showed that reservoir heterogeneity and composite water-aquifer configuration can significantly alter the productivity response of horizontal wells [8]. These studies improved the applicability of coning calculations to heterogeneous carbonate systems; however, they were still mainly developed on the basis of simplified Darcy-type flow assumptions and did not fully address the strong architectural heterogeneity and flow-regime transition in fault-controlled reservoirs.
In the last five years, research on bottom-water development has increasingly expanded from static critical-rate estimation toward dynamic prediction and integrated production analysis [9]. Representative studies have proposed dynamic water-cone prediction methods that consider oil–water interface evolution, new approaches for calculating the characteristic shape of water ridges under horizontal wells, and transient productivity models for bottom-water reservoirs with finite water bodies [10,11,12]. At the engineering scale, recent studies have further coupled reservoir flow with AICD or ICD completion behavior, as well as intelligent completion data, to predict water breakthrough and optimize water-control performance in horizontal wells [13,14,15]. More recent coupled models have further extended this line of work to multilateral horizontal wells, showing that well architecture can also reshape breakthrough behavior and recovery efficiency [16]. These advances significantly enrich the toolbox for bottom-water reservoir analysis, but they mainly target sandstone, heavy-oil, or relatively idealized bottom-water systems, and they do not explicitly address the zonal flow-regime transition that is typical of fault-controlled fractured–vuggy reservoirs [9,10,11,12,13,14,15,17,18].
This limitation is particularly important for fault-controlled fractured–vuggy reservoirs with a core–damage architecture [3,19]. In such systems, the fault core commonly contains highly conductive fractures and caverns, where high-velocity flow may induce strong non-Darcy effects, whereas the surrounding damage zone is more likely to be governed by low-velocity viscous flow [20,21]. Between them, a transition zone may exist in which viscous and inertial forces jointly control pressure loss. Moreover, recent studies have shown that gravity, interlayer distribution, wettability, and local flow architecture can strongly influence bottom-water invasion dynamics and breakthrough time, further indicating that a unified homogeneous model is insufficient for describing these reservoirs [17,18,22]. As a result, existing bottom-water-coning methods cannot adequately capture the spatial variation in pressure-loss mechanism and coning morphology in fault-controlled reservoirs, and their direct application may lead to biased critical-rate evaluation and incomplete engineering interpretation [5,6,7].
To address this issue, this study develops a zonal water-coning calculation framework for fault-controlled fractured–vuggy reservoirs based on a multi-modal flow model. The Forchheimer equation is adopted as the unified governing framework, and region-specific simplifications are introduced according to the dominant flow mechanism in the core, transition, and damage zones. By separately calculating the water-coning profile in each zone and integrating them into a coherent coning description, the proposed method aims to better represent the coupling between reservoir architecture and flow regime. The resulting framework provides a rapid and physically interpretable tool for critical production evaluation and for the design of segmented completion and targeted water-control strategies in strongly heterogeneous fault-controlled reservoirs.
2. Materials and Methods
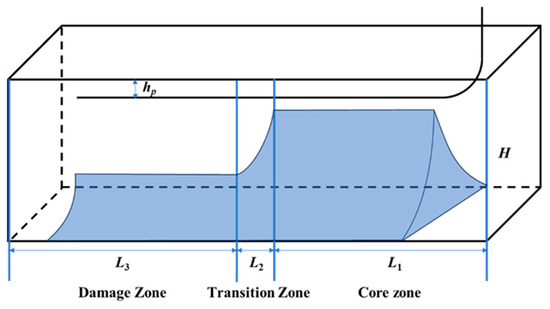
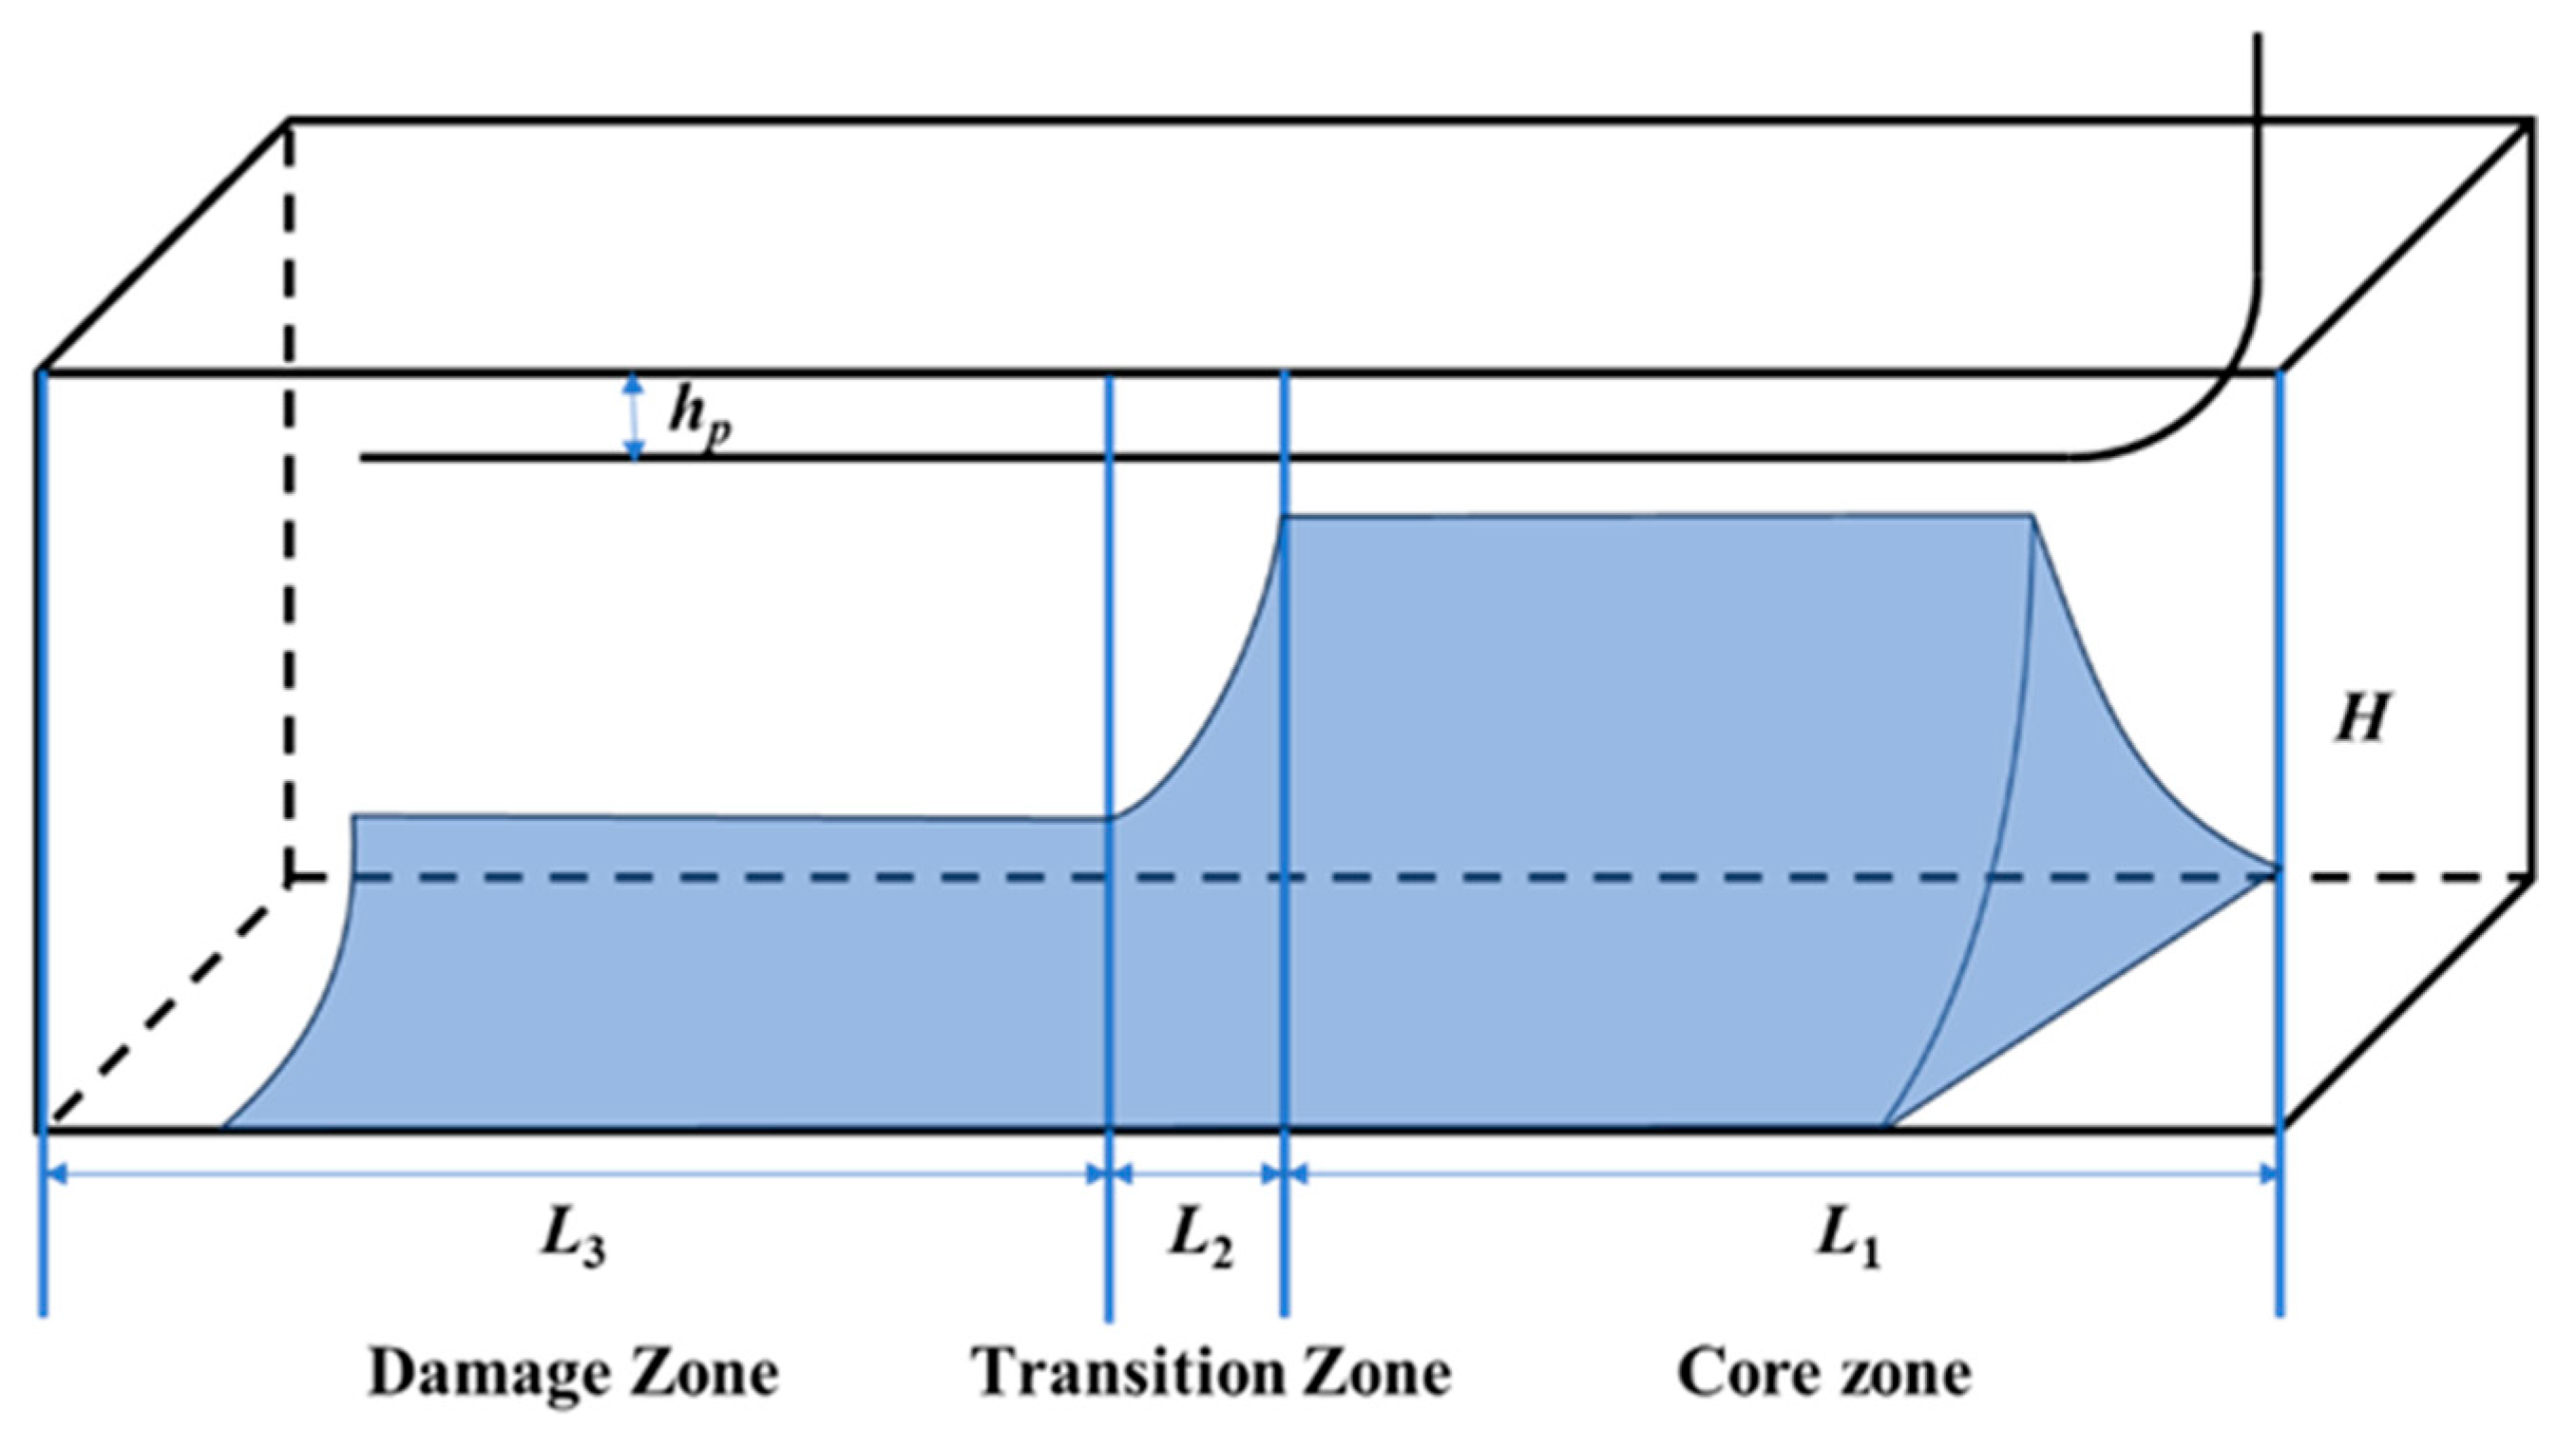
In the description of the core structure of the “Fault-Fracture Body” in fault-controlled reservoirs above, the core–damage structure is defined. Reservoirs with this structural characteristic will experience bottom-water upward channeling during depletion development—termed “water coning” for vertical wells and “water ridging” for horizontal wells. Based on the different flow modes in the different storage bodies of the fault-controlled reservoir, the reservoir can be roughly divided into three regions: the core (dominated by inertial forces), the damage zone (dominated by viscous forces), and the transition zone (where both inertial and viscous forces act together), as shown in Figure 1.
Figure 1.
Schematic of water coning in core–damage structure.
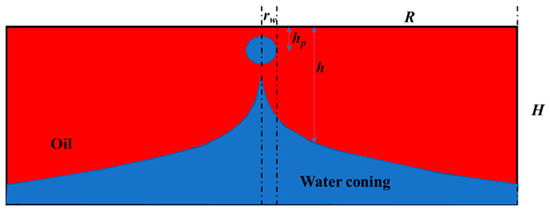
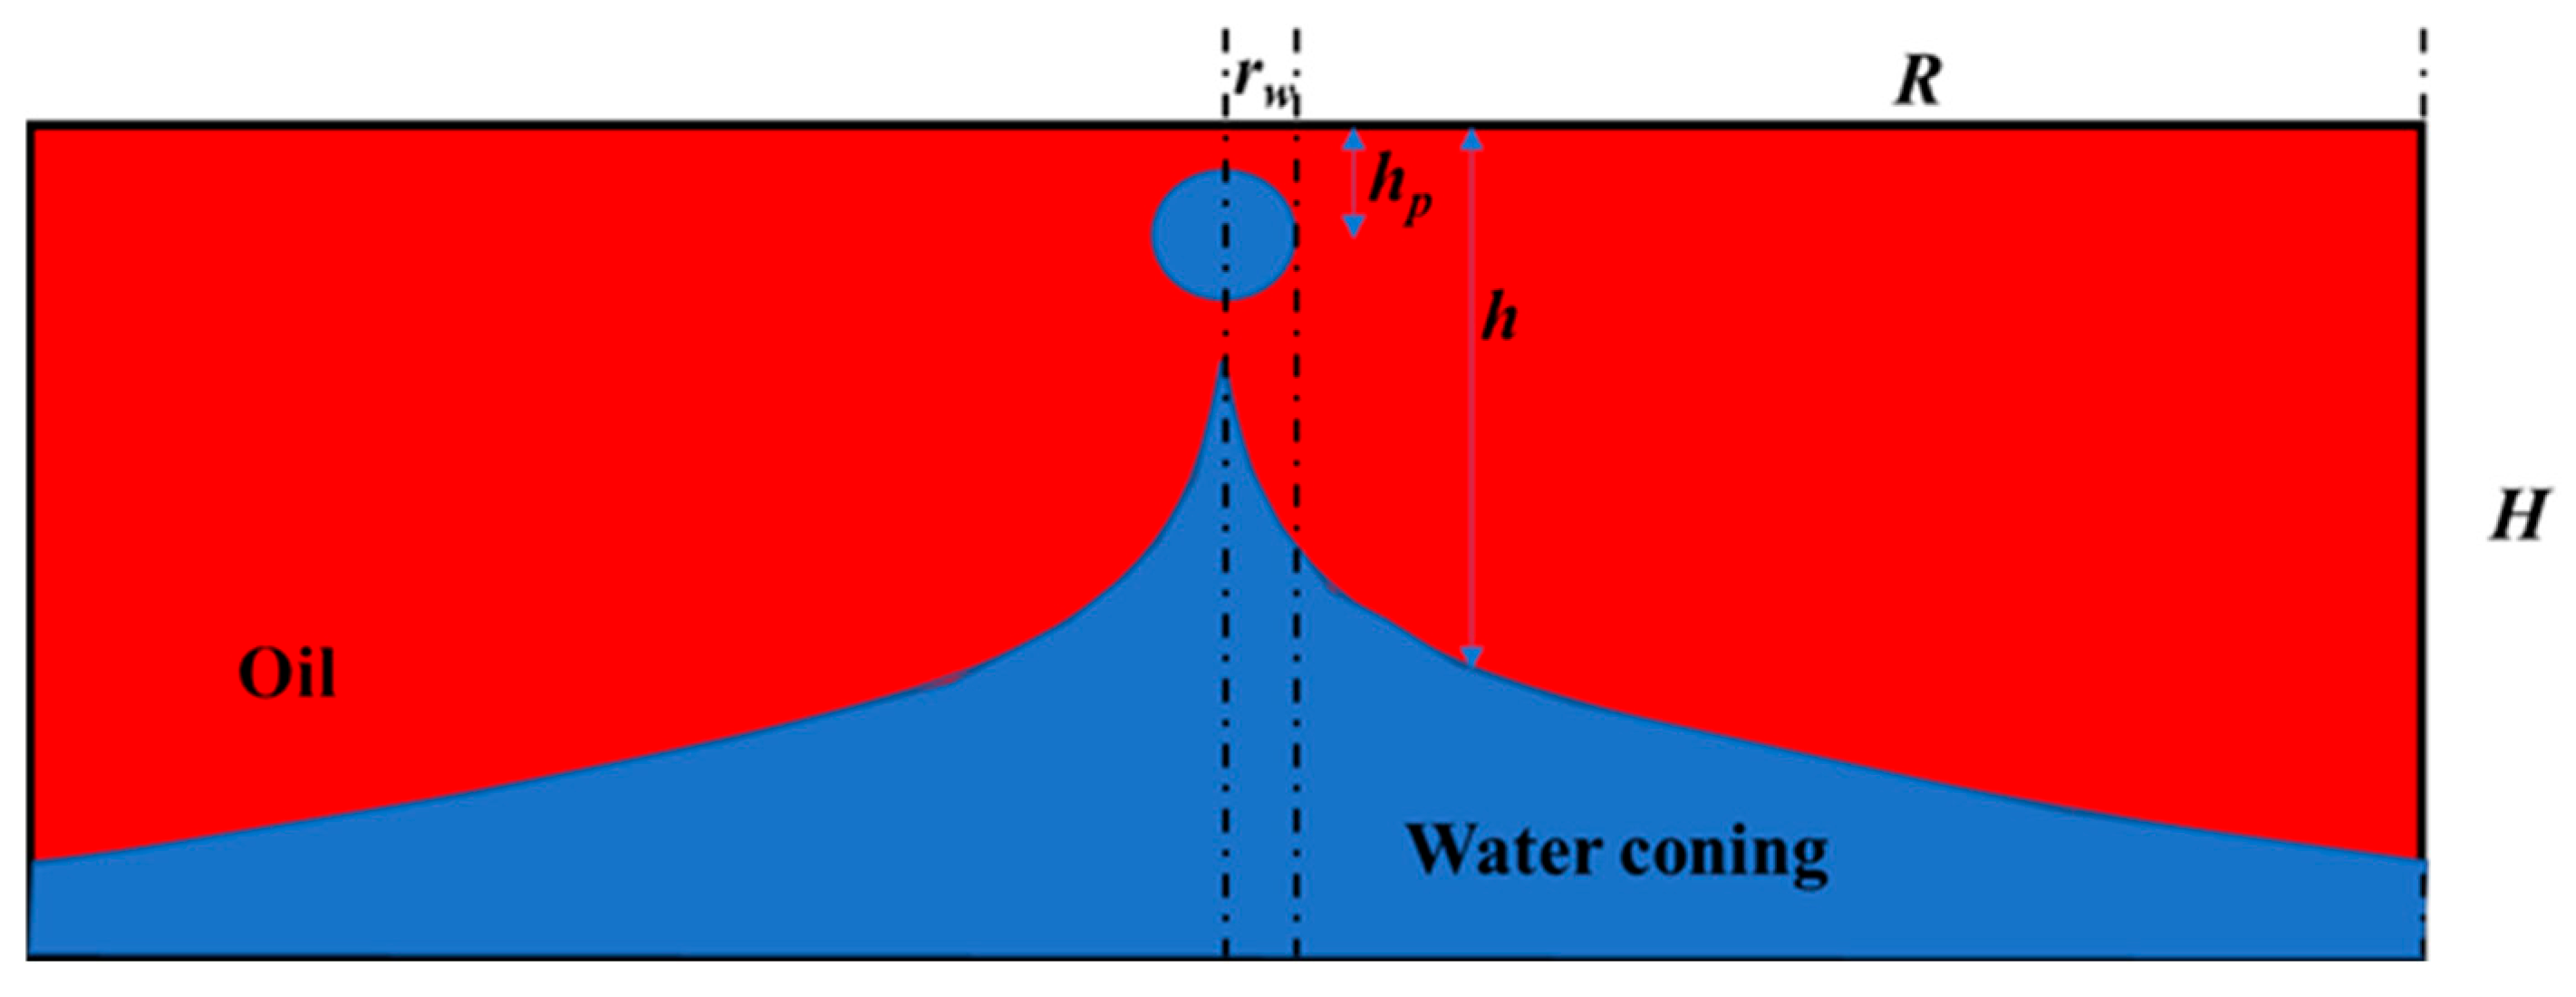
Assume the horizontal well length is L. The lengths of the core zone, transition zone, and damage zone are L1, L2, and L3, respectively. The reservoir thickness is H (vertical distance from the top of the oil layer to the initial oil–water interface); hp is the vertical distance from the wellbore to the top of the oil layer; the wellbore radius is rw. Assume the flow rates in the perforated sections of the core zone, transition zone, and damage zone are q1, q2, and q3, respectively.
During production, if the oil well produces at a stable rate, the formed water cone or ridge may stabilize at a certain height. Once the critical production is reached, assuming the water cone height is the same within the same region, the schematic of the water ridge is as shown in Figure 1. The calculation of the water ridge height can be simplified to the calculation of the water cone height in a cross-section, as shown in Figure 2.
Figure 2.
Cross-section of water coning.
To isolate the primary mechanisms of extreme heterogeneity and non-Darcy flow, this analytical framework incorporates three key engineering simplifications: (1) The complex 3D water ridging process is decoupled into 2D cross-sectional profiles by assuming uniform flux along specific regional well trajectories. (2) Capillary pressure at the oil–water interface is neglected, as the macroscopic flow in the fault-core is dominated by large-scale vugs and fracture corridors where the effective capillary radius is exceptionally large. (3) The ‘steady-state’ assumption is strictly applied to define the critical equilibrium point—the exact moment before water breakthrough—where the dynamic pressure drawdown above the interface is instantaneously balanced by the static gravitational head below.
In the core zone, since only inertial forces are considered, the Forchheimer equation can be simplified to the following form:
where the flow velocity in the core zone, v1, is expressed as follows:
where h1 is the height of the oil–water interface in the core zone. Substituting this relationship into the Equation (1):
Integrating Equation (3), the pressure drop is:
Under stable water-coning conditions, the pressure difference at each point on the oil–water contact surface is caused by the gravity difference between oil and water. Therefore, the relationship between pressure drop and oil–water interface height can be established:
So, Equation (5) can then be transformed into the following:
Re-integrating this, the water cone height in the core zone is obtained as follows:
Regarding the value of the non-Darcy coefficient β in the Forchheimer equation, researchers have conducted extensive experiments to determine the relationship between β, porosity φ, and permeability K. Numerous papers have fitted empirical formulas based on experimental data to estimate β [20]. Some correlations use only permeability K, while others consider porosity φ, tortuosity τ, etc. Zhao [21] summarized several empirical relationships proposed by different researchers: The Jones formula (1987) [21] correlates only with permeability K; the Thauvin–Mohanty formula (1998) [21] introduces a φ correction; the Li et al. (2001) [21] correlation integrates the effects of K and τ. Results show that predictions for β using different formulas for the same rock sample can vary significantly, ranging from 4.00 × 10⁴ m−1 to 1.34 × 10⁵ m−1, while the value obtained from direct numerical simulation is approximately 2.88 × 10⁵ m−1. Table 1 shows the non-Darcy coefficients calculated by Zhao et al. for a porosity of 0.38 and permeability of 4.59 μm2, indicating that empirical formulas have varying scopes of application and must be selected carefully. Generally, matrix permeability K is the most commonly used correlation parameter because K implicitly reflects the influence of pore size and pore structure on flow resistance to a certain extent.
Table 1.
Non-Darcy coefficient β calculation formation.
Due to the strong heterogeneity in the core zone, the porosity and permeability at different locations within the core also vary. The weighted average of permeability and porosity in the core zone is calculated using the following formula:
where Ki and ϕi are the representative values of the permeability and porosity for each interval, typically taken as the median; wi is the proportion of the interval; and n is the total number of intervals.
Similarly, in the damage zone, the pressure drop Equation (10) can be transformed into the water cone height formula:
where h3 is the height of the oil–water interface in the damage zone, m; and p3 is the pressure in the damage zone, Pa.
Due to the characteristics of the fractured and brecciated body, the transition zone is primarily composed of filled cavities and fractures. In this region, both viscous and inertial forces must be considered. Therefore, the water cone calculation formula is based on the complete Forchheimer equation:
Following the previous derivation method, we obtain:
Due to the complex units of various parameters, dimensionless processing is applied, and let
Substituting Equation (14) into Equation (13) gives the following:
The calculation methods for A and B are as follows:
When solving the steady-state water-coning profile, the boundary conditions are specified as follows:
Using the finite-difference method, the differential Equation (15) is discretized, and the residual form is written as follows:
where u is the vector of unknowns. To close the system, an additional well constraint equation is imposed at the wellbore:
Accordingly, the following global linear system can be assembled:
where the nonzero entries of T are , , , where i = r + 1; the vector e has only its first element nonzero; and the vector c is given by
Because the Forchheimer term introduces strong nonlinearity to the residual equations, the global linear system (Equation (20)) is solved iteratively using a damped Newton–Raphson method. To prevent iteration divergence caused by sharp gradient updates in the near-wellbore region, a relaxation factor of ω = 0.5 is applied to the solution vector update. The iterative process is terminated when the L∞-norm of the relative residual falls below a strict convergence tolerance of 10−6.
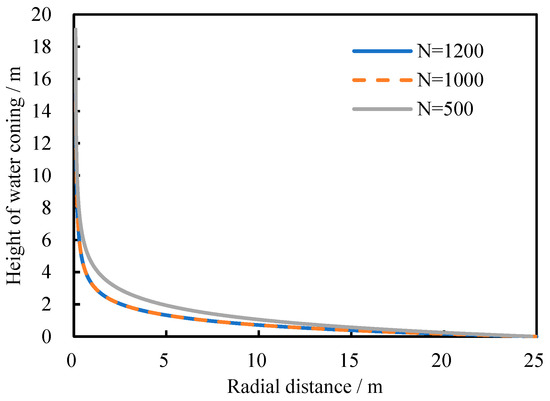
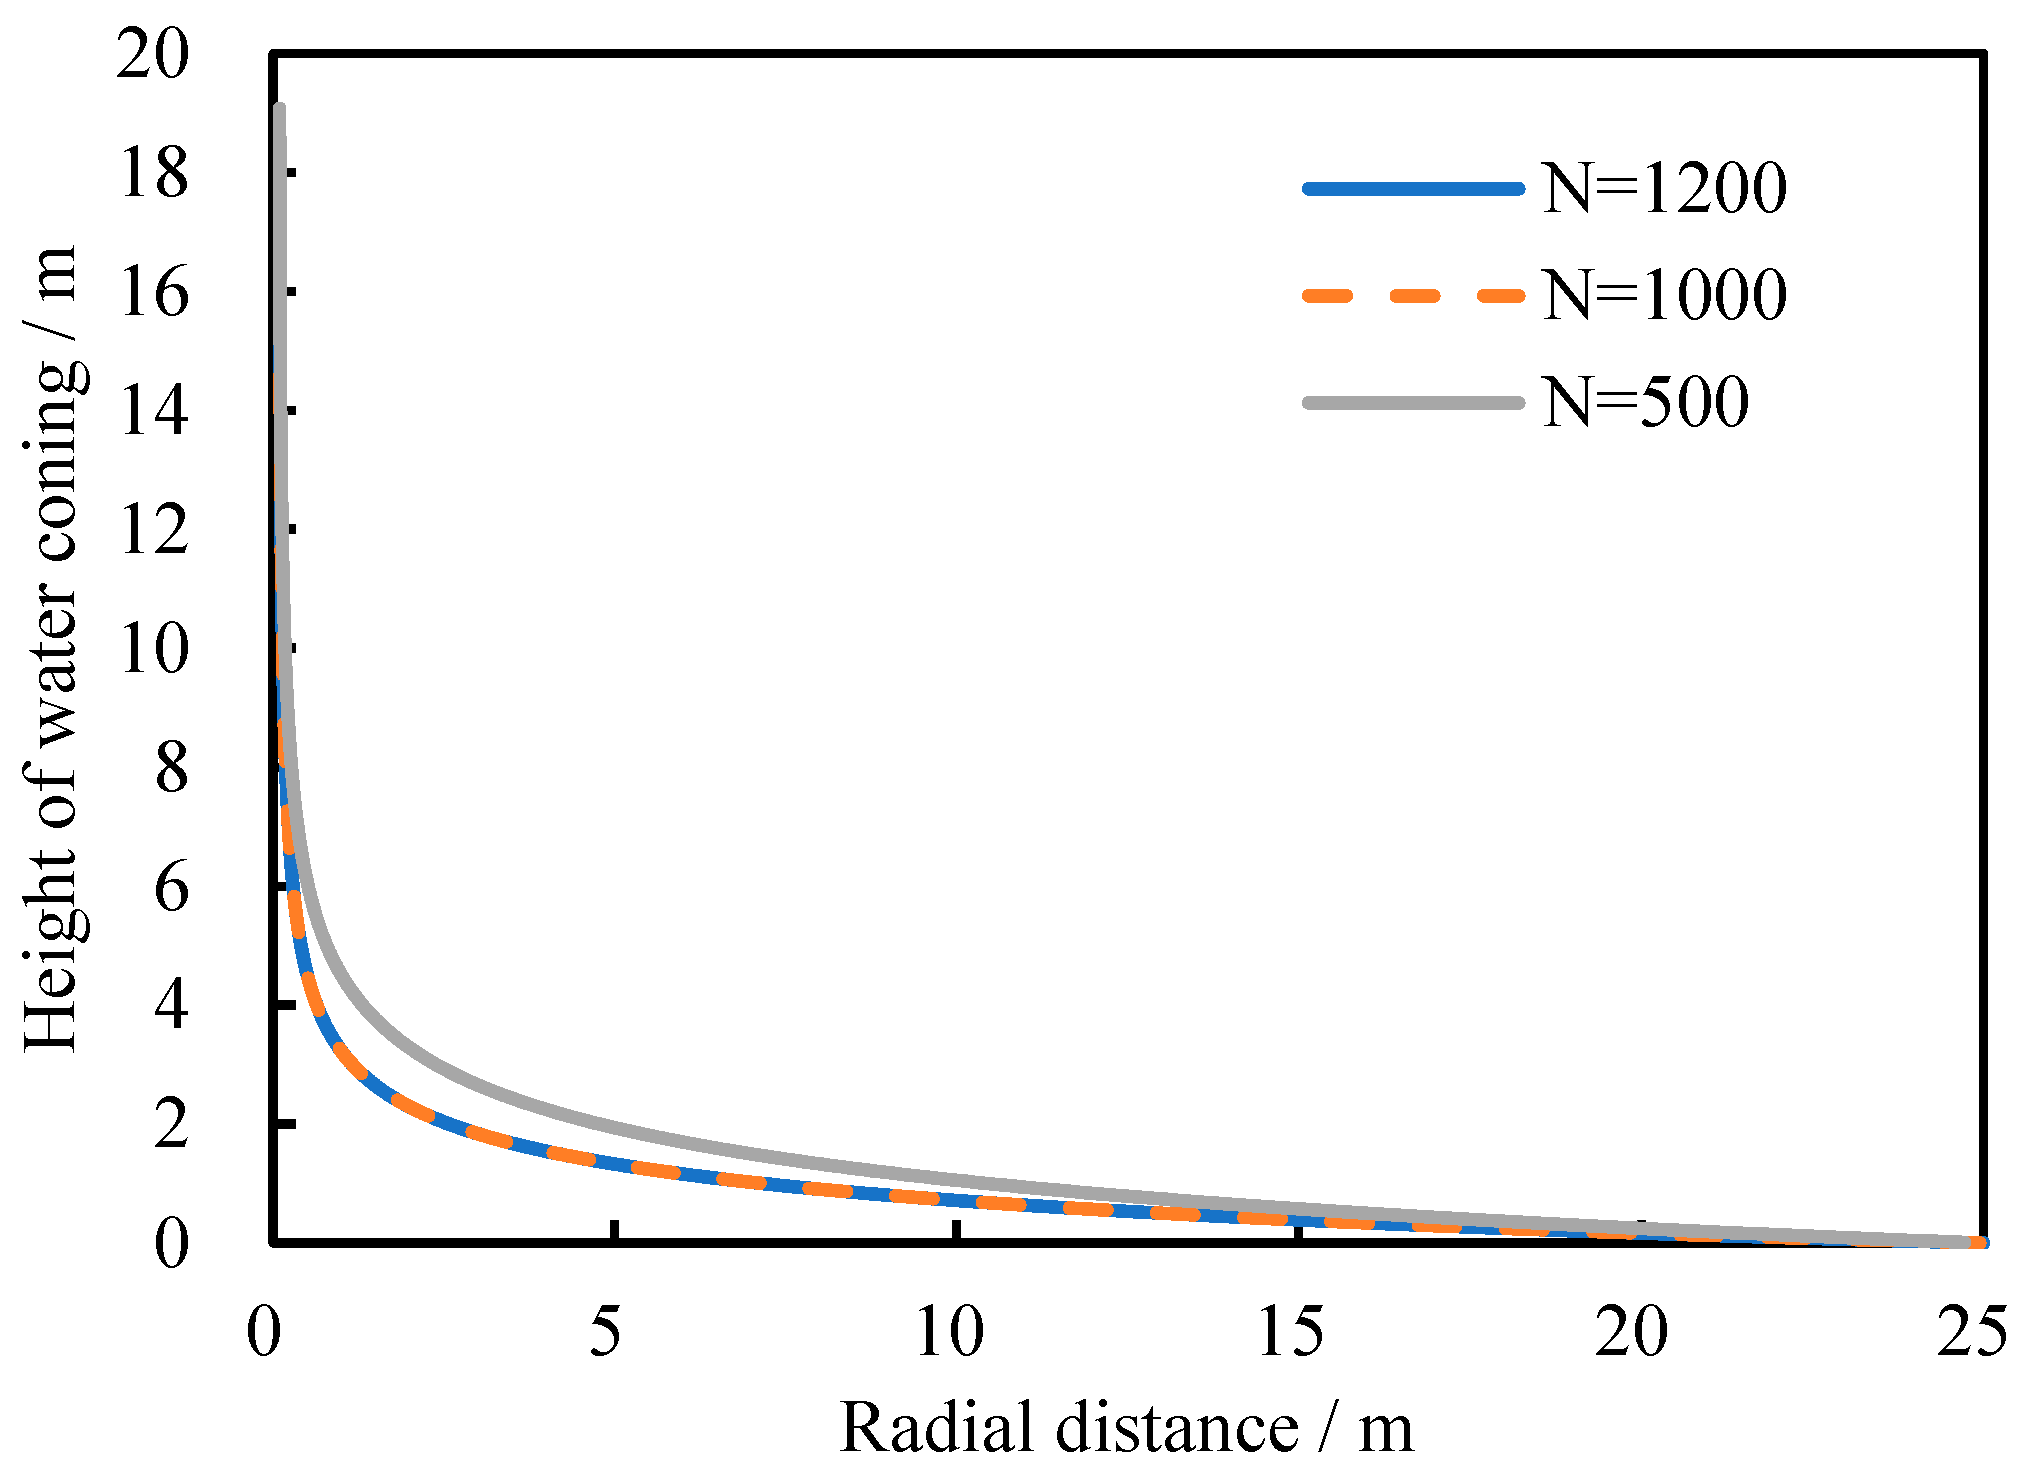
Furthermore, to maintain the second-order accuracy of the central difference scheme while handling the steep water-coning gradients near the wellbore without artificial numerical diffusion, a logarithmically refined grid is employed rather than an upwinding scheme. A rigorous grid sensitivity analysis was conducted with node numbers ranging from N = 500 to 1200. Results indicated that the calculated water-coning profiles and critical production rates stabilized with less than a 0.5% relative difference when N = 1000, as shown in Figure 3. Consequently, a grid resolution of N = 1000 was utilized for all numerical validations in this study to guarantee grid-independent stability.
Figure 3.
Comparison of water-coning heights in the transition zone with different node numbers.
3. Results and Discussions
3.1. Parameter Sensitivity Analysis
3.1.1. Impact of the β Calculation Formula on the Water-Coning Curve Shape
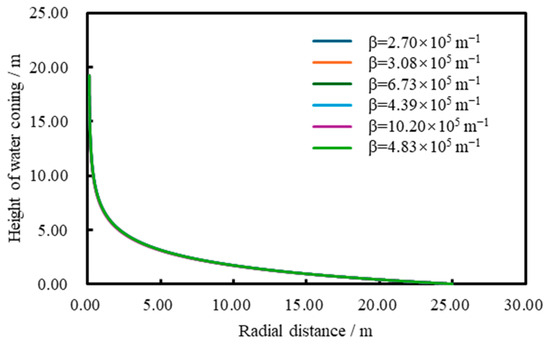
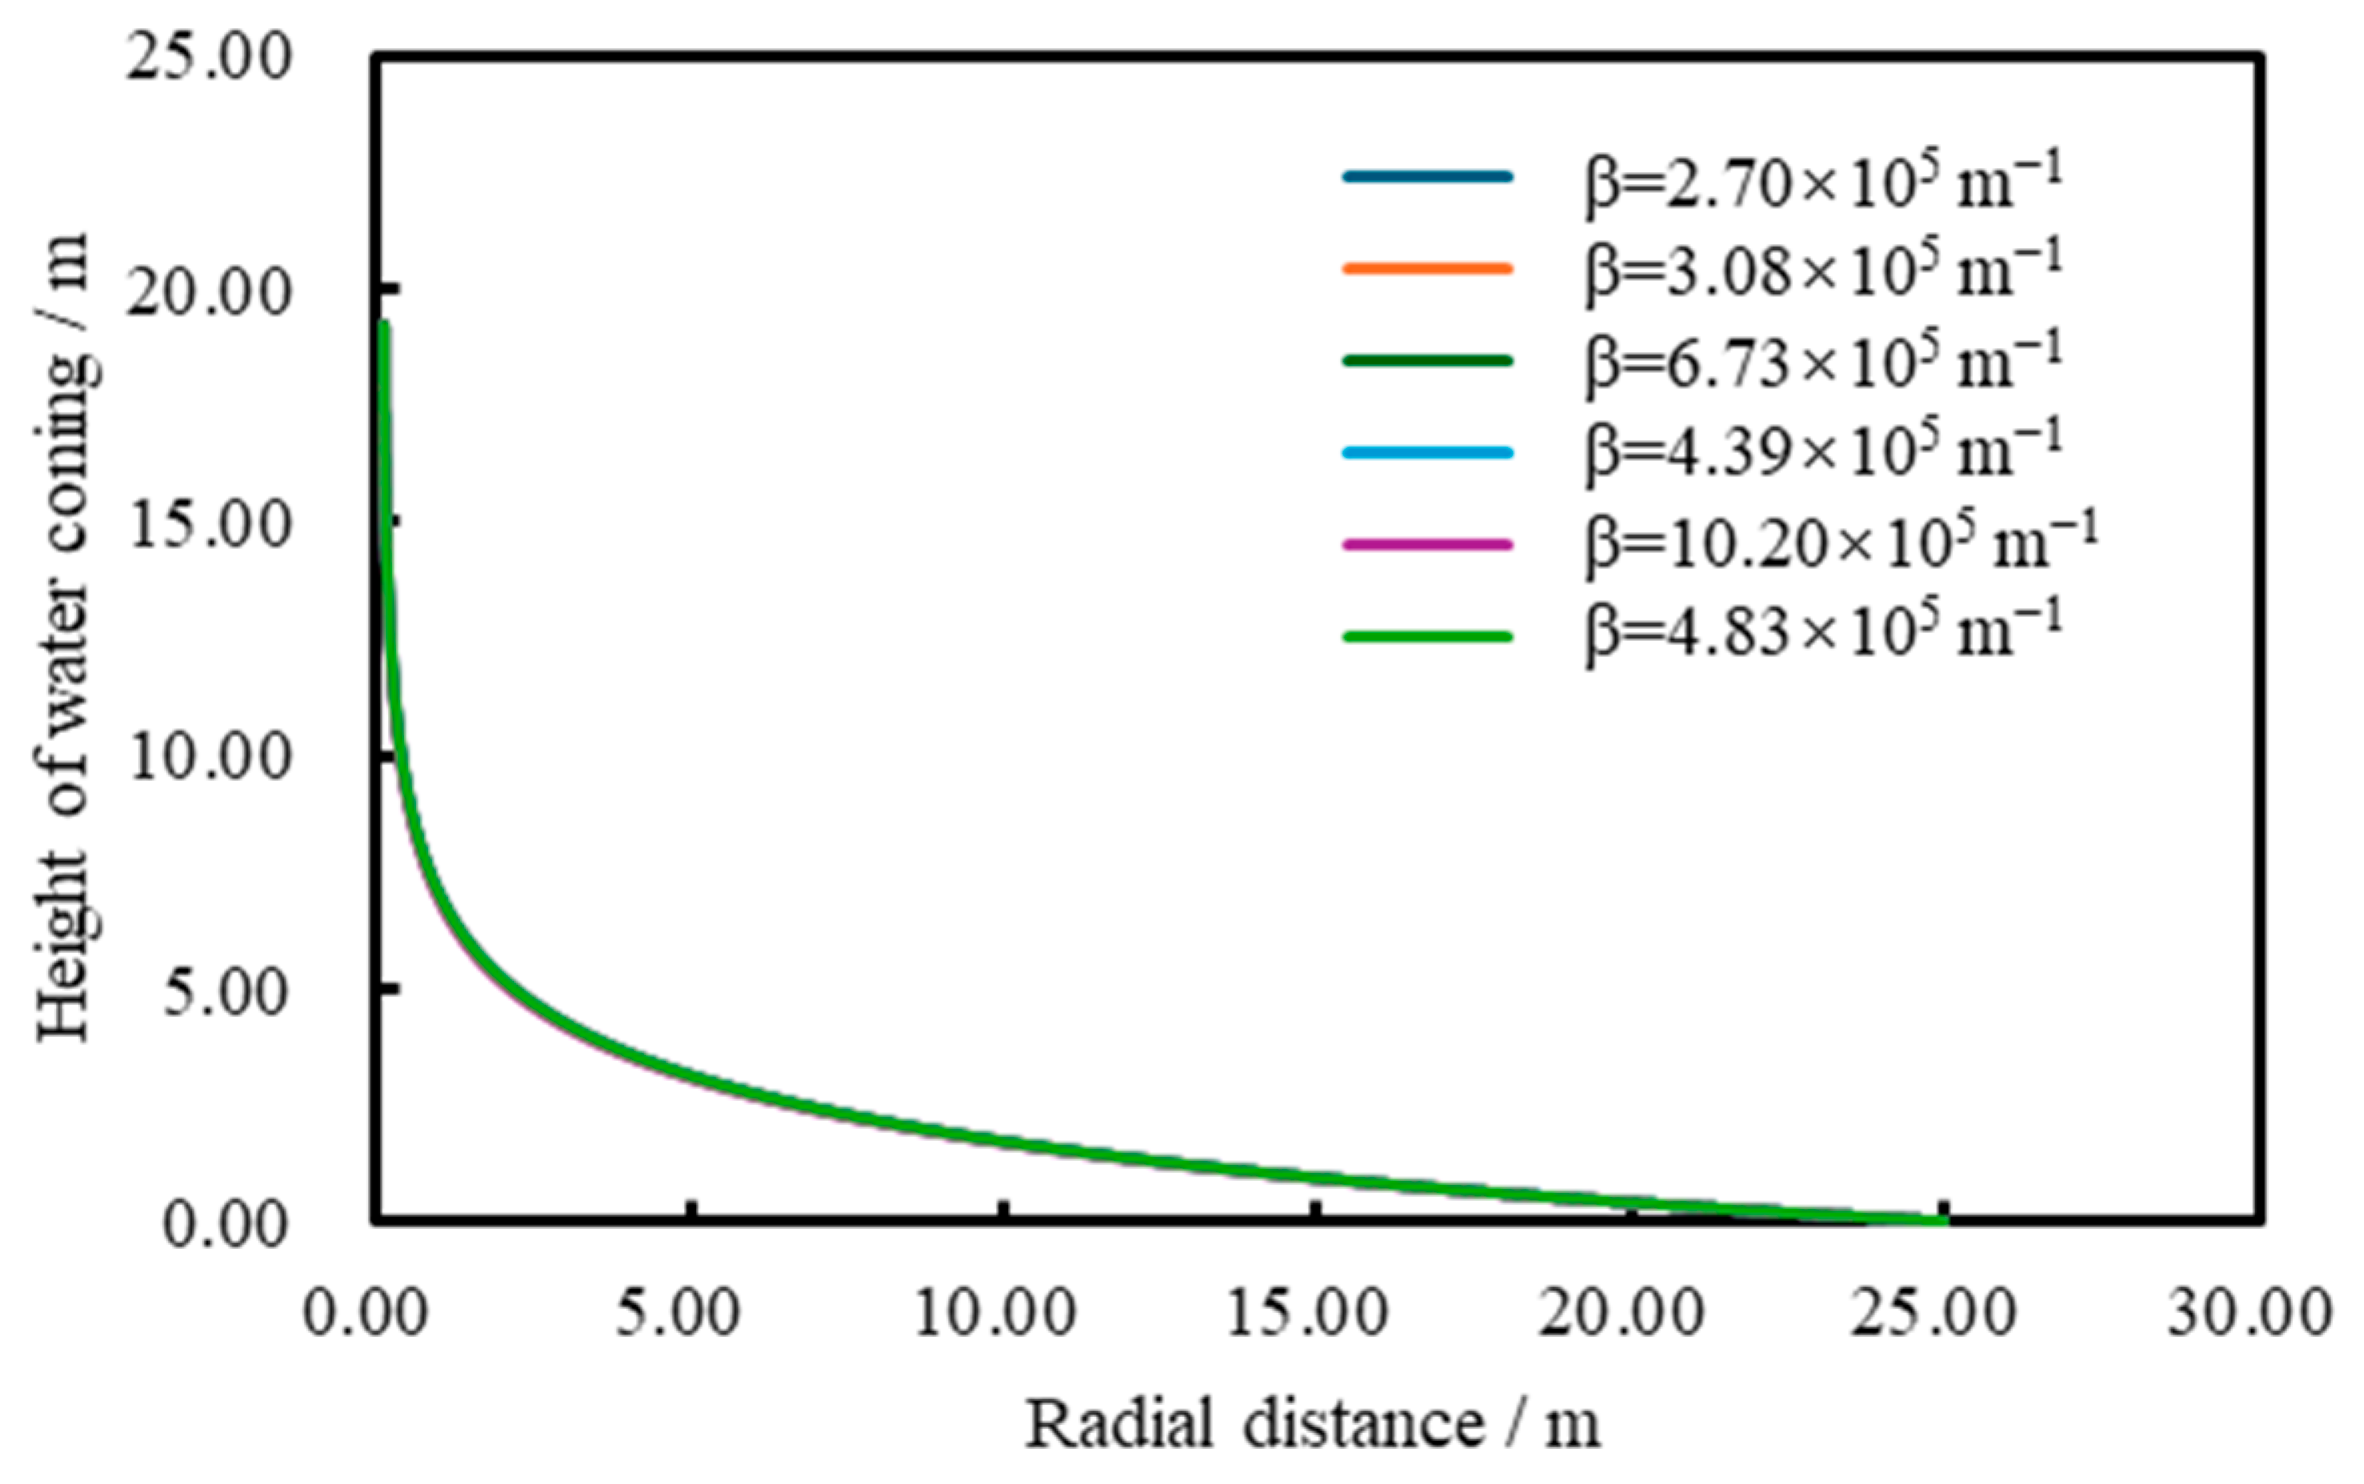
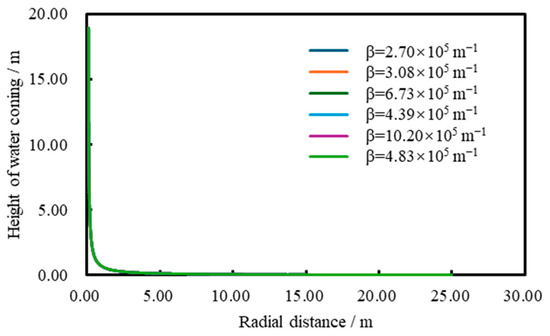
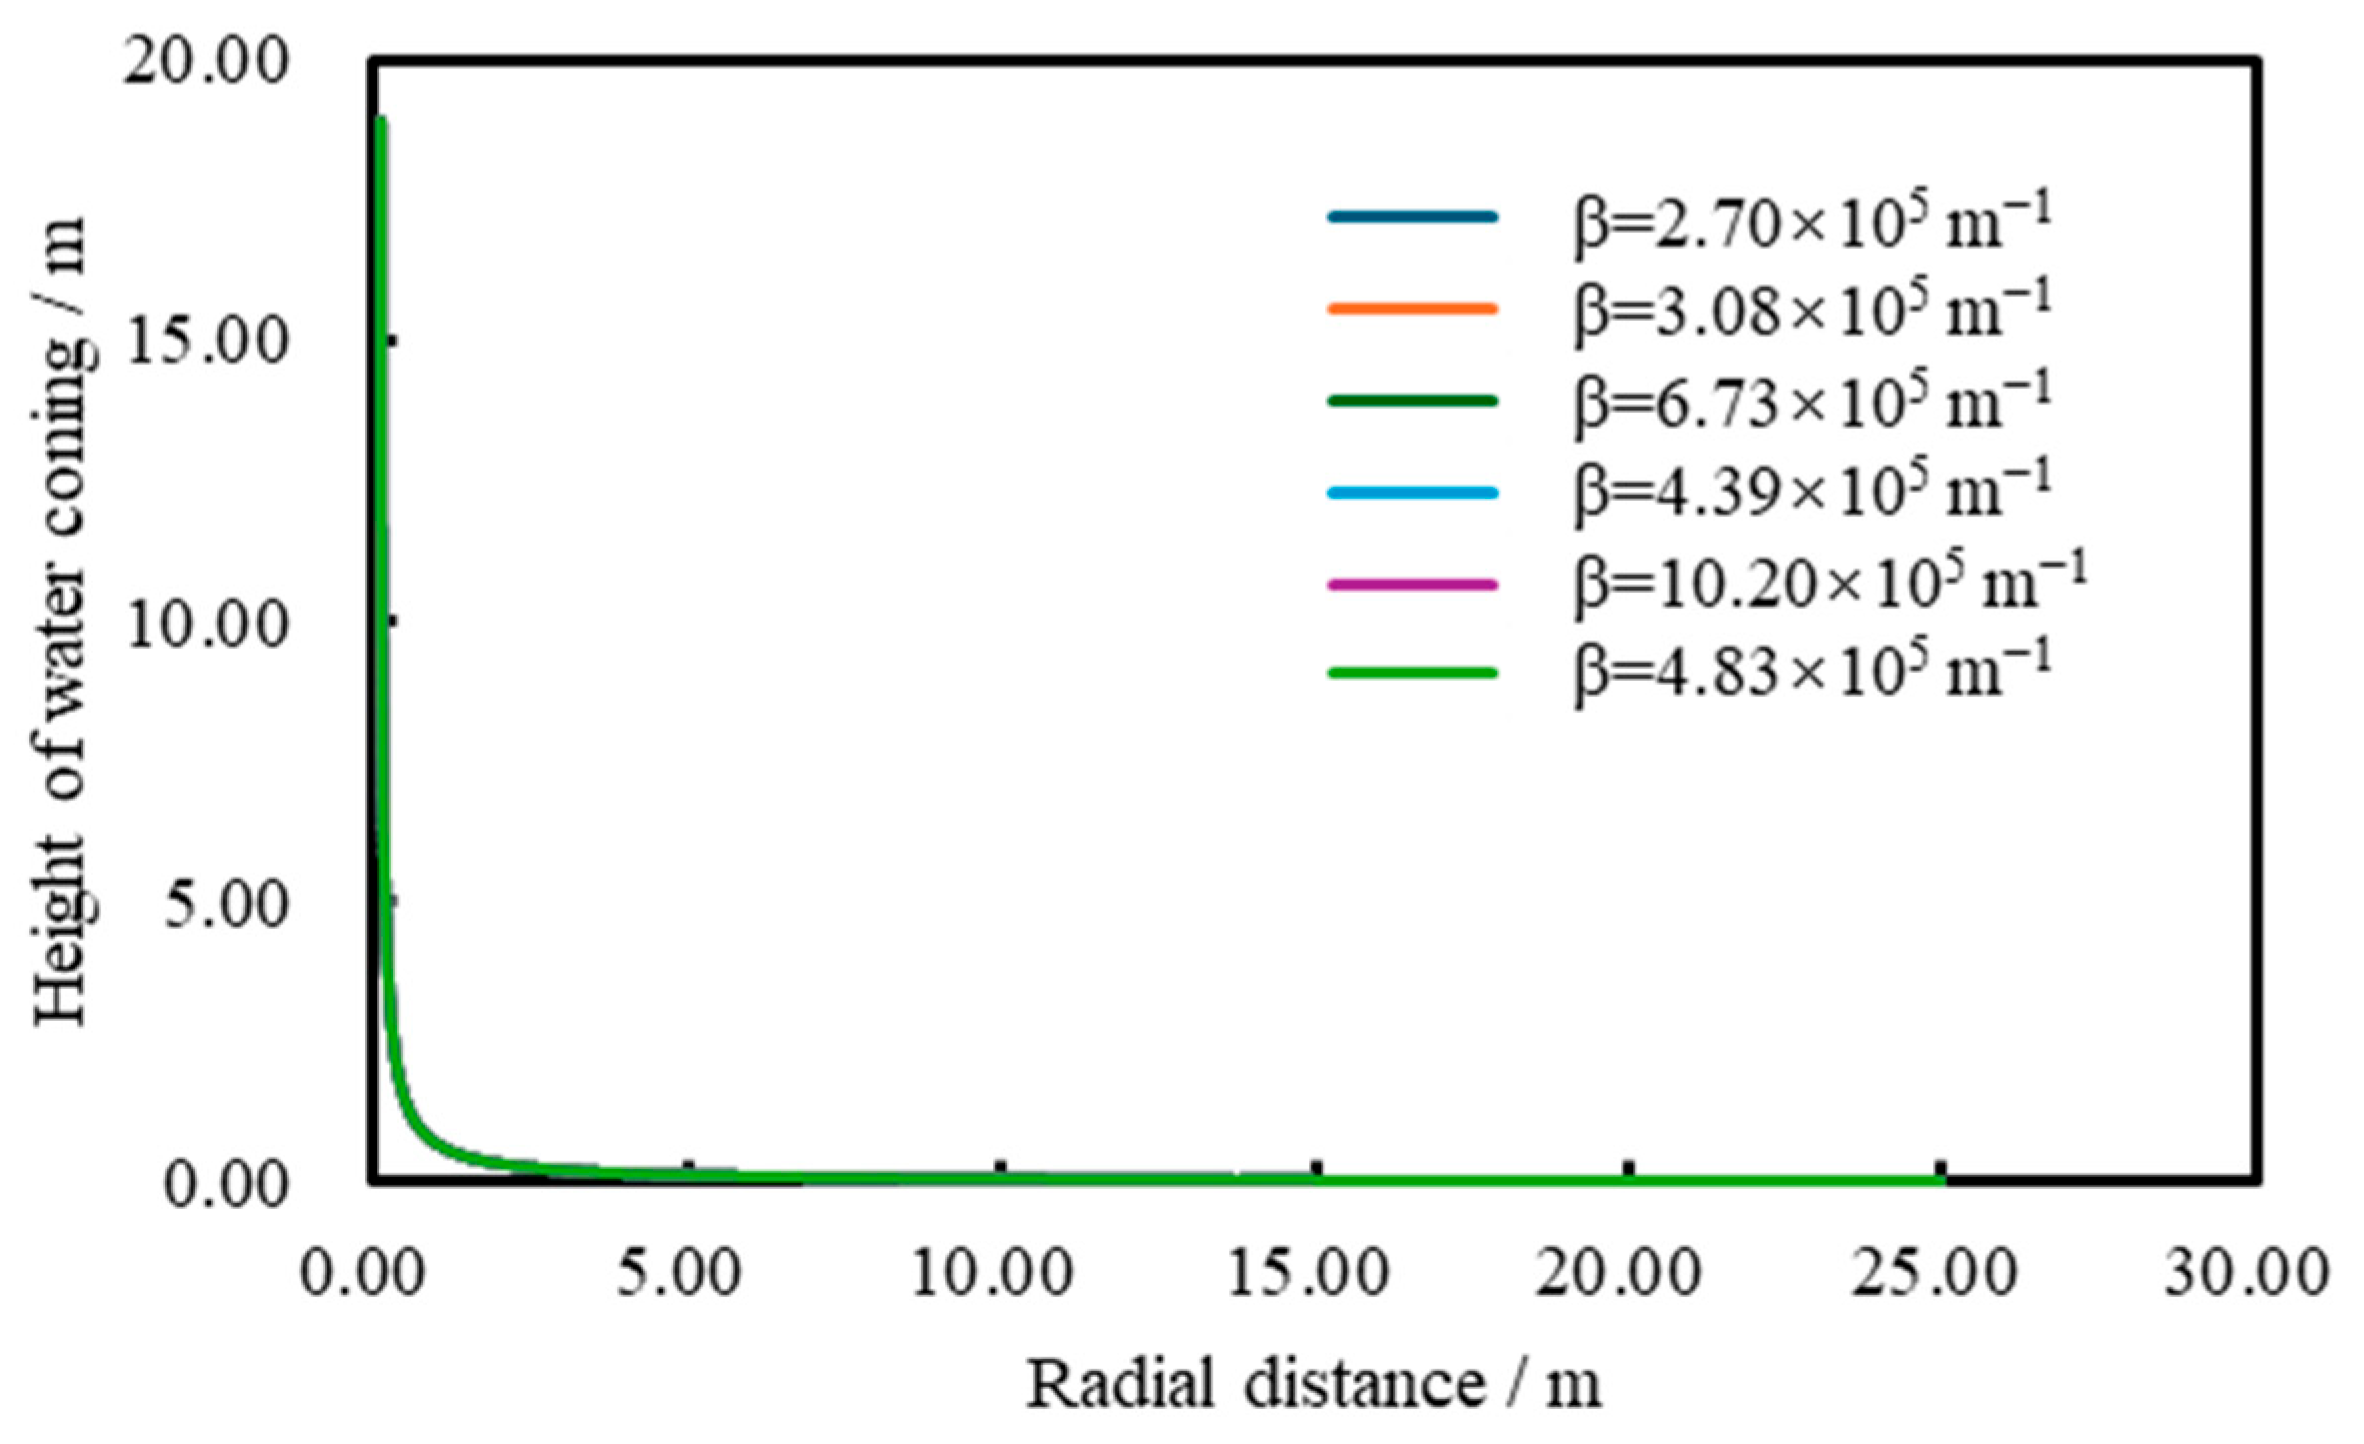
Based on the literature review and the derivation process in Section 3, it is found that there are numerical differences in the non-Darcy coefficient β calculated using different empirical formulas, with values typically spanning the range from 104~105 m−1. However, the comparison results shown in Figure 1 (Transition Zone) and Figure 2 (Core Zone) indicate that, despite different values for β, the final computed water-coning profiles overlap significantly. That is, for the same porosity–permeability parameters, the choice of the empirical formula for β has a negligible effect on the calculated water-coning profiles.
According to the derivation process in Chapter 3, in the near-well region of the core and transition zones, it can be seen from the equation that the pressure gradient is the interaction between β and v2, and that the fluid velocity v is inversely proportional to the radial distance r. Therefore, the pressure gradient can be considered as the interaction between β and 1/r2. As the radial distance approaches the wellbore radius rw, the increase in 1/r2 becomes the dominant factor, overshadowing the influence of β on the water-coning profile. To quantify this, a sensitivity analysis was conducted using the extreme values from Table 1. When the non-Darcy coefficient is varied by nearly four hundred percent, the calculated maximum cone height exhibits a relative variation of less than 4.5%, as shown in Figure 4 and Figure 5.
Figure 4.
Comparison of water-coning profiles in the transition zone.
Figure 5.
Comparison of water-coning profiles in the core zone.
Comparing the water-coning profiles of the core and the transition zones, as shown in Figure 4 and Figure 5, the water-coning curve in the core is much steeper. This is because, in the core, the viscous term is entirely neglected, and only the inertial term is considered. In this high-velocity flow state, the energy loss is mainly due to the dissipation of kinetic energy. To balance this significant flow pressure drop, the bottom water must rise to a higher level to maintain the potential energy balance. Therefore, the core exhibits an extremely steep “needle-shaped” water cone, which is highly prone to causing rapid water breakthrough in the well.
3.1.2. Analysis of the Regional Water-Coning Characteristics and Sensitivity Mechanism of β Based on Flow-State Transition
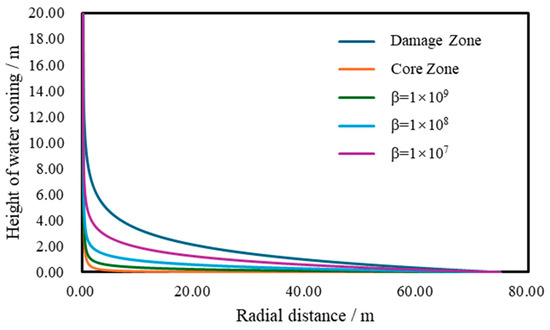
Under the same porosity and permeability conditions, only the β coefficient is varied to calculate the water-coning curve, while the porosity and permeability conditions remain unchanged. As shown in Figure 6, on a macroscopic level, the intensity of bottom-water coning is most severe in the core zone, followed by the transition zone, and weakest in the damage zone.
Figure 6.
Comparison of water-coning heights in the core zone, transition zone, and damage zone.
The damage zone follows Darcy’s law. Due to its distance from the wellbore and relatively low flow velocity, viscous resistance dominates, and energy dissipation is slower. Therefore, under the same production rate, the required production pressure difference is smaller, resulting in a water-coning profile that rises gradually, resembling the “funnel-shaped” water cone typical of conventional homogeneous sandstone reservoirs.
The core zone, on the other hand, follows high-speed non-Darcy behavior. In the near-well region, the dissipation of fluid kinetic energy increases sharply, and the nonlinear effects cause a significant local pressure drop. According to the gravity-pressure balance principle at the oil–water interface, this large pressure drop must be compensated by a higher water column, resulting in a highly destructive “needle-shaped” water cone in the core, with a coning height far exceeding that in the damage zone.
The transition zone lies between these two extreme flow states. It is influenced by both viscous and inertial forces, and its water-coning curve lies between those of the core and the damage zones, reflecting the intermediate process of flow-state transition from linear to nonlinear.
3.2. Field Application
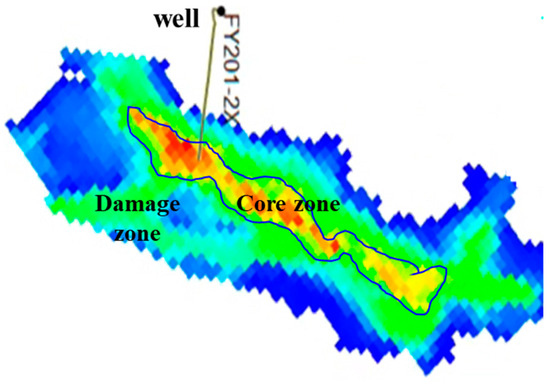
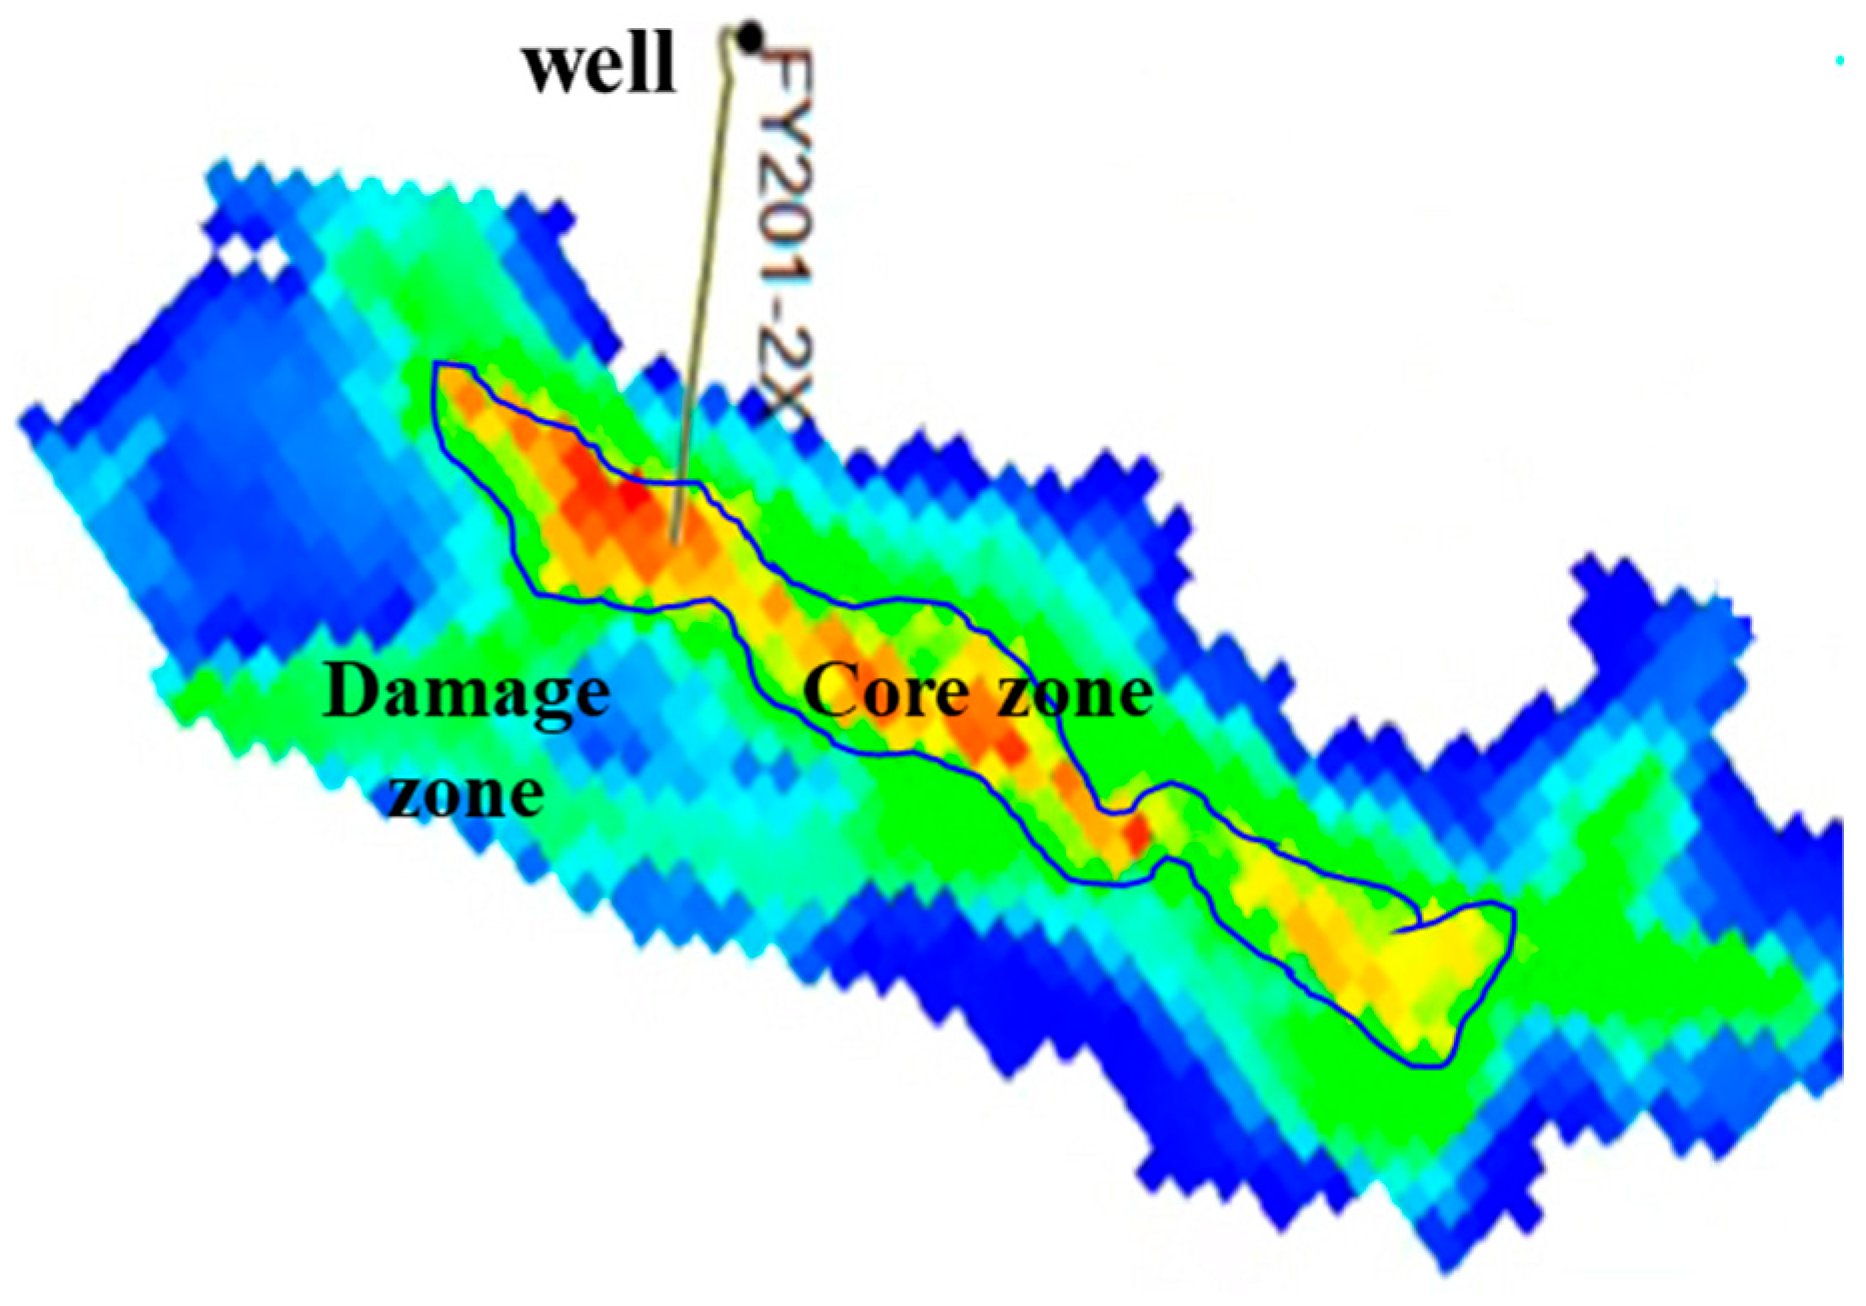
An example comes from the FY201-2X well in the Fuman Oilfield, where the block exhibits a typical core–zone structure. From the permeability horizontal projection map, it can be observed that the permeability in the core is the highest, and it gradually decreases from the core to the damage zone. To avoid arbitrary assignment, the regional boundaries of the core, transition, and damage zones were objectively delineated by applying specific permeability cutoffs to the property profile extracted along the horizontal well trajectory from the three-dimensional geological model. The parameters for calculating the water-coning curve are shown in Table 2.
Table 2.
Parameter values used for water-coning calculations in the core and the damage zones.
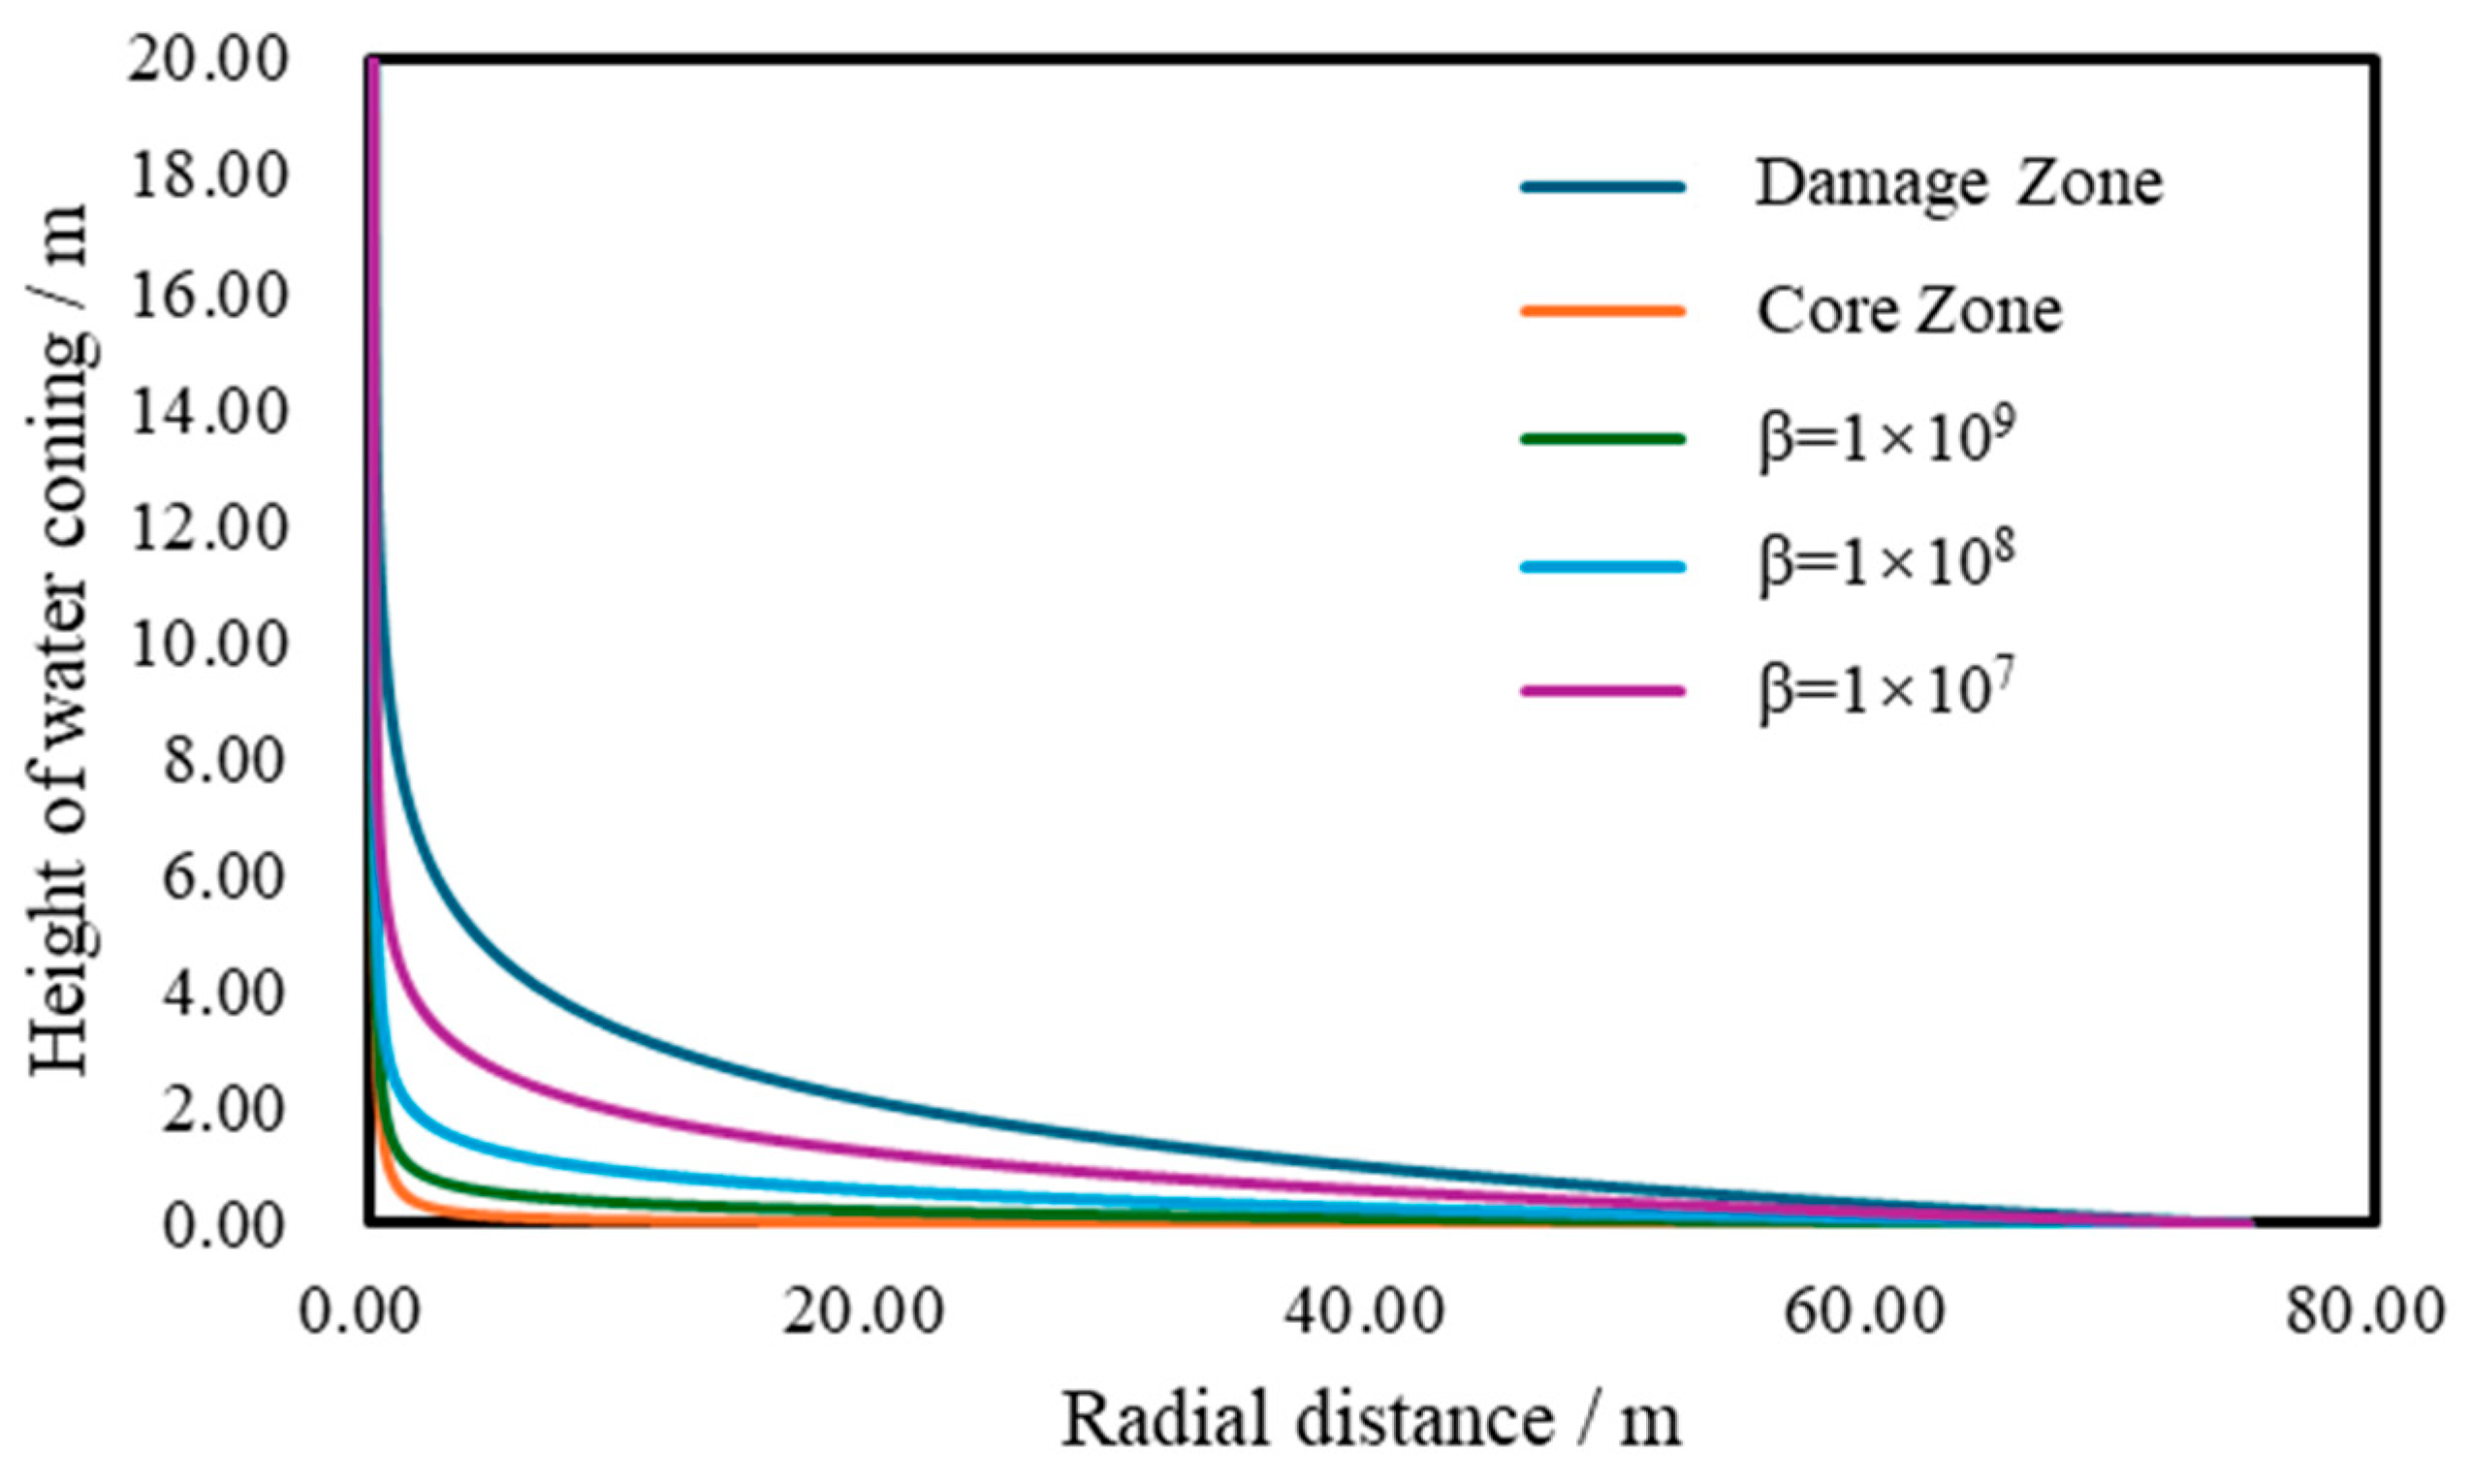
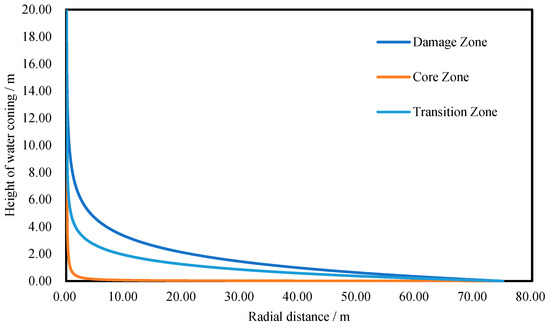
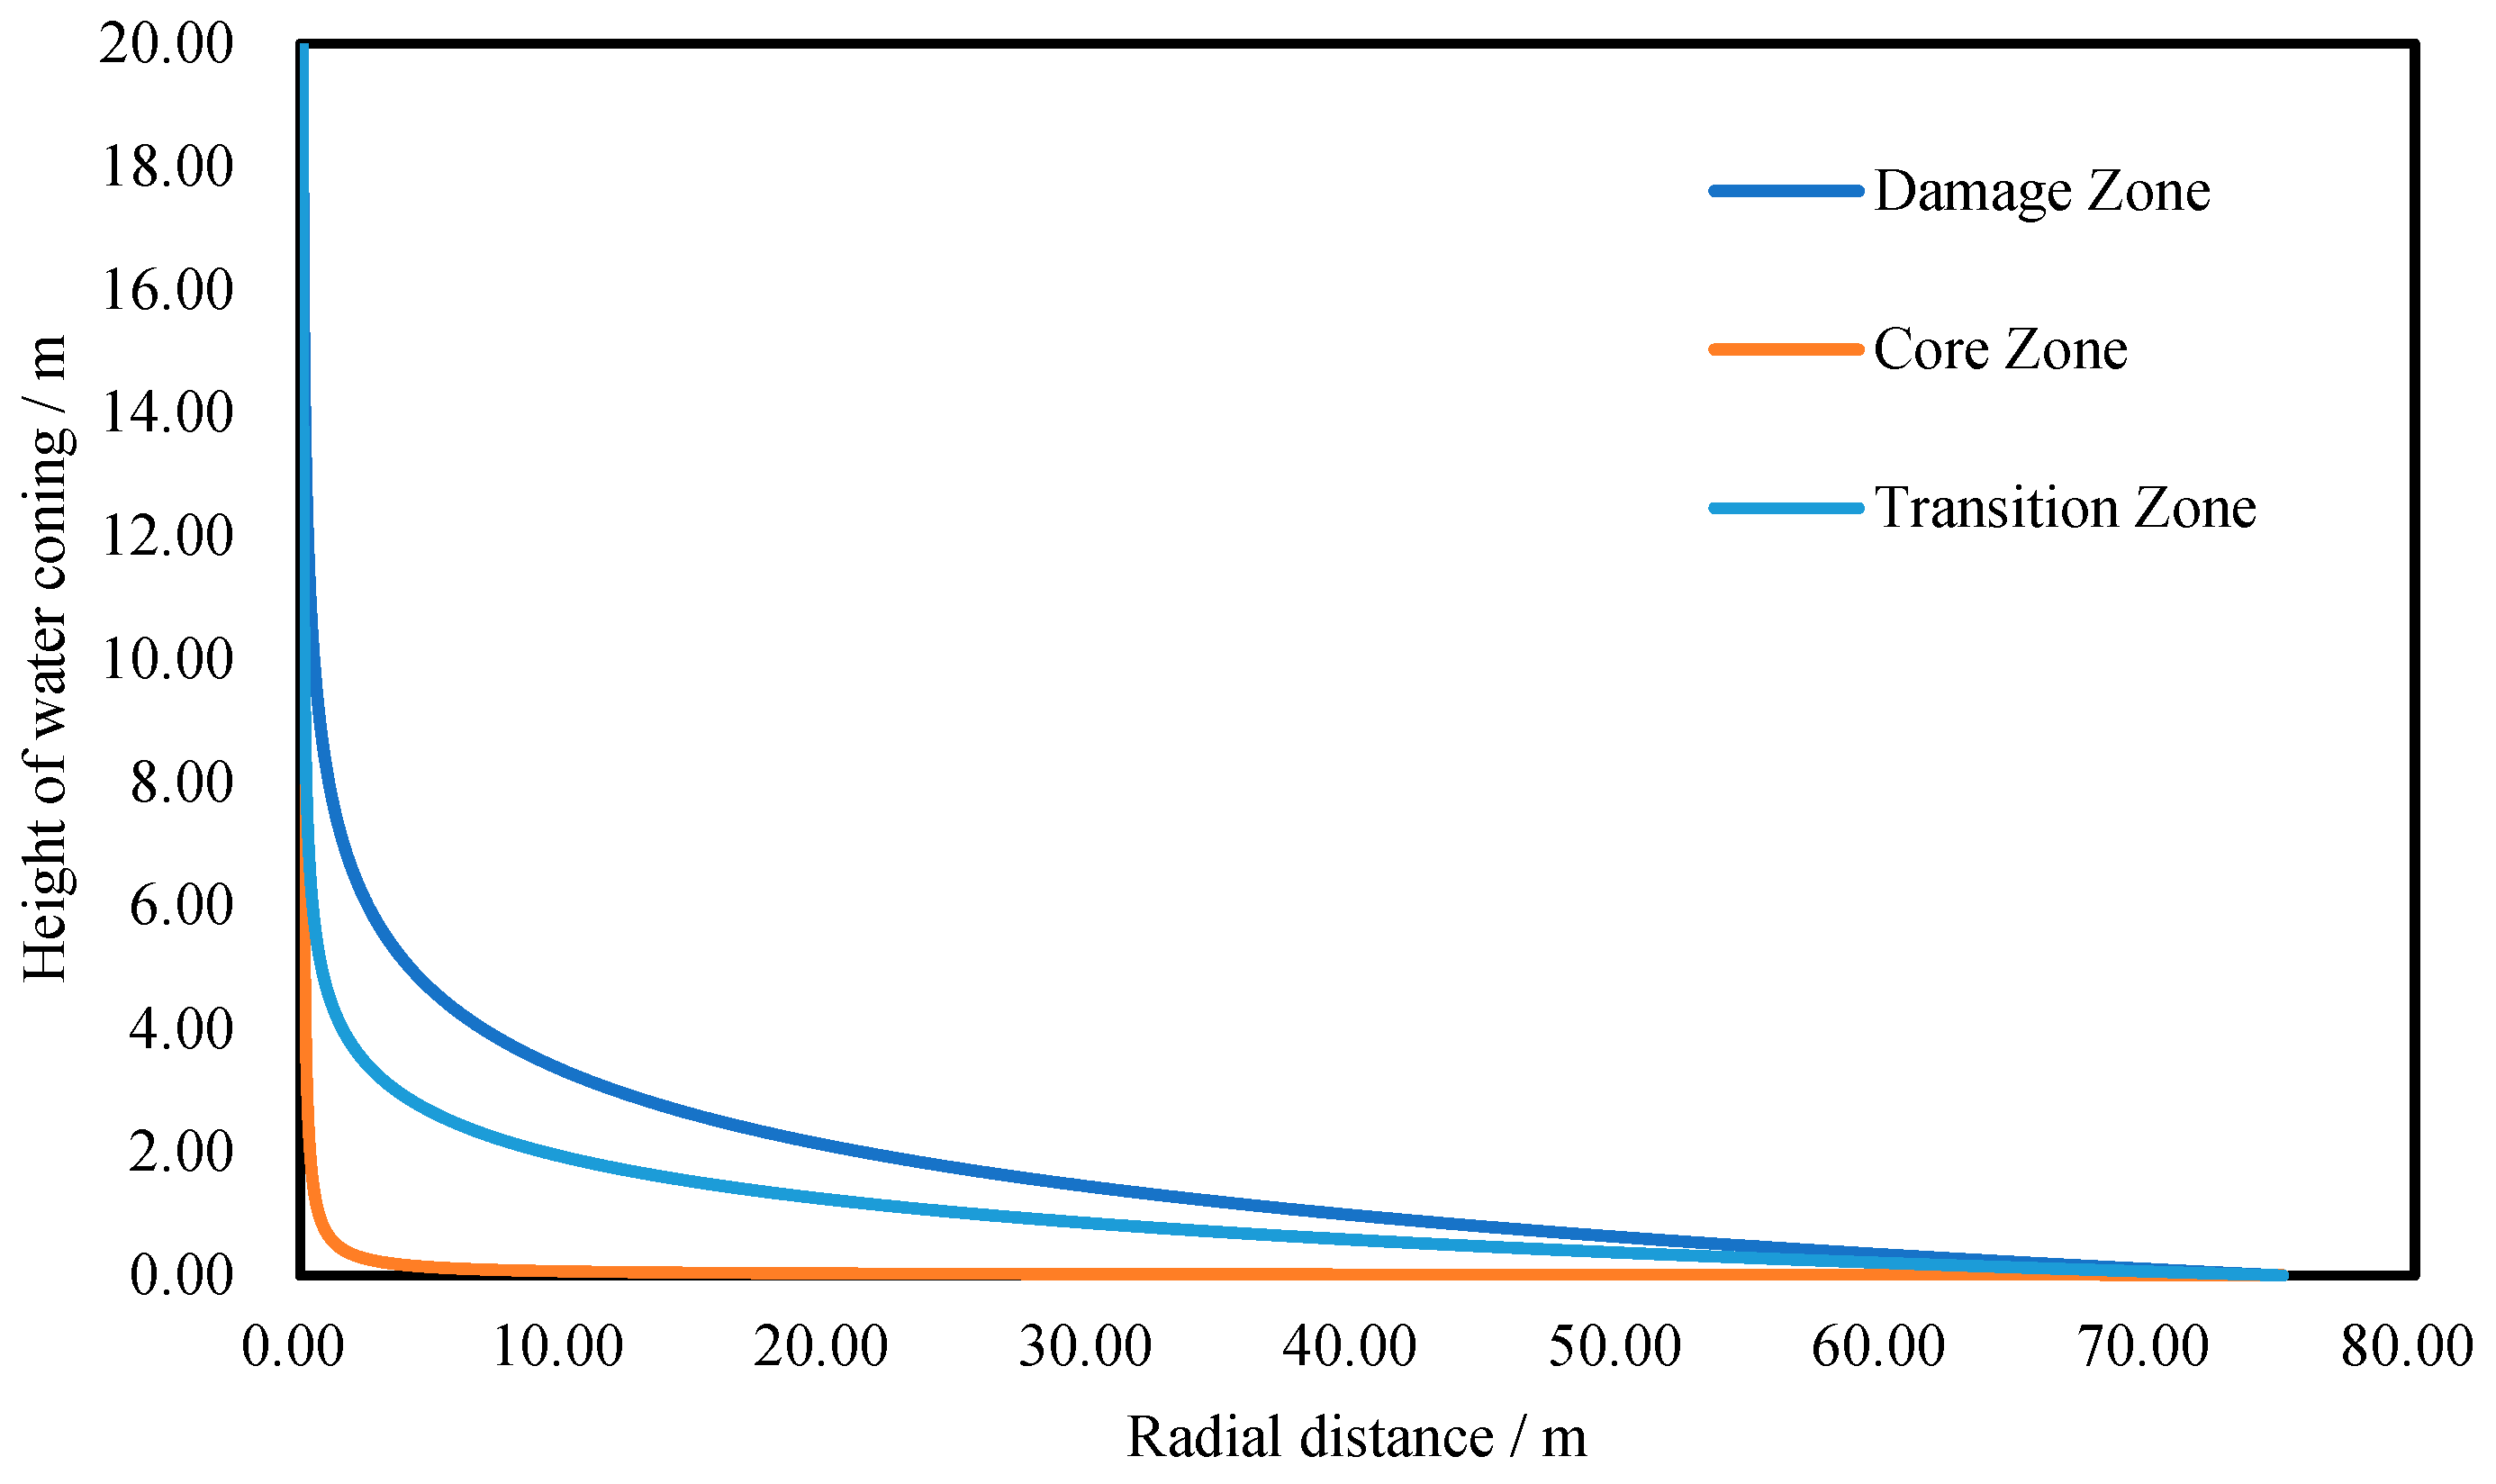
Because the core–damage structure in this block induces extremely strong porosity–permeability heterogeneity, the Janicek–Katz correlation was adopted to estimate the non-Darcy coefficient β. This correlation accounts for the combined effects of porosity and permeability and incorporates a power–law relationship between them; it is considered more reliable for high-permeability carbonate reservoirs on the order of 102~103 mD. In contrast, the Geertsma correlation is overly sensitive to porosity and may overpredict β by nearly two orders of magnitude when porosity is low. Furthermore, it should be noted that in the low-velocity damage zone, viscous forces completely dominate the flow. Therefore, the inertial term is excluded entirely in this region, rendering the application of any empirical correlation unnecessary. Using the Janicek–Katz correlation, β is estimated to be approximately 8.91 × 10⁶ m−1. The calculated critical production rates for the core zone, transition zone, and damage zone are 5.39 × 10⁻² m3/s, 2.39 × 10⁻⁴ m3/s, and 1.45 × 10⁻⁵ m3/s, respectively. It is crucial to clarify that these three values represent theoretically independent limits, assuming each zone is produced in isolation. In a unified horizontal wellbore where hydraulic communication enforces a nearly uniform pressure drawdown across all open sections, the total production is bottlenecked by the core zone based on the shortest stave principle. Once the unified drawdown reaches the critical limit of the core zone, a needle-like water cone will rapidly break through, forcing the transition and damage zones to operate strictly at subcritical rates. This physical reality underscores the severe inefficiency of conventional open-hole completions in core–damage architectures and theoretically justifies the deployment of inflow control devices to choke the core and balance the zonal drawdown. Figure 7 shows the corresponding water-coning profiles under these critical conditions.
Figure 7.
Three-dimensional geological model: horizontal projection of permeability.
As shown in Figure 8, although the core has very high permeability, high-rate production amplifies inertial effects and generates a large nonlinear pressure drop. To compensate for this localized drawdown, bottom water rises sharply in the core, forming a steep “needle-like” water cone. Under the same production pressure drawdown, the water-coning height in the core zone is significantly higher than that in the damage zone, implying that water breakthrough will occur first in the core and the water cut will increase abruptly thereafter. In the damage zone, flow follows linear Darcy behavior with low velocity and a mild pressure gradient; the resulting cone is broad and gentle, resembling a “funnel-shaped” profile. Before the bottom water in the core reaches the oil–water contact, the bottom water in the damage zone typically remains at a lower potential level. The transition zone exhibits intermediate behavior between these two extremes. Similar sensitivity of bottom-water behavior to geological and engineering parameters has also been reported in other strongly heterogeneous reservoirs [23].
Figure 8.
Comparison of water-coning profiles in the FY201-2X block.
4. Conclusions
This study proposes a zonal water-coning calculation framework for fault-controlled fractured–vuggy reservoirs characterized by a core–transition–damage zone architecture. Using the Forchheimer equation as a unified representation of non-Darcy flow, region-specific simplifications are introduced to reflect the dominant pressure-loss mechanism in each zone.
The results indicate clear zonal differences in coning morphology. The core and transition zones tend to exhibit steeper and sharper cones, whereas the damage zone shows a gentler funnel-like profile. Sensitivity analysis demonstrates that varying the non-Darcy coefficient by nearly four hundred percent results in less than a 4.5% difference in the critical production rate. A field example from the Fuman Oilfield reveals that the theoretical critical production rate of the core zone is three orders of magnitude higher than that of the damage zone. Under a unified wellbore pressure constraint, the entire horizontal well is bottlenecked by the core zone, which theoretically validates the necessity of deploying segmented completions and targeted water-control strategies.
Despite these insights, this analytical framework contains limitations. The model relies on static geological parameters and lacks dynamic production history matching. Additionally, utilizing weighted average properties simplifies the strong internal heterogeneity. In addition to prediction, recent studies have also begun to focus on numerical evaluation of coning-suppression strategies, including artificial barriers and water drainage [24]. Future research directions should prioritize coupling this steady-state model with transient flow simulations to capture the time-dependent evolution of the water front. Furthermore, incorporating stochastic uncertainty quantification techniques like Monte Carlo simulations will be crucial to assess the impact of parameter variability.
Author Contributions
Conceptualization, X.J. and Z.H.; methodology, Y.H.; validation, X.J. and Z.H.; formal analysis, C.X.; investigation, G.W.; resources, Y.H.; data curation, Y.H.; writing—original draft preparation, Y.H.; writing—review and editing, Y.H. and X.J.; supervision, Z.H.; project administration, X.Z. and T.Y. All authors have read and agreed to the published version of the manuscript.
Funding
This research was funded by PetroChina Tarim Oilfield Company under grant number 041024040028.
Data Availability Statement
The original contributions presented in the study are included in the article, further inquiries can be directed to the corresponding author.
Conflicts of Interest
Authors Xujian Jiang, Xingdong Zhao, Ting Yan, Chunyan Xiao and Guanglu Wei were employed by the Exploration and Development Research Institute, PetroChina Tarim Oilfield Company. The remaining authors declare that the research was conducted in the absence of any commercial or financial relationships that could be construed as a potential conflict of interest.
Nomenclature
| Symbol | Definition | Unit |
| h(r) | Water-cone height (interface uplift) at radial distance r | m |
| h1(r) | Water-cone height in the core zone | m |
| h2(r) | Water-cone height in the transition zone | m |
| h3(r) | Water-cone height in the damage zone | m |
| hp | The distance from the top of the reservoir to the wellbore | m |
| r | Radial distance from wellbore axis | m |
| rw | Wellbore radius | m |
| re | External boundary radius | m |
| p | Pressure | Pa |
| pres | Reservoir pressure | Pa |
| pwf | Flowing bottom-hole pressure (BHP) | Pa |
| Δp | Pressure drawdown | Pa |
| ρ | Fluid density (oil) | kg·m−3 |
| Δρ | Density difference | kg·m−3 |
| g | Gravitational acceleration | m·s−2 |
| K | Absolute permeability | μm2 |
| ϕ | Porosity | - |
| q1, q2, q3 | Zonal volumetric flow rate allocated to the core zone, transition zone and damage zone | m3·s−1 |
| β | Forchheimer non-Darcy coefficient | m−1 |
| L1, L2, L3 | Effective lengths of core/transition/damage sections | m |
References
- Chen, L.; Jiang, Z.; Sun, C.; Ma, B.; Su, Z.; Wan, X.; Han, J.; Wu, G. An Overview of the Differential Carbonate Reservoir Characteristic and Exploitation Challenge in the Tarim Basin (NW China). Energies 2023, 16, 5586. [Google Scholar] [CrossRef] [Scilit]
- Kargarpour, M.A. Carbonate Reservoir Characterization: An Integrated Approach. J. Pet. Explor. Prod. Technol. 2020, 10, 2655–2667. [Google Scholar] [CrossRef] [Scilit]
- Deng, X.; Chang, S.; Liu, Z.; Wang, M.; Chen, J.; Du, Y. Concept, Geological Model and Seismic Characterization of Ultra-Deep Fault-Fracture Bodies. Oil Geophys. Prospect. 2024, 59, 1099–1110. [Google Scholar]
- Chaperon, I. Theoretical Study of Coning Toward Horizontal and Vertical Wells in Anisotropic Formations: Subcritical and Critical Rates. In SPE Annual Technical Conference and Exhibition; SPE: Houston, TX, USA, 1986. [Google Scholar]
- Lu, Y.; Deng, Y.; Chen, G. Calculation Method of Critical Production Rate for Fractured-Vuggy Reservoir with Bottom Water. Lithol. Reserv. 2009, 21, 108–110+119. [Google Scholar]
- Lv, A.; Yao, J.; Wang, W. A Method for Determination of Water Coning Shape of Fractured-Vuggy Layered Reservoirs with Bottom Water. Xinjiang Pet. Geol. 2011, 32, 45–48. [Google Scholar]
- Cheng, X.; Yi, B.; Deng, Y.; Li, S.; Zhu, M. New Method for Calculation of Critical Production of Horizontal Well in Bottom Water Reservoir. Pet. Geol. 2011, 32, 60–62. [Google Scholar]
- Yuan, H.; Li, W.; Yuan, Y.; Luo, J.; Yan, W. Productivity Evaluation of Horizontal Well in Heterogeneous Reservoir with Composite Water Aquifer. J. Pet. Explor. Prod. Technol. 2021, 11, 1363–1373. [Google Scholar] [CrossRef] [Scilit]
- Matkivskyi, S.V. A review of studies on the phenomenon of bottom-water coning in oil and gas wells. Oil Gas Power Eng. 2025, 2, 114–126. [Google Scholar] [CrossRef] [Scilit]
- Chi, J. Water Cone Dynamic Prediction of Bottom Water Reservoir Considering Oil-Water Interface Dynamic Chance. Chem. Technol. Fuels Oils 2021, 57, 415–431. [Google Scholar] [CrossRef] [Scilit]
- Li, K.; Zhang, J.; Zhu, G.; Zhou, W.; Wang, K.; Liang, H. A New Method for Calculating the Characteristic Shape of the Water Ridge Under Horizontal Production Wells in Marine Sandstone Heavy Oil Reservoirs with Bottom Water. Chem. Technol. Fuels Oils 2021, 57, 690–697. [Google Scholar] [CrossRef] [Scilit]
- Jia, X.; Sun, Z.; Lei, G.; Yao, C. Model for Predicting Horizontal Well Transient Productivity in the Bottom-Water Reservoir with Finite Water Bodies. Energies 2023, 16, 1952. [Google Scholar] [CrossRef] [Scilit]
- Cai, J.; Chen, X.; Wu, D.; Chen, B.; Pan, Y. A New Method to Predict Water Breakthrough in Intelligent Completion Horizontal Well. Energy Fuels 2023, 37, 17438–17451. [Google Scholar] [CrossRef] [Scilit]
- Zhang, N.; An, Y.; Huo, R. Research on Production Performance Prediction Model of Horizontal Wells Completed with AICDs in Bottom Water Reservoirs. Energies 2023, 16, 2602. [Google Scholar] [CrossRef] [Scilit]
- An, Y.; Sun, Z.; Kang, Y.; Yang, G. A Fully Coupled Numerical Simulation Model for Bottom-Water Gas Reservoirs Integrating Horizontal Wellbore, ICD Screens, and Zonal Water Control: Development, Validation, and Optimization Strategies. Energies 2025, 18, 3607. [Google Scholar] [CrossRef] [Scilit]
- Cui, C.-X.; Chai, X.-L.; Liu, Y.-W.; Zhou, Z.-J.; Zhang, G.-Q.; Tian, L. Performance Evaluation of Multilateral Horizontal Wells on Flow Characteristics and Recovery Efficiency Based on Coupled Model. Pet. Sci. 2026, 23, 818–835. [Google Scholar] [CrossRef] [Scilit]
- Zhang, W.; Zhang, L.; Liu, R.; Zheng, K. Prediction Method of Water Breakthrough Time of Gas Wells in Bottom Water Gas Reservoir Considering the Influence of Water Gravity. In Proceedings of the International Field Exploration and Development Conference 2022; Lin, J., Ed.; Springer Series in Geomechanics and Geoengineering; Springer Nature: Singapore, 2023; pp. 2021–2030. [Google Scholar]
- Zhang, T.; Zhou, H.; Zhang, L.; Zhao, Y.; Huang, S.; Zhang, M.; Zhu, L.; Zhang, R. Pore-Scale Investigation of Bottom Water Invasion Dynamics in Carbonate Gas Reservoirs with Different Interlayer Distributions. Nat. Gas Ind. B 2024, 11, 140–153. [Google Scholar] [CrossRef] [Scilit]
- Zhao, H.; Chang, S.; Wang, P.; Chen, J. Geological Model of Internal Structure and Seismic Characterization Methods for Fault Zone 17 in the Fuman Oilfield. In Proceedings of the 2025 International Petroleum and Petrochemical Technology Conference; Research Institute of Exploration and Development, PetroChina Tarim Oilfield Company: Korla, China; PetroChina Hangzhou Research Institute of Geology: Hangzhou, China, 2025; pp. 193–204. [Google Scholar]
- Zhang, L.; Zhu, S.; Wang, K. A Mathematic Model for Non-Darcy Flow at High Flow Rate. Xinjiang Pet. Geol. 2004, 25, 165–167+176. [Google Scholar]
- Zhao, Y.; Zhu, G.; Zhang, C.; Liu, S.; Elsworth, D.; Zhang, T. Pore-Scale Reconstruction and Simulation of Non-Darcy Flow in Synthetic Porous Rocks. J. Geophys. Res. Solid Earth 2018, 123, 2770–2786. [Google Scholar] [CrossRef] [Scilit]
- Ma, Y.; Liu, B.; Liu, X.; Wu, C.; Pei, S.; Chen, Y.; Xiu, J. Water Invasion Prediction Method for Edge–Bottom Water Reservoirs: A Case Study in an Oilfield in Xinjiang, China. Processes 2023, 11, 919. [Google Scholar] [CrossRef] [Scilit]
- Li, X.; Yang, L.; Dai, X.; Song, J.; Gu, K.; Zhang, L.; Wang, L.; Sun, Y. Geological and Engineering Effects on Bottom Water Flow in Volcanic Reservoirs. Processes 2025, 13, 3334. [Google Scholar] [CrossRef] [Scilit]
- Zhang, Y.; Yang, L.; Xu, N.; Zhang, J.; Song, X. Numerical Simulation of Bottom-Water Coning Suppression by Artificial Barriers and Water Drainage. Processes 2025, 14, 116. [Google Scholar] [CrossRef] [Scilit]

Disclaimer/Publisher’s Note: The statements, opinions and data contained in all publications are solely those of the individual author(s) and contributor(s) and not of MDPI and/or the editor(s). MDPI and/or the editor(s) disclaim responsibility for any injury to people or property resulting from any ideas, methods, instructions or products referred to in the content. |
© 2026 by the authors. Licensee MDPI, Basel, Switzerland. This article is an open access article distributed under the terms and conditions of the Creative Commons Attribution (CC BY) license.