


Abstract
Tight oil resources are a critical component of China’s energy strategy, with significant potential in basins such as the Songliao Basin, particularly within the Fuyu oil layer. However, tight sandstone reservoirs, characterized by low porosity and permeability, present substantial challenges for exploration and development. Accurate reservoir classification and characterization are therefore essential for optimizing exploration efforts and resource management. This study investigates the characterization and classification of tight sandstone reservoirs in the Fuyu oil layer of the Songliao Basin, focusing on their impact on crude oil flow behavior. The research employs a variety of experimental methods, including high-pressure mercury intrusion (HPMI), nuclear magnetic resonance (NMR), and centrifugation tests, to analyze pore characteristics, fluid mobility, and reservoir physical properties. A unified classification framework is proposed, which integrates geological, petrophysical, and fluid flow perspectives. The reservoirs are categorized into four types based on porosity, permeability, and mercury intrusion curve characteristics. This classification provides valuable insights into reservoir quality, thereby aiding exploration and development decisions for tight oil resources in the Songliao Basin.
1. Introduction
Tight oil resources in China are widely distributed across several large sedimentary basins, including the Triassic Yanchang Formation in the Ordos Basin, the Permian Lucaogou Formation in the Junggar Basin, the Middle–Lower Jurassic strata in the Sichuan Basin, and the Qingshankou and Quantou formations in the Songliao Basin [1,2,3]. Among these, the Fuyu and Gaotaizi tight oil reservoirs developed in the northern part of the Songliao Basin are characterized by extensive distribution and substantial resource potential and have become key target zones for energy replacement in the Daqing Oilfield [4].
Compared with marine tight oil reservoirs in the United States, China’s tight oil resources are mainly hosted in continental shale formations and low-permeability sandstone reservoirs [5]. These reservoirs exhibit complex basin sedimentary systems, diverse diagenetic processes, multi-phase tectonic evolution, and generally low porosity and permeability—all of which impose significant constraints on the exploration and efficient development of tight oil [6,7].
As a key aspect of tight oil exploration and development, tight sandstone reservoir characterization and evaluation play a crucial role in identifying “sweet spots”, determining exploration priorities, and estimating resource potential [8,9]. The accuracy of reservoir classification directly affects the scientific soundness of target selection and the reliability of resource assessment. Reservoir classification and grading evaluation provide a framework for establishing classification criteria through systematic analysis of reservoir storage capacity and seepage characteristics. Existing reservoir grading systems can generally be divided into three main categories: (1) Petrophysical facies method. Proposed and refined by many scholars, this approach evaluates reservoir quality from the perspective of sedimentary–diagenetic evolution. However, it lacks a unified set of quantitative evaluation criteria [10,11]. (2) Multi-parameter comprehensive evaluation method. This method focuses on selecting key parameters and establishing classification standards. Although it effectively distinguishes reservoir quality differences, regional variability in parameter selection often results in limited comparability of evaluation results across different blocks [12]. (3) Pore–throat structure-based classification method [13]. For instance, Wang et al. [14], Wang Yongshi et al. [15], and Lu Shuangfang et al. [16] analyzed pore–throat structures in detail, optimized key experimental parameters, and developed systematic classification criteria for tight reservoirs.
Although numerous studies have explored reservoir classification and grading, significant differences in storage capacity and flow behavior are still observed among different blocks due to the heterogeneity of regional geological settings [17,18,19,20]. The Fuyu reservoir is a representative example, characterized by the coexistence of conventional and tight oil, with hydrocarbon accumulation primarily controlled by reservoir physical properties. Its spatial distribution exhibits a distinctive “source–reservoir integration” pattern [21]. However, strong heterogeneity caused by complex diagenetic processes leads to wide variations in macroscopic physical properties, microscopic pore–throat structures, and fluid flow behavior.
Therefore, establishing a unified and quantitative reservoir classification system requires integrating geological, petrophysical, and fluid flow perspectives. Simply combining the boundary values derived from different evaluation methods—without fully considering the geological implications behind each parameter—may yield misleading conclusions. This study focuses on the Fuyu oil layer in the fourth member of the Quantou Formation in the Songliao Basin. A comprehensive suite of analytical techniques—including porosity–permeability testing, scanning electron microscopy (SEM), NMR, multiphase displacement, and oil–water relative permeability experiments—was employed to investigate the physical properties and pore structures of tight sandstone reservoirs. Furthermore, the mobility and seepage characteristics of reservoir fluids were quantitatively analyzed. Based on the integration of rock physical properties and fluid mobility, a classification and grading framework was established for the Fuyu reservoir, providing a scientific basis and practical guidance for tight oil development in the Songliao Basin.
2. Geological Overview
From bottom to top, the stratigraphic succession in the northern Songliao Basin comprises the basement, Upper Jurassic, Cretaceous, Neogene, and Quaternary strata. During the late sedimentary stage of the Quantou Formation and the early sedimentary stage of the Qingshankou Formation, large quantities of dark mudstone of semi-deep to deep lake facies were deposited, forming high-quality source rocks [22]. Together with the fourth member of the lower Quantou Formation, these constitute a typical “source-over-reservoir” lithologic petroleum system. The present study focuses on the Fuyu oil layer within the Quansi section of the Lower Cretaceous [23].
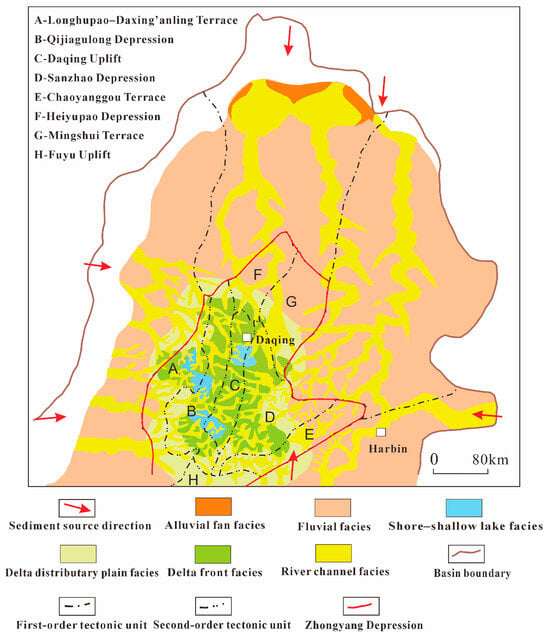
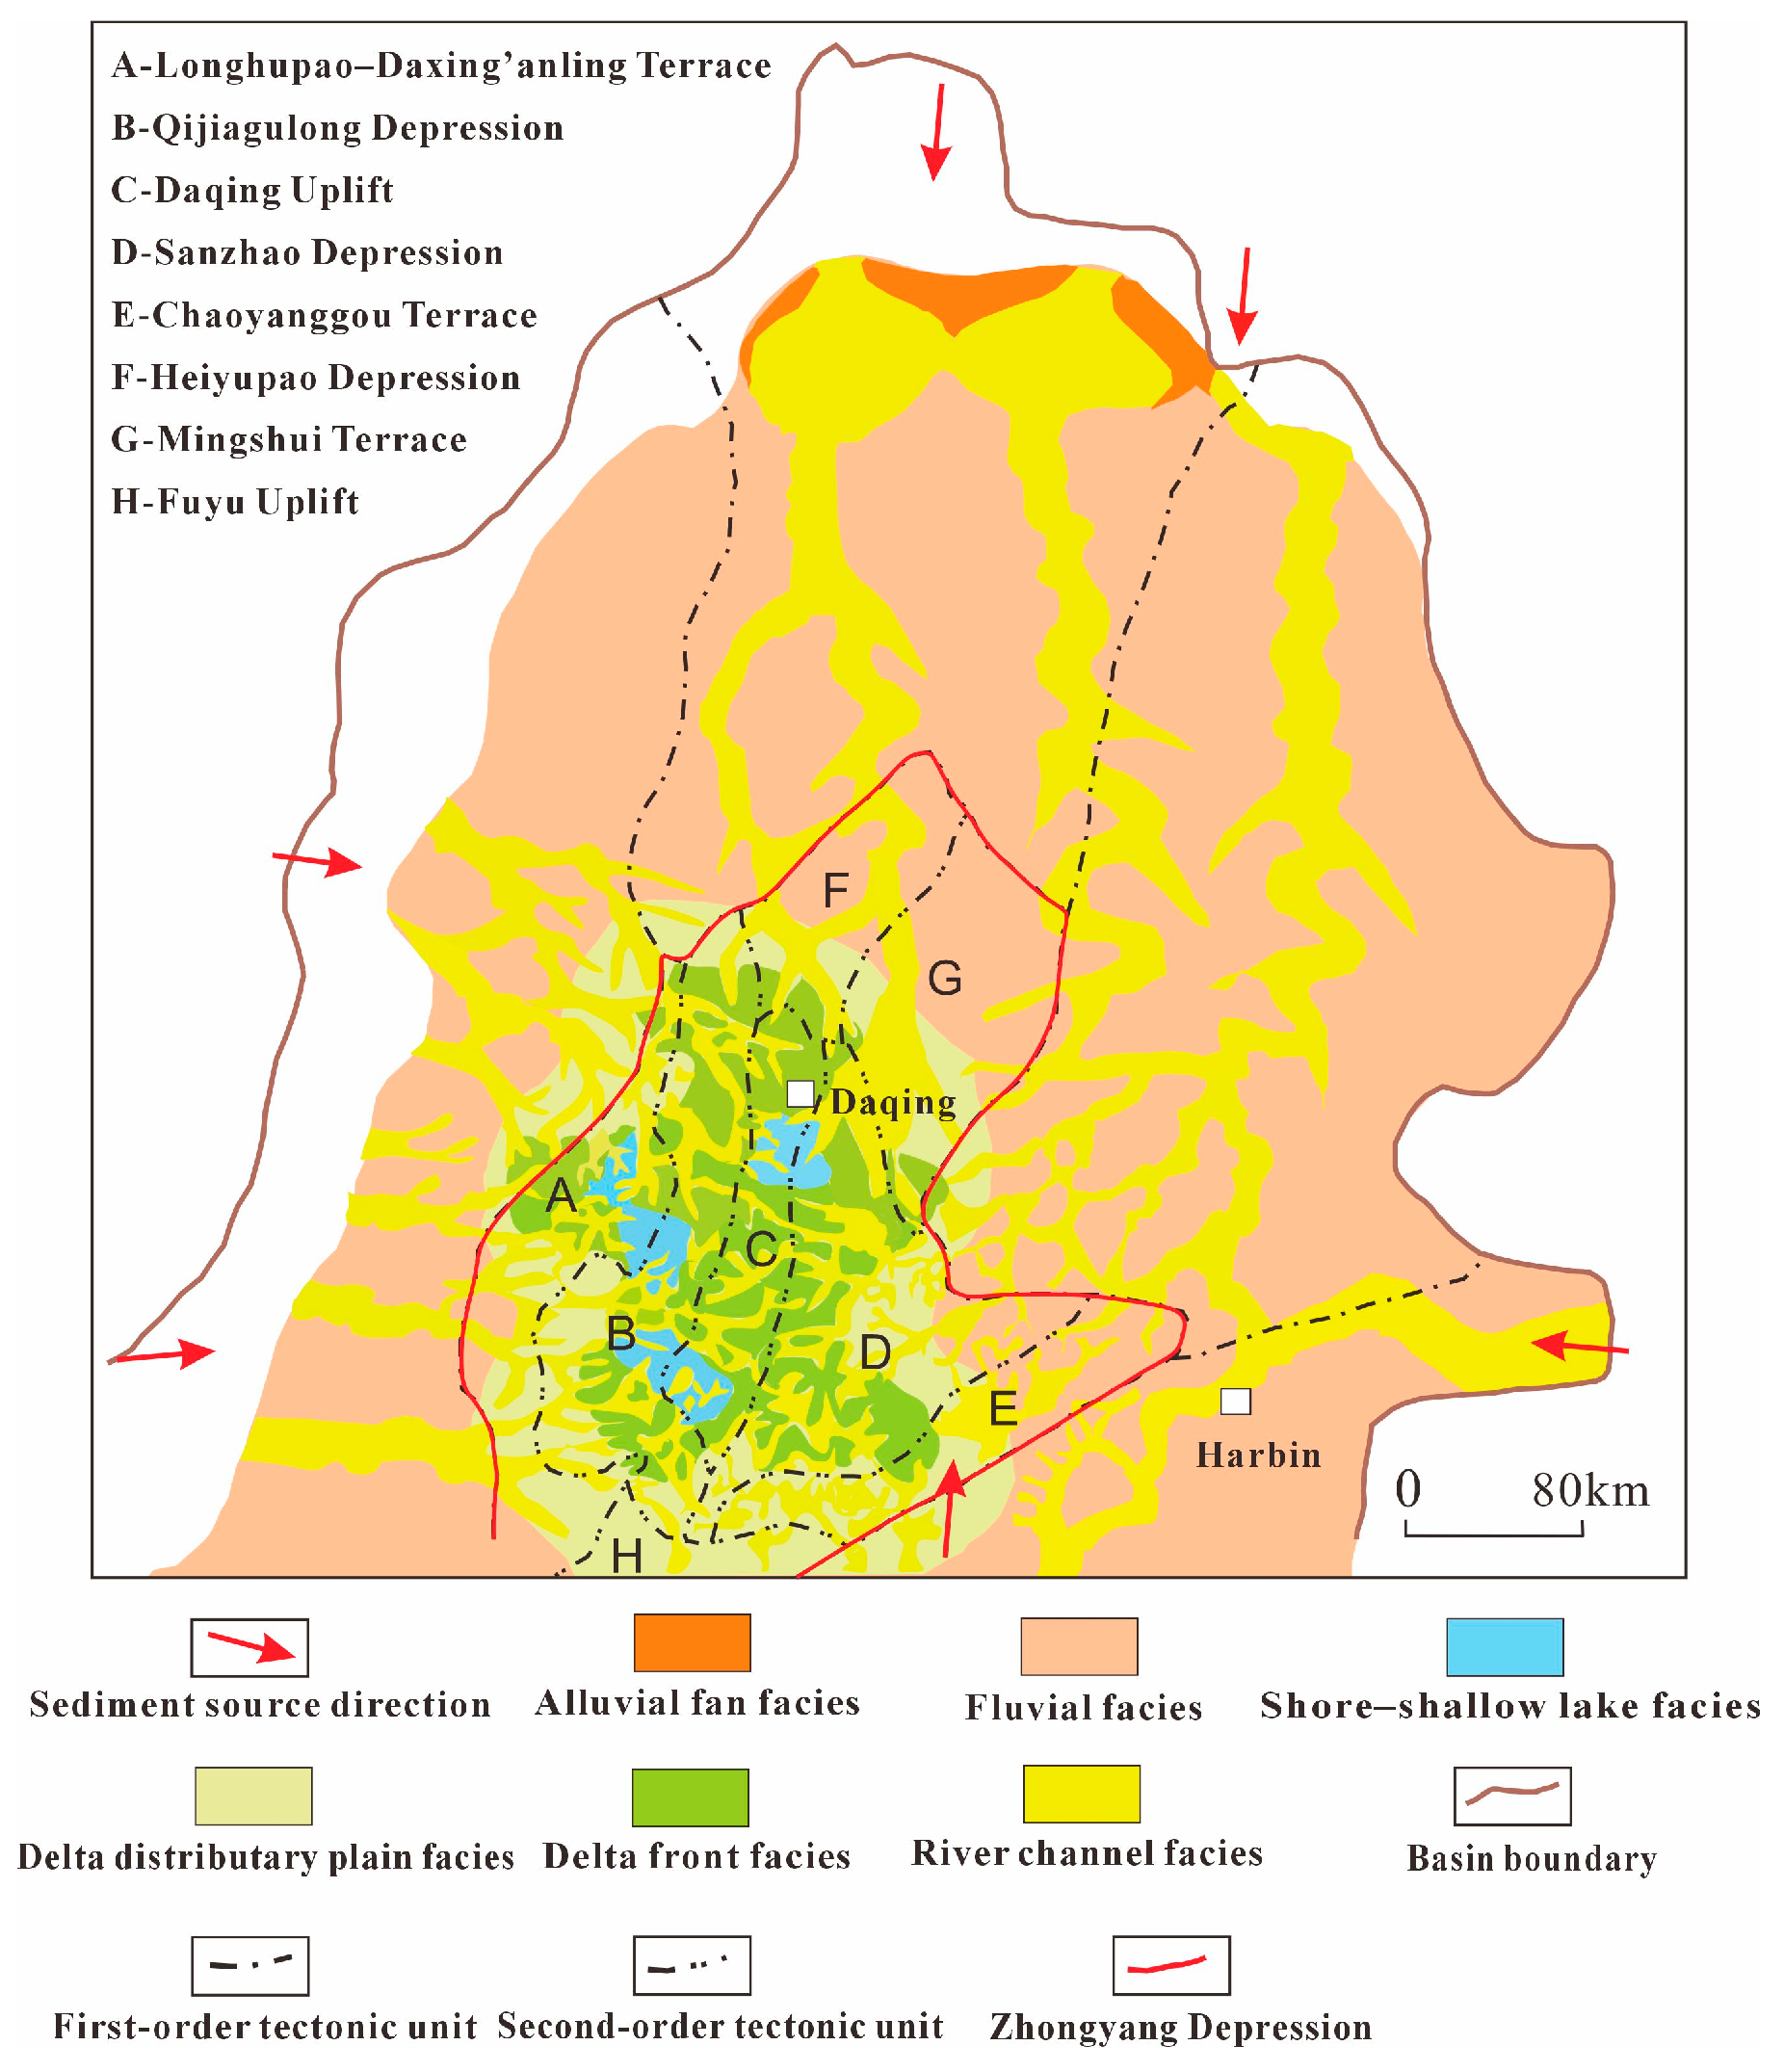
During the deposition of the Fuyu oil layer, the Songliao Basin was in the thermal subsidence stage. At this time, extensive fluvial systems developed along the basin margins [24] (Figure 1). Controlled by provenance systems from multiple directions, the depositional environment evolved from fluvial facies to shallow lacustrine delta facies. In the early stage, deposition was dominated by fluvial facies with only a few small shallow-lake basins. In the middle stage, fluvial facies still predominated, but the lake area expanded, forming a larger lacustrine basin in the Gulong area. In the late stage, a unified lacustrine basin developed across the basin, accompanied by the widespread development of shallow-water delta systems. Overall, the Fuyu oil layer hosts a large-scale fluvial–shallow lacustrine delta depositional system [25].
Figure 1.
Sedimentary facies distribution of the Fuyu oil layer (modified from Wang et al., 2023 [24]).
During the Quantou Formation, six major sediment provenance systems jointly influenced deposition, resulting in a transgressive depositional system overlying the Denglouku Formation. In the sedimentary stages of Members 1 and 2, basement fault activity within the basin controlled the formation of multiple subsidence centers. This led to an alternating distribution of shore–shallow lake facies and fluvial facies in the plan view [26,27]. In Members 3 and 4, channel sand bodies of fluvial facies and distributary-channel sand bodies of delta facies were widely developed. Vertically, these sand bodies exhibit multi-phase superposition; laterally, they occur as laterally continuous and interlaced belts. These characteristics resulted in the formation of extensive, high-quality sand bodies, constituting important tight reservoir intervals in the middle–shallow stratigraphic section of the northern Songliao Basin [28,29].
3. Samples and Methods
3.1. Samples
In this study, twelve core specimens were obtained from representative drill cores in wells located within the Zhongyang Depression of the Songliao Basin. Each specimen was drilled parallel to the bedding, with a diameter of 2.5 cm and a height of 6 cm. Prior to testing, residual oil was removed using a cleaning solvent composed of dichloromethane and methanol in a 93:7 ratio [30]. The cleaned samples were then dried in a constant-temperature oven at 60 °C for 48 h. Porosity measurements were subsequently conducted on the fully dried specimens using a Coretest Systems AP-608 automated permeameter–porosimeter (Coretest Systems Inc., Morgan Hill, CA, USA) with high-purity helium (99.99%). The porosity and permeability of all twelve samples are presented in Table 1.
Table 1.
Porosity and permeability of the 12 core samples.
3.2. Experimental Methods
- (1)
- Thin section observation
To identify pore types and sizes, a thin section was prepared by filling the evacuated pores of the sample with blue resin [31]. After the resin solidified, the samples were cut and polished. The composition of the rock particles, along with the pore structure and connectivity, was then analyzed using a Leica DM4500P polarizing microscope (Leica Microsystems, Wetzlar, Germany) [32,33].
- (2)
- High-pressure mercury intrusion analysis
HPMI testing involves injecting mercury into a porous medium at varying pressures using a mercury porosimeter. The relationship between injection pressure and pore radius during mercury intrusion follows the Washburn equation [34]. In this study, HPMI tests were conducted using an AutoPore IV 9510 porosimeter (Micromeritics Instrument Corporation, Norcross, GA, USA), generating pressurized intrusion curves with a maximum applied pressure of 200 MPa.
- (3)
- NMR-T2 measurements and centrifugation tests
NMR provides information on pore-size distribution by exploiting the interaction between the magnetic properties of hydrogen nuclei and an external magnetic field to obtain a T2 spectrum of water relaxation signals in rock pores, thereby revealing the pore structure [35]. In a homogeneous magnetic field, the transverse relaxation time T2 is expressed as
where is the T2 surface relaxivity, and is the pore-specific surface area. Introducing the shape factor , Equation (1) can be rewritten as
For a given rock sample, and can be considered approximately constant; thus, the T2 spectrum provides a direct representation of the pore radius distribution; thus, the T2 spectrum directly reflects the pore radius distribution, where long relaxation times correspond to larger pores and short relaxation times correspond to smaller pores.
The principle of the centrifugation test is to expel fluids from the core using centrifugal force generated at high rotational speeds. First, the rock samples were solvent-cleaned, dried, and re-saturated with prepared water, after which the initial NMR-T2 spectrum was recorded. The samples were then placed in a centrifuge at various rotational speeds, and the T2 spectrum was measured after each centrifugation step. The movable fluid saturation under a given centrifugal force was determined [36]. In this method, the centrifugal force can be considered analogous to capillary pressure, and the corresponding pore–throat radius can be calculated from:
where Pe is the capillary displacement pressure, MPa, l is the core length, cm, Re is the external rotation radius of the core, cm, is the density difference between the two immiscible fluids, g/mL, and n is the centrifuge rotational speed, r/min. The relationship between capillary pressure and pore–throat radius satisfies
where Pc is the capillary pressure, MPa, is the interfacial tension, θ is the contact angle between the two phases, and r is the pore–throat radius, μm. When the applied centrifugal force reaches a critical value, no additional fluid can be expelled; the expelled portion is classified as the movable fluid phase, while the remaining portion is the bound fluid phase. In this study, a centrifuge speed of 10,000 r/min was used, corresponding to an applied pressure of approximately 2.7 MPa. Based on mercury intrusion porosimetry experiment results, 6 representative samples were selected for centrifugation experiments. The oil used to saturate the cores in the experiment was crude oil collected from the Fuyu Formation in the Daqing Oilfield, with a density of 0.846 g/cm3.
- (4)
- Threshold pressure gradient experiment
To determine the threshold pressure gradient for crude oil flow, the flow-velocity/pressure-difference method was employed. First, the core sample was placed in the container and evacuated for 12 h. White oil was then pumped into the container and pressurized to 5 MPa for 24 h to ensure complete pore saturation. After saturation, the fully saturated core was transferred to a core holder, where a confining pressure of 20 MPa was applied using a confining pressure pump.
Once stabilized, white oil was injected at a constant pressure. After the fluid flow pressure and flow rate stabilized, pressure and flow rate were recorded. The pressure was then increased to inject crude oil into the core. Once steady-state flow was achieved at each pressure level, the corresponding flow rate, time, and pressure were recorded. This process continued until a complete flow curve was obtained, from which the threshold pressure gradient was determined. In this study, four representative samples were selected for threshold pressure gradient testing.
- (5)
- Two-phase relative permeability experiment
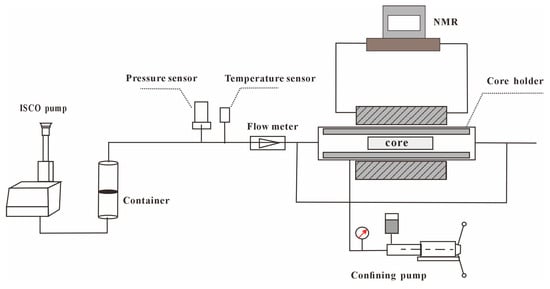
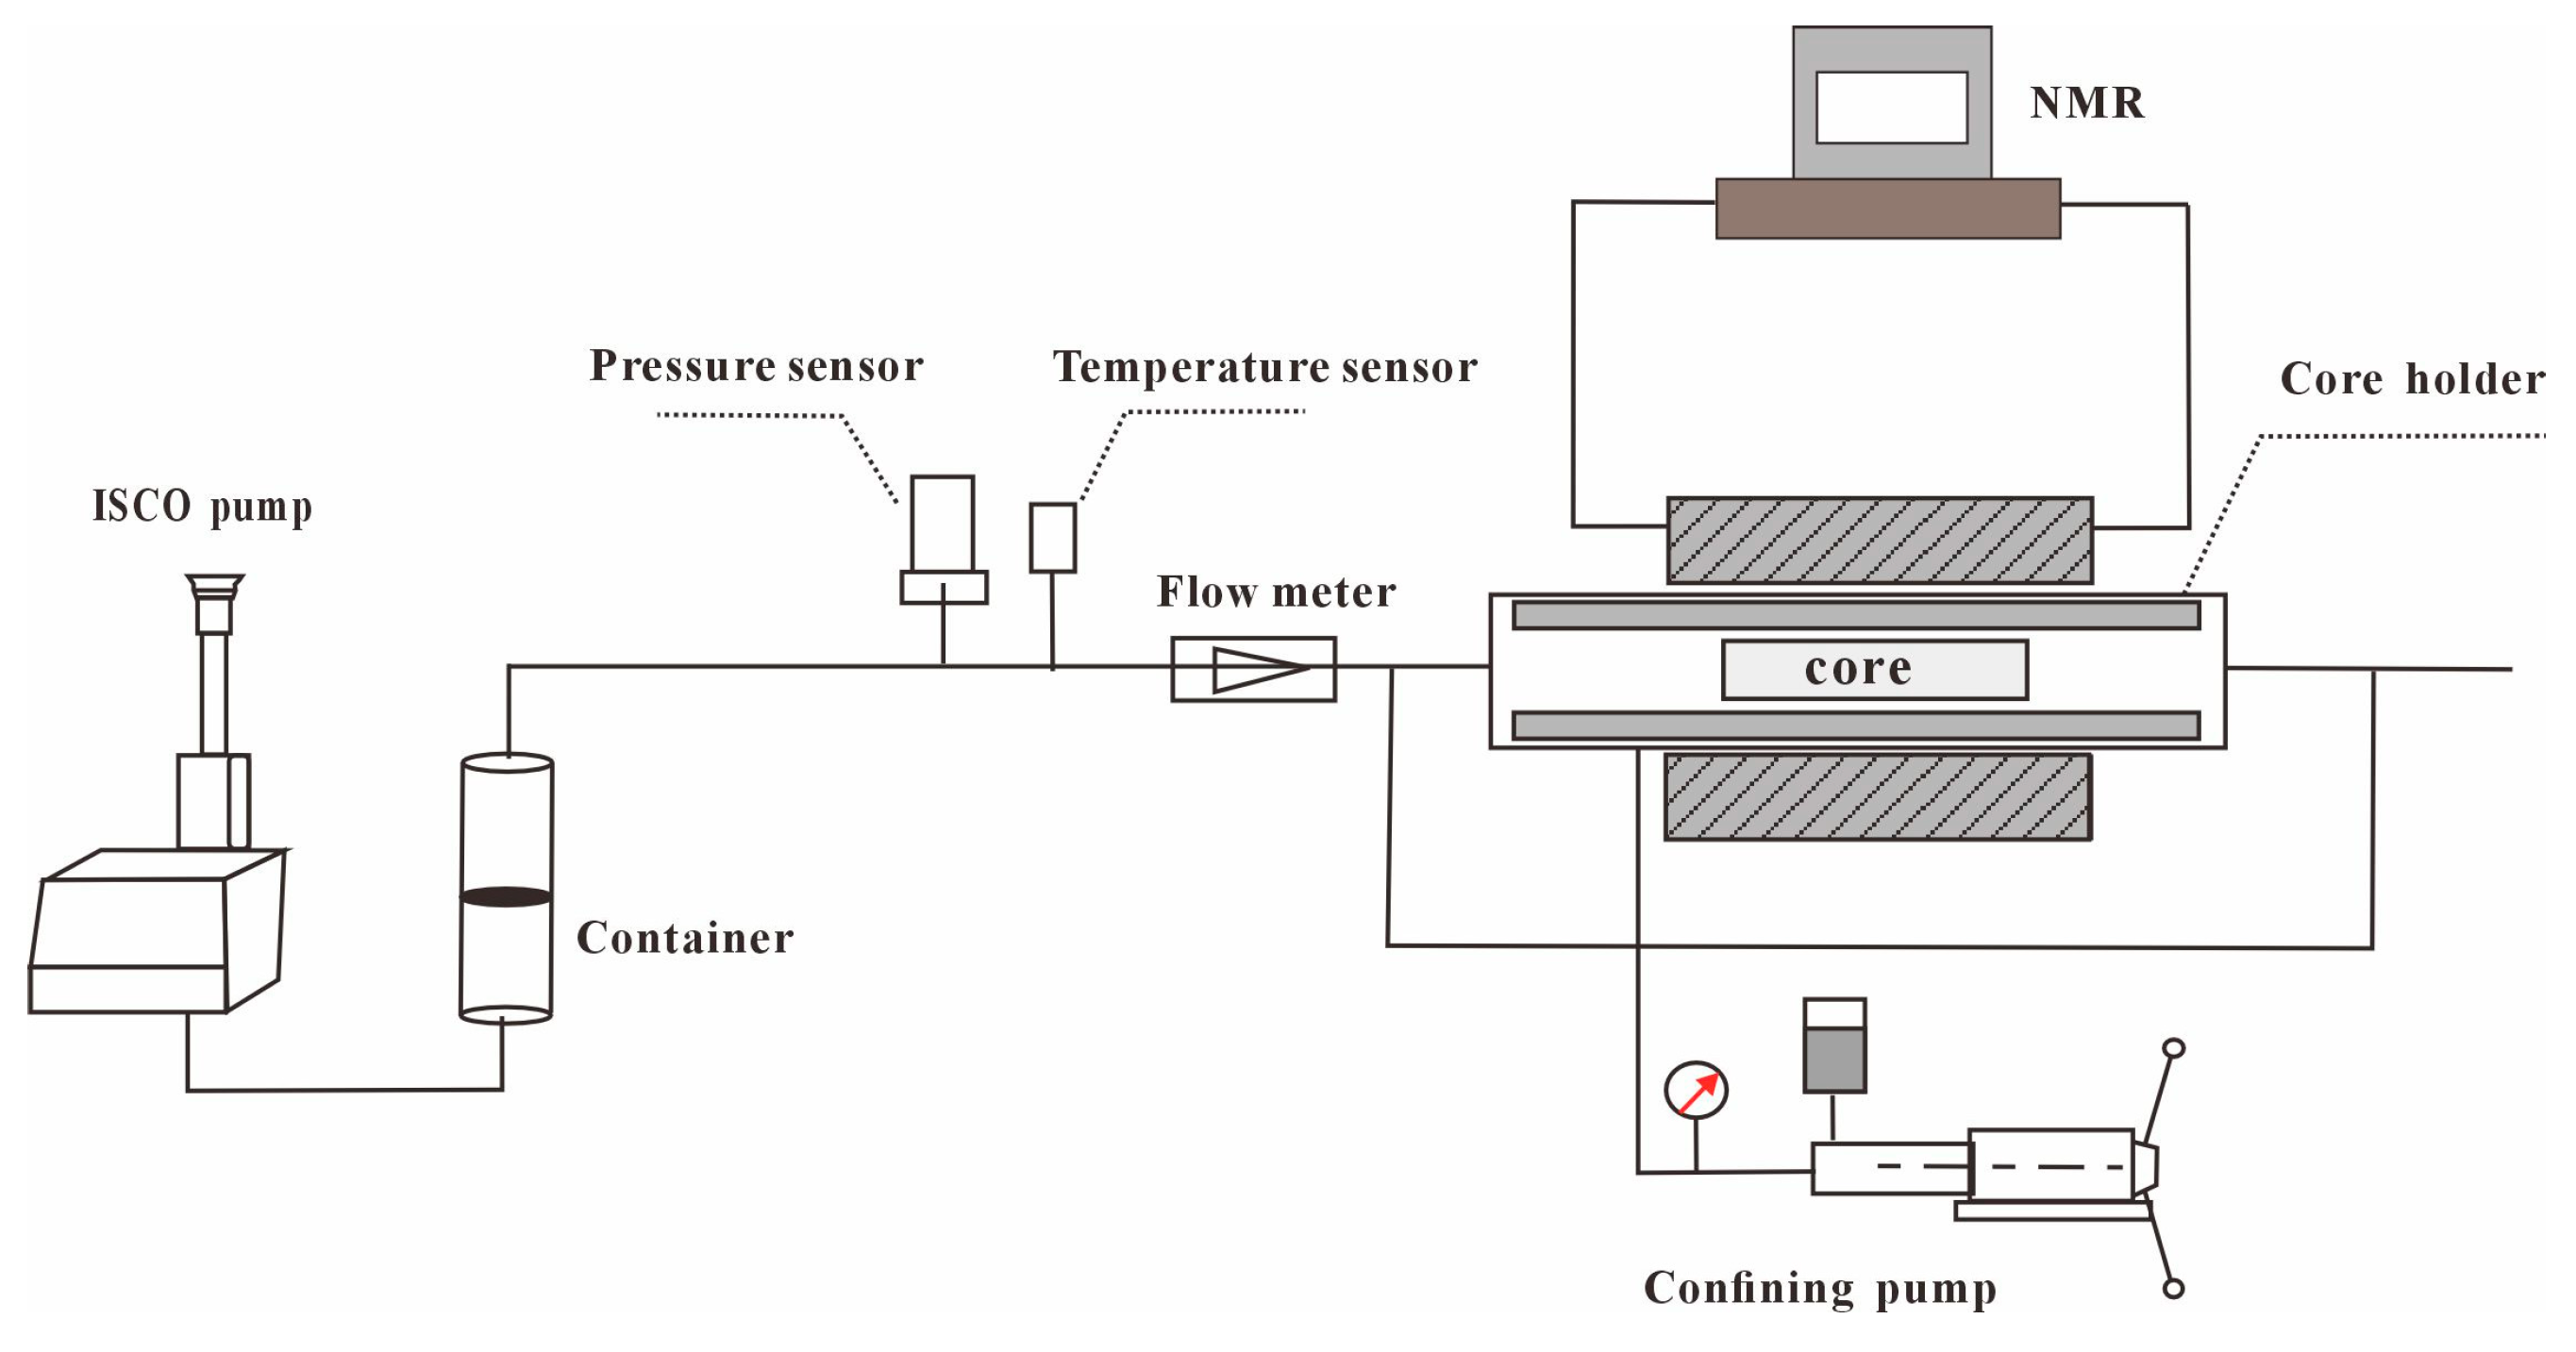
In this study, a self-constructed NMR-based setup and core samples were used for two-phase (water–oil) relative permeability measurements (Figure 2). To avoid interference from the water-phase NMR signal, deuterium oxide (D2O) was used as the displacing fluid. Oil production was monitored in real time using an NMR spectrometer, while the injected water volume was measured with an ISCO pump.
Figure 2.
Two-phase permeability experimental apparatus.
The core samples were first fully saturated with water (100% water saturation) and then placed in the core holder. A suitable pressure differential was applied to initiate the waterflooding experiment. To enable NMR monitoring of oil saturation changes, D2O was used as the displacing phase. Key parameters were recorded, including water breakthrough time, cumulative oil production at breakthrough (determined from the total reduction in NMR oil-phase signal), cumulative water injection volume (measured from ISCO pump readings), and the displacement pressure differential across the core. The data were processed using the JBN method [37] to obtain a series of oil- and water-phase relative permeability points. Relative permeability was then calculated according to the following equations [38]:
where is the oil fractional flow, %; represents the cumulative oil production normalized to the pore volume of the core; is the cumulative produced fluid volume normalized to pore volume; I is the relative injectivity, defined as the ratio of the instantaneous injectivity to the initial injectivity; is the initial oil flow rate at the outlet of the core, cm3/s; is the liquid flow rate at the outlet of the core at time t, cm3/s; is the initial displacement pressure differential, MPa; and is the displacement pressure differential at time t, MPa. This method directly monitors oil-phase variations within the core using NMR technology, thereby determining the cumulative oil production at different stages of the displacement process. The displaced oil volume is determined by measuring the change in the oil NMR signal within the core. Compared to conventional methods, this approach eliminates errors caused by the retention of oil in the connecting pipeline of the core holder. In this study, four representative samples were selected for gas–water two-phase relative permeability testing.
4. Results
4.1. Petrography and Pore Characteristics of Tight Sandstone Reservoirs
Based on thin-section observations of core samples collected from 12 cored wells, combined with mineralogical analysis, the detrital framework of the Fuyu oil layer reservoirs in the study area is composed primarily of quartz (20%), feldspar (26%), lithic fragments (38%), and matrix (16%). Core observations indicate that the maximum grain size of the detrital particles is 0.42 mm, with a dominant size range of 0.04–0.24 mm, suggesting an overall fine-grained texture. The detrital grains are predominantly sub-angular, with moderate roundness and medium-to-good sorting. Various cementation types are observed, including regeneration–film cementation, pore–film cementation, film–pore cementation, and regeneration–film–pore cementation. Lithic fragments are dominated by volcanic rock debris, indicating low compositional and textural maturity of the sandstone.
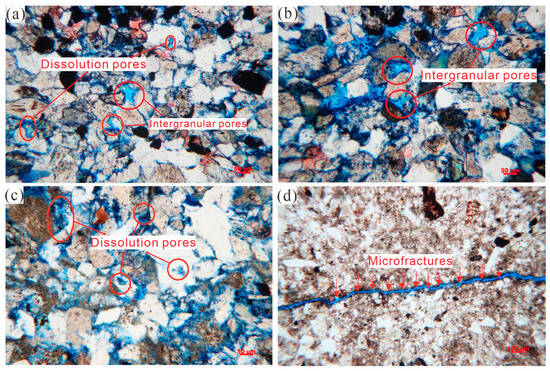
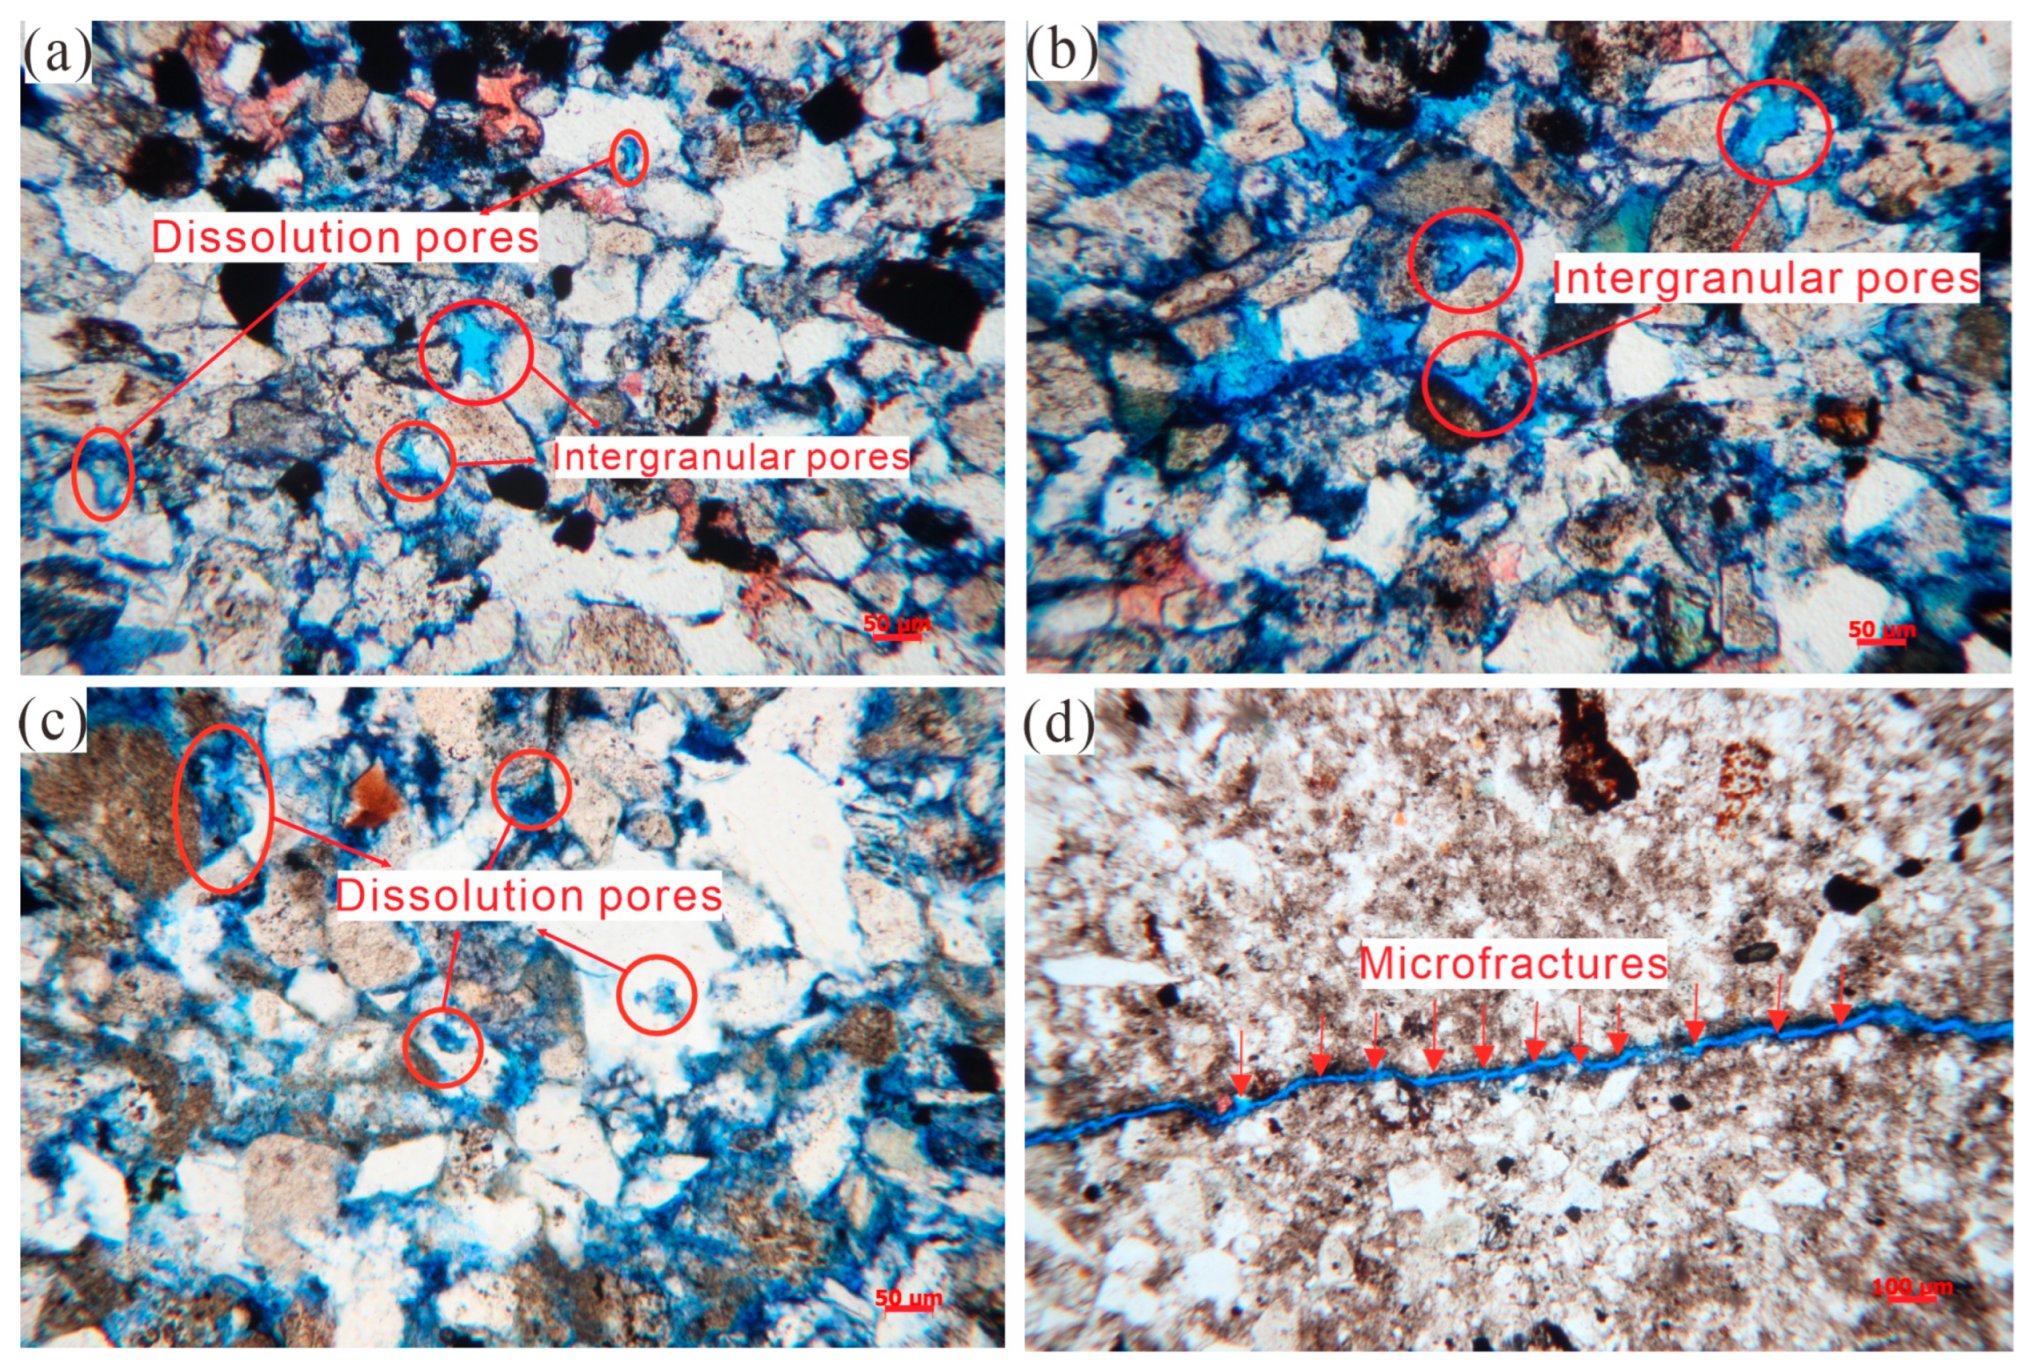
Cast thin-section analysis of 12 representative core samples reveals that the dominant pore type in the reservoirs is feldspar dissolution pores, accompanied by minor amounts of primary intergranular pores, secondary intergranular pores, quartz intercrystalline pores, and microfractures (Figure 3). Dissolution pores constitute a major component of the pore space in tight sandstones, typically formed by the dissolution of feldspar and carbonate cement. These pores are characterized by highly irregular surfaces and diameters ranging from 0.5 μm to 50 μm. They are often partially filled with clay minerals generated during feldspar dissolution, resulting in smaller intercrystalline clay pores. Such clay-associated pores are widely distributed within authigenic quartz intercrystalline spaces and clay minerals (Figure 3a,c). Residual intergranular pores represent unfilled primary pores that persist after compaction and cementation, occurring mainly between framework grains [39]. Although these pores have relatively large radii (10–200 μm), they are sparsely distributed and are typically triangular or polygonal in shape with smooth edges (Figure 4b). Microfractures, formed under tectonic stress or diagenesis, contribute a limited pore volume but play a critical role in connecting isolated micropores, thereby providing effective pathways for fluid migration (Figure 4d).
Figure 3.
Pore characteristics of tight sandstone reservoirs of the Fuyu oil layer in the Songliao Basin ((a)—dissolution pores; (b)—intergranular pores; (c)—dissolution pores; (d)—microfractures).
Figure 4.
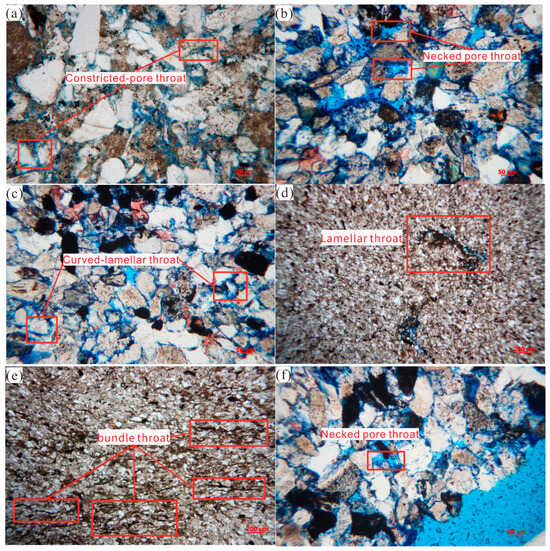
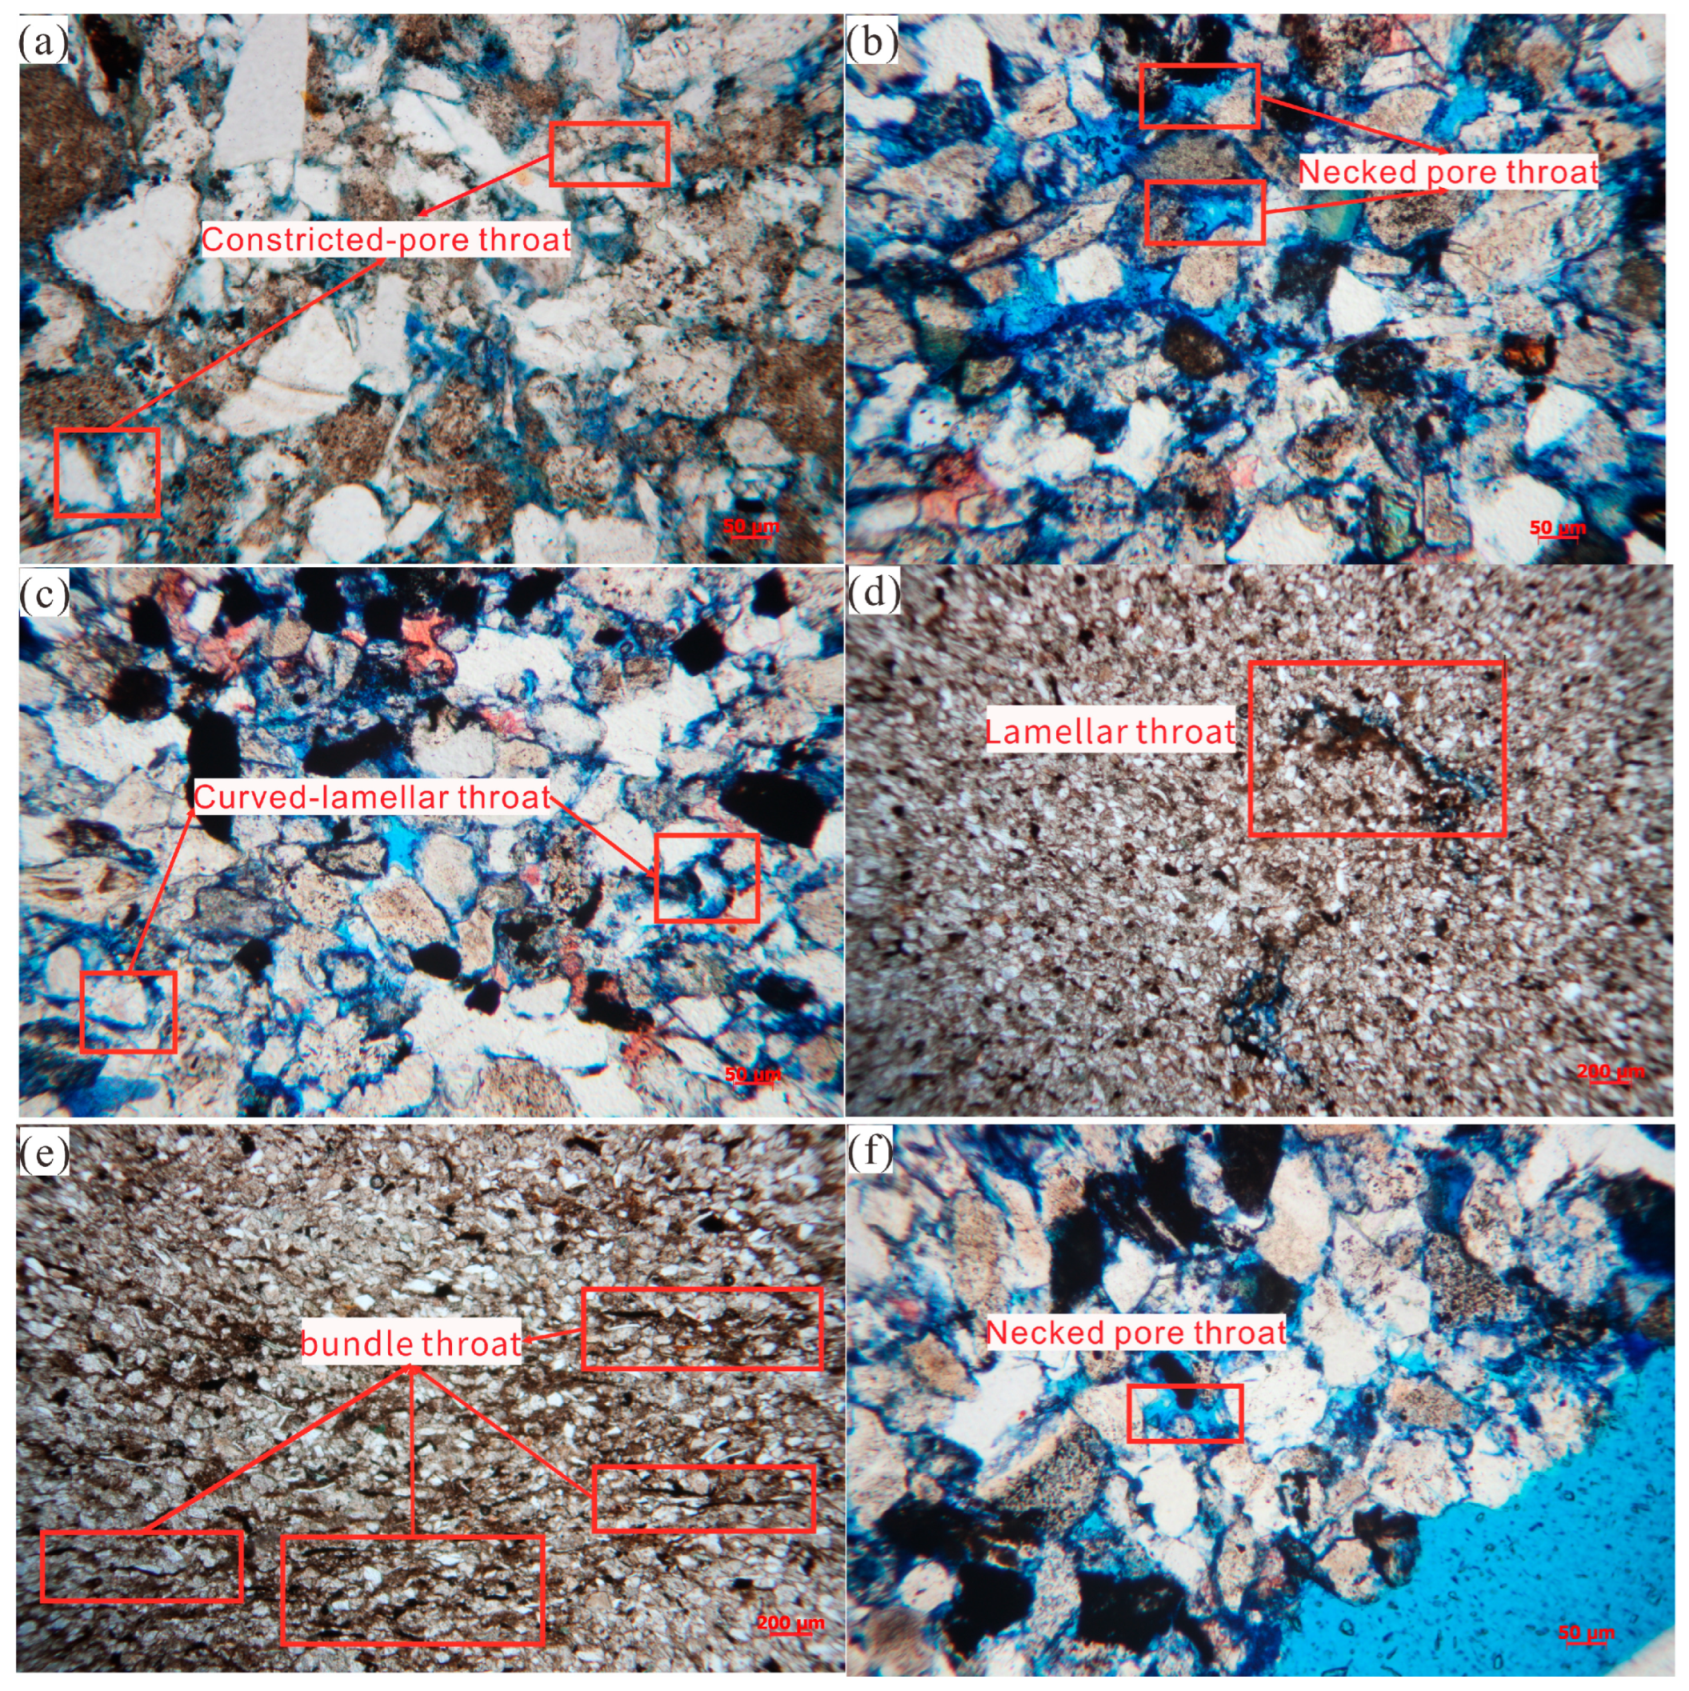
Throat characteristics of tight sandstone reservoirs in the Fuyu oil layer ((a)—constricted-pore throat; (b)—necked pore throat; (c)—curved-lamellar throat; (d)—lamellar throat; (e)—bundle throat; (f)—necked pore throat).
The Fuyu oil layer reservoirs exhibit a variety of pore–throat structures, including pore-constricted throats, necked throats, tabular throats, curved-tabular throats, and bundle-like throats. Pore-constricted throats typically develop between adjacent pores, with diameters considerably smaller than those of the connected pores (Figure 4). Due to their narrow diameters, these throats restrict fluid flow, thereby significantly influencing reservoir permeability and flow capacity.
Necked throats are formed by pronounced constriction at the junctions between adjacent pores, creating funnel- or dumbbell-shaped microstructures (Figure 4b,f). These throats possess relatively large radii and poorly defined boundaries with surrounding pores, allowing effective connectivity between adjacent pores. Consequently, they are classified as large-pore–small-throat types [40]. Lamellar and curved-lamellar throats are narrow, flattened channels formed along the contact surfaces of adjacent grains, typically exhibiting plate- or slit-like geometries, with thickness much smaller than width and length. These structures are generally controlled by compaction and pressure solution, and their connectivity is further reduced due to clay mineral infill, thereby enhancing reservoir heterogeneity (Figure 4c,d). Bundle-like throats (Figure 4e) result from intergranular pores being subdivided into variably sized, tube-like channels after infill by clay minerals such as kaolinite, chlorite, illite, and montmorillonite. This process significantly reduces pore volume and diminishes connectivity between pore bodies.
4.2. Pore Size Distribution
High-pressure mercury intrusion provides information on pore size distribution and throat radii; however, its accuracy is constrained by the maximum intrusion pressure and the shielding effect of large throats, making it less effective for characterizing nanoscale pores in tight rocks. In contrast, nuclear magnetic resonance (NMR) analyzes the T2 spectrum of fully saturated cores, capturing pore information across the entire size range. In this study, HMIP was integrated with NMR T2 spectra to calibrate the pore size distribution, and the conversion was carried out using Equation (2):
T2 = r/(ρ2Fs) = Cr,
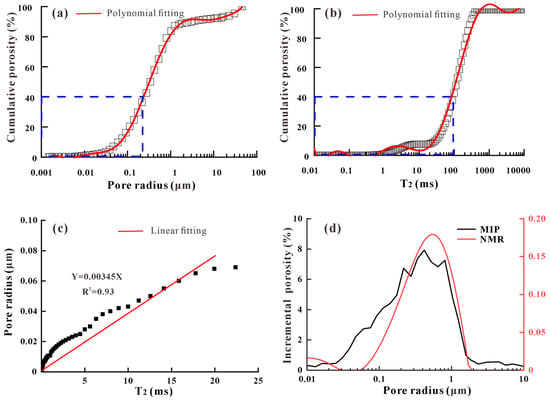
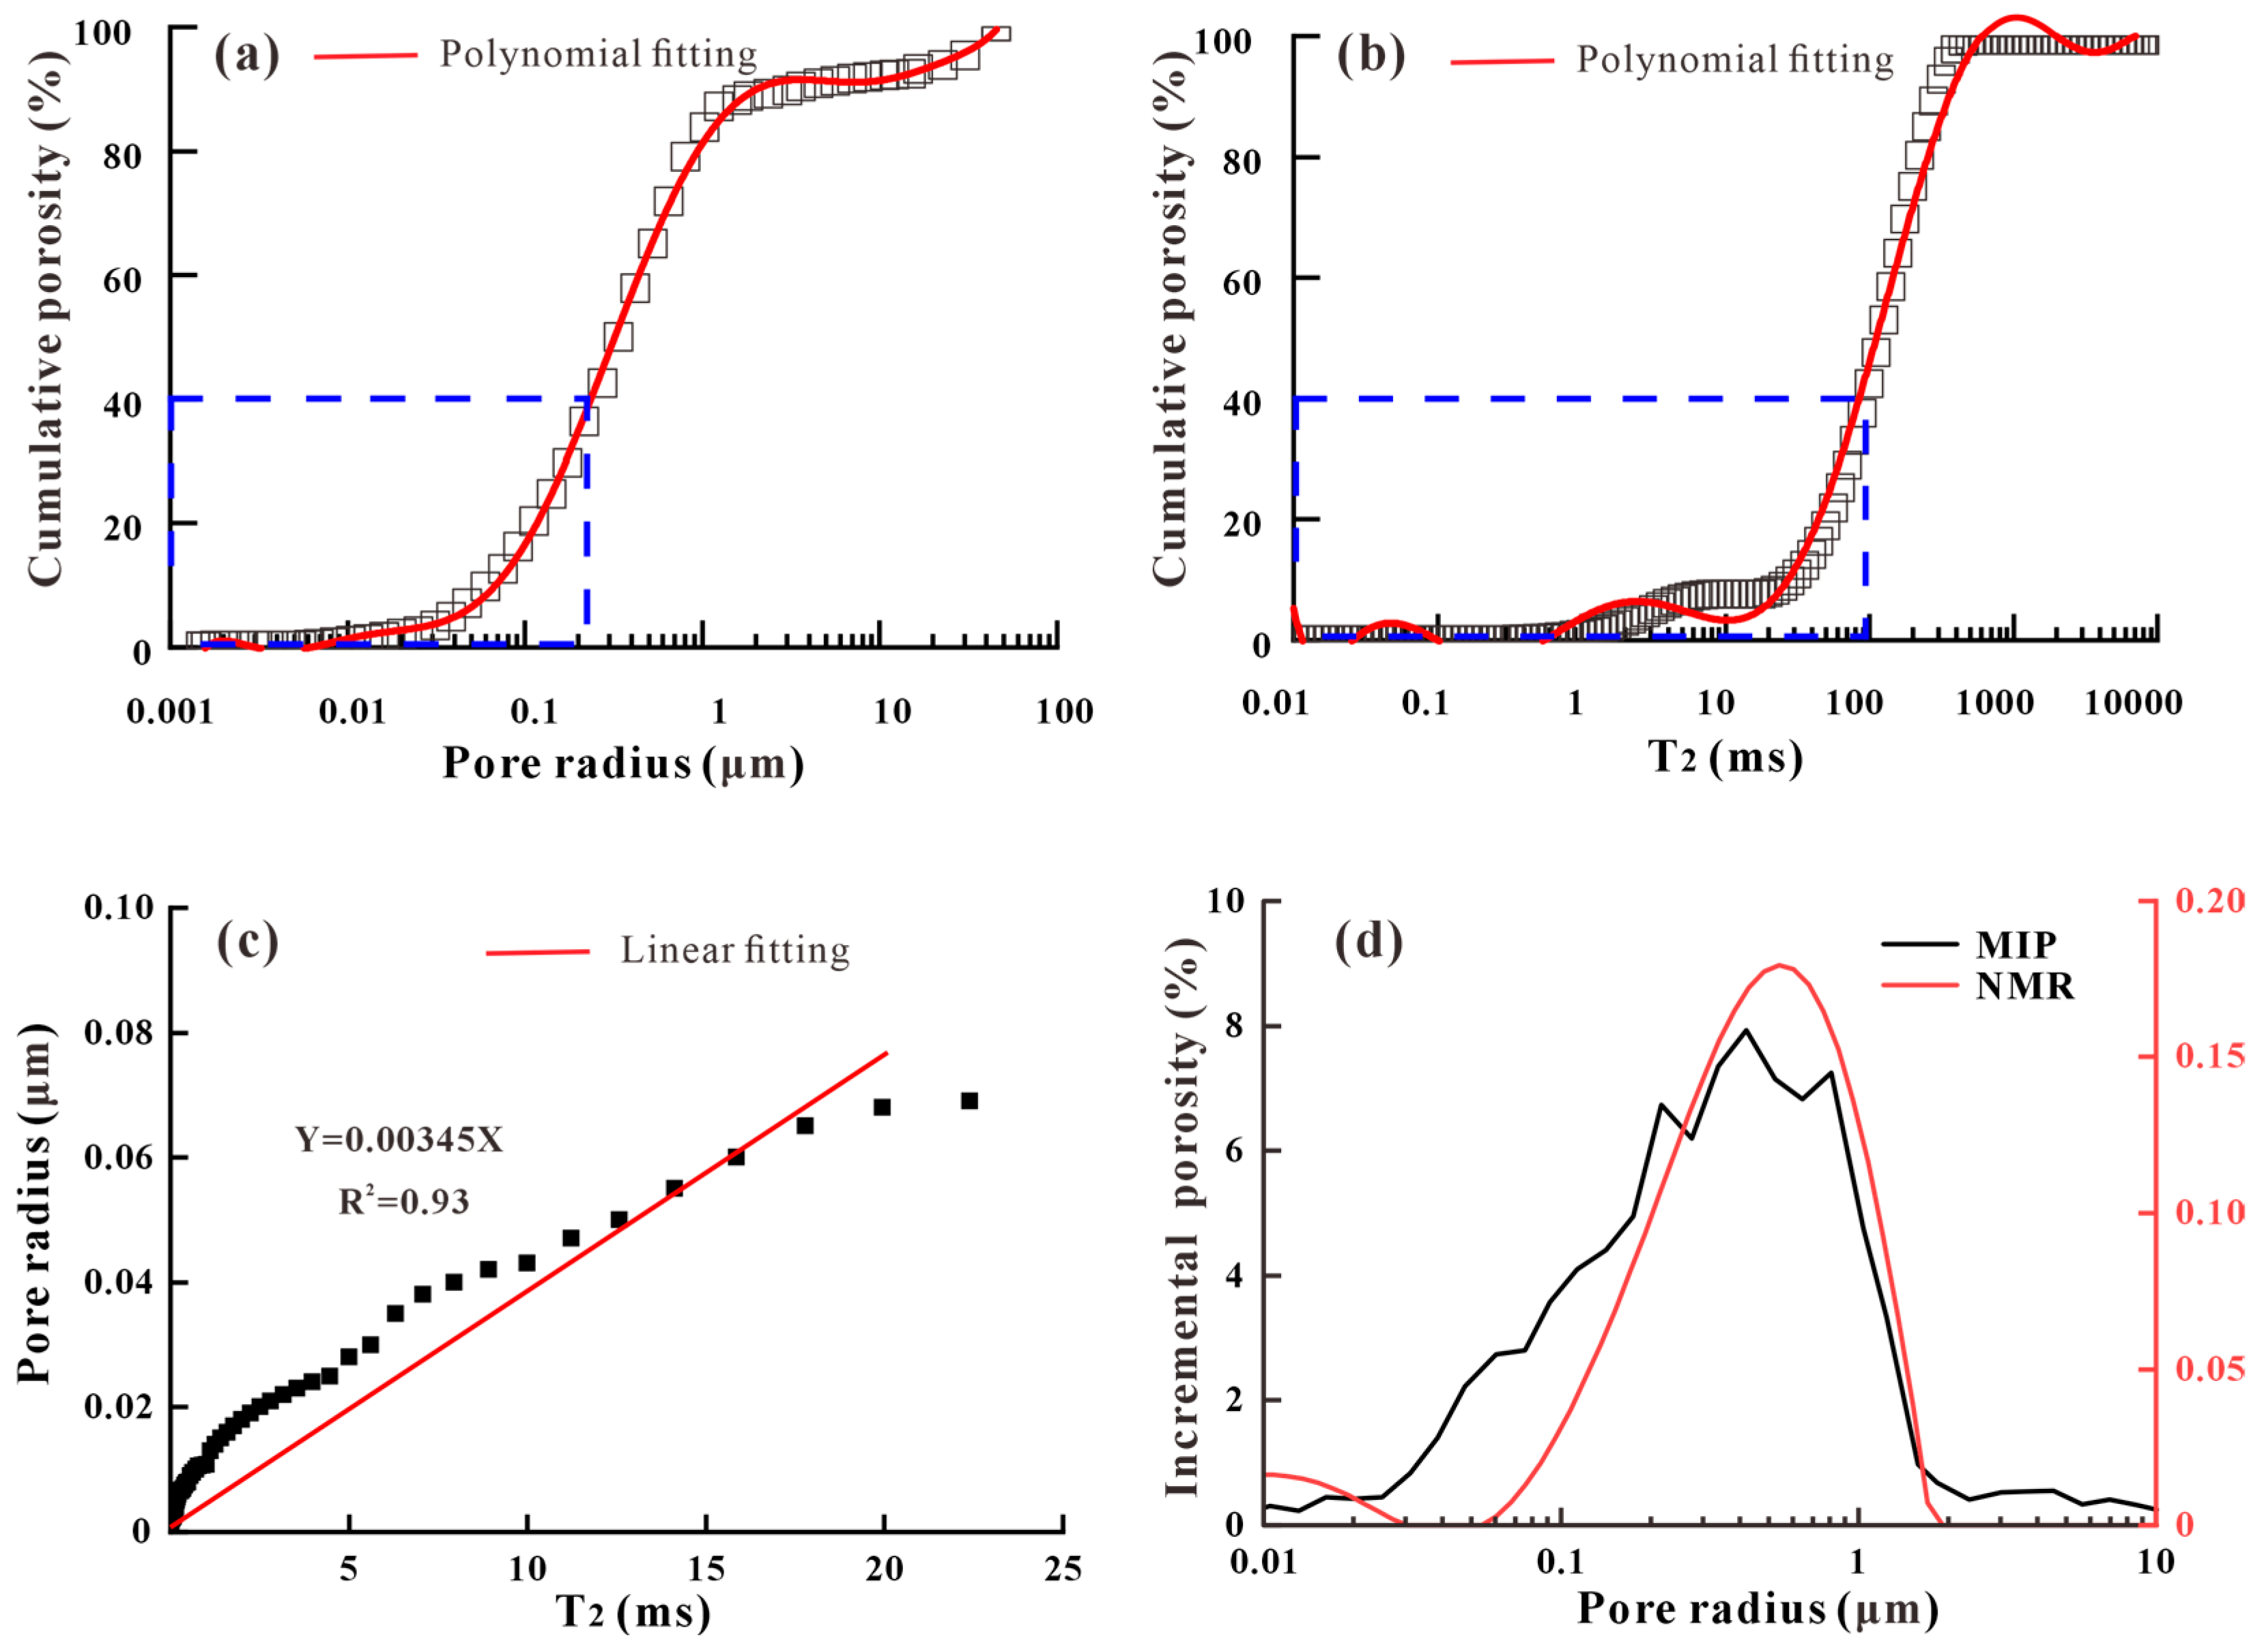
For a given core, the constant C in Equation (9) allows conversion of the NMR T2 spectrum into pore size distribution. By comparing HMIP-derived capillary pressure curves with the corresponding pore–throat ranges in the T2 spectra, the conversion coefficient can be accurately determined. Previous studies have shown good agreement between HMIP and NMR measurements for pores smaller than 1 μm, so this size range was selected for analysis. The cumulative pore volume curve from HMIP was fitted (Figure 5a), and the T2 spectrum was accumulated along increasing pore radius and fitted (Figure 5b). Using the resulting polynomial fits, the T2 relaxation times were mapped to corresponding pore radii at equal cumulative pore volumes, and a linear fit within the comparable range yielded the conversion coefficient C (Figure 5c). Applying the conversion coefficient to the original T2 spectrum produced the full-range pore size distribution (Figure 5d).
Figure 5.
Pore size distribution calibrated by combined NMR–HMIP experiments (sample J-1). (a) HMIP cumulative pore volume (polynomial fit); (b) Cumulative T2 spectrum vs. pore radius (polynomial fit); (c) T2–pore radius conversion at equal cumulative volume (linear fit for coefficient C); (d) Full-range PSD from T2 spectrum and HMIP.
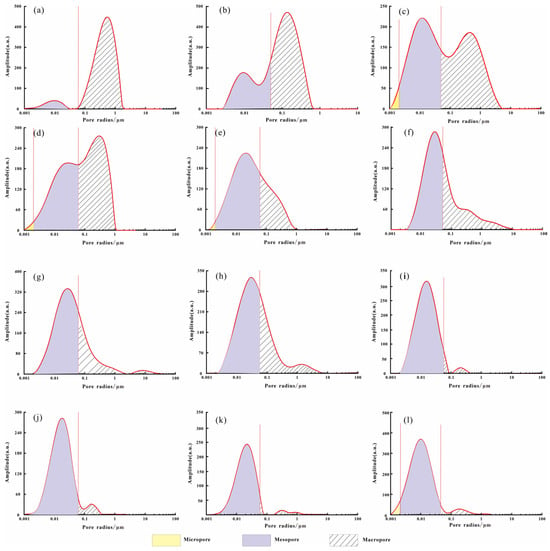
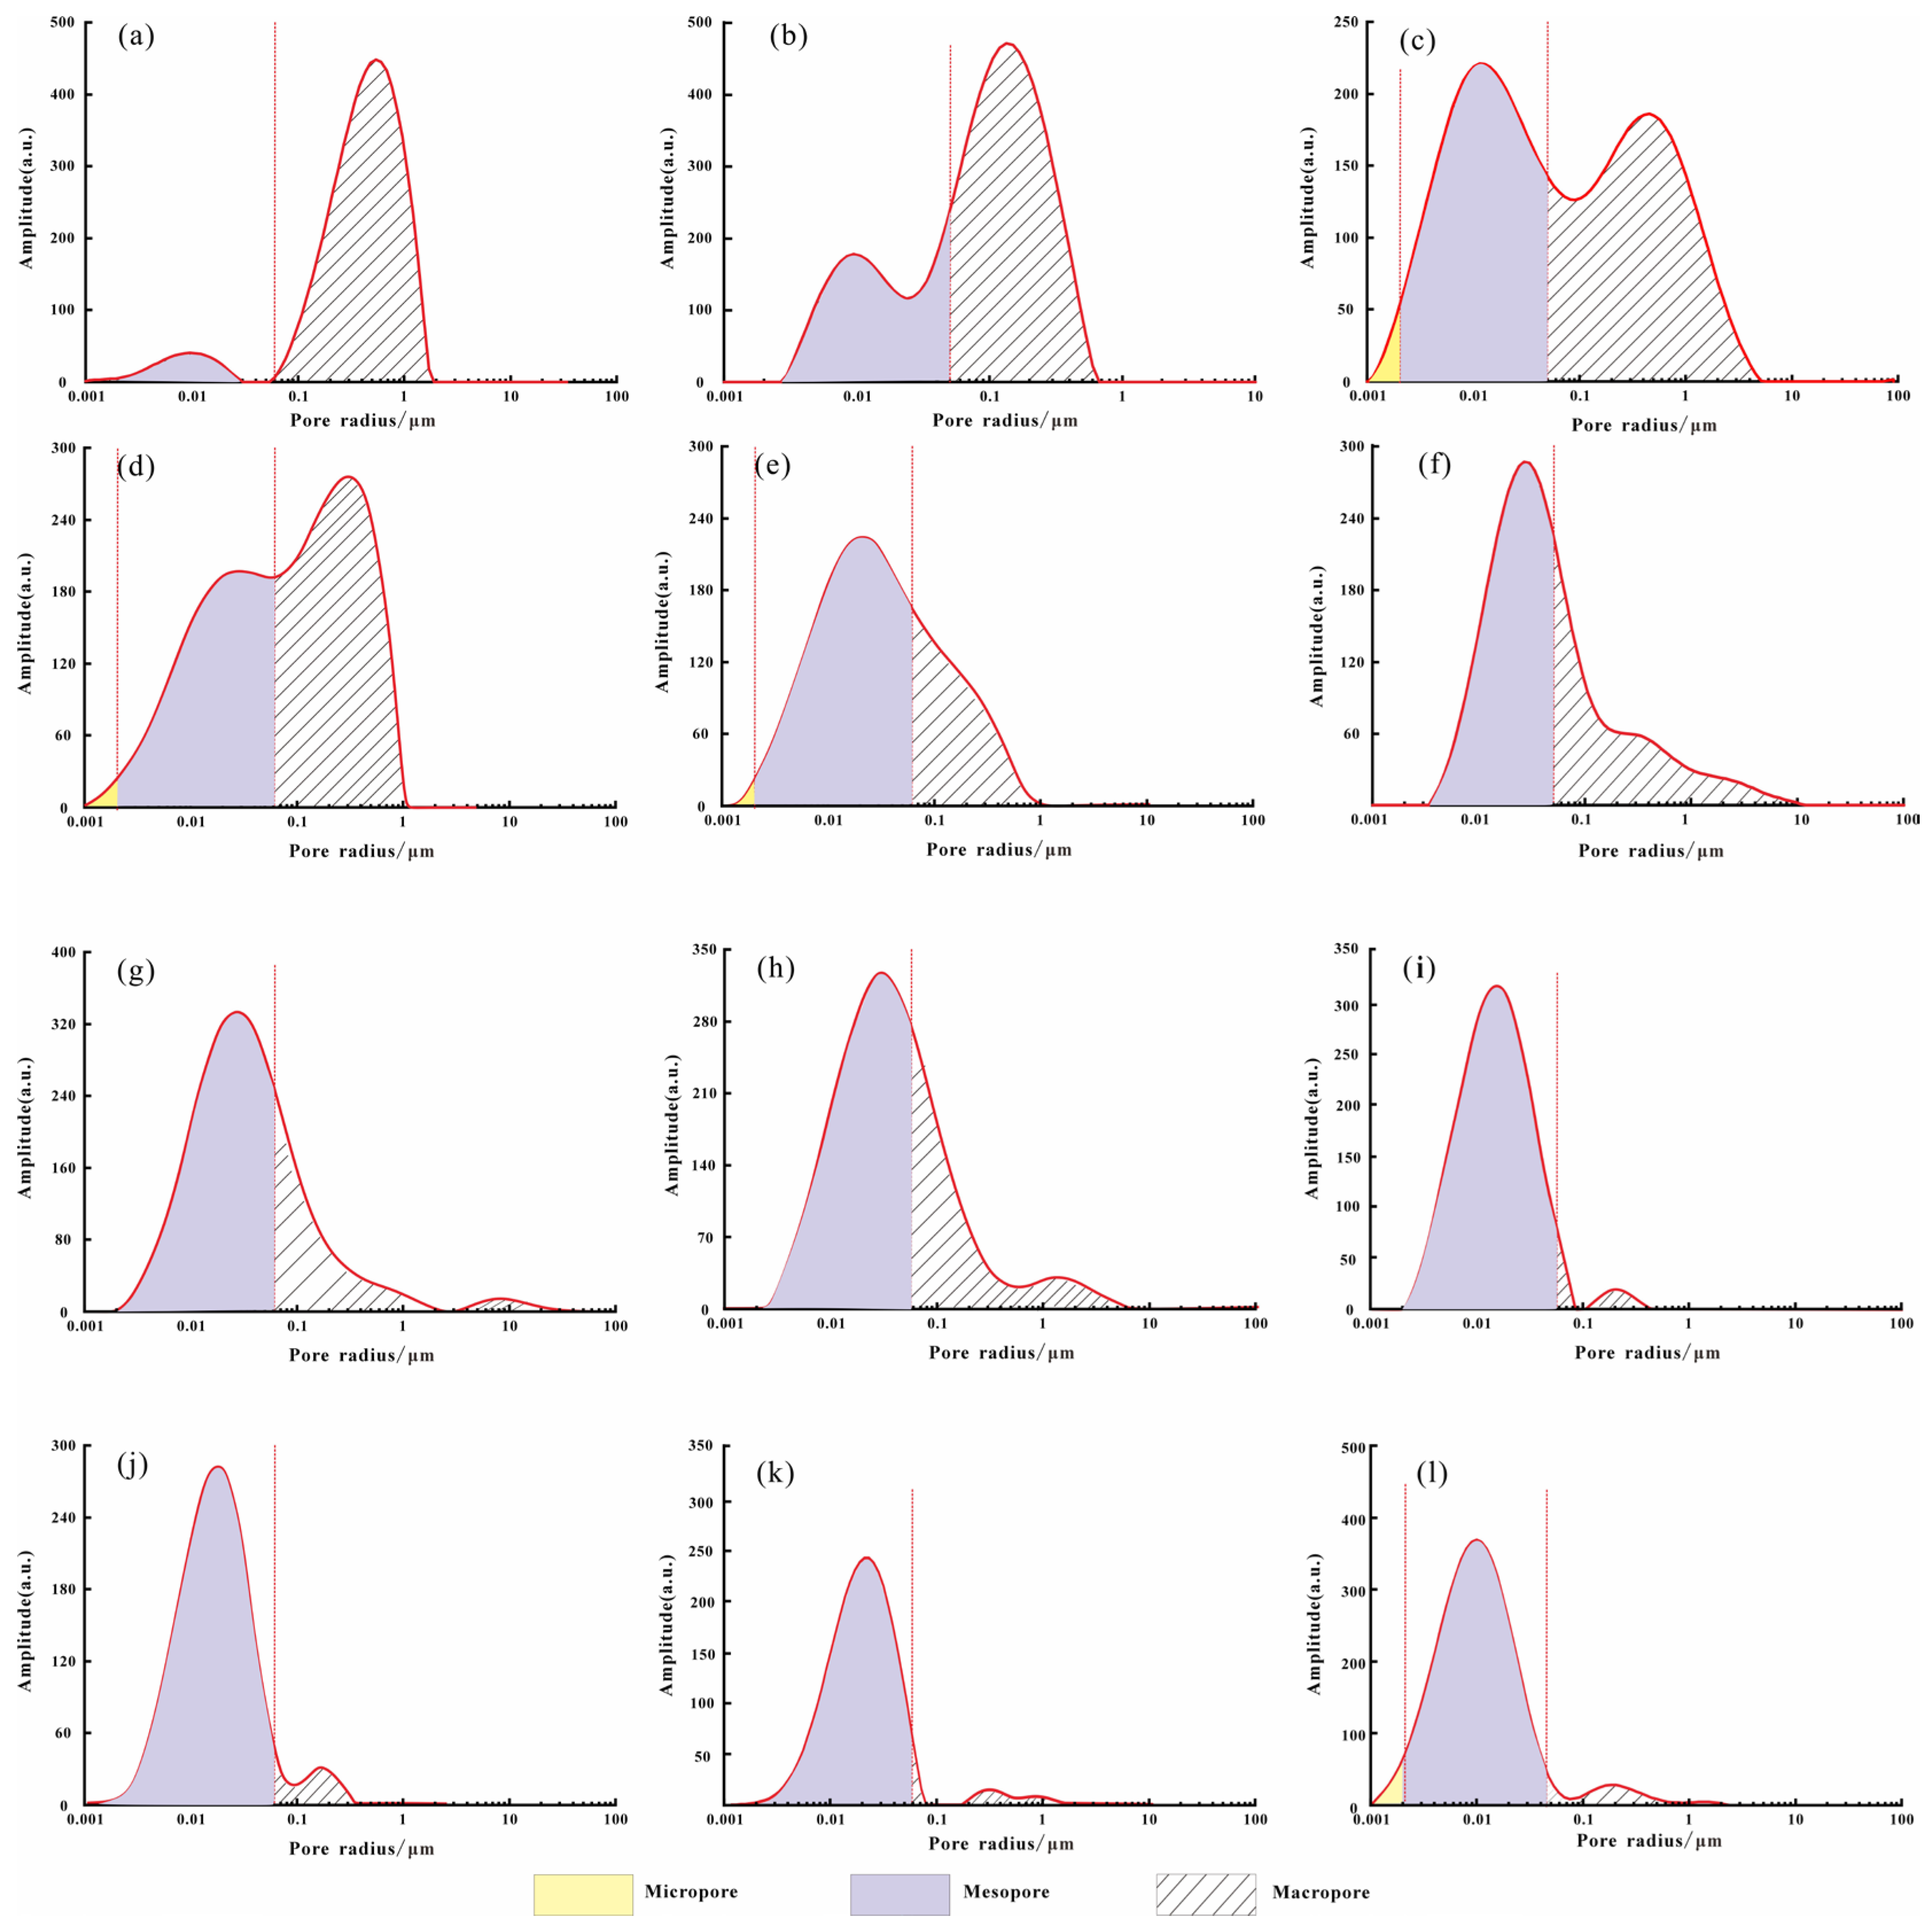
Using the conversion coefficient and T2 spectra, the full pore-size distributions of six samples were obtained. All six samples exhibited bimodal or trimodal distributions. Following the IUPAC classification, the pores in coal can be divided into three categories: micropores (pore size < 2 nm), mesopores (2 nm < pore size < 50 nm), and macropores (pore size > 50 nm).
For the Fuyu reservoir sandstones, the pore system is mainly composed of mesopores and macropores, while micropores (<2 nm) are less developed (Figure 6). Samples J-1 and J-4 are dominated by macropores. In samples C-9, C-1, C-3, and C-105, the proportion of mesopores increases, and both mesopores and macropores are well developed. Samples P-2, P-3, Y-4, Y-2, Y-24, and Y-354 are mainly characterized by mesopores, with a smaller proportion of macropores.
Figure 6.
Pore size distribution of 12 typical samples ((a), J-1; (b), J-4; (c), C-9; (d), C-1; (e), C-105; (f), C-3; (g), P-2; (h), P-3; (i), Y-4; (j), Y-2; (k), Y-24; (l), Y-354).
Based on the pore volume proportions of different pore-size ranges, the geometric mean pore size was calculated, which to some extent reflects the characteristic pore size of the dominant pore population. The geometric mean pore sizes of the 12 samples are listed in Table 2.
Table 2.
Geometric mean pore sizes and saturation of movable fluids in different pores of samples.
4.3. Movable Oil Saturation
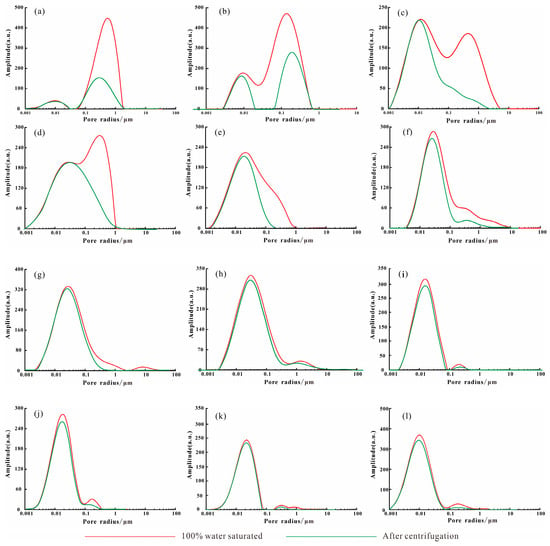
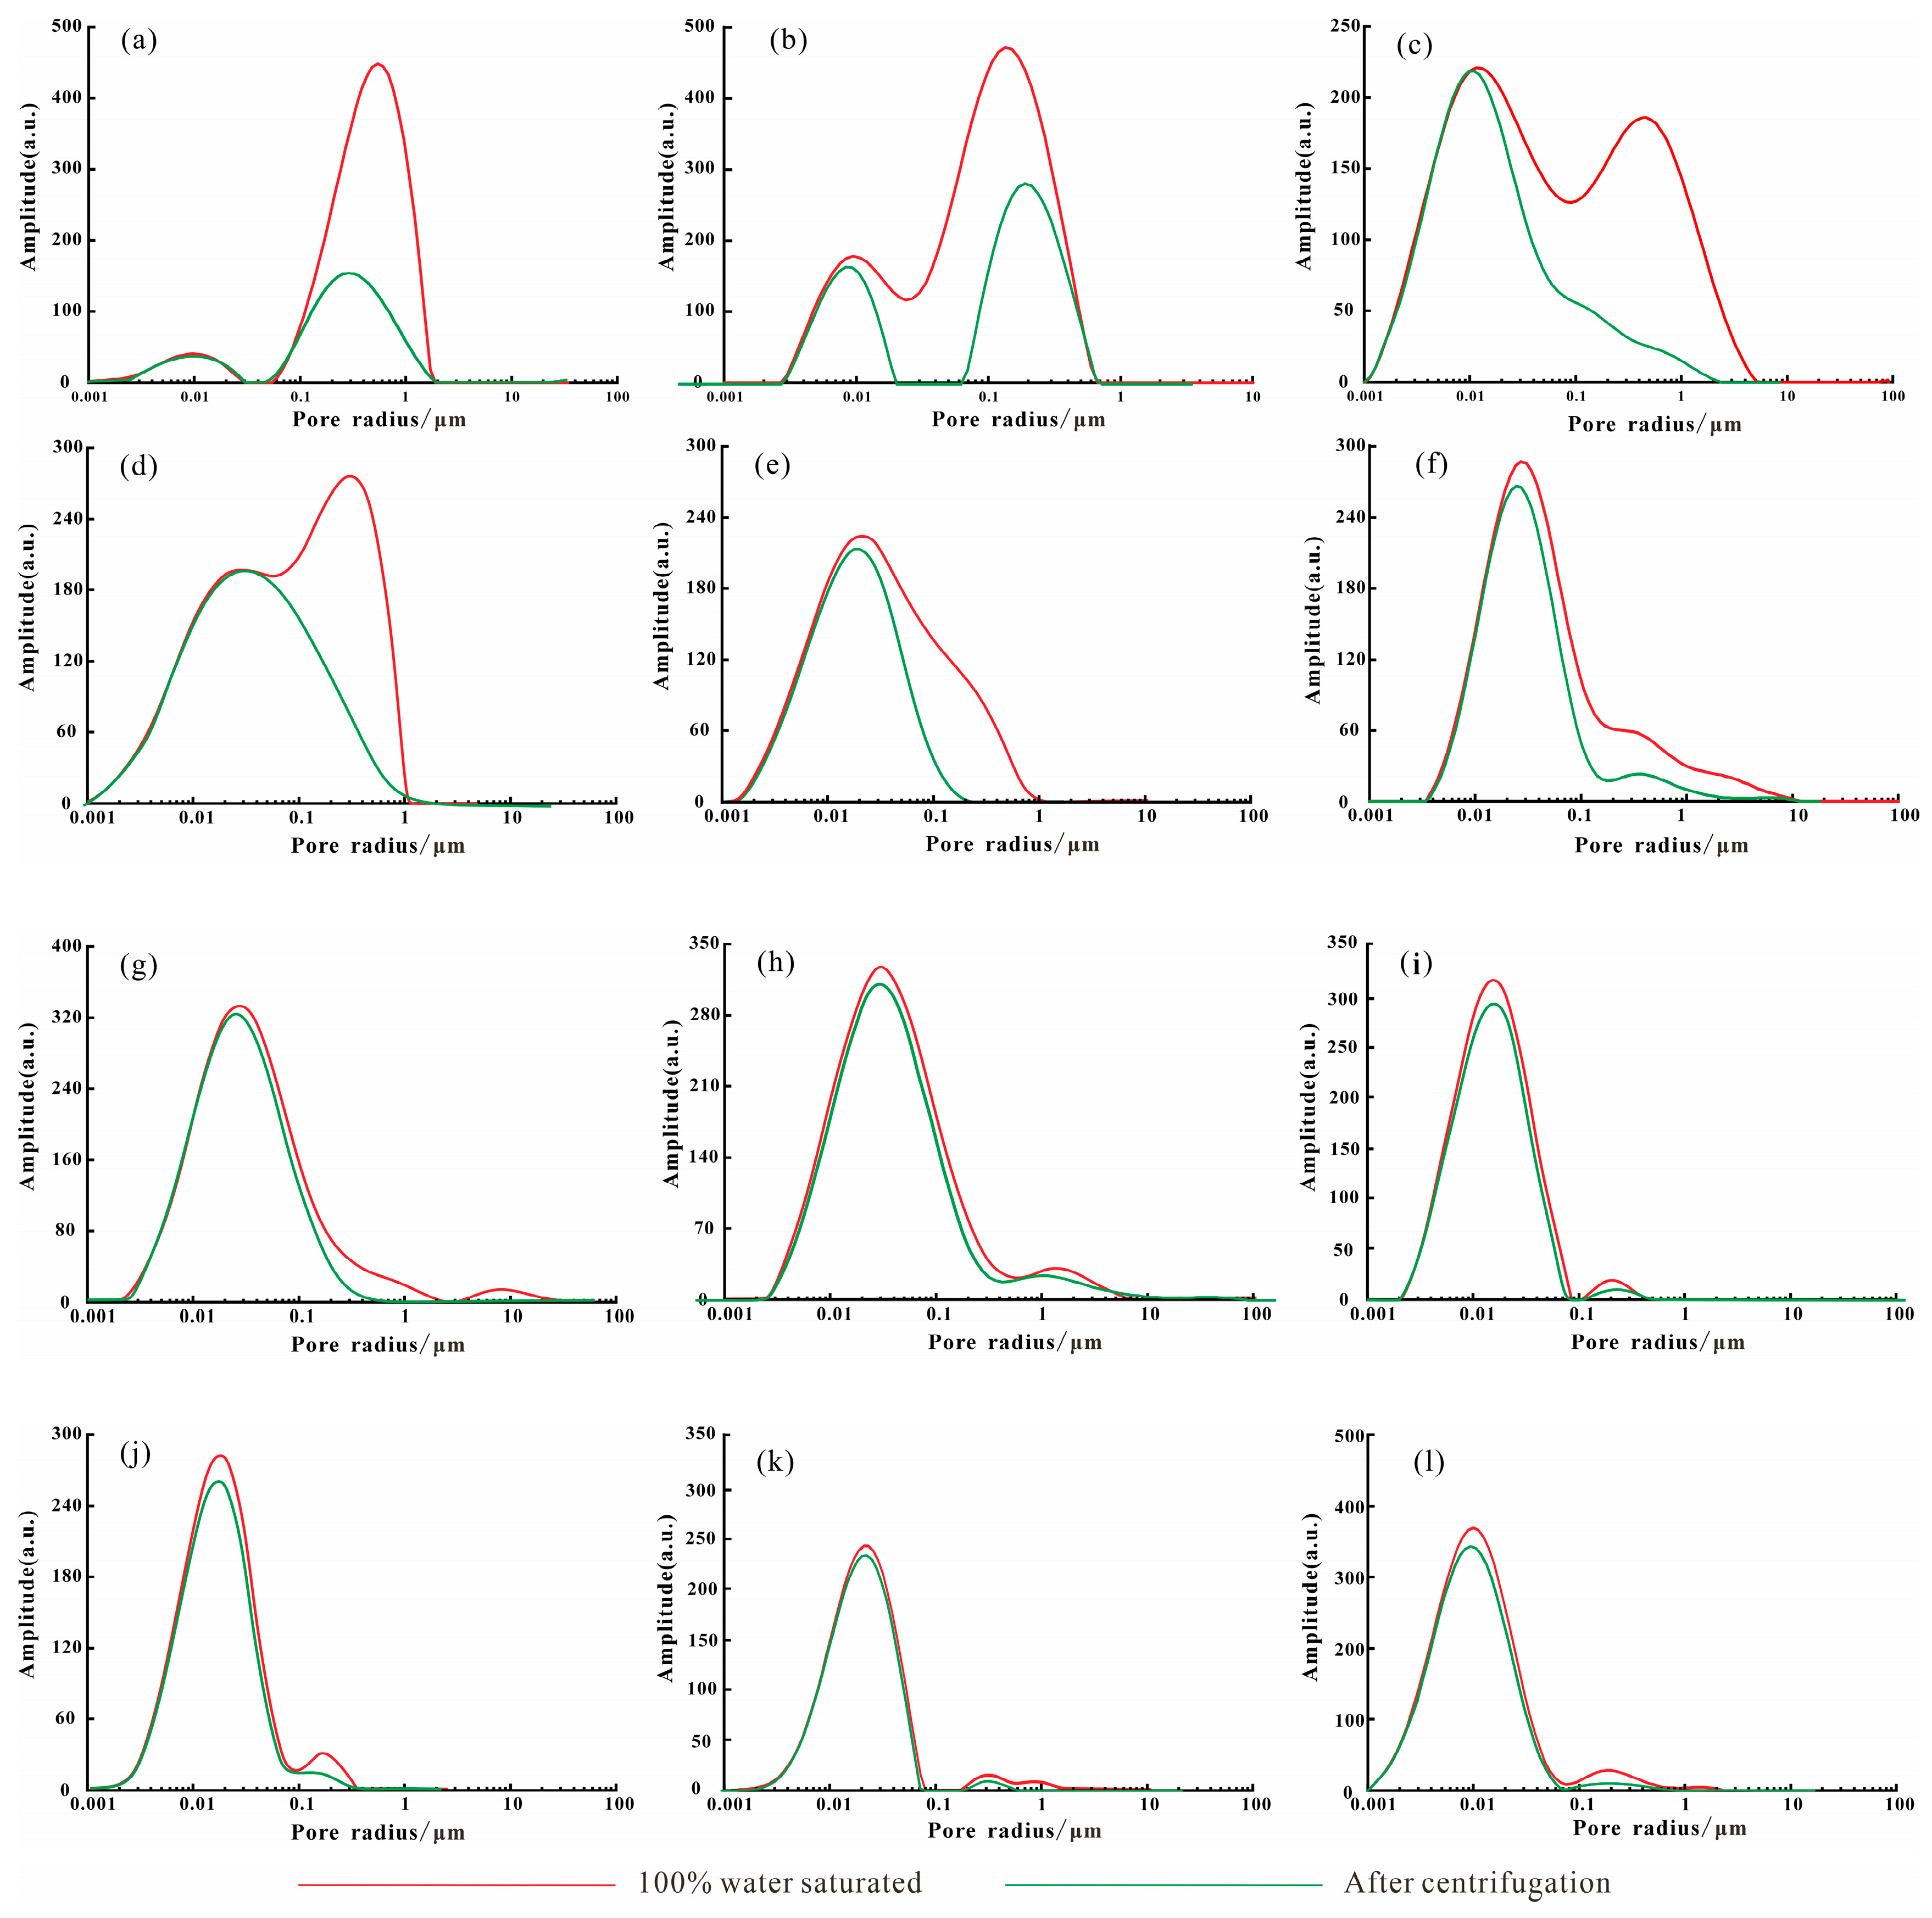
Centrifugation experiments were conducted on 12 samples, as shown in Figure 7. After centrifugation, part of the oil was displaced, but varying amounts of residual oil remained within the cores. Table 2 summarizes the movable fluid parameters in different pore-size ranges obtained from the NMR centrifugation experiments. The residual oil saturation and distribution characteristics vary significantly among the sandstone samples from the Fuyu reservoir, with movable fluid saturations ranging from 8.7% to 52.1%.
Figure 7.
T2 distributions of 12 samples before and after NMR centrifugation ((a), J-1; (b), J-4; (c), C-9; (d), C-1; (e), C-3; (f), C-105; (g), P-1; (h), P-2; (i), Y-4; (j), Y-2; (k), Y-354; (l), Y-24).
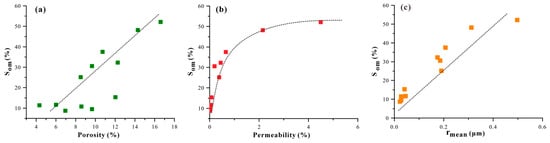
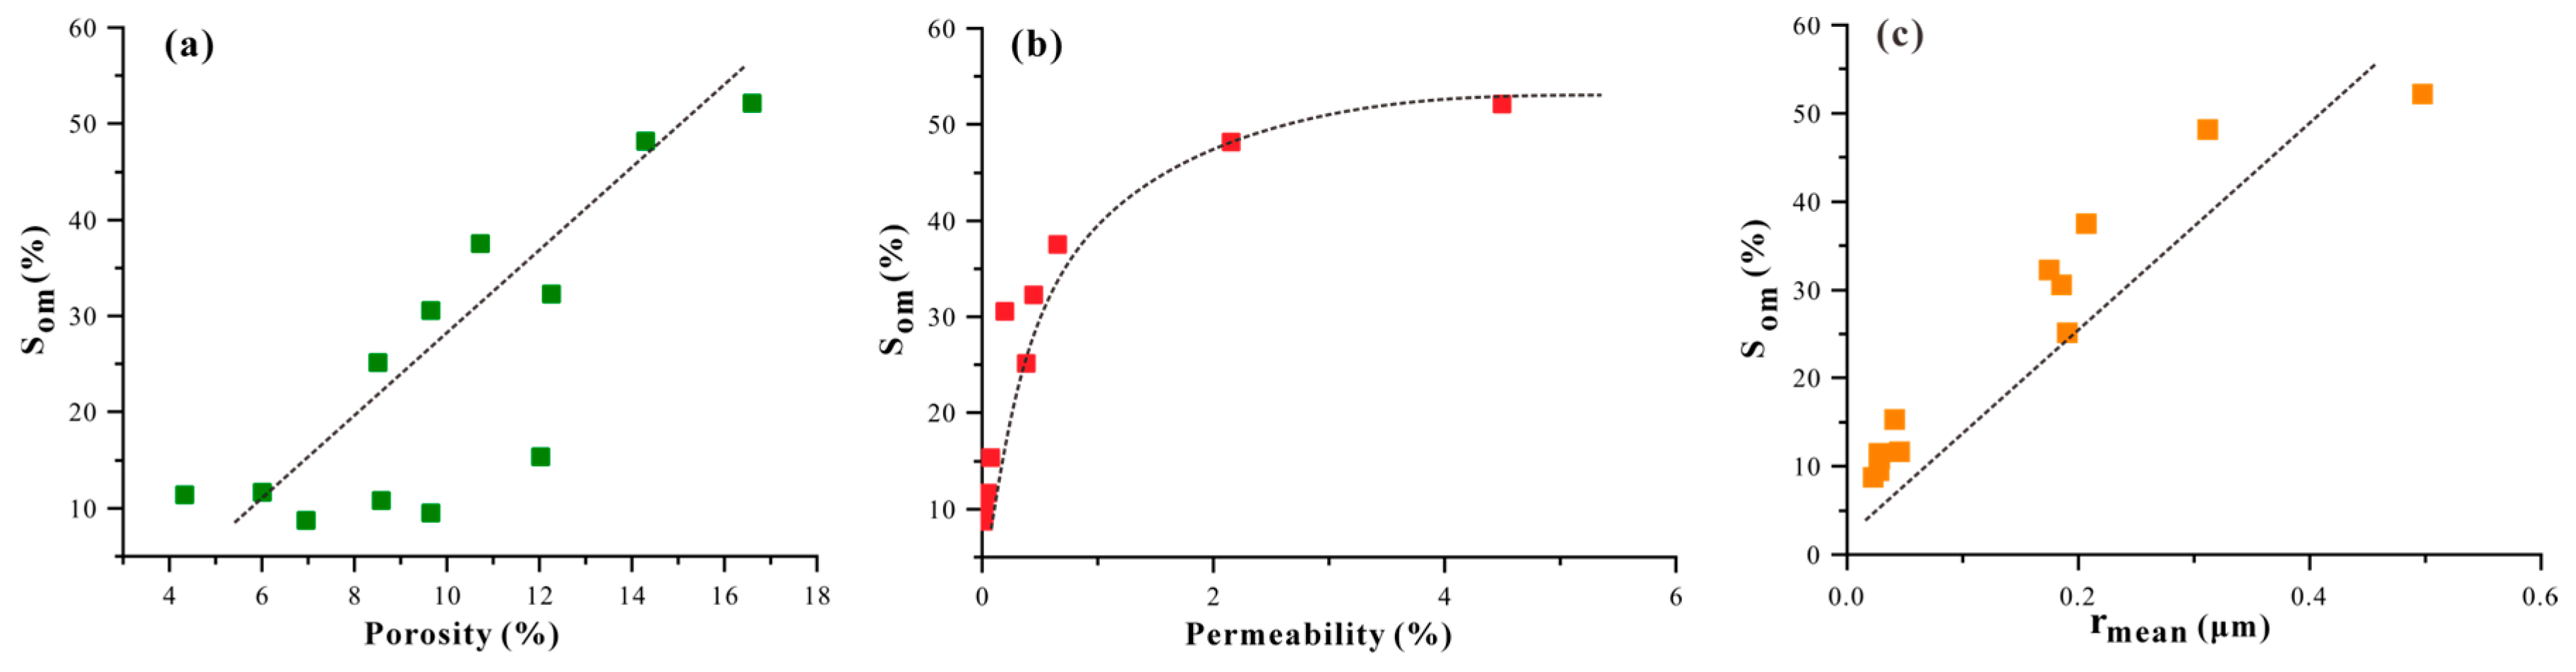
Movable oil analyses were conducted for both mesopores and macropores, showing that overall oil mobility is higher in macropores than in mesopores, which is consistent with the distribution patterns of movable oil observed in tight sandstones from the Linxing area of the Ordos Basin [41]. In sample J-4, mesopores exhibit the highest mobility, reaching 40.2%, which is much greater than that of other samples, indicating strong pore connectivity. Notably, samples Y-24 and Y-354 have residual oil contents exceeding 80%, particularly within the mesopores. Their reservoir space is mainly composed of micropores and microthroats, suggesting an extremely complex pore structure. Moreover, these residual oil values are comparable to those reported for tight sandstones in the Ordos Basin. For example, residual water saturation in the Linxing area ranges from 8% to 46% [41]. Despite differences in oil–water wettability, the residual saturation levels are similar, indicating that the tight pore structure is the primary factor controlling high residual fluid retention in tight sandstones. As shown in Figure 8a,b, both porosity and permeability exhibit a positive correlation with formation oil mobility. Rocks with higher porosity and permeability generally show higher movable fluid saturation and movable fluid porosity, indicating better fluid mobility. Larger pore–throat radii not only enlarge the storage space but also improve pore connectivity. As illustrated in Figure 8, movable fluid saturation and porosity are also positively correlated with the average pore–throat radius (geometric mean). An increase in the average pore–throat radius reflects an overall improvement in pore structure, which simultaneously enlarges the pore volume and enhances fluid flow capacity.
Figure 8.
Correlation between movable fluid parameters and reservoir physical properties: (a) porosity; (b) permeability; (c) Rmean.
4.4. Threshold Pressure Gradient
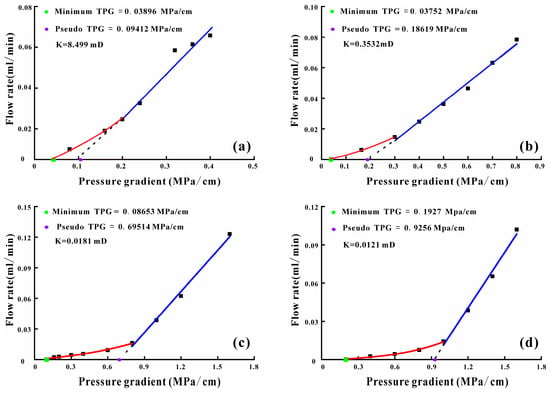
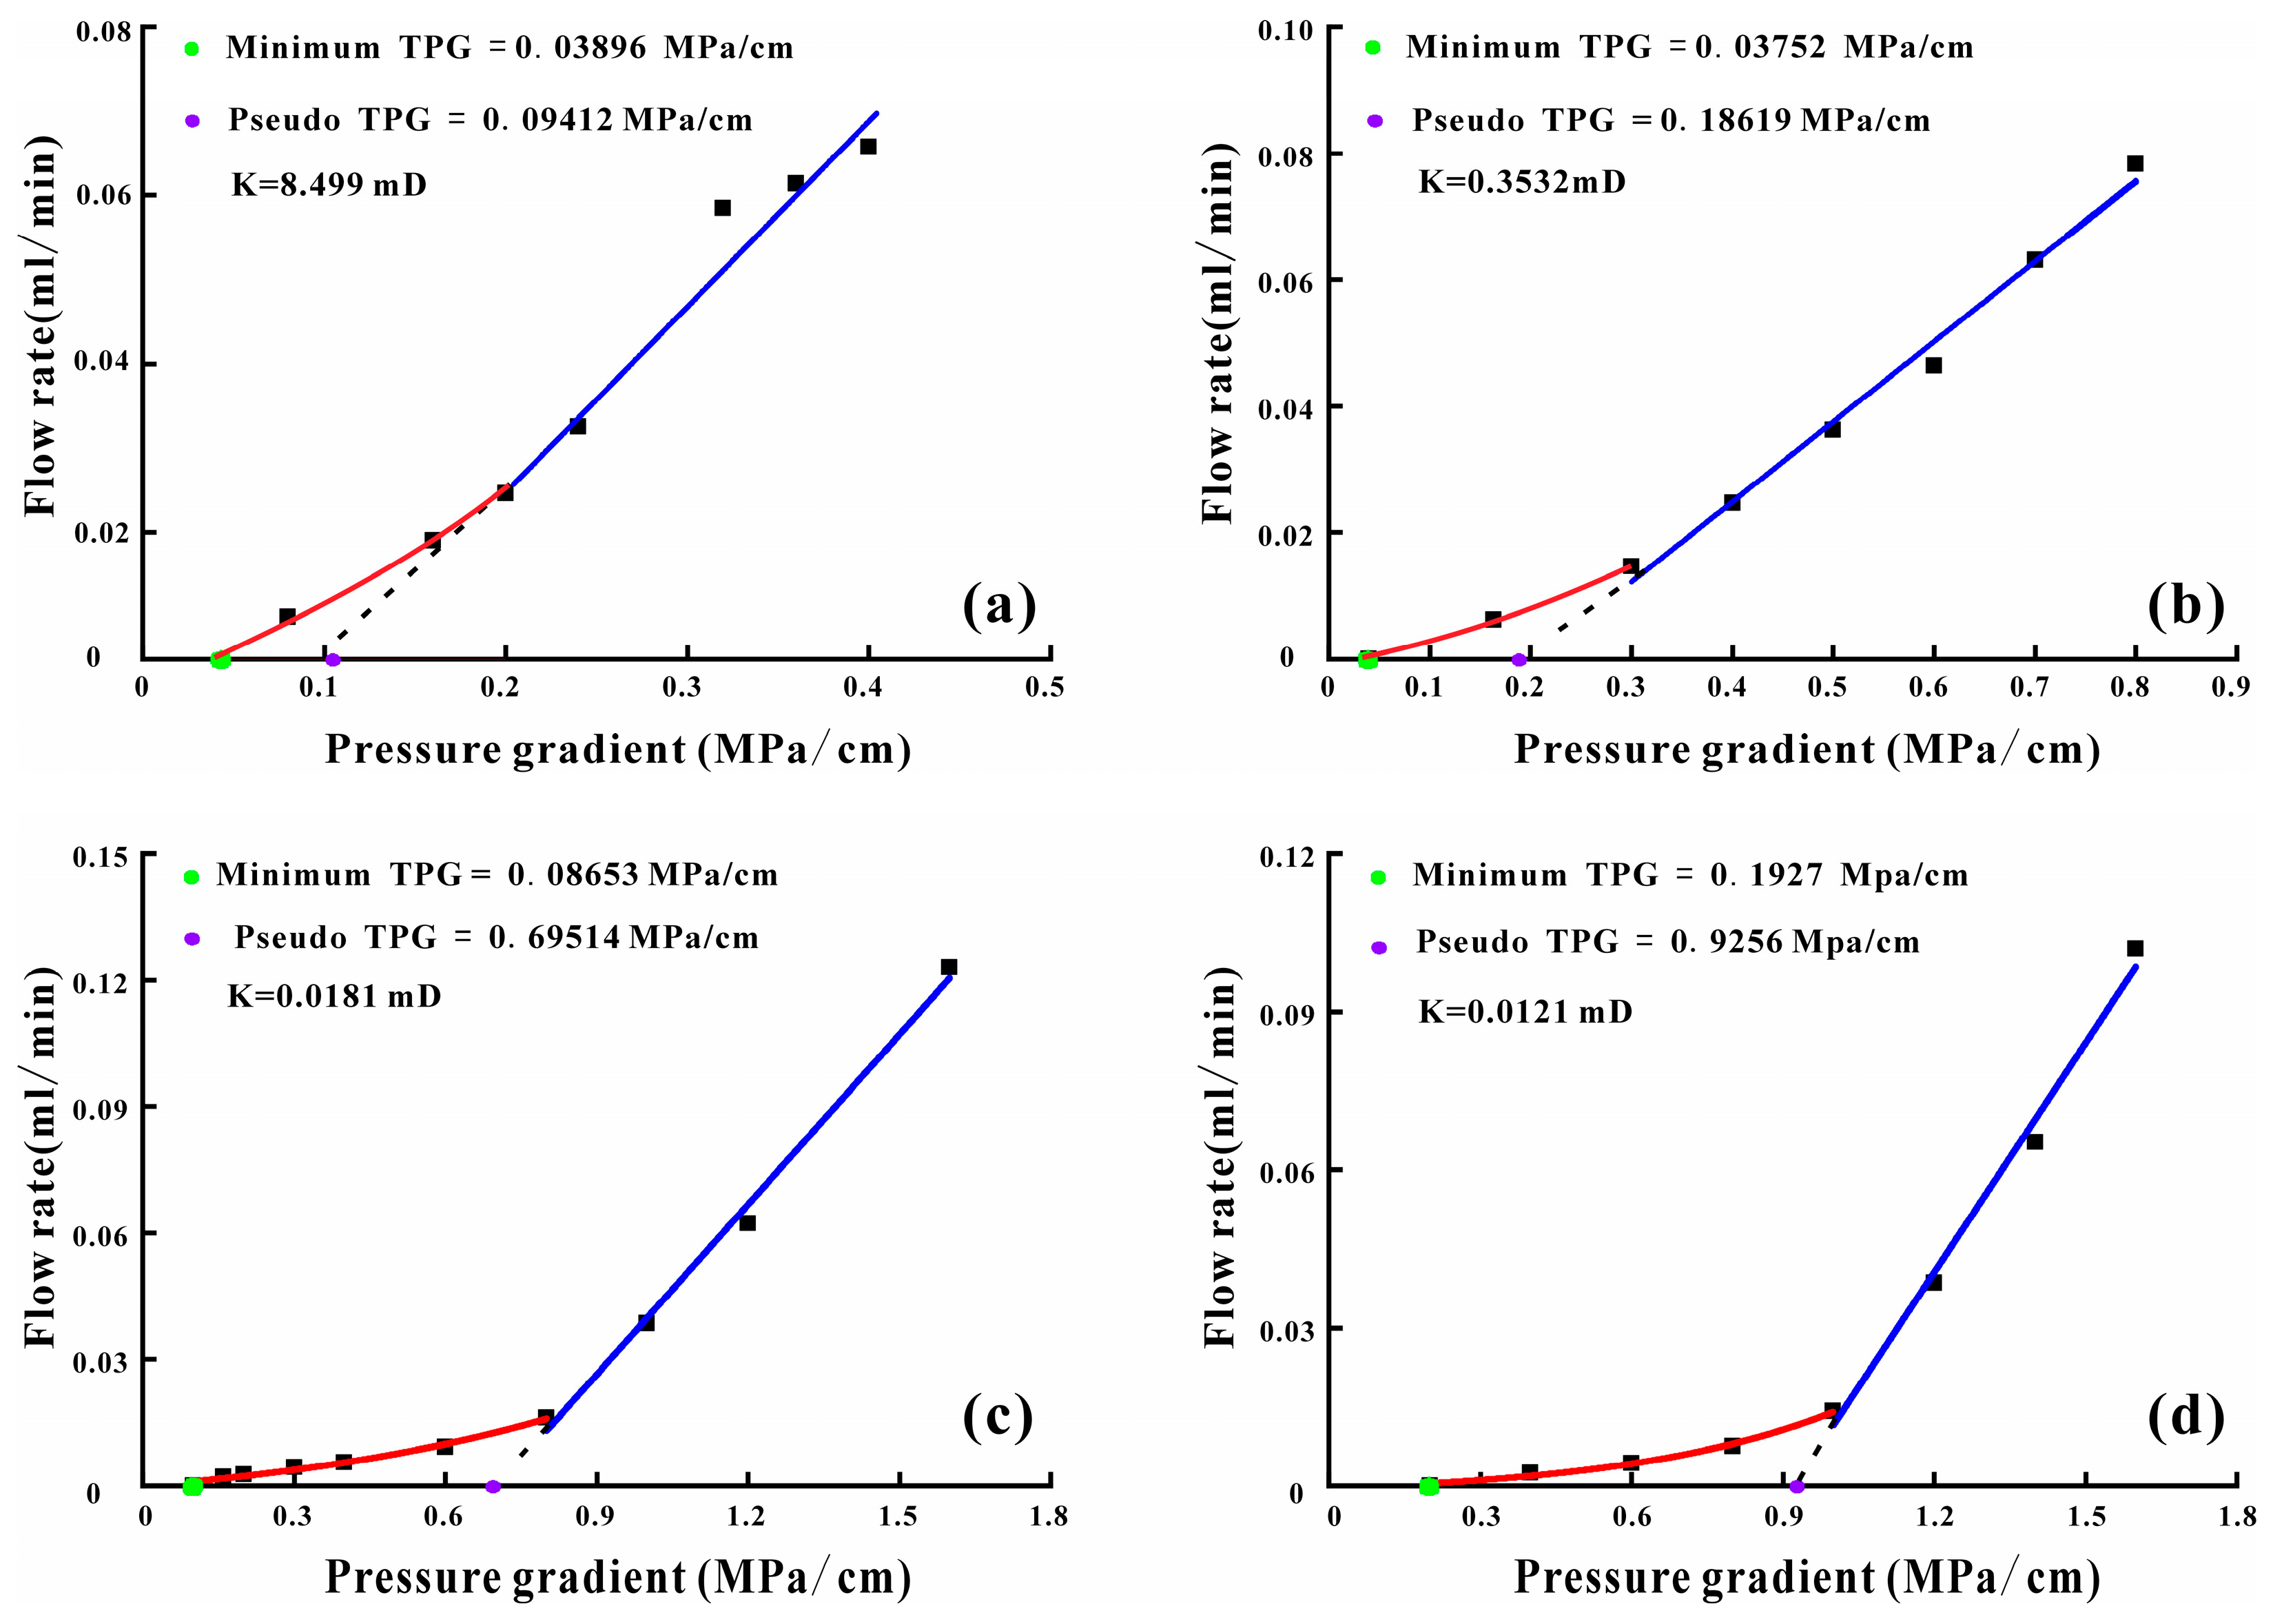
Four representative samples were selected for crude oil threshold pressure measurements. As shown in Figure 9, all samples exhibit a distinct non-Darcy flow behavior, as indicated by the clear intercepts of the flow rate–pressure gradient curves on the coordinate axis. The low-permeability sample Y354 displays a more pronounced nonlinear segment, with its flow curve closer to the pressure gradient axis and a correspondingly higher apparent threshold pressure gradient, reflecting the decisive influence of pore–throat structure on flow behavior.
Figure 9.
Relationship between Flow rate and Pressure Difference Curves of Four Typical Samples ((a), J-1; (b), C-9; (c), P-2; (d), Y354).
To quantify the apparent threshold pressure gradient of each sample, the flow rate–pressure difference curves were linearly fitted. The results show that for the Type I sample (J-1), the minimum threshold pressure gradient is 0.0389 MPa/cm, and the apparent threshold pressure gradient is 0.0941 MPa/cm. For the Type II sample (C-9), the minimum and apparent threshold pressure gradients are 0.0375 MPa/cm and 0.1861 MPa/cm, respectively. For the Type III sample (P-2), these values are 0.0865 MPa/cm and 0.6951 MPa/cm, respectively. For the Type IV sample (Y354), the minimum threshold pressure gradient reaches 0.1972 MPa/cm, while the apparent threshold pressure gradient is as high as 0.9256 MPa/cm.
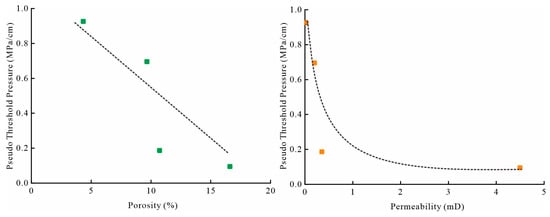
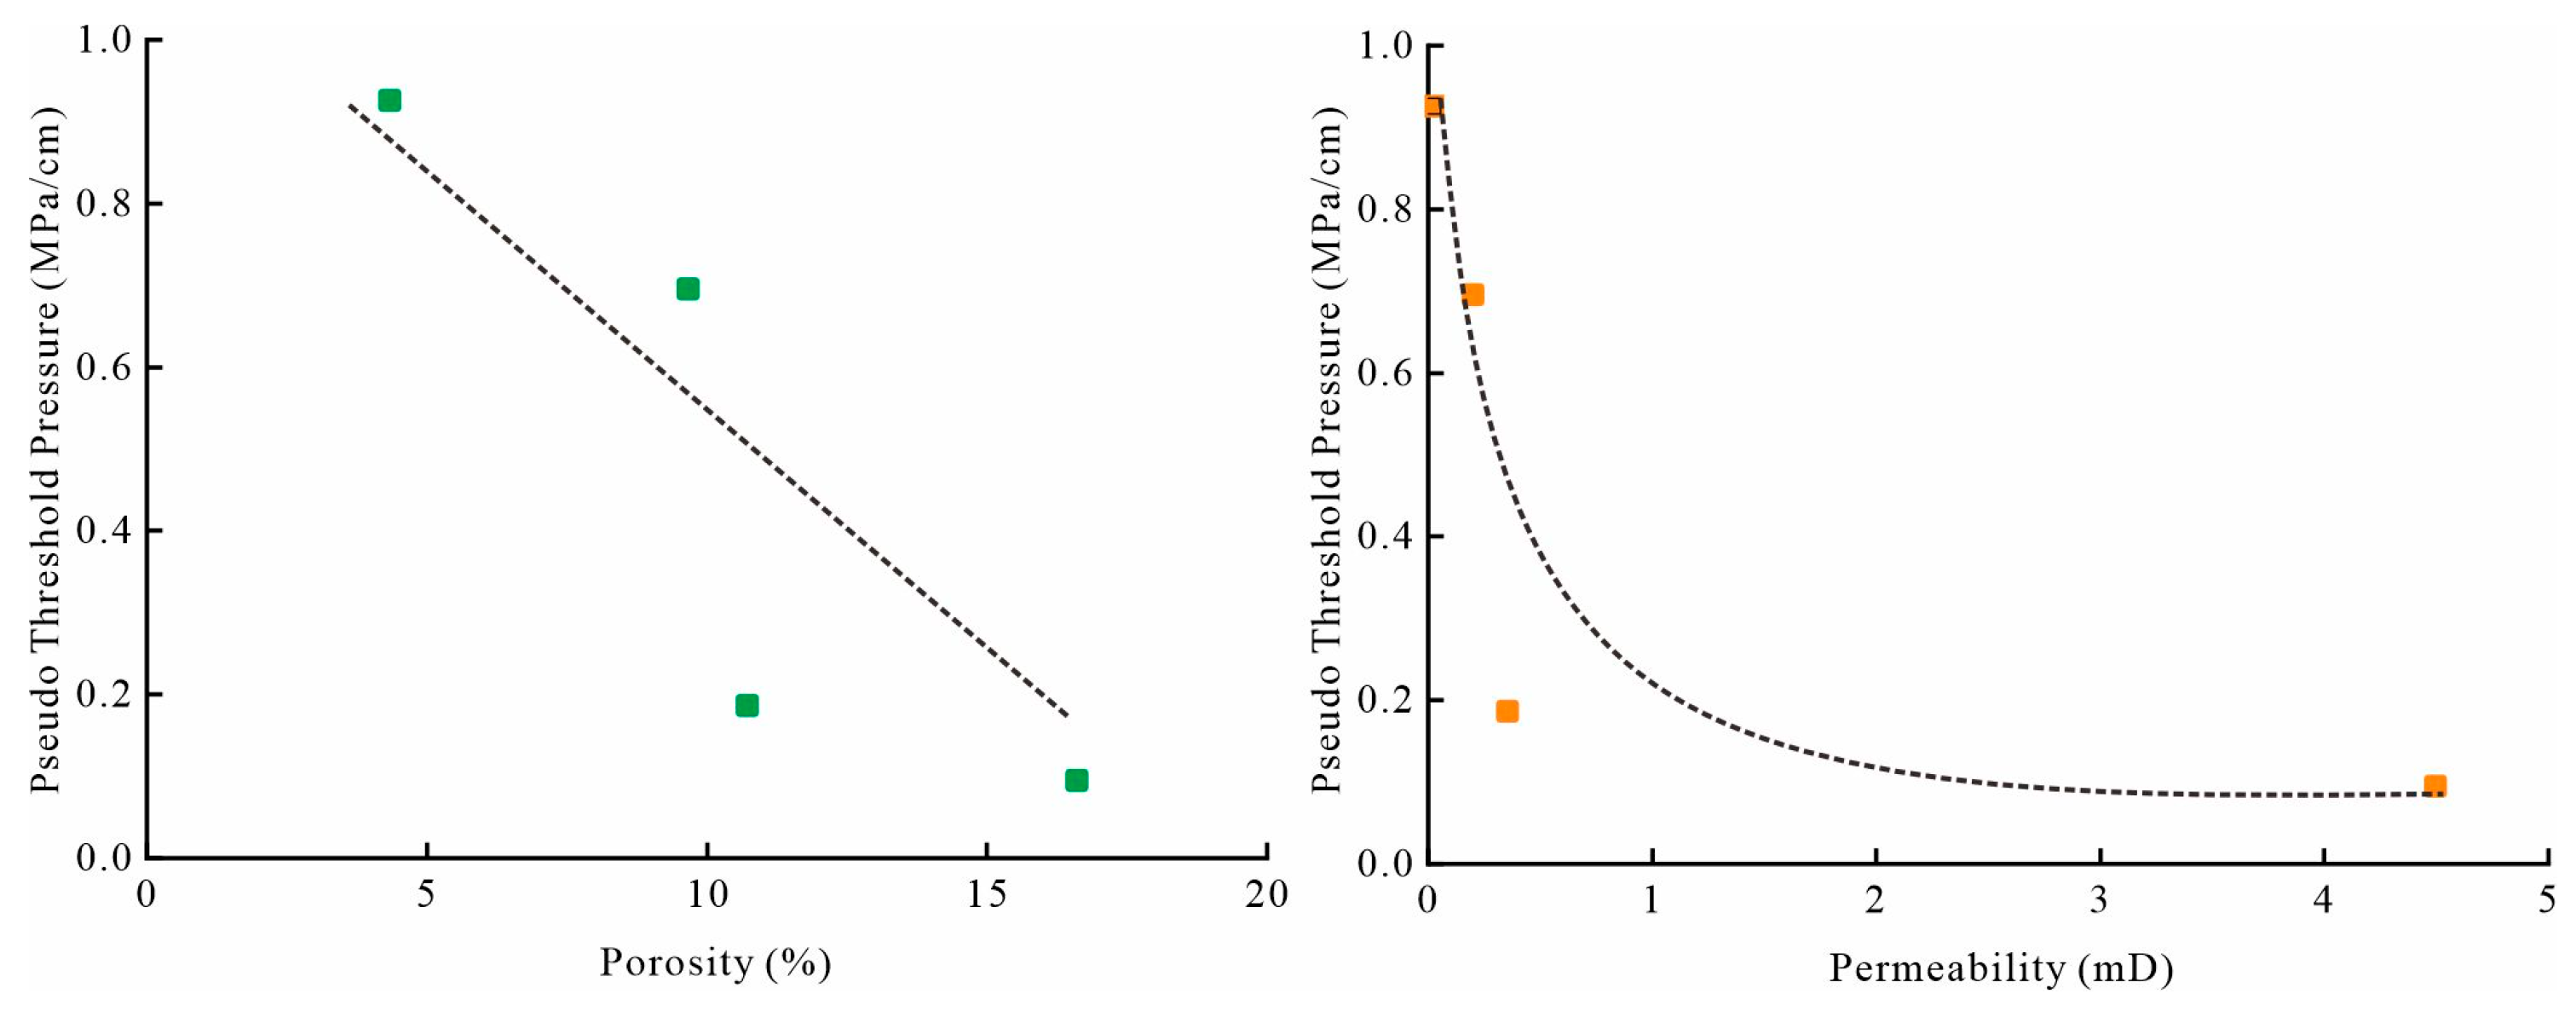
As shown in Figure 10, higher reservoir porosity indicates that more pore space is available for fluid flow, resulting in lower flow resistance. The higher the porosity, the better the fluid conductivity of the reservoir, allowing fluids to begin flowing under lower pressure gradients. Similarly, higher permeability enhances the reservoir’s ability to transmit fluids through the pore network, thus requiring a lower threshold pressure gradient for flow initiation. When the average pore–throat radius is larger, the flow channels are wider, fluid resistance is reduced, and the threshold pressure gradient needed to initiate flow is correspondingly lower.
Figure 10.
Relationship between Reservoir Properties and Threshold Pressure Gradient.
From Type I to Type IV samples, both the minimum and apparent threshold pressure gradients increase progressively. As the physical properties of the samples deteriorate, the pore–throat structure becomes increasingly complex, resulting in greater resistance to fluid flow.
4.5. Relative Permeability to Oil and Water
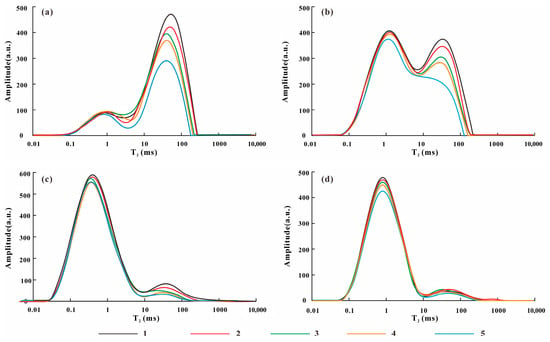
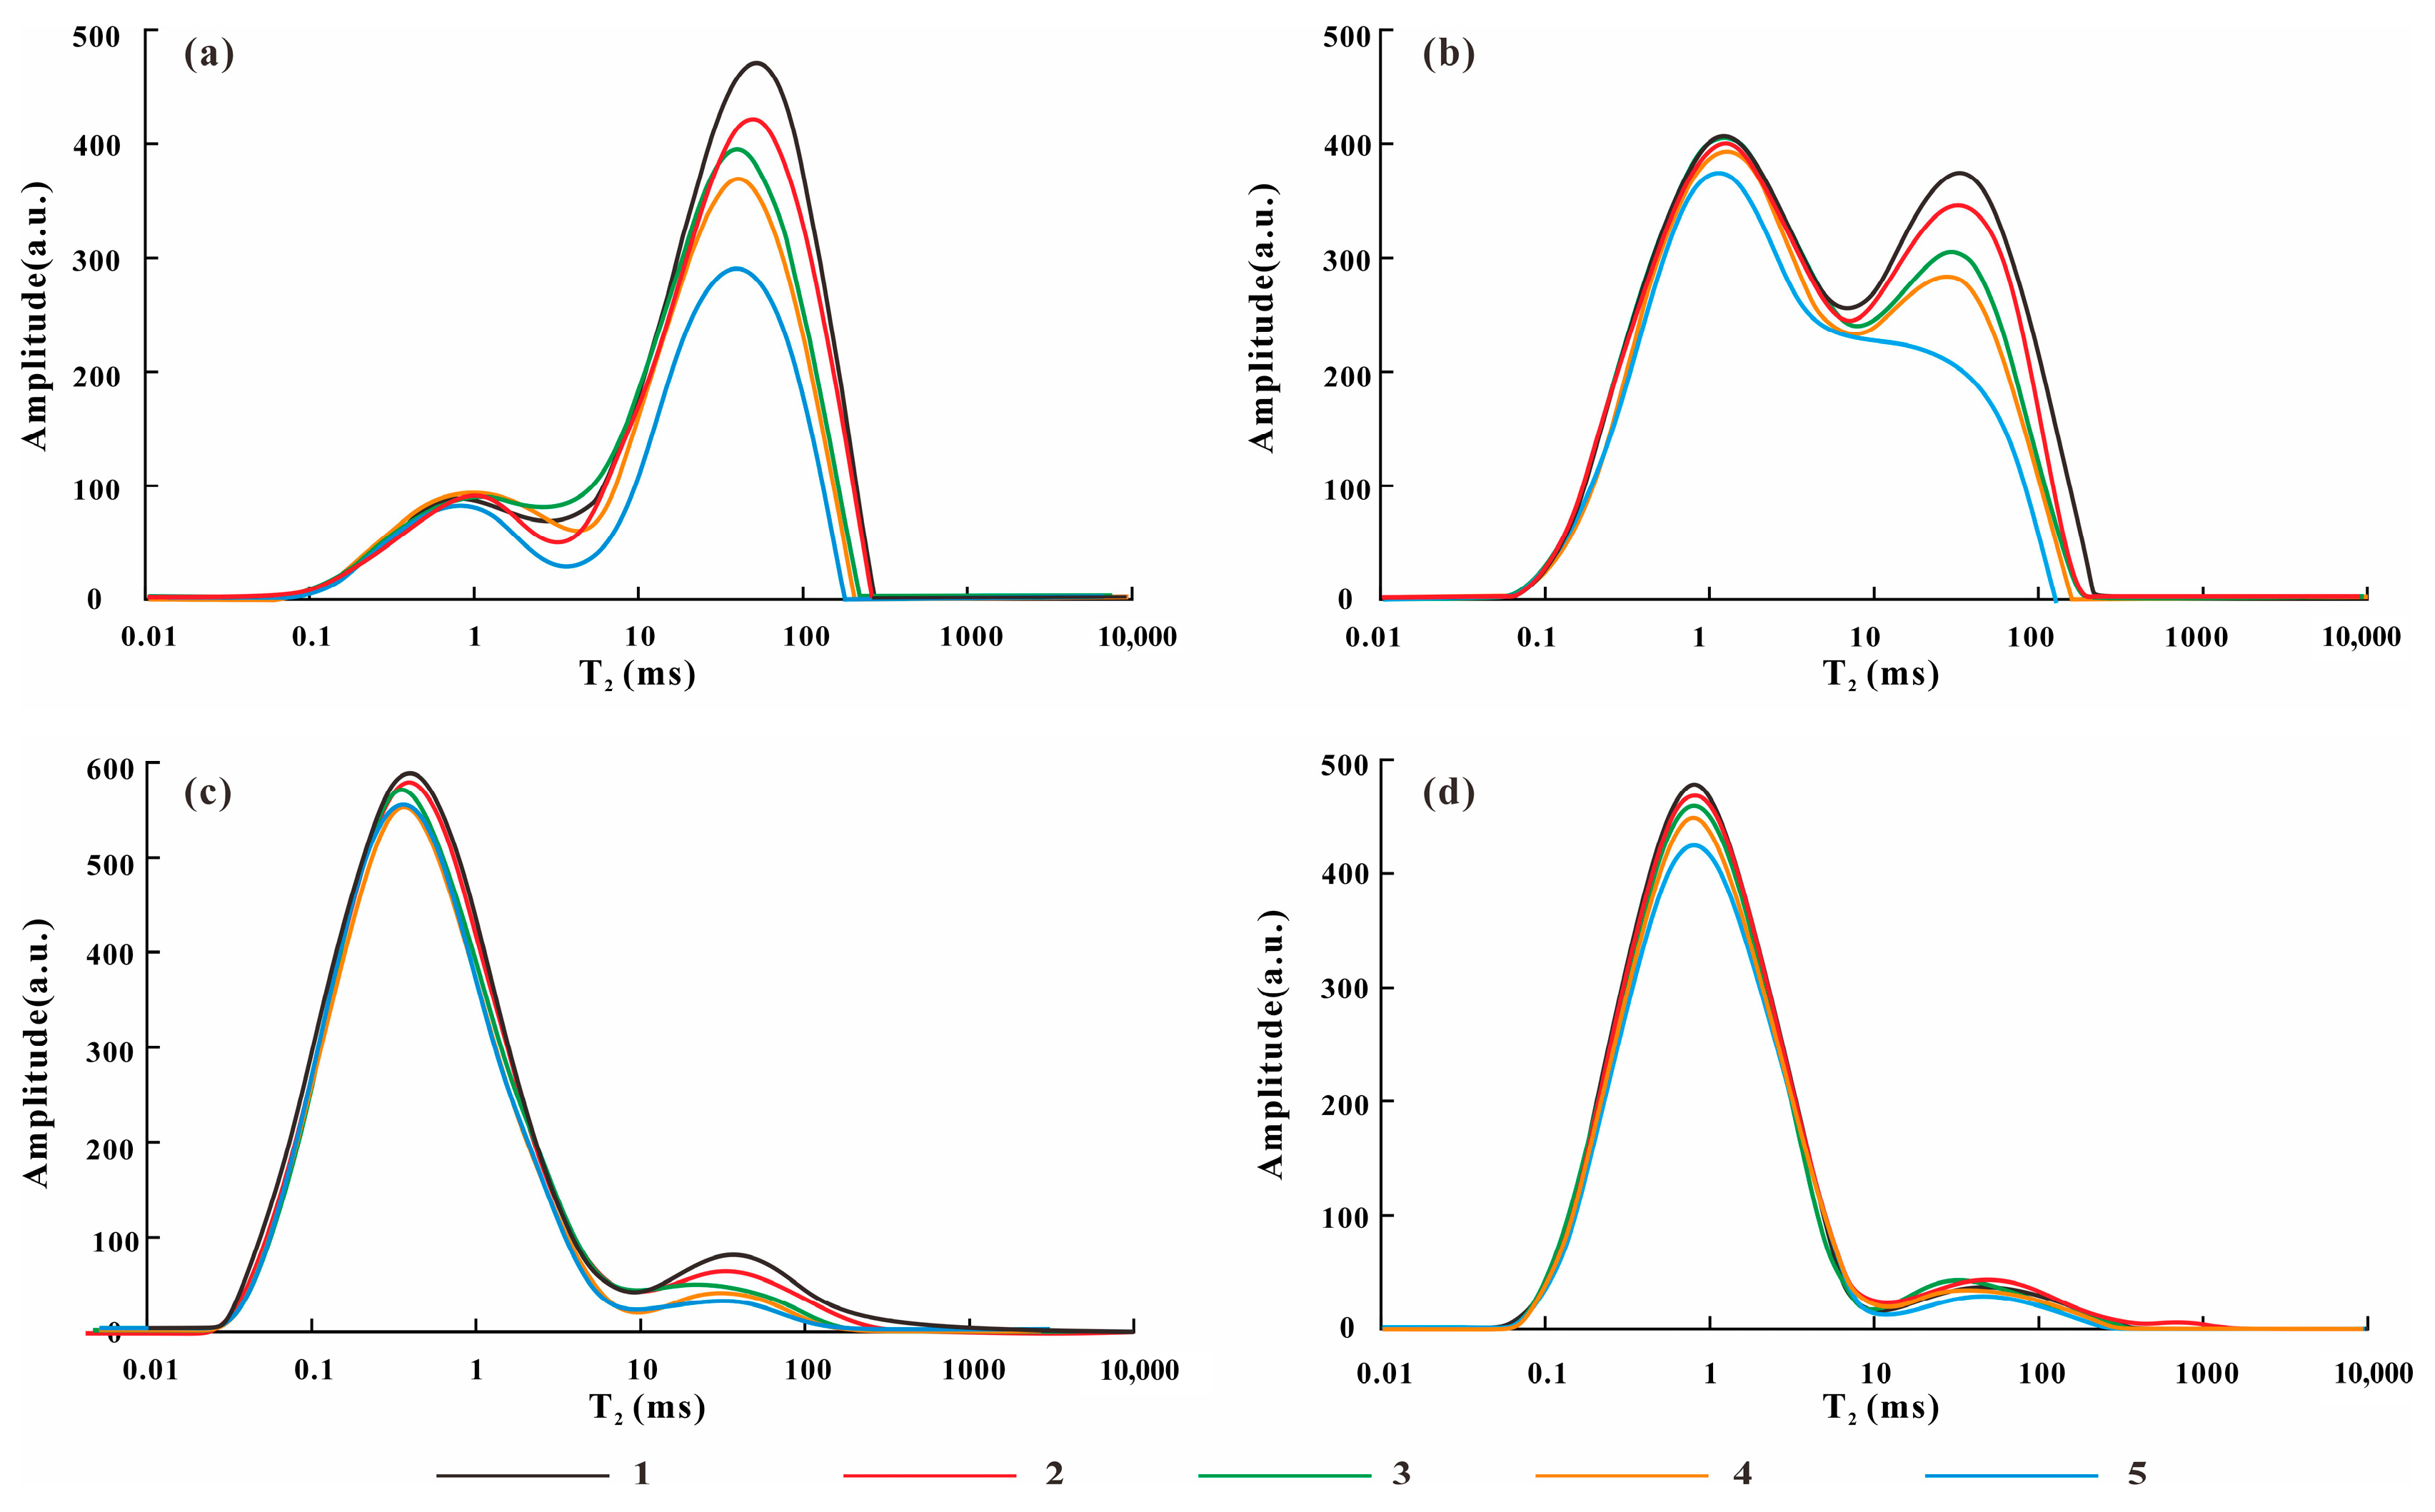
Four types of reservoir cores were selected for two-phase permeability experiments using NMR. During the unsteady-state water flooding process, oil content was monitored in real time by NMR. The evolution of T2 spectra during displacement is shown in Figure 11 (1–6 indicate the sequence of T2 measurements). Based on the characteristics of the T2 spectral peaks, the displacement process is similar to the centrifugation process: oil in macropores is displaced first, while part of the oil in mesopores is also expelled. Oil displacement occurs simultaneously in both mesopores and macropores.
Figure 11.
T2 spectra of tight oil reservoirs during the water flooding process ((a), J-1; (b), C-9; (c), P-2; (d), Y354; note that the number represents the sequence of the T2 spectrum curves during each displacement experiment).
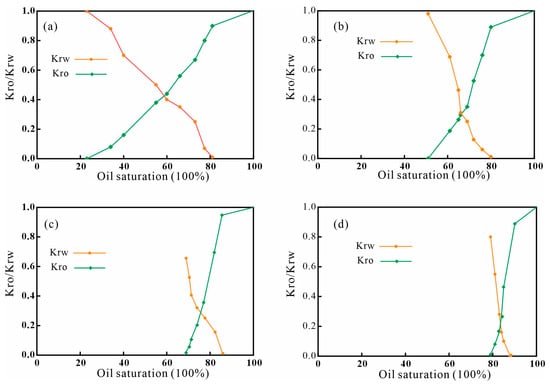
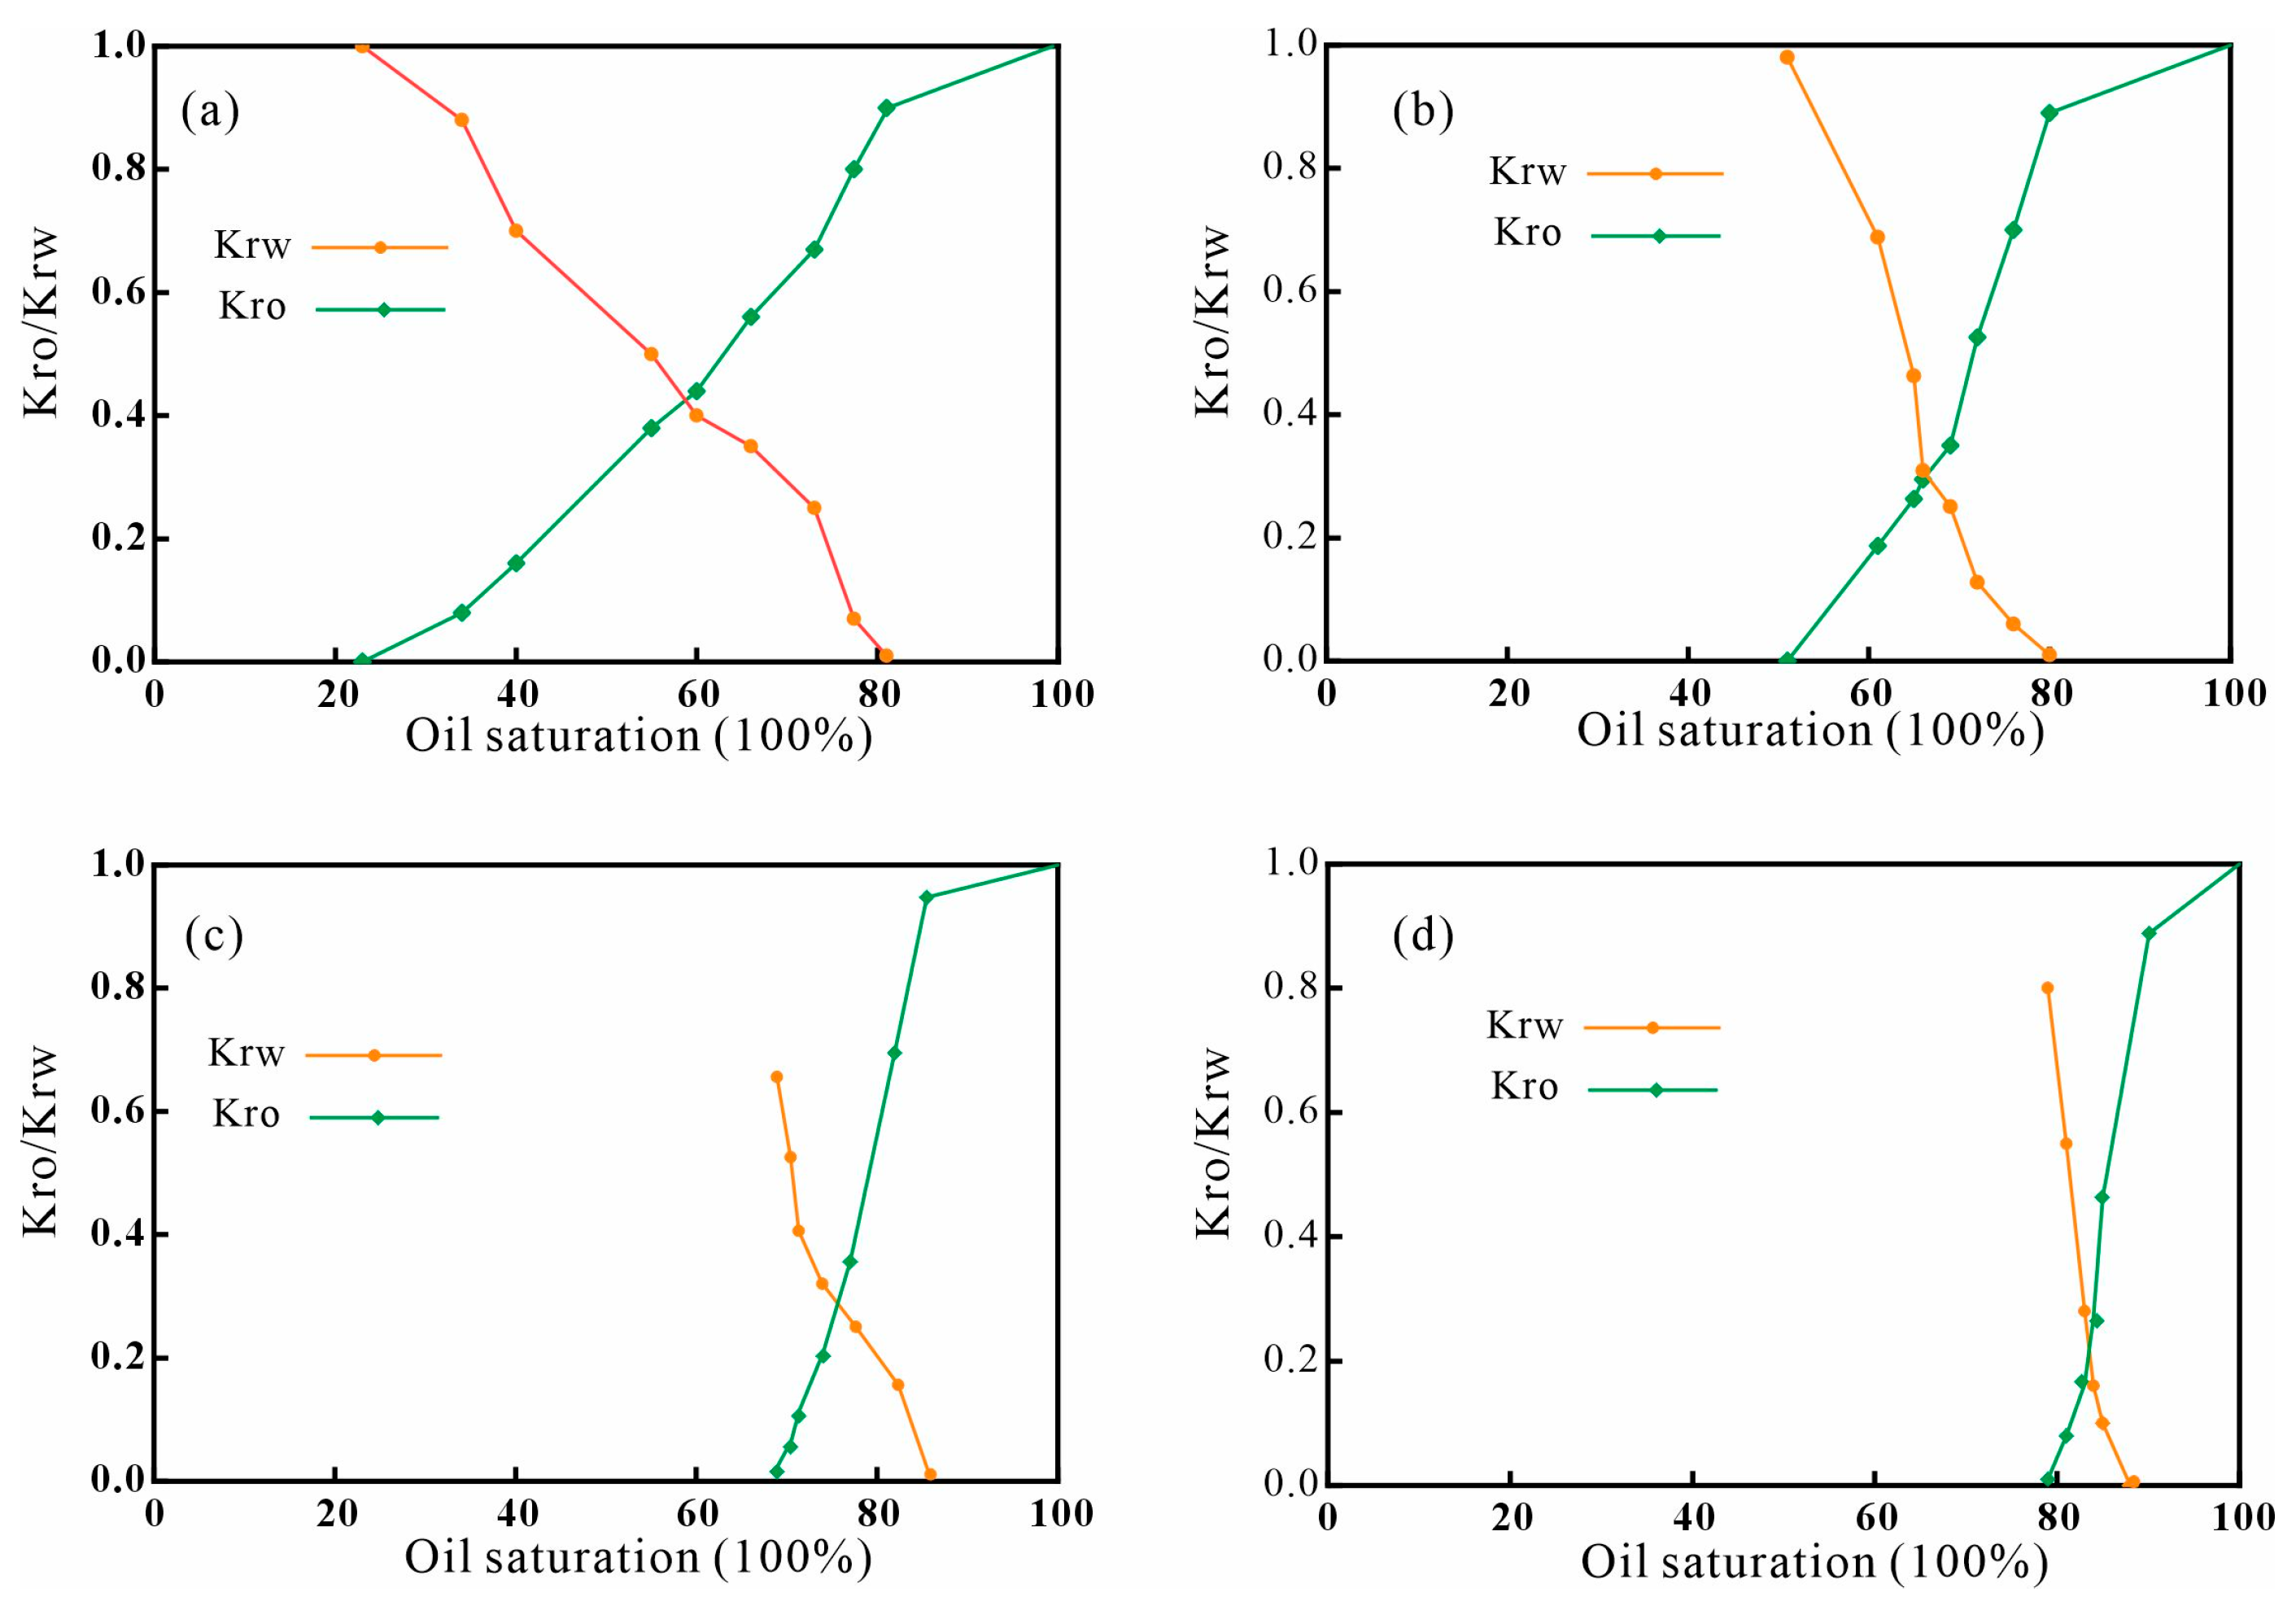
Two-phase permeability curves were calculated using the JBN method, as shown in Figure 12. The residual oil saturations are 22.1% for sample J-1, 51.5% for sample C-9, 69.1% for sample P-2, and 79.4% for sample Y354. Compared with the centrifugation mobility experiments, the residual oil saturation decreases after water flooding. Compared with tight sandstones in the Sichuan Basin [42], where the irreducible water saturation ranges from 27.5% to 82.4% with an average of 53.3%, the J-1 sample in this study exhibits a significantly lower residual oil saturation. This is primarily because the porosity and permeability characteristics of sample J-1 indicate that it no longer falls within the typical range of tight sandstone reservoirs. During water flooding, some micropores experience spontaneous imbibition under capillary forces, displacing part of the oil. In addition, due to the relatively uniform pore structure of the sandstones and the small viscosity difference between oil and water, viscous fingering is less likely to occur, leading to a piston-like displacement front that favors efficient oil recovery. The simultaneous and uniform displacement of oil from mesopores and macropores, as observed in the T2 spectra, supports this conclusion.
Figure 12.
Oil–water relative permeability curves for the four samples ((a): J-1; (b): C-9; (c): P-2; (d): Y354).
For the four samples, the oil–water equal permeability points shift progressively to the right from sample J-1 to Y354, indicating that oil becomes more difficult to displace. When oil and water have similar flow capacities, a higher oil saturation at the equal permeability point suggests that water occupies the central pore space. This phenomenon can indicate stronger oil-wet behavior of the reservoir, or it may also occur as reservoir quality deteriorates. The relative permeabilities of oil and water at the equal permeability point show a positive correlation with reservoir properties and the average pore–throat radius. This is because higher porosity and permeability imply a larger total pore volume, providing more effective channels for two-phase flow and reducing flow resistance. High-permeability reservoirs also exhibit better pore–throat connectivity and higher flow efficiency, minimizing the interference between oil and water phases and allowing equilibrium to be reached more easily.
Moreover, as reservoir quality decreases, the two-phase flow zone becomes narrower. The oil relative permeability (Kro) and water relative permeability (Krw) curves become steeper at low water saturation, indicating that fewer pores participate in flow. In contrast, the J-1 sample with better reservoir properties exhibits a wider two-phase flow zone, meaning that more pores contribute to flow and fewer pores remain immobile. However, Liu et al. [43] reported a relatively narrow two-phase flow region in tight sandstone samples from the Ordos Basin, despite a low mercury injection displacement pressure of only 0.18 MPa, which contrasts with our experimental observations. They attributed this phenomenon to the occurrence of strong fingering during displacement.
5. Discussion
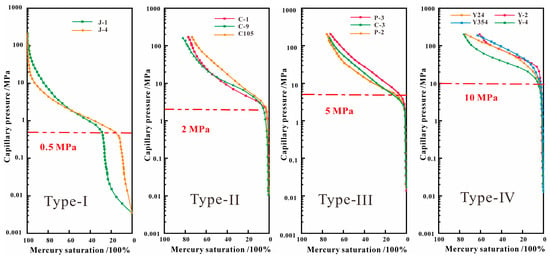
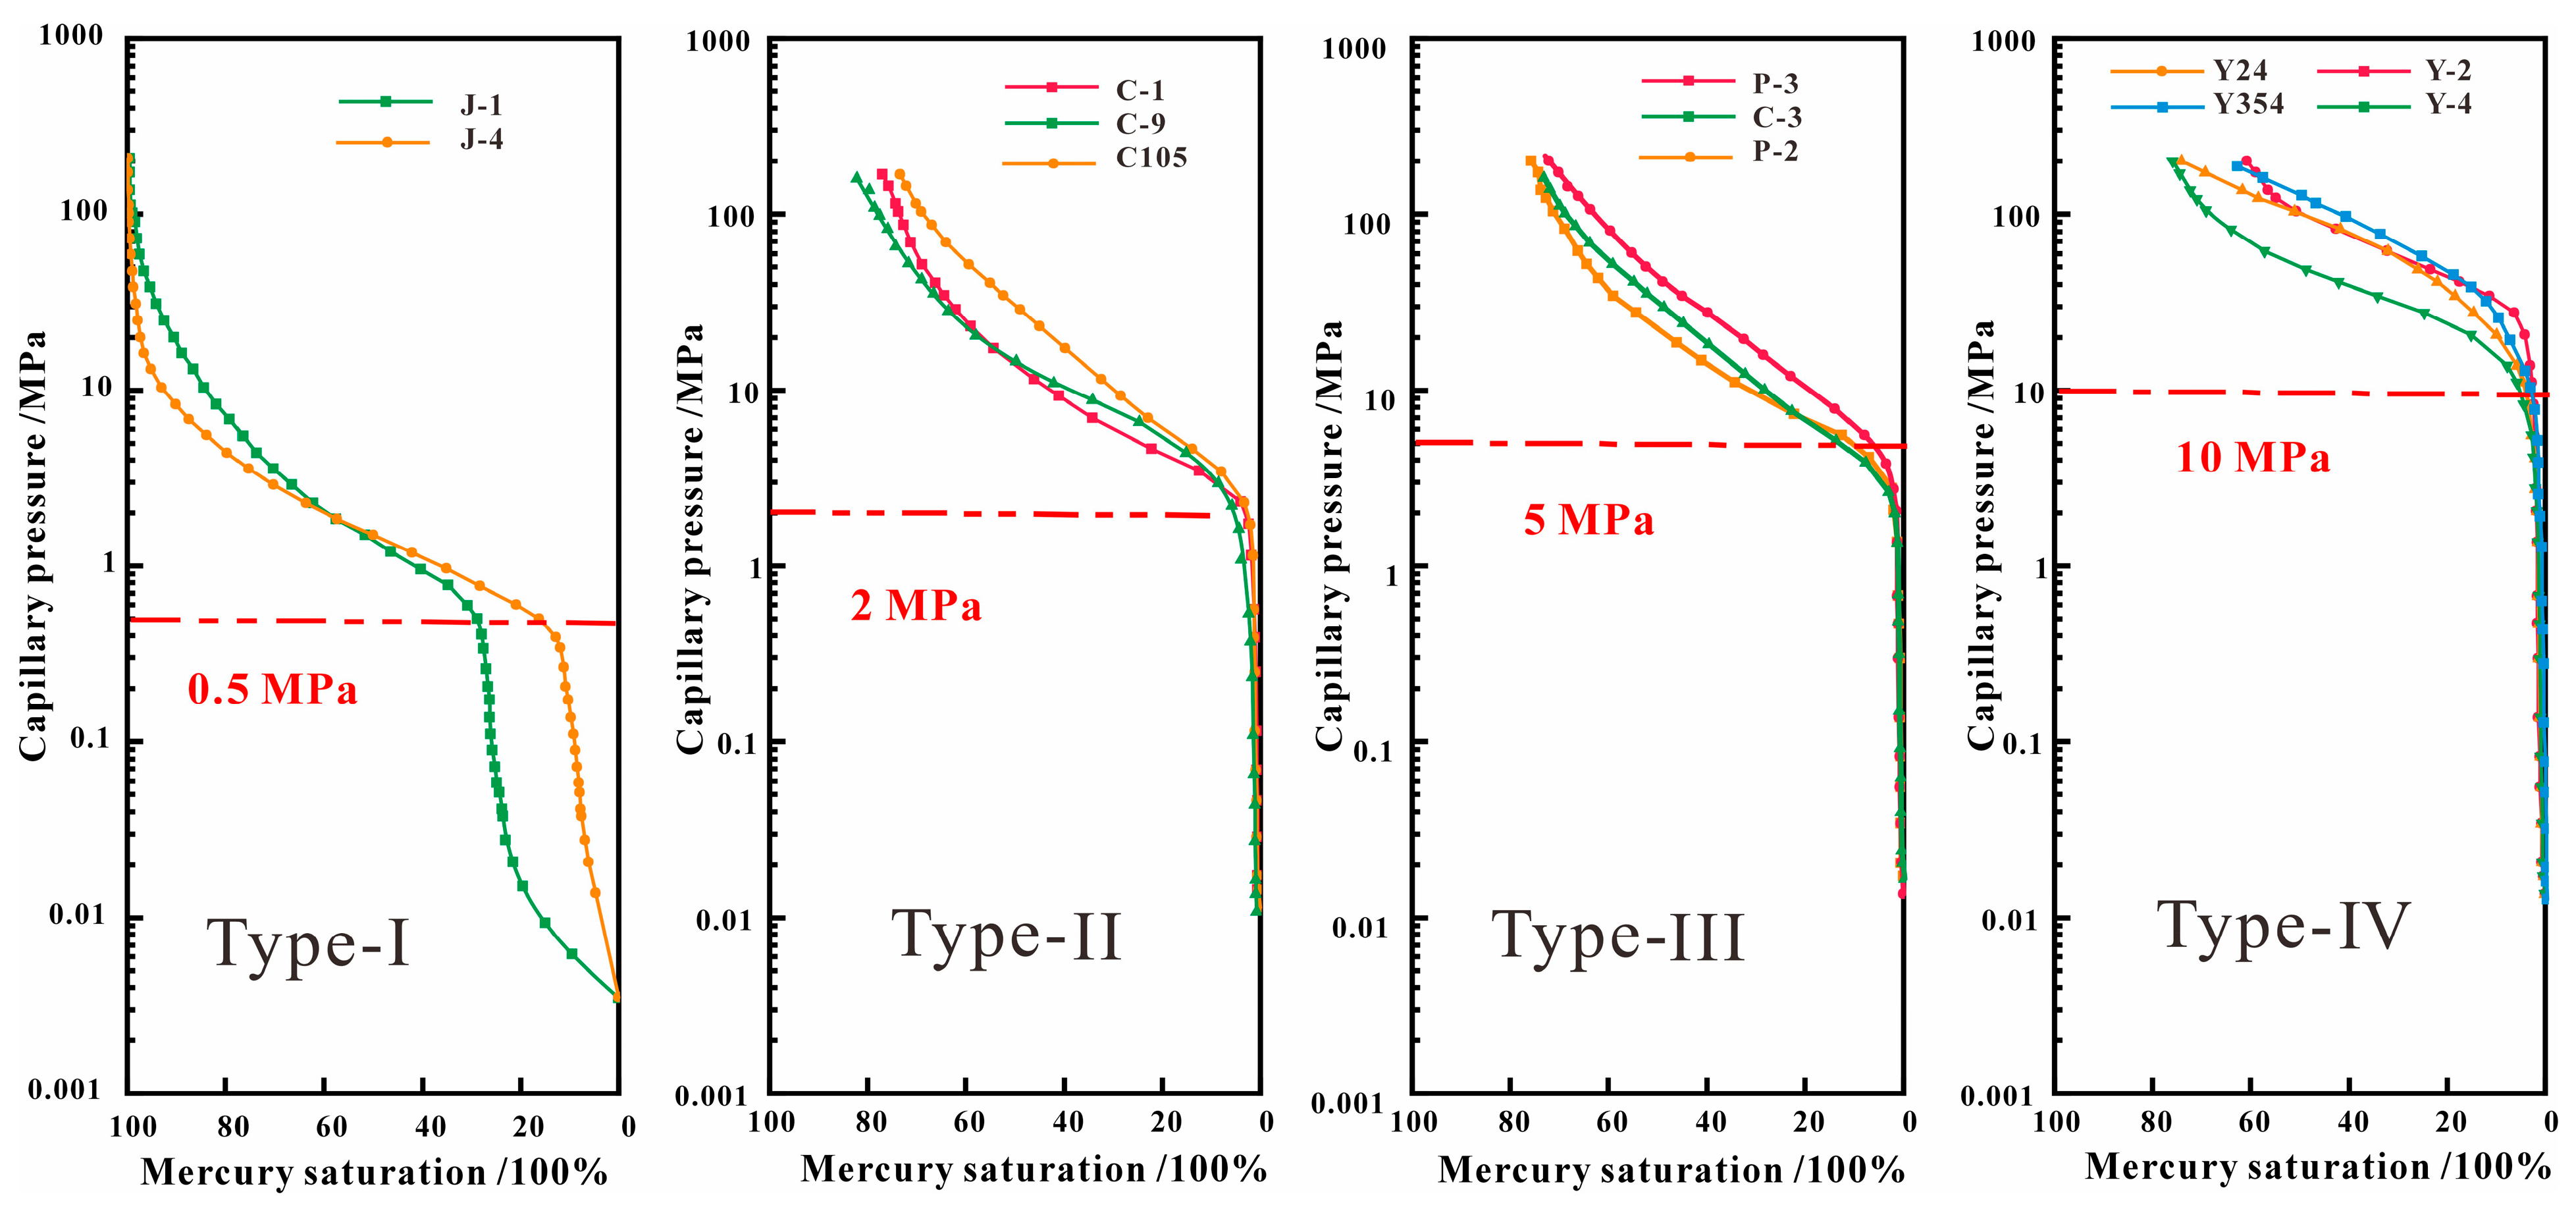
For reservoir classification and grading, porosity and permeability are the most important physical parameters. In this study, the classification was carried out by integrating mercury intrusion data with porosity and permeability measurements. In a mercury intrusion curve, distinct inflection points often appear on the pressure–volume plot, indicating significant changes in pore structure. Pores of different sizes respond differently to mercury injection: macropores are filled at low pressures, mesopores at intermediate pressures, and micropores or microfractures at high pressures. The primary inflection point typically corresponds to the dominant pore size of the reservoir, representing the main effective porosity, while additional inflection points may reflect secondary pore structures or capillary throat constrictions. Therefore, the overall pore size distribution can be inferred from the characteristic inflection pressures. As shown in Figure 13, four distinct inflection pressures—0.5, 2, 5, and 10 MPa—were identified among the twelve samples analyzed.
Figure 13.
Mercury intrusion curves of the 12 samples and their classification (dashed lines represent the corresponding inflection pressures).
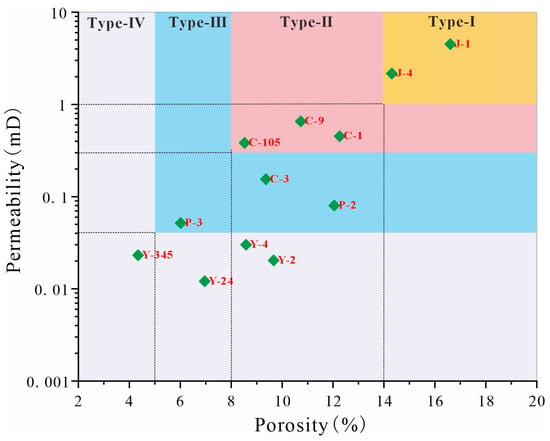
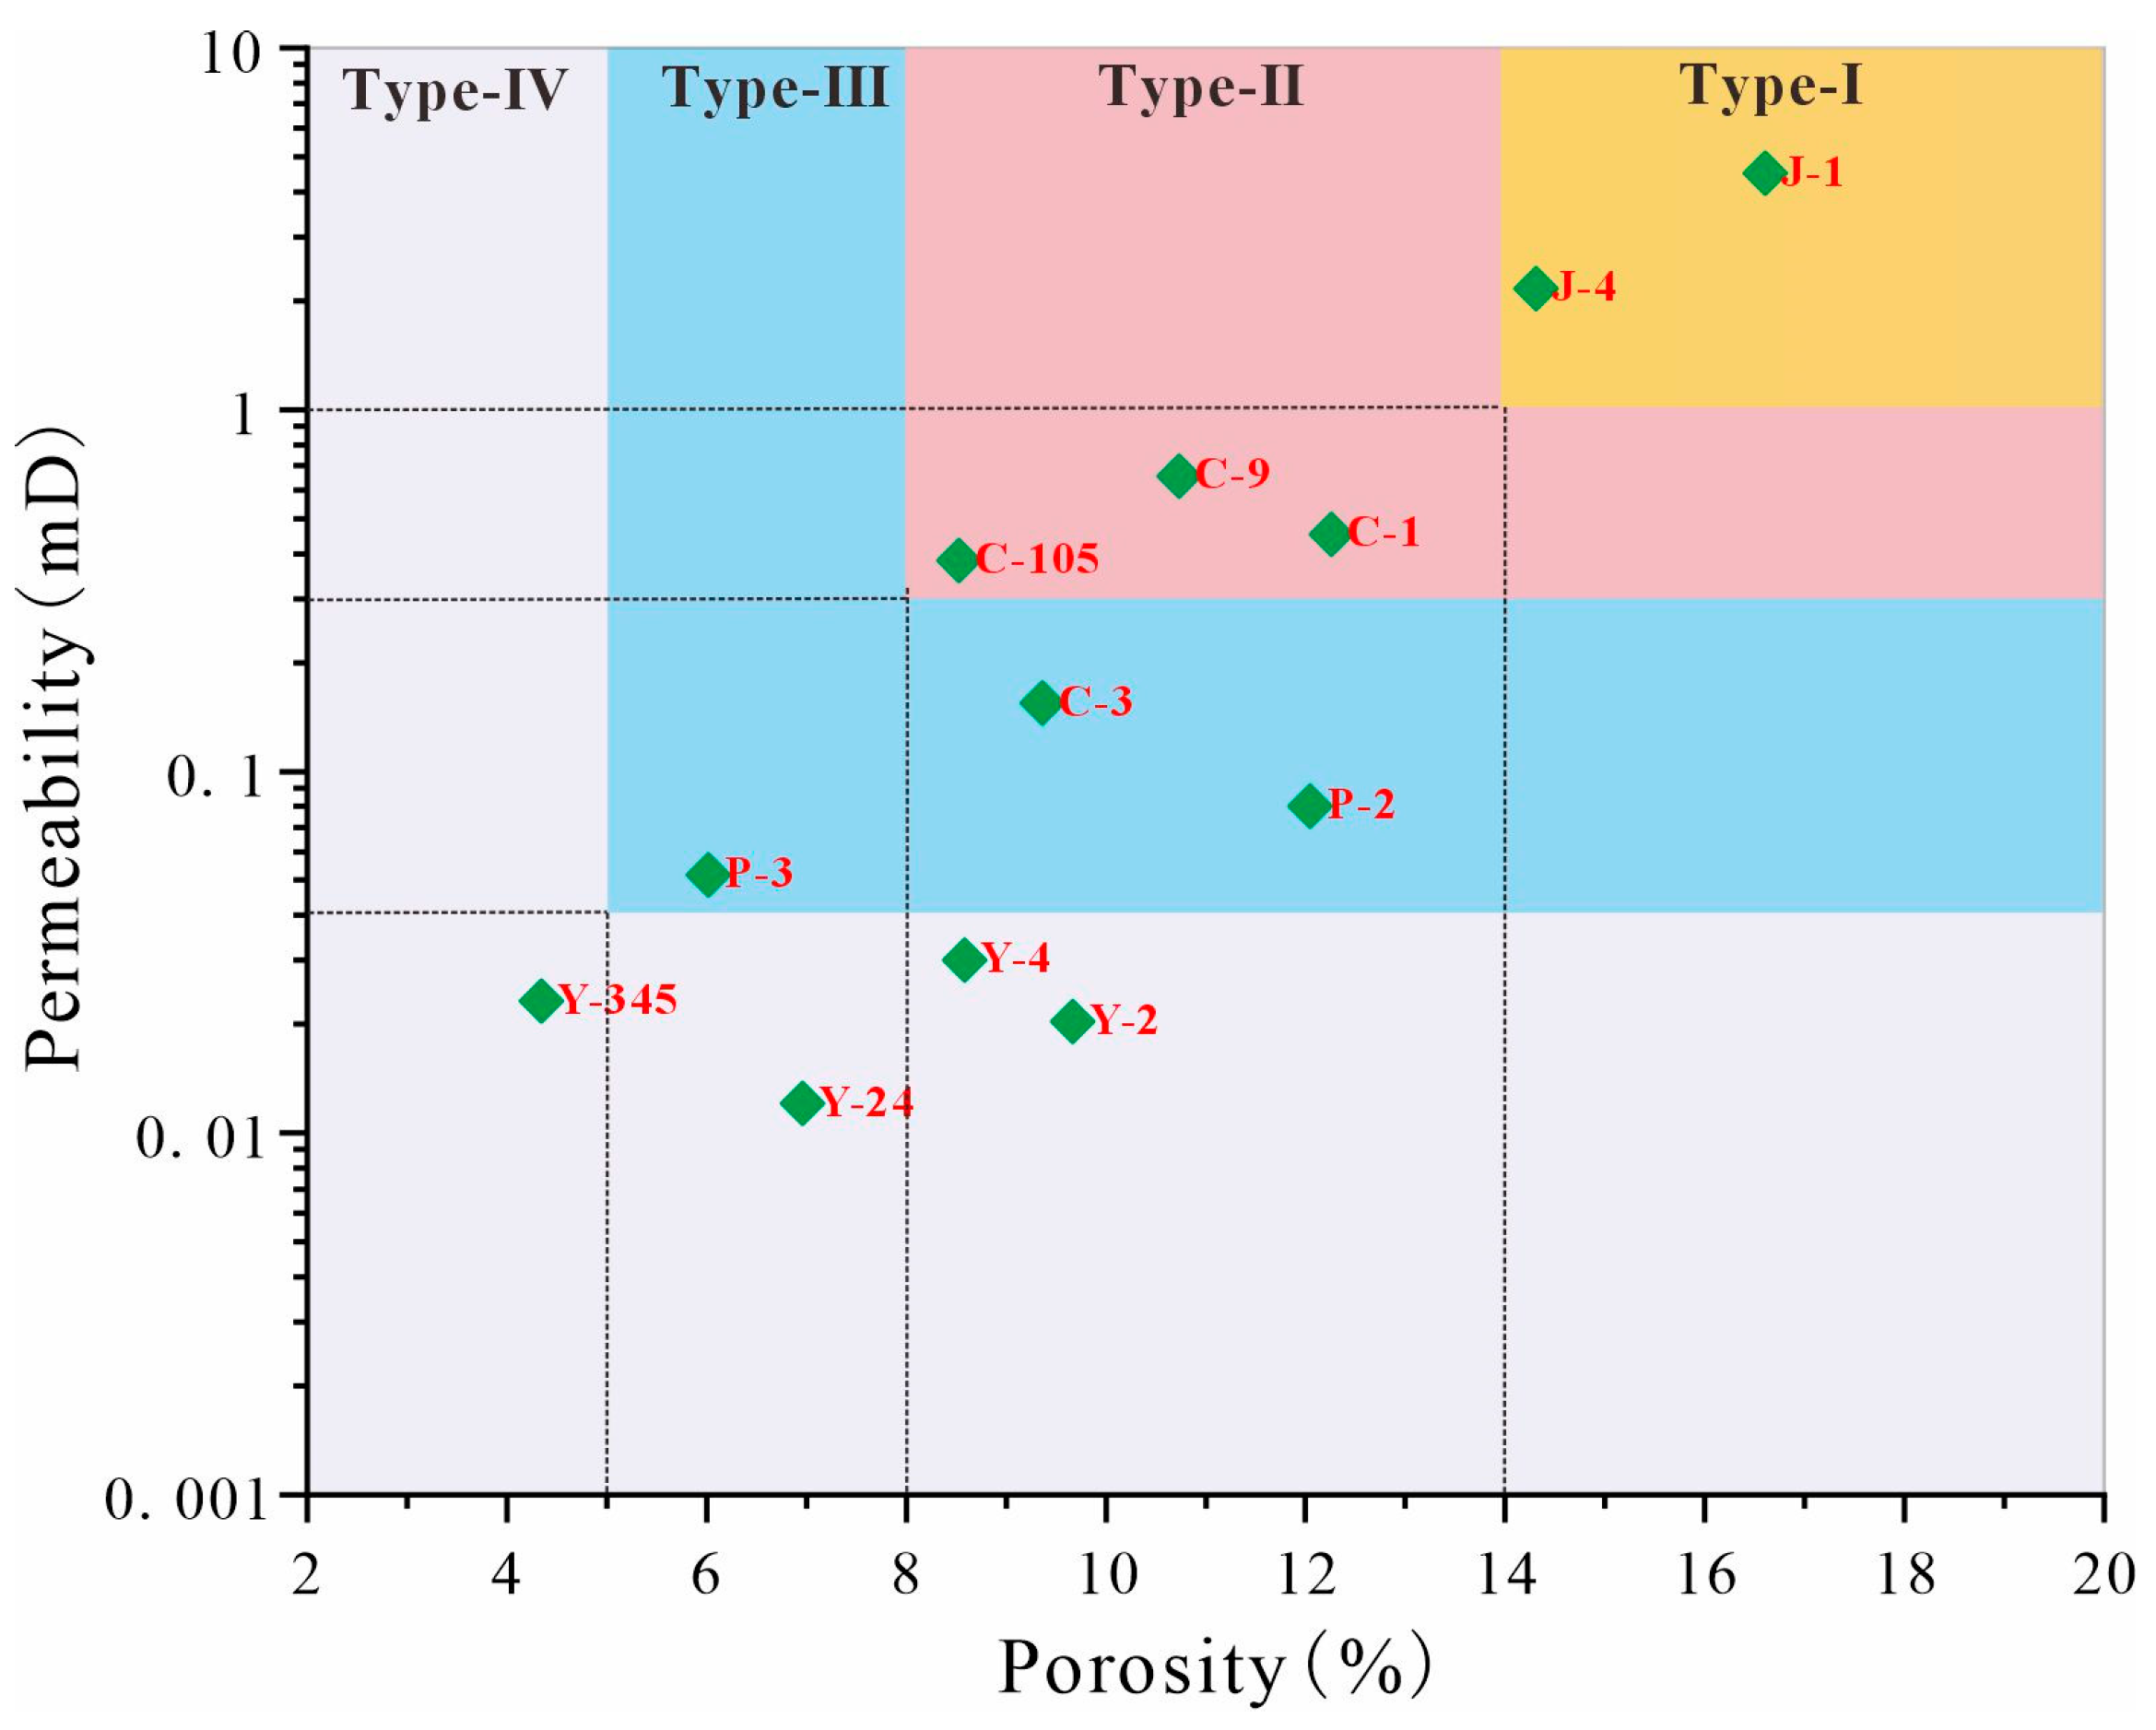
Kong et al. [41] classified tight sandstones in the Linxing area of the Ordos Basin into four categories, with porosity thresholds of 10%, 9%, and 6%, and corresponding permeability thresholds of 10, 1, and 0.2 mD. Jia et al. [44] conducted a statistical analysis of tight oil reservoirs from the Sichuan Basin, Ordos Basin, and Junggar Basin in China, as well as the Bakken Formation in the United States, and classified them into four categories based on porosity: >10%, 7–10%, 4–7%, and <4%. For tight sandstones in the Songliao Basin, Fang et al. [45] classified them into three categories using porosity thresholds of 8% and 5% and permeability thresholds of 0.2 mD and 0.04 mD. Building upon the classification scheme proposed by Fang et al., we further refined the categories based on mercury intrusion curve characteristics. As shown in Figure 14, for samples with porosity greater than 8% (J-1, J-4, C-1, and C-9), analysis of NMR T2 spectra and mercury injection curves revealed significant differences among these samples. Therefore, an additional subdivision at 14% porosity was introduced to better distinguish their reservoir characteristics. Therefore, the boundaries of porosity and permeability were further defined on the porosity–permeability cross-plot to establish the classification criteria for the four reservoir types. Specifically, for Type I reservoirs, porosity is greater than 14% and permeability exceeds 1 mD, with an inflection pressure of 0.5 MPa; for Type II reservoirs, porosity ranges from 8% to 14% and permeability from 0.3 to 1 mD, with an inflection pressure of 2 MPa; for Type III reservoirs, porosity ranges from 5% to 8% and permeability from 0.04 to 0.3 mD; and for Type IV reservoirs, porosity is less than 5% and permeability is below 0.04 mD.
Figure 14.
Classification standards for the four reservoir types (yellow—Type I, pink—Type II, blue—Type III, grey—Type IV).
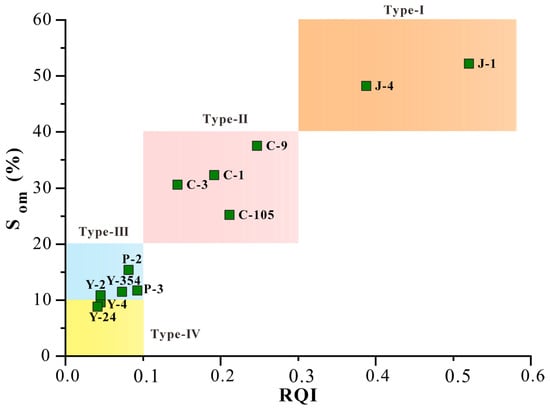
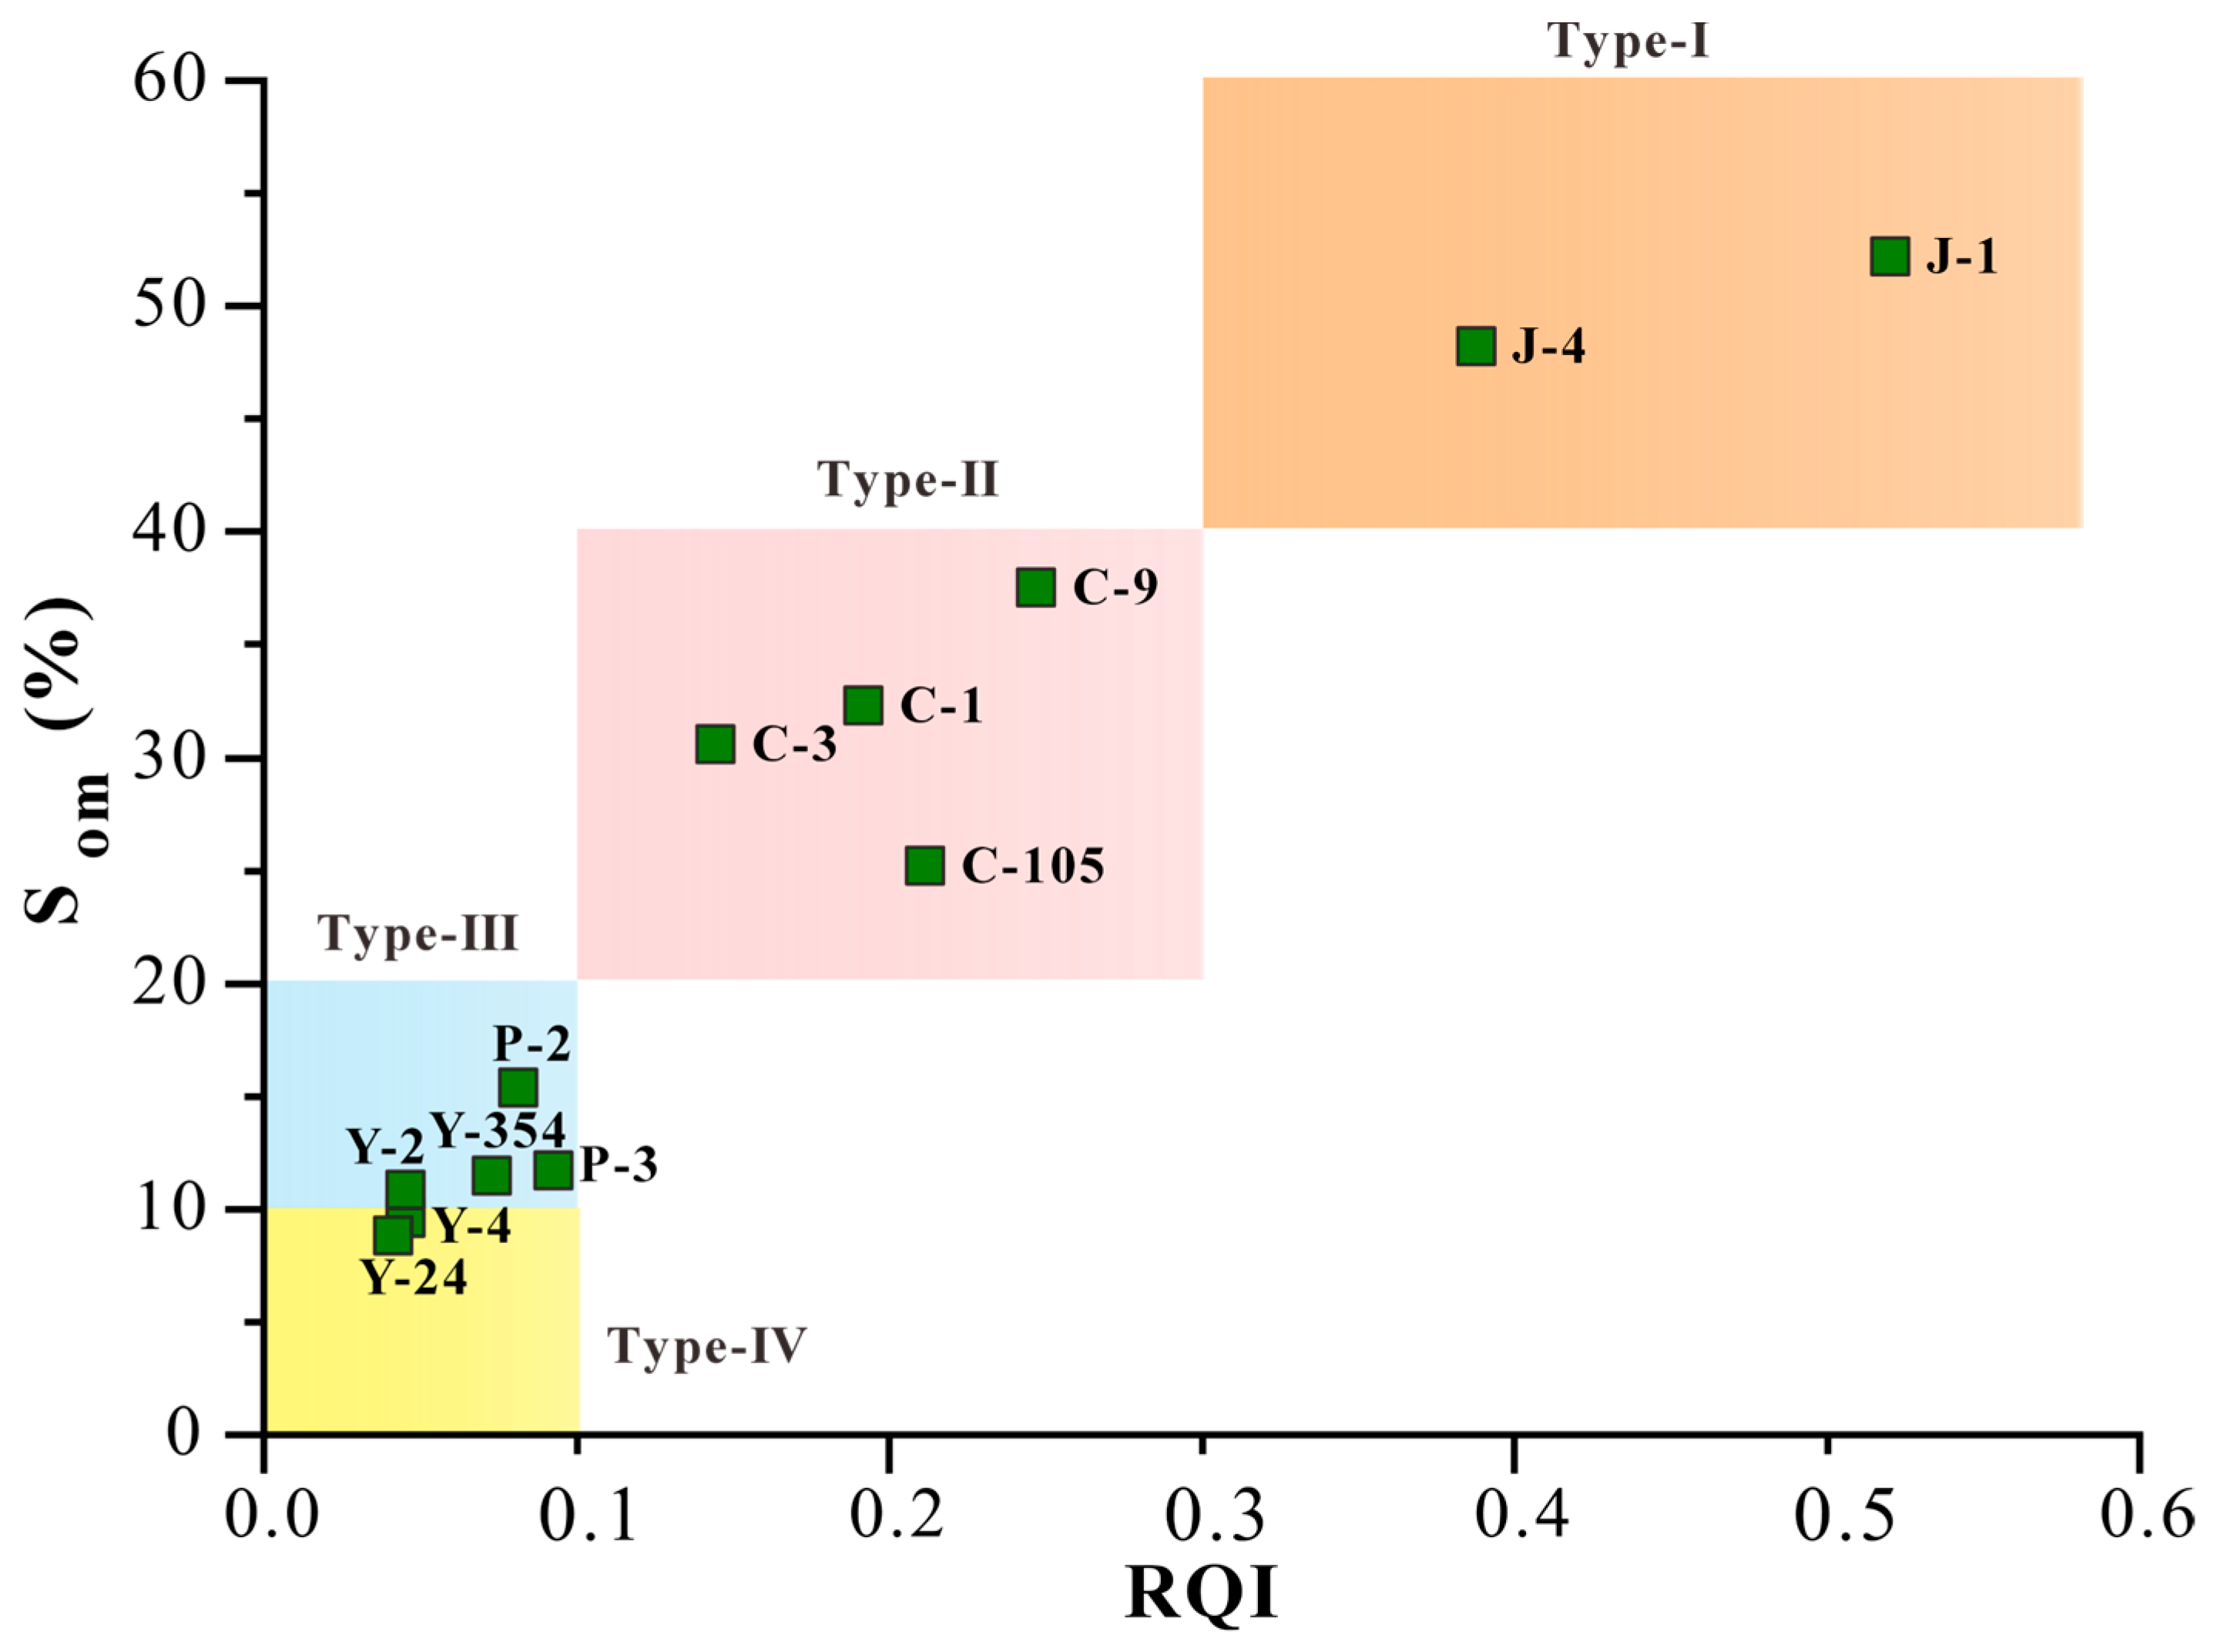
Porosity reflects the storage capacity of a reservoir, with higher porosity providing greater space for fluid accumulation, whereas permeability quantifies the rock’s ability to transmit fluids. Together, these parameters govern fluid mobility within the reservoir. In this study, the Reservoir Quality Index (RQI = ) was employed as a key metric to evaluate the integrated performance of the reservoir [46]. By combining porosity and permeability, the RQI effectively captures both storage and flow capacities. The RQI values were then cross-plotted against movable fluid saturation (movable oil saturation) obtained from centrifugation experiments to establish a classification and grading framework that simultaneously accounts for fluid mobility and reservoir quality (Figure 15).
Figure 15.
Classification and grading scheme integrating fluid mobility and reservoir quality (orange—Type I, pink—Type II, blue—Type III, yellow—Type IV).
The results indicate that movable fluid saturation increases markedly with the reservoir quality index. Rocks with higher RQI values exhibit better-developed pore structures and higher connectivity, facilitating more efficient fluid migration. Based on crude oil mobility and the reservoir quality factor, the reservoirs were classified into four categories, with representative samples from each category selected for threshold pressure gradient and two-phase relative permeability tests.
Type I reservoirs possess favorable porosity and permeability, resulting in low threshold pressure gradients and high movable oil saturations. Specifically, these high-quality permeable reservoirs have RQI > 0.6, movable oil saturation > 40%, wide two-phase flow zones on relative permeability curves, low threshold pressure gradients, and oil saturations approaching 50% at the equal-permeability point. These reservoirs represent prime sweet spots for exploration and development.
Type II reservoirs exhibit moderate reservoir quality, with RQI values between 0.1 and 0.3 and movable oil saturations of 20–40%. Compared with Type I reservoirs, they show higher threshold pressure gradients, narrower two-phase flow zones, and slightly elevated oil saturations at the equal-permeability point, making them suitable for targeted exploration and development.
Type III reservoirs correspond to oil-bearing tight reservoirs with RQI < 0.1, porosity of 5–8%, and permeability of 0.04–0.3 mD. These reservoirs are characterized by low crude oil mobility (10–20%), high threshold pressure gradients, and narrow two-phase flow zones, indicating limited natural producibility.
Type IV reservoirs have porosity < 5%, permeability < 0.04 mD, and RQI < 0.1. Crude oil mobility is extremely low (<10%), reflecting poor connectivity and minimal fluid flow potential. These reservoirs are considered non-effective tight reservoirs with limited exploration and development potential, and conventional exploitation is generally not recommended.
For Type III and IV reservoirs, reservoir stimulation and production-enhancement technologies are critical. Advanced fracturing strategies—including multistage fracturing, refracturing, and complex hybrid fracturing—should be implemented to increase fracture complexity and improve hydrocarbon recovery efficiency.
6. Conclusions
The present study systematically characterizes and classifies tight sandstone reservoirs in the Fuyu oil layer of the Songliao Basin, integrating geological, petrophysical, and fluid flow perspectives. Using a combination of high-pressure mercury intrusion, nuclear magnetic resonance, centrifugation, and two-phase relative permeability experiments, the reservoirs were evaluated in terms of pore structure, connectivity, and fluid mobility. Based on these properties, four reservoir types were delineated. Type I reservoirs, exhibiting high porosity and permeability, represent sweet spots with favorable fluid flow and high development potential. Type II and III reservoirs display intermediate properties, with reduced mobility and more complex pore–throat networks, suggesting that targeted stimulation techniques may be required to enhance hydrocarbon recovery. Type IV reservoirs, characterized by low porosity, poor connectivity, and minimal fluid mobility, are less amenable to conventional production methods. The findings underscore the critical influence of pore structure and fluid flow behavior on reservoir performance and highlight the necessity of integrating multi-scale experimental data to inform reservoir evaluation. The classification framework established here provides a quantitative and practical tool for identifying high-quality zones, optimizing development strategies, and improving resource management in the Fuyu oil layer. Furthermore, this approach can serve as a reference for reservoir characterization and exploration in other tight sandstone systems in China, supporting more effective and targeted hydrocarbon exploitation.
Author Contributions
Conceptualization, H.Z. and Q.L.; methodology, H.Z., L.Y. and C.W.; investigation, G.Y., X.S., L.Y. and J.H.; resources, Q.L. and L.Y.; writing—original draft preparation, H.Z. and L.Y.; writing—review and editing, X.S., X.Z. and M.Z. All authors have read and agreed to the published version of the manuscript.
Funding
This research received no external funding.
Data Availability Statement
The data presented in this study are available on request from the corresponding author. (The data used in this study were collected from a research area that involves a confidentiality agreement signed with a company).
Conflicts of Interest
Authors Hailong Zhang, Qingxiang Lin, Li Yang, Jian He, Guang Yang, Mingwei Zhang and Xiaofeng Zhang were employed by the company Daqing Oilfield Co., Ltd. Downhole Operations Branch. Author Chenyu Wang was employed by PetroChina Tarim Oilfield Company. The remaining authors declare that the research was conducted in the absence of any commercial or financial relationships that could be construed as a potential conflict of interest.
References
- Jia, C.Z.; Zhang, M.; Zhang, Y.F. Unconventional hydrocarbon resources in China and the prospect of exploration and development. Pet. Explor. Dev. 2012, 39, 139–146. [Google Scholar] [CrossRef] [Scilit]
- Yin, J.; Chen, H.; Wang, H.Y.; Sharma, M. The benefits and challenges of well monitoring of Gulong shale oil. Earth Energy Sci. 2025, 1, 120–122. [Google Scholar] [CrossRef] [Scilit]
- Zheng, H.; Liao, R.Q.; Cheng, N.; Shi, S.Z. Microscopic mechanism of fracturing fluid imbibition in stimulated tight oil reservoir. J. Pet. Sci. Eng. 2021, 202, 108533. [Google Scholar] [CrossRef] [Scilit]
- Bai, X.; Li, J.; Fu, X.; Xu, M.; Bai, Y.; Su, Y.; Cui, K.; Xu, Q.; Liu, Z.; Liu, Y. Coupling thermal and maturity histories of the Gulong shale oil reservoir in the Songliao Basin: Insights from vitrinite reflectance and apatite fission track. Unconv. Resour. 2025, 6, 100178. [Google Scholar] [CrossRef] [Scilit]
- Kong, X.Y.; Wang, X.J.; Li, Z.W.; Zhu, P.; Dong, Y.X.; Luo, Q.; Zhong, Z.Q.; Liu, Z.B.; Tan, J. Formation mechanisms and distribution patterns of fractures in shale reservoirs: A case study of the Lucaogou Formation, Jimsar Sag, Junggar Basin. J. Earth Sci. 2025, 36, 2373–2379. [Google Scholar] [CrossRef] [Scilit]
- Tang, H.; Kou, G.; Zhou, H.; Liu, W.; Duan, X.; Zhan, S.; Li, H.; Li, Q. Microscopic pore-throat classification and reservoir grading evaluation of the Fengcheng formation in shale oil reservoir. Unconv. Resour. 2024, 4, 100074. [Google Scholar] [CrossRef] [Scilit]
- Qi, M.; Li, W. Identification of diagenetic facies logging of tight oil reservoirs and their impact on reservoir quality. Minerals 2022, 12, 913. [Google Scholar] [CrossRef] [Scilit]
- Lu, J.; Liu, M.; Liu, K.; Zou, Y. A novel method for quantitative evaluation of oil content and mobility in shale oil reservoirs by NMR logging: A case study of the inter-salt shale oil in the Jianghan Basin. Unconv. Resour. 2024, 4, 100067. [Google Scholar] [CrossRef] [Scilit]
- Zhao, X.Z.; Pu, X.G.; Jin, F.M.; Bai, G.P.; Shi, Z.N.; Xie, D.L.; Liu, X.P. Paleogene lacustrine tight shale oil system, Huanghua subbasin, Bohai Bay Basin: Sweet spot delineation, production breakthrough, and implications. AAPG Bull. 2025, 109, 147–179. [Google Scholar] [CrossRef] [Scilit]
- Dutton, S.P.; Finley, R.J. Controls on reservoir quality in tight sandstones of the Travis Peak Formation, East Texas. SPE Form Eval. 1988, 3, 97–104. [Google Scholar] [CrossRef] [Scilit]
- Pershin, I.M.; Pervukhin, D.A.; Ilyushin, Y.V.; Afanaseva, O.V. Design of distributed systems of hydrolithospere processes management. Selection of optimal number of extracting wells. IOP Conf. Ser. Earth Environ. Sci. 2017, 87, 032030. [Google Scholar] [CrossRef] [Scilit]
- La Fontaine, N.M.; Le, T.; Hoffman, T.; Hofmann, M.H. Integrated outcrop and subsurface geomodeling of the Turonian Wall Creek Member of the Frontier Formation, Powder River Basin, Wyoming, USA. Mar. Pet. Geol. 2021, 125, 104795. [Google Scholar] [CrossRef] [Scilit]
- Mountain, J.O.; Perry, L.; Ghanbarian, B.; Temizel, C.; Çetin, C. Characterizing pore-throat size distributions in Mesaverde tight gas sandstones using generalized normal distribution. Transp. Porous Media 2025, 152, 69. [Google Scholar] [CrossRef] [Scilit]
- Wang, J.; Jiang, Z.; Zhang, Y.; Li, L.; Zhang, Q.; Cui, Z.; Wang, Z.; Li, C. Quantitative evaluation of the reservoir potential and controlling factors of semi-deep lacustrine tempestites in the Eocene Lijin Sag of the Bohai Bay Basin, East China. Mar. Petrol. Geol. 2016, 77, 262–279. [Google Scholar] [CrossRef] [Scilit]
- Wang, Y.; Gao, Y.; Fang, Z. Characteristics and classification evaluation of pore-throat structure in the Jiyang Sag tight oil reservoirs. Petrol. Explor. Dev. 2021, 48, 266–278. [Google Scholar]
- Lu, S.; Li, J.; Zhang, P. Micro pore-throat classification and grading evaluation of shale oil reservoirs. Petrol. Explor. Dev. 2018, 45, 436–444. [Google Scholar]
- Li, S.J.; Bian, H.Y.; Zhang, D.; Liu, Y.X.; Liu, G.L.; Wang, F. Research on pore structure and classification evaluation of tight oil reservoirs based on fractal theory. Acta Geophys. 2024, 72, 4079–4089. [Google Scholar] [CrossRef] [Scilit]
- Jiang, D.L.; Chen, H.; Xing, J.P.; Shang, L.; Wang, Q.-H.; Sun, Y.-C.; Zhao, Y.; Cui, J.; Duncan, I. A novel method of quantitative evaluation and comprehensive classification of low permeability-tight oil reservoirs: A case study of Jidong Oilfield, China. Pet. Sci. 2022, 19, 1527–1541. [Google Scholar] [CrossRef] [Scilit]
- Chen, F.; Zheng, Q.; Lu, S.; Ding, X.; Ju, Y.; Zhao, H. Classification of the tight oil reservoir storage space in the Raoyang Sag of the Jizhong Depression in the Bohai Bay Basin, China. Energy Sci. Eng. 2020, 8, 74–88. [Google Scholar] [CrossRef] [Scilit]
- Jiang, L.; Sun, X.Z.; Chen, D.X.; Lei, W.Z.; Yang, H.X.; Deng, Y.; Wang, Z.H.; Li, C.H.; Liu, T.; Geng, C.; et al. Tight sandstone gas reservoir types and formation mechanisms in the second member of the Xujiahe Formation in the Anyue Area, Sichuan Basin. Energies 2025, 18, 3009. [Google Scholar] [CrossRef] [Scilit]
- Yuan, Z.; Tang, X.; Xiao, H.; Jiang, Z.; Liu, J.; Xu, M.; Jiao, Y. Characteristics and genetic mechanism of effective seepage channels in the tight reservoir of the Fuyu Oil Layer in the northern part of the Songliao Basin. Energy Fuels 2024, 38, 9660–9675. [Google Scholar] [CrossRef] [Scilit]
- Liu, S.; Gao, Y.; Liang, R.J.; Wang, P.J.; Liu, H. Stratigraphic sequence and age determination of the Cretaceous rift-sag transition period in the Songliao Basin, NE China: Based on new data from ICDP boreholes SK2 and SK3. Cretac. Res. 2026, 179, 106257. [Google Scholar] [CrossRef] [Scilit]
- Cao, Z.; Lin, C.; Dong, C.; Ren, L.; Liu, K.; Azmy, K.; Qing, H.; Cosford, J. Impact of CO2 influx on sandstone reservoir quality: A case study of the Quantou Formation, southern Songliao Basin, China. AAPG Bull. 2024, 108, 1149–1185. [Google Scholar] [CrossRef] [Scilit]
- Wang, X.J.; Bai, X.F.; Lu, J.M.; Jin, Z.J.; Wang, G.W.; Kuang, L.C.; Li, J.H.; Li, J.S.; Zhang, J.Y.; Sun, L.D.; et al. New fields, new types, and resource potentials of oil-gas exploration in northern Songliao Basin. Acta Pet. Sin. 2023, 44, 2091–2103,2178. [Google Scholar]
- Si, S.; He, J.; Zhao, Y.; Er, C.; Bai, Y.; Wu, W. Diagenesis of tight sandstone and its influence on reservoir properties: A case study of Fuyu reservoirs in Songliao Basin, China. Unconv. Resour. 2023, 3, 84–92. [Google Scholar] [CrossRef] [Scilit]
- Huang, W.; Liang, J.; Zhao, B.; Sun, G.; Yang, Q. Main controlling factors of tight oil accumulations in the Fuyu Layer of Cretaceous Quantou Formation in northern Songliao Basin. J. Palaeogeogr. 2013, 15, 635–644. [Google Scholar]
- Zhang, S.; Fu, X.L.; Zhang, C.C. The sedimentary evolution and response to hydrocarbon accumulation of Quantou and Qingshankou formations in Songliao Basin. J. Oil Gas Technol. 2011, 33, 6–10. [Google Scholar]
- Wang, X.J.; Bai, X.F.; Li, J.H.; Jin, Z.; Wang, G.; Chen, F.; Zheng, Q.; Hou, Y.; Yang, Q.; Li, J.; et al. Enrichment model and major controlling factors of below-source tight oil in Lower Cretaceous Fuyu reservoirs in northern Songliao Basin, NE China. Pet. Explor. Dev. 2024, 51, 279–291. [Google Scholar] [CrossRef] [Scilit]
- Zhang, H.; Wang, X.; Jia, C.; Li, J.; Meng, Q.; Jiang, L.; Wang, Y.; Bai, X.; Zheng, Q. Total petroleum system and hydrocarbon accumulation model in shallow and medium strata in northern Songliao Basin, NW China. Pet. Explor. Dev. 2023, 50, 784–797. [Google Scholar] [CrossRef] [Scilit]
- Keshavarz, V.; Khosravanian, R.; Taheri-Shakib, J.; Salimidelshad, Y.; Hosseini, S.A. Chemical removal of organic precipitates deposition from porous media: Characterizing adsorption and surface properties. J. Pet. Sci. Eng. 2019, 175, 200–214. [Google Scholar] [CrossRef] [Scilit]
- Wang, J.Y.; Jiang, F.J.; Zhang, C.L.; Song, Z.Z.; Mo, W.L. Study on the pore structure and fractal dimension of tight sandstone in coal measures. Energy Fuels 2021, 35, 3887–3898. [Google Scholar] [CrossRef] [Scilit]
- Xia, H.F.; Wang, L.H.; Han, P.H.; Cao, R.B.; Zhang, S.Q.; Sun, X.D. Microscopic residual oil distribution characteristics and quantitative characterization of producing degree based on core fluorescence analysis technology. Geofluids 2021, 2021, 8827721. [Google Scholar] [CrossRef] [Scilit]
- Liu, B.; Yan, M.; Sun, X.D.; Bai, Y.F.; Bai, L.H.; Fu, X.F. Microscopic and fractal characterization of organic matter within lacustrine shale reservoirs in the first member of Cretaceous Qingshankou Formation, Songliao Basin, Northeast China. J. Earth Sci. 2020, 31, 1241–1250. [Google Scholar] [CrossRef] [Scilit]
- Matthews, G.P.; Moss, A.K.; Ridgway, C.J. The effects of correlated networks on mercury intrusion simulations and permeabilities of sandstone and other porous media. Powder Technol. 1995, 83, 61–77. [Google Scholar] [CrossRef] [Scilit]
- Chang, Y.H.; Yao, Y.B.; Liu, Y.; Zheng, S. Can cuttings replace cores for porosity and pore size distribution analyses of coal? Int. J. Coal Geol. 2020, 227, 103534. [Google Scholar] [CrossRef] [Scilit]
- Wang, Z.; Yao, Y.; Ma, R.; Zhang, X.; Zhang, G. Application of multifractal analysis theory to interpret T2 cutoffs of NMR logging data: A case study of coarse clastic rock reservoirs in southwestern Bozhong Sag, China. Fractal Fract. 2023, 7, 57. [Google Scholar] [CrossRef] [Scilit]
- Sun, X.X.; Ripepi, N.; Yao, Y.B.; Liu, D. A novel method for gas-water relative permeability measurement of coal using NMR relaxation. Transp. Porous Media 2018, 124, 73–90. [Google Scholar] [CrossRef] [Scilit]
- Ham, Y.; Kantzas, A. Measurement of Relative Permeability of Coal to Gas and Water. In Proceedings of the SPE Unconventional Resources Conference and Exhibition-Asia Pacific, Brisbane, Australia, 12–14 August 2013. [Google Scholar]
- Hubbert, M.K. Entrainment of petroleum under hydrodynamic conditions. AAPG Bull. 1953, 37, 1954–2026. [Google Scholar]
- Baoquan, M.; Shumin, C.; Weilin, Y. Pore structure evaluation of low permeability clastic reservoirs based on sedimentation diagenesis: A case study of the Chang 8 reservoirs in the Zhenbei region, Ordos Basin. J. Pet. Sci. Eng. 2021, 196, 107841. [Google Scholar] [CrossRef] [Scilit]
- Kong, X.; Xiao, D.; Jiang, S.; Lu, S.; Sun, B.; Wang, J. Application of the combination of high-pressure mercury injection and nuclear magnetic resonance to the classification and evaluation of tight sandstone reservoirs: A case study of the Linxing Block in the Ordos Basin. Nat. Gas Ind. B 2020, 7, 433–442. [Google Scholar] [CrossRef] [Scilit]
- Wei, H.; Xie, R.; Wang, Y.; Xie, B.; Lai, Q.; Guo, J. Nuclear magnetic resonance T2 distribution-based gas–water relative permeability prediction in tight sandstone reservoirs: A case study on central Sichuan Basin, China. Energy Fuels 2024, 38, 3598–3608. [Google Scholar] [CrossRef] [Scilit]
- Liu, H.; Luo, Y.; Meng, Y.; Xiao, G.; Zhao, Y.; Zhou, S.; Shao, L. Effects of pore structure on the moveable oil saturation in water-driven tight oil sandstone reservoirs. J. Pet. Sci. Eng. 2021, 207, 109142. [Google Scholar] [CrossRef] [Scilit]
- Jia, C.; Zou, C.; Li, J.; Li, D.; Zheng, M. Assessment criteria, main types, basic features and resource prospects of the tight oil in China. Acta Pet. Sin. 2012, 33, 343–350. [Google Scholar]
- Fang, X.; Yang, Z.; Guo, X.; Wu, Y.; Liu, J. Resource grading evaluation and exploration potential of tight oil in major basins of China. Nat. Gas Geosci. 2019, 30, 1094–1105. [Google Scholar]
- Pu, Q.; Xie, J.; Li, X.; Zhang, Y.; Hu, X.; Hao, X.; Zhang, F.; Zhao, Z.; Cao, J.; Li, Y.; et al. Single-factor comprehensive reservoir quality classification evaluation-taking the Hala’alat mountains at the northwestern margin of the Junggar Basin as an example. ACS Omega 2023, 8, 37065–37079. [Google Scholar] [CrossRef] [Scilit] [PubMed]

Disclaimer/Publisher’s Note: The statements, opinions and data contained in all publications are solely those of the individual author(s) and contributor(s) and not of MDPI and/or the editor(s). MDPI and/or the editor(s) disclaim responsibility for any injury to people or property resulting from any ideas, methods, instructions or products referred to in the content. |
© 2026 by the authors. Licensee MDPI, Basel, Switzerland. This article is an open access article distributed under the terms and conditions of the Creative Commons Attribution (CC BY) license.