


Abstract
Rain erosion is a critical issue for the development of wind power generation because it limits the lifetime of wind turbine blades. To clarify the erosion initiation mechanism in wind turbine blades of metallic material, pit formation and erosion initiation on a smooth wet wall of aluminum materials A3003 and annealed A5052 were investigated; water droplets were impinged on the wall using a pulsed-jet tester; and combined theoretical and numerical studies were performed by considering the influence of the water film on the wall. Although the theoretical and numerical impact pressures were much lower than the offset yield strength of the materials, random pit formation and erosion initiation were observed on the target material. To clarify the reason for this, the occurrence of cavitation erosion was investigated based on the numerical pressure distribution of a droplet impacting a wet wall. The numerical results showed that the pressures in the droplet center and water film became lower than the saturated vapor pressure, suggesting the occurrence of cavitation erosion. Furthermore, a similar pit formation and erosion initiation were observed on the wall material in the acoustic cavitation test under the cavitation erosion condition. These results indicate that the pit formation could have been caused by the high impact pressure caused by the micro-jet mechanism that occurs when a droplet impacts the wet wall. This could potentially explain the mechanism of the more severe erosion in the actual wind turbine blade than was expected.
1. Introduction
Wind power is one of the major sources of renewable energy, but it suffers from the influence of atmospheric conditions, such as rain, ice and natural hazards, on wind turbines. Rain erosion of the blades limits their lifetime and is a critical issue in wind power generation on land and offshore. The erosion of wind turbine blades can be defined by the progressive mass loss from the blade due to repeated rain impacts. Although rain erosion occurs for both on-land and offshore wind turbine blades, offshore wind turbines may experience higher erosion than those on land. This is because of the higher impact velocities of rain droplets in the offshore environment arising from the larger scale of wind turbine and the noise-free operating environment.
The erosion is generated by the impact pressure of rain droplets impacting the leading edge of wind turbine blades [1,2,3,4,5,6,7], while the erosion mechanism has not been fully understood yet. This may be more complex when combined with other factors, such as blade deterioration by ultraviolet light, sand and hailstone particle impacts, and saltwater corrosion, making it difficult to predict the lifetime of an actual blade operating in an atmospheric environment [8,9,10,11]. Although the impact pressure of the droplet was considered lower than the offset yield strength of the blade, it was high enough to cause blade fatigue damage [12,13,14,15]. Blade erosion is highly associated with the power efficiency of the wind turbine in actual operating condition. This is because the erosion of a wind turbine blade can generate roughness on the leading edge, which deteriorates the aerodynamic performance and wind turbine power [16,17].
The diameter of the rain droplet ranges from 0.3 to 3 mm [8], while the droplet shape is complex because of the influence of wind shear under actual operating conditions of the wind turbine. According to a survey of rain erosion studies [2,8], the rain impact velocity on megawatt-class wind turbine blades ranges from 60 to 100 m/s, where the impact velocity is defined by the droplet velocity relative to the blade. In this velocity range, the droplet can be considered incompressible because of the lower Mach numbers, Ma (=V/c) = 0.04−0.07 (c: sound velocity of water, V: impact velocity). Therefore, the impact pressure on a wind turbine blade can be estimated from the incompressible Navier–Stokes equations [18,19], which are validated by the impact force measurement on a whirling-arm tester [20]. However, the impact pressure has not been measured in the literature because of the limitation of experimental techniques.
In recent years, a challenging aspect of leading-edge erosion has received considerable attention [7,15]; this is the influence of the water film on the impact pressure of the droplet, which comes from the spreading of the preceding rain droplets impacting the blades. Liquid droplet impingement (LDI) on wet walls was first studied by Brunton and Rochester [21]; they suggested pressure-wave damping owing to the influence of the water film on the blade. Later, the influence of the water film was studied numerically, where the Navier–Stokes equations were solved using the moving particle semi-implicit method; it was shown that the damping of the impact pressure increased with the water film thickness [22]. This finding was confirmed experimentally, and a decreased erosion rate was observed with increasing water film thickness [23,24]. Further numerical studies on LDI on a wet wall showed that the equivalent stress inside the material was lower than a dry wall [25]. Numerical and experimental studies on droplet impact on rough walls have been conducted considering the influence of the water film [26,27,28,29]. These previous studies have demonstrated that the influence of the water film on the impact pressure cannot be neglected for the impact velocity range of actual blades, but the erosion initiation behavior in the incubation stage is not yet well understood.
To protect the blade from erosion, the coating technique using polyurethane film is popular [2,4,5,11,12,17]. It damps the impact pressure of the rain through the viscoelastic effect. However, the application of this technique may be limited to a relatively low velocity range for the droplet impact. When the velocity is increased, metallic and thermoplastic coatings are more promising because of the increased fatigue strength of the materials [7,30]. Therefore, the fundamentals of erosion phenomenon for metallic and thermoplastic materials are becoming important, but the mechanisms are not fully understood. Thus, the studies of LDI erosion on aluminum materials will provide fruitful information for the study of erosion mechanisms in wind turbine blades of metallic materials.
To understand the mechanism of metallic material erosion by LDI, the eroded surface structure was studied using scanning electron microscopy [31]. LDI erosion was found to have started with surface deformation along the crystal grain boundaries; this resulted in the removal of crystal grains and an associated mass loss at the end of the incubation stage—with an increasing number of impacts [31]. The incubation stage was followed by the acceleration stage, maximum rate point, decelerating stage of erosion, and terminal stage (where a constant erosion rate is observed due to the increased number of impacts) [32]. Erosion in the incubation stage was highly influenced by experimental conditions, such as the impact velocity, diameter of the droplet, hardness of the material, water film thickness, surface roughness, and physical properties of the wall materials. This resulted in a scattering of the threshold velocity during erosion initiation tests when using several metallic materials [33]. However, the erosion mechanism is not fully understood—possibly owing to the difficulty in measuring the peak impact pressure on a wet blade.
The purpose of this study is to clarify the mechanism of blade erosion using a pulsed-jet erosion tester combined with theoretical, numerical and experimental considerations for the impact pressure. Furthermore, a numerical consideration of cavitation initiation conditions and a comparison to the erosion behavior of an acoustic cavitation test are conducted. These results led to the emergence of cavitation erosion as a new mechanism of rain erosion for wind turbine blades.
2. Experimental Setup and Method
2.1. Pulsed-Jet Test
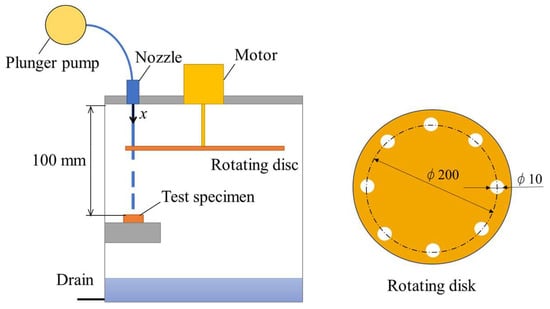
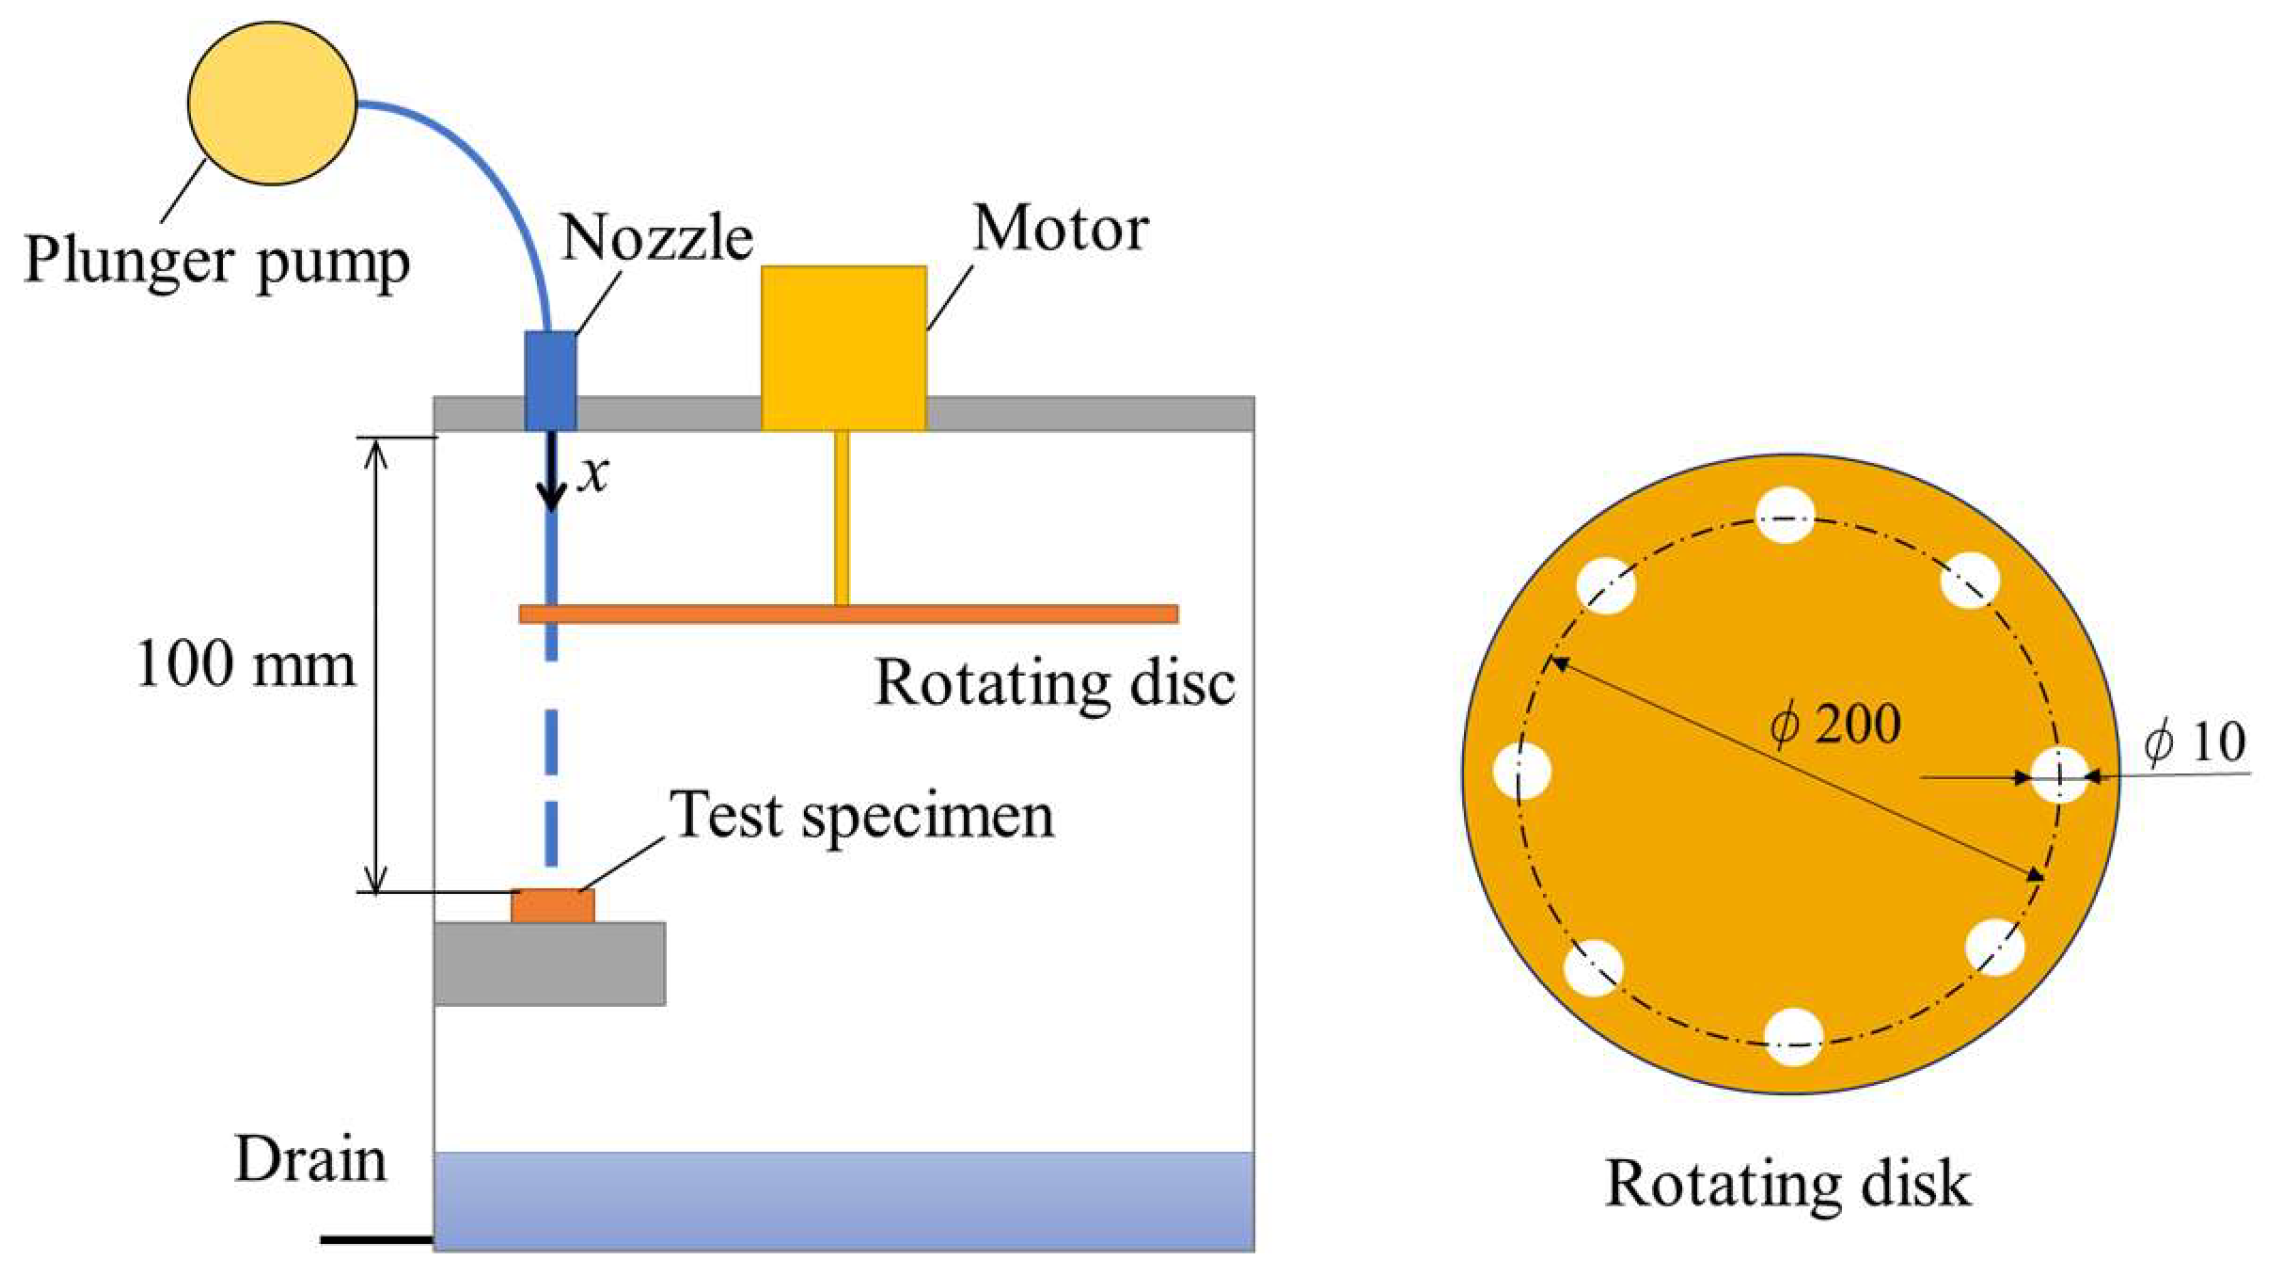
A pulsed-jet test was conducted to evaluate the initiation of erosion on test materials caused by LDI, using a pulsed-jet erosion tester with a working fluid of tap water (Figure 1). A rotating disk was driven by a motor to generate a pulsed jet from a continuous jet driven by a plunger pump that issued from a straight nozzle. The details of the pulsed-jet erosion tester are described in the literature [34]. Erosion initiation was observed for several impact velocities ranging from 58 to 99 m/s, corresponding to the impact velocity range of an actual blade [2,7,8]. The effective diameter of the rotating disk was 200 mm, with eight 10 mm diameter holes (Figure 1), and the rotation speed was fixed at 1200 rpm—resulting in an impact frequency of 160 Hz for pulsed-jet impacts. The nozzle pressure varied in the range from 2 to 6 MPa, which corresponded to a pulsed jet velocity of 58 to 99 m/s, and the standoff distance was 100 mm measured from the nozzle exit.
Figure 1.
Experimental apparatus of pulsed-jet tester.
The erosion image was captured using a microscope with a digital camera with a spatial resolution of 2000 px × 2000 px, whereas the impact velocity of the pulsed jet was measured using the particle-image velocimetry system [34].
2.2. Test Materials
The target specimens (20 mm diameter and 14 mm thickness) were made of aluminum (A3003, A5052) with mirror-surface finishing on the target wall. The material A5052 was annealed in an electric furnace for 5 h at 345 °C to achieve the desired offset yield strength for evaluating the near critical condition of pit formation. Tensile tests were performed for test materials A3003 and A5052, and the results are summarized in Table 1. The average offset yield strengths were found to be 63 and 89 MPa, respectively, and the ultimate tensile strengths were 97 and 215 MPa, respectively. It should be mentioned that the same test material A3003 has been used for the erosion initiation test using the whirling-arm erosion tester, as reported by DNV GL [35].
Table 1.
Material properties of test specimen measured in tensile test.
2.3. Acoustic Cavitation Test
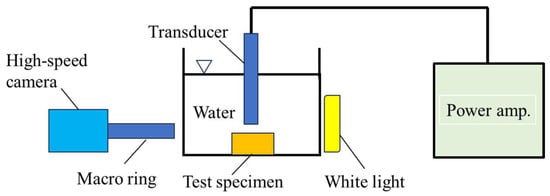
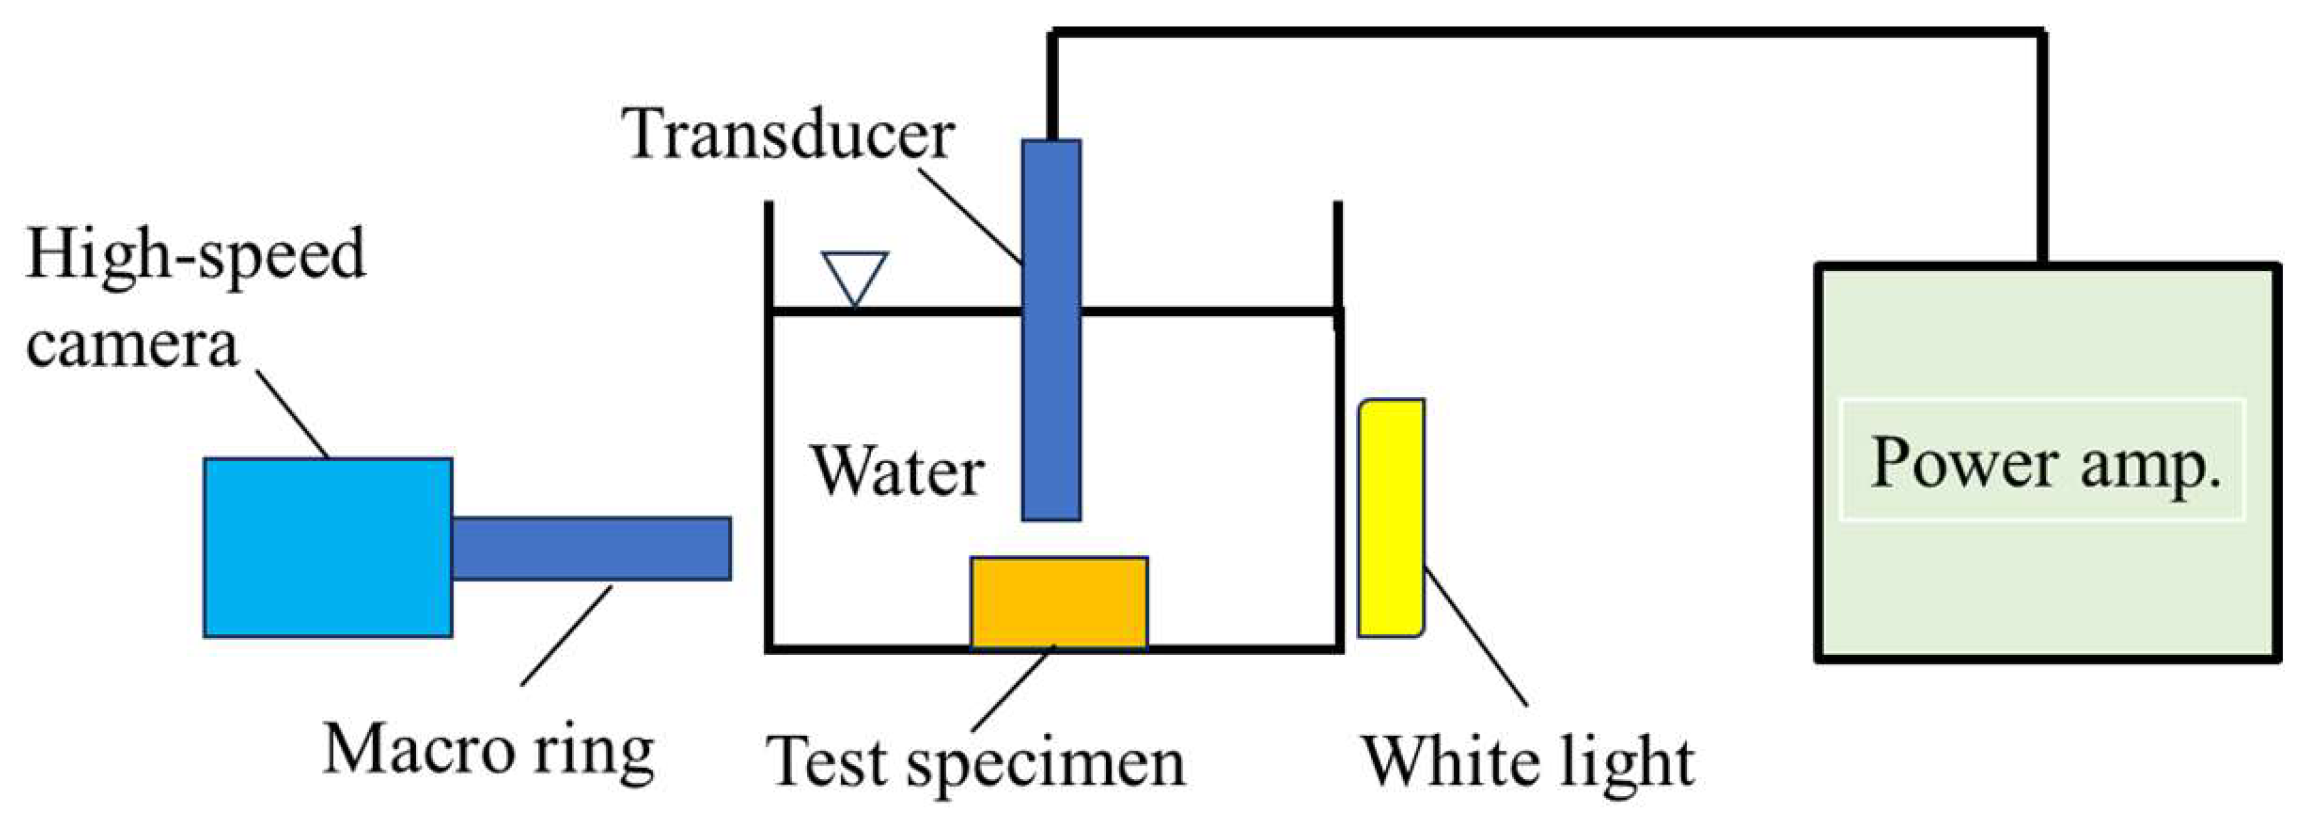
To compare the erosion behavior of a pulsed-jet impact on a wall, an acoustic cavitation test at a 20 kHz oscillation frequency was conducted, driven by a power amplifier of maximum output 600 W in tap water (Figure 2). The horizontal transparent cross-section made of acrylic resin was 94 mm × 94 mm with a height of 57 mm, and it was filled with tap water up to a depth of 47 mm. The water was kept calm for more than 1 h before the experiment, and the temperature was 20 °C. When the transducer was turned on, it started oscillating and generated an acoustic streaming of cavitation clouds from the end of the transducer (4.2 mm in diameter) to the test specimen. This results in the generation of a cavitation collapse near the wall and the associated impulsive pressure on the target specimen. The surface observation of the test material was made using the standard microscope and differential interferometric microscope.
Figure 2.
Experimental setup of acoustic cavitation test.
To confirm the occurrence of cavitation clouds over the test specimen in the acoustic cavitation test, a flow visualization study was carried out using an LED light and a high-speed camera for inline observations of a 1 mm thick target spacing. Observations were made at 6000 frames/s with a shutter speed of 33 μs and an image resolution of 1024 × 1024 pixels. The power input to the transducer was set to 600 W in the acoustic cavitation test, which resulted in a peak-to-peak amplitude of 70 μm oscillating at 20 kHz.
3. Experimental Observation of Pit Formation by Pulsed Jets
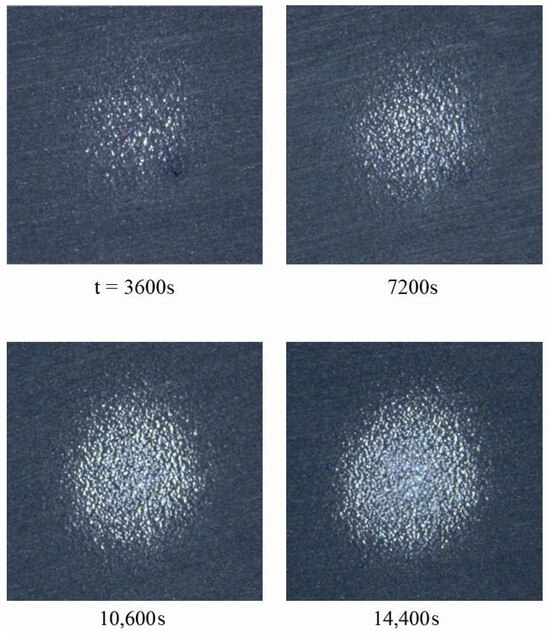
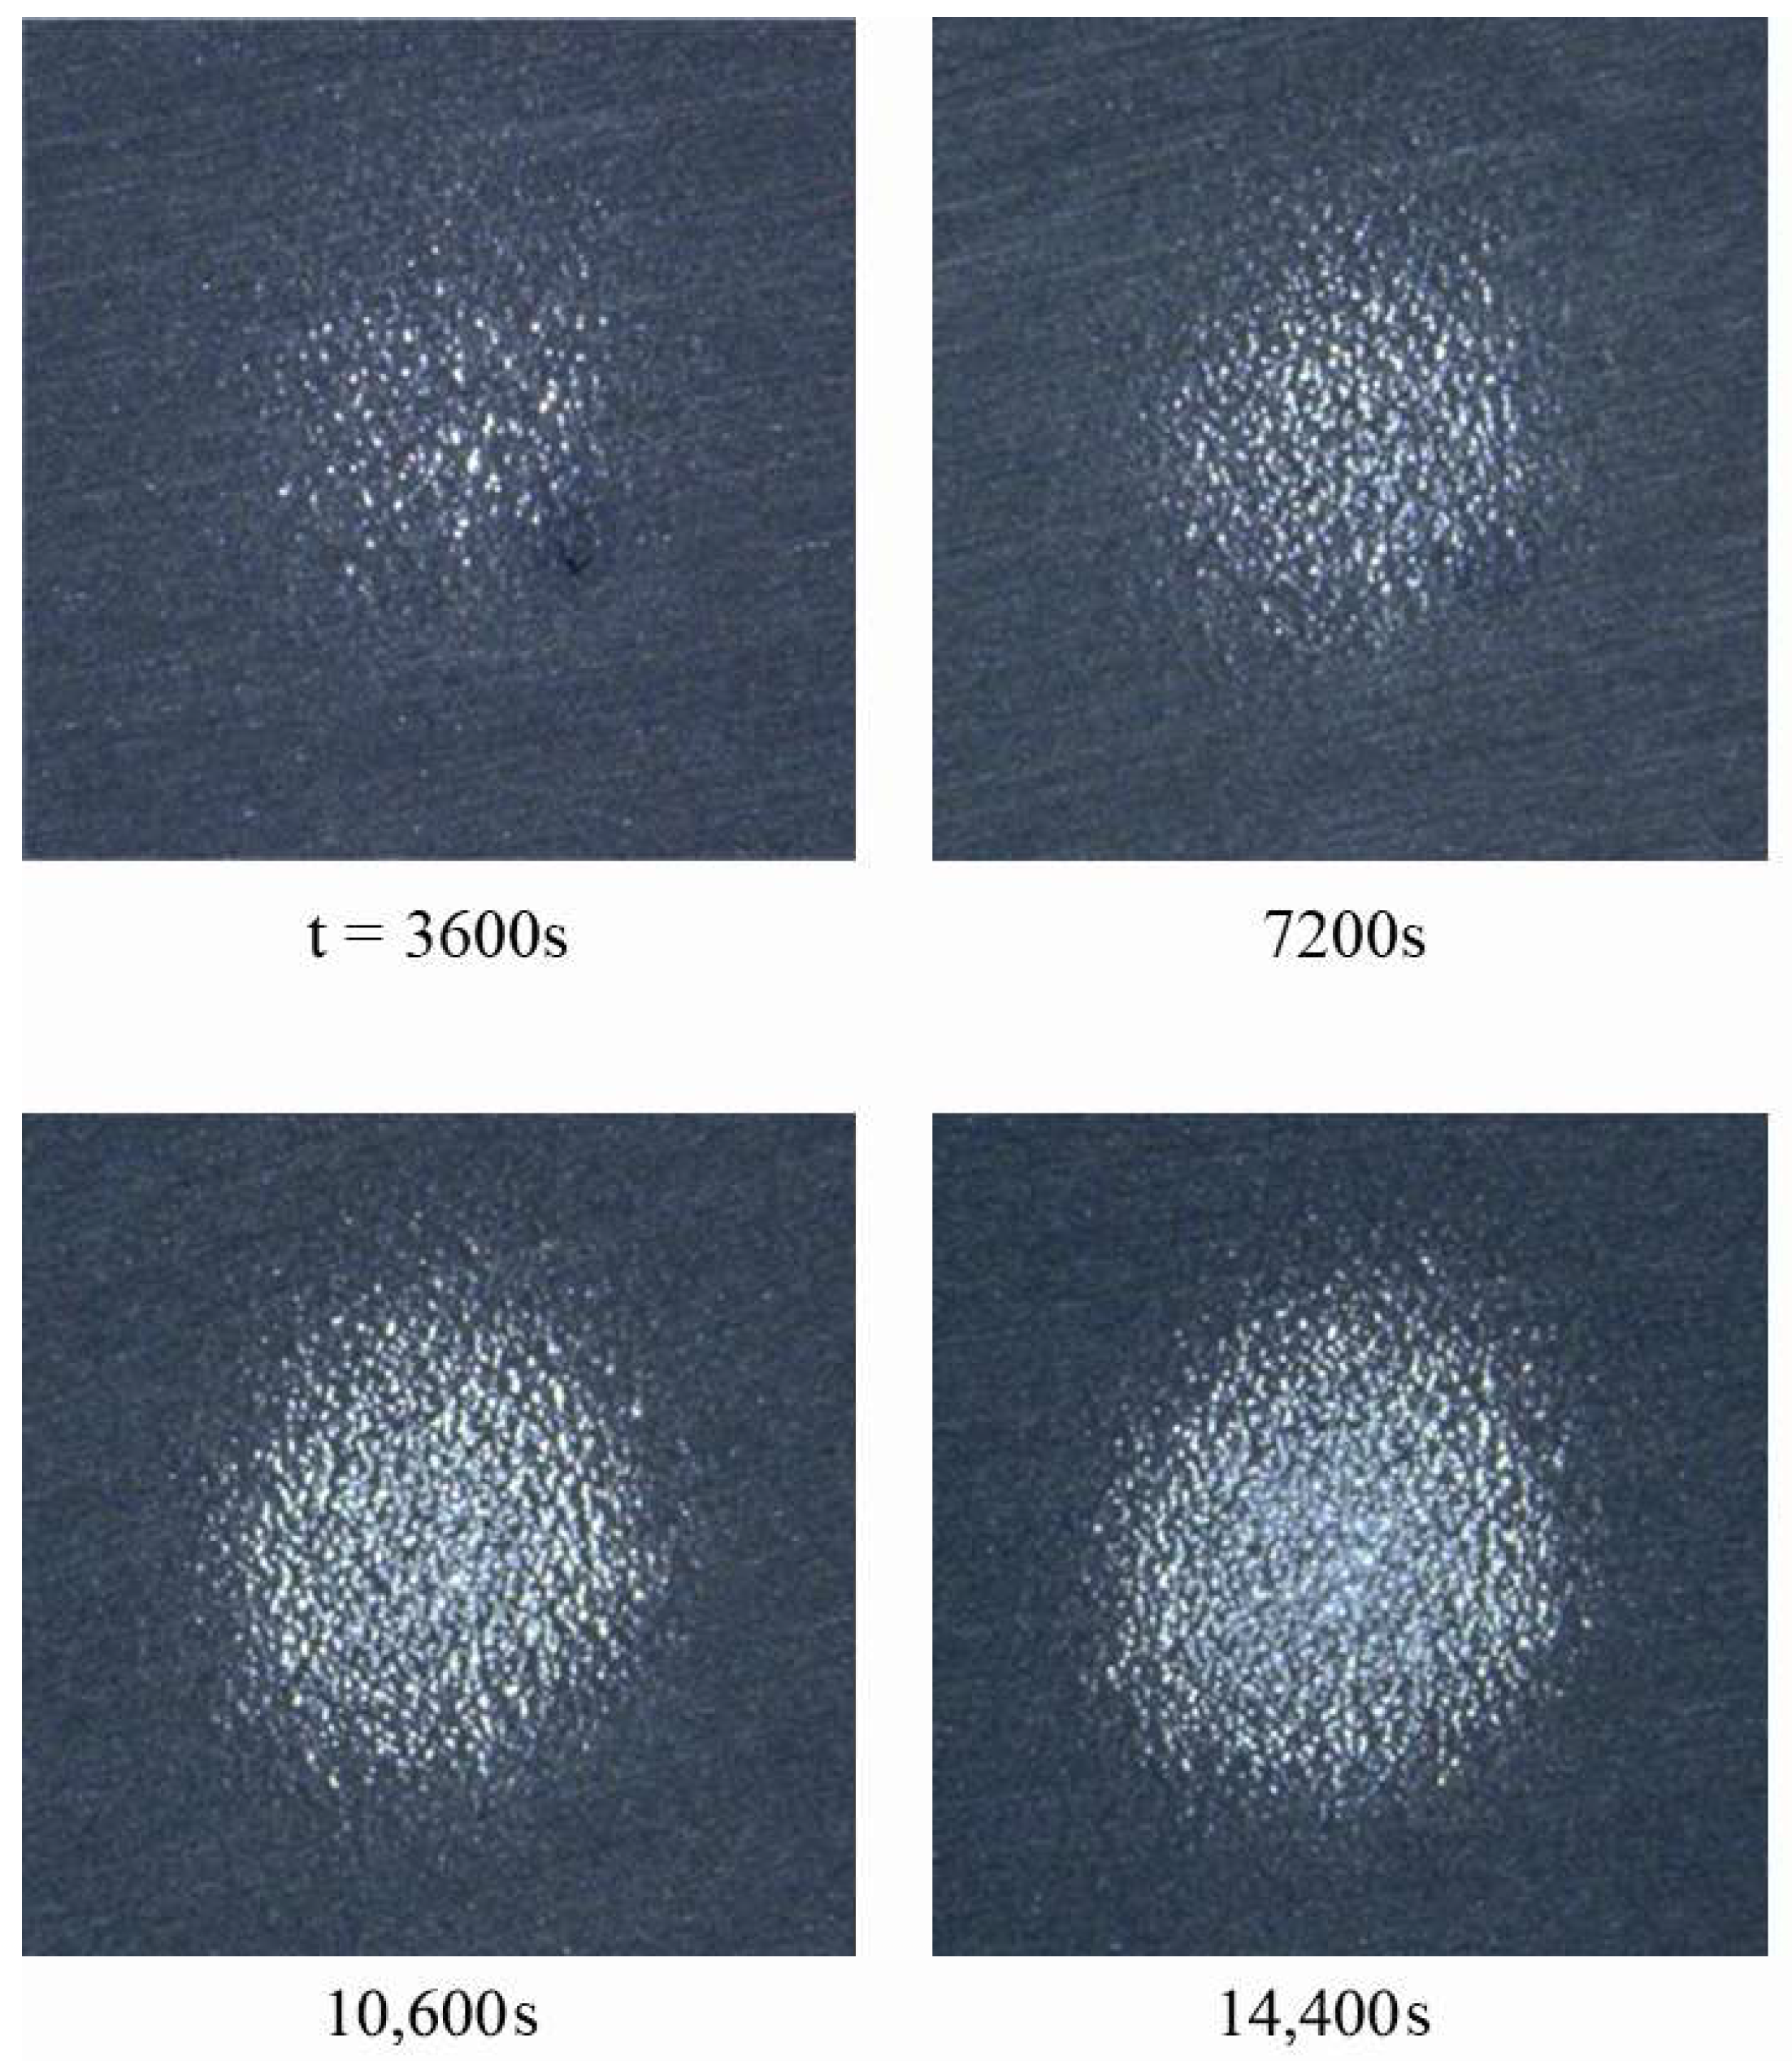
Figure 3 shows the time-series images of the A3003 test material taken by a microscope after the pulsed-jet operation at impact velocity V = 82 m/s, with a jet length L = 54 mm. Pit formation was observed on the material surface, immediately after impacting the wall. By increasing the elapsed time t (s), the number of pits increased, as shown in the images at t = 3600, 7200, 10,800, and 14,400 s. Mass loss did not occur until the last picture at t = 14,400 s, corresponding to the end of the incubation stage. High-speed observations of the pulsed jet near the wall showed jet fluctuations in space and time [34], resulting in a random distribution of pit formation on the wall over an area approximately 2 mm in diameter. The pit area increased when increasing the number of pulsed-jet impacts. Note that pit formation started immediately after the pulsed jet impacted the wall, much earlier than the end of the incubation stage associated with the mass loss at t = 14,400 s. Furthermore, the random pit pattern observed in this study could differ from the erosion pattern of a single liquid-nickel droplet impact [36]. This might have been caused by the influence of the water film, and further detailed studies are necessary.
Figure 3.
Pit formation on A3003 by pulsed-jet impacts (V = 82 m/s, L = 54 mm) (picture at 14,400 s marks the end of incubation stage associated with the mass loss; 2.6 mm × 2.6 mm in image area).
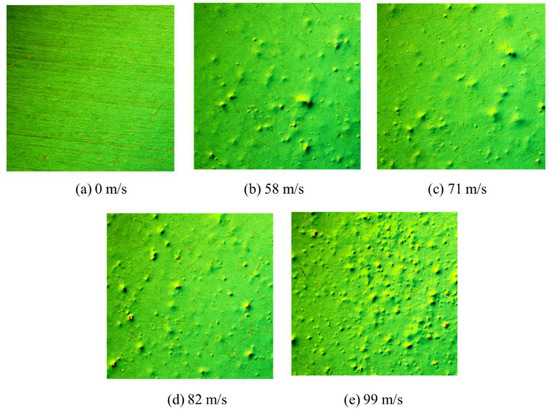
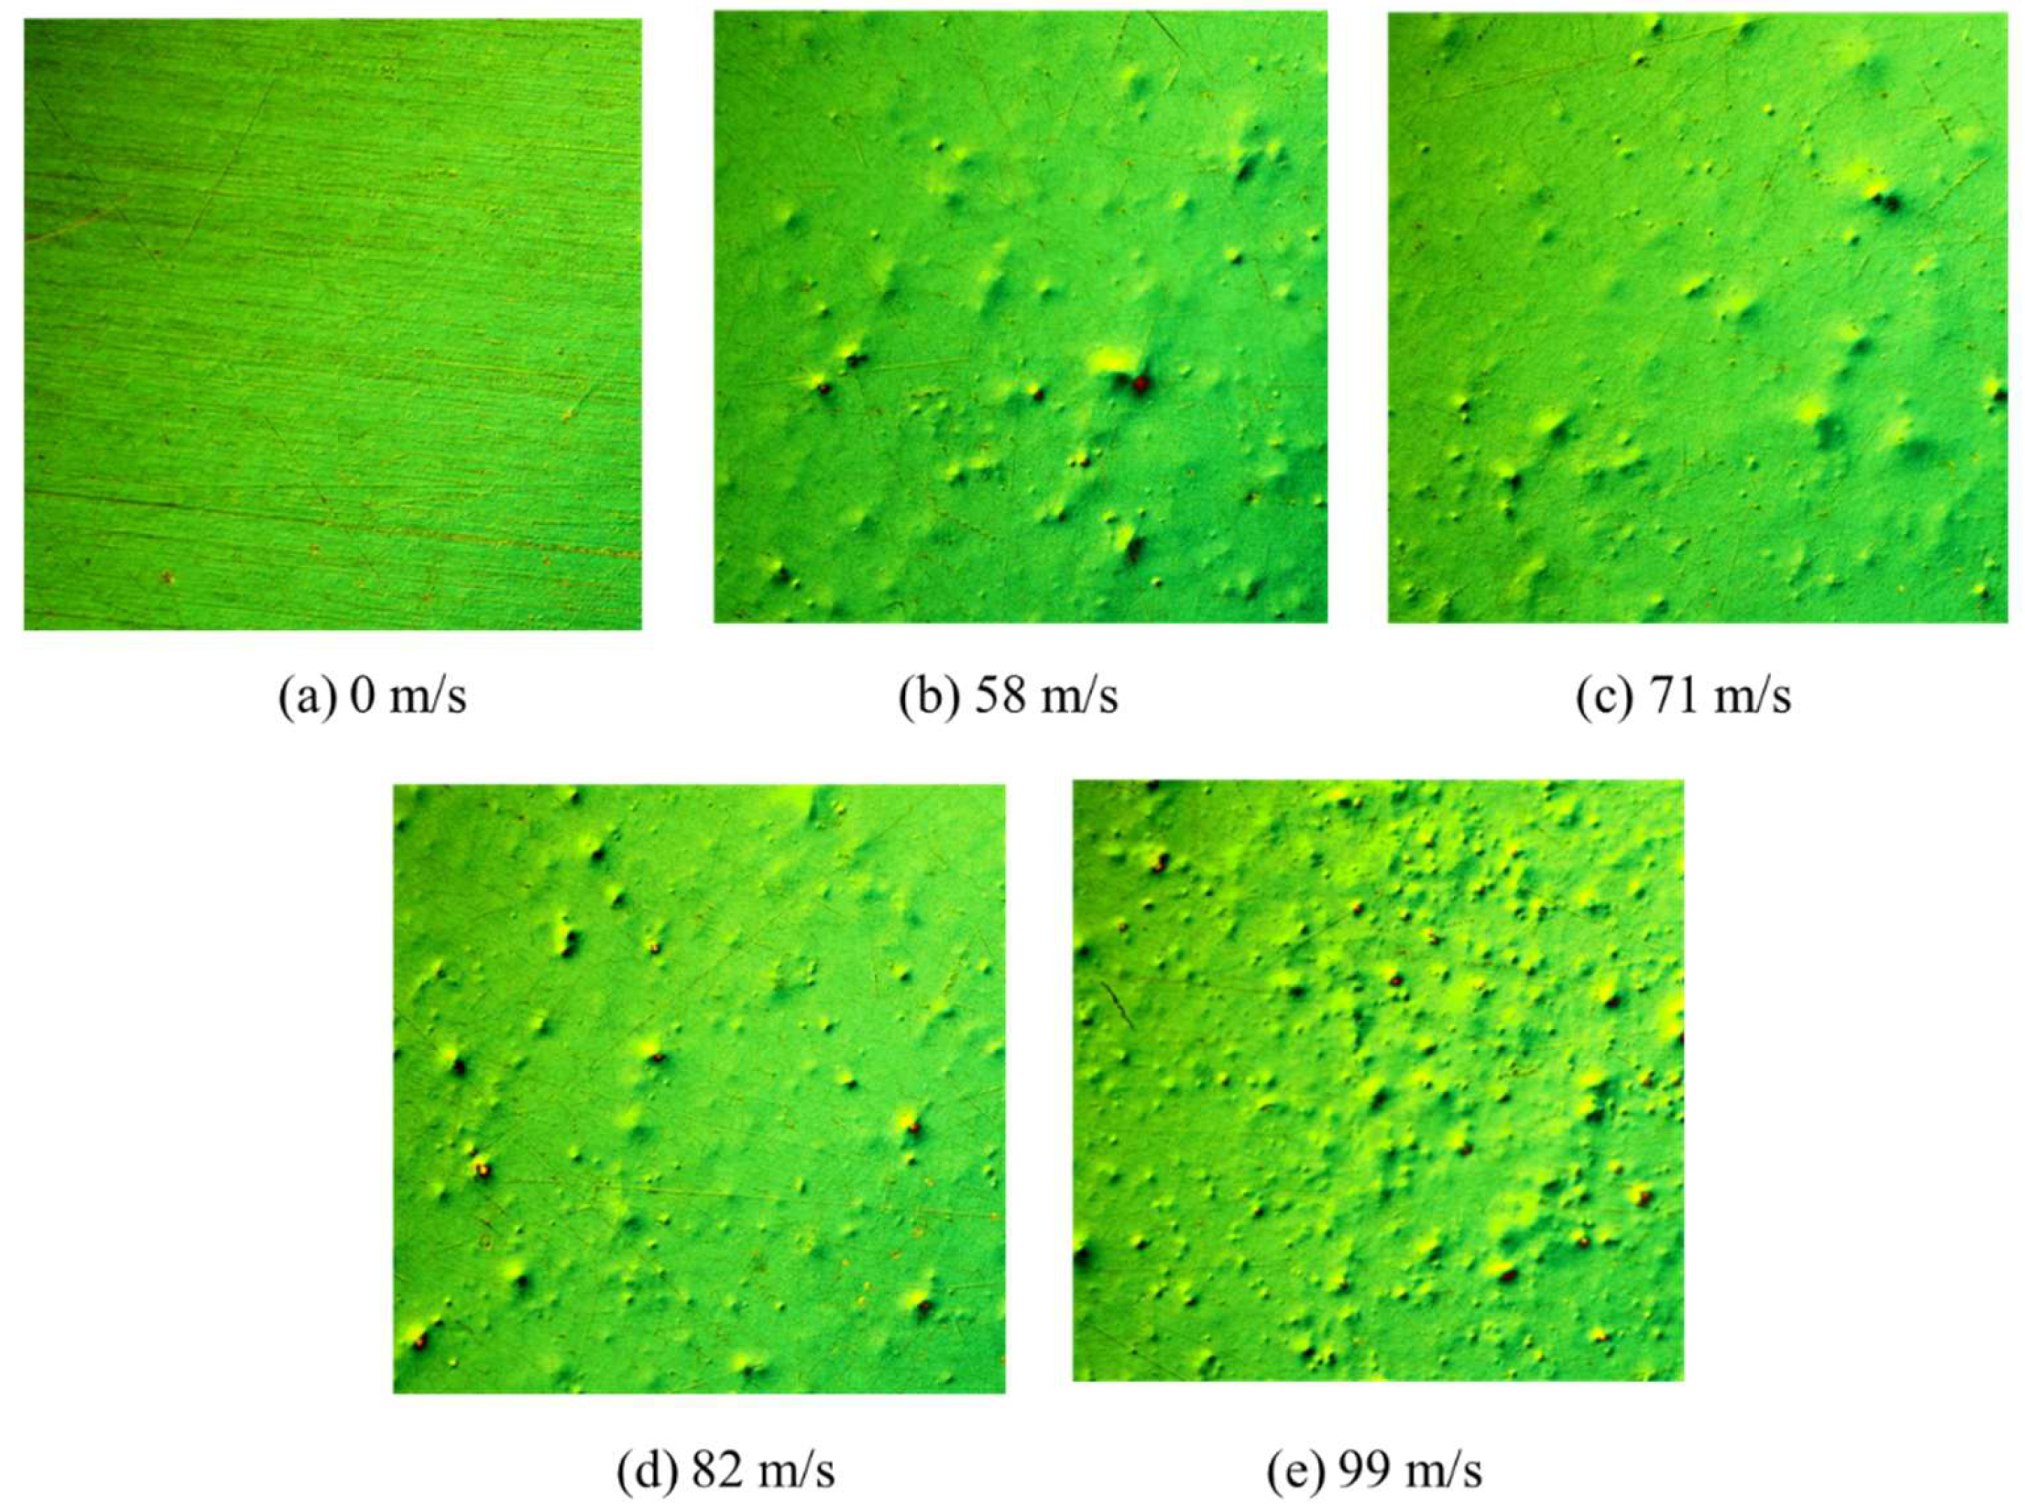
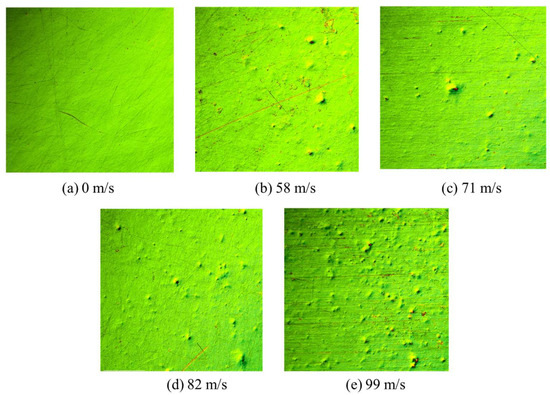
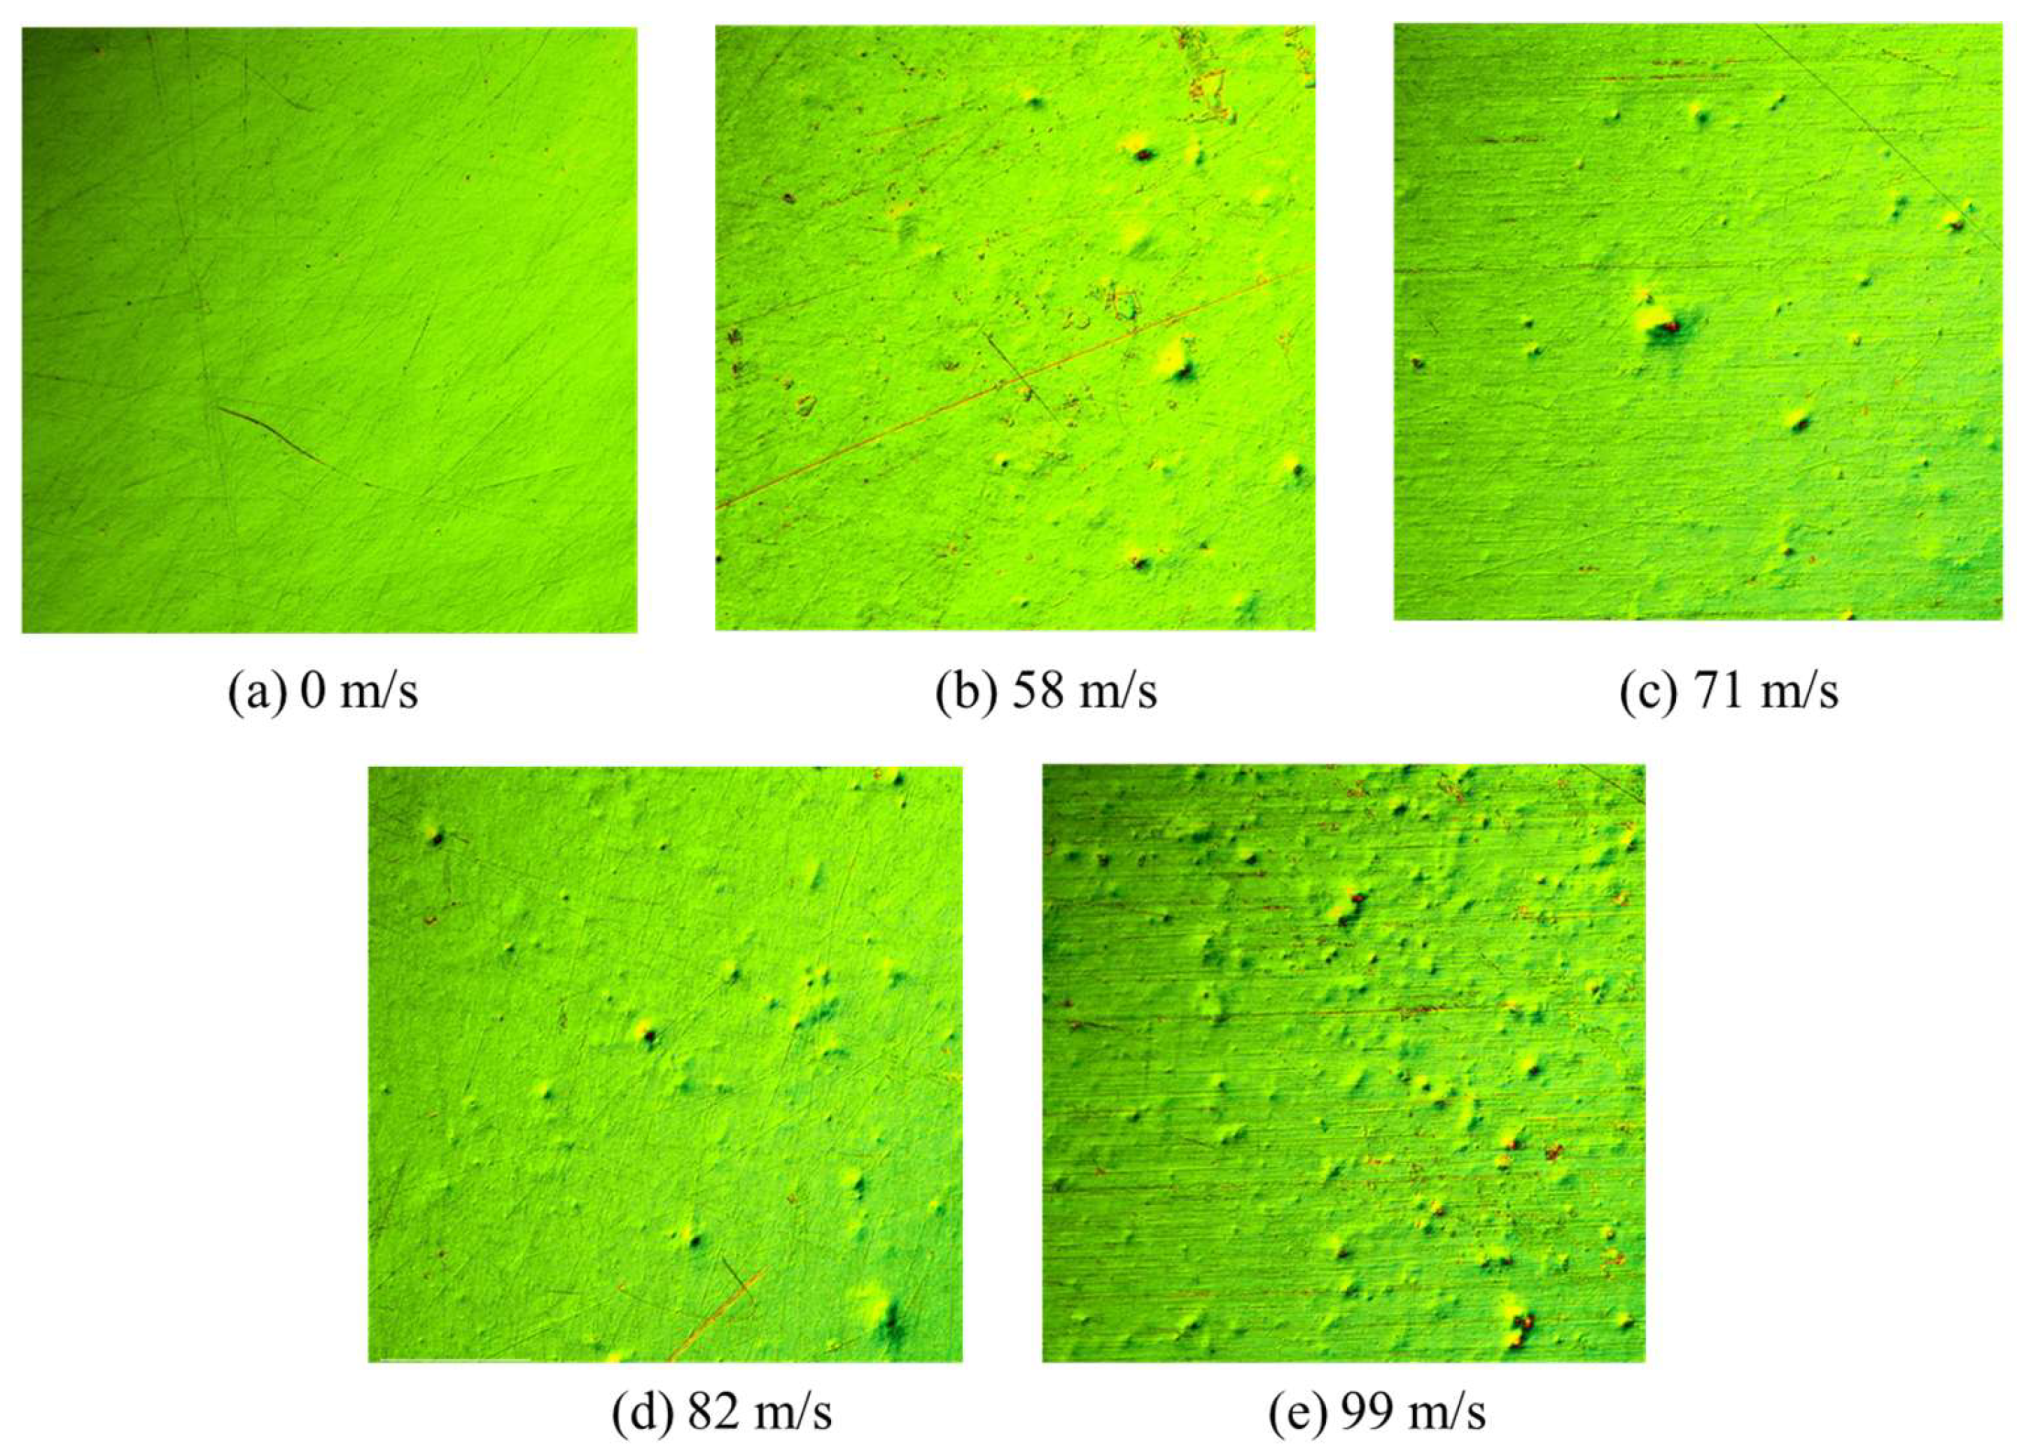
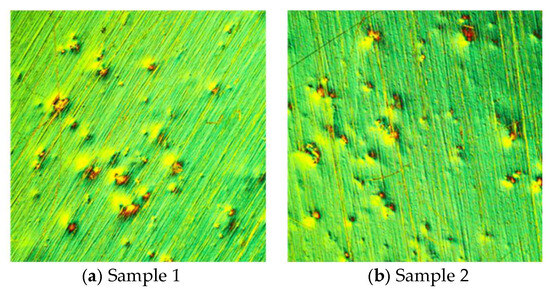
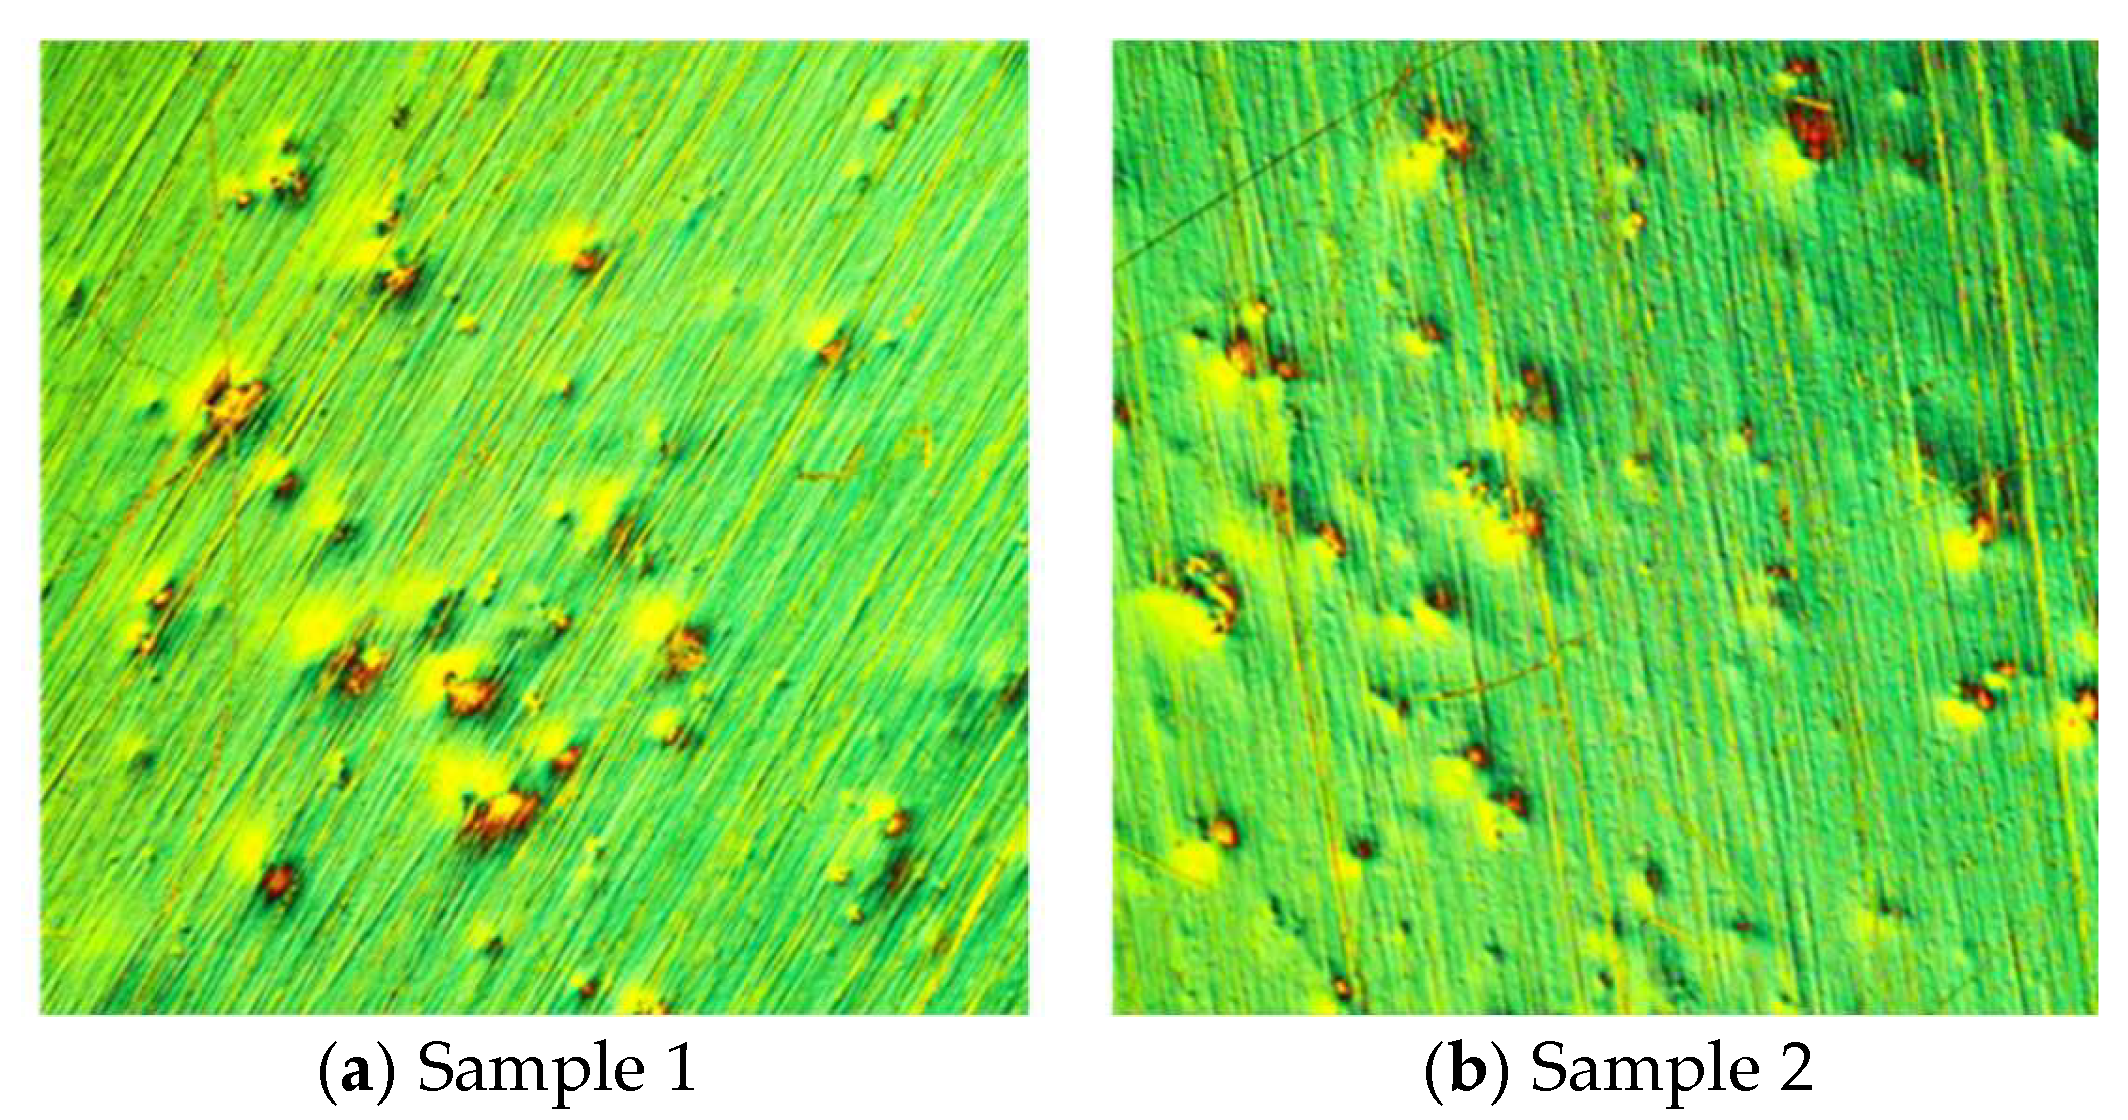
To understand the influence of the impact velocity on pit formation during the incubation stage, several test specimens were prepared from the same aluminum material of A3003 for the pulsed-jet test near the center of the specimen. Figure 4 shows the sample experimental pitting images at different impact velocities of 0, 58, 71, 82, and 99 m/s. Note that the duration of the pulsed-jet test was fixed at 60-s post-pulsed-jet impact, much shorter than the 14,400-s incubation period. The observations were made using a differential interferometric microscope because it has sufficient sensitivity for monitoring minor wall deformations. Although the aluminum wall was smooth enough before the pulsed-jet impact, pit formation was clearly observed on the A3003 at all velocities ranging from 58 to 99 m/s. With increasing impact velocity, the number of pits increased; the increase was almost proportional to the number of impacts of the pulsed jets.
Figure 4.
Pit formation on A3003 by pulsed-jet impacts (0.8 mm × 0.8 mm in image area, 60-s impact period).
A similar erosion test was performed on annealed aluminum material (A5052), whose offset yield strength was higher than that of A3003. The annealing time was set to 5 h after systematic trial and validation. The experimental results for A5052, for various impact velocities in the range from 58 to 99 m/s, are shown in Figure 5. These images show a similar pit formation on the wall material to that of A3003 (Figure 4); however, the number of pits observed was lower than those on A3003 at the same impact velocities. This result can be attributed to the increased offset yield strength of A5052 (89 MPa) compared with that of A3003 (63 MPa). The number of pits observed in Figure 5b for the lowest velocity of 58 m/s is far lower than those observed in Figure 4b. Therefore, the impact velocity for test material A5052 may be closer to the critical condition of pit formation. Experiments with lower impact velocities were not possible with the current plunger pump because of operating pressure range limitations.
Figure 5.
Pit formation on annealed A5052 by pulsed-jet impacts (0.8 mm × 0.8 mm in image area, 60-s impact period).
4. Theoretical and Numerical Considerations of Impact Pressure on a Wet Wall
The impact pressure of a water droplet can be evaluated using the incompressible Navier–Stokes equations combined with a continuity equation, which were solved by using the commercial software FLUENT, 2023, in the velocity range from 60 to 100 m/s for rain droplets impacting actual wind turbine blades [19]. According to the numerical study of a water droplet [19], the impact pressure on the wet wall pw can be expressed by Equation (1):
where pd is the impact pressure on a dry wall, the constants a and b are determined as a = −5.67 and b = 0.68, and h/d is the water film thickness h normalized by the droplet diameter d. Equation (1) is applicable to both incompressible and compressible fluids because the water film damping effect is similarly observed in both cases [19,24]. A numerical simulation of droplet impact on a dry wall using incompressible Navier–Stokes equations showed that pd is given by the following equation [19]:
pd = 7ρV2
Using Equation (2), the impact pressure is determined to be ~14 times larger than the stagnation pressure. This implies that the impact pressure of the pulsed jet increases by up to 14 times the stagnation pressure immediately after impact, but decreases quickly down to the stagnation pressure, which is less effective for the erosion of the material. Therefore, the droplet impact pressure was well approximated by the peak pulsed-jet impact pressure, except for the influence of the water film. Note that the water film thickness increases with an increased rain flow rate and radial distance of the blade and a decreased rotation rate of the blade, which are described in ref. [19]. Therefore, the water film is thicker in the actual wind turbine blade than that of a whirling-arm tester. Furthermore, the impact force evaluated in the numerical simulation agreed with the direct force measurement using a force sensor with an error of 5%, which was obtained using a whirling-arm erosion tester operating at an impact velocity of 127 m/s (Ma = 0.085) [20]. This indicates that the numerical results obtained using the incompressible Navier–Stokes equations were validated experimentally in the impact velocity range of operating whirling-arm blades.
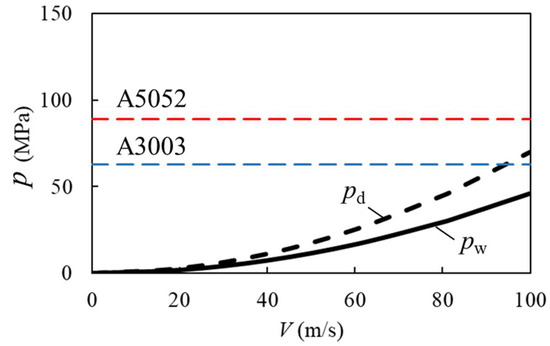
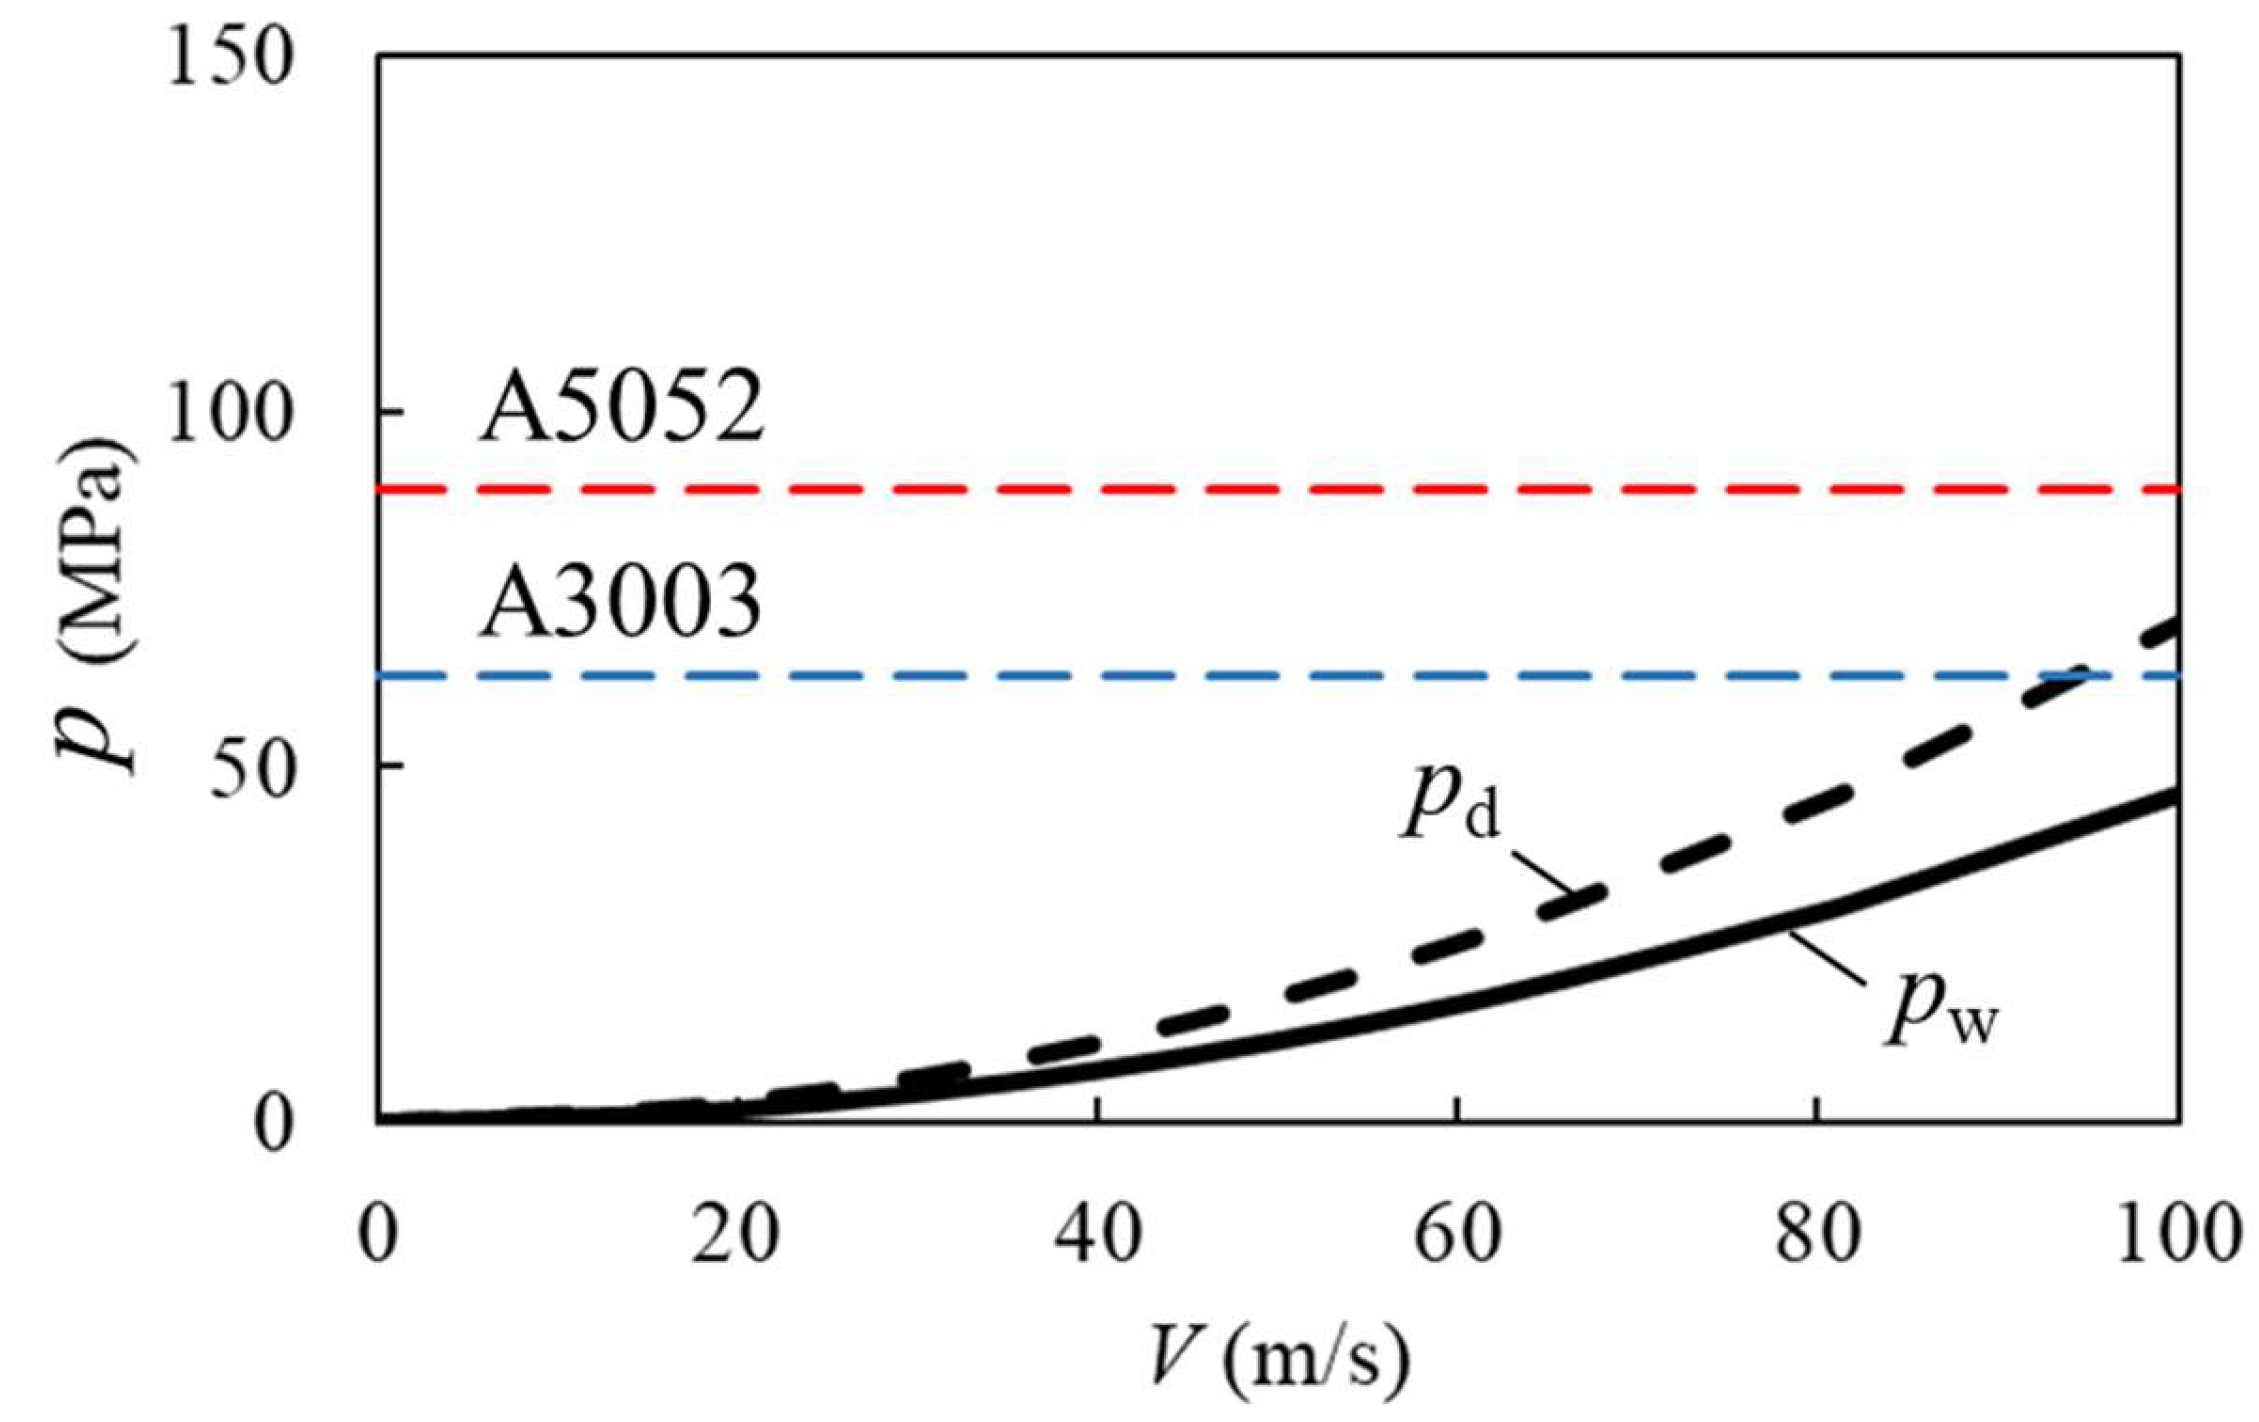
Figure 6 shows the peak impact pressures on a wet wall pw and dry wall pd (obtained using Equations (1) and (2)) plotted against the impact velocity V of the droplet. The non-dimensional water film thickness in this study was evaluated as h/d = 0.0213 under the assumption of the uniform spreading of the pulsed jet [37]. Thus, the peak impact pressure on the wet wall pw can be lower than that on the dry wall pd, owing to the pressure damping effect of the water film. It was found that the impact pressure on a wet wall could be evaluated as pw = 17 to 46 MPa in the velocity range from 60 to 100 m/s. This impact pressure range was lower than the measured offset yield strength of 63 MPa for A3003. Therefore, pit formation is not expected in this impact velocity range. However, pit formation was observed on the wall material (A3003) even at the lowest pulsed jet velocity of 58 m/s, which is shown in Figure 4b.
Figure 6.
Numerically simulated impact pressure p (MPa) versus droplet impact velocity V (m/s) in comparison with offset yield strengths of wall materials.
Furthermore, pit formation was observed on the test material (A5052) at the lowest velocity of 58 m/s, as shown in Figure 5b, where the measured offset yield strength increased to 89 MPa. This result also indicates that pit formation was suppressed in the test material A5052, where the offset yield strength of the material was approximately five times larger than the numerical impact pressure on the wet wall for the impact velocity of 58 m/s. Therefore, pit formation might not be caused by pure droplet impact pressure but by other mechanisms of erosion, such as cavitation erosion. This will be discussed in the next section.
5. LDI Cavitation Erosion Mechanism on Wet Wall
High-speed LDI was numerically simulated (considering the influence of the water film) by solving the two-dimensional compressible Euler equations for two-phase flows [27,38], where the viscous and surface tension effects were not included because of the high Reynolds number flow. These equations are written as follows:
where P is the pressure, u is the velocity vector, ρ is the density, and E is the total energy defined by the following equation:
where e is the specific internal energy.
These equations were closed by the stiffened gas equation of the state, and the material properties were obtained from the advection equations. For further details of the governing equations, see ref. [38].
The governing equations were solved through the finite volume method using the Monotonic Upwind Scheme for Conservation Laws (MUSCL) with a Harten–Lax–van Leer contact approximate Riemann solver. Time integration was performed using the three-stage Runge–Kutta total variation diminishing method with the slip wall boundary condition using the Ghost-cell Immersed boundary method. The validation of this result was confirmed through multiphase flow with a shock wave in comparison with the exact solution. For further details, see ref. [38].
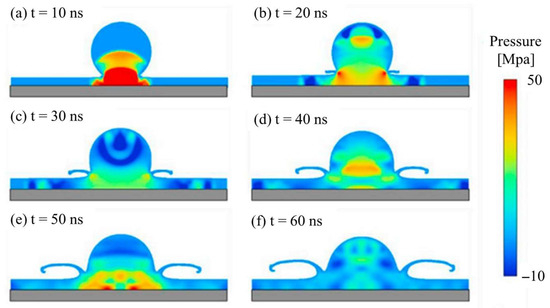
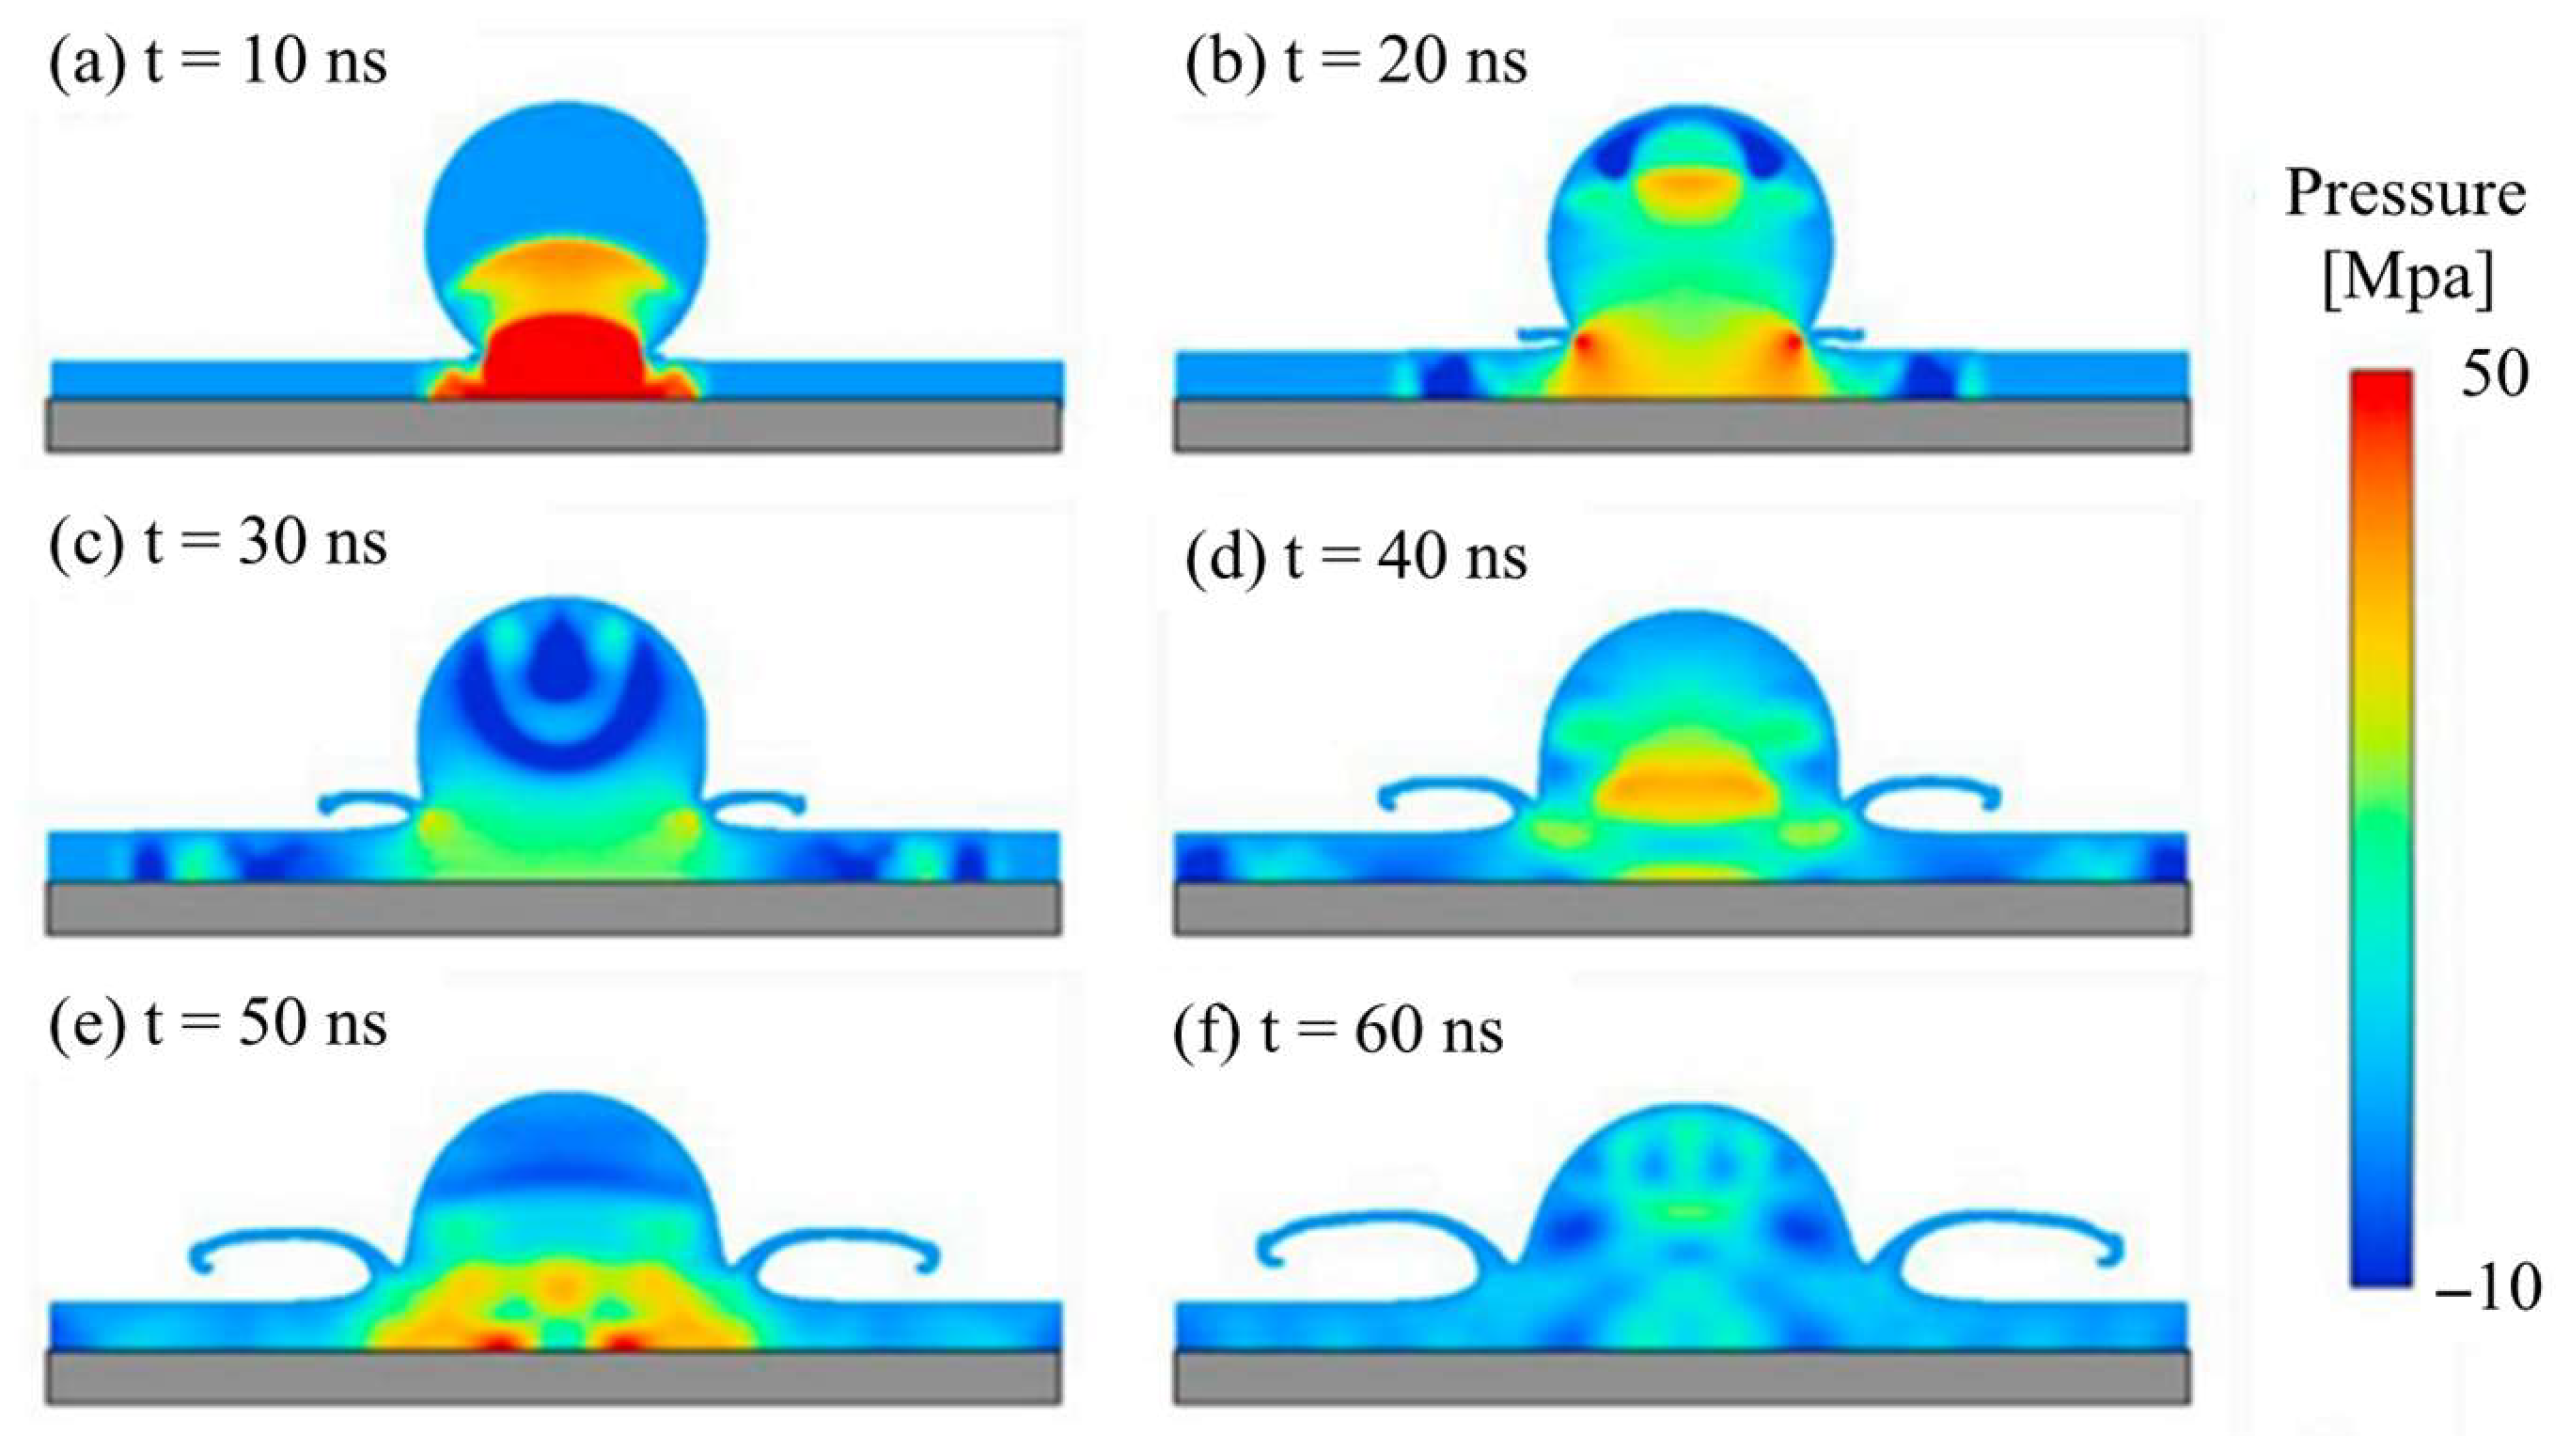
Examples of the LDI pressure fields for various time periods after the droplet impacting a wet wall are shown in Figure 7 [27]. The computation was conducted for a water droplet with a 30 μm diameter impacting a wet wall with a 5 μm thick water film at a velocity of 100 m/s, which corresponds to the non-dimensional water film thickness h/d = 0.167. A careful examination of the pressure contour showed that the formation of the low-pressure region appeared not only on the top of water droplets Figure 7b,c but also on both sides of droplets Figure 7b–d in the water film. It should be mentioned that cavitation can be generated when water droplets impact water film, when the local pressure decreases lower than the saturated vapor pressure of water (=0.0023 MPa at 20 °C). This condition approximately corresponds to the negative-pressure region in Figure 7. The formation of a low-pressure region in the top of the droplet could be caused by the interaction of reflected expansion waves [39], while that in the water film could be generated by the high-speed lateral jet along the wall, which is several times faster than the impact velocity [7].
Figure 7.
Illustrations of numerical pressure contours of LDI on a wet wall [27]. Copyright (2019) with permission from Elsevier.
The low-pressure region on top of the liquid droplet Figure 7b,c could be a source of cavitation on the dry wall, as noted in the literature [39,40,41]. On the other hand, the low-pressure region in the water film on the wall Figure 7b–d could be an additional source of cavitation erosion arising from the impact on the wet wall. This might have influenced the material erosion of the water droplet because it was placed closer to the wall. Therefore, the low-pressure region near the wall in the water film may generate a higher impulsive pressure than that of the droplet impact on a wall. The mechanism of impulsive pressure generation could be the cavitation bubble collapse near the wall by the micro-jet [42,43,44,45,46,47,48,49,50,51]. The low-pressure region near the wall is generated on both sides of the impacting droplet and moves away from the impacting position over time; see Figure 7b–d.
Furthermore, an increased impact pressure on the wet wall was found by Sasaki & Iga [28] in a numerical study of a droplet impacting a wet cavity wall, where the peak impact pressure was several times higher than that of the droplet on a dry wall. Such an increased impact pressure can be caused by the reentrant-jet mechanism. The micro-jet velocity can be several times higher than that of the pulsed jet [45]; it depends on the bubble diameter, distance from the wall, and surface roughness. The micro-jet may be accelerated by the influence of the water film on the wet cavity wall, resulting in increased erosion, consistent with the present experiment.
It might be difficult to accurately measure the impulsive pressure of cavitation through the simultaneous measurement of impact force and the area of impact. This is because the measurement requires a tiny force sensor with a high frequency response and an evaluation of the pitting area, which is expected to be smaller than 0.1 mm in diameter. Furthermore, a micro-jet occurs randomly in space and time in a tiny pitting area. Therefore, the impulsive pressure has rarely been measured in the literature, and it will be a future topic of interest (See ref. [51]).
Interestingly, the pit formation observed in the LDI on the wet wall behaves similarly to cavitation pit formation, which was experimentally observed by Hattori & Takinami [31]. This is because LDI on a wet wall is a cavitation erosion phenomenon. This result suggests that the impact pressure is much larger than the offset yield strength of the wall and could be caused by cavitation erosion on a wet wall. However, further studies on the influence of the water film on the impact pressure considering cavitation will be an important topic for evaluating the erosion initiation of actual blades operating in rainfall.
6. Comparison with Acoustic Cavitation Test
Droplet impingement on a wall is characterized by the very short impact time associated with droplet deformation. When a droplet of 3 mm in diameter impacts the wall at a velocity of 60 m/s, the impact time is estimated as 50 μs (=20 kHz), which is based on the droplet diameter and impact velocity for the actual blade. This droplet impact can be approximately reproduced in the acoustic cavitation test by oscillating the transducer at 20 kHz because it has a similar lifetime to the droplet impact. To compare the pit image caused by the pulsed jet in acoustic cavitation tests, observations of the cavitation bubble and erosion behavior in the acoustic cavitation test were carried out in this study. It should be mentioned that the general behavior of cavitation erosion in the acoustic cavitation test has been studied in the literature [52,53,54,55,56,57,58].
Cavitation clouds were generated near the test specimen A3003 in the acoustic cavitation test (Figure 2) by oscillating the transducer, which resulted in erosion initiation on the test specimen. Note that the spacing between the transducer and test specimen was set to 1 mm from the condition of maximum impulsive pressure in reference to the previous study [56]. A working fluid of tap water was used in this experiment because it is a well-studied liquid in acoustic cavitation tests in the literature [52,54,56]. It should be mentioned that the rain droplet could involve air pollutants and emissions [59]. Furthermore, air bubbles could be generated at the impact of the droplet on the wall due to the air entrainment mechanism [60,61,62]. The entrained air bubbles might collapse in the low-pressure region of the impacting droplet. Therefore, the cavitation pressure could suffer due to these effects and the dissolved gas content [55], which requires future study.
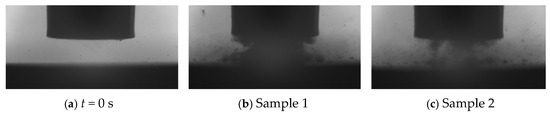
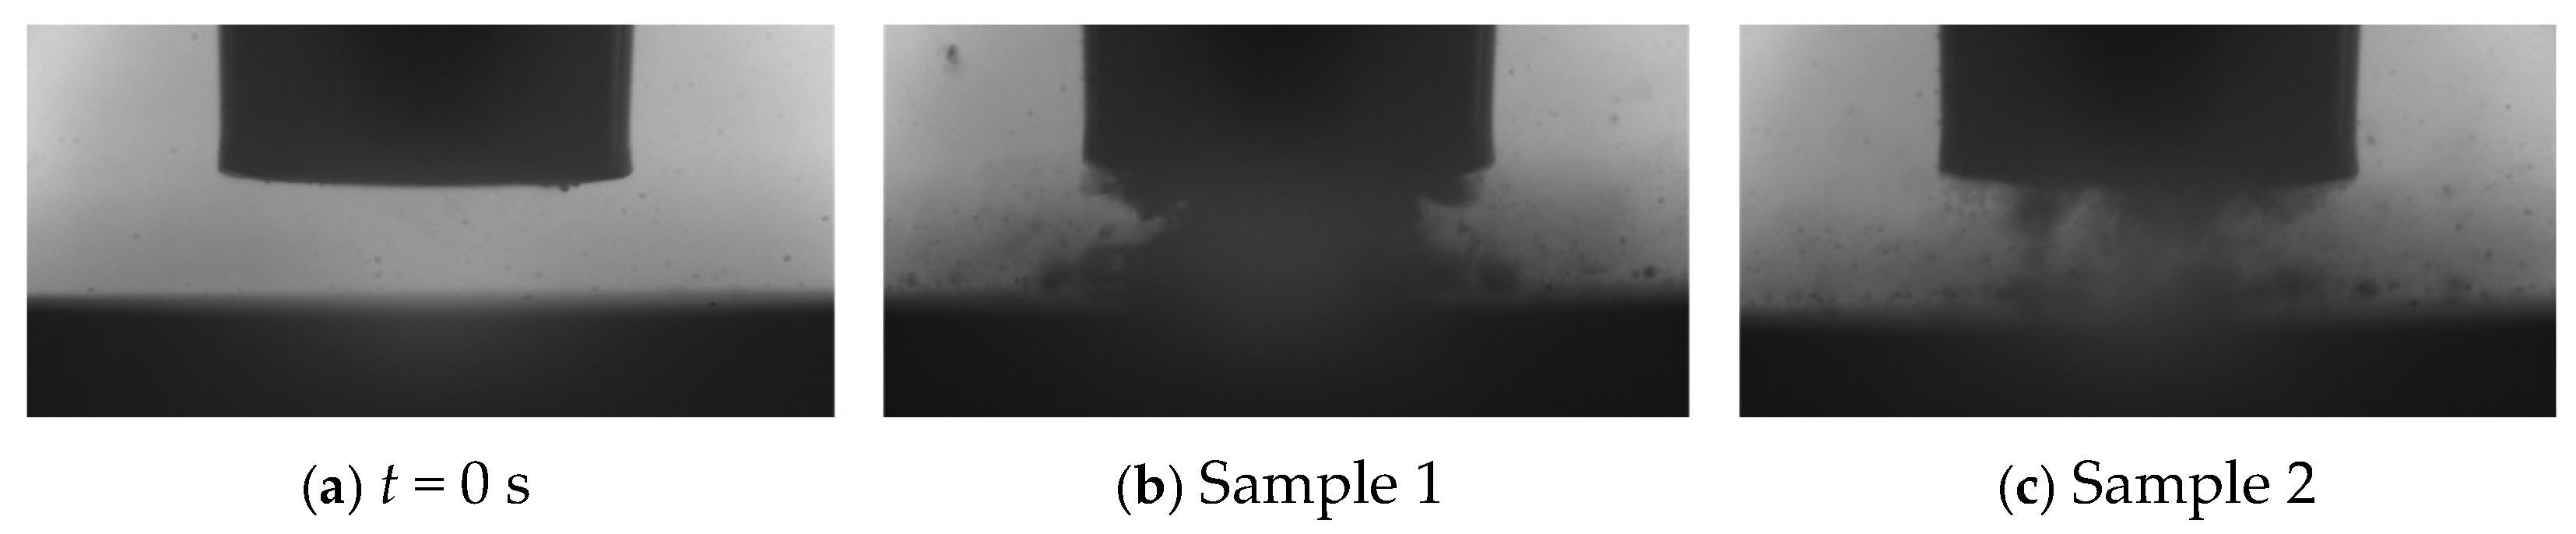
Figure 8 shows inline observations of the target spacing between the transducer and target specimen before the test (a) and after the operation of the transducer (b), (c), which were taken by a high-speed camera. These images show the occurrence of cavitation clouds over the target specimen. Cavitation clouds were generated near the transducer surface and target specimen. The careful observation of time-series images showed that cavitation clouds were generated in the spacing, where the flow in and out of the spacing occurred unsteadily, which was observed in Figure 8b,c.
Figure 8.
Observation of acoustic cavitation clouds over the target material A3003 (4.0 mm × 8.4 mm in image area).
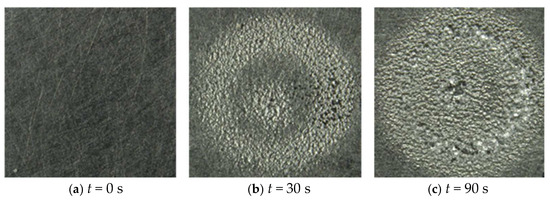
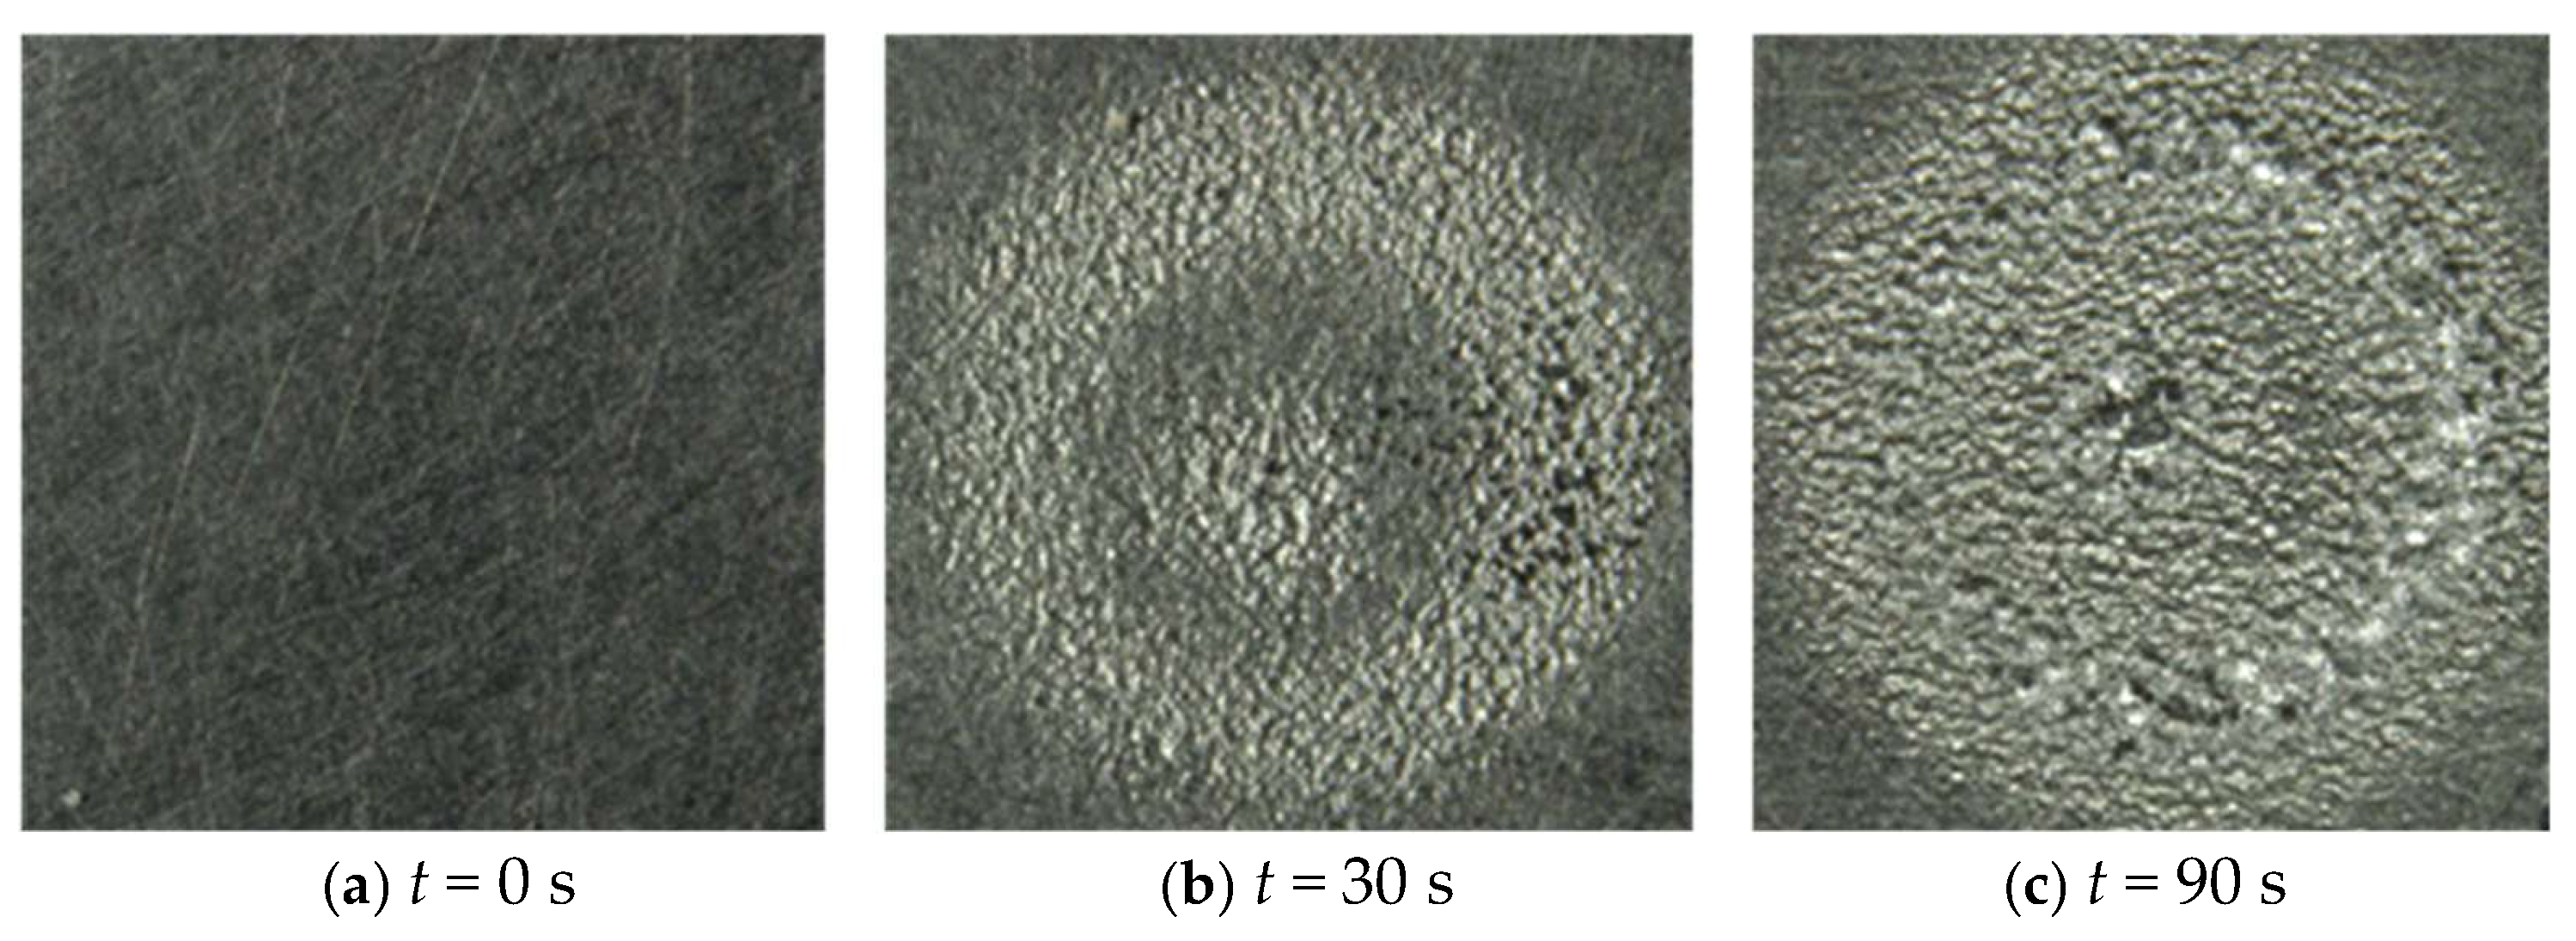
Figure 9 shows the erosion images of the target material A3003 before the test (a) at t = 0 s and after the operation of transducer at times t = 30 s (b) and t = 90 s (c), taken using a standard microscope. The erosion images show that the target material A3003 initiates pit formation immediately after the operation of the transducer (b), and the erosion area spreads when increasing the operating time (c). It should be noted that the oscillation frequency of the transducer was 20 kHz in the acoustic cavitation test, while the impact frequency of the pulsed-jet test was 160 Hz, resulting in a 125-times difference in the impact frequency. By considering this impact frequency difference, the operation times of 30 s and 90 s in the acoustic cavitation test correspond to 3750 s and 11,250 s in the pulsed-jet test, respectively. Thus, the erosion behavior of the acoustic cavitation test was similarly observed in the pulsed-jet test in Figure 3.
Figure 9.
Observation of acoustic cavitation erosion initiation for the target material A3003 observed using a microscope (4.2 mm × 4.2 mm in image area).
Figure 10 shows the observations for the surface material A3003 in the acoustic cavitation test using a differential interferometric microscope, when the acoustic cavitation test time was sufficiently short, ~0.5 s, which corresponds to the number of impacts for the pulsed-jet test of 60 s in Figure 4. The target surface images for the test specimen are filled with pits that are randomly distributed on the target materials, similar to the surface images of the pulsed-jet test in Figure 4. This result implies that the pitting behavior of the pulsed-jet test was well reproduced in the acoustic cavitation test, when the number of impacts was approximately the same. Thus, the impulsive pressure of the pulsed jet could be considered roughly the same magnitude as that of the acoustic cavitation test. This could support the occurrence of random pits of cavitation in the present pulsed-jet test on a wet aluminum wall.
Figure 10.
Observation of acoustic cavitation pits on the target material A3003 using a differential interferometric microscope (0.8 mm × 0.8 mm of center image area, 0.5-s impact period).
The measurement of the impact pressure and observation of high-speed droplet behavior near the material surface remain a future topic of interests for clarifying the detailed mechanism of pit formation caused by pulsed-jet and acoustic cavitation tests. Furthermore, the development of a new ground erosion tester based on the similarity between the acoustic cavitation and pulsed-jet tests will be part of a future study in the context of rain erosion prediction for blades, as the acoustic cavitation test can accelerate the erosion behavior of materials.
7. Conclusions
In this study, a new rain erosion mechanism for a wet wind turbine blade was investigated theoretically, numerically and experimentally by examining the impact pressures of a water droplet on the smooth wet wall of aluminum A3003 (with an offset yield strength of 63 MPa) and annealed A5052 (with a higher offset yield strength of 89 MPa).
The experimental results showed that pit formation was observed on the smooth wall of A3003 immediately after the short pulsed-jet duration, which is much shorter than the end of the incubation stage associated with mass loss. Furthermore, pit formation was observed critically on the annealed A5052. Experimental pit formation was observed randomly on the walls, even if the theoretical and numerical impact pressures of the pulsed jet were lower than the offset yield strength of the wall.
To explain this, the occurrence of cavitation was examined in reference to the pressure contour obtained from the previous numerical result for droplet impact on a wet wall. The result showed that the pressure region lower than the saturated vapor pressure led to the occurrence of cavitation, which was observed not only in the impacting droplet but also in the water film in the droplet-impacting area. This may produce significantly higher impact pressures on the wall through the micro-jet mechanism of cavitation collapse than that of the droplet impact.
Furthermore, an acoustic cavitation test was carried out to explain the similarity between the pulsed-jet and acoustic cavitation tests. It was confirmed that the pitting behavior of the pulsed-jet test was similarly observed in the acoustic cavitation test at roughly the same number of impacts when the impact frequency difference accounted for the number of impacts. Furthermore, the occurrence of cavitation clouds in the acoustic cavitation test was confirmed through a flow visualization study operating at 600 W and 20 kHz with a 1 mm thick spacing between the transducer and test material, resulting in random pit formation and erosion initiation on aluminum A3003.
These results indicate that the erosion initiation of an actual blade may occur much sooner than expected by the end of the incubation stage of erosion, and that the impact pressure is larger than the offset yield strength of the wall. This can be caused by the occurrence of cavitation erosion caused by the formation of low pressure in the water droplet and film. Therefore, the rain droplet impact on wet wind turbine blades might be associated with cavitation erosion, resulting in greater erosion on the wind turbine blade than expected.
Funding
This work was partly supported by the NEDO international collaborative research project, JPNP20005, and the JSPS KAKENHI, Grant Number JP22K05000.
Data Availability Statement
The original contributions presented in this study are included in the article. Further inquiries can be directed to the corresponding author.
Acknowledgments
The author expresses gratitude to T. Yamagata of Niigata University and M. Nakagawa of Niigata Prefecture Institute of Technology for the testing and surface observations using a standard microscope and differential interferometric microscope, respectively. The acoustic cavitation test was performed with the cooperation of T. Sasaki of Niigata University.
Conflicts of Interest
The author declares that he has no known competing financial interests or personal relationships that could have appeared to influence the work reported in this article.
Nomenclature
| a, b | Constants [-] |
| c | Sound velocity of water (m/s) |
| d | Diameter of droplet (μm) |
| h | Water film thickness (μm) |
| L | Jet length (mm) |
| Ma | Mach number (=V/c) [-] |
| p | Pressure (MPa) |
| pd | Pressure on dry wall (MPa) |
| pw | Pressure on wet wall (MPa) |
| t | Elapsed time (s) |
| V | Impact velocity of droplet (m/s) |
| ρ | Density of fluid (kg/m3) |
References
- Dalili, N.; Edrisy, A.; Carriveau, R. A review of surface engineering issues critical to wind turbine performance. Renew. Sustain. Energy Rev. 2009, 13, 428–438. [Google Scholar] [CrossRef] [Scilit]
- Keegan, M.H.; Nash, D.H.; Stack, M.M. On erosion issues associated with the leading edge of wind turbine blades. J. Phys. D 2013, 46, 383001. [Google Scholar] [CrossRef] [Scilit]
- Sareen, A.; Sapre, C.A.; Selig, M.S. Effects of leading-edge erosion on wind turbine blade performance. Wind Energy 2014, 17, 1531. [Google Scholar] [CrossRef] [Scilit]
- Slot, H.M.; Gelinck, E.R.M.; Rentrop, C.; Heidevan, E. Leading edge erosion of coated wind turbine blades: Review of coating life models. Renew. Energy 2015, 80, 837–848. [Google Scholar] [CrossRef] [Scilit]
- Mishnaevsky, L., Jr.; Hasager, C.B.; Bak, C.; Tilg, A.M.; Bech, J.I.; Rad, S.D.; Fæster, S. Leading edge erosion of wind turbine blades: Understanding, prevention and protection. Renew. Energy 2021, 169, 953–969. [Google Scholar] [CrossRef] [Scilit]
- Pryor, S.C.; Barthelmie, R.J.; Cadence, J.; Dellwik, E.; Hasager, C.B.; Kral, S.T.; Reuder, J.; Rodgers, M.; Veraart, M. Atmospheric drivers of wind turbine blade leading edge erosion: Review and recommendations for future research. Energies 2022, 15, 8553. [Google Scholar] [CrossRef] [Scilit]
- Fujisawa, N. A review of liquid droplet impingement and rain erosion of a wind turbine blade. Next Energy 2025, 8, 100262. [Google Scholar] [CrossRef] [Scilit]
- Amirzadeh, B.; Louhghalam, A.; Raessi, M.; Tootkaboni, M. A computational framework for the analysis of rain-induced erosion in wind turbine blades. J. Wind Eng. Ind. Aerodyn. 2017, 163, 33–54. [Google Scholar] [CrossRef] [Scilit]
- Bartolomé, L.; Teuwen, J. Prospective challenges in the experimentation of the rain erosion on the leading edge of wind turbine blades. Wind Energy 2018, 22, 140–151. [Google Scholar] [CrossRef] [Scilit]
- Eisenberg, D.; Laustsen, S.; Stege, J. Wind turbine blade coating leading edge rain erosion model: Development and validation. Wind Energy 2018, 21, 942–951. [Google Scholar] [CrossRef] [Scilit]
- Dashtkar, A.; Hadavinia, H.; Sahinkaya, M.N.; Williams, N.A.; Vahid, S.; Ismail, F.; Turner, M. Rain erosion-resistant coatings for wind turbine blades: A review. Polym. Polym. Compos. 2019, 27, 443–475. [Google Scholar] [CrossRef] [Scilit]
- Herring, R.; Dyer, K.; Martin, F.; Warda, C. The increasing importance of leading edge erosion and a review of existing protection solutions. Renew. Sustain. Energy Rev. 2019, 115, 109382. [Google Scholar] [CrossRef] [Scilit]
- Ibrahim, M.E.; Medraj, M. Water droplet erosion of wind turbine blades: Mechanics, testing, modeling and future perspectives. Materials 2020, 13, 157. [Google Scholar]
- Law, H.; Koutsos, B. Leading edge erosion of wind turbines: Effect of solid airborne particles and rain on operational wind farms. Wind Energy 2020, 23, 1955–1965. [Google Scholar] [CrossRef] [Scilit]
- Fujisawa, N.; Johansen, N.F.J.; Yamagata, T.; Fujisawa, K.; Tanaka, M. A review and comparative study of uncertainty in rain erosion testers for wind turbine blades. J. Flow Energy 2023, 1, 1–15. [Google Scholar]
- Castorrini, A.; Ortolani, A.; Campobasso, M.S. Assessing the progression of wind turbine energy yield losses due to blade erosion by resolving damage geometries from lab tests and field observations. Renew. Energy 2023, 218, 119256. [Google Scholar] [CrossRef] [Scilit]
- Yusof, N.A.W.; Algaddaime, T.F.; Stack, M.M. Advancements and challenges in coatings for wind turbine blade raindrop erosion: A comprehensive review of mechanisms, materials and testing. Sustainability 2025, 17, 9611. [Google Scholar] [CrossRef] [Scilit]
- Verma, A.S.; Castro, S.G.P.; Jiang, Z.; Teuwen, J.J.E. Numerical investigation of rain droplet impact on offshore wind turbine blades under different rainfall conditions: A parametric study. Compos. Struct. 2020, 241, 112096. [Google Scholar] [CrossRef] [Scilit]
- Fujisawa, N.; Kawabata, H. Numerical study on the impact pressure of droplets on wind turbine blades using a whirling arm rain erosion tester. Fluids 2024, 9, 160. [Google Scholar] [CrossRef] [Scilit]
- Fujisawa, N.; Yoshida, M.; Yamagata, T. Experimental method for measuring the impact force of a rain droplet on the leading edge of a wind turbine blade. J. Flow Energy 2024, 2, 37–46. [Google Scholar]
- Brunton, J.H.; Rochester, M.C. Erosion of solid surfaces by the impact of liquid drops. Acad. Press Treatise Mater. Sci. Technol. 1979, 16, 186–248. [Google Scholar]
- Xiong, J.; Koshizuka, S.; Sakai, M. Investigation of droplet impingement onto wet walls based on simulation using particle method. J. Nucl. Sci. Technol. 2011, 48, 145–153. [Google Scholar] [CrossRef]
- Fujisawa, N.; Yamagata, T.; Saito, K.; Hayashi, K. The effect of liquid film on liquid droplet impingement erosion. Nucl. Eng. Des. 2013, 265, 909–917. [Google Scholar] [CrossRef] [Scilit]
- Fujisawa, K.; Yamagata, T.; Fujisawa, N. Damping effect on impact pressure from liquid droplet impingement on wet wall. Ann. Nucl. Energy 2018, 121, 260–268. [Google Scholar] [CrossRef] [Scilit]
- Sasaki, H.; Ochiai, N.; Iga, Y. Numerical analysis of damping effect of liquid film on material in high-speed liquid droplet impingement. Int. J. Fluid Mach. Syst. 2016, 9, 57–65. [Google Scholar] [CrossRef] [Scilit]
- Fujisawa, N.; Takano, S.; Fujisawa, K.; Yamagata, T. Experiments on liquid droplet impingement erosion on a rough surface. Wear 2018, 398–399, 158–164. [Google Scholar] [CrossRef] [Scilit]
- Fujisawa, K.; Ohki, M.; Fujisawa, N. Influence of surface roughness on liquid droplet impingement erosion. Wear 2019, 432–433, 202955. [Google Scholar] [CrossRef] [Scilit]
- Sasaki, H.; Iga, Y. Numerical analysis of liquid droplet impingement on pitted material surface with water pool of various depth. Int. J. Fluid Mach. Syst. 2019, 12, 277–284. [Google Scholar] [CrossRef] [Scilit]
- Fujisawa, N. Liquid droplet impingement erosion on multiple grooves. Wear 2020, 462, 203513. [Google Scholar] [CrossRef] [Scilit]
- Mishnaevsky, A.L., Jr.; Tempelis, N.; Kuthe, P. Mahajan, Recent developments in the protection of wind turbine blades against leading edge erosion: Materials solutions and predictive modelling. Renew. Energy 2023, 215, 118966. [Google Scholar] [CrossRef] [Scilit]
- Hattori, S.; Takinami, M. Comparison of cavitation erosion rate with liquid impingement erosion rate. Wear 2010, 269, 310–316. [Google Scholar] [CrossRef] [Scilit]
- ASTM G73-10; Standard Test Method for Liquid Impingement Erosion Using Rotating Apparatus. ASTM International: West Conshohocken, PA, USA, 2017; pp. 294–312.
- Fujisawa, N.; Komatsu, M.; Yamagata, T. Experimental study on erosion initiation via liquid droplet impingement on smooth and rough walls. Wear 2020, 452–453, 203316. [Google Scholar] [CrossRef] [Scilit]
- Yamagata, T.; Hasegawa, M.; Fujisawa, N. Erosion behavior of pulsed-jet test facility for wind turbine blade. Wear 2023, 514–515, 204565. [Google Scholar] [CrossRef] [Scilit]
- DNV GL-RP-0171; Testing of Rotor Blade Erosion Protection Systems. DNV GL: Høvik, Norway, 2018; pp. 1–64.
- Haller, K.K.; Ventikos, Y.; Poulikakos, D.; Monkewitz, P. Computational study of high-speed liquid droplet impact. J. Appl. Phys. 2002, 92, 2821–2828. [Google Scholar] [CrossRef] [Scilit]
- Fujisawa, N.; Yamagata, T.; Fujisawa, K. On the correlation of erosion initiations using pulsed-jet and whirling-arm testers. Wear 2025, 568–569, 205965. [Google Scholar] [CrossRef] [Scilit]
- Fujisawa, K.; Yamagata, T.; Fujisawa, N. Liquid droplet impingement erosion on groove roughness. Nucl. Eng. Des. 2018, 330, 368–376. [Google Scholar] [CrossRef] [Scilit]
- Sasaki, H.; Ochiai, N.; Iga, Y. Numerical study of high speed liquid droplet impingement phenomena by fluid/material coupled numerical method. J. Multiph. Flow 2016, 30, 65–74. (In Japanese) [Google Scholar] [CrossRef] [Scilit]
- Field, J.E.; Dear, J.P.; Ogren, J.E. The effects of target compliance on liquid drop impact. J. Appl. Phys. 1989, 65, 533–540. [Google Scholar] [CrossRef] [Scilit]
- Field, J.E.; Camus, J.J.; Tinguely, M.; Obreschkow, D.; Farhat, M. Cavitation in impacted drops and jets and the effect on erosion damage thresholds. Wear 2012, 290, 154–160. [Google Scholar] [CrossRef] [Scilit]
- Tomita, Y.; Shima, A. Mechanisms of impulsive pressure generation and damage pit formation by bubble collapse. J. Fluid Mech. 1986, 169, 535–564. [Google Scholar] [CrossRef] [Scilit]
- Philipp, A.; Lauterborn, W. Cavitation erosion by single laser-produced bubbles. J. Fluid Mech. 1998, 361, 75–116. [Google Scholar] [CrossRef] [Scilit]
- Ochiai, N.; Iga, Y.; Nohmi, M.; Ikohagi, T. Numerical analysis of nonspherical bubble collapse behavior and induced impulsive pressure during first and second collapses near the wall boundary. J. Fluid Sci. Technol. 2011, 6, 860–874. [Google Scholar] [CrossRef] [Scilit]
- Tzanakis, I.; Eskin, D.G.; Georgoulas, A.; Fytanidis, D.K. Incubation pit analysis and calculation of the hydrodynamic impact pressure from the implosion of an acoustic cavitation bubble. Ultrason. Sonochem. 2014, 21, 866–878. [Google Scholar] [CrossRef] [Scilit] [PubMed]
- Peters, A.; Sagar, H.; Lantermann, U.; Moctar, O. Numerical modelling and prediction of cavitation erosion. Wear 2015, 338, 189–201. [Google Scholar] [CrossRef] [Scilit]
- Ye, L.; Zhu, X. Analysis of the effect of impact of near-wall acoustic bubble collapse micro-jet on Al 1060. Ultrason. Sonochem. 2017, 36, 507–516. [Google Scholar] [CrossRef] [Scilit]
- Fujisawa, N.; Fujita, Y.; Yanagisawa, K.; Fujisawa, K.; Yamagata, T. Simultaneous observation of cavitation collapse and shock wave formation in cavitating jet. Exp. Therm. Fluid Sci. 2018, 94, 159–167. [Google Scholar] [CrossRef] [Scilit]
- Xiong, J.; Liu, Y.; Li, C.; Zhou, Y.; Li, F. Quantitative evaluation of the microjet velocity and cavitation erosion on a copper plate produced by a spherical cavity focused transducer at the high hydrostatic pressure. Ultrason. Sonochem. 2022, 82, 105899. [Google Scholar] [CrossRef] [Scilit]
- Zhai, Y.; Xu, W.; Luo, J.; Li, J. Experimental study on the characteristics of microjets and shock waves of cavitation bubbles near elastic boundaries. Ocean Eng. 2022, 257, 111664. [Google Scholar] [CrossRef] [Scilit]
- Fujisawa, N. Recent advances in experimental and numerical studies on cloud and erosion behaviors in cavitating jets. Fluids 2026, 11, 14. [Google Scholar] [CrossRef] [Scilit]
- Krefting, D.; Mettin, R.; Lauterborn, W. High-speed observation of acoustic cavitation erosion in multibubble systems. Ultrason. Sonochem. 2004, 11, 119–123. [Google Scholar] [CrossRef] [Scilit]
- Ashokkumar, M. The characterization of acoustic cavitation bubbles–an overview. Ultrason. Sonochem. 2011, 18, 864–872. [Google Scholar] [CrossRef] [Scilit] [PubMed]
- Laguna-Camacho, J.R.; Lewis, R.; Vite-Torres, M.; Méndez-Méndez, J.V. A study of cavitation erosion on engineering materials. Wear 2013, 301, 467–476. [Google Scholar] [CrossRef] [Scilit]
- Li, B.; Gu, Y.; Chen, M. An experimental study on the cavitation of water with dissolved gases. Exp. Fluids 2017, 58, 164. [Google Scholar] [CrossRef] [Scilit]
- Yokoyama, K.; Sasaki, T. Research on visualization of bubble behavior and flow control in ultrasonic cavitation. In 55th Hokushinetsu Mechanical Engineering Conferences; The Japan Society of Mechanical Engineers: Fukui, Japan, 2018; p. K035. (In Japanese) [Google Scholar]
- Yasui, K. Acoustic cavitation. In Acoustic Cavitation and Bubble Dynamics; Yasui, K., Ed.; Springer International Publishing: Cham, Switzerland, 2018; pp. 1–35. [Google Scholar]
- Hofmann, J.; Thiébaut, C.; Riondet, M.; Lhuissier, P.; Gaudion, S.; Fivel, M. Comparison of acoustic and hydrodynamic cavitation, Material point of view. Phys. Fluids 2023, 35, 017112. [Google Scholar] [CrossRef] [Scilit]
- Grennfelt, P.; Engleryd, A.; Forsius, M.; Hov, Ø.; Rodhe, H.; Cowling, E. Acid rain and air pollution: 50 years of progress in environmental science and policy. Ambio 2020, 49, 849–864. [Google Scholar] [CrossRef] [Scilit]
- Tran, T.; de Maleprade, H.; Sun, C.; Lohse, D. Air entrainment during impact of droplets on liquid surfaces. J. Fluid Mech. 2013, 726, R3. [Google Scholar] [CrossRef] [Scilit]
- Pack, M.; Hu, H.; Kim, D.; Zheng, Z.; Stone, H.A.; Sun, Y. Failure mechanisms of air entrainment in drop impact on lubricated surfaces. Soft Matter 2017, 13, 2402–2409. [Google Scholar] [CrossRef] [Scilit]
- Tran, H.; He, Z.; Pack, M.Y. Microbubble entrainment on thin liquid films under drop impacts. J. Colloid Interface Sci. 2025, 682, 915–923. [Google Scholar] [CrossRef] [Scilit]

Disclaimer/Publisher’s Note: The statements, opinions and data contained in all publications are solely those of the individual author(s) and contributor(s) and not of MDPI and/or the editor(s). MDPI and/or the editor(s) disclaim responsibility for any injury to people or property resulting from any ideas, methods, instructions or products referred to in the content. |
© 2026 by the author. Licensee MDPI, Basel, Switzerland. This article is an open access article distributed under the terms and conditions of the Creative Commons Attribution (CC BY) license.