


Abstract
With hydropower supplying nearly 94% of Ethiopia’s electricity, the national power grid is extremely vulnerable to recurrent droughts and erratic rainfall. To mitigate this risk, this study examines the wind power potential across five specific locations: Arerti, Sela Dingay, Debre Berhan, Mega, and Gode. By combining on-site mast measurements with datasets from NASA and the Global Wind Atlas, we evaluated wind characteristics at industry-standard hub heights of 80 m and 100 m. The analysis focused on wind power density (WPD), Weibull stability parameters (k and c), and directional consistency. The results indicate that Gode and Mega are the premier choices for commercial development, showing average speeds above 8.5 m/s and power densities exceeding 500 W/m2 at the 100 m level. Gode stands out as the most reliable site, with a Weibull shape factor (k) of 2.8 and a scale factor (c) of 9.1 m/s. We modeled a standard 3 MW turbine while factoring in a 20% loss for real-world conditions; this yielded net annual energy productions of 9461 MWh (36% CF) for Gode, 9040 MWh (34.4% CF) for Mega, and 8619 MWh (32.8% CF) for Arerti. While Sela Dingay and Debre Berhan have lower initial yields, their feasibility improves significantly when using towers taller than 80 m. Wind rose data reveals that Gode and Arerti have highly unidirectional flows, which simplifies turbine micro-siting. Notably, Arerti provides a unique economic advantage due to its location right next to existing 132/230 kV transmission infrastructure and industrial load centers. Overall, these findings provide a definitive technical roadmap for Ethiopia to diversify its energy portfolio and meet its Climate-Resilient Green Economy (CRGE) objectives.
1. Introduction
Ethiopia stands as one of East Africa’s most vibrant economies, a status that necessitates a massive surge in power generation to fuel industrial growth and achieve universal energy access. However, the nation’s energy sector is defined by a deep contradiction: while widely recognized as the “Water Tower of Africa” because of its extensive river systems, its energy security remains remarkably precarious. Currently, the national grid relies on hydropower for approximately 94% of its total generation [1]. Although hydro provides affordable baseload electricity, it is extremely vulnerable to shifts in the climate [2]. Recent periods of erratic rainfall and severe droughts have drastically lowered reservoir levels, causing power shortages that undermine economic stability [3]. Therefore, diversifying the energy mix is an essential step to reduce “hydro-dependency” and ensure a consistent power supply [4].
To counter these weaknesses, the Ethiopian government has established the Climate-Resilient Green Economy (CRGE) strategy and the National Electrification Program (NEP 2.0), both targeting full electrification by 2030 [5,6]. A fundamental element of this shift involves utilizing the country’s vast wind resources, which are theoretically estimated at 1350 GW [7]. Despite this massive potential, the move toward operational capacity has been sluggish; as of 2024, less than 1% of the technically viable wind capacity is being utilized [8,9]. This significant gap highlights the urgent need for localized technical validation to facilitate utility-scale investments [10].
At the global level, Ethiopia’s focus on wind energy corresponds with a broader international energy transition steered by the Paris Agreement and Sustainable Development Goal 7 (SDG 7) [11]. Global wind capacity recently crossed the 1 Terawatt (TW) threshold, supported by decreasing costs and advancements in turbine technology [12,13]. While developed countries and China have historically led the sector, emerging markets in Sub-Saharan Africa are now seen as the next frontier for wind power integration [14]. In this setting, Ethiopia’s initiatives serve as a vital case study for renewable energy deployment in landlocked, mountainous developing nations [15].
The main obstacle to widespread wind integration in Ethiopia is the scarcity of high-resolution, site-specific feasibility data. Regional assessments are currently uneven, with notable knowledge gaps in high-potential regions [16,17]. This research addresses these deficiencies by evaluating five distinct sites: Arerti, Sela Dingay, and Debre Berhan in the Amhara highlands, Gode in the Somali lowlands, and Mega in the Oromia region [18]. These study areas represent diverse topographical conditions, ranging from rugged mountain highlands to stable trade-wind plains [19,20].
The methodology for this research adopts a multi-source framework, combining NASA’s POWER data, the Global Wind Atlas (GWA) 3.0, and on-site meteorological mast measurements [21,22]. A primary objective is the vertical extrapolation of wind speeds to modern industry hub heights (80–100 m) to maximize energy capture efficiency [23,24]. Furthermore, the study assesses technical feasibility through Weibull distribution parameters (k and c), wind power density (WPD), and annual energy production (AEP) for 3 MW turbines [25,26]. Beyond technical characteristics, the research also considers infrastructural advantages, such as Arerti’s proximity to existing 132 kV and 230 kV transmission lines, which facilitates immediate grid integration with minimal capital cost [27]. Northern Africa leads the continent’s wind sector, with Egypt, Morocco, and Tunisia accounting for approximately 97% of all current installations [28] By examining the seasonal complementarity between wind and hydro, this study supports the development of a resilient and diversified energy system for Ethiopia [29,30].
1.1. Literature Review
The management and regulation of Ethiopia’s power infrastructure fall under the jurisdiction of Ethiopian Electric Power (EEP) and the Ethiopian Electric Utility (EEU). While the nation boasts an impressive total installed capacity of 7649 MW, the growth of wind power has remained noticeably static at just 404 MW [31,32]. In [33] it was highlighted that East Africa possesses substantial untapped wind energy potential that could alleviate the region’s current over-reliance on hydroelectric power. Furthermore, the successful deployment of wind power in Ethiopia necessitates addressing grid stability concerns through the optimized control of frequency and power oscillations [34].Utilizing DFIG-based turbines alongside advanced optimization algorithms offers a robust solution for damping system disturbances during the integration process [34]. Collectively, these studies emphasize the need to bridge reliable meteorological validation with technical stability enhancements to realize the wind energy potential of specific Ethiopian sites [33,34]. These earlier findings highlighted a critical technical requirement: for wind projects in the Ethiopian highlands to achieve utility-scale viability, they must utilize significantly taller hub heights and turbines specifically engineered for moderate speed regimes [35]. Additionally, these studies underscore a vital seasonal advantage; wind resources in these highlands typically peak during the dry season, offering a natural “hydro-complementarity” that balances the national grid when reservoir levels are at their lowest [36].
The topographical variety across the five selected study areas, including Gode, Mega, Arerti, Sela Dingay, and Debre Berhan, necessitates a sophisticated and differentiated modeling approach. Gode and Mega are characterized by relatively flat landscapes and consistent trade-wind patterns, whereas Arerti and Debre Berhan are subject to the complexities of rugged terrain and low-level jet streams [37,38]. To quantify these variables, researchers rely on the two-parameter Weibull distribution, where the shape factor (k) serves as a measure of stability and the scale factor (c) represents the average speed [39,40]. Achieving high k values is a priority for grid operators, as consistency in wind flow is essential for maintaining grid stability and minimizing the mechanical wear and fatigue on turbine components [41].
A persistent hurdle in wind resource modeling is the vertical extrapolation of data from ground-level masts to modern industry hub heights. The Hellman Power Law exponent is the standard tool for this calculation, though its precision is deeply dependent on localized factors like surface roughness and atmospheric layers [42]. In a regional context, Ethiopia’s wind ambitions find a strong parallel in Kenya’s Lake Turkana Wind Power project, which demonstrated that massive wind farms can be successfully synchronized with relatively small national grids [43]. Globally, China’s ability to implement over 20 GW of onshore capacity every year provides a clear roadmap for rapid renewable expansion [44]. As the international community moves toward a Net-Zero target for 2050, the prioritization of high-yield, strategically connected sites, such as those evaluated in this study, is vital for sustainable energy growth [45].
The socio-economic and practical feasibility of Ethiopian wind energy is heavily reliant on its proximity to existing industrial centers and transmission networks. Regional research suggests that sites in the Amhara and Oromia regions possess a competitive edge due to their closeness to major load centers and established high-voltage infrastructure [46]. For example, developing wind capacity in the Arerti area allows for the direct use of existing electrical systems, which drastically lowers the Levelized Cost of Energy (LCOE) compared to developing isolated, off-grid projects [47]. Similarly, techno-economic models indicate that wind expansion in the Somali region (Gode) could act as a catalyst for rural electrification and support the development of climate-resilient agricultural systems [48,49].
Modern advancements in resource mapping have integrated Geographic Information Systems (GIS) and remote sensing to pinpoint viable locations with extreme accuracy. These advanced tools allow for the pre-screening of land-use limits, environmental protections, and topographical hurdles before expensive on-site masts are deployed [50]. On a global scale, the transition toward “smart grids” and decentralized power has heightened the need for high-resolution data to manage the natural variability of renewable energy [51]. Furthermore, modern turbine innovations, such as adaptive smart blades, have proven highly effective in the moderate wind conditions typical of the Ethiopian highlands, effectively lowering the commercial entry barrier [52]. Consequently, the technical evaluation of these five sites adds valuable data to the global renewable resource database, supporting the worldwide transition toward decentralized energy and mid-century carbon neutrality [53].
The subsequent sections of this paper are organized as follows: Section 2 details the research methodology and provides descriptions of the selected study locations. Section 3 presents the data analysis, results, and a comprehensive discussion of the findings. Section 4 offers a detailed technical analysis of turbine power performance and annual energy output. Section 5 concludes the research with a summary of major takeaways, while Section 6 defines the study’s scope, future exploration compass, and potential research directions.
1.2. Contributions of the Study
- Built technical profiles that prove that Gode is the best spot for development because it has high power potential and very steady wind patterns.
- Showed that by using towers that are 100 m high, highland areas like Sela Dingay and Debre Berhan can finally produce enough energy to meet professional business standards.
- Calculated how much electricity a 3 MW turbine would actually produce in a year, subtracting 20% for natural losses to ensure that the numbers are realistic for planners.
- Identified Arerti as the best place to start building immediately because it is already located very close to 132 kV and 230 kV power lines and major transport roads.
- Created strategies to stop turbines from wearing out too fast and to help fix energy shortages during dry seasons by using spots where the wind blows in one steady direction.
- Aligned Ethiopia’s wind potential with global Net-Zero and SDG 7 targets, offering a technical roadmap to replace vulnerable hydro with stable wind power.
2. Materials and Methods
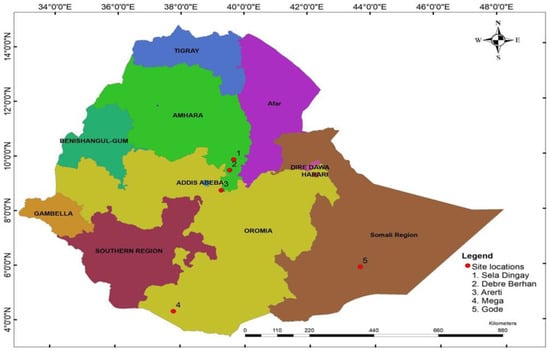
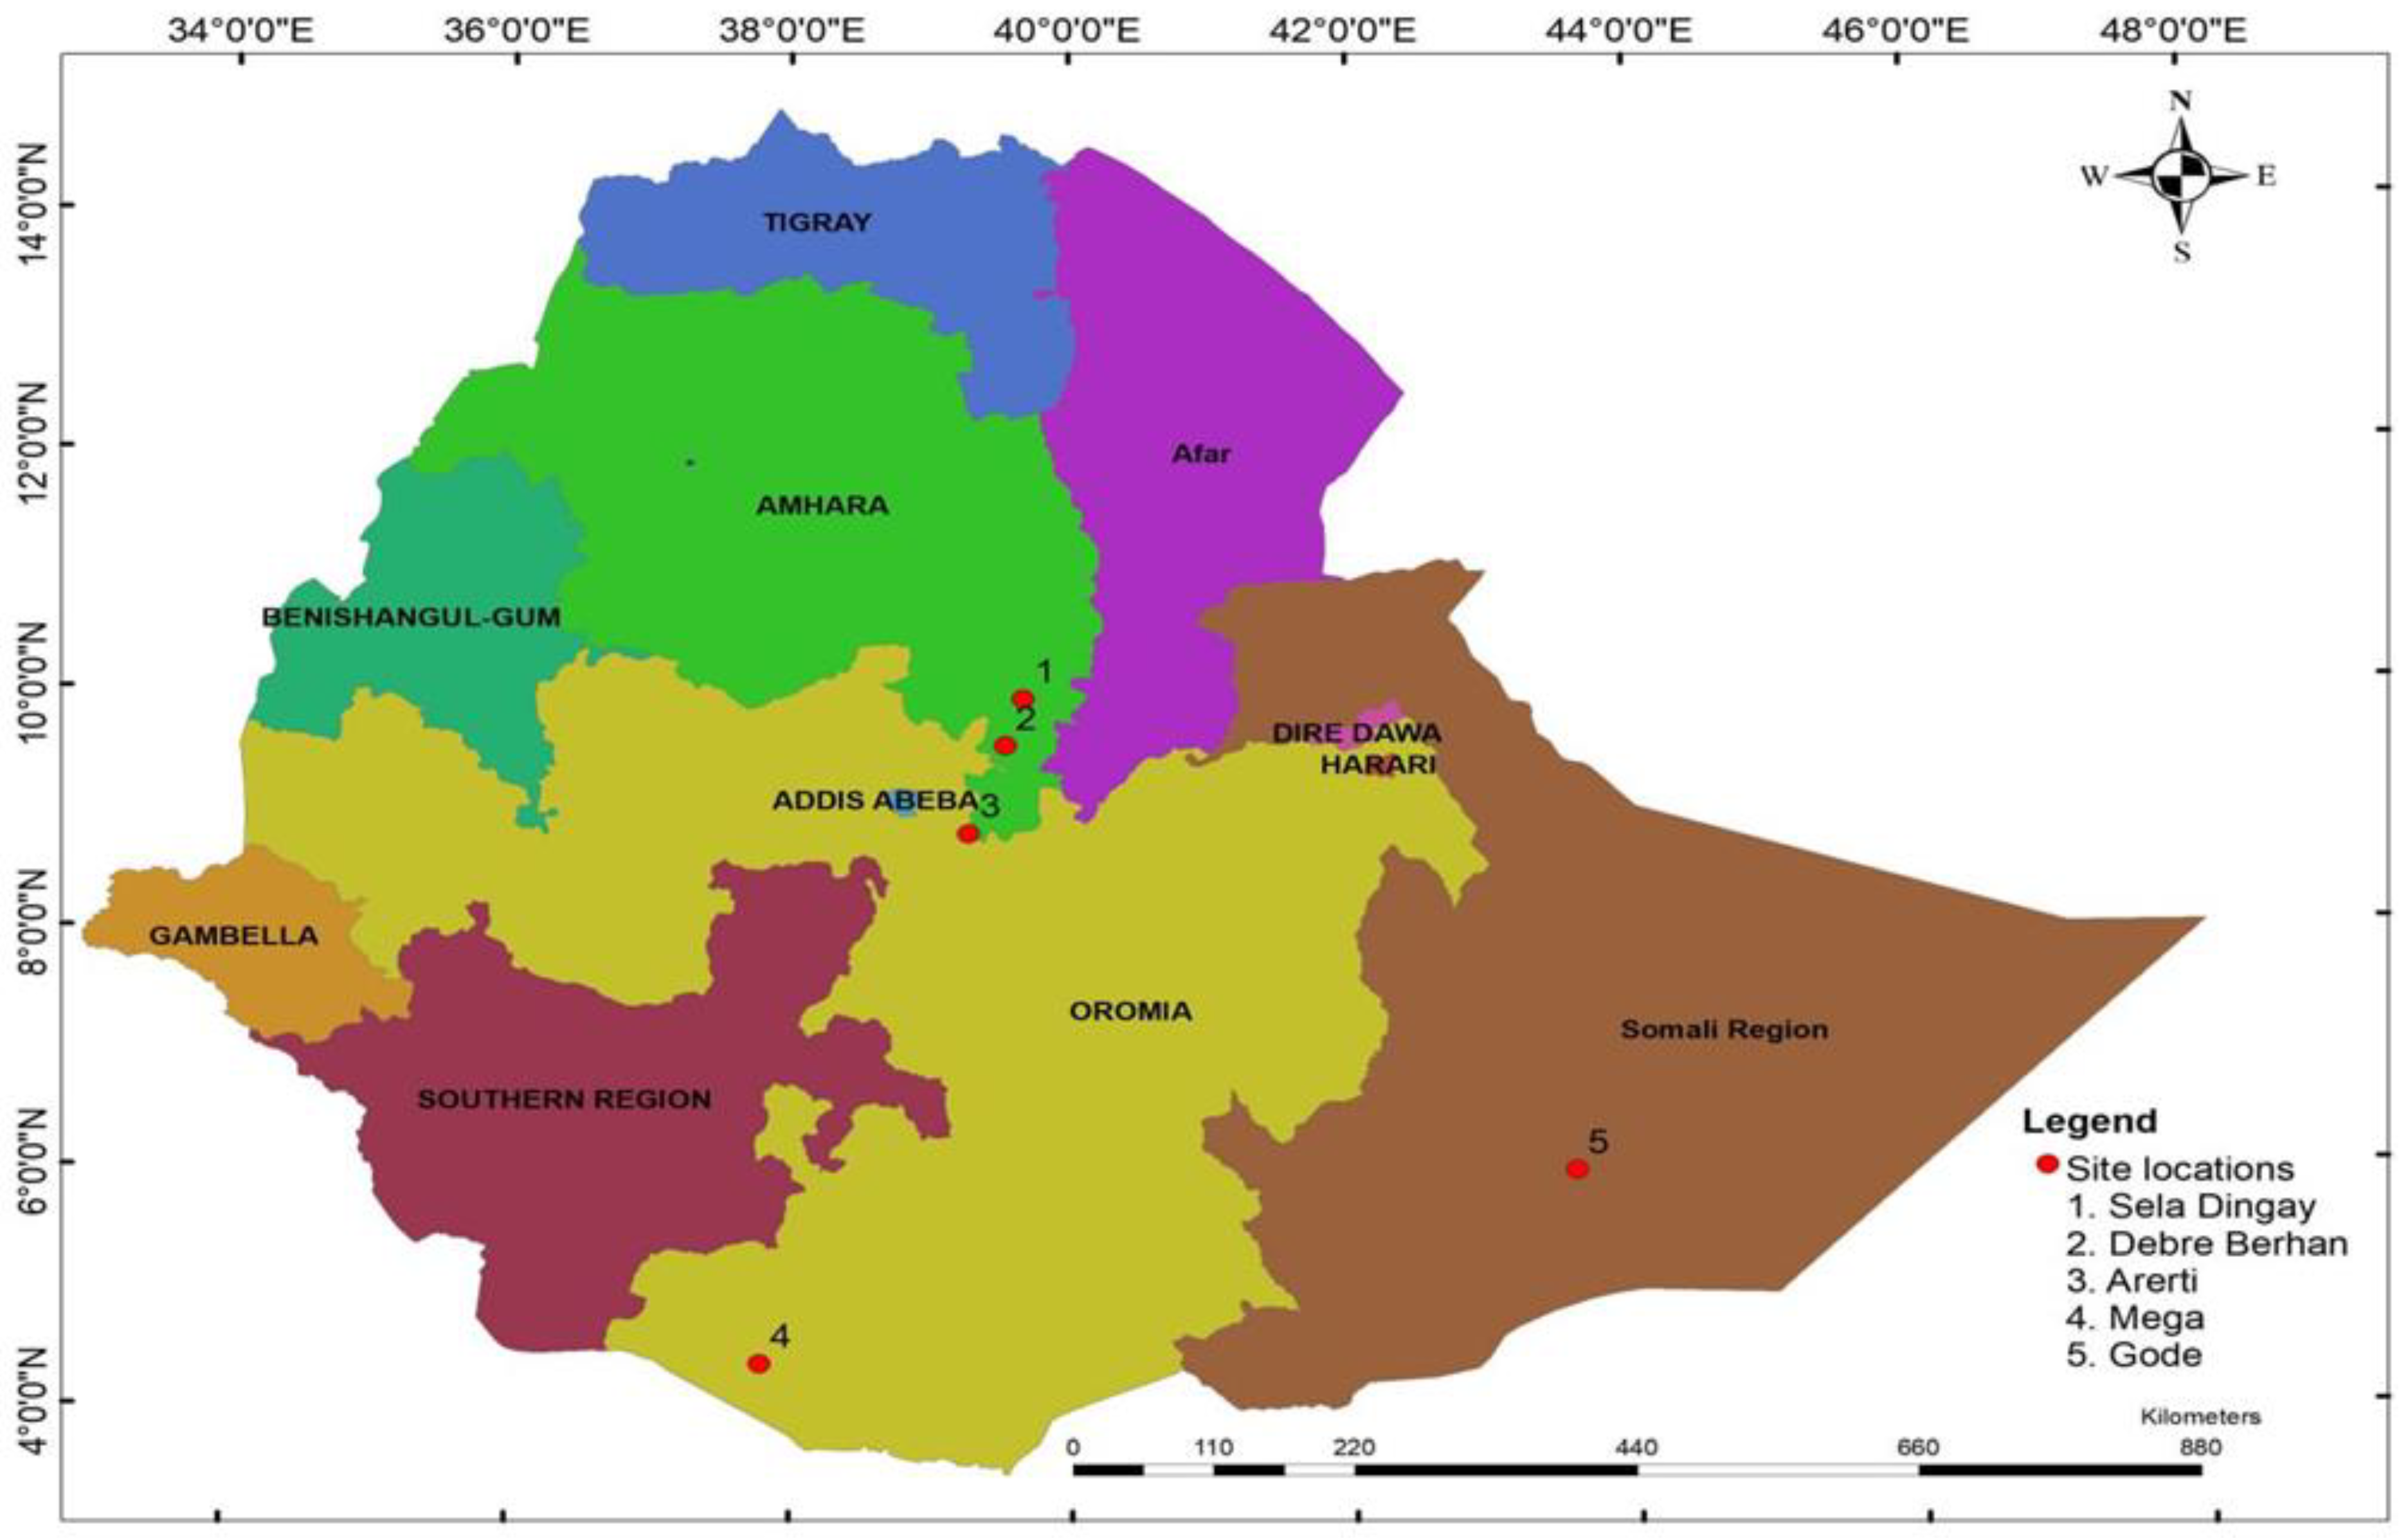
The research focuses on evaluating the wind energy potential across five strategic Ethiopian locations: Arerti, Debre Berhan, Gode, Mega, and Sela Dingay. These sites, distributed across the Amhara, Somali and Oromia regions, were selected to explore viable alternatives for diversifying Ethiopia’s energy sector, which currently relies on hydropower for over 94% of its generation. The geographical distribution and locations of these sites are given in Table 1 and in Figure 1. To ensure a high level of geographical precision and long-term reliability, the study employs a triangulated data methodology integrating three distinct sources. Primary high-frequency ground-truth data were sourced from meteorological masts at heights of 20 m, 40 m, 60 m, 80 m, and 100 m for Debre Berhan, Gode, Mega, and Sela Dingay. Because the Arerti site lacked direct mast infrastructure, its wind profile was synthesized using the Global Wind Atlas (GWA) for high-resolution spatial screening and NASA’s POWER/MERRA-2 satellite database for long-term (30+ years) climatological trends. This hybrid approach allows for the reconciliation of satellite model “smoothing effects” with high-fidelity ground observations, using NASA datasets to validate seasonal cycles and fill temporal gaps in shorter-term records.
Table 1.
Case study areas information.
Figure 1.
Geographic location of the five wind resource assessment sites in Ethiopia.
Data processing and analysis were implemented through a dual-software approach to maximize efficiency: MATLAB R2024a was utilized for core numerical modeling, vertical wind profile extrapolations, and the generation of Weibull probability density functions and wind roses, while Python 3.13 was employed for data organization and cross-validation of results. Python was employed for estimating the Weibull shape (k) and scale parameter (c) using the maximum likelihood estimation (MLE) method. The MLE procedure was implemented using the weibull_min.fit function available in the SciPy statistical library. Prior to parameter estimation, wind speed datasets were cleaned and organized using Pandas, while NumPy was utilized for numerical computations.
To standardize comparisons across different measurement elevations, all wind speeds were extrapolated to a uniform 100 m utility-scale hub height using the Hellman Power Law. A shear exponent (α) of 0.18 was adopted as a representative value for the semi-open, moderate-roughness terrains characteristic of the study sites. The technical viability of each site was assessed through the Weibull Statistical Model, deriving the shape (k) and scale (c) parameters to characterize wind stability and magnitude. These parameters facilitated the calculation of wind power density (WPD) and the simulation of a 3 MW utility-scale wind turbine (featuring a 3 m/s cut-in speed and 11 m/s rated speed). The final engineering verdict was established by calculating the capacity factor (CF) and net annual energy production. To ensure realistic estimates for grid integration, the methodology incorporates a conservative 20% aggregate loss factor, accounting for mechanical friction, wake effects, turbulence, electrical transmission resistance, and scheduled maintenance downtime. This comprehensive framework provides a rigorous technical assessment of each site’s suitability for commercial-scale power generation.
3. Data Analysis
The ground measurement data are taken at different heights (20 m, 40 m, 60 m, 80 m, and 100 m) whereas data for NASA is taken at a height of 50 m, and to get the wind speed value at a height of 80 m and 100 m in this study, an average value of the friction coefficient α between 0.1 and 0.25, which is 0.18, has been used in the calculation [36]. The friction coefficients of various land cover types are given in Table 2 [42]. The most commonly used of these simpler expressions is the Hellmann exponential law that correlates the wind speed readings at two different heights and is expressed by
in which v is the speed to the height H, v0 is the speed to the height H0 and α is the friction coefficient or Hellman exponent [42].
Table 2.
Friction coefficient for a variety of landscape [42].
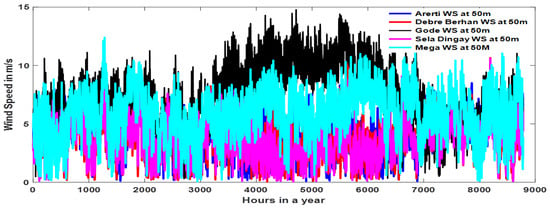
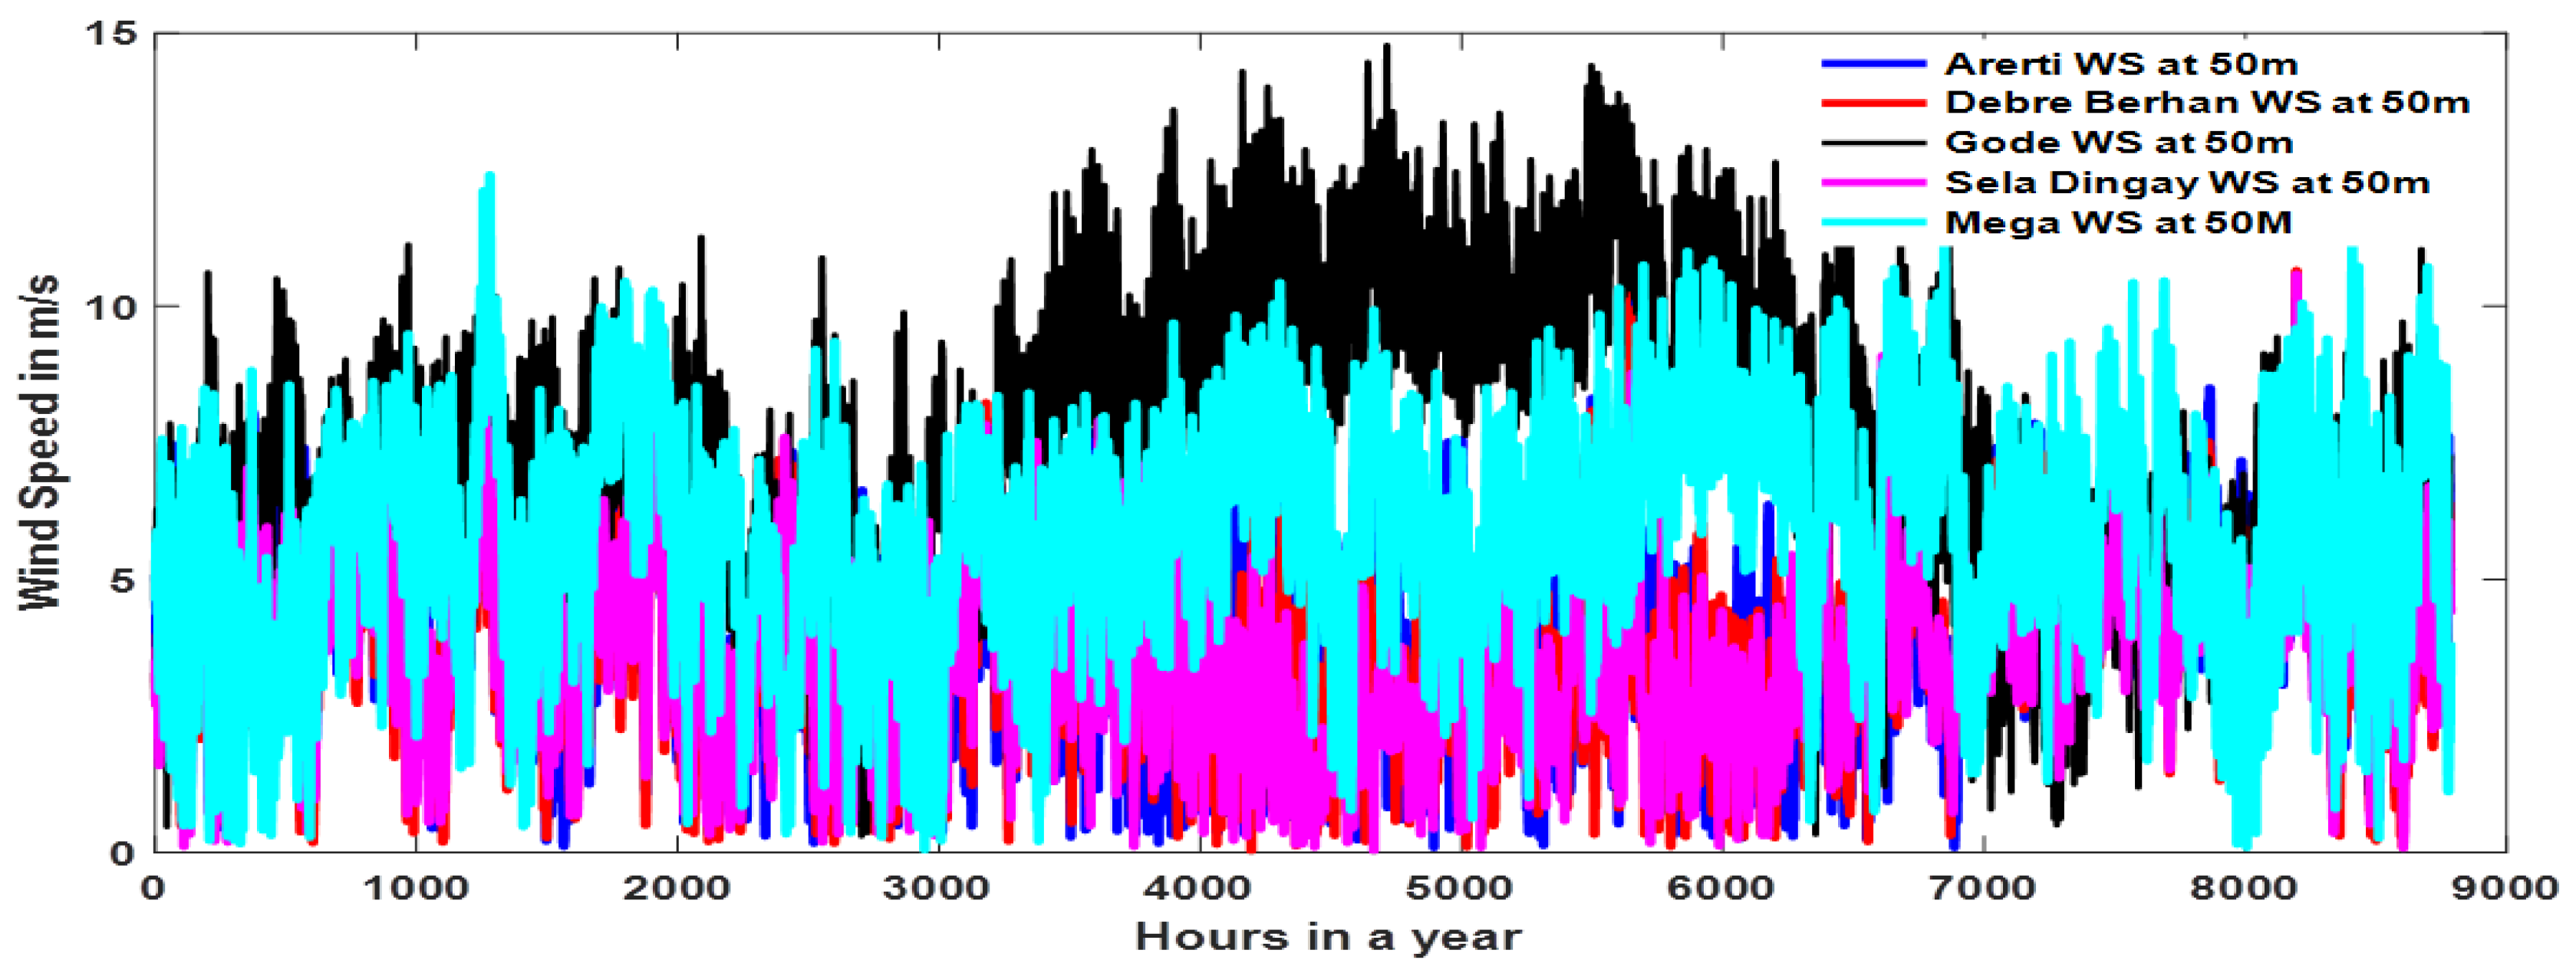
From the one-year hourly wind speed data comparison obtained from NASA of Figure 2, the proposed study area, Gode, has the highest mean wind speed compared to other locations, including Mega, Arerti, Debre Berhan, and Sela Dingay. This analysis reflects seasonal variations in wind speed throughout the year and involves a comparison of wind speeds across these multiple locations.
Figure 2.
Hourly mean wind speed variation in the case study areas throughout the year.
3.1. Comparison NASA and Mast Data
Among the proposed five study sites, all four sites except Arerti have mast data as part of direct measurements installed from 17 wind masts in six regions of Ethiopia, with measurements taken at heights of 20 m, 40 m, 60 m, 80 m, and 100 m. The installation periods of these masts differ, and as a result, the measured data collection readings may be compared hourly, monthly, or yearly, depending on the availability of the existing mast data. Since there is no mast installed in Arerti, the researchers in this study considered the Global Wind Atlas for Arerti for comparison. For all the other case study areas, NASA, mast, and Global Wind Atlas data are considered for comparison.
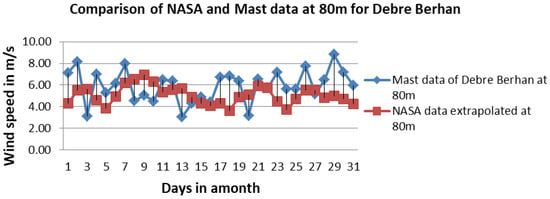
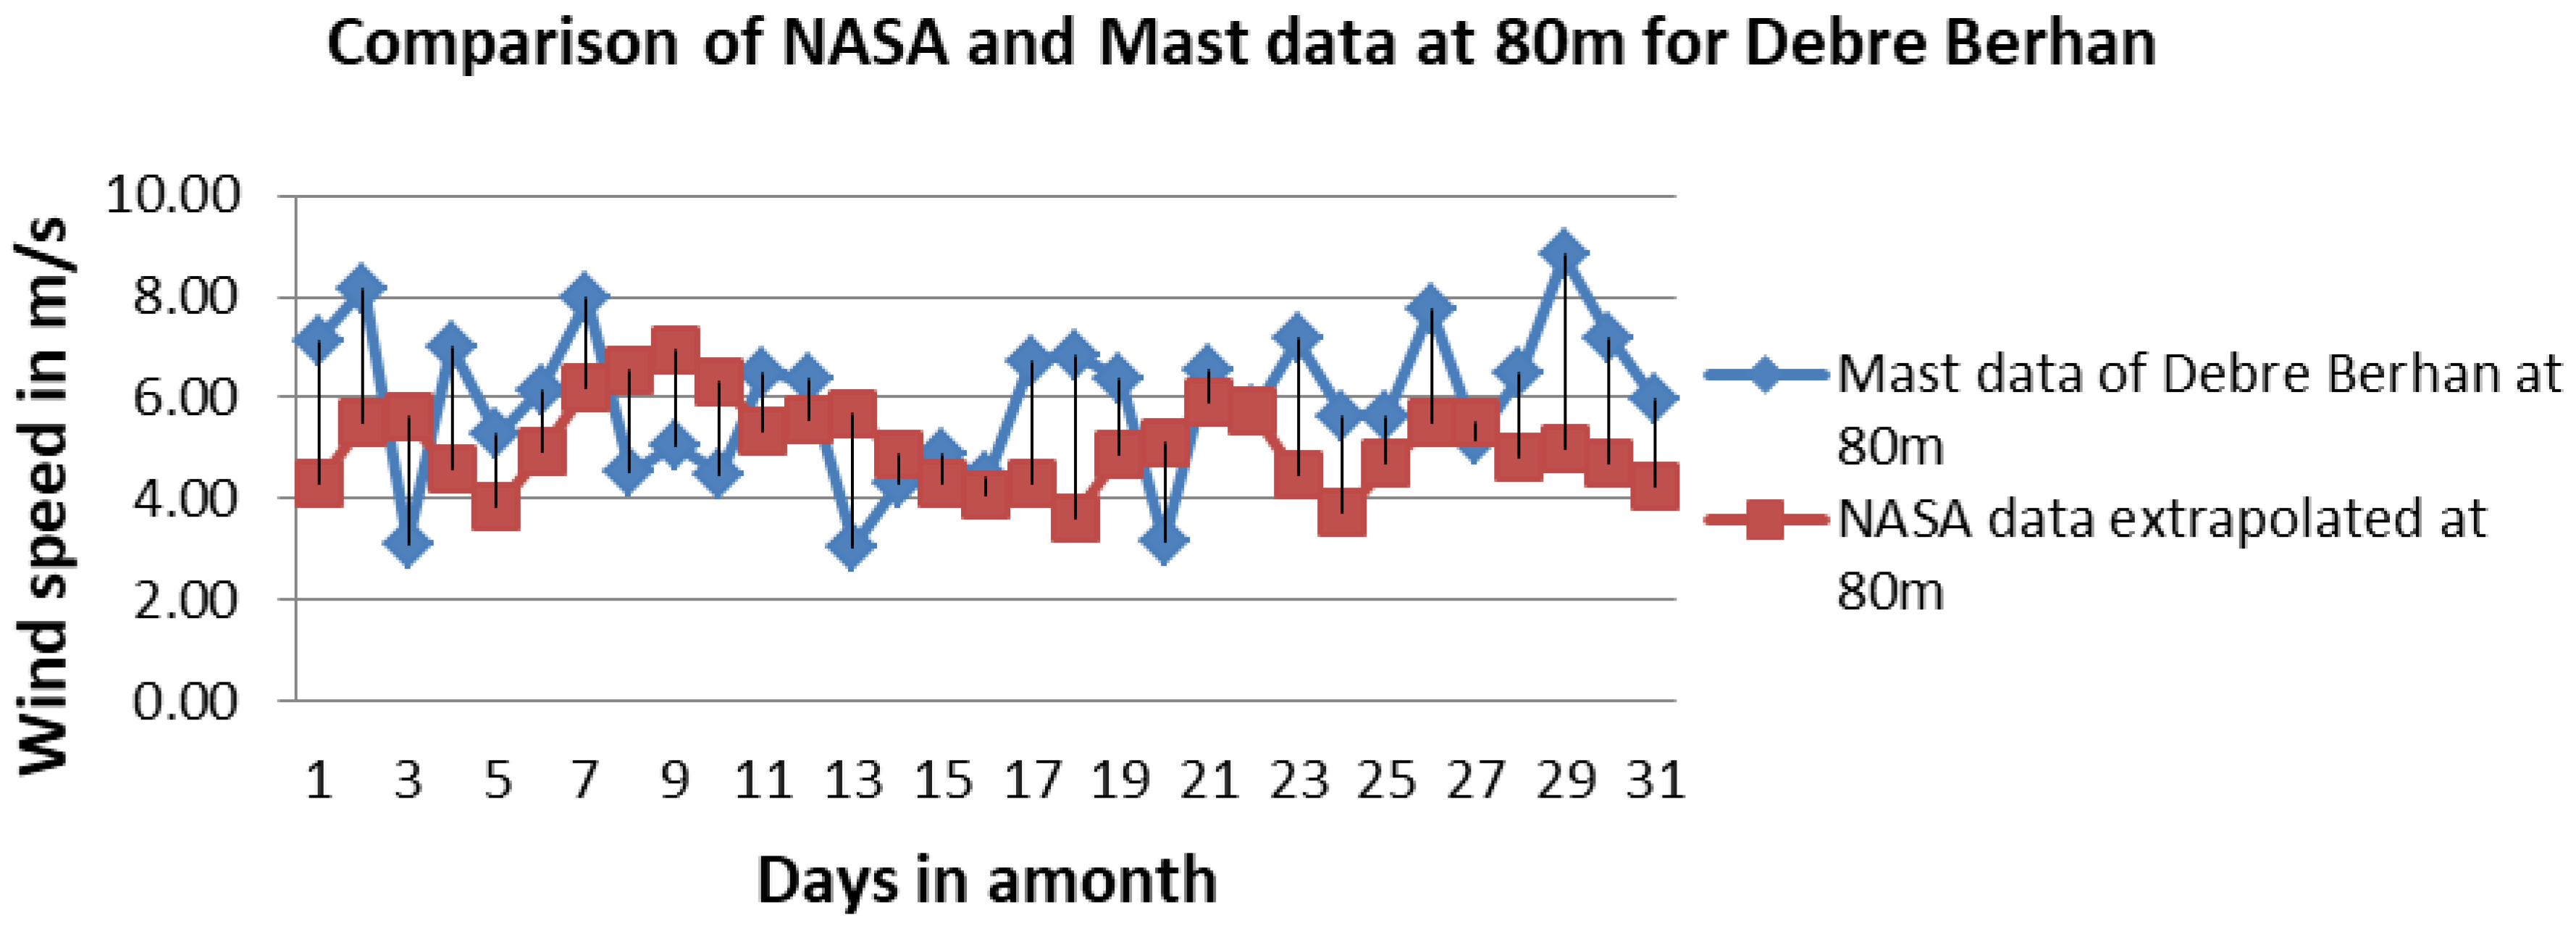
The measurement data in (blue line) in Figure 3 above shows higher variability across days than NASA data with wind speed varying from 3.0 m/s to 9.0 m/s whereas wind speeds vary between 4.0 m/s and 6.5 m/s for NASA. The met-mast data reflects wind speed measurements at a specific site and therefore captures the actual local wind behavior, including short-term increases and decreases observed on a daily basis. By contrast, the NASA wind data represents spatially averaged conditions over a large grid area, which smooths out local extremes. As a result, the NASA dataset shows a smoother wind speed pattern and generally underrepresents the short-term variability seen in the mast measurements
Figure 3.
Comparison of NASA data and on-site mast measurements for Debre Berhan (December 2020).
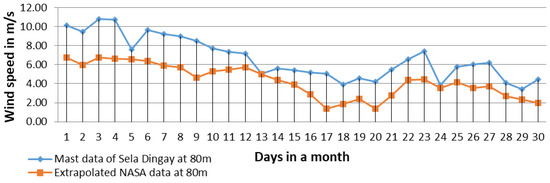
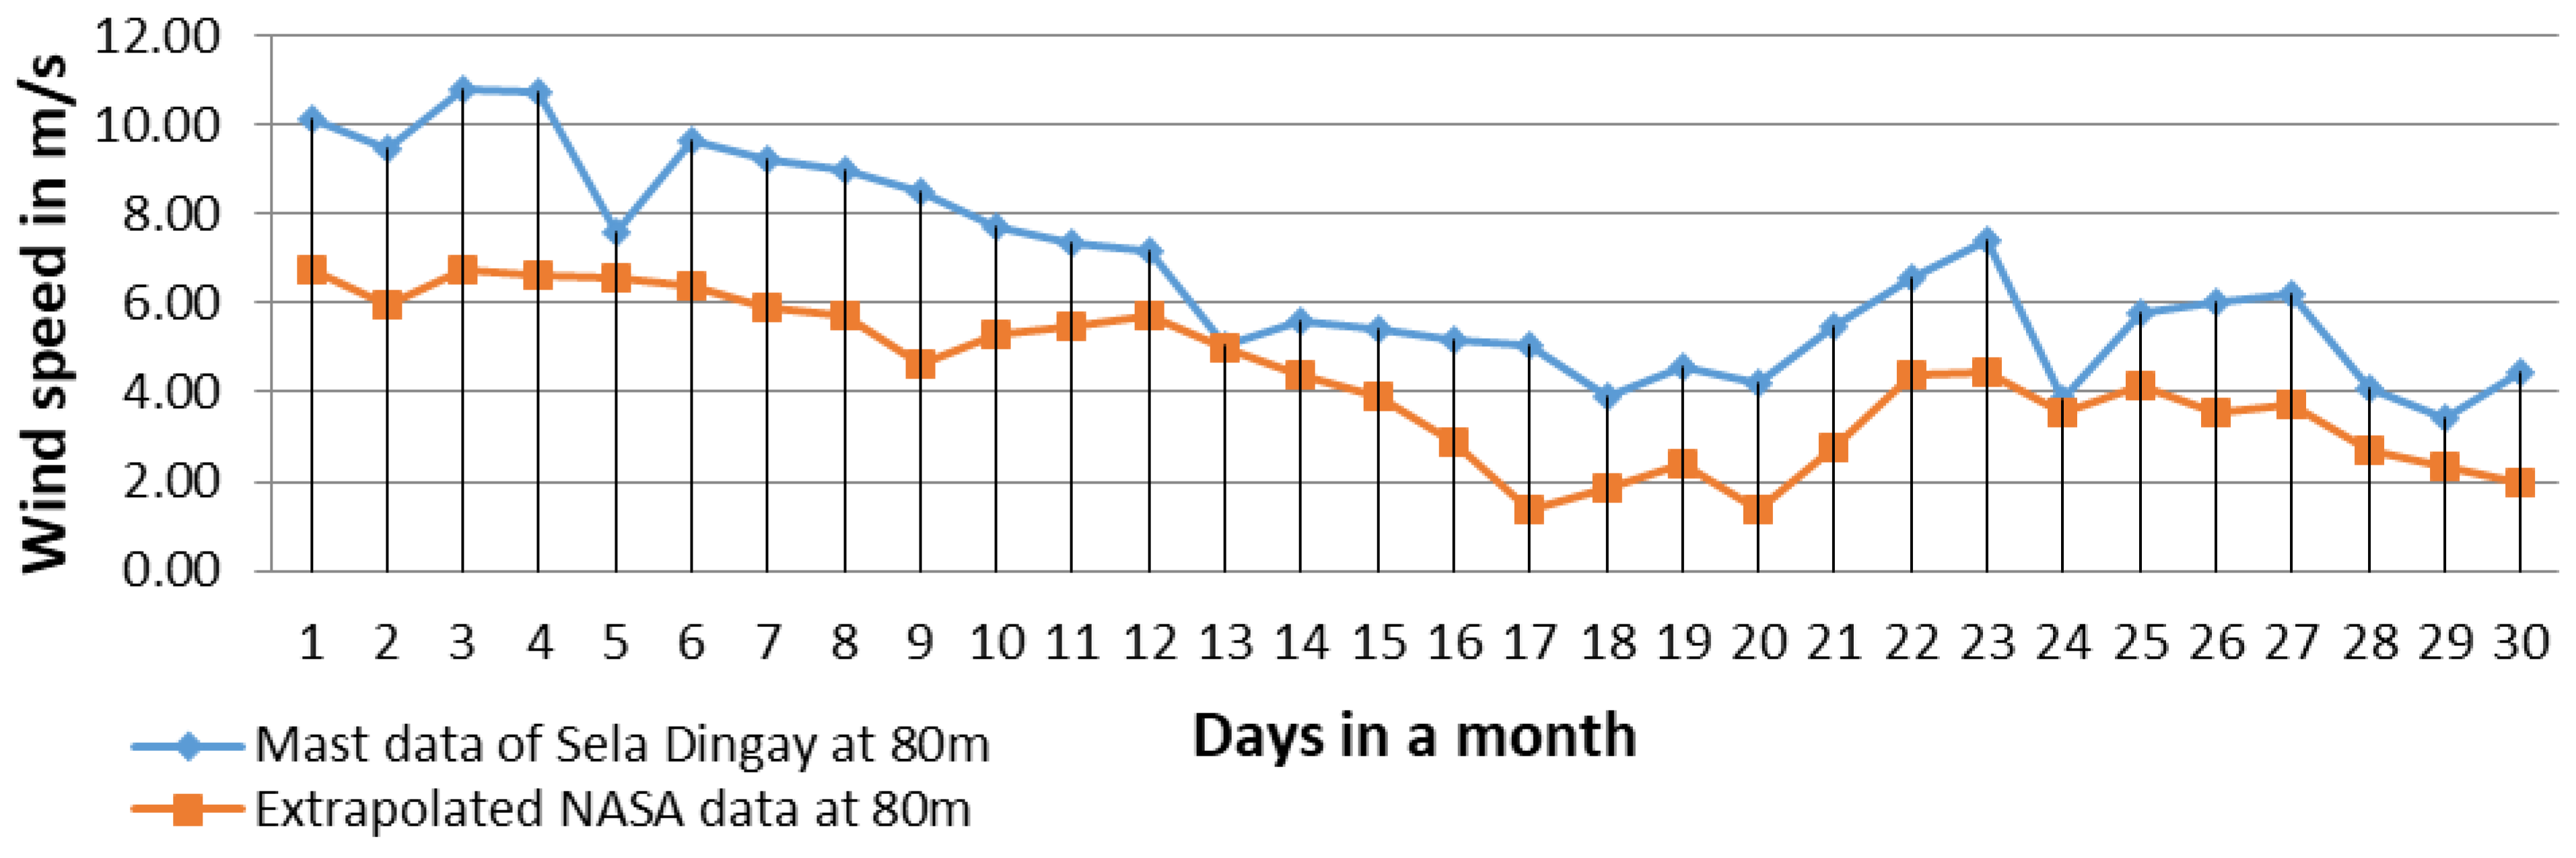
Mast data shows a gradual decline from high wind speeds about 10 m/s at the beginning of the month to a lower value of about 4 m/s towards the end. NASA data is significantly lower and smoother than mast data and this comparison is clearly shown in Figure 4.
Figure 4.
Comparison of NASA and mast-measured wind speeds for Sela Dingay (April 2020).
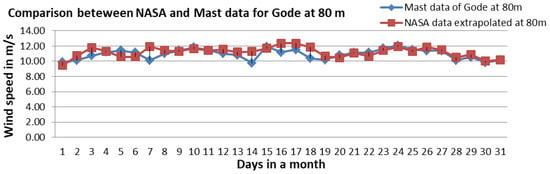
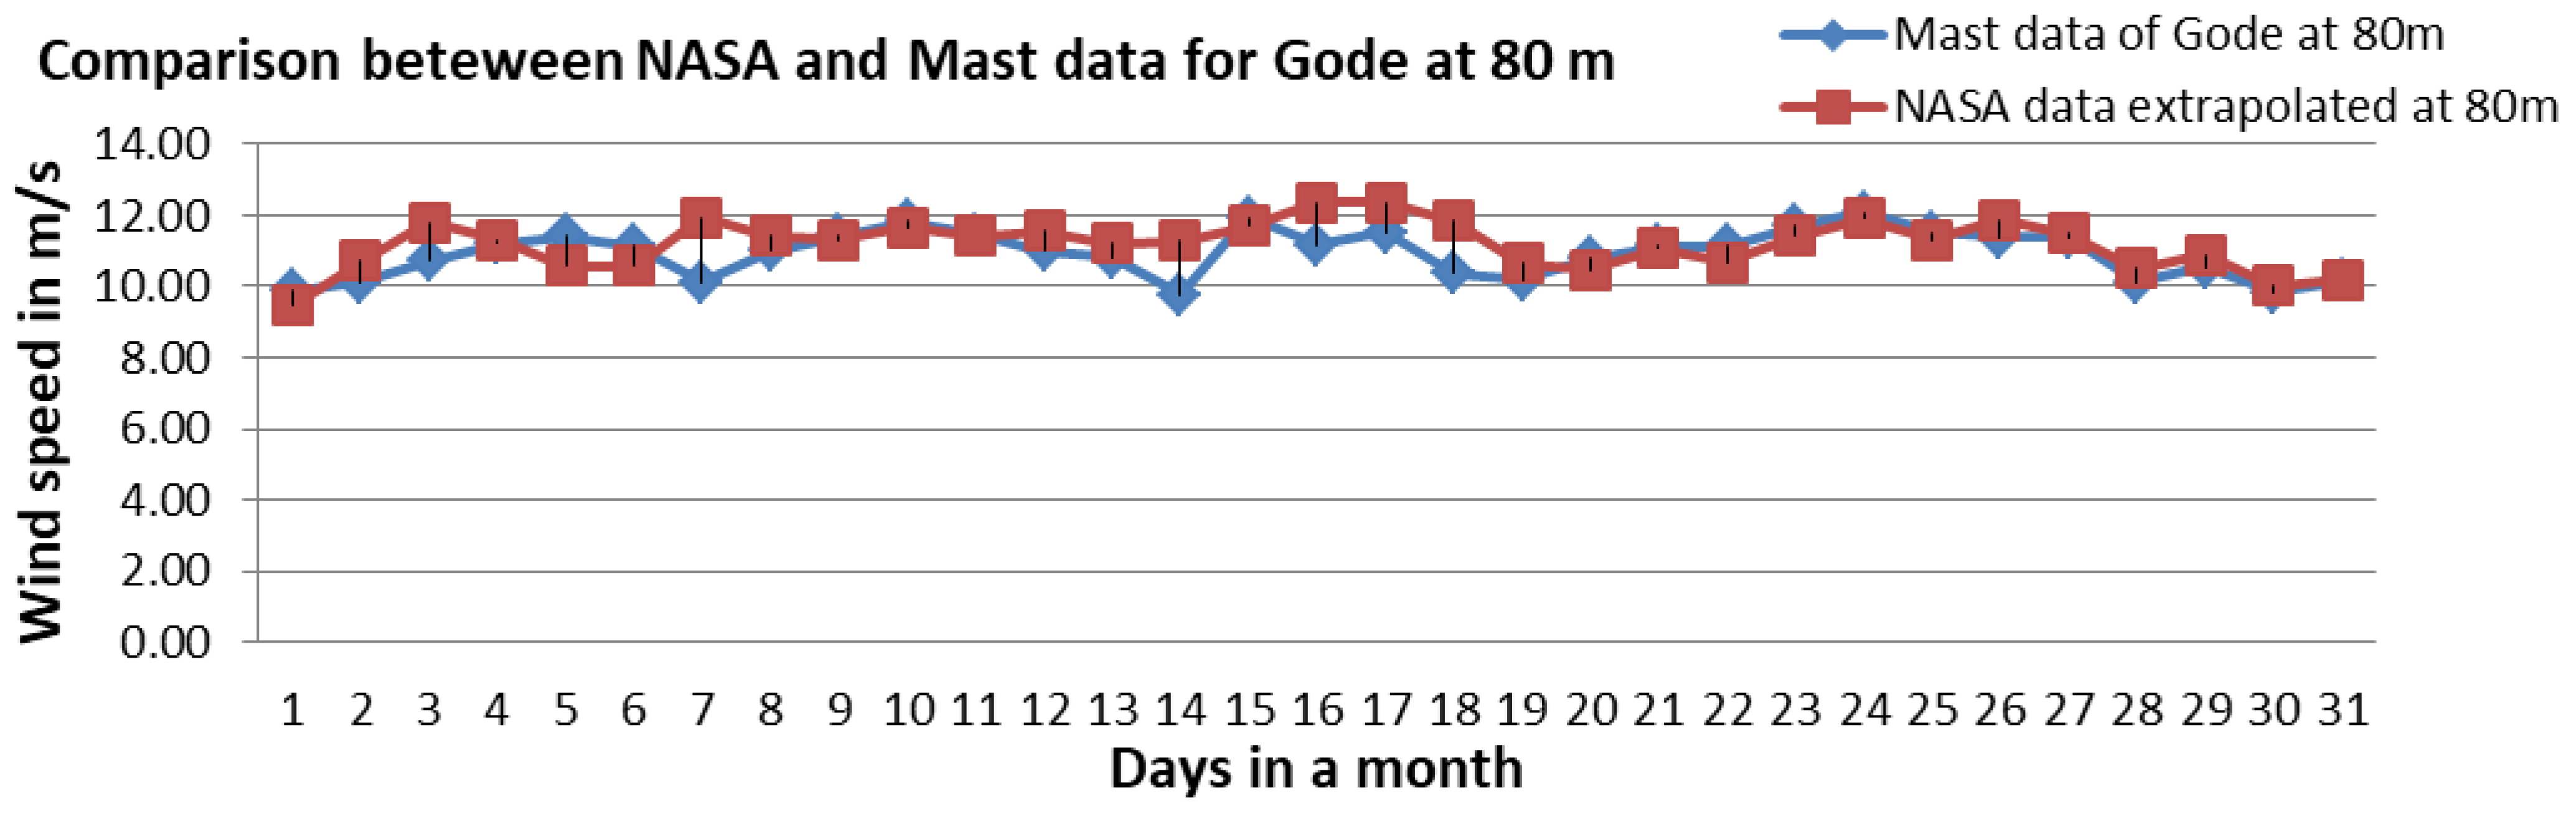
Both mast and NASA data in Figure 5 show similar trends in windspeed fluctuations. Most of the time the wind speed is above 10 m/s for both. In general, the NASA extrapolated data closely matches the mast data.
Figure 5.
Comparison of NASA and mast-measured wind speeds for Gode (August 2019).
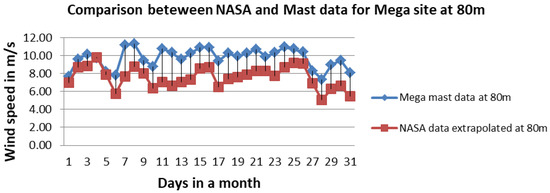
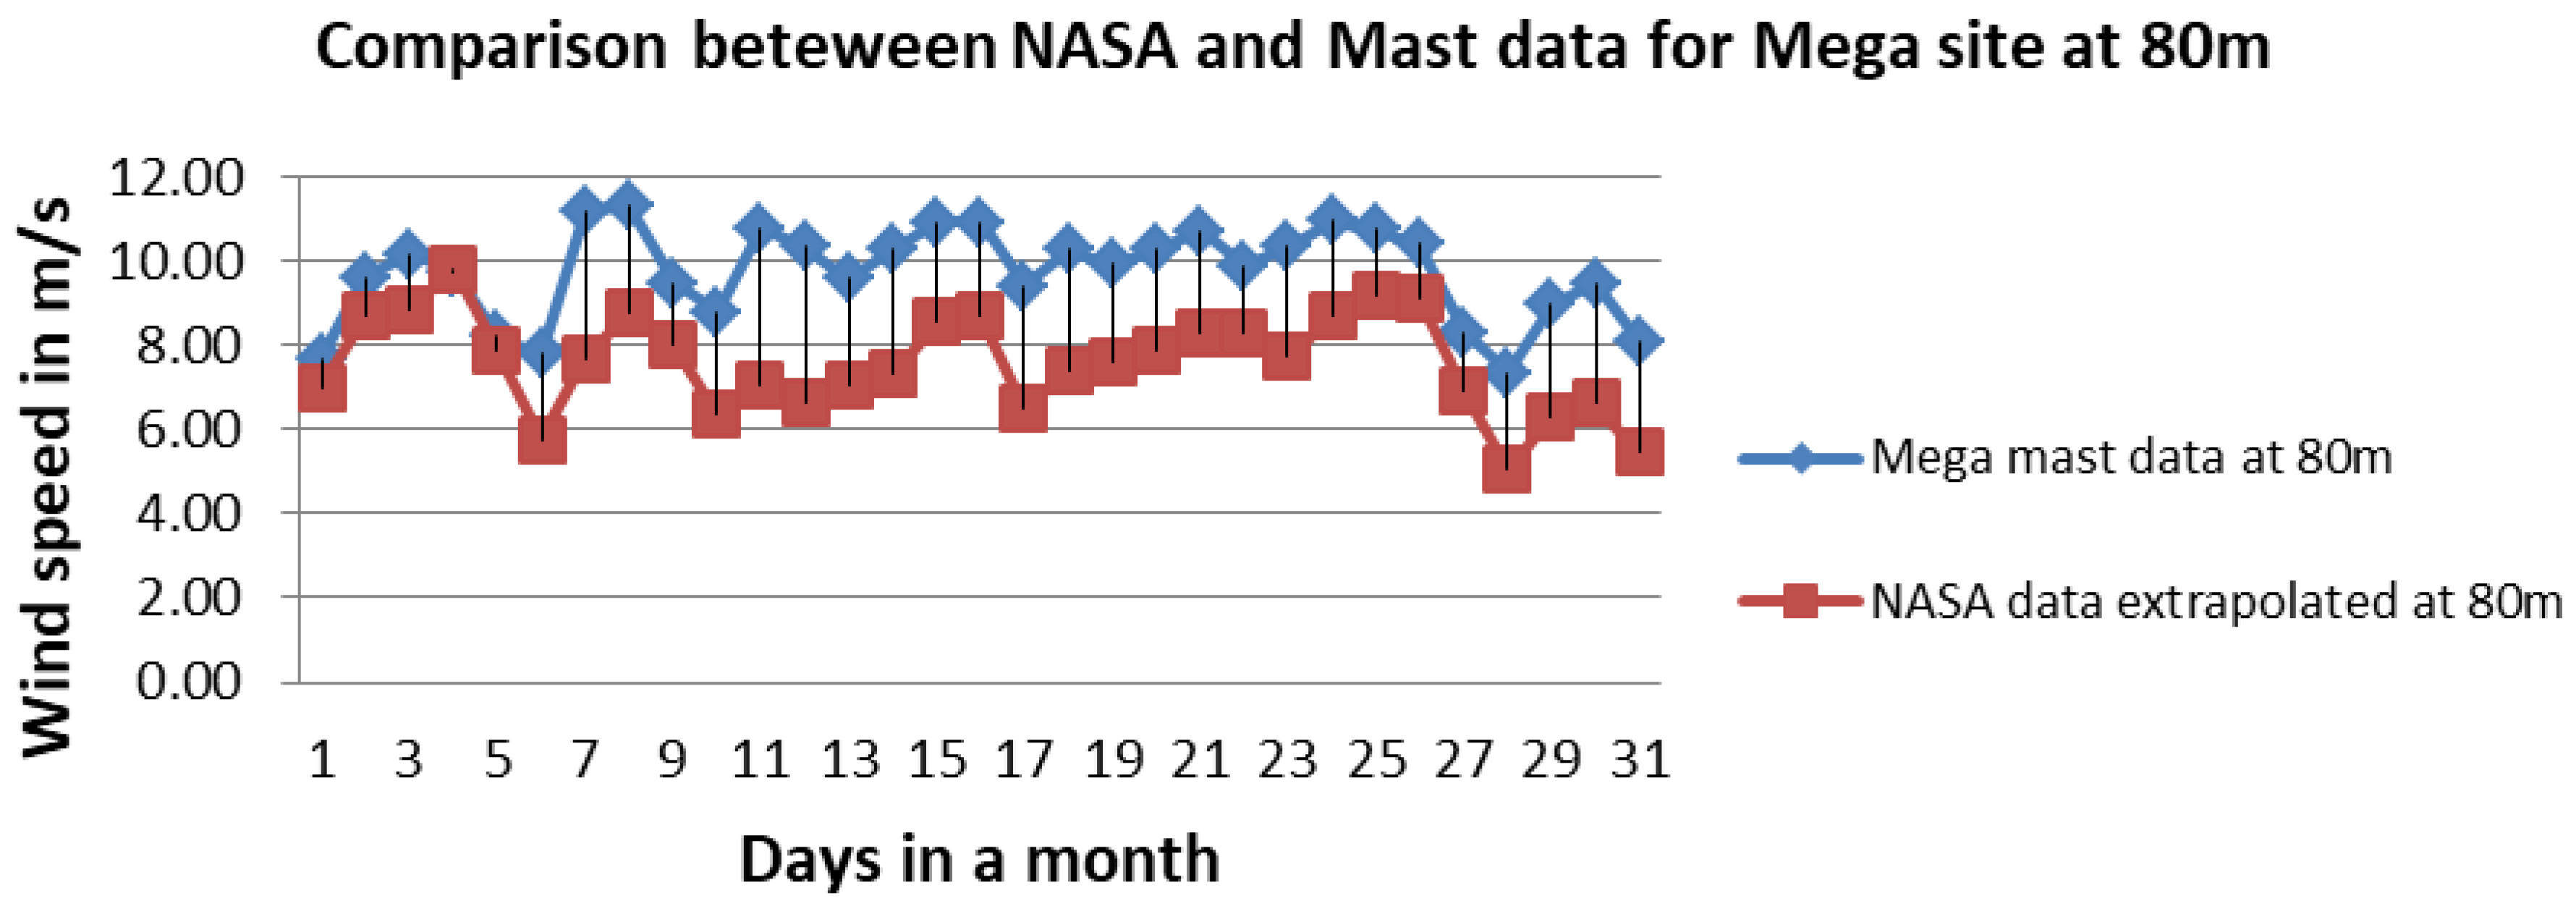
In the Figure 6 Mega mast data varies from 7.8 m/s to 11.6 m/s, whereas NASA wind speed data for Mega varies from 4.6 m/s to 10 m/s. However, both datasets from NASA and mast data are following the same flowing pattern.
Figure 6.
Comparison of NASA and mast data for Mega for August 2019.
3.2. Wind Power Density Analysis
The amount of wind power available per unit area is typically expressed in watts per square meter (W/m2). From reference [20] of the wind resource assessment handbook which is given in Table 3, grid cells designated as Class 4 or greater are generally considered to be suitable for most wind turbine applications. Class 3 areas are suitable for wind energy development using tall (e.g., 50 m hub height) turbines. Class 2 areas are marginal and Class 1 areas are unsuitable for wind energy development. Areas designated as Class 3 or greater are suitable for most wind turbine applications, whereas Class 2 areas are marginal. Class 1 areas are generally not suitable.
Table 3.
Classification of wind power density.
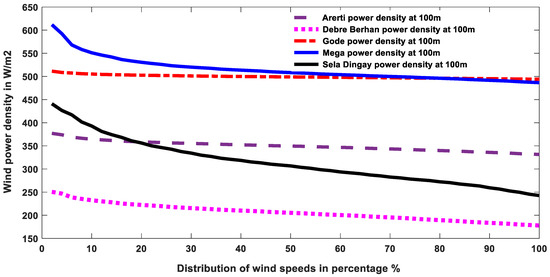
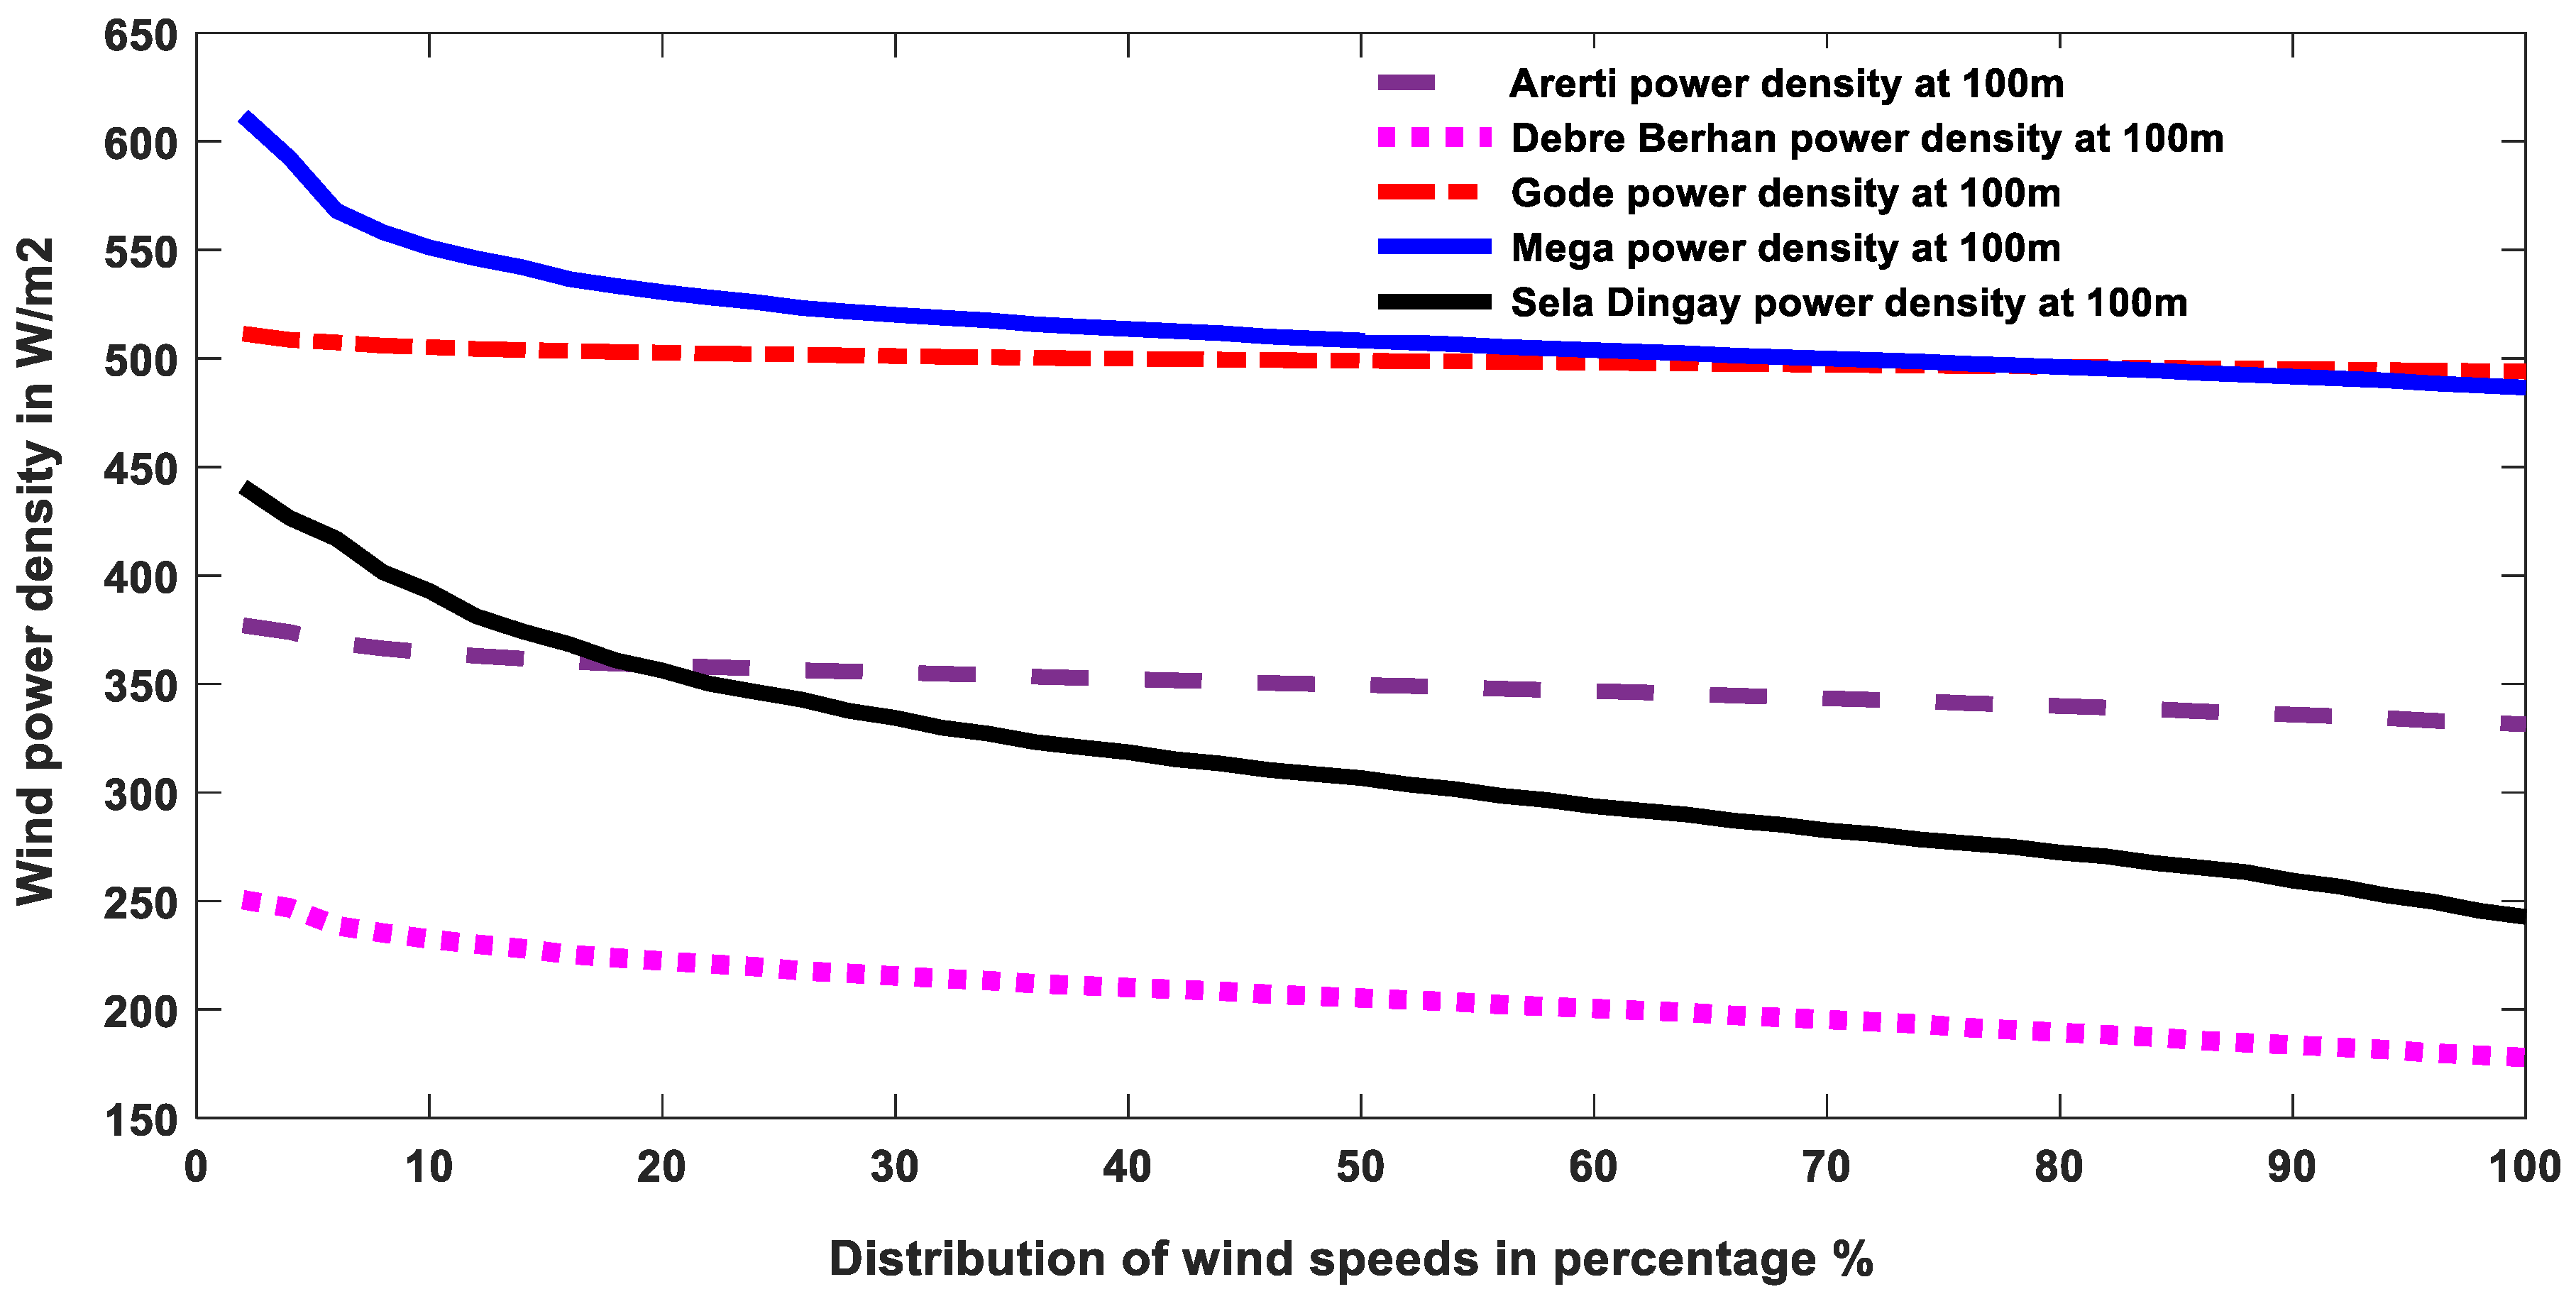
In Figure 7, the Y-axis represents wind power density (W/m2), which indicates the amount of available wind energy at a height of 100 m. The X-axis shows the distribution of wind speeds in percentiles (%), illustrating how wind power density varies across different wind conditions. Each percentile corresponds to the percentage of time that wind speeds are less than or equal to a given value. As seen in the Figure, the left side of the curve like P10 corresponds to 10% of the time that the wind power density lowers some value of each site and 90% of the time that the wind power density is higher than that value. For the case of the Arerti site, the 10th percentile (P10) wind power density of 360 W/m2 indicates that 10% of the observations fall below this value, while 90% of the time, the wind power density exceeds 360 W/m2 and the middle region around the 50th percentile represents the median wind condition at each site.
Figure 7.
Wind power density comparison of the case study areas at 100 m hub height using GWA data.
Among the evaluated wind sites, Mega exhibits the highest wind power density overall, starting around 620 W/m2 and gradually decreasing. The graph indicates a strong and consistent wind resource, making it highly suitable for large-scale wind energy development. Gode presents the flattest and most uniform curve, maintaining a consistent wind power density of around 500 W/m2; the high stability of Gode’s wind resource makes it a strong candidate for wind power development. Debre Berhan, on the other hand, shows lower wind power density, starting near 260 W/m2 and decreasing to around 200 W/m2, indicating less favorable conditions for wind energy generation. Finally, the Arerti site demonstrates moderate wind performance, with values ranging from 380 W/m2 down to 340 W/m2. Its relatively flat curve indicates stable and consistent wind conditions.
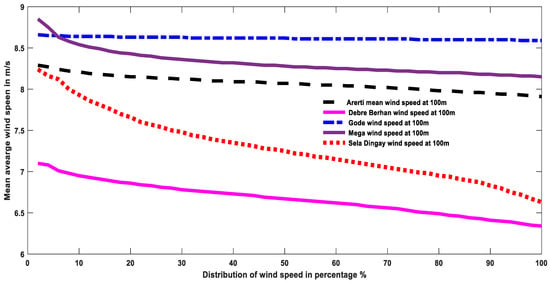
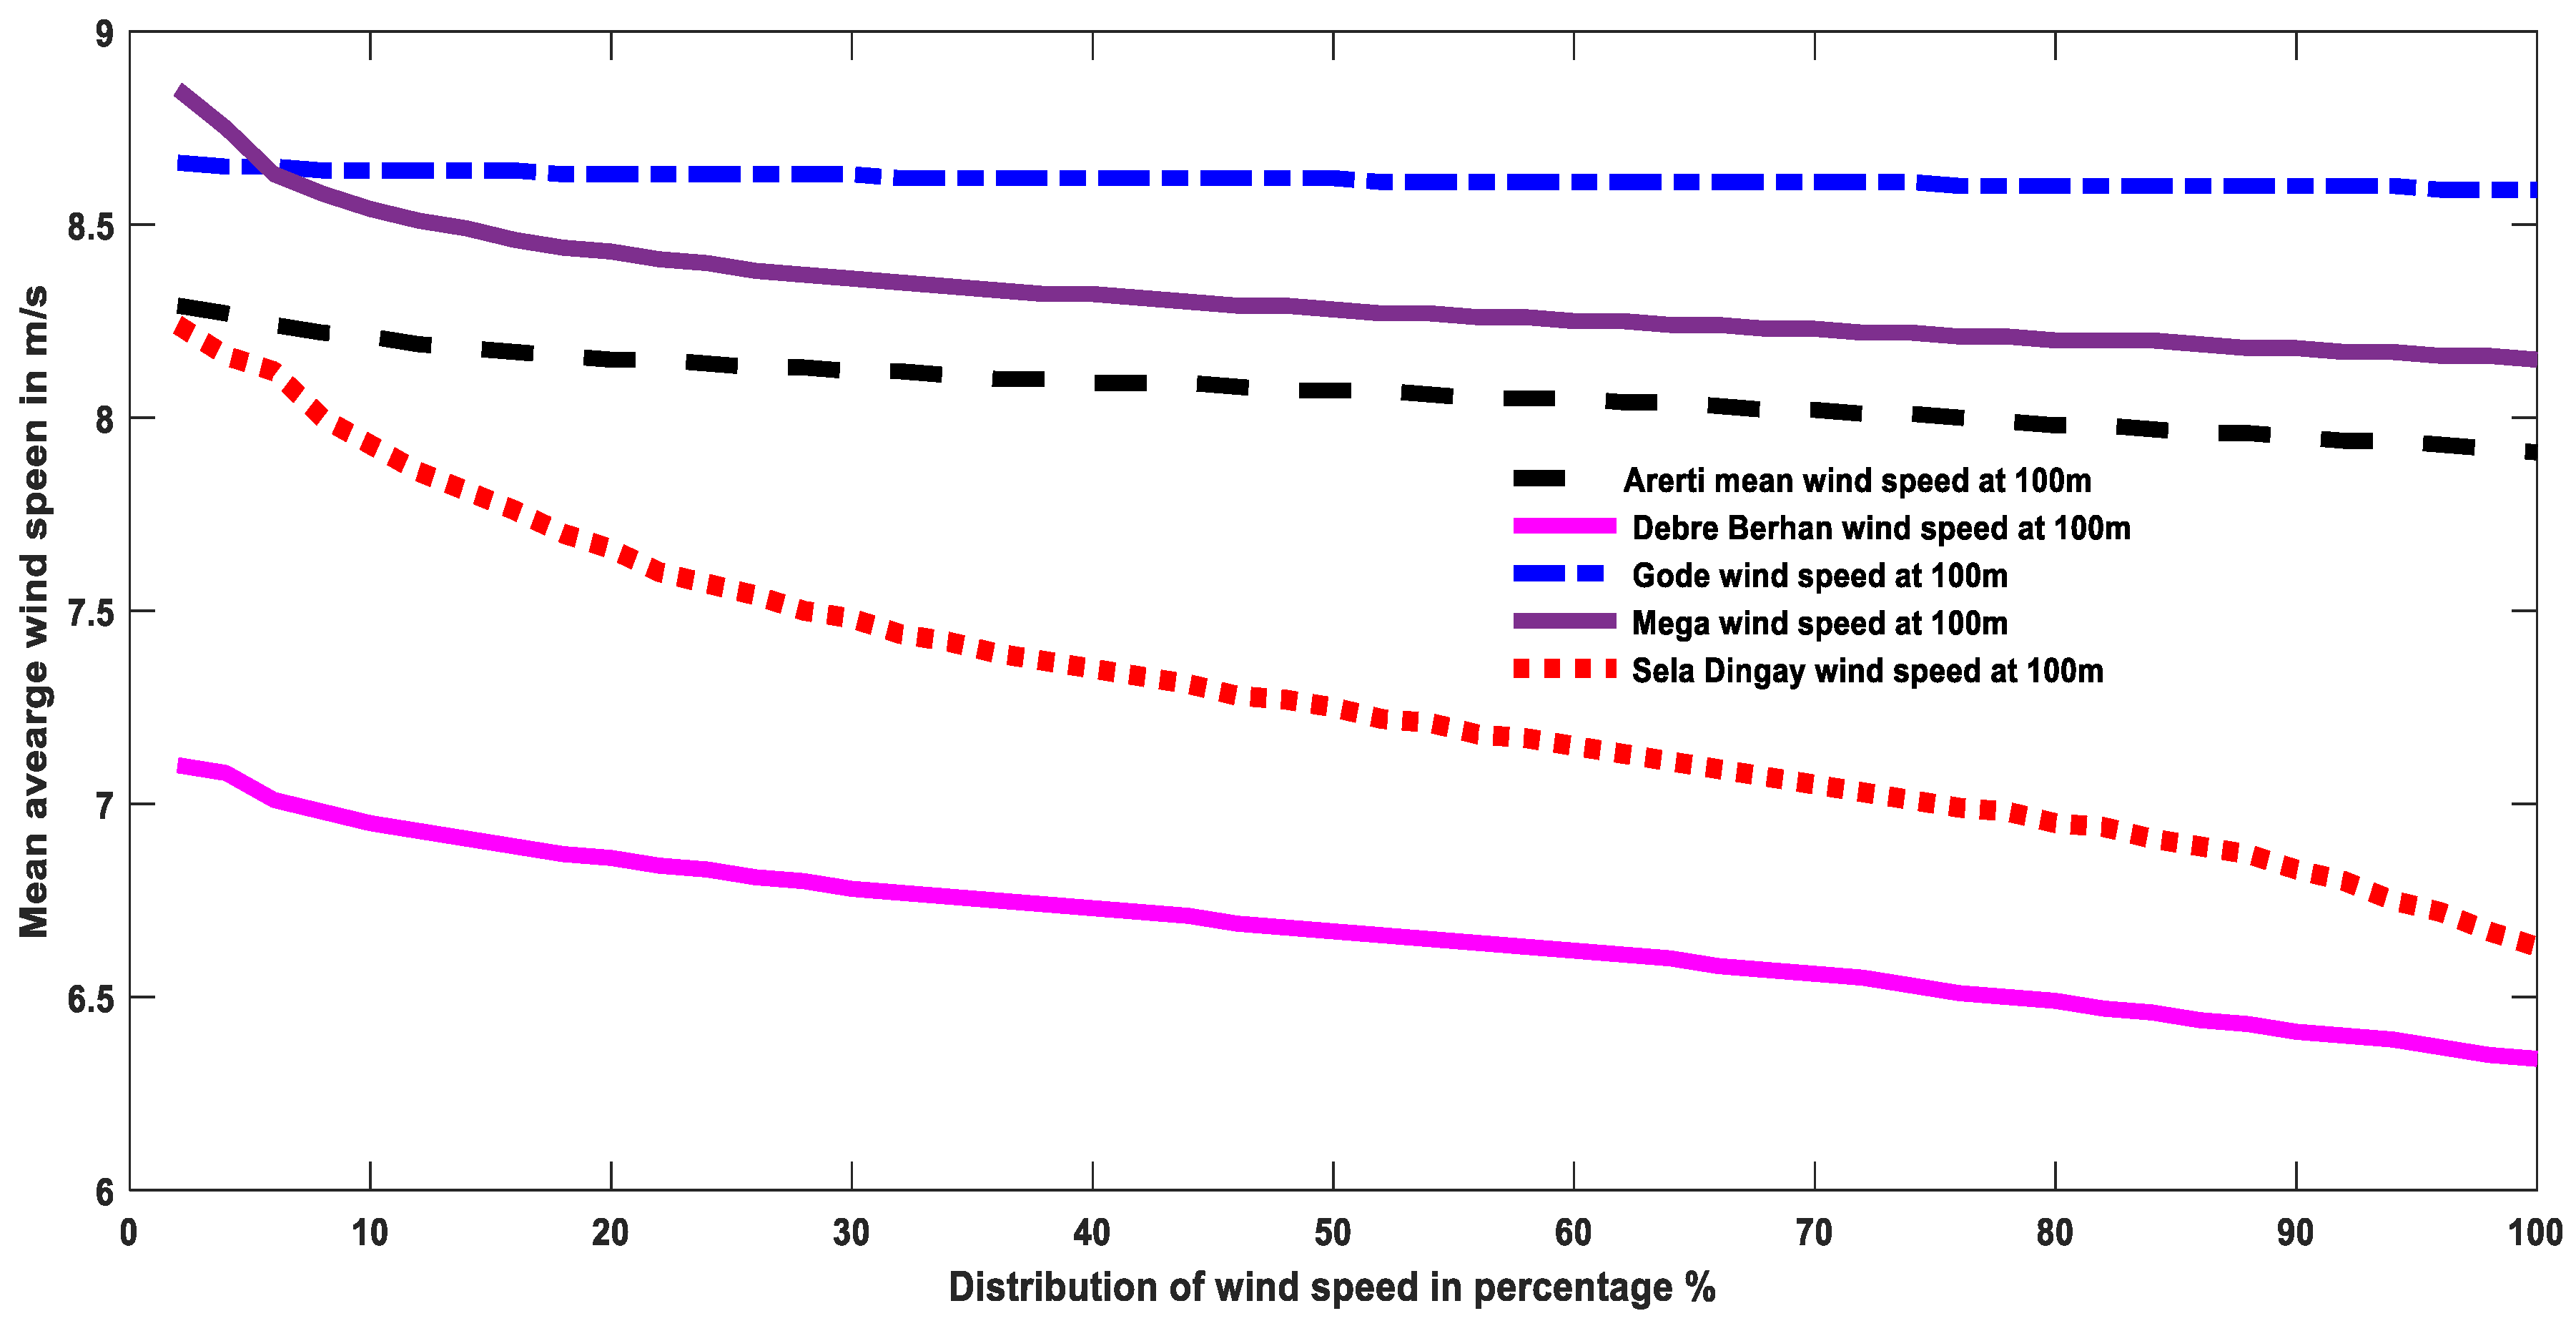
Figure 8 shows the mean average wind speed comparison of the five study areas, in which Gode and Arerti are more stable and consistent, while Mega gradually achieved consistency and stability, beginning from the highest average wind speed reading. Sela Dingay falls from 8.3 m/s to 7.2 m/s, and among the others, Debre Berhan has a lower average wind speed reading of 7.1 m/s, which decreases to 6.1 m/s.
Figure 8.
Wind speed comparison of the case study areas at 100 m hub height using GWA data.
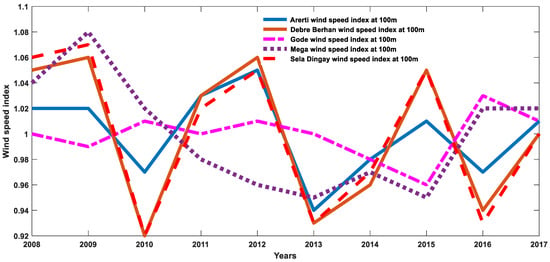
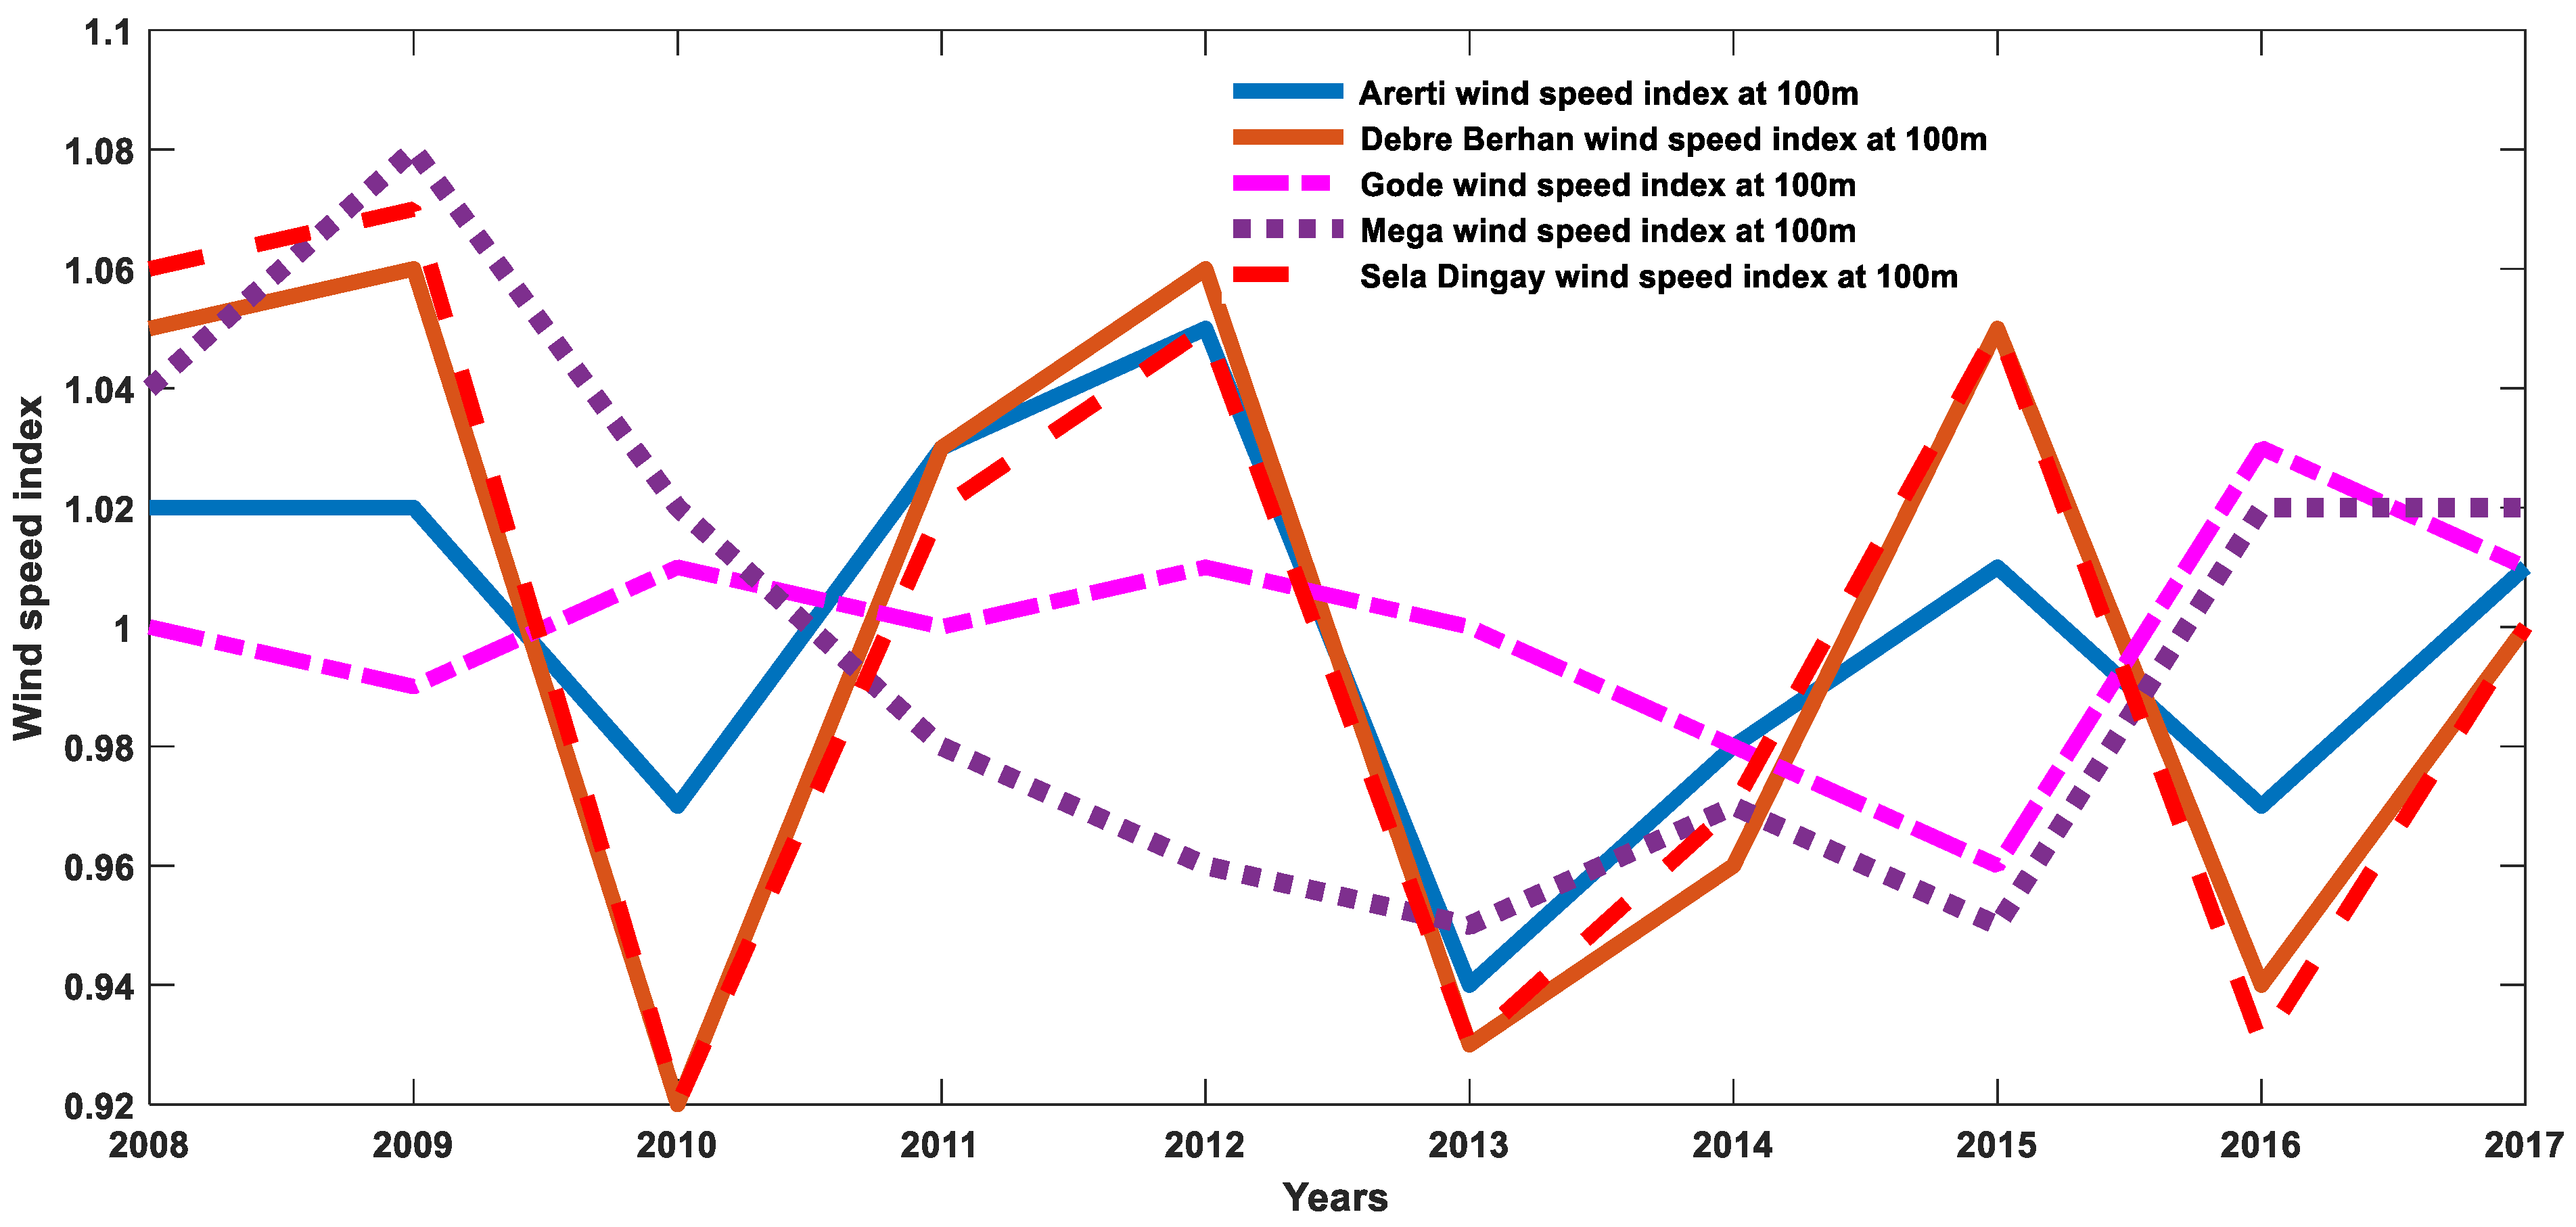
The Y-axis of the graph in Figure 9 shows the normalized value from the average value. It shows the variability of wind speed over the year for all sites. Most of the year, the sites experience a similar pattern and they also show divergence in some years. Debre Berhan’s high variability might indicate a less consistent wind resource, which could impact energy production. The graph indicates that the baseline is one and values above one indicate windspeed that is above average and windspeed below one shows low wind speed. The graph also indicates that the Gode site has less variability in the wind speed.
Figure 9.
Normalized wind speed index comparison of the case study areas at 100 m hub height using GWA data.
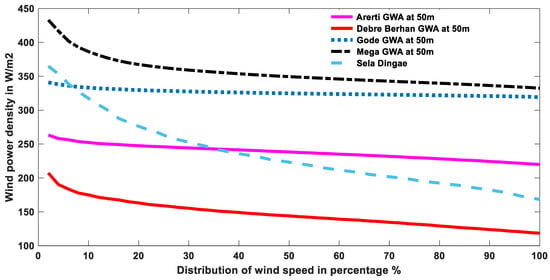
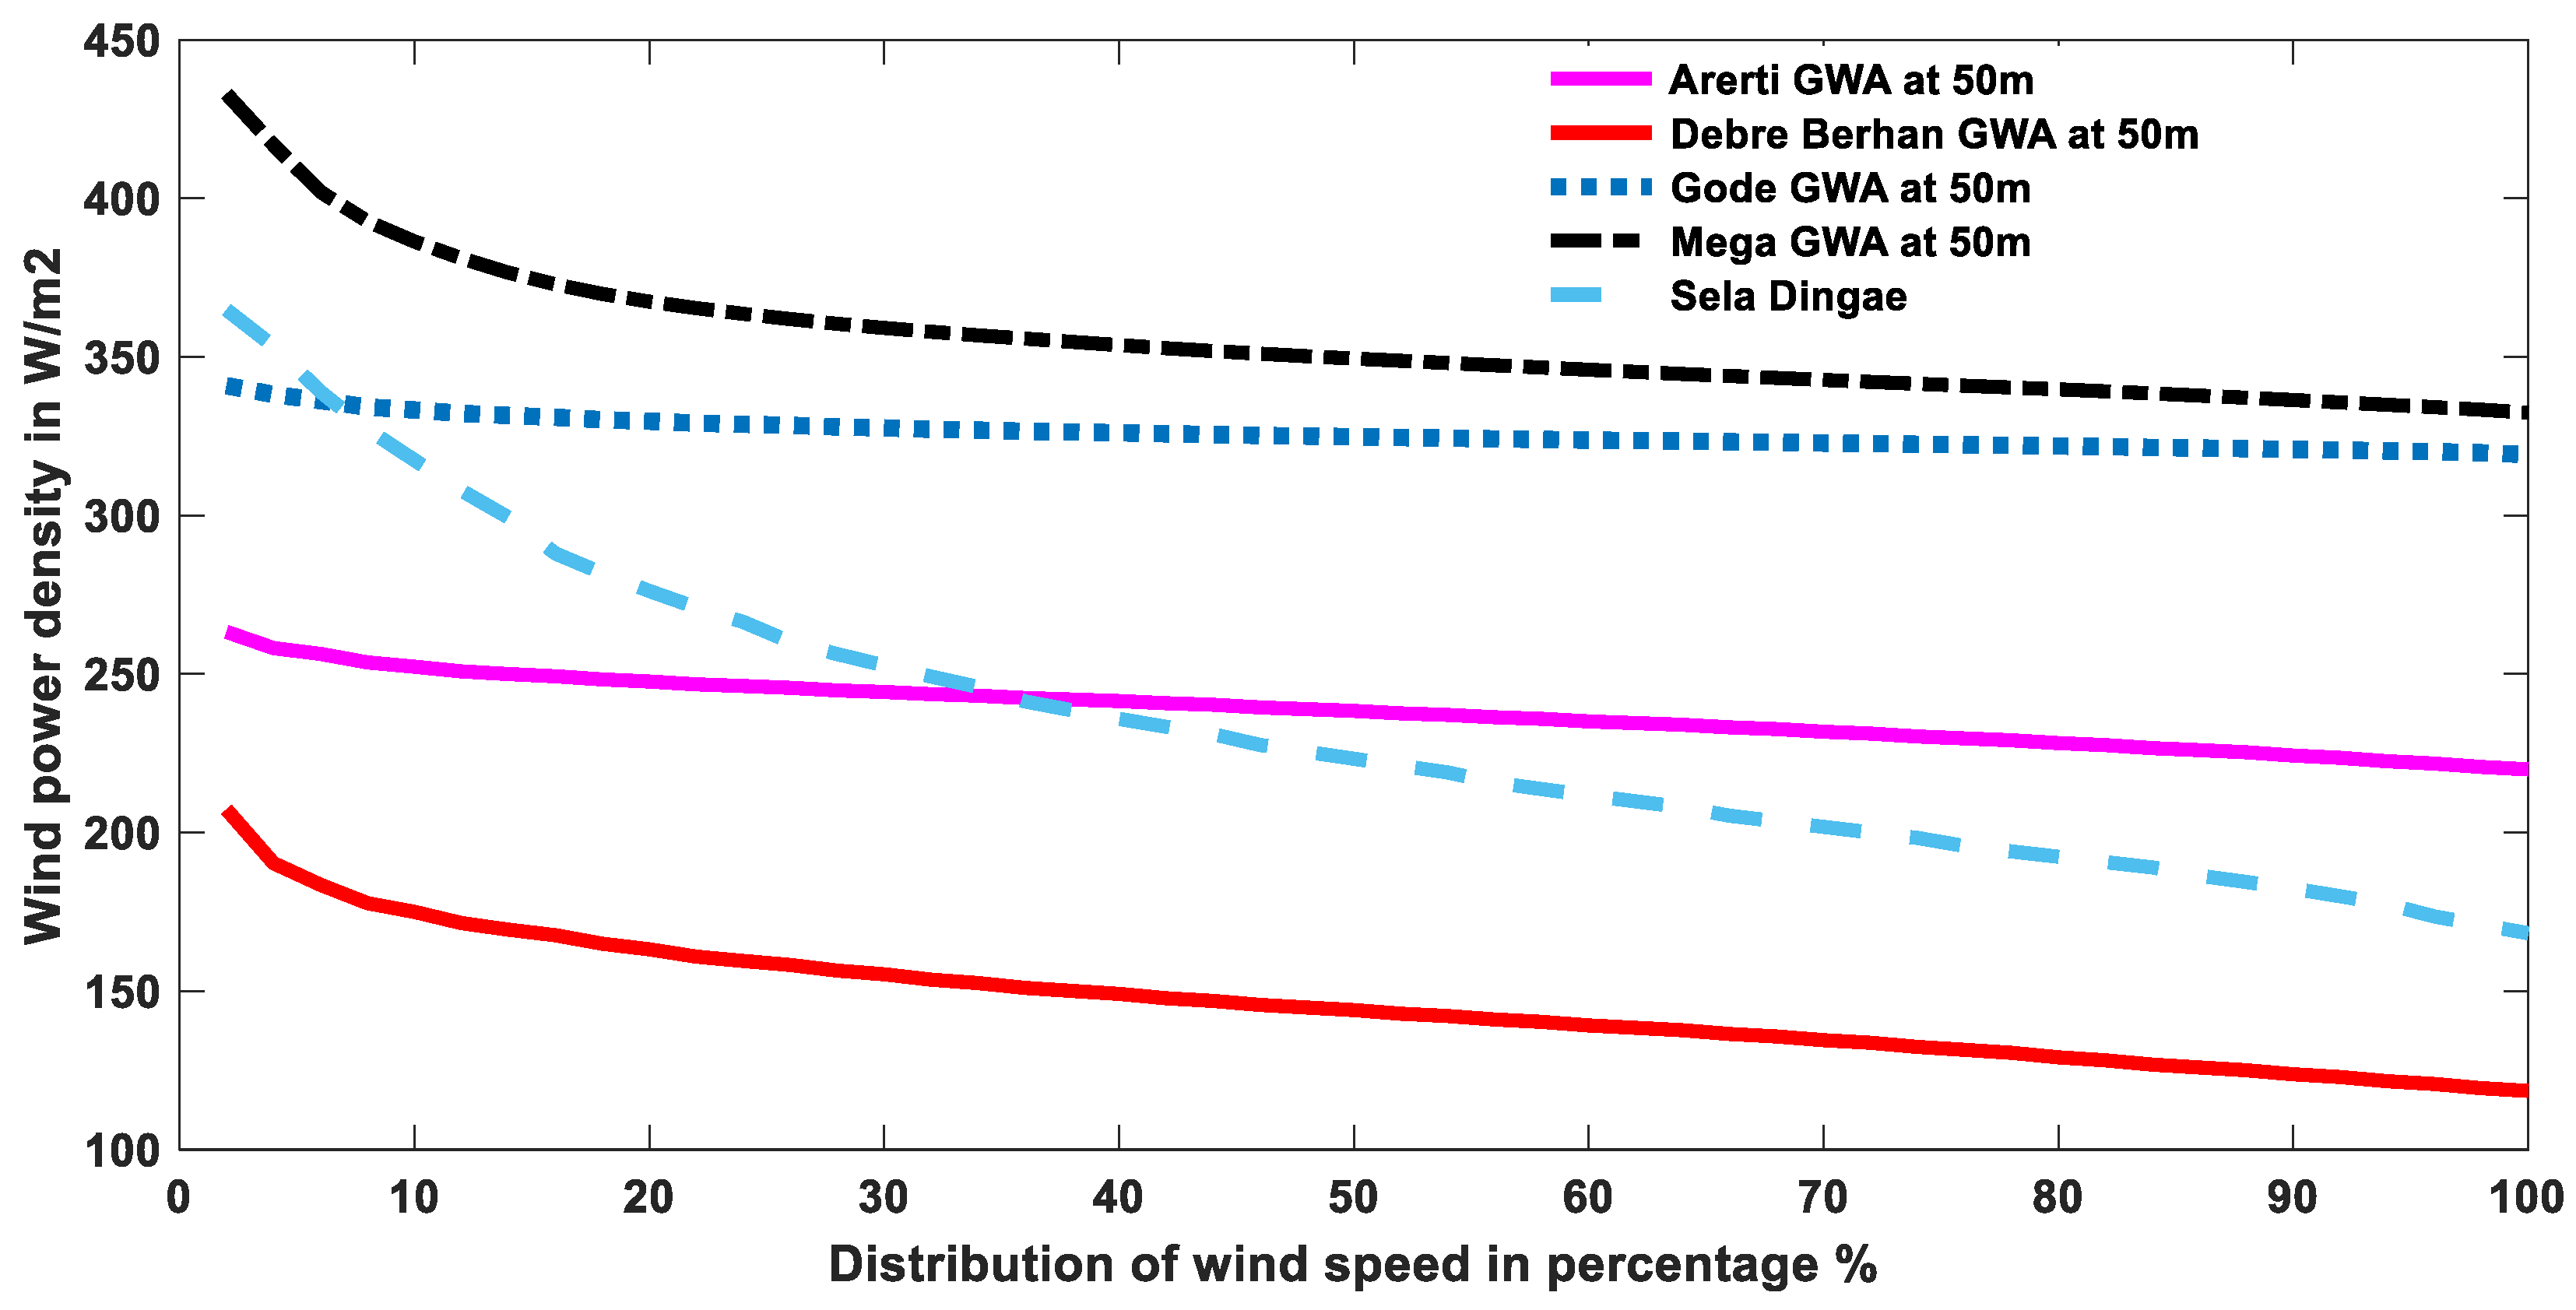
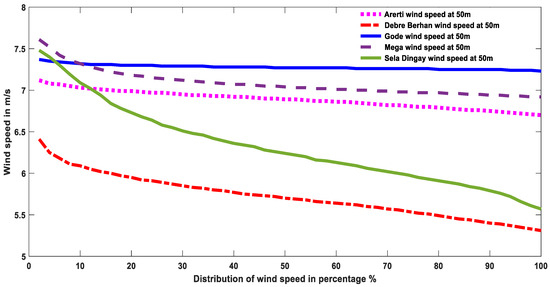
From Figure 10, at a height of 50 m, the wind power density using the GWA data shows that the three sites, including Mega, Gode, and Arerti, are more stable, consistent, and have better wind power density than Sela Dingay and Debre Berhan.
Figure 10.
Wind power density comparison of the case study areas at 50 m hub height using GWA data.
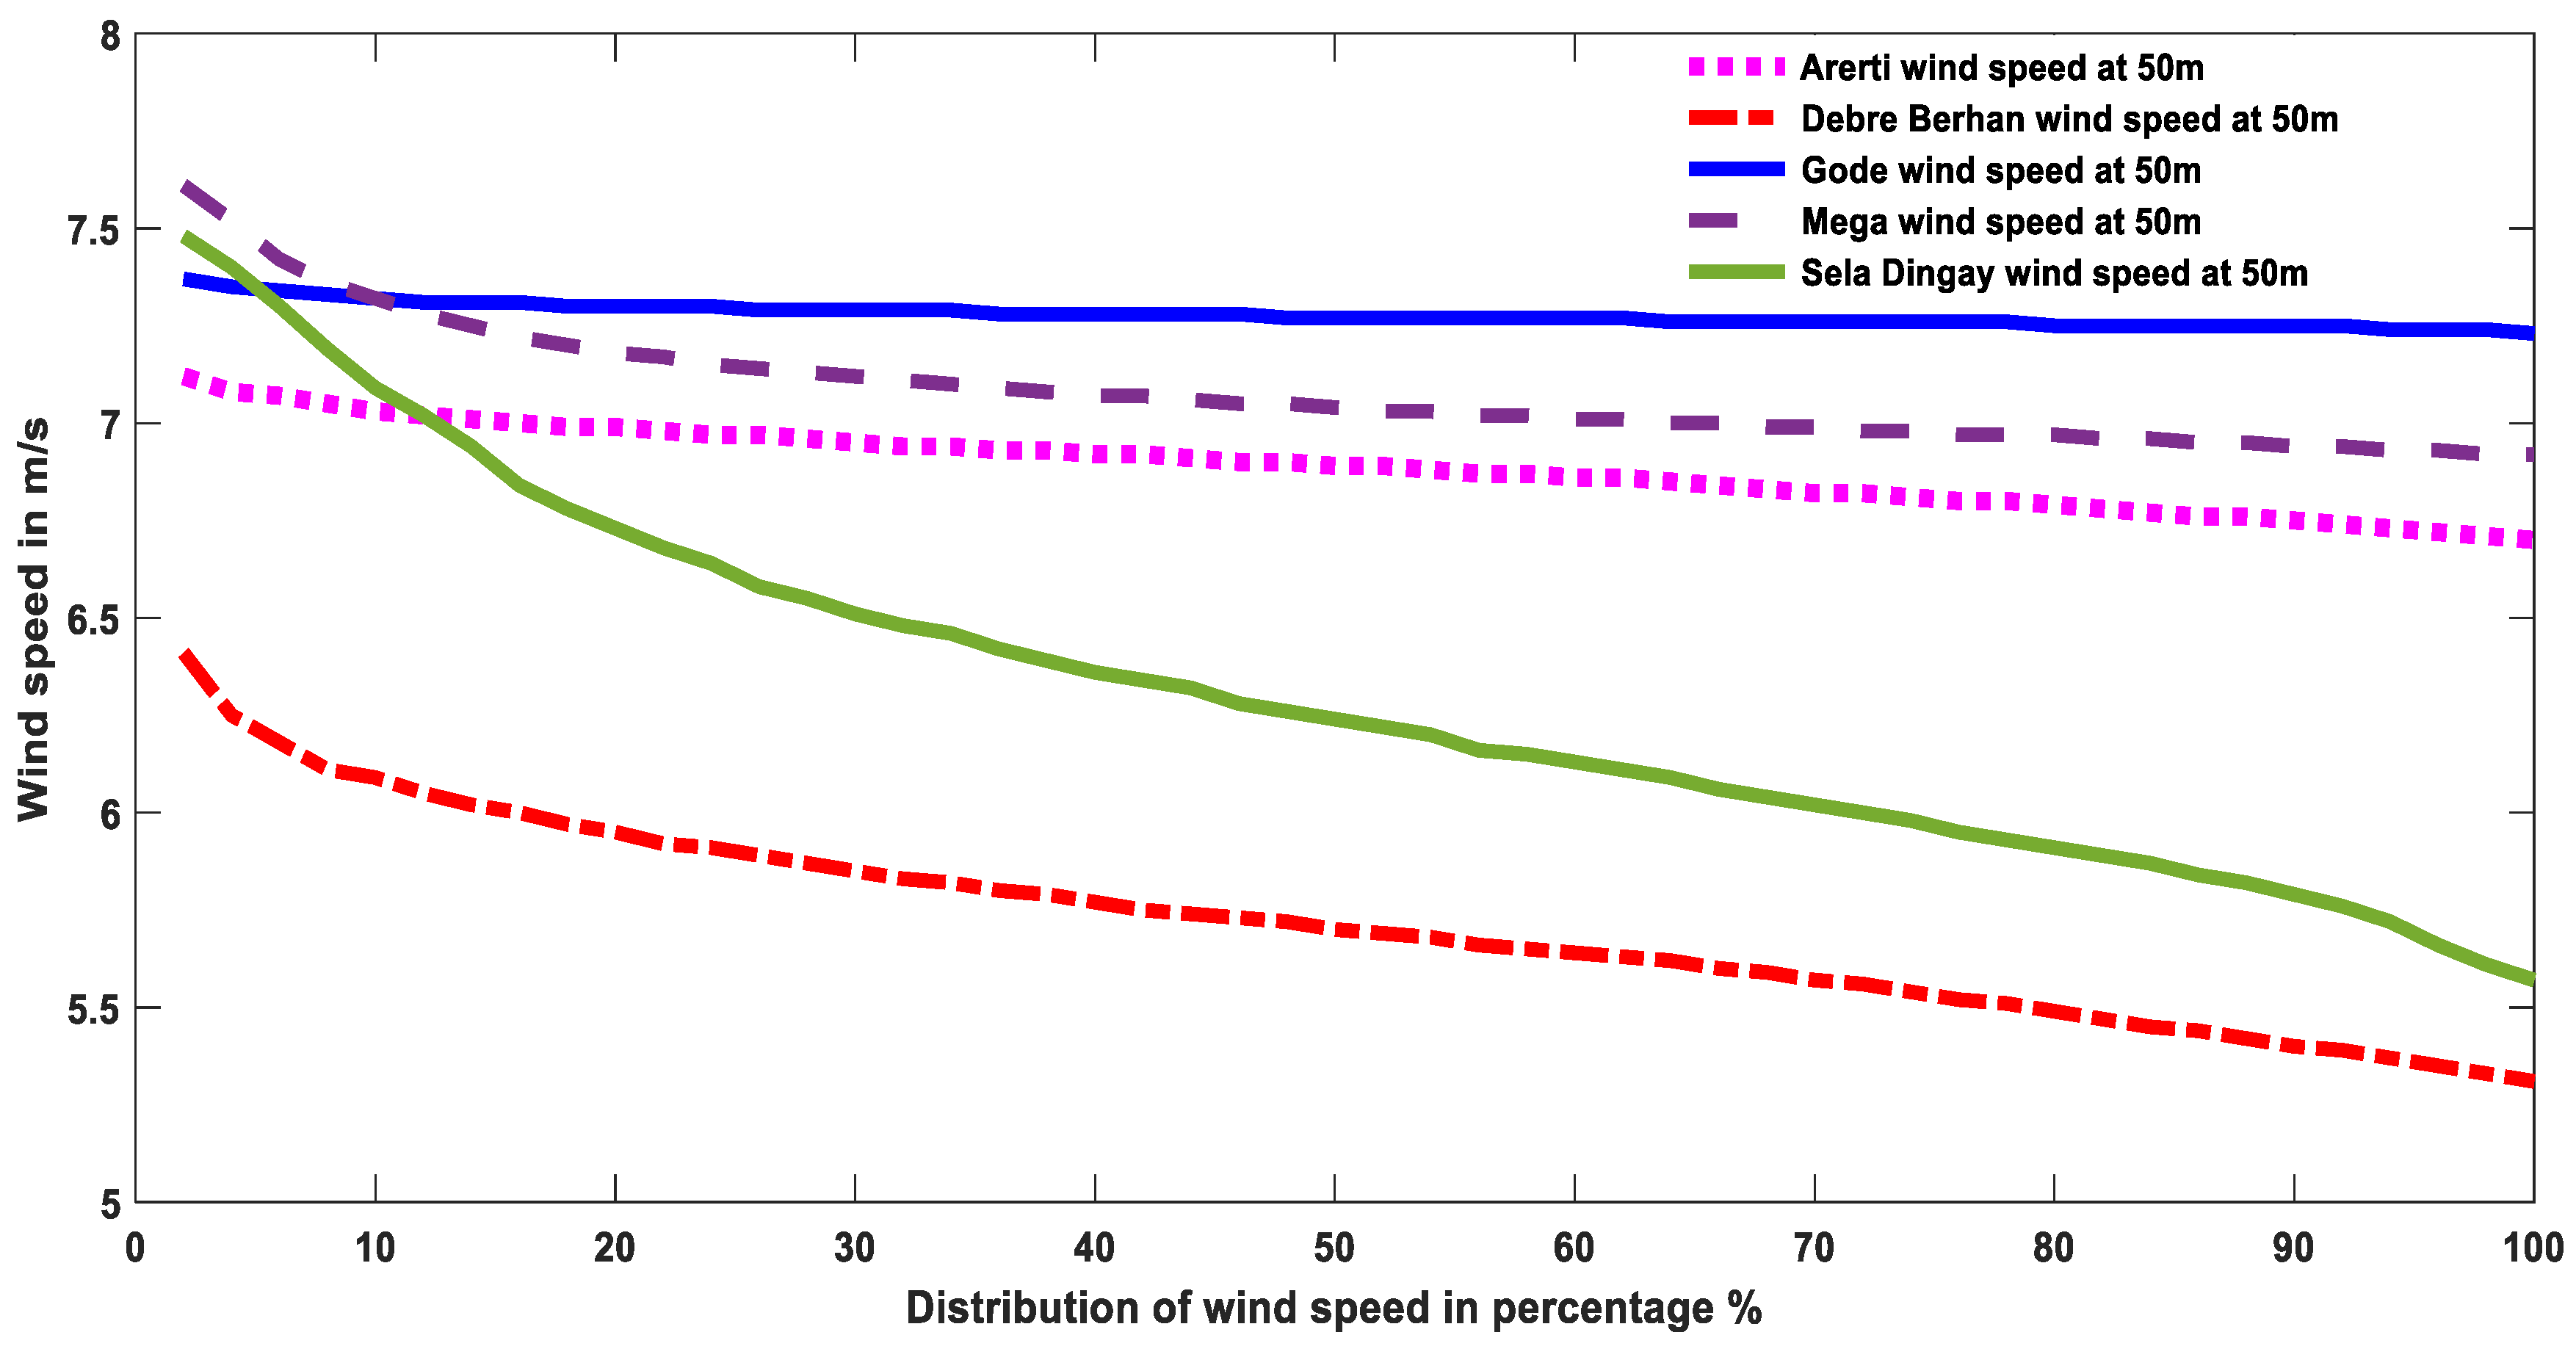
Similarly, from Figure 11, at a height of 50 m, the average wind speed in m/s using the GWA data shows that the three sites of Mega, Gode, and Arerti are more stable, consistent, and have better average wind speed than Sela Dingay and Debre Berhan.
Figure 11.
Wind speed comparison of the case study areas at 50 m hub height using GWA data.
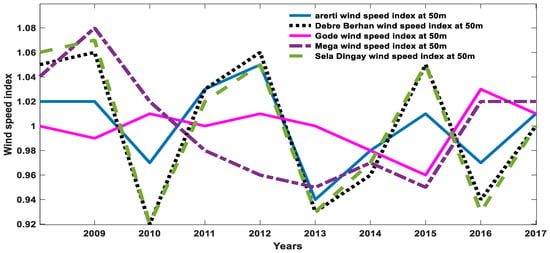
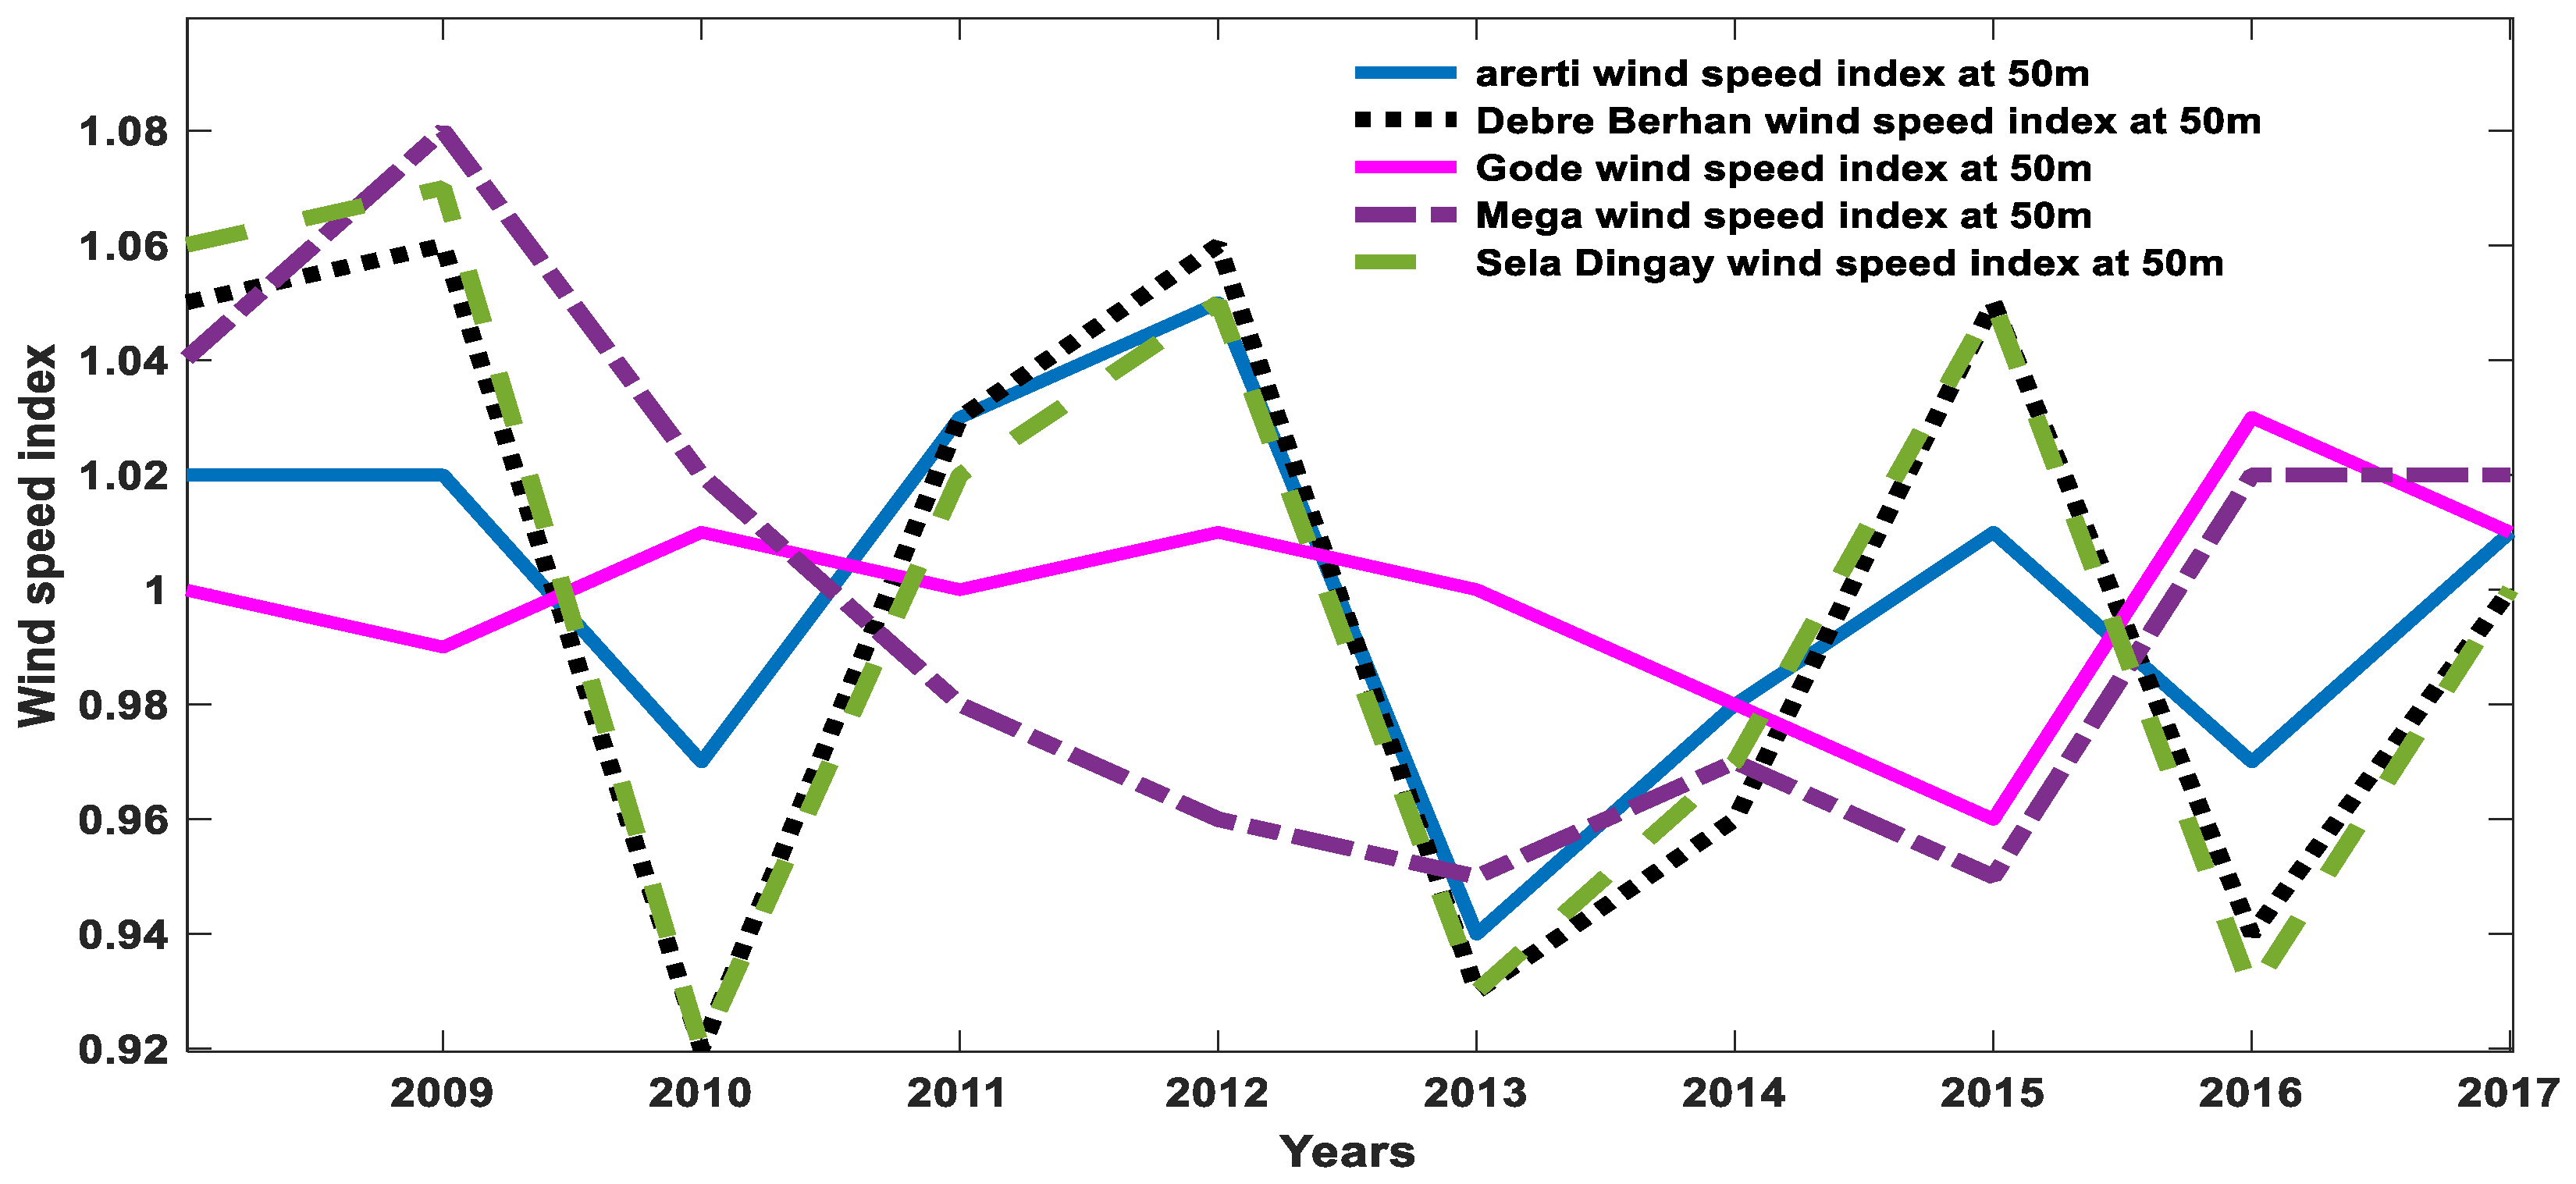
From Figure 12, comparing the average wind speed index from Global Wind Atlas data at 50 m, Debre Berhan and Sela Dingay show high variability, whereas the rest, Mega and Arerti, are consistent and stable wind resources, with Gode being much more stable and consistent, which will lead to good energy production.
Figure 12.
Wind speed index comparison of the case study areas at 50 m hub height.
3.3. Weibull Frequency Distribution Analysis of k and c Using Approximation Calculation
The Weibull distribution is a widely used statistical method for modeling wind speed data and assessing wind potential. It is particularly effective because it can describe the variability of wind speeds over time, making it ideal for evaluating the feasibility of wind energy projects. The most common density function utilized to characterize wind speed is the Weibull probability density function f (v):
Here, v denotes the wind speed, k the shape factor (dimensionless) and c the scale factor (m/s). As the name suggests, it determines the shape of the distribution curve; c is the scale factor and f(v) is the Weibull probability density function.
The following approximation can be used for the Weibull parameter k:
which is valid when . The value of k is approximately 2 for most wind profiles. The Weibull parameter c approximation is
The wind power density P/A can be evaluated with the Weibull distribution as
where
µ = Mean wind speed;
v = Wind speed;
Γ = Gamma function;
ρ = Air density (1.225 kg/m3 at sea level).
The most probable wind speed Vmp (m/s) can be determined using the Weibull parameters k and c. The most probable wind speed is the most frequent wind speed for a given wind probability distribution:
The shape parameter k in the Weibull distribution parameter indicates the variability of wind speed; a lower k value indicates high variability. As the wind speed is more variable it will be challenging for wind turbine operations. The scale parameter “c” indicates, particularly, the characteristics of wind speed directly related to the average wind speed
3.4. Weibull Frequency Distribution Analysis
Weibull frequency distribution analysis of k and c using maximum likelihood estimation (MLE):
Then, c is given by:
where
n = total wind speed observation;
vi = ith measure wind speed;
vik = ith wind speed raised to power of Weibull shape parameter, k.
As shown from Table 4 higher k values (e.g., Arerti, Mega, Gode) reflect lower wind speed variability, aligning with their “excellent” wind potential classification.
Table 4.
Comparison of the Weibull shape factor (k) across the five case study areas using the maximum likelihood estimation (MLE) method with GWA data.
Lower k values (e.g., Debre Berhan) indicate higher variability, consistent with its “nearly good” status.
The Weibull scale factor (c) across the five study shows in Table 5 indicates that Gode has highest average wind speed values at all height scenarios
Table 5.
Comparison of the Weibull scale factor (c) across the five case study areas using the maximum likelihood estimation (MLE) method with GWA data.
Table 6 indicates most probable wind speed across the five case study areas and as height increases, most probable wind speed also increases.
Table 6.
Comparison of the most probable wind speeds across the five case study areas using the maximum likelihood estimation (MLE) method with GWA data.
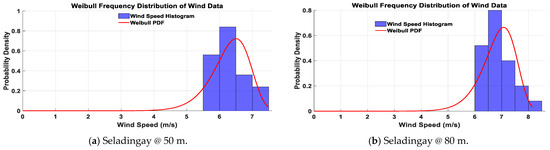
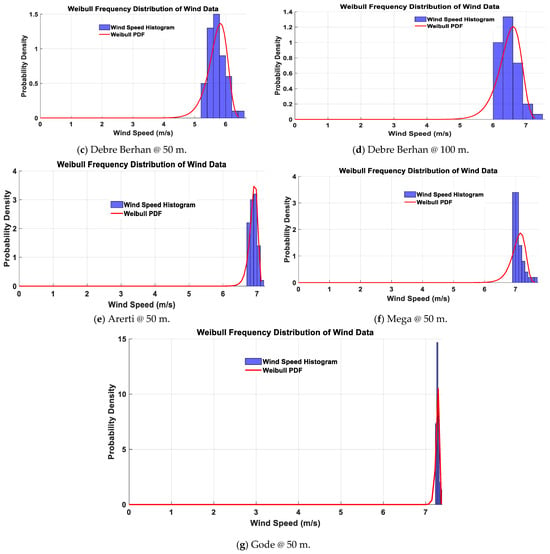
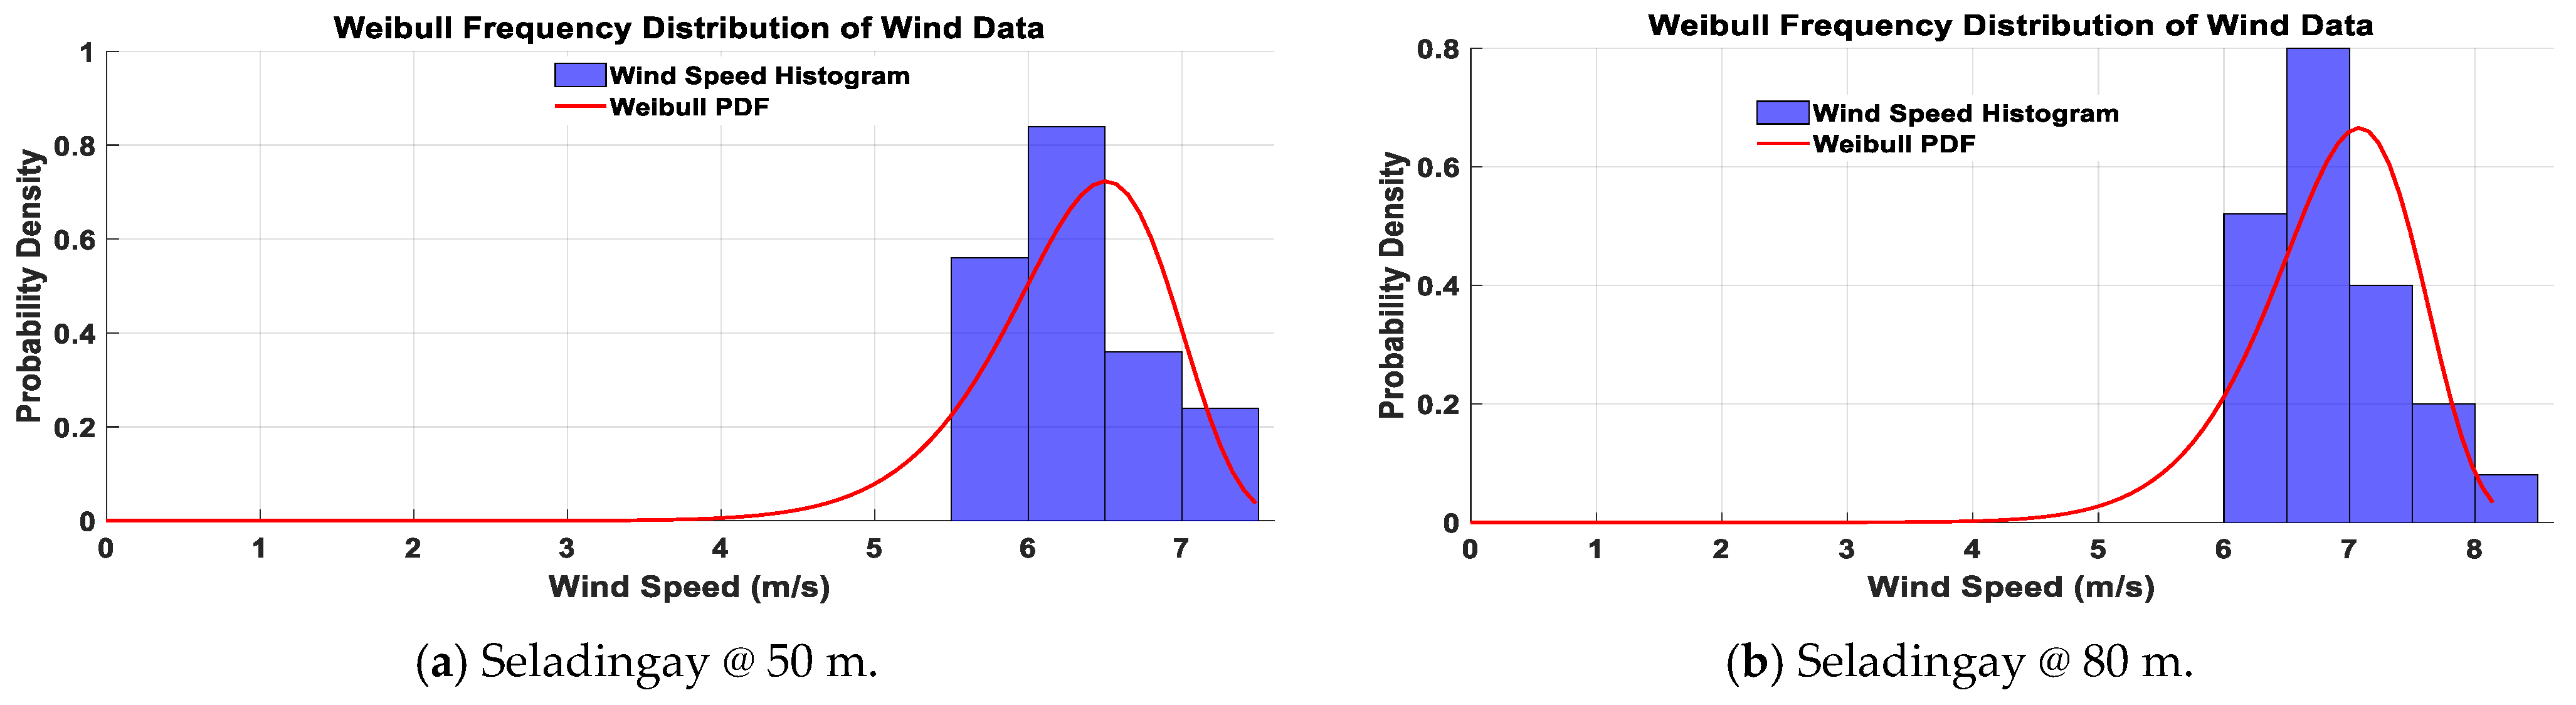
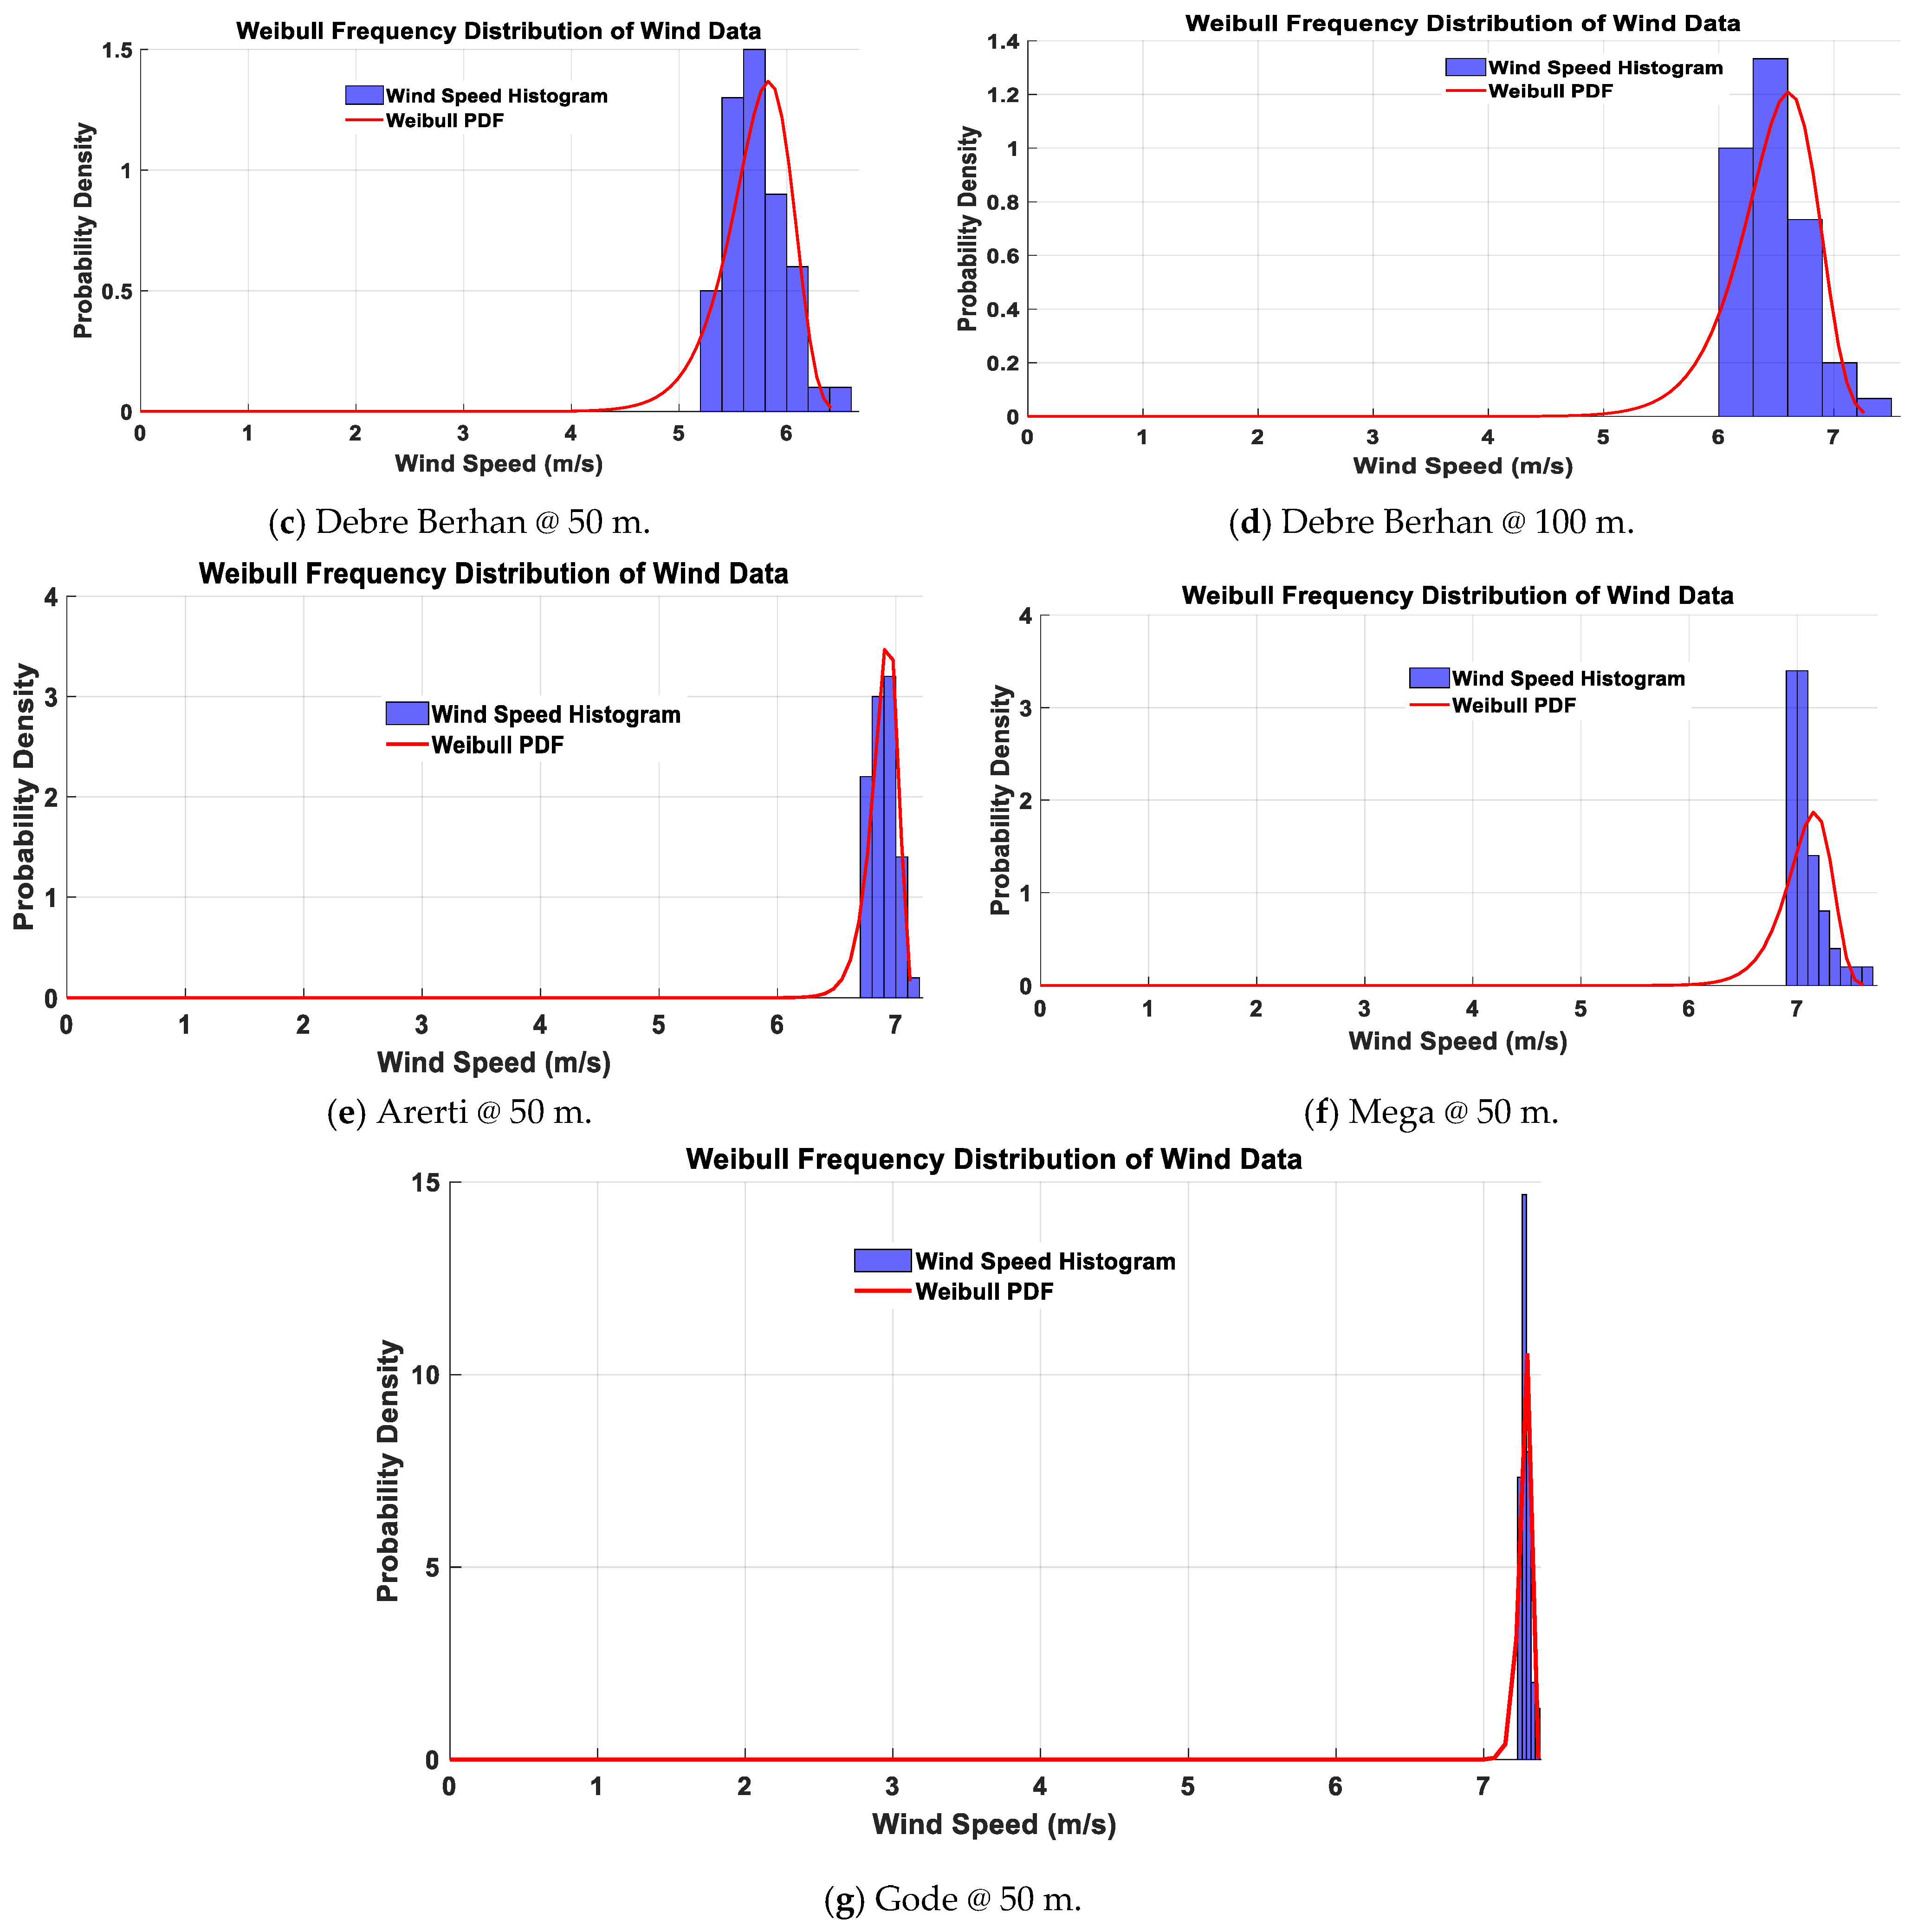
As shown in Figure 13, based on Weibull parameters, an analysis of Arerti from Global Wind Atlas data found that, at a height of 50 m, the mean wind speed is 6.89 m/s, with its mean power density varying between 300 W/m2 and 400 W/m2. Almost 55% of the wind speeds were above 6.7 m/s; as a result, the site is suitable for wind power generation. Moreover, at the Arerti wind site, the higher peak of the graph indicates that wind blows frequently at certain speeds. The histogram shows wind speeds tightly clustered around 6.9 m/s, with a sharp peak in the Weibull curve suggesting a high shape parameter (k), which reflects the low variability in wind speeds and is favorable for wind energy generation. Similarly, Gode, with a mean wind power density lying in the range of 500 W/m2 to 600 W/m2 and a high shape parameter (k), reflects low variability in wind speeds, which is classified as excellent for large-scale wind power generation. The average wind speed for Sela Dingay from Figure 13 at a height of 50 m, using the Global Wind Atlas, is 6.32 m/s, and the average wind speed when using extrapolation at 80 m is 6.87 m/s, with its mean power density varying between 300 W/m2 and 400 W/m2. It is only suitable for the generation of wind power if the height is 60 m and above in order to obtain an average wind speed of 6.5 m/s and above. So, Sela Dingay is suitable for wind power generation if the hub height of the wind turbine is 60 m or above. The mean wind speed for Mega at 50 m height is 7.08 m/s with its mean power density varying between 400 W/m2 and 500 W/m2 which is suitable for wind power generation. Using Global Wind Atlas data at 50 m, Debre Berhan is not suitable, but when it is extrapolated to 100 m, its average wind speed is 6.48 m/s, which is suitable for wind power generation, as its mean power density also lies and varies between 300 W/m2 and 400 W/m2.
Figure 13.
Wind speed histograms and Weibull PDFs for the case study site based on GWA wind speed data.
3.5. Wind Frequency Rose Analysis
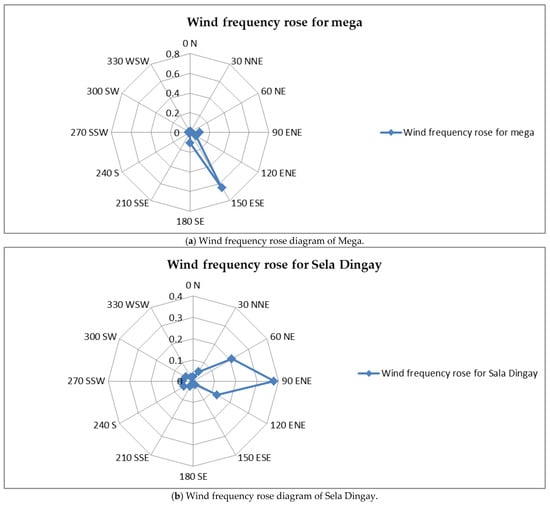
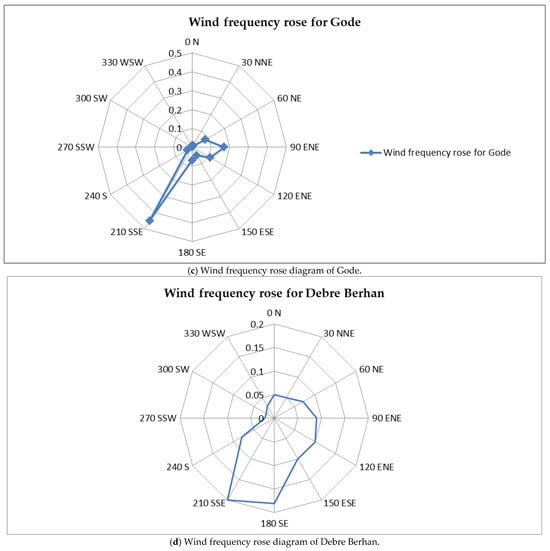
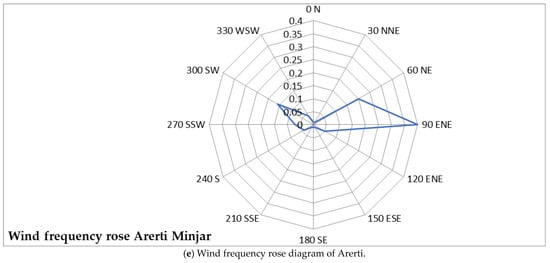
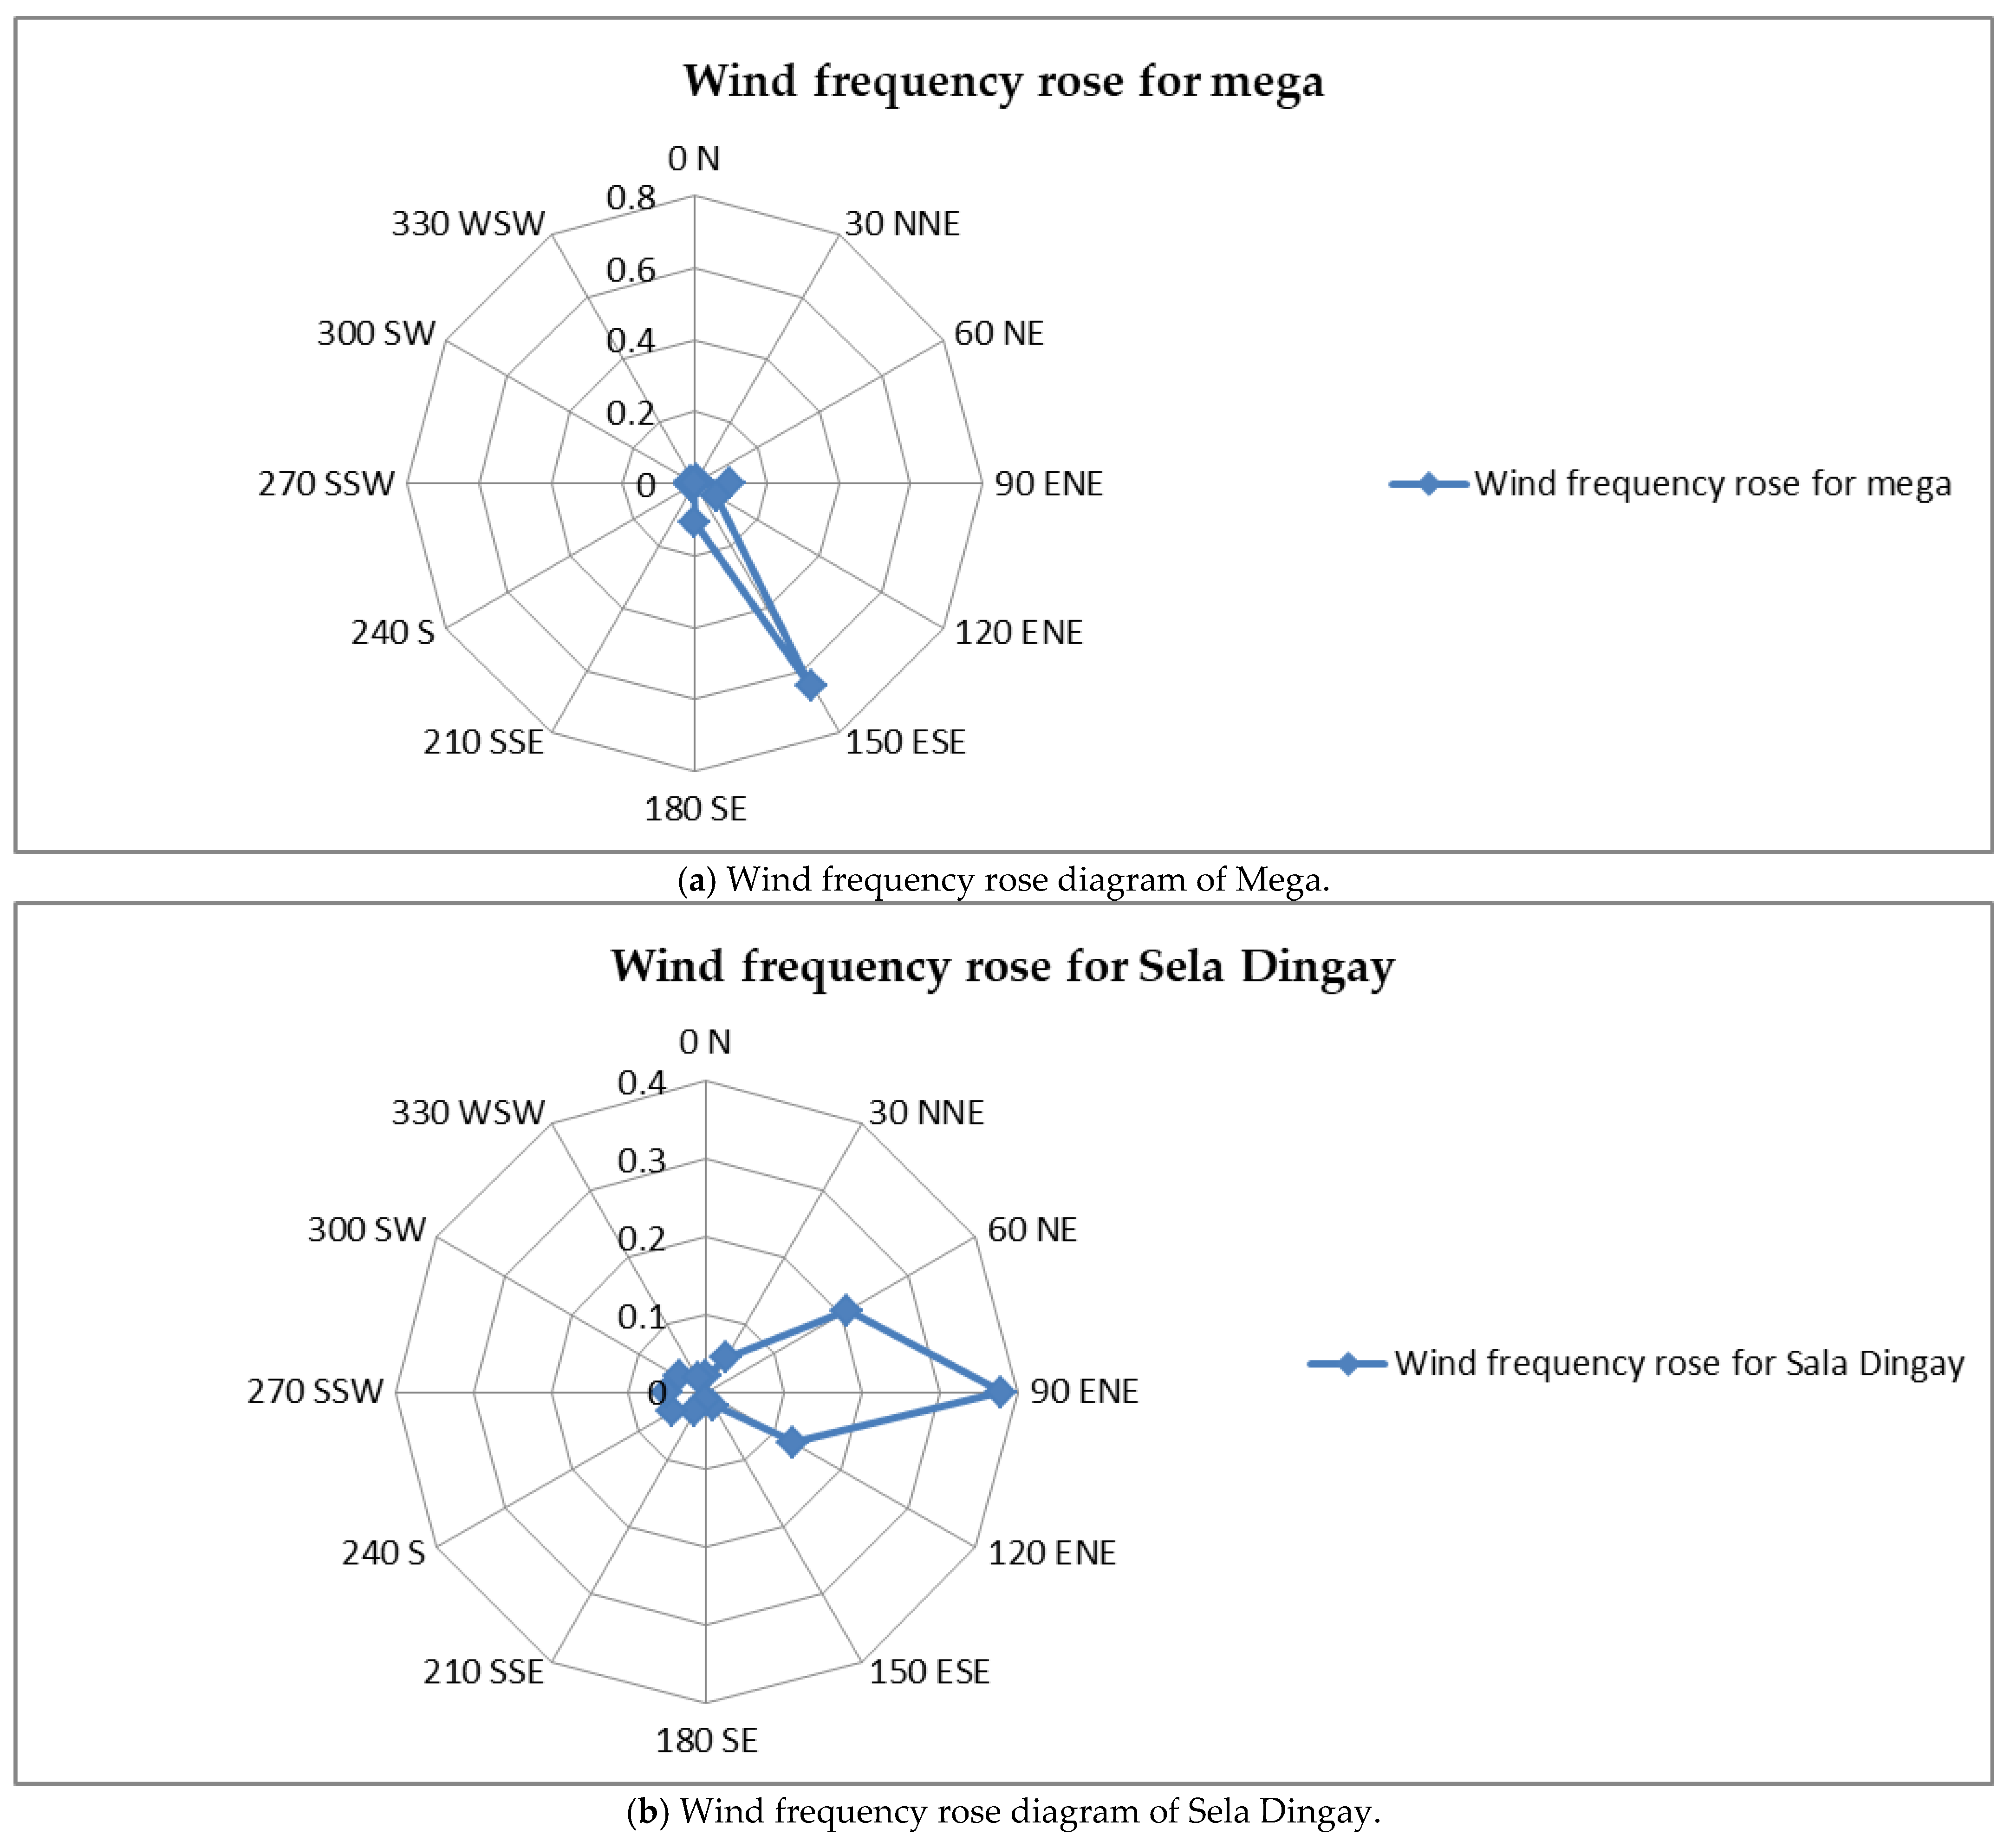
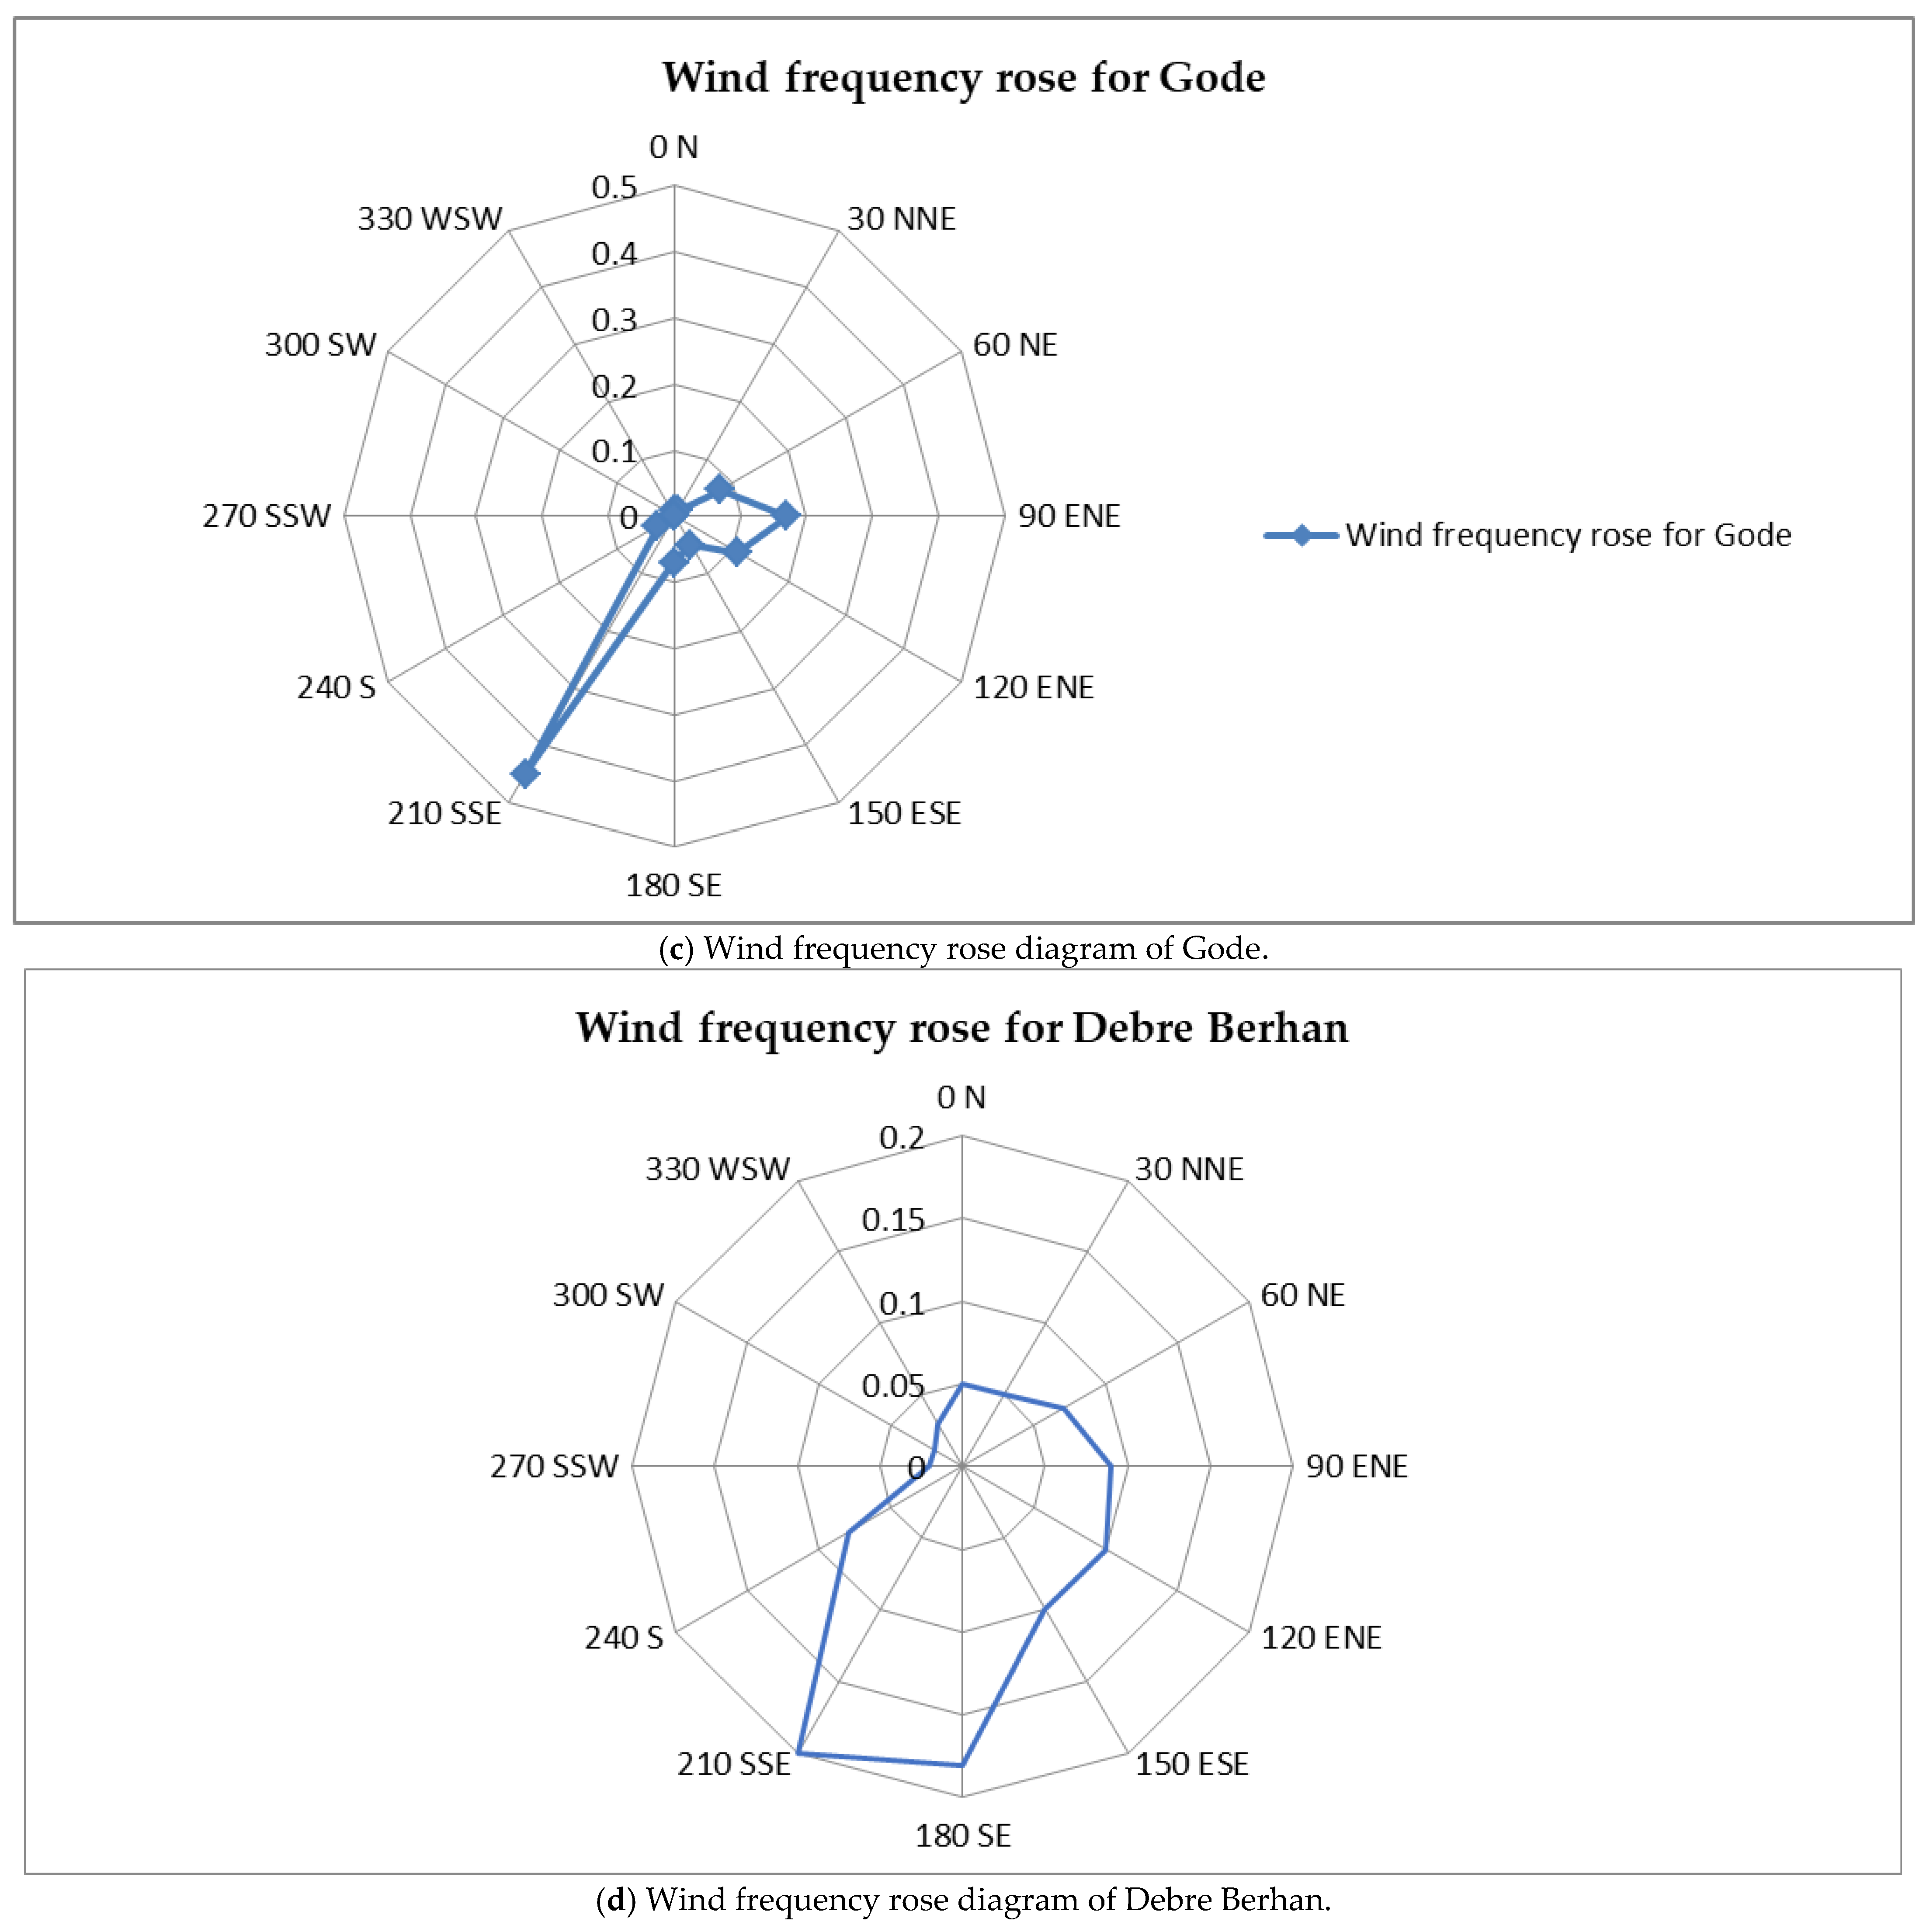
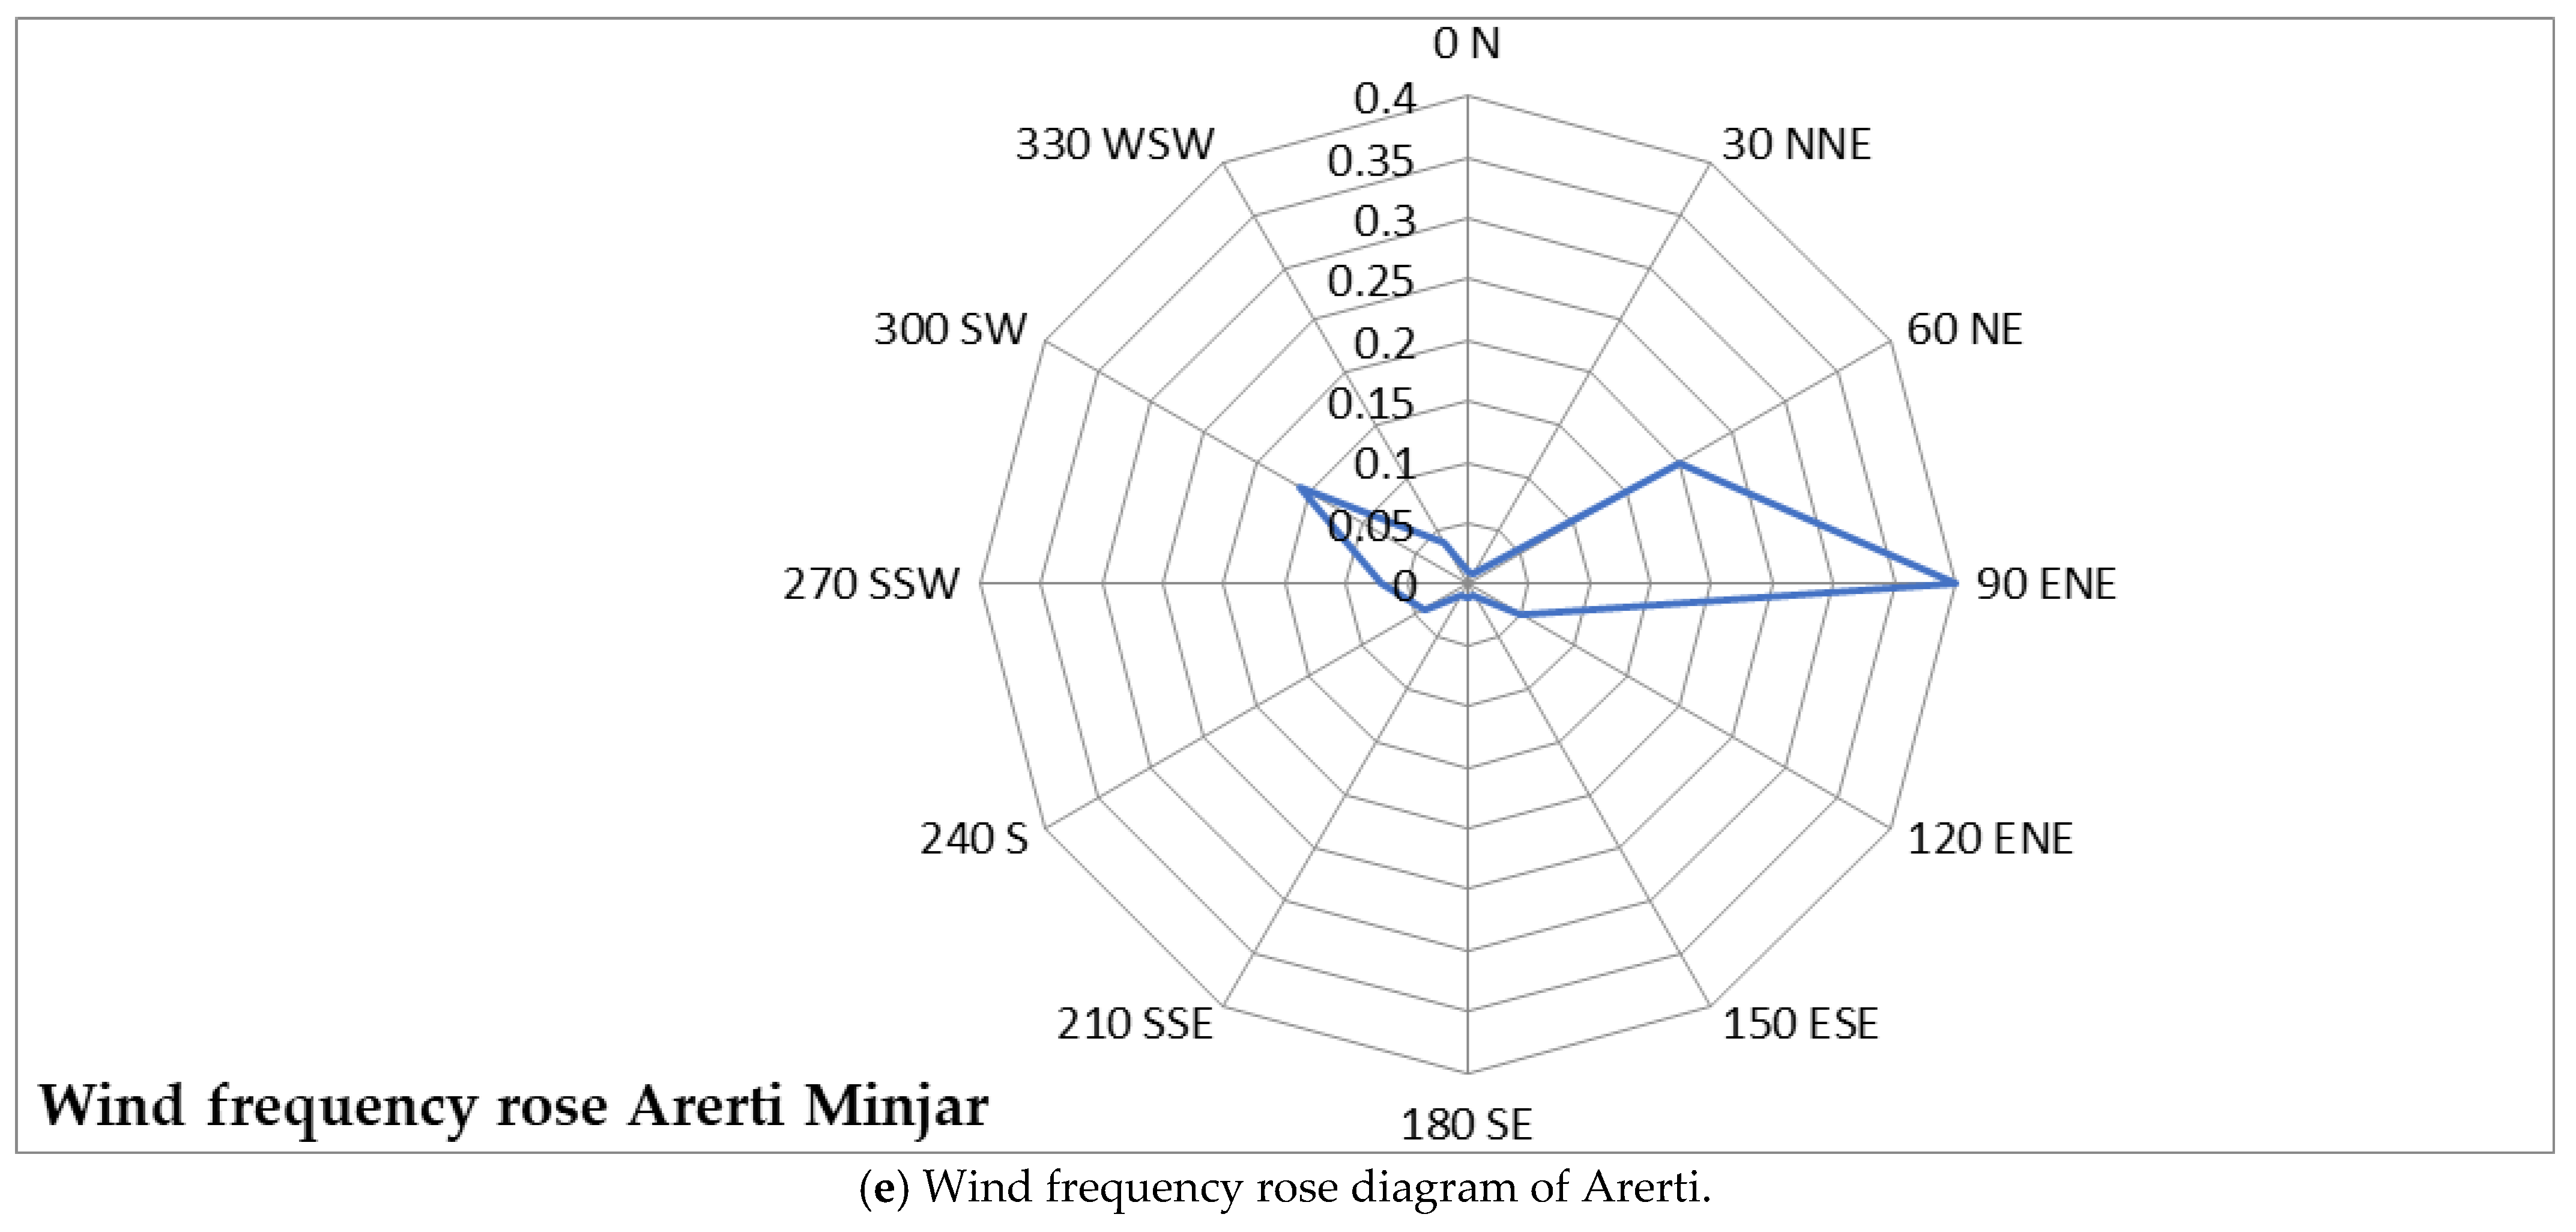
A wind rose is a graphical tool used in wind analysis to visualize the distribution of wind direction and speed at a location over time. The length of each segment indicates the frequency of wind from that direction; longer segments represent more frequent winds. Wind roses are essential for wind turbine orientation, ensuring turbines face prevailing winds for maximum energy capture, and for determining optimal turbine spacing within wind farms. Figure 14 shows the wind rose of different wind sites; from the graph, the proposed study sites of the Amhara region’s winds blow east north east (ENE) for Sela Dingay and Arerti, whereas for Debre Berhanainly towards South South east (SSE); for Gode in the Somali region the direction of wind blow is south south east (SSE) and that of Mega in the Oromia region is in an east south east (ESE) direction. The detailed analysis of the wind sites is beyond the scope of this study; however, the wind rose provides essential contextual information regarding the prevailing wind directions and directional wind frequency, which directly influence wind resource assessment and future project planning. The wind rose supports the interpretation of the Weibull-based statistical analysis by identifying dominant wind sectors that contribute most significantly to energy production. It also serves as a preliminary indicator for potential wind farm orientation and turbine alignment in future detailed studies.
Figure 14.
(a–e) Wind frequency rose diagrams for different wind sites of the case study areas.
4. Technical Analysis of Turbine Power and Annual Energy Generation
4.1. Weibull Distribution for Capacity Factor and Energy Analysis
The long-term wind speed behavior at a specific site can be represented using the Weibull distribution’s shape factor (k) and the scale parameter (c). Once these parameters are determined, the wind power density, annual energy production (AEP), and the capacity factor (CF) of a wind turbine or wind farm can be reliably evaluated
From Table 4, Gode, Mega, Arerti, Seladingay and Debre Berhan have shape parameters (k = 2.7, 2.5, 2.6, 2.1 and 1.8) respectively at 80 m and these are used to calculate the capacity factor. A high capacity factor dramatically improves the economics of the plant [54] and as the value of k increases, the curve has a sharper peak, indicating that there is less wind speed variation [30]
4.2. Capacity Factor (CF) Estimation
To estimate the capacity factor (CF) of a wind turbine, we use an approximate formula based on the Weibull distribution of wind speeds. In this analysis, we assume a wind turbine with a rated capacity of 3 MW. The turbine has a cut-in wind speed of 3 m/s, a rated wind speed of 11 m/s, and a cut-out wind speed of 25 m/s. The capacity factor can be approximated using the following formula for Weibull-distributed winds:
This expression simplifies the estimation of the CF by accounting for the probability of wind speeds falling within the turbine’s operating range, as described by the Weibull shape parameter k and scale parameter c. Specifically, it considers the exponential decay in wind speed probabilities from cut-in to rated speed and adds the rated speed’s contribution again to reflect energy production at rated power. This method provides a useful approximation of a turbine’s efficiency under varying wind conditions. For a 3 MW turbine (cut-in: 3 m/s, rated: 11 m/s):
From Table 7 above Gode has a highest capacity factor than the other case study sites.
Table 7.
Capacity factor calculation.
4.3. Turbine Power out Put
A higher k value suggests more consistent wind speeds, which are favorable for stable power generation, while a lower k value indicates greater variability, making turbine operation less predictable. To calculate the turbine power output, the rated power (PR) of the turbine is required [21].
Average Power Output (P_avg) = CF × Rated Power (PR)
To calculate the turbine power output of the case study sites as shown in Table 8,the CF is multiplied by with the same 3 MW output turbine for all sites and from this result, Gode is the highest and Debre Berhan is the lowest
Table 8.
Turbine power output.
4.4. Energy Generation (Yearly and Monthly)
The energy output of a wind turbine is calculated as
Energy (kWh) = Capacity (kW) × CF × Hours in Period
Yearly Energy (for 1 turbine): Energy = 3000 kW × CF × 8760 h.
Monthly Energy (for 1 turbine): Energy = 3000 kW × CF × 730 h.
4.5. Energy Output Calculations
Annual energy production (AEP) is derived by multiplying the capacity factor by the turbine’s rated power and annual hours (8760); Yearly Energy (Per Turbine): 3000 kW × CF × 8760 h [30,41].
The above calculation in Table 9 is for the ideal case and does not consider wake effects, turbulence, mechanical losses, electrical losses, downtime and maintenance [21,30,41].
Table 9.
Yearly and monthly energy output.
4.6. Revised Energy Estimates (Including Losses)
A conservative 20% aggregate loss factor, accounting for wake effects, electrical inefficiencies, downtime, and environmental losses, is applied post-capacity factor to adjust annual energy production (AEP) estimates [54]. Applying an average 20% loss factor (conservative estimate combining all losses) produces the adjusted capacity factor (CFadj):
CFadj = CF × (1 − Total Losses) = CF × 0.80
Revised Yearly Energy Output (Per Turbine).
Energy/Year = 3000 kW × CFadj × 8760 h.
As indicated in Table 10 after considering 20% loss factors, turbine yearly energy production in MWh and capacity factors (CFs) in percentage for Gode, Mega, Arerti, Sela Dingay and Debre Berhan respectively are 9461, 9040, 8619, 7358, and 5886 and 36%, 34.40%, 32.80%, 28%, and 22.40%.
Table 10.
Energy estimate considering losses.
4.7. Energy Production of Wind Farm
Assuming for installing a 50 MW wind farm capacity (15 turbines each with 3MW turbines), the total annual energy production of each site will be found by multiplying per turbine annual energy production with the number of turbines. An aggregated loss factor of 20% for wake losses, electrical losses, turbine availability is applied to represent a realistic wind farm; however, the detailed wind farm layout and wake modeling using the tools like WASP and other models are beyond the scope of the study and are recommended for future work.
4.8. Energy Mix Diversification and Wind Farm Development Plan
According to the Energy Outlook Report of Ethiopian Electric Power (EEP) in March 2024, the country’s installed electricity generation capacity is dominated by hydropower, with approximately 4GW from hydro and 0.3GW from wind. In addition, several large-scale generation projects are under construction and planned to be fully commissioned by 2027. In line with national energy policy, Ethiopia aims to diversify its electricity mix so that at least 25% of electricity generation is supplied from non-hydro renewable energy sources (wind, solar, and geothermal) by 2030. Similarly, the Ethiopian Power System Expansion Master Plan has pointed out a strategic objective to reduce hydropower’s share of electricity generation to below 75% by 2030, thereby increasing system resilience through diversification of non-hydro renewable energy sources, such as wind, solar, and geothermal. The Master Plan prioritizes wind and solar projects in the short term due to their relatively short construction periods and annual installation limits of approximately 300 MW per year [55,56].
From a power system planning perspective, the wind site projects identified in this study area should be incorporated into Ethiopia’s medium- and long-term generation expansion plans. The selection criteria of these wind sites are based on strong wind resource characteristics, proximity to existing transmission infrastructure and access availability to the site and ports. Based on the wind resource assessment conducted across five regions, Gode (Somali Region), Mega (Oromia), and Arerti (Amhara) emerged as the most promising locations for utility-scale wind energy development.
Among these sites, Arerti demonstrates strategic advantages for near-term wind farm deployment due to its proximity to major load centers, access to ports, and availability of existing 132 kV and 230 kV transmission networks, which collectively reduce grid integration costs and project implementation timelines. Although Gode and Mega exhibit superior wind resource potential and higher projected energy yields, their development is more suitable for medium- and long-term expansion respectively due to their distance from the port and national grid, as well as transmission line constraints in Mega. Sela Dingay and Debre Berhan, which exhibit moderate wind resources, remain viable candidates for long-term development through the deployment of taller wind turbines.
5. Conclusions
This investigation establishes a thorough engineering blueprint to help Ethiopia transition away from its current 94% dependency on hydroelectric power. Through a multi-layered data fusion of local mast records, NASA resources, and Global Wind Atlas information, the research confirms significant energy potential at five key locations: Gode, Mega, Arerti, Sela Dingay, and Debre Berhan. The results prove that Gode and Mega possess superior commercial characteristics, falling into “Excellent” classifications with velocities surpassing 8.5 m/s and power densities over 500 W/m2 at modern 100 m hub heights. Specifically, Gode is recognized as the most reliable location due to its Weibull shape factor of 2.8, which provides the steady electrical output required for maintaining a balanced power grid.
In addition to wind metrics, the study underscores that tower elevation and existing logistical networks are vital for determining a project’s success. Although mountainous regions like Debre Berhan and Sela Dingay show lower speeds at the ground level, their economic prospects rise sharply when paired with contemporary 100 m turbine technology. Arerti emerges as the strongest candidate for near-term investment because it combines a “Good” wind resource for utility-scale power with a strategic location; its immediate access to high-voltage transmission lines (132/230 kV) and industrial hubs significantly lowers setup expenses. Ultimately, this research aligns with Ethiopia’s Climate-Resilient Green Economy (CRGE) goals, illustrating that wind power can effectively balance the national energy supply by providing a vital seasonal counterpoint to hydropower during periods of low rainfall.
6. Future Work
To translate these theoretical assessments into operational wind farms, the next stage of research must prioritize precise turbine placement through detailed layout optimization and micro-siting using specialized software like the Wind Atlas Analysis and Application Program (WASP). This site-specific modeling should be integrated into a broader effort to expand ground-level monitoring by placing meteorological masts in high-potential regions that remain unmapped, thereby validating satellite data and lowering financial risks for stakeholders. Beyond site preparation, it is essential to conduct advanced dynamic simulations to test how the national grid handles large-scale wind integration, particularly looking at how DFIG-based turbine systems can be tuned to stabilize power frequencies and prevent oscillations. These engineering priorities must ultimately be grounded in rigorous economic modeling, specifically through Levelized Cost of Energy (LCOE) analysis and comprehensive social impact studies to ensure that Ethiopia’s wind energy expansion is both cost-effective and beneficial to the local communities it serves.
Author Contributions
Conceptualization, S.F. and M.A.; methodology, S.F., M.A., D.A., W.K., Y.Y., M.J., S.M., J.M.G., J.C.V., and Y.G.; validation, S.F., M.A., and D.A.; investigation, S.F., M.A., D.A., W.K., Y.Y., M.J., S.M., and Y.G.; data curation, S.F., M.A., and D.A.; writing—original draft preparation, S.F. and M.A.; writing—review and editing, S.F., M.A., W.K., Y.Y., and Y.G.; visualization, Solomon Feleke and M.A.; supervision, J.M.G., J.C.V., and Y.G.; project administration, Y.G.; funding acquisition, Y.G., J.M.G., and J.C.V. All authors have read and agreed to the published version of the manuscript.
Funding
This work was supported by the LastWind project (granted by the Danish Ministry for Foreign Affairs and supported by the Danida Fellowship Centre under grant 23-M01-AAU).
Data Availability Statement
The data presented in this study are available upon request from all authors.
Conflicts of Interest
Author Mulat Azene was employed by the company Ethiopian Electric Power (EEP). The remaining authors declare that the research was conducted in the absence of any commercial or financial relationships that could be construed as a potential conflict of interest.
Abbreviations
| AEP | Annual Energy Production |
| CF | Capacity Factor |
| CRGE | Climate-Resilient Green Economy |
| WPD | Wind Power Density |
| EEP | Ethiopian Electric Power |
| EEU | Ethiopian Electric Utility |
| GWA | Global Wind Atlas |
| NASA | National Aeronautics and Space Administration |
| DFIG | Doubly Fed Induction Generator |
| GIS | Geographic Information System |
| SDG 7 | Sustainable Development Goal 7 (Affordable and Clean Energy) |
| LCOE | Levelized Cost of Energy |
| NEP | National Electrification Program |
| MERRA-2 | Modern-Era Retrospective analysis for Research and Applications, Version 2 |
| WASP | Wind Atlas Analysis and Application Program |
| k | Weibull Shape Factor (dimensionless) |
| c | Weibull Scale Factor (m/s) |
| α | Hellman Exponent (Wind Shear Coefficient) |
| ρ | Air Density (kg/m3) |
| v | Wind Speed (m/s) |
| Vmp | Most Probable Wind Speed (m/s) |
| MW/MWh | Megawatt/Megawatt-hour |
| kV | Kilovolt |
References
- Gebreslassie, M.G. Hydropower dependency and climate risk: Ethiopia’s energy challenges. Energy Policy 2021, 155, 112345. [Google Scholar]
- Bekele, G.; Dile, Y.T.; Berhanu, B.; Moges, M. Climate change impacts on hydropower generation in Ethiopia. J. Hydrol. 2020, 587, 124678. [Google Scholar]
- Ministry of Water and Energy (MoWE). National Power System Expansion Plan (NPSEP); Ministry of Water and Energy (MoWE): Addis Ababa, Ethiopia, 2023. [Google Scholar]
- Hailu, A.D.; Gebremedhin, T.; Berhe, M. Ethiopia’s Climate-Resilient Green Economy Strategy: Progress and gaps. Sustainability 2023, 15, 9214. [Google Scholar]
- World Bank. Ethiopia National Electrification Program 2.0; World Bank: Washington, DC, USA, 2022. [Google Scholar]
- Gebreslassie, M.G. Ethiopia’s wind energy potential: Opportunities and barriers. Renew. Energy 2022, 185, 45–56. [Google Scholar]
- Bekele, G.; Palm, B.; Gebremedhin, T. Wind resource assessment in Ethiopia’s highlands. Energy Sustain. Dev. 2020, 58, 22–34. [Google Scholar]
- Ministry of Water and Energy (MoWE). Energy Sector Status Report; Ministry of Water and Energy (MoWE): Addis Ababa, Ethiopia, 2024. [Google Scholar]
- Gebremichael, T.; Bekele, G.; Gebremedhin, T.; Asfaw, A. Wind energy potential in Ethiopia’s Amhara, Oromia, and Somali regions. Energy Rep. 2023, 9, 312–325. [Google Scholar]
- Feleke, S.; Anteneh, D.; Khan, B.; Álvarez, R.M. Feasibility and Potential Assessment of Wind Resource: A Case Study. Distrib. Gener. Altern. Energy J. 2023, 38, 1863–1884. [Google Scholar]
- United Nations (UN). Sustainable Development Goal 7: Affordable and Clean Energy; UN Progress Report; United Nations (UN): New York, NY, USA, 2024. [Google Scholar]
- Global Wind Energy Council (GWEC). Global Wind Report 2024: Annual Market Update; Global Wind Energy Council (GWEC): Brussels, Belgium, 2024. [Google Scholar]
- Wiser, R.; Bolinger, M.; Barbose, G.L.; Darghouth, N.R.; Hoen, B.; Mills, A.D. Grid integration challenges for wind energy in emerging markets. IEEE Trans. Sustain. Energy 2021, 12, 3062–3075. [Google Scholar]
- International Energy Agency (IEA). Africa Energy Outlook 2023; International Energy Agency (IEA): Paris, France, 2023. [Google Scholar]
- International Renewable Energy Agency (IRENA). Renewable Capacity Statistics; International Renewable Energy Agency (IRENA): Abu Dhabi, United Arab Emirates, 2024. [Google Scholar]
- Seguro, J.V.; Lambert, T.W. Modern wind turbine technology for low-wind regions. Appl. Energy 2020, 260, 114987. [Google Scholar]
- NASA POWER. Prediction of Worldwide Energy Resources; [Data Set]; NASA POWER: Hampton, VA, USA, 2023. [Google Scholar]
- Hansen, B.O.; Badger, J.; Davis, N.N.; Hahmann, A.N.; Mortensen, N.G.; Olsen, B.T.; Floors, R.; Lizcano, G.; Casso, P.; Lacave, O.; et al. Global Wind Atlas 3.0: A tool for wind energy planning. Renew. Energy 2022, 187, 12–25. [Google Scholar]
- Ahmed, N.A. Vertical extrapolation of wind speeds for turbine optimization. Energy Convers. Manag. 2019, 198, 111935. [Google Scholar]
- Bailey, B.H.; McDonald Scott, L.; Bernadett Daniel, W.; Markus Michael, J.; Elsholz Kurt, V. Wind Resource Assessment Handbook; National Renewable Energy Lab (NREL): Golden, CO, USA, 1997. [Google Scholar]
- Ackermann, T. (Ed.) Wind Power in Power Systems; John Wiley & Sons: Hoboken, NJ, USA, 2012. [Google Scholar]
- Brower, M. Wind Resource Assessment: A Practical Guide; John Wiley & Sons: Hoboken, NJ, USA, 2012. [Google Scholar]
- IPCC. Renewable Energy Sources and Climate Change Mitigation; Cambridge University Press: Cambridge, UK, 2011. [Google Scholar]
- Liu, X.; Wang, W.; Nielsen, C.P.; McElroy, M.B. China’s wind power development: Achievements and challenges. Appl. Energy 2019, 242, 45–58. [Google Scholar]
- Mentis, D.; Hermann, S.; Howells, M.; Welsch, M.; Siyal, S.H. A GIS-based approach for wind energy in Africa. Renew. Sustain. Energy Rev. 2015, 44, 12–24. [Google Scholar]
- Global Wind Energy Council (GWEC). Africa Wind Energy Outlook; Global Wind Energy Council (GWEC): Brussels, Belgium, 2022. [Google Scholar]
- International Renewable Energy Agency (IRENA). Renewable Energy Market Analysis: East Africa; International Renewable Energy Agency (IRENA): Abu Dhabi, United Arab Emirates, 2023. [Google Scholar]
- Agbetuyi, A.F.; Odigwe, I.A.; Awelewa, A.A.; Awosope, C.O.A. Wind power potential and integration in Africa. Int. J. Dev. Sustain. 2013, 2, 232–239. [Google Scholar]
- Seguro, J.V.; Lambert, T.W. Estimation of wind speed parameters. Renew. Energy 2000, 21, 339–361. [Google Scholar]
- Manwell, J.F.; McGowan, J.G.; Rogers, A.L. Wind Energy Explained: Theory and Design; John Wiley & Sons: Hoboken, NJ, USA, 2010. [Google Scholar]
- Ethiopian Electric Power (EEP). Annual Progress Report of Wind Power Projects; Ethiopian Electric Power (EEP): Addis Ababa, Ethiopia, 2023. [Google Scholar]
- Gebreslassie, M.G. Ethiopia’s renewable energy potential: A review. Energy Strategy Rev. 2021, 34, 100718. [Google Scholar]
- Gudoshava, M.; Semazzi, F. Sensitivity of Wind Energy Potential Analysis over East Africa to Land Cover Change. In Proceedings of the 96th American Meteorological Society Annual Meeting, New Orleans, LA, USA, 10–14 January 2016; Volume 96, p. 515. [Google Scholar]
- Feleke, S.; Satish, R.; Pydi, B.; Anteneh, D.; Abdelaziz, A.Y.; El-Shahat, A. Damping of Frequency and Power System Oscillations with DFIG Wind Turbine and DE Optimization. Sustainability 2023, 15, 4751. [Google Scholar] [CrossRef] [Scilit]
- Mentis, D.; Hermann, S.; Howells, M.; Welsch, M.; Siyal, S.H. Assessing wind energy potential in Africa. Renew. Sustain. Energy Rev. 2015, 44, 152–164. [Google Scholar]
- Bekele, G.; Palm, B. Wind energy potential at four locations in Ethiopia. Appl. Energy 2009, 86, 388–396. [Google Scholar] [CrossRef] [Scilit]
- Archer, C.L.; Jacobson, M.Z. Evaluation of global wind power. J. Geophys. Res. 2015, 110, D12103. [Google Scholar] [CrossRef] [Scilit]
- Ethiopian Electric Power (EEP). Grid Transmission Infrastructure Map and Wind Integration; Ethiopian Electric Power (EEP): Addis Ababa, Ethiopia, 2023. [Google Scholar]
- Lazard. Levelized Cost of Energy Analysis—Version 17.0; Lazard: New York, NY, USA, 2024. [Google Scholar]
- Belay, T. Hybrid Wind-Solar Systems for Rural Electrification in Ethiopia. Afr. J. Sci. Technol. 2023, 14, 55–72. [Google Scholar]
- Burton, T.; Jenkins, N.; Bossanyi, E.; Sharpe, D. Wind Energy Handbook; John Wiley & Sons: Hoboken, NJ, USA, 2011. [Google Scholar]
- Bañuelos-Ruedas, F.; Ángeles Camacho, C.; Rios-Marcuello, S. Extrapolation of wind speed at different heights. Wind Farm Siting 2011, 97, 114–128. [Google Scholar]
- Lake Turkana Wind Power Project. Project Impact Report; Lake Turkana Wind Power Project: Nairobi, Kenya, 2022. [Google Scholar]
- Global Wind Energy Council (GWEC). Global Wind Report 2019: Annual Market Update; Global Wind Energy Council (GWEC): Brussels, Belgium, 2020. [Google Scholar]
- International Energy Agency (IEA). Net Zero by 2050: A Roadmap for the Global Energy Sector; International Energy Agency (IEA): Paris, France, 2021. [Google Scholar]
- Ministry of Water and Energy (MoWE). Strategic Plan for Renewable Energy Diversification; Ministry of Water and Energy (MoWE): Addis Ababa, Ethiopia, 2023. [Google Scholar]
- Bekele, G.; Tsegaye, S.; Shewarega, F. Economic assessment of grid-connected wind power in Ethiopia. Energy Strategy Rev. 2023, 45, 100987. [Google Scholar]
- Somali Regional State Bureau of Energy. Opportunities for Wind Power in the Somali Region; Somali Regional State Bureau of Energy: Jijiga, Ethiopia, 2024. [Google Scholar]
- Ahmed, N.A.; Ali, A.M.; Mohammed, A.A. Techno-economic analysis of off-grid wind systems in Oromia. Sustainability 2022, 14, 4567. [Google Scholar]
- Mentis, D.; Hermann, S.; Howells, M.; Welsch, M.; Siyal, S.H. A GIS-based energy resource assessment of wind power in Africa. Renew. Energy 2017, 101, 15–28. [Google Scholar]
- International Energy Agency (IEA). Global Energy Review: Renewable Integration; International Energy Agency (IEA): Paris, France, 2024. [Google Scholar]
- Elgammal, A.A.; El-Naggar, M.F.; Abdel-Rahman, M.H. Adaptive blade designs for low-wind-speed turbines. Energies 2022, 15, 852. [Google Scholar]
- IPCC. Climate Change 2023: Synthesis Report. In Contribution of Working Groups to the Sixth Assessment Report; IPCC: Geneva, Switzerland, 2023. [Google Scholar]
- Mignacca, B.; Locatelli, G. Economics and finance of Small Modular Reactors: A systematic review and research agenda. Renew. Sustain. Energy Rev. 2020, 118, 109519. [Google Scholar] [CrossRef] [Scilit]
- Ethiopian Electric Power (EEP). Ethiopian Energy Outlook; Ethiopian Electric Power (EEP): Addis Ababa, Ethiopia, 2025; Available online: https://www.ea-energianalyse.dk/wp-content/uploads/2025/06/Ethiopian-Energy-Outlook-2025.pdf (accessed on 15 May 2025).
- Ethiopian Power System Expansion Master Plan Study—Vol. II Generation Planning Report; East Africa Energy Program (EAEP): Addis Ababa, Ethiopia, 2021.

Disclaimer/Publisher’s Note: The statements, opinions and data contained in all publications are solely those of the individual author(s) and contributor(s) and not of MDPI and/or the editor(s). MDPI and/or the editor(s) disclaim responsibility for any injury to people or property resulting from any ideas, methods, instructions or products referred to in the content. |
© 2026 by the authors. Licensee MDPI, Basel, Switzerland. This article is an open access article distributed under the terms and conditions of the Creative Commons Attribution (CC BY) license.