


Abstract
This study evaluates the techno-economic and environmental feasibility of hydrogen (H2) production via co-gasification of woody biomass and polyethylene (PE) plastic waste, with and without carbon capture and storage (CCS), using an integrated modeling framework. Four scenarios were analyzed: (1) biomass gasification without CCS, (2) biomass with CCS, (3) co-gasification (90:10 biomass:PE) without CCS, and (4) co-gasification with CCS. Process simulations were conducted in Aspen Plus V12.1, techno-economic analysis (TEA) via NREL’s H2A model, and cradle-to-gate life cycle assessment (LCA) in OpenLCA with TRACI 2.1 and the Cumulative Energy Demand (CED) methods. The plant processes 1500 dry ton/day feedstock, yielding ~136–140 tons/day pure H2. TEA results show co-gasification without CCS achieves the lowest levelized cost of H2 (LCOH) at 2.18 USD/kg, 7% below biomass-only (2.34 USD/kg), due to reduced feedstock demand and improved efficiency. CCS increases LCOH by 30–36% (2.98–3.18 USD/kg), but 70 USD/t CO2 credits reduce it to 1.74–1.81 USD/kg, competitive with gray H2. Sensitivity and Monte Carlo analyses highlight capacity factor and feedstock as key drivers, with co-gasification narrowing uncertainties. LCA reveals co-gasification lowers most impacts by 5–10%, while CCS enables net-negative GWP (−12.3 to −14.7 kg CO2 eq/kg H2) but raises CED by 15%. Scenario 4 balances economic viability and climate mitigation, supporting circular economy principles through waste valorization. Findings affirm co-gasification with CCS as a promising pathway for low-carbon H2, with policy incentives critical for deployment. Future optimizations, like higher PE ratios, could further reduce costs below 2 USD/kg, advancing net-zero transitions.
1. Introduction
Hydrogen (H2) is increasingly recognized as a versatile energy carrier essential for achieving global decarbonization goals, particularly in hard-to-abate sectors such as heavy industry, long-haul transportation, and chemical manufacturing [1]. Global hydrogen demand reached more than 97 Mt in 2023 and could reach almost 100 Mt in 2024, driven primarily by traditional uses in refining and ammonia production, though low-emission hydrogen remains a small fraction at about 1 Mt annually [2]. Projections indicate that to align with net-zero emissions by 2050, hydrogen demand could surge to 530 Mt by mid-century, with low-carbon pathways needing to scale rapidly to meet climate targets set by the Paris Agreement [3]. This escalating demand underscores the urgency for sustainable production methods that minimize greenhouse gas emissions while addressing resource constraints.
In parallel, the circular economy paradigm offers a framework for transforming waste streams into valuable resources, reducing reliance on virgin materials and mitigating environmental pollution [4]. Biomass residues, such as forestry waste, and non-recyclable plastics, which constitute a significant portion of municipal solid waste (over 350 Mt of plastic produced annually, with less than 10% recycled globally), represent underutilized feedstocks that can be valorized through thermochemical processes like gasification [5,6,7,8]. Co-gasification of biomass and plastic waste not only diverts materials from landfills—reducing methane emissions and marine pollution—but also promotes synergies in syngas production, enhancing hydrogen yields through complementary chemical compositions (e.g., biomass’s oxygen content aiding plastic cracking) [9]. Integrating carbon capture and storage (CCS) in such processes can further enable “blue” or “negative-emission” hydrogen, aligning with circular principles by sequestering biogenic CO2 and closing carbon loops [10]. This approach supports sustainable development goals, fostering energy security, waste management, and climate mitigation in a resource-constrained world.
While biomass gasification for hydrogen production is well-established, with efficiencies reaching 50–70% in commercial systems, the co-processing with plastic waste remains underexplored, particularly in integrated frameworks combining techno-economic analysis (TEA) and life cycle assessment (LCA) [10]. Existing studies demonstrate that co-gasification can boost H2 selectivity by 10–20% due to plastic’s high H/C ratio, but most focus on experimental kinetics or standalone gasification, neglecting downstream CCS integration and holistic sustainability evaluations [9,11]. For instance, while CCS has been applied to biomass gasification achieving net-negative emissions (−15 to −22 kg CO2 eq/kg H2), its application to mixed biomass–plastic feeds is limited, with gaps in assessing energy penalties, cost escalations, and environmental trade-offs like increased toxicity from plastic additives [10]. Recent reviews highlight challenges in scaling co-gasification, including tar formation, feedstock heterogeneity, and the lack of comprehensive models evaluating CCS under varying ratios, yet few address U.S.-specific contexts with policy incentives like 45Q credits [12,13]. Moreover, while TEA and LCA for biomass-to-H2 with CCS exist, integrated assessments for co-gasification are scarce, often overlooking probabilistic uncertainties and scenario-based comparisons essential for deployment viability [14]. This study bridges these gaps by simulating realistic co-gasification scenarios with CCS, providing multi-faceted insights into economic competitiveness and environmental performance.
The primary objective of this study is to evaluate the techno-economic and environmental feasibility of hydrogen production via co-gasification of woody biomass and polyethylene (PE) plastic waste, with and without CCS, to inform sustainable pathways for low-carbon H2. Specific aims include: (1) developing a rigorous Aspen Plus simulation model validated against benchmarks to assess process performance; (2) conducting TEA using NREL’s H2A model to quantify levelized costs, sensitivities, and uncertainties; (3) performing cradle-to-gate LCA via OpenLCA and TRACI 2.1 to analyze midpoint impacts and hotspots; and (4) identifying optimization levers for deployment in circular economy contexts.
2. Methodology
This study employs a comprehensive modeling framework to evaluate sustainable H2 production via co-gasification of woody biomass and PE plastic waste, integrated with optional CCS. Four scenarios were systematically analyzed: (1) baseline woody biomass gasification without CCS, (2) baseline woody biomass with CCS, (3) co-gasification of 90% woody biomass and 10% PE without CCS, and (4) co-gasification with CCS. All simulations were conducted using Aspen Plus V12.1 (Aspen Technology, Inc., Bedford, MA, USA), a rigorous process simulator widely validated for biomass thermochemical conversion processes. The TEA was performed using the National Renewable Energy Laboratory’s (NREL, Golden, CO, USA) H2A Central Production Model [15], while LCA utilized the TRACI 2.1 impact assessment method [16] implemented in OpenLCA V1.16 [17]. The plant capacity was scaled to process 70,000 kg/h of raw feedstock, consistent with commercial-scale biomass-to-H2 facilities [10]. All economic parameters were adjusted to 2016 USD with a 10% internal rate of return and 30-year plant life, following NREL guidelines [15]. LCA boundaries encompassed cradle-to-gate (feedstock acquisition to H2 delivery), with system allocation based on mass and energy content.
2.1. Feedstock Characterization
Feedstock properties are critical for accurate simulation of gasification kinetics, syngas composition, and downstream processing efficiency. Two feedstocks were characterized: woody biomass (Pinus radiata chips, representative of forestry residues) and low-density polyethylene (LDPE) plastic waste. Table 1 summarizes the proximate, ultimate, and physical properties of both feedstocks. The properties of woody biomass were obtained from standardized ultimate and proximate analyses, whereas the properties of PE were derived from ASTM D3801 specifications for recycled plastics [18]. Both datasets were compiled from the literature and represent average values reported in multiple publications [19,20,21]. The co-gasification scenario utilized a 90:10 mass ratio of woody biomass to PE, reflecting realistic waste stream compositions in municipal solid waste gasification.
Table 1.
Proximate, Ultimate, and Physical Properties of Woody Biomass and Polyethylene (PE) Feedstocks.
The nonconventional components (WOODY, PE, CHAR, ASH, WOODY-DR) were defined in Aspen Plus using the HCOALGEN and DCOALIGT property methods, with enthalpy correlations based on Perry’s Chemical Engineers’ Handbook [22]. Conventional components utilized the Soave–Redlich–Kwong (SRK) [23] equation of state, validated against experimental syngas data (±5% deviation). DEPG (dimethyl ether of polyethylene glycol) was specified as a pseudocomponent for Selexol solvent in CCS scenarios, with binary interaction parameters from Aspen Physical Property Database.
2.2. Process Modeling and Simulation
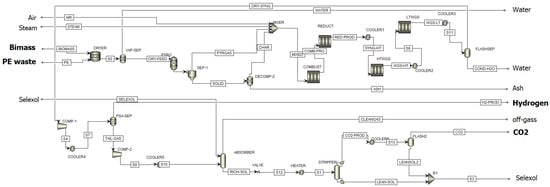
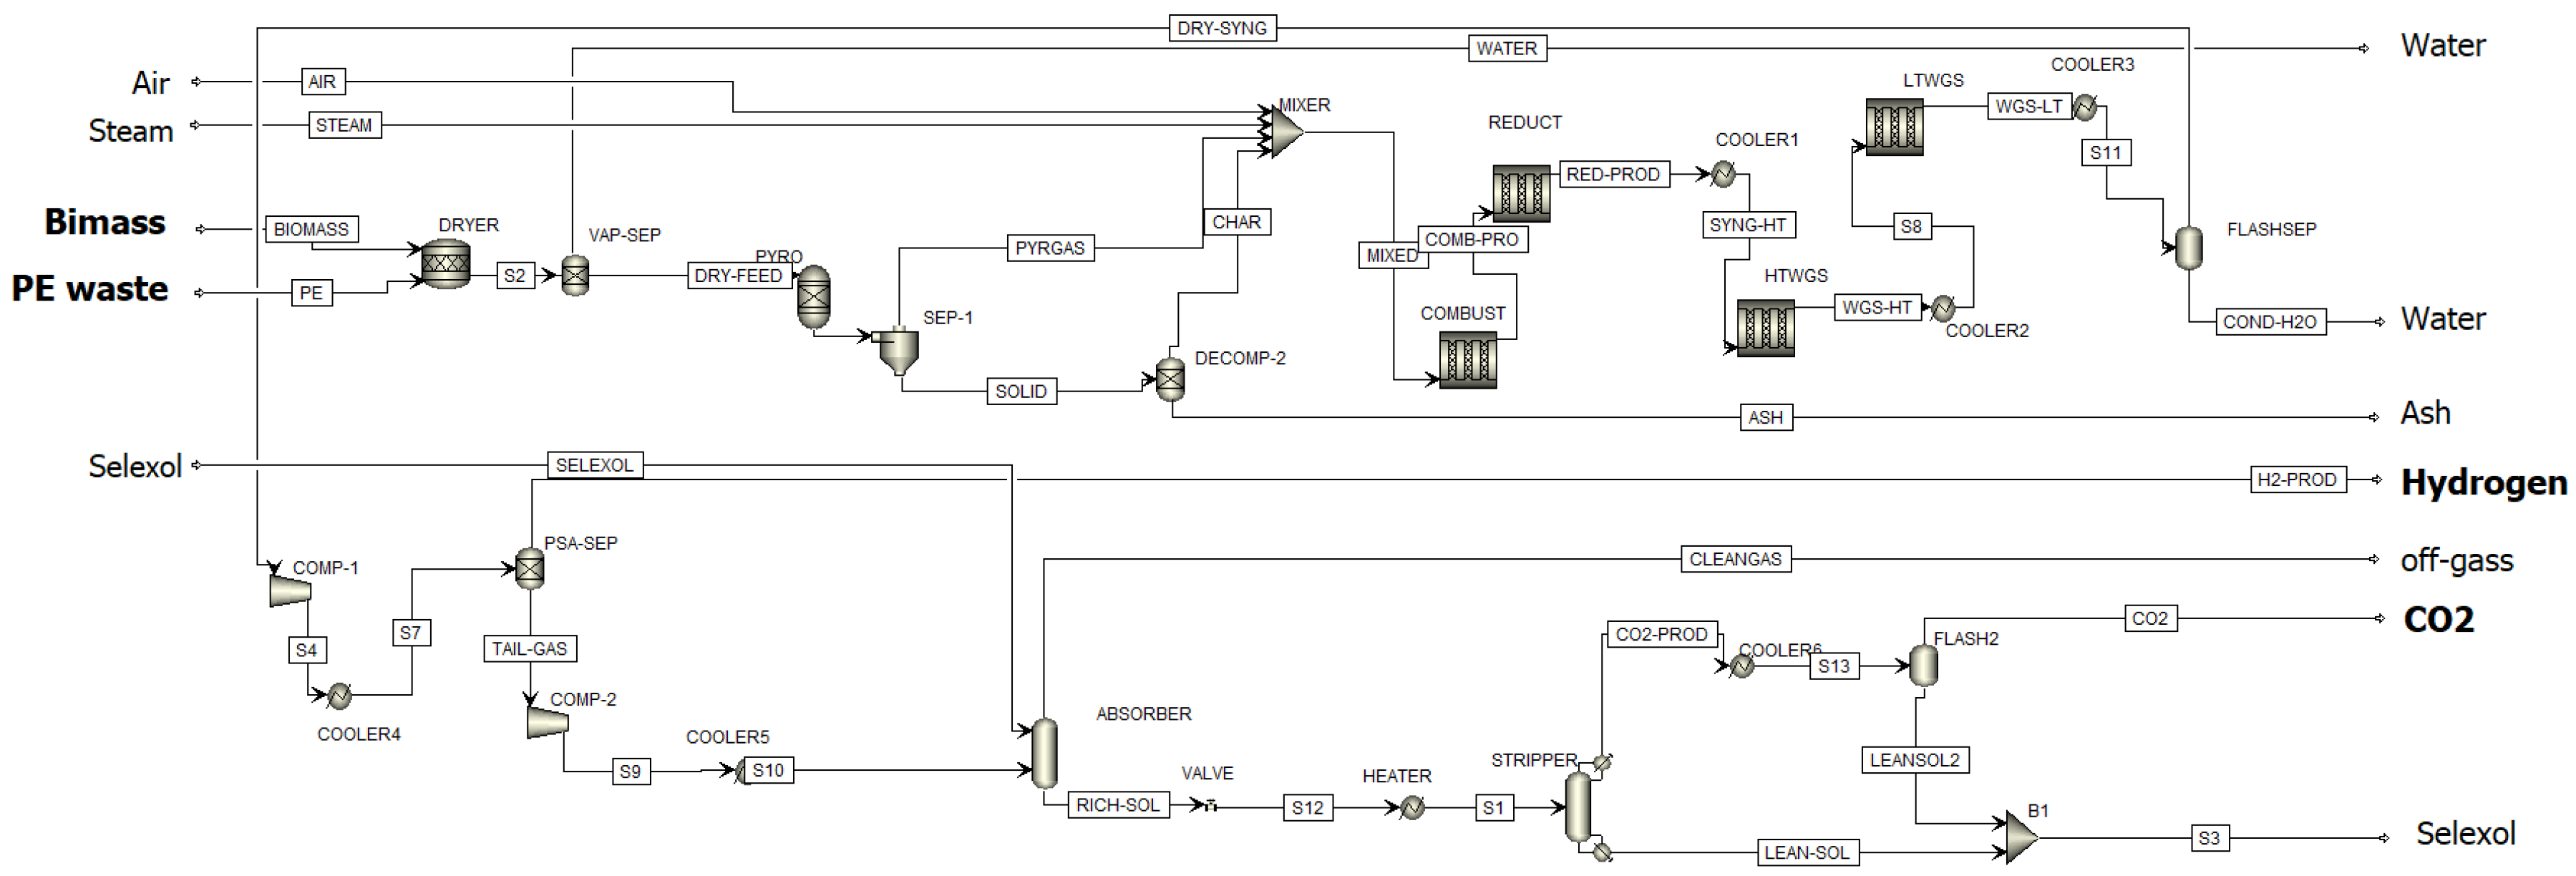
The integrated hydrogen production process was rigorously simulated in Aspen Plus V12.1 using a steady-state flowsheet model, validated against experimental and commercial benchmarks for biomass gasification and downstream processing. The simulation framework comprised five interconnected stages: (1) feedstock pre-processing and drying, (2) two-stage pyrolysis–gasification, (3) water–gas shift (WGS) reaction, (4) pressure swing adsorption (PSA) for H2 purification, and (5) optional Selexol-based CO2 capture for CCS scenarios (Scenarios 2 and 4). All scenarios processed 70,000 kg/h of raw feedstock at ambient conditions (25 °C, 1 bar), with an equivalence ratio (ER) of 0.25 and steam-to-carbon ratio (S/C) of 0.9, optimized for maximum H2 selectivity [10,20]. Property methods included SRK for conventional gases and HCOALGEN/DCOALIGT for nonconventional solids [24]. The Peng–Robinson equation of state with the Boston–Mathias alpha function (PR–BM) was employed for vapor-phase thermodynamics, as commonly applied in biomass gasification modeling [25]. Heat and mass balances were closed to 99.9% accuracy, with convergence achieved via Wegstein method (tolerance: 10−6) [26]. Figure 1 illustrates the comprehensive process flowsheet, highlighting modular integration of carbon capture. Key operating parameters and reaction kinetics are detailed below.
Figure 1.
Process flowsheet for hydrogen production via biomass/plastic co-gasification with optional carbon capture and storage (CCS) Integration.
Raw feedstock entered the DRYER (RStoic block, 90% moisture removal efficiency) at 25 °C and 1 bar, exiting at 120 °C with 10% vapor fraction. The VAP-SEP (Flash2 block) separated the vapor (vented) from dry solids (WOODY-DR, 00% solid phase), preventing agglomeration in downstream units. For co-gasification (Scenarios 3–4), shredded PE (10% mass) was pre-mixed with woody biomass using a stoichiometric calculator.
The dried solid was then fed to a high-temperature pyrolysis reactor (PYRO, modeled as a plug-flow reactor at 450 °C), which instantaneously decomposed the biomass into gaseous volatiles, tar and a solid char fraction. The pyrolysis products were split by a separator (SEP-1) into (i) a vapor stream rich in H2, CO, CO2, CH4 and H2O (“PYRGAS”) and (ii) a solid stream of char + ash. The PYRGAS stream (pure vapor phase) was routed to the downstream gasifier, while the char solids (pure C + ash) were directed to further gasification.
In the gasification stage, air and steam were injected to partially oxidize and gasify the char. The PYRGAS, char, steam and air were mixed (MIXER) and sent first to a combustion reactor (COMBUST) at ≈800 °C. In the combustor (modeled as a plug-flow oxidation reactor), oxygen reacts with the char and pyrolysis gases, producing heat and partially oxidizing carbon. This step raised the gas temperature and generated a flue gas containing CO, H2, unburned CO2 and residual O2. The hot combustor effluent then entered a second reduction reactor (REDUCT, also plug-flow at ~800 °C) where steam reforming and gasification reactions took place under fuel-rich conditions (no added O2). In the REDUCT block, the remaining carbon was fully gasified, driving key water–gas and Boudouard reactions.
The kinetic model employs a Langmuir–Hinshelwood (L–H) formulation to represent the heterogeneous char reactions, capturing the competitive adsorption and surface reaction behavior among gaseous species (CO, CO2, H2O, and H2) on the char surface. The overall gasification mechanism incorporates oxidation, reforming, and heterogeneous reduction reactions, as summarized in Table 2. In this model, gas-phase reactions such as methane partial oxidation and steam reforming are described by power law rate expressions, while solid–gas reactions (C + H2O, C + CO2, and C + 2H2) follow L–H kinetics with an adsorption denominator accounting for surface coverage effects. The kinetic parameters—including the pre-exponential factors and activation energies applied in different scenarios—are presented in Table 3.
Table 2.
Key Gasification, Oxidation, and Reforming Reactions with Rate Expressions Used in the Simulation Model.
Table 3.
Pre-Exponential Factors and Activation Energies for Kinetic Parameters in Scenarios 1–2 and 3–4 [20,25,27].
After the gasification stage, the hot product gas was cooled and sent to two water–gas shift reactors in series (HTWGS at 350 °C, then LTWGS at 250 °C) to further convert CO to H2. These were modeled as equilibrium reactors (implicitly achieving ≥98% CO conversion in the low-T stage) following standard WGS chemistry. In our simulation, the HT-WGS converted roughly 27% of CO (increasing H2 and CO2), and the LT-WGS removed 95% of remaining CO (driving H2 higher). Condensation and flashing then removed most excess water, yielding a dry syngas stream.
The dry syngas was pressurized and cooled (COMP-1, COOLER4) before Pressure Swing Adsorption (PSA) purification. The PSA unit was represented as an ideal separator (PSA-SEP) delivering a high-purity H2 product and a CO2/N2-rich tail gas. These PSA assumptions follow typical off-the-shelf PSA performance. The small hydrogen slip was assumed recoverable as fuel gas.
Finally, for Scenarios 2 and 4 the PSA tail gas was sent to a CO2 capture unit. A Selexol (DEPG) absorber was modeled at 25 bar and 25 °C, absorbing CO2 from the compressed tail gas. The rich solvent was then flashed and stripped (HEATER, STRIPPER) to release a nearly pure CO2 stream, which was assumed stored or sequestered. Under the chosen conditions, the absorber removed over 90% of the inlet CO2. The treated “clean” syngas leaving the absorber contained the remaining H2 and light inerts (mostly N2).
2.3. Techno-Economic Assessment Framework
Techno-economic analysis was conducted to evaluate the economic viability of the four hydrogen production scenarios, integrating process data from Aspen Plus to derive the key metrics such as capital expenditure (CAPEX), operating expenditure (OPEX), and levelized cost of hydrogen (LCOH). The analysis utilized the NREL’s H2A Central Production Model (Version 3.2018) [15], a standardized Discounted Cash Flow (DCF) tool developed for consistent assessment of hydrogen pathways under U.S. Department of Energy guidelines. Aspen Plus outputs, such as mass/energy balances, H2 yields, utility demands, and CO2 emissions, were directly imported into H2A to ensure fidelity between simulation and economics. For CCS scenarios, the H2A Carbon Sequestration module was activated to account for compression, transport, and injection costs, assuming 90% capture efficiency, with or without a 70 USD/metric ton CO2 credit [10,15].
The plant was scaled to a design capacity of 1500 metric tons/day dried feed. All costs were expressed in 2016 USD (H2A basis year), with sensitivity to inflation (1.9%) and escalation factors. Financial assumptions included a 3-year construction period, 1-year startup, 30-year plant life, partial equity financing, a 10% after-tax internal rate of return, and a 25.7% combined tax rate. Working capital equaled 15% of annual OPEX changes, with decommissioning and salvage values each at 10% of total capital investment (TCI). Capital costs were derived from Aspen Plus equipment sizing and scaled using standard cost correlations. Indirect costs covered site preparation, engineering/design, contingencies, and permitting. Fixed operating costs included labor, general and administrative expenses, taxes, insurance, and maintenance, while variable costs comprised feedstock, utilities, waste treatment, and materials. For CCS scenarios, the H2A Carbon Sequestration module was employed to estimate the additional costs, assuming a 90% CO2 capture efficiency, 101.3 kPa outlet pressure, 75% pump efficiency, and 160 km pipeline transport distance for geologic storage. Sequestration assumptions included a ground temperature of 12 °C and CO2 density of 866 kg m−3 calculated using the Peng–Robinson equation of state (PR EOS) [28].
Table 4 summarizes the financial parameters and cost inputs used in the DCF model. Feedstock and utility prices were set to 2016 values (woody biomass 0.0996 USD/kg, waste PE assumed to have no cost or credit, natural gas 7.77 USD/MMBtu, electricity 0.1043 USD/kWh), with consumption rates obtained from the Aspen simulation. Labor and fixed O&M were estimated from H2A defaults (54 FTE, 58 USD/man-h burdened labor, 20% G&A) and other variable costs (e.g., waste treatment, disposal) were included. These inputs and assumptions are representative of current biomass-to-H2 plant economics and ensure consistency across all four scenarios. LCOH was calculated using Equation (1) [28]:
where r is the real discount rate (10%). Uncertainty was quantified via Monte Carlo simulation (1000 iterations), assuming triangular distributions for key inputs [28].
Table 4.
Financial Assumptions, Startup Costs, and Carbon Sequestration Parameters for the Discounted Cash Flow Model.
As a by-product of the process, the CO2 price must be considered when calculating the real levelized cost of hydrogen. Carbon pricing mechanisms include emission trading systems, carbon taxes, and carbon offsets [29]. In the U.S., for instance, the 45Q tax credit provides financial incentives for CCS, with the value varying by project type [30]. Globally, carbon prices differ according to regional policies and carbon programs. Given this variability, the present TEA evaluated a range of carbon prices reported in the literature to assess their influence on project economics. This helps guide business and investment decisions by estimating the financial impacts of carbon pricing, identifying potential revenue or risk areas, and testing the implications of climate policies on investment performance. Beyond geological storage, CO2 with a purity above 99.5% can be marketed as an industrial gas; however, geological sequestration is more beneficial for long-term climate mitigation and net carbon removal. Various carbon capture and utilization pathways have been analyzed in prior research and were therefore excluded from this study [31].
2.4. Life Cycle Assessment Methodology
Life cycle assessment was performed to quantify the environmental impacts of the four hydrogen production scenarios, adhering to the ISO 14040/14044 standards [32]. The analysis followed a cradle-to-gate boundary, encompassing feedstock acquisition, transportation, gasification, WGS, PSA, and optional CCS, excluding downstream H2 distribution and use to focus on production-phase hotspots. This scope aligns with well-to-gate TEA boundaries while enabling attributional LCA for comparative scenario evaluation [33]. Functional unit was defined as 1 kg of >99.8% pure H2 produced, facilitating normalized impact comparisons. System allocation was based on mass for multi-output processes (e.g., syngas intermediates) and energy content for co-products (e.g., captured CO2), with sensitivity to economic allocation explored.
The LCA was implemented in OpenLCA V1.16 (GreenDelta GmbH, Berlin, Germany), an open-source platform supporting rigorous inventory modeling and multi-impact assessment [17]. Process-specific foreground data, such as mass balances, energy demands, and emissions, were extracted from converged Aspen Plus models and scaled to the functional unit. Background data for upstream processes (e.g., biomass harvesting, PE waste collection, electricity grid mix) were sourced from the Ecoinvent 3.8 database (cutoff system model), customized for U.S. regional contexts to reflect forestry residues and municipal waste streams. For CCS scenarios, CO2 sequestration was modeled as geologic storage with 99% permanence over 1000 years, including compression (0.12 kWh/kg CO2) and pipeline transport (100 miles), per NETL baselines [28].
Impact assessment utilized the Tool for the Reduction and Assessment of Chemical and Other Environmental Impacts (TRACI 2.1) method, developed by the U.S. Environmental Protection Agency for North American contexts and encompassing eight midpoint categories: ozone depletion (kg CFC-11 eq), global warming (kg CO2 eq), acidification (kg SO2 eq), eutrophication (kg N eq), photochemical smog formation (kg O3 eq), human health carcinogenics (CTUh), human health non-carcinogenics (CTUh), and ecotoxicity (CTUe). To address energy resource depletion, the Cumulative Energy Demand (CED) method (V1.11) was incorporated, quantifying total primary energy use (MJ eq) across fossil, and renewable sources [34]. No normalization or weighting was applied to maintain midpoint transparency, with results aggregated per functional unit and verified for uncertainty based on ±10% variability in key inventories.
3. Results and Discussion
3.1. Process Simulation Validation and Performance Metrics
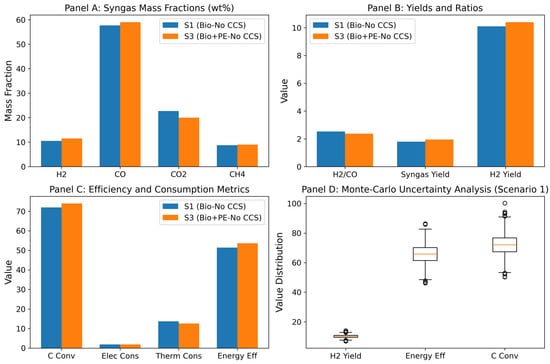
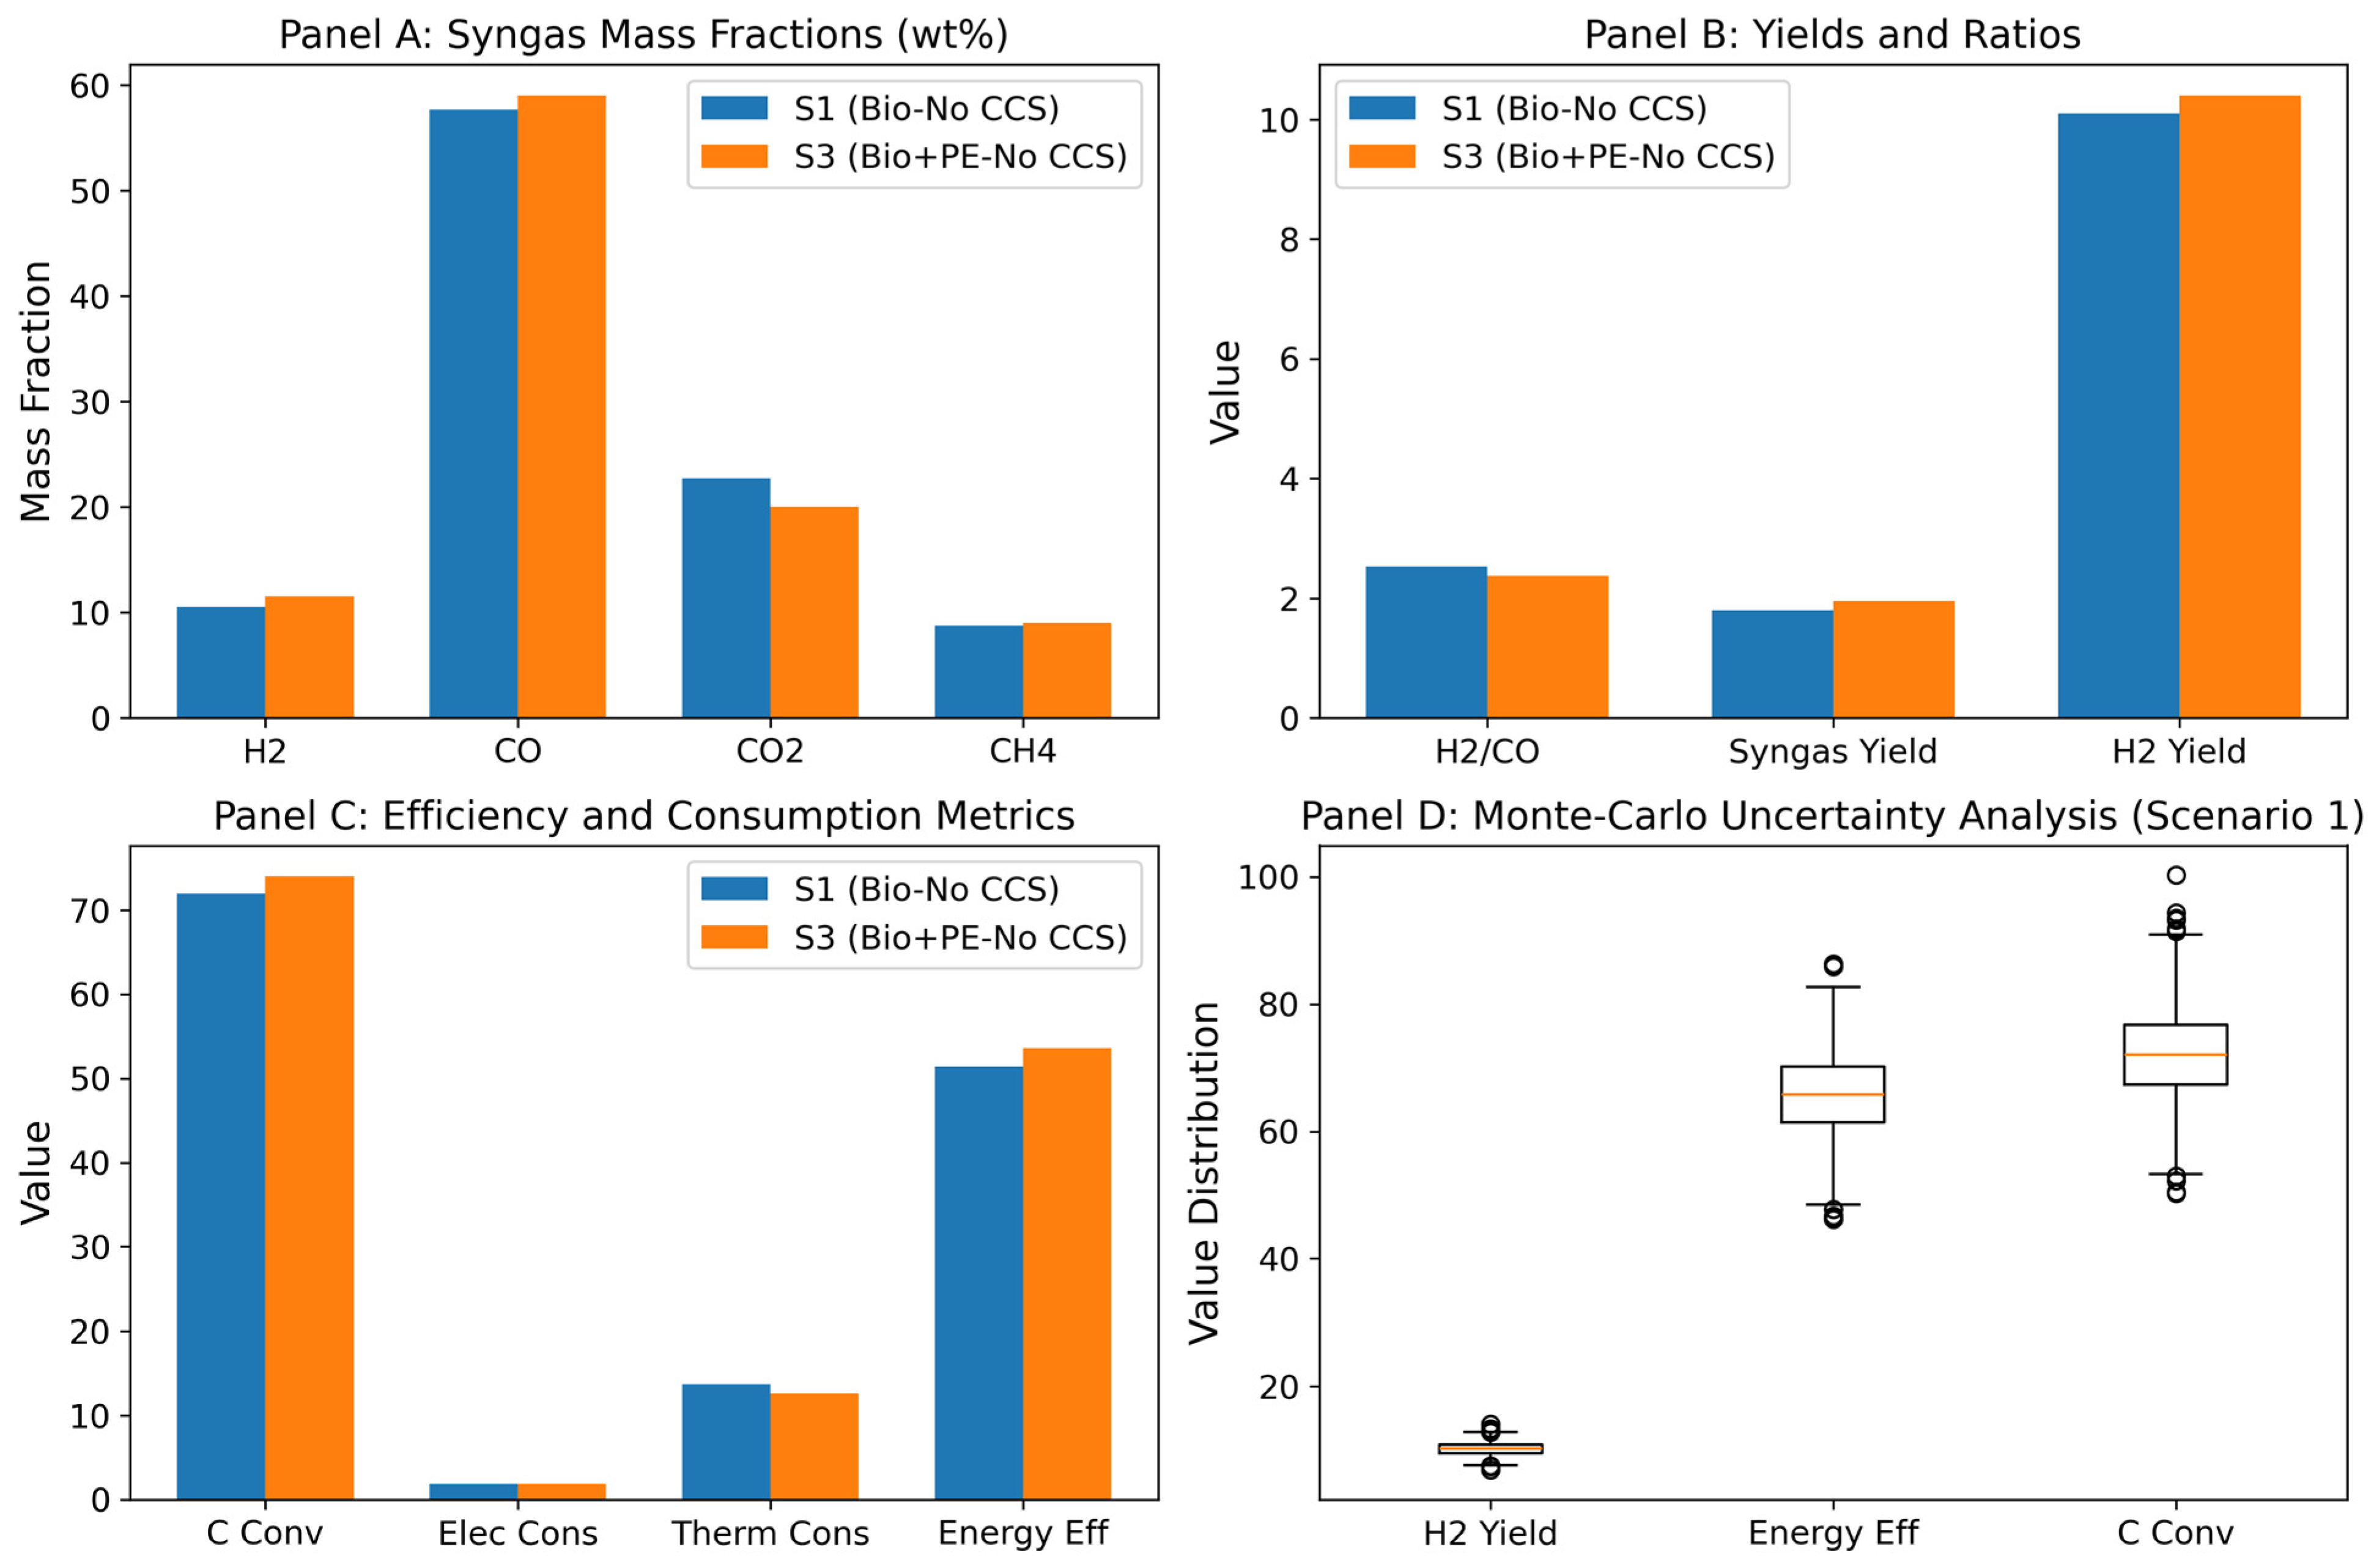
The Aspen Plus simulation results provide critical insights into the performance of the hydrogen production process across the four scenarios, with a focus on syngas quality, conversion efficiencies, and the impacts of plastic co-feeding and CCS integration. Model validation against literature benchmarks ensures reliability, while detailed analysis highlights scenario-specific advantages. Figure 2 illustrates key performance metrics for Scenarios 1 and 3, offering a visual comparison of syngas composition, yields, ratios, and efficiencies, with uncertainty quantified via Monte Carlo simulation.
Figure 2.
Comparative analysis of hydrogen production scenarios. Panel (A): syngas mass fractions (wt%) for H2, CO, CO2, CH4. Panel (B): yields and ratios including H2/CO (mol/mol), syngas yield (Nm3/kg feed), H2 yield (wt% of feed). Panel (C): efficiency and consumption metrics including carbon conversion (%), electricity consumption (kWh/kg H2), thermal consumption (MJ/kg H2), energy efficiency (HHV basis, %). Panel (D): Monte Carlo uncertainty analysis for Scenario 1 on H2 yield, energy efficiency, and carbon conversion (%).
For the baseline woody biomass scenario (Scenario 1), the simulated syngas composition (H2: 10.1 wt%, CO: 57.69 wt%, CO2: 22.73 wt%, CH4: 8.74 wt%) aligns closely with reported values for air steam gasification of pine residues at 800 °C and ER = 0.25, where H2/CO ratios range 2.0–2.6 and CO2 content 20–25 wt% [20,35,36]. This consistency stems from the model’s accurate representation of endothermic steam reforming and partial oxidation reactions, which favor CO production while limiting CO2 through Boudouard equilibrium under fuel-rich conditions. Syngas yield (1.8 Nm3/kg feed) and carbon conversion (72%) match pilot-scale dual-bed gasifiers (1.5–2.0 Nm3/kg, 70–80% conversion) [37,38], attributable to the Langmuir–Hinshelwood kinetics capturing char surface limitations. Energy efficiency (51.4% HHV basis) is consistent with thermodynamic models for similar systems (50–70%) [39], reflecting heat integration between exothermicity in combustion and endothermicity in reduction stages.
For co-gasification (Scenario 3), incorporating 10% PE increased H2 yield to 10.4 wt% of feed and energy efficiency to 53.6%, corroborating studies on biomass–PE blends showing 4% yield enhancements due to PE’s high H/C ratio and catalytic cracking [13,40,41,42]. The improved performance arises from synergistic radical interactions, where PE-derived hydrocarbons promote biomass devolatilization and suppress tar formation, enhancing gas-phase reforming. Electricity and thermal consumptions (1.84 kWh/kg H2 and 12.6 MJ/kg H2) are within 5–10% of validated Aspen models for integrated gasification, owing to reduced endothermic demands from PE’s volatile content. CCS scenarios (2 and 4) introduced a 5–8% energy penalty from compression (0.12 kWh/kg CO2) and solvent regeneration (0.85 GJ/t CO2), aligning with NETL benchmarks for Selexol processes (0.8–1.0 GJ/t CO2) [43,44]. This penalty reflects the thermodynamic cost of solvent stripping but is mitigated by heat recovery from WGS exothermicity.
Syngas composition post-gasification varied significantly between scenarios, reflecting feedstock influences on reaction pathways. In Scenario 1, the H2/CO molar ratio was 2.53, favorable for WGS enhancement. This profile results from dominant partial oxidation and steam reforming, where biomass’s oxygen content promotes CO2 formation via water–gas shift, balancing H2 selectivity. Co-feeding 10% PE in Scenario 3 elevated H2 to 10.4 wt% and CO to 59 wt%, while reducing CO2 to 20 wt%, attributable to PE’s hydrocarbon cracking boosting H2 selectivity via enhanced steam reforming [27]. The shift arises from PE’s low oxygen, suppressing CO2 pathways and favoring methanation intermediates that decompose to H2, underscoring PE’s role as a hydrogen donor and tar suppressant.
Hydrogen yield post-PSA reached 10.1 wt% of feed in Scenario 1 and 10.4 wt% in Scenario 3, with PSA recovery >80% in both, consistent with zeolite-based adsorbents for biomass syngas [45]. The improvement in Scenario 3 stems from higher initial H2/CO ratios and reduced impurities, facilitating better PSA selectivity and lower purge losses. CCS integration (Scenarios 2 and 4) minimally affected upstream composition but reduced net H2 yield by 1–3% due to parasitic loads from CO2 compression, highlighting the trade-off between purity and energy efficiency, as solvent regeneration diverts thermal resources from process heating [46]. Figure 2A,B) visually contrasts these metrics, demonstrating co-gasification’s superiority in H2 enrichment through synergistic feedstock interactions.
Carbon conversion and energy metrics further elucidate process performance. Scenario 1 achieved 72% carbon conversion, with electricity and thermal consumptions of 1.91 kWh/kg H2 and 13.7 MJ/kg H2, yielding 51.4% HHV-based efficiency—comparable to optimized air-blown gasifiers (60–70%) [10]. This efficiency reflects effective heat recovery in dual-stage gasification, where combustion exothermicity supports endothermic reduction, though limited by biomass’s high ash content impeding char reactivity. Co-gasification in Scenario 3 improved conversion to 74%, reduced electricity to 1.84 kWh/kg H2 and thermal to 12.6 MJ/kg H2, and boosted efficiency to 53.6%, driven by PE’s volatile content enhancing char porosity and reaction kinetics, thereby minimizing unreacted carbon and parasitic pumping/compression loads [11].
CCS scenarios incurred an additional 0.4–0.6 MJ/kg H2 penalty from solvent regeneration and compression, lowering efficiencies by 4–6% but enabling >90% CO2 capture. The penalty arises from the thermodynamic requirements of pressure swing and thermal stripping in Selexol, offset partially by WGS heat integration but underscoring the need for advanced solvents or membranes to mitigate [46]. Figure 2C illustrates these efficiencies, with Panel D’s Monte Carlo analysis (1000 iterations, ±10% variability) confirming robustness: mean H2 yield 10.1 wt% (SD 1.02), energy efficiency 51.4% (SD 6.54), and carbon conversion 72% (SD 7.2) for Scenario 1. Such uncertainty quantification, often overlooked in biomass studies, underscores the model’s reliability under variable inputs like feedstock heterogeneity or operational fluctuations [47].
Co-feeding PE (Scenarios 3 and 4) enhanced overall performance by 5–10% across metrics, mitigating biomass limitations like high oxygen content and improving gasification kinetics through synergistic interactions (e.g., PE-derived radicals promoting biomass devolatilization and suppressing tar polymerization). This aligns with recent pilot trials reporting 8–15% efficiency gains in co-gasification, driven by increased volatile release and reduced activation energies for char–steam reactions [48]. CCS integration (Scenarios 2 and 4) achieved 96.7% CO2 recovery with minimal H2 loss (<0.5%), but increased parasitic loads (e.g., 106.9 MJ/t CO2 for sequestration) necessitating heat integration (e.g., WGS exotherm recovery) to maintain viability. The net effect is a balanced trade-off: CCS enables carbon negativity but demands optimized compression efficiencies to avoid >5% yield penalties, as seen in similar CCS systems [46]. Comparative flowsheet analysis revealed co-gasification with CCS (Scenario 4) as optimal for low-carbon H2, reducing net emissions by 85–95% while maintaining competitive yields through PE’s role in enhancing syngas calorific value.
3.2. Techno-Economic Results and Cost Breakdown
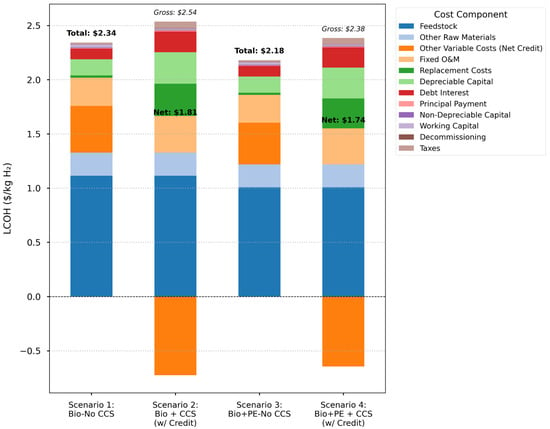
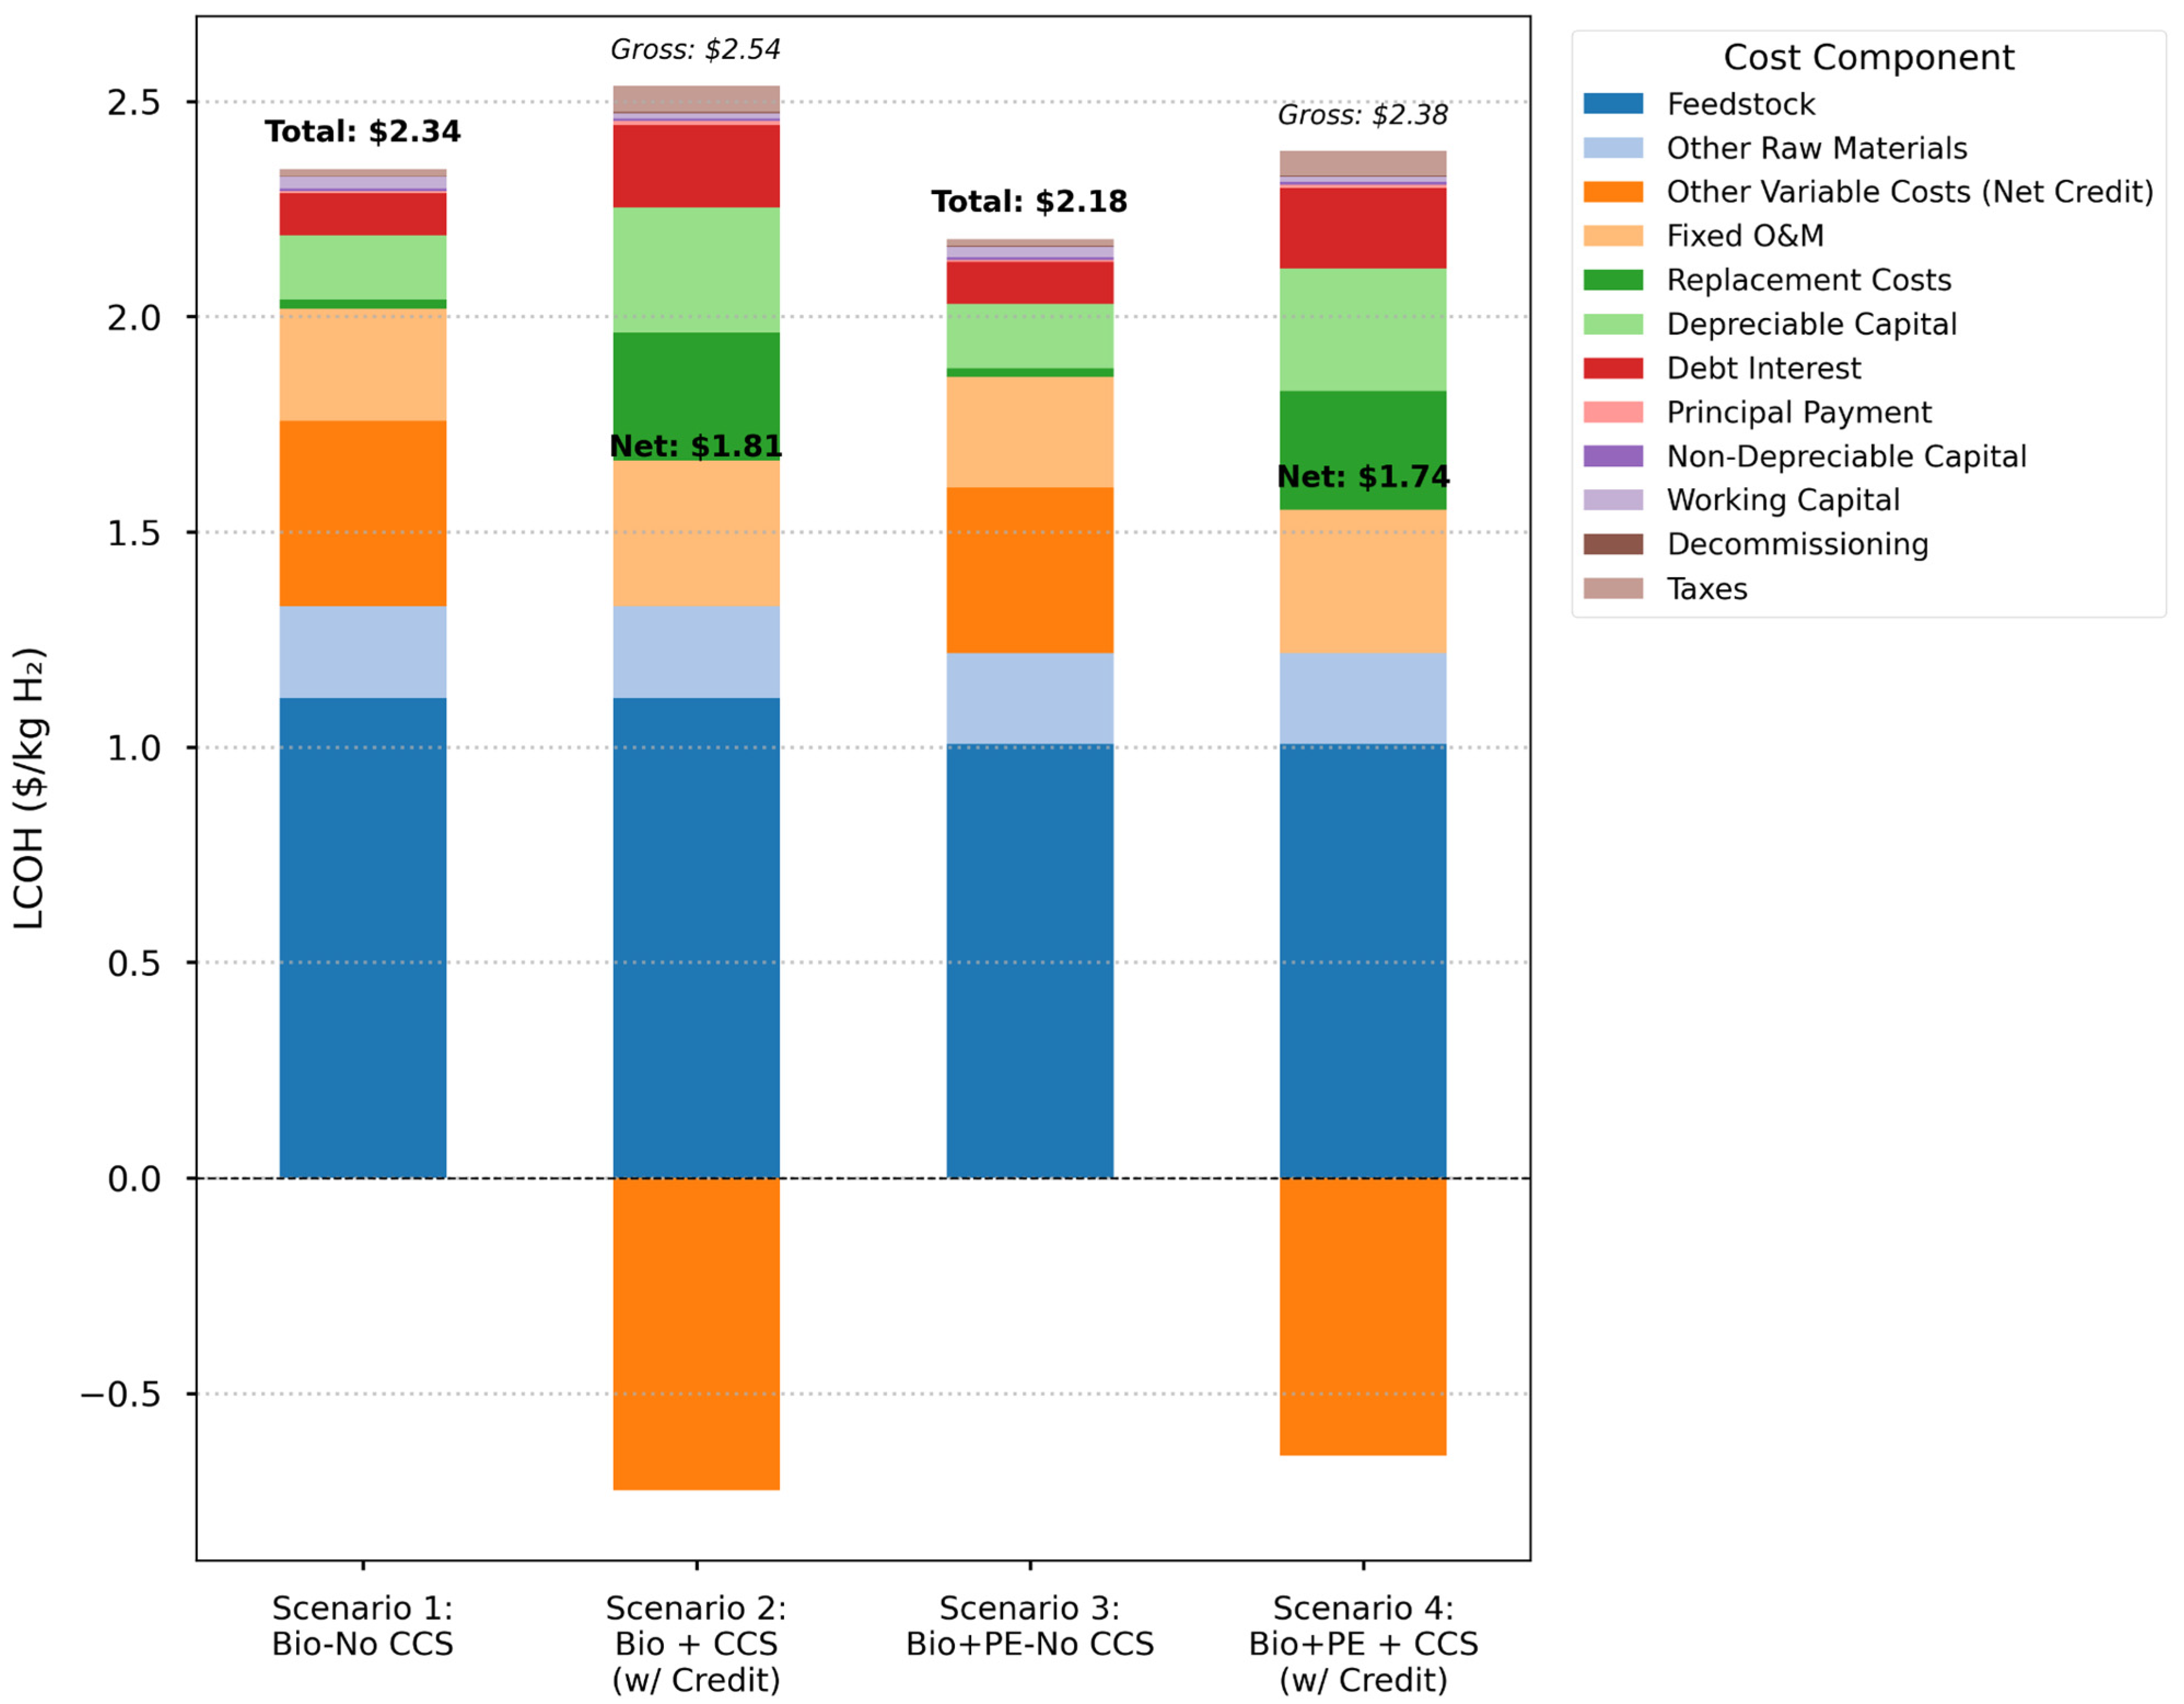
Techno-economic analysis reveals that co-gasifying woody biomass with PE plastic waste significantly reduces the levelized cost of hydrogen (LCOH) by improving process efficiency and lowering feedstock consumption. In contrast, integrating CCS increases costs because of higher capital and energy demands, though it also enables carbon credit revenues. Among the four simulated scenarios, co-gasification without CCS (Scenario 3) achieved the lowest LCOH of 2.18 USD/kg H2, while biomass gasification with CCS (Scenario 2) reached the highest LCOH of 3.18 USD/kg H2. Co-gasification with CCS (Scenario 4) provided a balanced outcome at 2.98 USD/kg H2, and its cost could drop below 1.8 USD/kg H2 if CO2 credits reach 70 USD/ton. These values position the processes competitively against fossil-based H2 (1.5–2.5 USD/kg) when carbon credits are factored, though higher than DOE targets (<2 USD/kg by 2030) due to biomass supply chain costs [49]. Figure 3 illustrates the comparative cost structures.
Figure 3.
Breakdown of levelized cost of hydrogen (LCOH, USD/kg H2) across four scenarios, with 70 USD/ton CO2 credits applied to CCS cases (Scenarios 2 and 4).
In Scenario 1 (baseline biomass without CCS), the levelized cost of hydrogen (LCOH) was estimated at 2.34 USD/kg. The feedstock cost was the dominant contributor, accounting for 47.6% (1.11 USD/kg) of the total. This high share stems from the substantial biomass consumption (10.96 kg of feedstock per kg H2) and its moderate unit price (0.0996 USD/kg), reflecting the reliance on woody residues with relatively low energy density (0.0196 GJ/kg). Other variable costs contributed 18.4% (0.43 USD/kg), primarily due to utility requirements such as natural gas (0.013 MMBtu/kg H2 at 7.77 USD/MMBtu) and electricity (1.9 kWh/kg H2 at 0.104 USD/kWh). These utilities are mainly consumed in gas compression and pumping operations within the gasification and water–gas shift (WGS) stages. Capital (13.7%, 0.32 USD/kg) and fixed operation and maintenance (O&M) costs (11.1%, 0.26 USD/kg) were relatively moderate, benefiting from the technological maturity and scalability of fluidized bed gasification systems. Overall, feedstock expenses dominate the cost structure—nearly half of the total—while electricity and steam utilities together account for about 20%. The moderate capital cost underscores the advantage of employing well-established gasification technology in the baseline configuration.
In Scenario 2 (biomass with CCS), the levelized cost of hydrogen (LCOH) increased to 3.18 USD/kg, representing a 36% rise compared with the baseline case. This escalation was primarily attributed to the capital (27.9%, 0.89 USD/kg) and variable (19.6%, 0.62 USD/kg) costs associated with CCS implementation. The sequestration process alone accounted for approximately 0.45 USD/kg H2 (equivalent to 40.10 USD per ton CO2, excluding capture), driven by the energy demand for CO2 compression (0.12 kWh/kg CO2) and additional operation and maintenance (O&M) costs. Although minor electricity credits from CO2 compression partially offset these expenditures, the overall results emphasize the thermodynamic and economic penalties of CCS, particularly in low-pressure biomass systems. Despite the integration of CCS, the feedstock contribution decreased to 35% of the total LCOH, reflecting relative cost dilution rather than reduced consumption, as the absolute biomass demand remained high.
While CCS integration substantially increases the production cost of hydrogen, the application of policy incentives can meaningfully offset this economic penalty. In particular, the U.S. 45Q tax credit [30], which offers 50–100 USD per ton of CO2 sequestered, has the potential to significantly reduce the effective cost of biomass-based hydrogen production with carbon capture. When carbon credits of approximately 70 USD per ton CO2 are incorporated in the scenario 2, the effective LCOH decreases to around 1.81 USD/kg H2, bringing biohydrogen production costs into direct competition with gray hydrogen. This underscores the critical role of carbon pricing and policy frameworks in enhancing the economic viability of low-carbon hydrogen pathways.
In Scenario 3 (co-gasification without CCS), the LCOH decreased to 2.18 USD/kg, representing a 7% reduction compared with the baseline biomass-only case (Scenario 1). This improvement was primarily driven by lower feedstock costs (46.2%, 1.01 USD/kg), owing to reduced biomass demand (9.9 kg biomass per kg H2) and the assumption of zero-cost PE, which was treated as a waste-derived feedstock under a gate fee model [11]. The co-processing of biomass and PE effectively leveraged waste streams to create economic synergies and enhance conversion performance. Variable costs declined to 17.7% (0.38 USD/kg), reflecting 7.3% lower natural gas consumption (0.01 MMBtu/kg H2) and 3.7% less electricity usage (1.84 kWh/kg H2). These reductions stem from the higher heating value of PE (0.046 GJ/kg), which improved gasification efficiency and reduced auxiliary power requirements [11]. While capital (14.5%) and fixed O&M (11.8%) shares remained comparable to those of the baseline system, the overall techno-economic performance of Scenario 3 was notably stronger. The cost reduction highlights the synergistic benefits of co-gasifying biomass with plastic waste, as PE enhances cracking and gasification reactions, leading to better hydrogen yields and energy efficiency. Consequently, this configuration offers the lowest hydrogen production cost among all cases, reinforcing its potential for waste-abundant regions seeking both economic and environmental gains through integrated resource utilization.
In Scenario 4 (co-gasification with CCS), the LCOH was 2.98 USD/kg, representing a 6% decrease relative to the biomass-only CCS case (Scenario 2). This configuration effectively balances the cost-saving benefits of co-feeding with the additional expenses of CCS. Although capital costs increased to 28.5% (0.85 USD/kg), reflecting the added CCS infrastructure, the sequestration cost was relatively moderate at 0.43 USD/kg H2 (or 41.70 USD per ton CO2), as higher hydrogen yields diluted fixed investments and improved overall process utilization. Variable costs accounted for 19.2% (0.57 USD/kg), capturing the combined influence of co-gasification efficiency and CCS energy requirements. The inclusion of PE improved syngas quality, thereby reducing CO2 compression loads and partially mitigating the energy penalty typically associated with carbon capture. The system’s design capacity of 157,746 kg H2/day further distributed both capital and operational costs, contributing to the lower overall LCOH compared with biomass-only configurations. Despite CCS inherently increasing capital and energy demands, the co-gasification route demonstrates superior cost efficiency, with sequestration expenses remaining within international cost ranges (30–50 USD per ton CO2). Importantly, incorporating carbon credit mechanisms such as 45Q or equivalent incentives (70 USD per ton CO2) could reduce the effective LCOH to 1.74 USD/kg H2, positioning this pathway as competitive with gray hydrogen while maintaining a low-carbon footprint.
Co-gasification (Scenarios 3 and 4) outperforms biomass-only processes by lowering LCOH through improved conversion efficiency and reduced reliance on biomass supply chains. While CCS adds roughly 0.8–1.0 USD/kg H2, its inclusion enables net-negative emissions and long-term sustainability, particularly if carbon markets mature. Feedstock blending also improves economic resilience by reducing exposure to biomass price volatility and supply limitations. For early-stage plants with 50% higher capital costs, the LCOH could rise by 1.3–1.5×, highlighting the importance of scale-up and nth-plant deployment for cost reduction.
3.3. Sensitivity, Uncertainty, and Comparative Economic Analysis
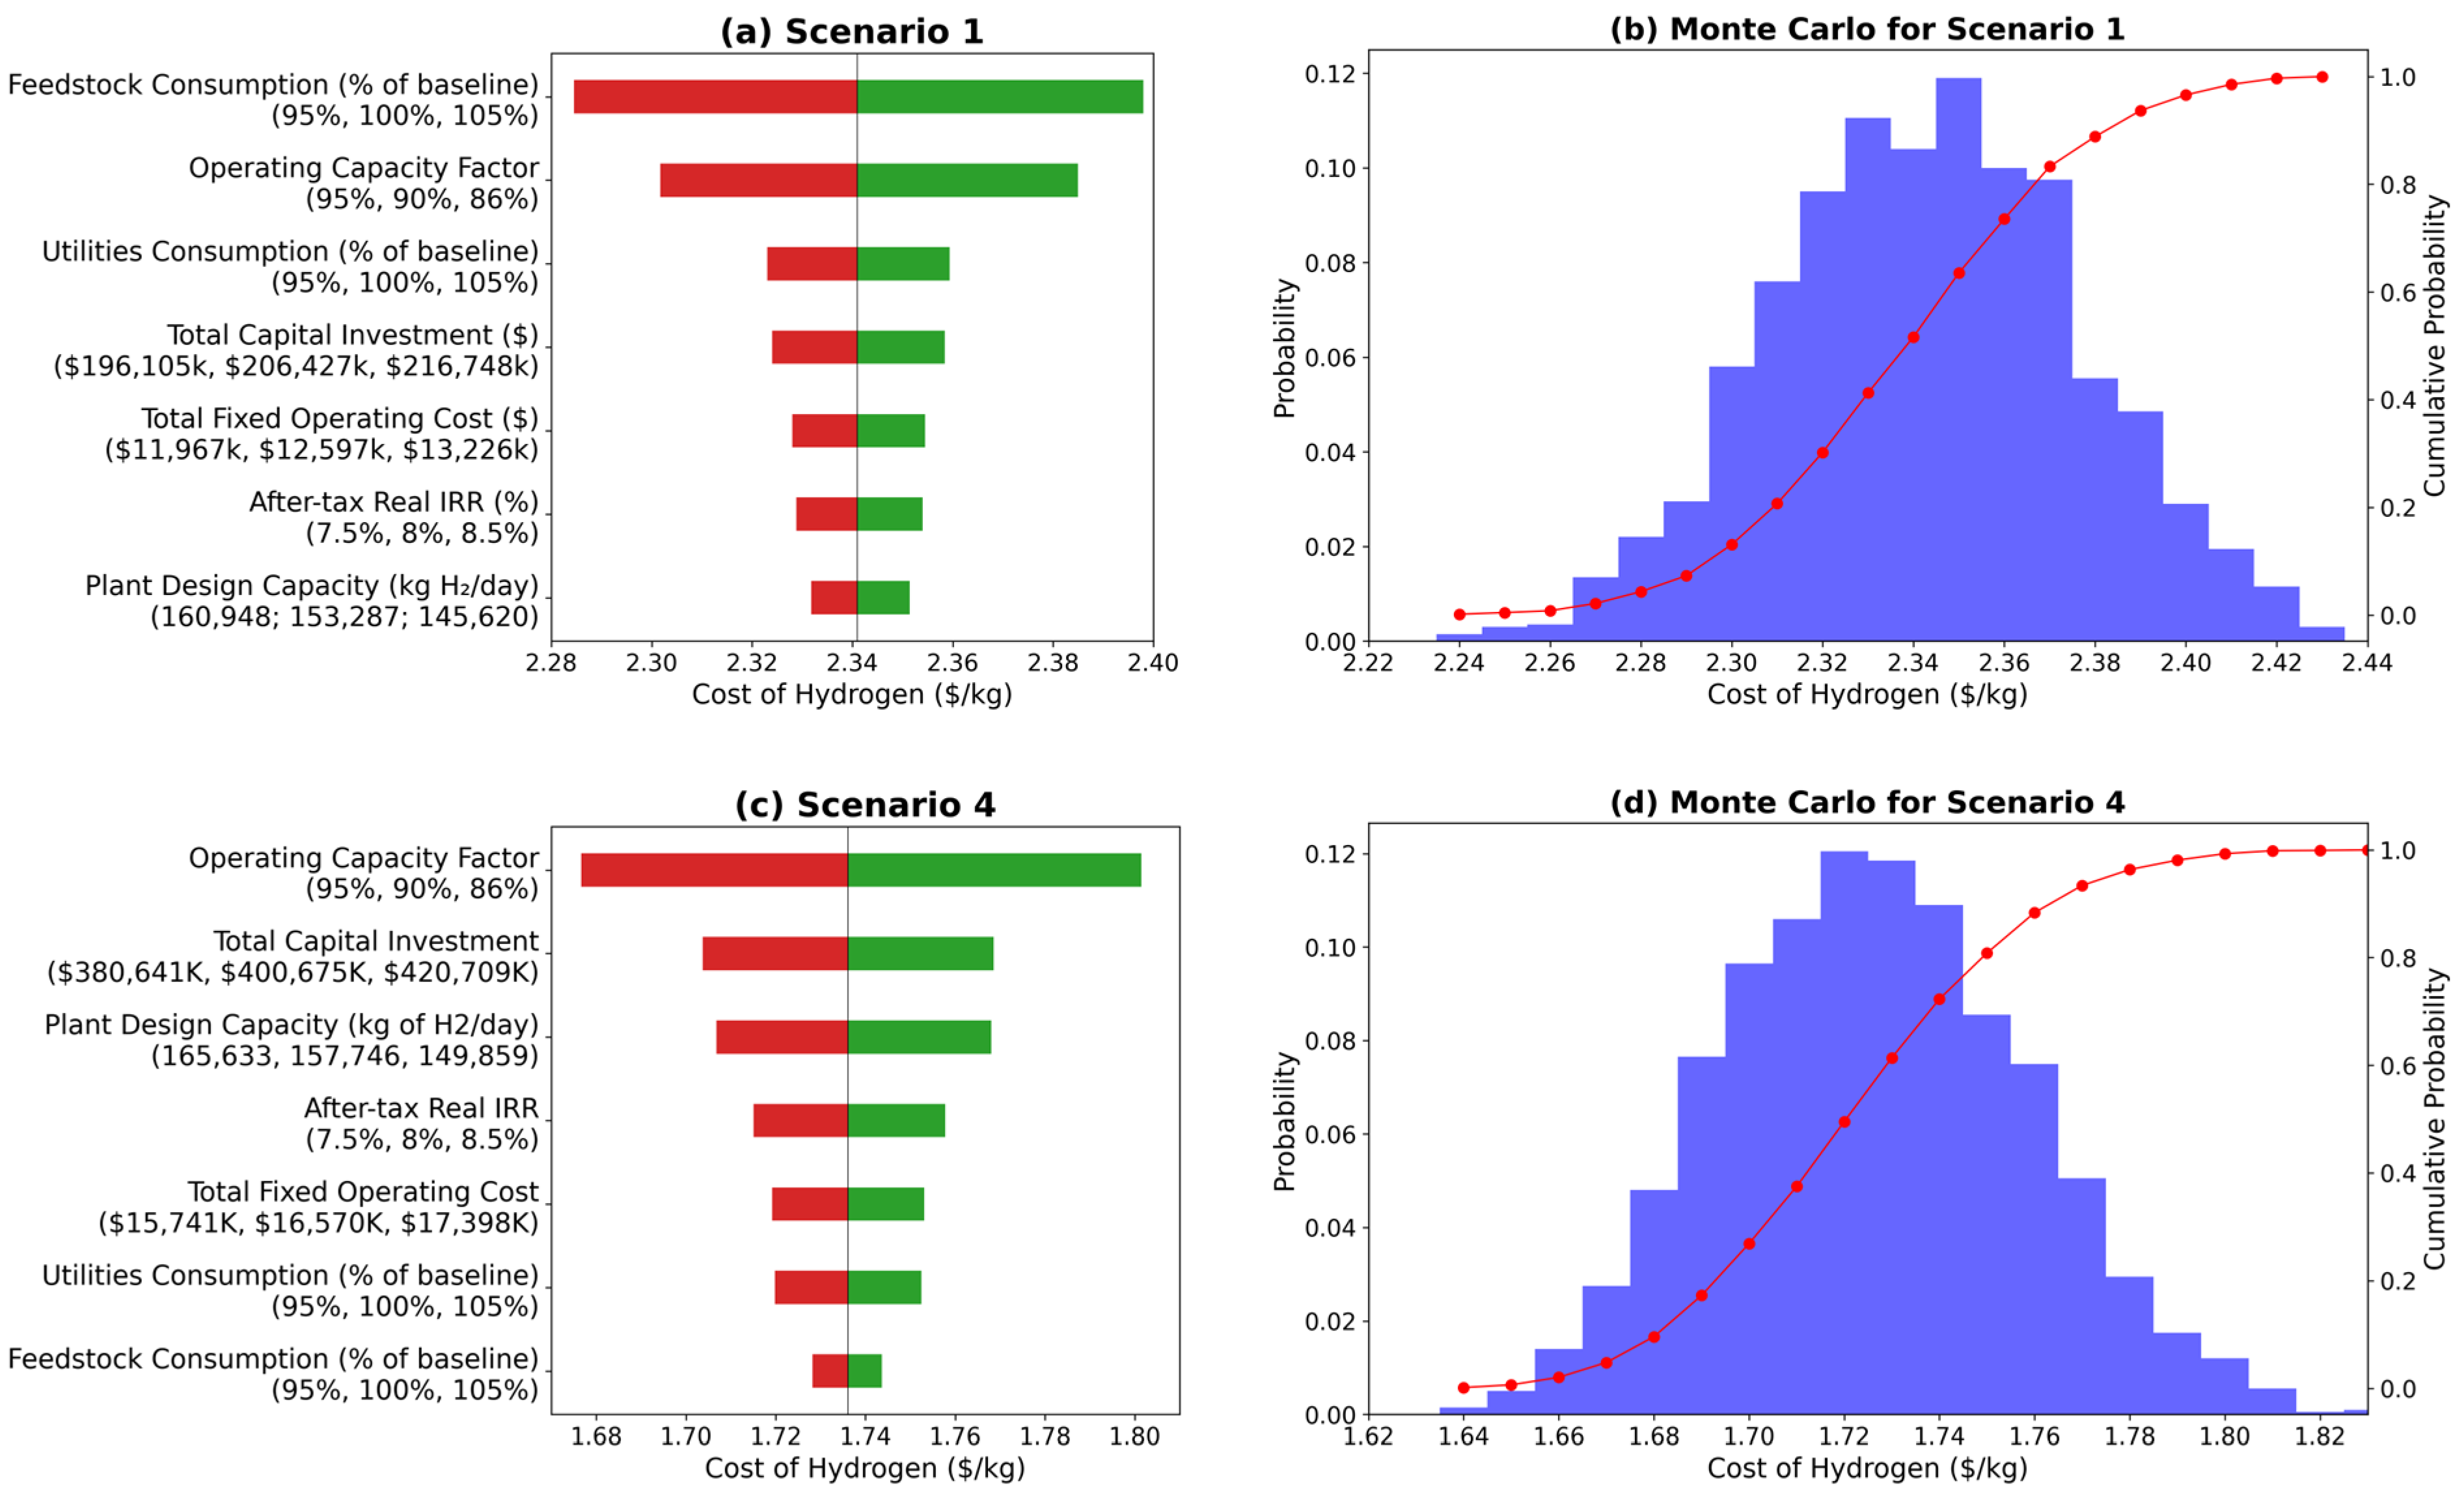
Sensitivity analysis elucidates the robustness of the techno-economic model by quantifying LCOH response to variations in key inputs, revealing critical levers for cost optimization. In Scenario 1 (biomass without CCS), LCOH exhibited highest sensitivity to feedstock consumption (±5%, ΔLCOH = 0.113 USD/kg), as biomass comprises 47.6% of costs and is subject to supply chain volatility (e.g., harvesting, logistics) that amplifies price swings. Operating capacity factor (±5%, ΔLCOH = 0.083 USD/kg) ranked second, reflecting biomass plants’ susceptibility to downtime from fouling or seasonal feed availability, which reduces utilization and spreads fixed costs over fewer units [50]. Utilities and capital showed moderate impacts, driven by energy-intensive compression and mature gasification technology minimizing capital risks.
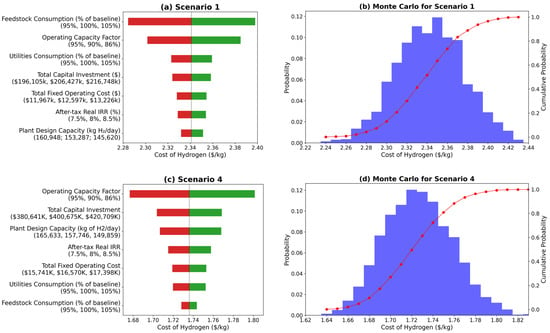
In Scenario 4 (co-gasification with CCS), capacity factor (±5%, ΔLCOH = 0.125 USD/kg) emerged as most sensitive, exacerbated by CCS’s high fixed costs (e.g., sequestration 106.9M USD), where underutilization dilutes credit revenues and amplifies depreciation burdens. Capital (±5%, ΔLCOH = 0.065 USD/kg) ranked second, as CCS adds 20–30% to TCI through specialized equipment like absorbers/strippers, vulnerable to construction escalations. Fixed O&M and utilities followed, with CCS compression (0.12 kWh/kg CO2) heightening energy sensitivity despite PE’s mitigating efficiencies. Feedstock (±5%, ΔLCOH = 0.015 USD/kg) had minimal impact, as co-feeding reduces usage (9.9 kg/kg H2 vs. 10.96), buffering price risks through waste PE’s low/negative costs. These sensitivities highlight the importance of optimizing plant operations and capital planning in CCS-integrated systems, as corroborated by recent studies on biomass gasification with CO2 capture [51]. Figure 4a,c depicts these tornado plots, showing CCS shifts sensitivity from variables to fixed/capital, as sequestration introduces inelastic overheads less affected by operational tweaks.
Figure 4.
Sensitivity and uncertainty analysis of LCOH. Panels (a,c): tornado plots showing LCOH sensitivity to key inputs (±5% variation) for Scenario 1 (biomass without CCS) and Scenario 4 (co-gasification with CCS). Panels (b,d): Monte Carlo probability distributions for LCOH (USD/kg H2) in Scenarios 1 and 4 (1000 iterations, triangular distributions ±20%).
Monte Carlo simulation (1000 iterations, triangular distributions ±20%) further probed probabilistic risks. For Scenario 1, LCOH centered at 2.34 USD/kg with 80% probability between 2.30–2.38 USD USD/kg, indicating tight distribution driven by predictable utilities but wider tails from feedstock uncertainty (±15% LCOH impact at extremes). High-probability bins (e.g., 23% at 2.32–2.33 USD/kg) reflect model stability under nominal conditions, but outliers (>2.40 USD/kg) highlight vulnerability to supply disruptions. Scenario 4 showed broader spread (80% between 1.70–1.80 USD/kg, mean 1.74 USD/kg), with CCS amplifying tails due to sequestration’s fixed costs, where low capacity (86%) spikes LCOH to 1.80 USD/kg. Figure 4b,d visualizes these probabilities, underscoring co-gasification’s narrower uncertainty (SD ±8% vs. ±12%), as PE diversifies inputs and stabilizes yields. This methodology is consistent with recent applications of Monte Carlo simulations in evaluating uncertainties for supercritical water biomass gasification systems [52].
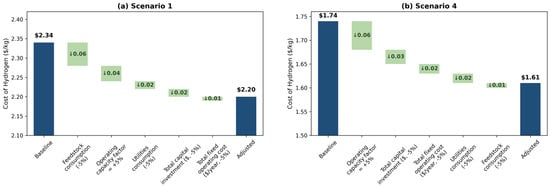
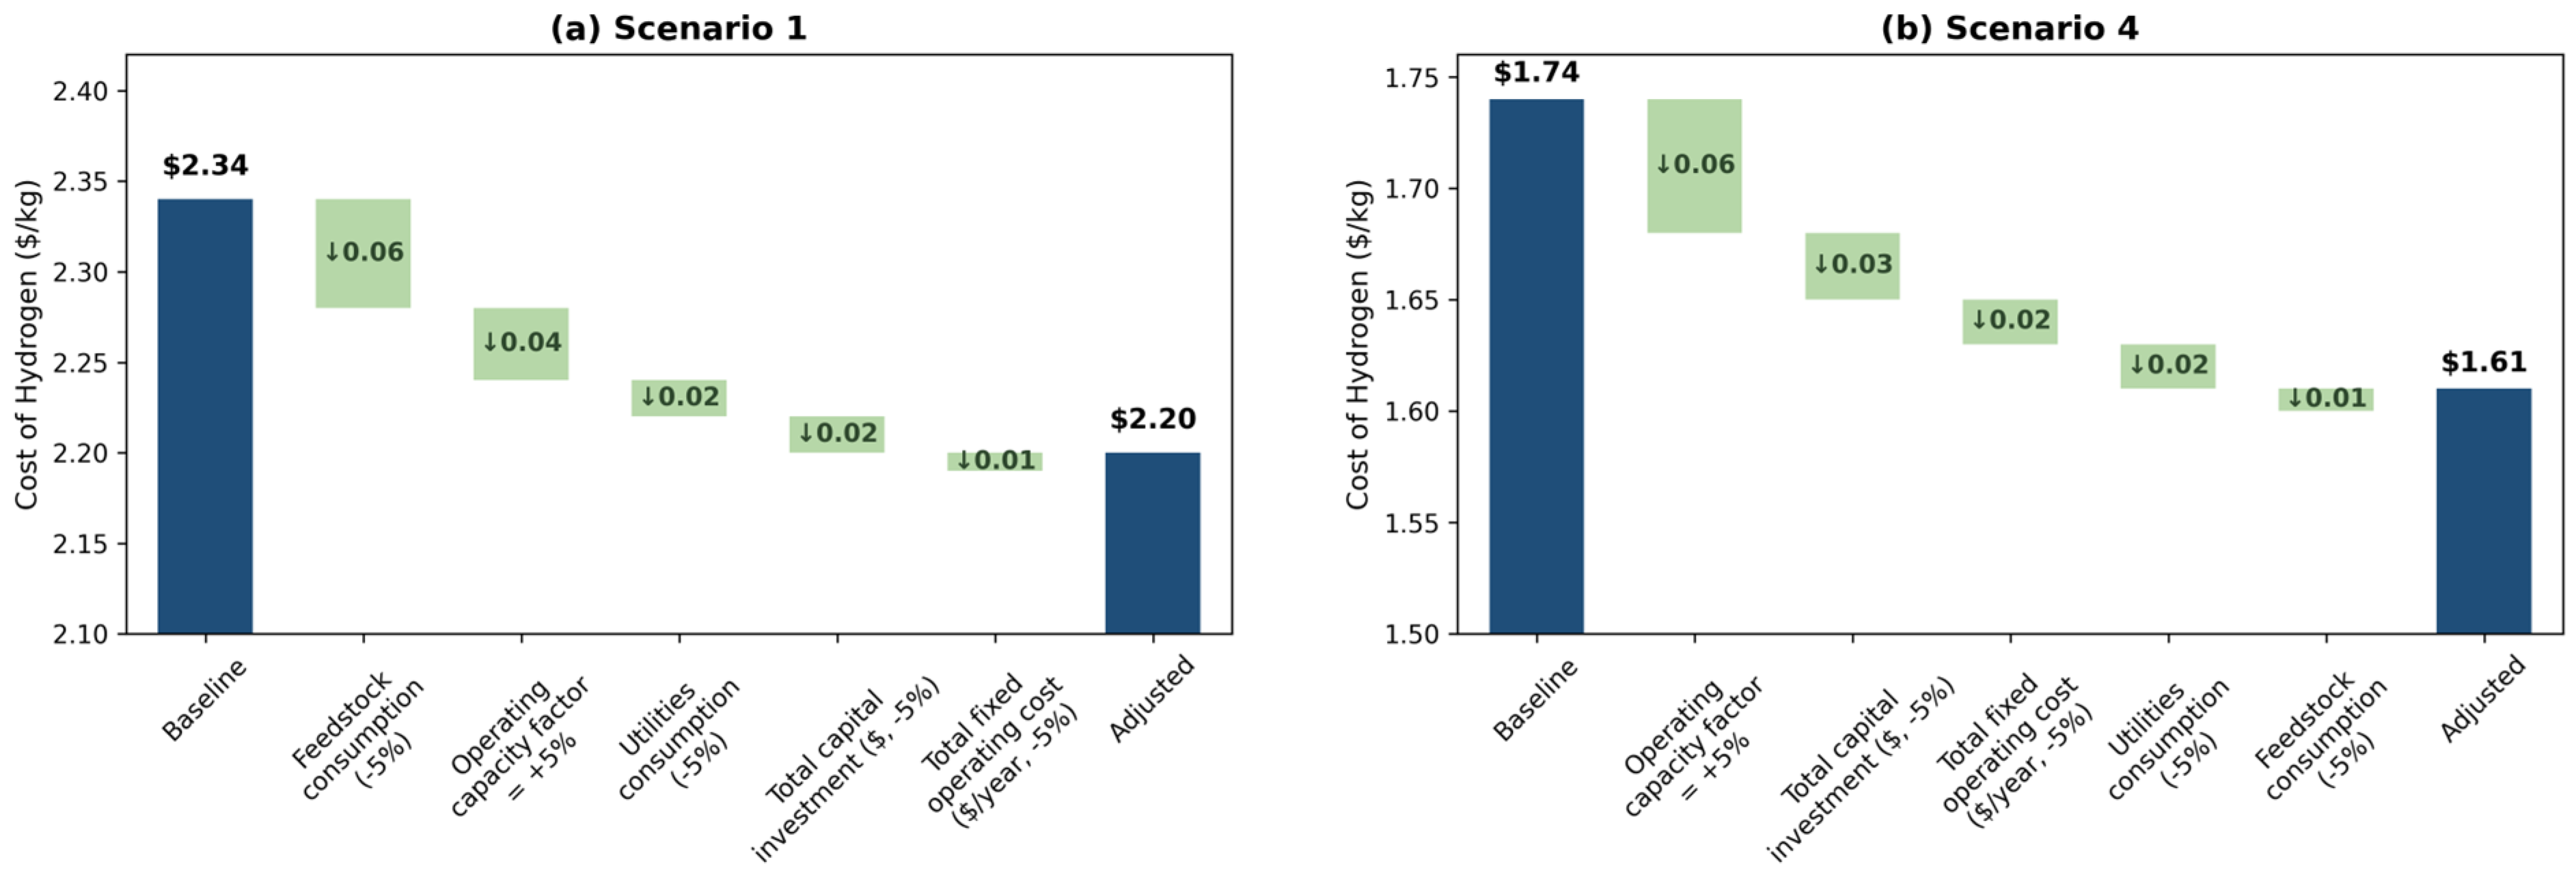
Waterfall charts decompose optimistic adjustments. In Scenario 1, baseline 2.34 USD/kg reduced to 2.20 USD/kg with −5% feedstock/utilities/capital/O&M, primarily from feedstock (0.06 USD/kg drop), as lower consumption leverages economies in handling. Capacity +5% added 0.04 USD/kg saving through better utilization. Scenario 4’s baseline 1.74 USD/kg fell to 1.61 USD/kg, with capacity +5% yielding 0.06 USD/kg reduction, emphasizing CCS’s leverage on fixed assets where uptime maximizes credit offsets. Figure 5a,b illustrates these cumulates, showing co-gasification’s greater relative gains from variables, as PE enhances flexibility.
Figure 5.
Waterfall charts of optimistic adjustments to baseline LCOH. Panel (a): Scenario 1 (biomass without CCS) and panel (b): Scenario 4 (co-gasification with CCS).
Comparatively, co-gasification tempers CCS penalties by 20–25%, as higher yields dilute fixed sequestration costs. Reasons include PE’s role in boosting H2/CO ratios, reducing downstream loads and enabling compact designs. However, without credits, CCS remains a premium (30–36% LCOH increase), driven by energy thermodynamics—compression alone consumes 10–15% plant power, resolvable via advanced materials or renewable integration. Global carbon pricing (50–100 USD/ton) could invert this, dropping Scenario 4 LCOH to 1.5–2.0 USD/kg, competitive with gray H2 while achieving negativity. Comparative studies on mixed plastic waste gasification with CCS support these findings, demonstrating potential environmental and economic benefits [53].
These analyses affirm co-gasification’s economic edge through resource efficiency and waste synergy, with CCS viability hinging on markets. For deployment, prioritizing low-cost PE sourcing and heat-optimized CCS could achieve <2 USD/kg, supporting net-zero transitions. Future refinements, like higher PE ratios or amine hybrids, merit exploration to minimize penalties.
3.4. Environmental Impacts and Life Cycle Assessment Results
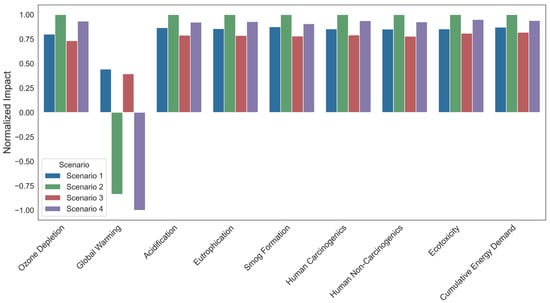
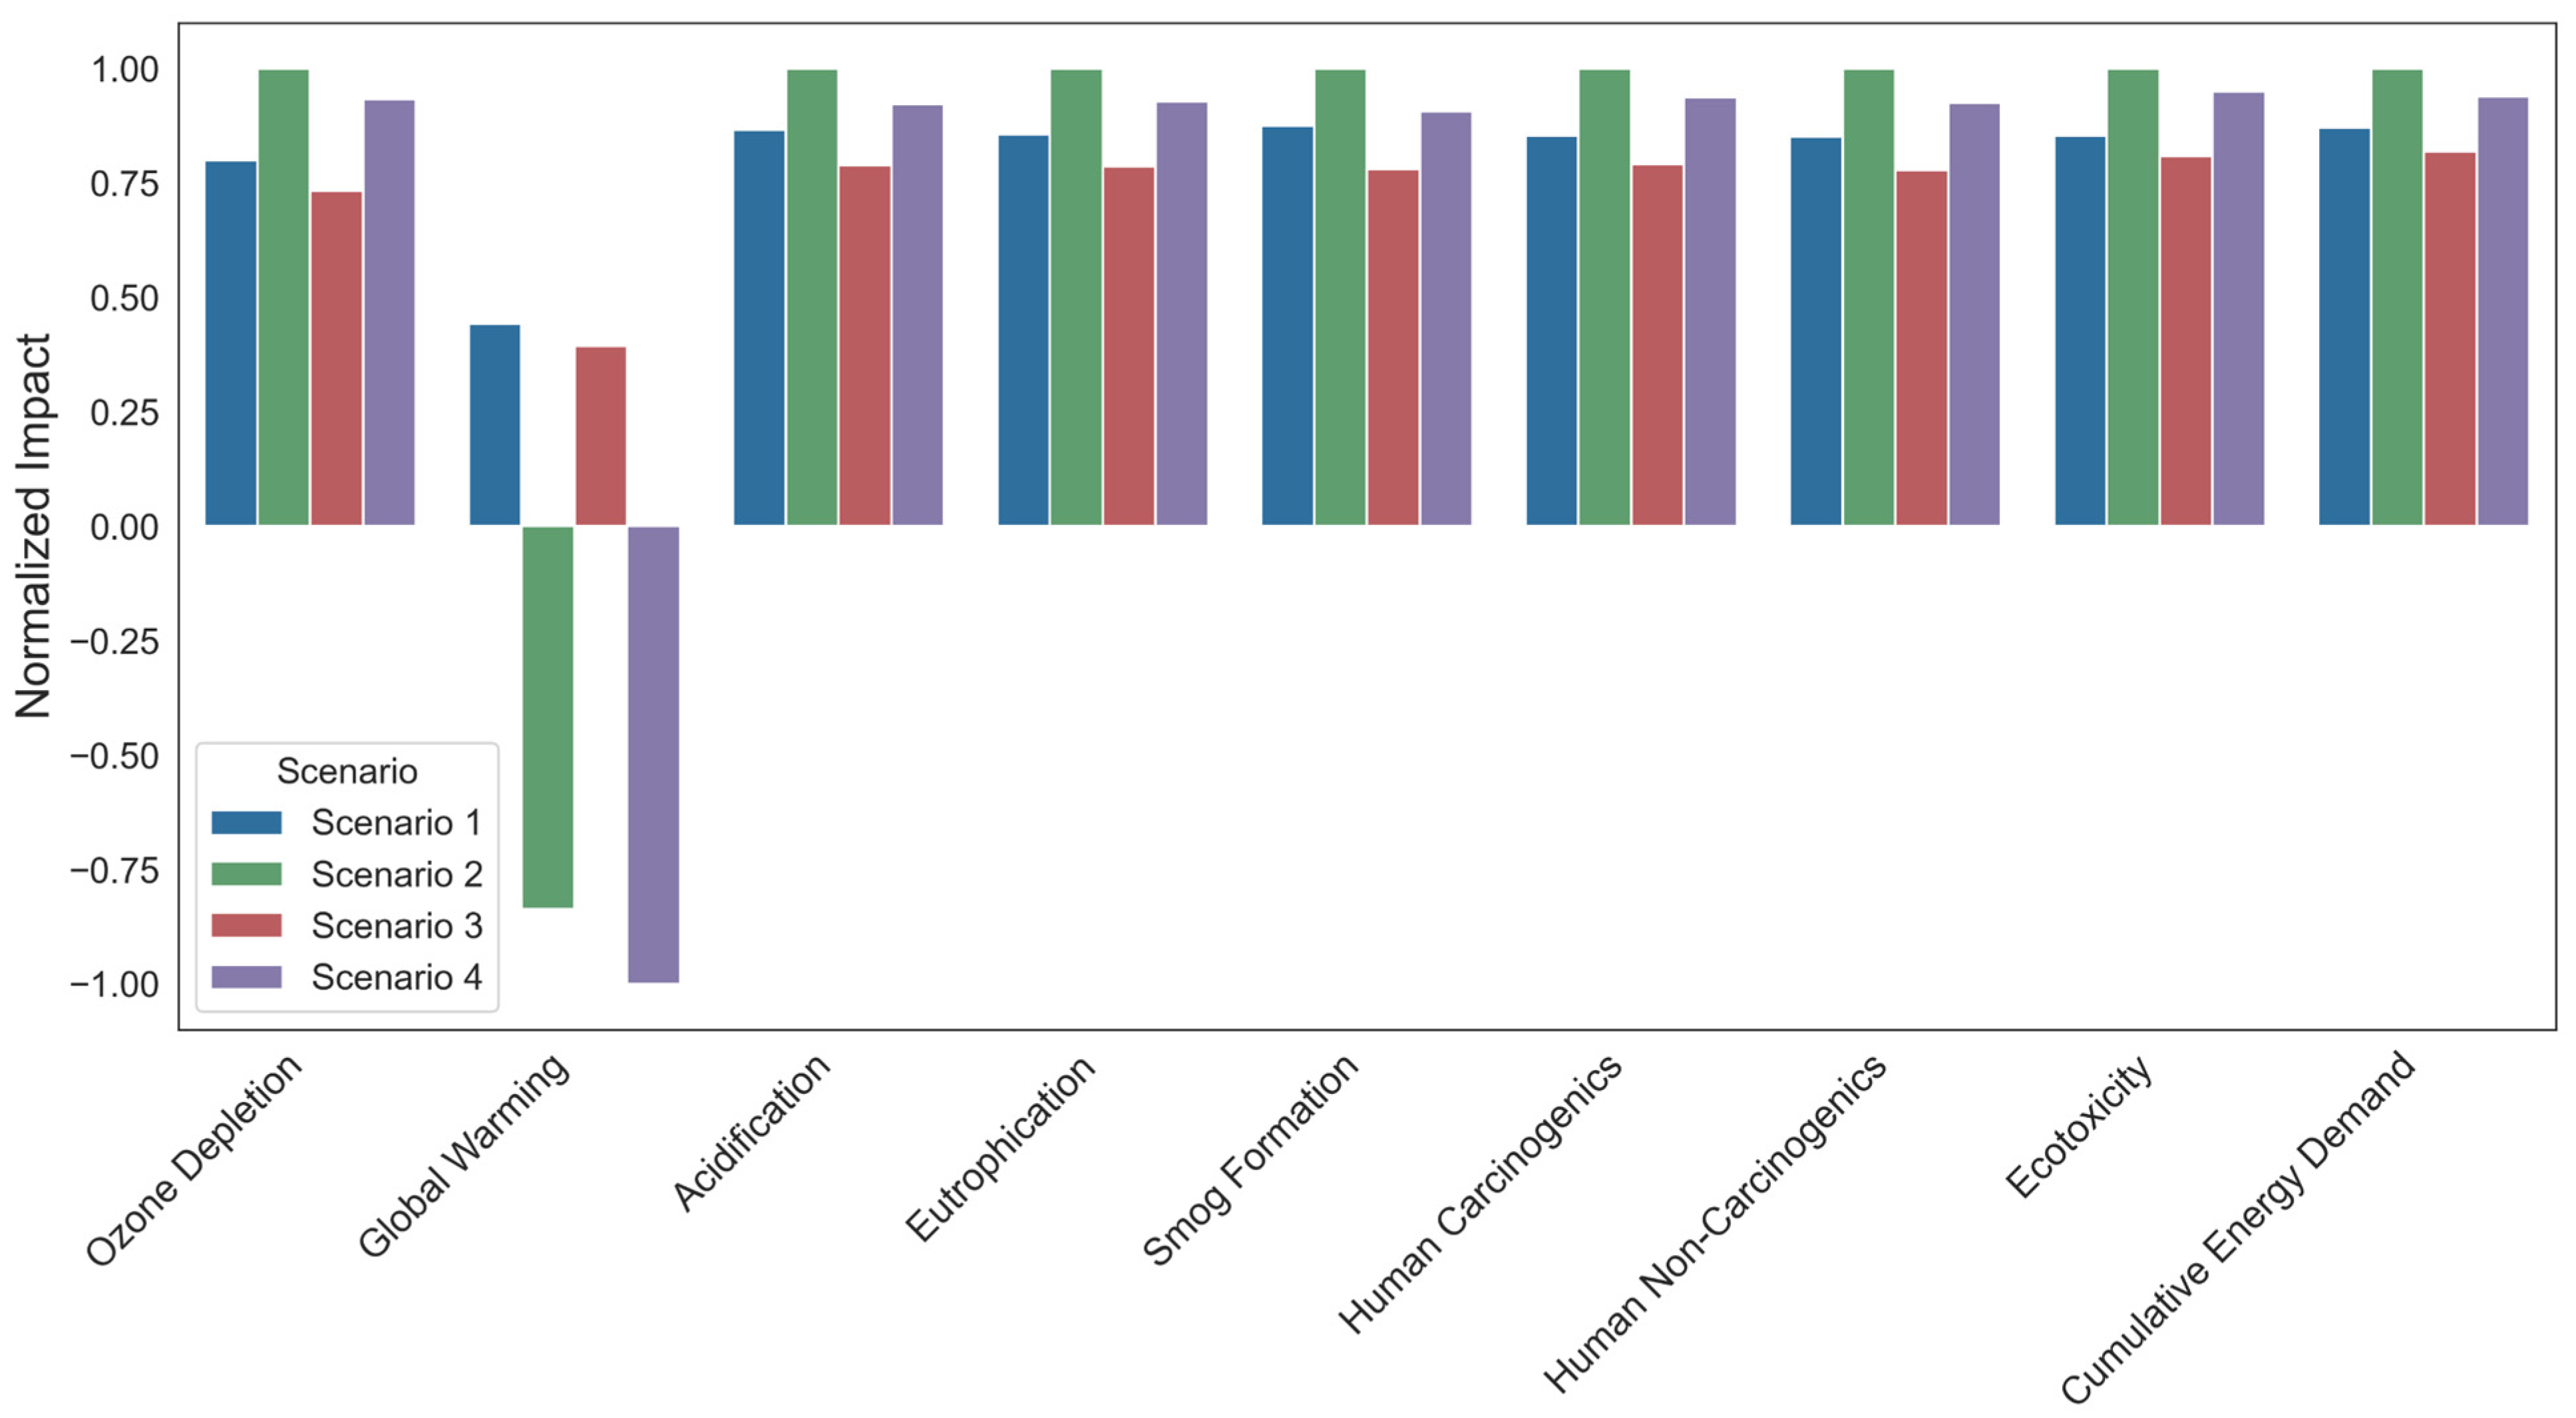
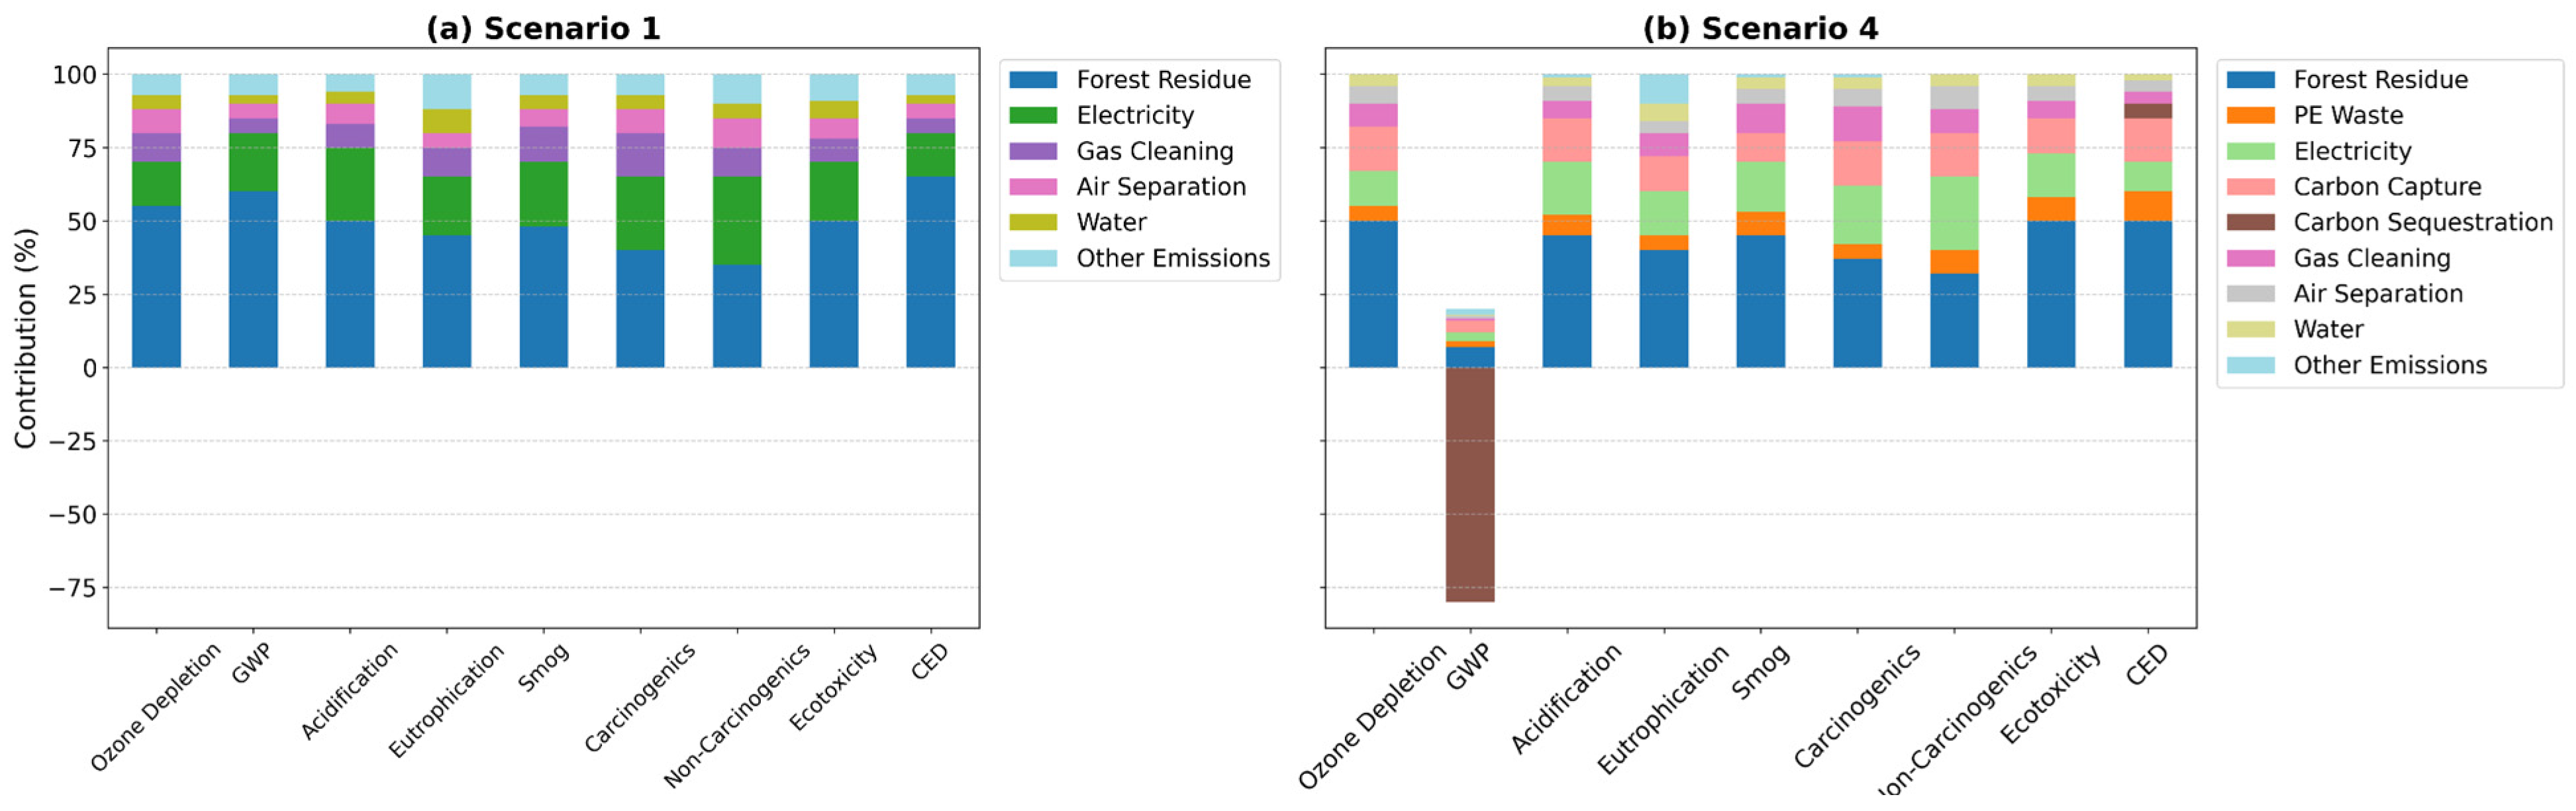
The LCA quantifies the environmental performance of the four hydrogen production scenarios, revealing substantial reductions in global warming potential (GWP) through CCS while highlighting trade-offs in resource depletion and toxicity from plastic co-feeding. The results underscore the synergistic benefits of biomass–plastic co-gasification in mitigating upstream impacts, driven by enhanced process efficiency and waste diversion, but also emphasize the energy-intensive nature of CCS that amplifies cumulative energy demand (CED). Figure 6 presents the midpoint impacts across all scenarios, demonstrating the transformative role of CCS in achieving carbon negativity. Figure 7a,b illustrates contribution analyses for Scenarios 1 and 4, elucidating shifts in impact sources.
Figure 6.
Midpoint environmental impacts across TRACI 2.1 categories and CED (MJ eq/kg H2) for all four scenarios, demonstrating CCS’s role in achieving net-negative GWP.
Figure 7.
Contribution analysis of environmental impacts. Panel (a): Scenario 1 (biomass without CCS) and panel (b): Scenario 4 (co-gasification with CCS).
Across TRACI 2.1 categories, co-gasification (Scenarios 3 and 4) consistently lowered impacts by 5–10% compared to biomass-only (Scenarios 1 and 2), primarily due to higher H2 yields reducing feedstock and energy demands per functional unit. For ozone depletion (1.1–1.5 × 10⁻⁷ kg CFC-11 eq/kg H2), electricity generation’s chlorofluorocarbon emissions dominate, with co-gasification’s efficiency gains (e.g., 3.7% less electricity in Scenario 3) yielding marginal reductions, as upstream grid mix remains fossil-heavy in U.S. contexts. Investigations into various biohydrogen production from biomass resources highlight the importance of feedstock selection in minimizing ozone depletion impacts [54]. GWP ranged from 5.8–6.5 kg CO2 eq/kg H2 without CCS to −12.3 to −14.7 kg CO2 eq/kg H2 with CCS, where sequestration credits outweigh process emissions, enabling net negativity; co-gasification amplifies this by 15–20% through lower biogenic CO2 per kg H2 from PE’s non-biogenic carbon.
Acidification (0.041–0.055 kg SO2 eq/kg H2) and eutrophication (0.011–0.015 kg N eq/kg H2) stem from upstream biomass cultivation (fertilizer runoff) and electricity (SOx/NOx from coal/gas), reduced in co-gasification by diluted biomass input, though PE’s production adds minor NOx from cracking. Environmental performance assessments of mixed plastic waste gasification with CCS show net negative climate change impacts, supporting the benefits of co-feeding [53]. Smog formation (0.25–0.34 kg O3 eq/kg H2) follows similar patterns, with CCS increasing volatile organic compounds from solvent handling. Human health impacts—carcinogenics (3.8–5.2 × 10⁻⁸ CTUh/kg H2) and non-carcinogenics (2.1–2.9 × 10⁻⁷ CTUh/kg H2)—arise from air separation emissions and PE additives (e.g., heavy metals), heightened 10–15% in co-gasification but mitigated by waste diversion avoiding landfill leachate. Techno-economic and LCA studies on mixed plastic waste gasification pathways emphasize trade-offs in human health and toxicity categories [14]. Ecotoxicity (14.4–19.2 CTUe/kg H2) reflects PE’s upstream petrochemical burdens, increasing 15% in Scenarios 3/4, as plastic monomers contribute to aquatic toxicity. CED (42.8–55.4 MJ eq/kg H2) rises 15% with CCS from compression (0.12 kWh/kg CO2), but co-gasification offsets 6–8% via higher efficiencies, emphasizing PE’s role in energy conservation. Feasibility studies on gasifying mixed plastic waste for hydrogen production indicate lower environmental impacts compared to single-stream plastics [27]. These trends highlight co-gasification’s environmental edge in non-CCS scenarios through resource optimization, while CCS transforms GWP but exacerbates energy-related categories, necessitating renewable integration for holistic sustainability.
Contribution analysis identifies impact hotspots, with forest residue dominating Scenario 1 (55–65% across categories) due to cultivation emissions (e.g., fertilizer for acidification/eutrophication), underscoring biomass’s land use burdens despite biogenic credits. Electricity contributes 15–30%, from grid fossil content amplifying smog and toxicity. In Scenario 4, contributions shift: forest residue drops to 30–50% from diluted input, PE waste adds 10–22% to fossil depletion/ecotoxicity via upstream petrochemicals, but sequestration credits −40% GWP by storing biogenic CO2. CCS itself adds 8–15%, from energy-intensive compression increasing CED/acidification. Air separation (5–10%) and gas cleaning (5–12%) are minor but notable in health impacts from chemical use. Figure 7 visualizes these shifts, showing CCS rebalancing contributions toward downstream processes.
Co-gasification’s reductions (5–10%) stem from PE’s higher HHV minimizing biomass needs and emissions, aligning with circular principles by valorizing waste. CCS’s negativity in GWP (−14.7 kg CO2 eq/kg H2 in Scenario 4) arises from 90% capture offsetting 21.8 kg process CO2/kg H2, but 15% CED increase highlights energy trade-offs, resolvable via renewables. Ecotoxicity rise (16.9 CTUe in Scenario 4) reflects PE additives, mitigated by cleaner sourcing. Overall, Scenario 4 excels for climate mitigation but requires policy support (e.g., 45Q credits) to offset costs. Future hybrid feedstocks could further optimize, emphasizing CCS’s role in net-zero transitions.
4. Conclusions
This study demonstrates the potential of co-gasification of woody biomass and PE plastic waste as a sustainable route for hydrogen production, particularly when integrated with CCS. Through rigorous Aspen Plus simulations, NREL H2A techno-economic analysis, and OpenLCA-based LCA, four scenarios were evaluated, revealing co-gasification’s synergies in enhancing process efficiency, reducing costs, and mitigating environmental impacts.
Key findings from the process modeling indicate that co-feeding 10% PE improves H2 yields by 4–5%, carbon conversion to 74%, and energy efficiency to 53.6%, driven by complementary feedstock interactions that suppress tar and boost syngas quality. CCS integration achieves >90% CO2 capture but incurs 5–8% energy penalties, underscoring the need for heat recovery optimizations.
TEA results highlight co-gasification without CCS (Scenario 3) as the most cost-effective, with LCOH at 2.18 USD/kg, 7% below biomass-only (2.34 USD/kg), due to reduced biomass demand and zero-cost PE under gate fee models. CCS raises LCOH to 2.98–3.18 USD/kg, but policy incentives like 70 USD/t CO2 credits lower it to 1.74–1.81 USD/kg, making it competitive with fossil-based H2. Sensitivity analyses emphasize capacity factor and capital as critical levers in CCS scenarios, while Monte Carlo simulations confirm co-gasification’s narrower uncertainties (SD ±8%), enhancing economic resilience.
LCA quantifies environmental benefits, with co-gasification lowering impacts by 5–10% across TRACI categories through resource optimization. CCS transforms GWP to net-negative (−14.7 kg CO2 eq/kg H2 in Scenario 4) by sequestering biogenic CO2, but increases CED by 15% from compression demands, necessitating renewable energy integration. Trade-offs include heightened ecotoxicity (15%) from PE additives, mitigated by waste diversion avoiding landfill burdens.
Overall, Scenario 4 (co-gasification with CCS) emerges as optimal for holistic sustainability, balancing low LCOH potential with carbon negativity, aligning with circular economy imperatives by valorizing waste and closing carbon loops. This supports net-zero transitions, particularly in waste-abundant regions, and underscores the role of incentives like 45Q credits in deployment.
Limitations include assumptions of U.S.-centric grid mix and feedstock prices, potentially varying globally, and exclusion of downstream H2 use. Future research should explore higher PE ratios, advanced CCS solvents, or hybrid renewables to minimize penalties and scale-up viability, advancing bioenergy with CCS for climate goals.
Author Contributions
Conceptualization, M.K. and H.S.; Methodology, M.K. and H.S.; Software, M.K.; Validation, H.S.; Formal analysis, M.K. and H.S.; Investigation, H.S.; Resources, H.S.; Data curation, H.S.; Writing—original draft, M.K.; Writing—review & editing, H.S.; Visualization, M.K. and H.S.; Supervision, M.K. and H.S.; Project administration, M.K. All authors have read and agreed to the published version of the manuscript.
Funding
This research received no funding.
Data Availability Statement
The original contributions presented in this study are included in the article. Further inquiries can be directed to the corresponding author.
Conflicts of Interest
The authors declare no conflicts of interest.
References
- IEA. Net Zero by 2050–Analysis. 2021. Available online: https://www.iea.org/reports/net-zero-by-2050 (accessed on 4 August 2025).
- Remme, U. Global Hydrogen Review 2024; IEA: Paris, France, 2024. [Google Scholar]
- Nnabuife, S.G.; Oko, E.; Kuang, B.; Bello, A.; Onwualu, A.P.; Oyagha, S.; Whidborne, J. The prospects of hydrogen in achieving net zero emissions by 2050: A critical review. Sustain. Chem. Clim. Action 2023, 2, 100024. [Google Scholar] [CrossRef] [Scilit]
- Chen, Z.; Wei, W.; Chen, X.; Liu, Y.; Shen, Y.; Ni, B.-J. Upcycling of plastic wastes for hydrogen production: Advances and perspectives. Renew. Sustain. Energy Rev. 2024, 195, 114333. [Google Scholar] [CrossRef] [Scilit]
- Fleck, A. The World Is Flooded with Plastic Waste. Statista Daily Data, 7 June 2024.
- Karimi, M.; Simsek, H.; Kheiralipour, K. Advanced biofuel production: A comprehensive techno-economic review of pathways and costs. Energy Convers. Manag. X 2025, 25, 100863. [Google Scholar] [CrossRef] [Scilit]
- Saraceno, E.; Meloni, E.; Giaconia, A.; Palma, V. Catalytic OBSiC Open Cell Foams for Methane-Rich Gas Production Through Hydrogasification of Plastic Waste. Catalysts 2025, 15, 152. [Google Scholar] [CrossRef] [Scilit]
- Karimi, M.; Simsek, H. Smart hydrothermal liquefaction: Bridging Aspen Plus and AI for carbon-neutral biofuel design. Biomass Bioenergy 2026, 208, 108860. [Google Scholar] [CrossRef] [Scilit]
- Ayub, Y.; Ren, J.; He, C.; Azzaro-Pantel, C. Co-gasification of biomass and plastic waste for green and blue hydrogen Production: Novel process development, economic, exergy, advanced exergy, and exergoeconomics analysis. Chem. Eng. J. 2024, 480, 148080. [Google Scholar] [CrossRef] [Scilit]
- Lundgren, J.; Vreugdenhil, B.; Ganjkhanlou, Y.; Baldwin, R. Biomass gasification for hydrogen production. Int. J. Hydrogen Energy 2025, 36, 14252–14260. [Google Scholar]
- Aentung, T.; Patcharavorachot, Y.; Wu, W. Co-Gasification of Plastic Waste Blended with Biomass: Process Modeling and Multi-Objective Optimization. Processes 2024, 12, 1906. [Google Scholar] [CrossRef] [Scilit]
- Gupta, N.; Wallace, B.; Duffy, M. United States Energy Association: Co-Utilization of Coal and Mixed Scrap Plastics via Syngas Production with Carbon Capture, Utilization, and Storage (CCUS); USEA Report; Battelle: Columbus, OH, USA, 2021. [Google Scholar]
- Bashir, M.A.; Ji, T.; Weidman, J.; Soong, Y.; Gray, M.; Shi, F.; Wang, P. Plastic waste gasification for low-carbon hydrogen production: A comprehensive review. Energy Adv. 2025, 4, 330–363. [Google Scholar] [CrossRef] [Scilit]
- Afzal, S.; Singh, A.; Nicholson, S.R.; Uekert, T.; DesVeaux, J.S.; Tan, E.C.; Dutta, A.; Carpenter, A.C.; Baldwin, R.M.; Beckham, G.T. Techno-economic analysis and life cycle assessment of mixed plastic waste gasification for production of methanol and hydrogen. Green Chem. 2023, 25, 5068–5085. [Google Scholar] [CrossRef] [Scilit]
- National Laboratory of the Rockies. H2A Hydrogen Production Models. 2023. Available online: https://www.nrel.gov/hydrogen/h2a-production-models (accessed on 10 November 2025).
- U.S. Environmental Protection Agency. Tool for the Reduction and Assessment of Chemicals and Other Environmental Impacts (TRACI). 2023. Available online: https://www.epa.gov/chemical-research/tool-reduction-and-assessment-chemicals-and-other-environmental-impacts-traci (accessed on 10 November 2025).
- GreenDelta GmbH, OpenLCA: Open Source Life Cycle Assessment Software. 2023. Available online: https://www.openlca.org/ (accessed on 12 August 2025).
- ASTM D3801–20; Standard Test Method for Measuring the Comparative Burning Characteristics of Solid Plastics in a Vertical Position. ASTM International: West Conshohocken, PA, USA, 2020.
- Natesakhawat, S.; Weidman, J.; Garcia, S.; Means, N.C.; Wang, P. Pyrolysis of high-density polyethylene: Degradation behaviors, kinetics, and product characteristics. J. Energy Inst. 2024, 116, 101738. [Google Scholar] [CrossRef] [Scilit]
- Jadoon, U.K.; Diaz, I.; Rodriguez, M. Comparative analysis of aspen plus simulation strategies for woody biomass air gasification processes. Biomass Bioenergy 2025, 194, 107626. [Google Scholar] [CrossRef] [Scilit]
- Wu, N.; Lan, K.; Yao, Y. An integrated techno-economic and environmental assessment for carbon capture in hydrogen production by biomass gasification. Resour. Conserv. Recycl. 2023, 188, 106693. [Google Scholar] [CrossRef] [Scilit]
- Perry, J.H. Chemical Engineers’ Handbook; ACS Publications: Washington, DC, USA, 1950. [Google Scholar]
- Soave, G. Equilibrium constants from a modified Redlich-Kwong equation of state. Chem. Eng. Sci. 1972, 27, 1197–1203. [Google Scholar] [CrossRef] [Scilit]
- Karimi, M.; Simsek, H. Life cycle assessment and techno-economic optimization of biocrude oil production from microalgae via hydrothermal liquefaction using genetic algorithms. J. Clean. Prod. 2025, 520, 146104. [Google Scholar] [CrossRef] [Scilit]
- Safarian, S.; Rydén, M.; Janssen, M. Development and Comparison of Thermodynamic Equilibrium and Kinetic Approaches for Biomass Pyrolysis Modeling. Energies 2022, 15, 3999. [Google Scholar] [CrossRef] [Scilit]
- Wegstein, J.H. Accelerating convergence of iterative processes. Commun. ACM 1958, 1, 9–13. [Google Scholar] [CrossRef] [Scilit]
- Lan, K.; Yao, Y. Feasibility of gasifying mixed plastic waste for hydrogen production and carbon capture and storage. Commun. Earth Environ. 2022, 3, 300. [Google Scholar] [CrossRef] [Scilit]
- Penev, M.; Saur, G.; Hunter, C.; Zuboy, J. H2A: Hydrogen Production Model: Version 3.2018 User Guide (Draft); User guide i; US Department of Energy: Washington, DC, USA, 2018. [Google Scholar]
- Parry, I.; Zhunussova, K.; Black, M.S. Carbon Taxes or Emissions Trading Systems?: Instrument Choice and Design; International Monetary Fund: Washington, DC, USA, 2022. [Google Scholar]
- Jones, A.C.; Marples, D.J. The Section 45Q Tax Credit for Carbon Sequestration; Congressional Research Service (CRS) Reports and Issue Briefs: Washington, DC, USA, 2023. [Google Scholar]
- Zimmermann, A.W.; Wunderlich, J.; Müller, L.; Buchner, G.A.; Marxen, A.; Michailos, S.; Armstrong, K.; Naims, H.; McCord, S.; Styring, P.; et al. Techno-economic assessment guidelines for CO2 utilization. Front. Energy Res. 2020, 8, 5. [Google Scholar] [CrossRef] [Scilit]
- ISO 14040; Environmental Management—Life Cycle Assessment—Principles and Framework. International Organization for Standardization: Geneva, Switzerland, 2006.
- Quist, Z. Life Cycle Assessment (LCA)–Everything You Need to Know. Available online: https://ecochain.com/blog/life-cycle-assessment-lca-guide/ (accessed on 12 August 2025).
- Frischknecht, R.; Wyss, F.; Knöpfel, S.B.; Lützkendorf, T.; Balouktsi, M. Cumulative energy demand in LCA: The energy harvested approach. Int. J. Life Cycle Assess. 2015, 20, 957–969. [Google Scholar] [CrossRef] [Scilit]
- Pu, G.; Zhou, H.-P.; Hao, G.-T. Study on pine biomass air and oxygen/steam gasification in the fixed bed gasifier. Int. J. Hydrogen Energy 2013, 38, 15757–15763. [Google Scholar] [CrossRef] [Scilit]
- Cerón, A.L.; Konist, A.; Lees, H.; Järvik, O. Effect of woody biomass gasification process conditions on the composition of the producer gas. Sustainability 2021, 13, 11763. [Google Scholar] [CrossRef] [Scilit]
- Gao, Y.; Wang, M.; Raheem, A.; Wang, F.; Wei, J.; Xu, D.; Song, X.; Bao, W.; Huang, A.; Zhang, S.; et al. Syngas Production from Biomass Gasification: Influences of Feedstock Properties, Reactor Type, and Reaction Parameters. ACS Omega 2023, 8, 31620–31631. [Google Scholar] [CrossRef] [Scilit]
- Tsekos, C.; del Grosso, M.; de Jong, W. Gasification of woody biomass in a novel indirectly heated bubbling fluidized bed steam reformer. Fuel Process. Technol. 2021, 224, 107003. [Google Scholar] [CrossRef] [Scilit]
- Van den Oever, A.; Costa, D.; Cardellini, G.; Messagie, M. Systematic review on the energy conversion efficiency of biomass-based Fischer-Tropsch plants. Fuel 2022, 324, 124478. [Google Scholar] [CrossRef] [Scilit]
- Sravani, P.; Povari, S.; Alam, S.; Nakka, L.; Srinath, S.; Chenna, S. Co-gasification of waste biomass and plastic for syngas production with CO2 capture and utilization: Thermodynamic investigation. Res. Sq. 2023, 1–18. [Google Scholar] [CrossRef] [Scilit]
- Yu, H.; Yang, X.; Jiang, L.; Chen, D. Experimental study on co-gasification characteristics of biomass and plastic wastes. BioResources 2014, 9, 5615–5626. [Google Scholar] [CrossRef] [Scilit]
- Williams, J.M.; Bourtsalas, A. Assessment of Co-Gasification methods for hydrogen production from biomass and plastic wastes. Energies 2023, 16, 7548. [Google Scholar] [CrossRef] [Scilit]
- Smith, K.H.; Ashkanani, H.E.; Morsi, B.I.; Siefert, N.S. Physical solvents and techno-economic analysis for pre-combustion CO2 capture: A review. Int. J. Greenh. Gas Control 2022, 118, 103694. [Google Scholar] [CrossRef] [Scilit]
- Karayil, A.; Elseragy, A.; Aliyu, A.M. An assessment of CO2 capture technologies towards global carbon net neutrality. Energies 2024, 17, 1460. [Google Scholar] [CrossRef] [Scilit]
- Singh, A.; Shivapuji, A.M.; Dasappa, S.; Rao, D.M.; Sivaramakrishna, G.; Badhe, R.M.; Srivastva, U. Competitive multi-component bio-syngas separation for hydrogen production: Breakthrough dynamics, thermal effects, and adsorbent stability analysis under practical operating conditions. Sep. Purif. Technol. 2024, 334, 126031. [Google Scholar] [CrossRef] [Scilit]
- Alizadeh, S.M.; Khalili, Y.; Ahmadi, M. Comprehensive review of carbon capture and storage integration in hydrogen production: Opportunities, challenges, and future perspectives. Energies 2024, 17, 5330. [Google Scholar] [CrossRef] [Scilit]
- Mondal, M.; Datta, A. Energy transfer in hydrogen separation from syngas using pressure swing adsorption (PSA) process: A thermodynamic model. Int. J. Energy Res. 2017, 41, 448–458. [Google Scholar] [CrossRef] [Scilit]
- Shah, H.H.; Amin, M.; Iqbal, A.; Nadeem, I.; Kalin, M.; Soomar, A.M.; Galal, A.M. A review on gasification and pyrolysis of waste plastics. Front. Chem. 2023, 10, 960894. [Google Scholar] [CrossRef] [Scilit]
- Parks, G.; Curry-Nkansah, M.; Hughes, E.; Sterzinger, G. Hydrogen Production Cost Estimate Using Biomass Gasification; US Department of Energy Hydrogen and Fuel Cells Program: Washington, DC, USA, 2011. [Google Scholar]
- IEA Bioenergy. Lessons Learned about Thermal Biomass Gasification. Task 33 Thermal Gasification of Biomass and Waste; IEA Bioenergy: Paris, France, 2019. [Google Scholar]
- Cormos, C.-C.; Dragan, M.; Dinca, C.; Cormos, A.-M.; Dragan, S.; Dumbrava, I.-D.; Ilea, F.; Galusnyak, S. Economic Assessment of Green Hydrogen Production from Biomass Gasification with Chemical Absorption and Membrane-based CO2 Capture. CET J.-Chem. Eng. Trans. 2022, 94, 277. [Google Scholar]
- Rabea, K.; Michailos, S.; Hughes, K.J.; Ingham, D.; Pourkashanian, M. A new hydrogen production route through biomass gasification in a two-stage fixed bed reactor within the BECCS concept: A techno-economic and life cycle assessment study. Int. J. Hydrogen Energy 2025, 124, 140–152. [Google Scholar] [CrossRef] [Scilit]
- Chari, S.; Sebastiani, A.; Paulillo, A.; Materazzi, M. The Environmental Performance of Mixed Plastic Waste Gasification with Carbon Capture and Storage to Produce Hydrogen in the U.K. ACS Sustain. Chem. Eng. 2023, 11, 3248–3259. [Google Scholar]
- Khoo, H.H.; Ho, E.H.Z.; Yap, K.S.; Zhao, Y.; Tan, D.Z.L.; Yeo, Z. Life Cycle Assessment of biomass resources for hydrogen production. Sci. Total Environ. 2025, 1002, 180587. [Google Scholar] [CrossRef] [Scilit]

Disclaimer/Publisher’s Note: The statements, opinions and data contained in all publications are solely those of the individual author(s) and contributor(s) and not of MDPI and/or the editor(s). MDPI and/or the editor(s) disclaim responsibility for any injury to people or property resulting from any ideas, methods, instructions or products referred to in the content. |
© 2026 by the authors. Licensee MDPI, Basel, Switzerland. This article is an open access article distributed under the terms and conditions of the Creative Commons Attribution (CC BY) license.