


Abstract
The increasing size and complexity of wind turbines have intensified the need for reliable real-time condition monitoring and health assessment. However, conventional numerical models often involve high computational demand, limiting their applicability for real-time digital twin implementation. This paper proposes a physics-based digital twin framework for the real-time health monitoring of a 3 MW class wind turbine. A physics-based numerical model was developed using Modelica 4.0.0 to simulate the electrical and mechanical behaviors of the wind turbine based on supervisory control and data acquisition (SCADA) inputs. Data preprocessing and wind speed calibration strategies were applied to reconcile nacelle-measured SCADA data with the turbine design specifications. Furthermore, reduced-order models (ROMs) were integrated with the physics-based numerical model to predict the thermal states of the generator and gearbox. Key operational parameters were selected through correlation analysis to enable accurate temperature prediction. Validation results demonstrate that the proposed digital twin accurately reproduces the dynamic behavior of the wind turbine, with the ROM-based temperature predictions showing agreement with SCADA measurements. The overall framework achieves a computation time within one second, indicating its suitability for real-time diagnostic and predictive maintenance applications.
1. Introduction
Wind power has emerged as a renewable energy source for achieving global carbon neutrality and has exhibited rapid growth worldwide. The global wind power generation capacity has been increasing by more than 100 GW annually and is projected to reach approximately 2200 GW by 2030. Furthermore, to achieve the net-zero scenario by 2050, an installed capacity exceeding 8000 GW is required, necessitating average annual wind capacity additions of about 340 GW from 2030 [1]. In particular, the offshore wind market is projected to grow at a compound annual growth rate of about 15.8% through 2030, resulting in an approximately threefold increase in global installed capacity by 2030. Global offshore wind capacity is expected to increase from 73 GW in 2023 to around 560 GW by 2035 and to exceed 1950 GW by 2050 [2,3].
Compared to onshore wind turbines, offshore wind turbines benefit from higher average wind speeds and lower turbulence intensity, resulting in higher capacity factors. In addition, offshore installations face fewer constraints related to noise and land availability, enabling the deployment of megawatt-class wind turbines [3]. The rated capacity of individual wind turbines has steadily increased, as larger rotor diameters and increased tower heights enable turbines to exploit higher wind speeds due to wind shear effects, thereby reducing the levelized cost of energy [4,5,6,7]. As a result, individual wind turbines have become progressively larger, and the development of single turbines with rated capacities exceeding 12 MW is actively being pursued by industry and research [8]. With the increasing size and complexity of modern wind turbines, digital twin technologies have gained significant attention as effective tools for real-time monitoring, performance evaluation, and predictive maintenance. A digital twin enables near real-time replication of the physical behavior of an actual wind turbine within a virtual environment, allowing the states of components to be estimated based on supervisory control and data acquisition (SCADA) data [9].
Previous studies have extensively investigated digital twin frameworks for wind turbines, focusing primarily on the dynamic behavior and health monitoring of components such as gearboxes, bearings, generators, and structural elements. These studies have employed physics-based models to capture mechanical dynamics, and data-driven approaches to enable fault detection, remaining useful life estimation, and predictive maintenance based on SCADA and condition monitoring data [10,11,12,13,14,15,16]. However, many existing digital twin implementations emphasize electromechanical dynamics and often rely on artificial intelligence models for thermal state prediction when SCADA data are available. In contrast, this study introduces a digital twin framework that incorporates a reduced-order model (ROM) for temperature prediction, aiming to provide a computationally efficient and physically interpretable alternative to purely data-driven approaches. The integration of the ROM within a physics-based digital twin enables real-time thermal state estimation while preserving model transparency and robustness. Accordingly, this study targets the prediction of generator and gearbox temperatures within a physics-based digital twin framework.
This paper presents a physics-based digital twin framework for real-time condition monitoring of a 3 MW class wind turbine. The main methodological contributions of this study are threefold: (i) a physics-consistent wind speed calibration strategy based on design reference points, (ii) a hierarchical integration of physics-based modeling and reduced-order thermal prediction, and (iii) a deployable digital twin framework validated using field SCADA data. The primary objective is to develop a system capable of predicting generator and gearbox temperatures without the excessive computational overhead associated with traditional numerical methods. This objective is achieved by integrating a physics-based numerical model with ROM techniques within the ANSYS Twin Builder version 2023 R2 environment. A wind speed calibration strategy was applied to reduce wind speed errors in SCADA data caused by blade wake effects. The calibrated wind speed was used as an input to the physics-based model to align the simulated output power with the SCADA measurements and the turbine design specifications. The temperatures of the generator and gearbox were predicted by combining SCADA measurements with synthetic data generated from the physics-based numerical model. Based on this framework, ROMs were developed to enable efficient temperature prediction. Accordingly, the proposed framework adopts a hierarchical modeling structure, in which a physics-based wind turbine model provides a calibrated system-level representation, while reduced-order models are employed for efficient thermal state prediction. This structure enables the integration of different modeling fidelities and time resolutions within a unified digital twin. This research aims to provide a reliable and efficient digital twin architecture that serves as a foundation for predictive maintenance and enhances the operational reliability of large-scale wind energy conversion systems.
2. Description of the 3 MW Wind Turbine
2.1. Specification of the 3 MW Wind Turbine
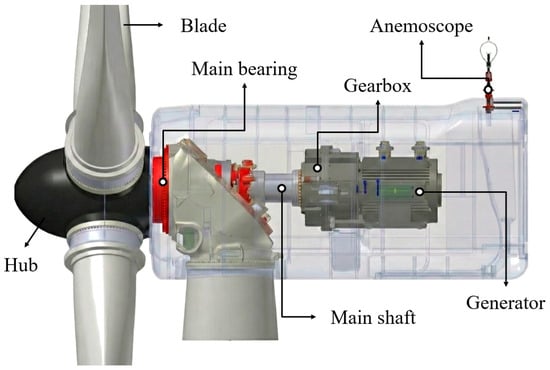
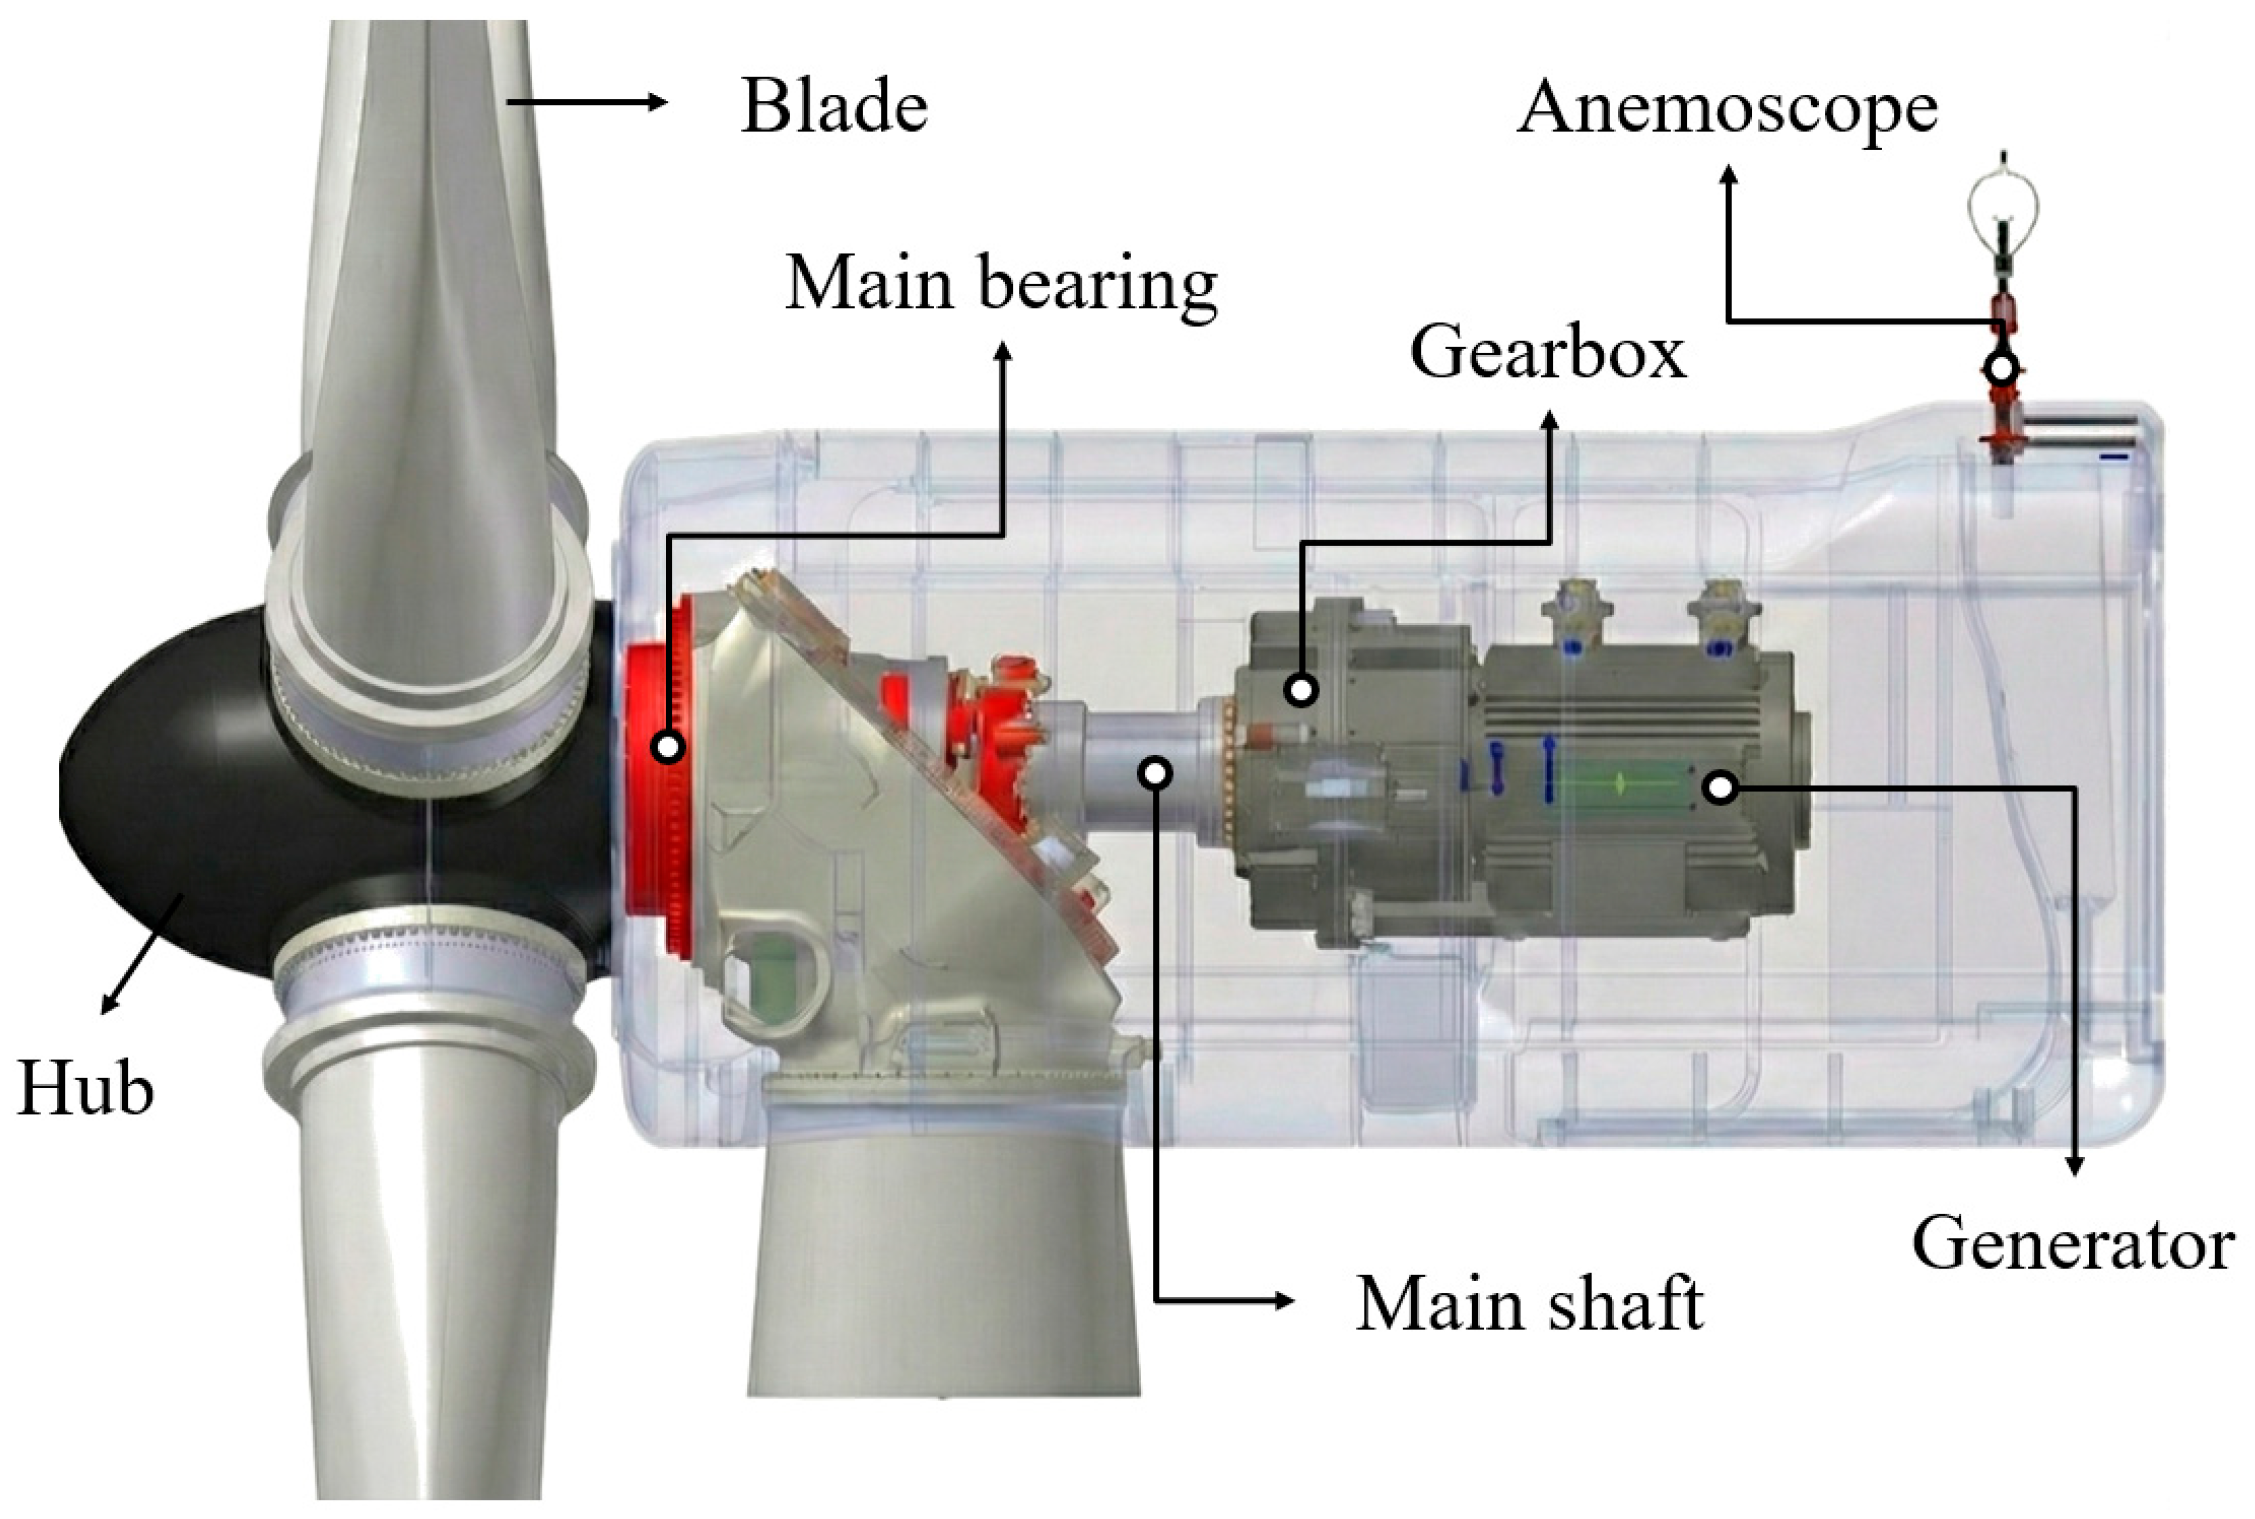
An operational 3 MW wind turbine is selected as the target system to demonstrate the applicability of the proposed digital twin framework. The turbine considered in this study is the WindDS3000 model manufactured by Doosan Enerbility in Changwon, South Korea. Table 1 lists the detailed specifications of the target wind turbine, with all electrical and mechanical parameters derived from the design documentation. The turbine is designed for a rated wind speed of 13 m/s, with cut-in and cut-out wind speeds of 3 m/s and 25 m/s, respectively. The turbine is equipped with a three-bladed rotor with a radius of approximately 45.65 m, which is connected to a gearbox with a ratio of 1:93. The gearbox increases the rotational speed to the nominal generator speed of 1459 rpm. The generator operates at a rated line-to-line voltage of 690 V and a rated current of 2510 A. The electrical parameters required for the physics-based model were adopted from the manufacturer’s specifications. The turbine achieves a maximum power coefficient of 0.491 at an optimal tip-speed ratio of 7.67. Figure 1 illustrates the internal composition of the nacelle and the drivetrain configuration of the target wind turbine. The kinetic energy captured by the rotor blades is converted into aerodynamic torque and transmitted through the main bearing and the main shaft. This torque is delivered to the gearbox, which increases the low rotational speed of the rotor to the rated speed required by the permanent magnet synchronous generator (PMSG) for power generation. The wind speed and direction are measured by an anemoscope mounted on the rear of the nacelle, while the ambient temperature is monitored to represent the environmental operating conditions of components such as the generator and gearbox. The nacelle-measured wind speed was used as an input to drive the physics-based model, and the corresponding SCADA measurements were used as reference data for comparison with the model outputs.
Table 1.
Specifications of the 3 MW wind turbine.
Figure 1.
Composition of the 3 MW class wind turbine.
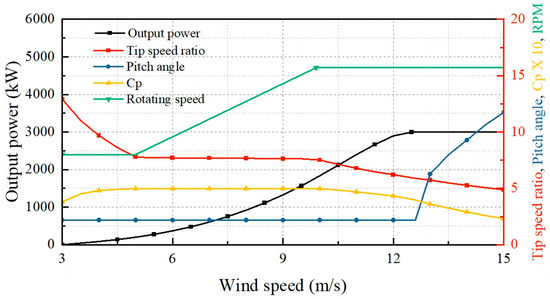
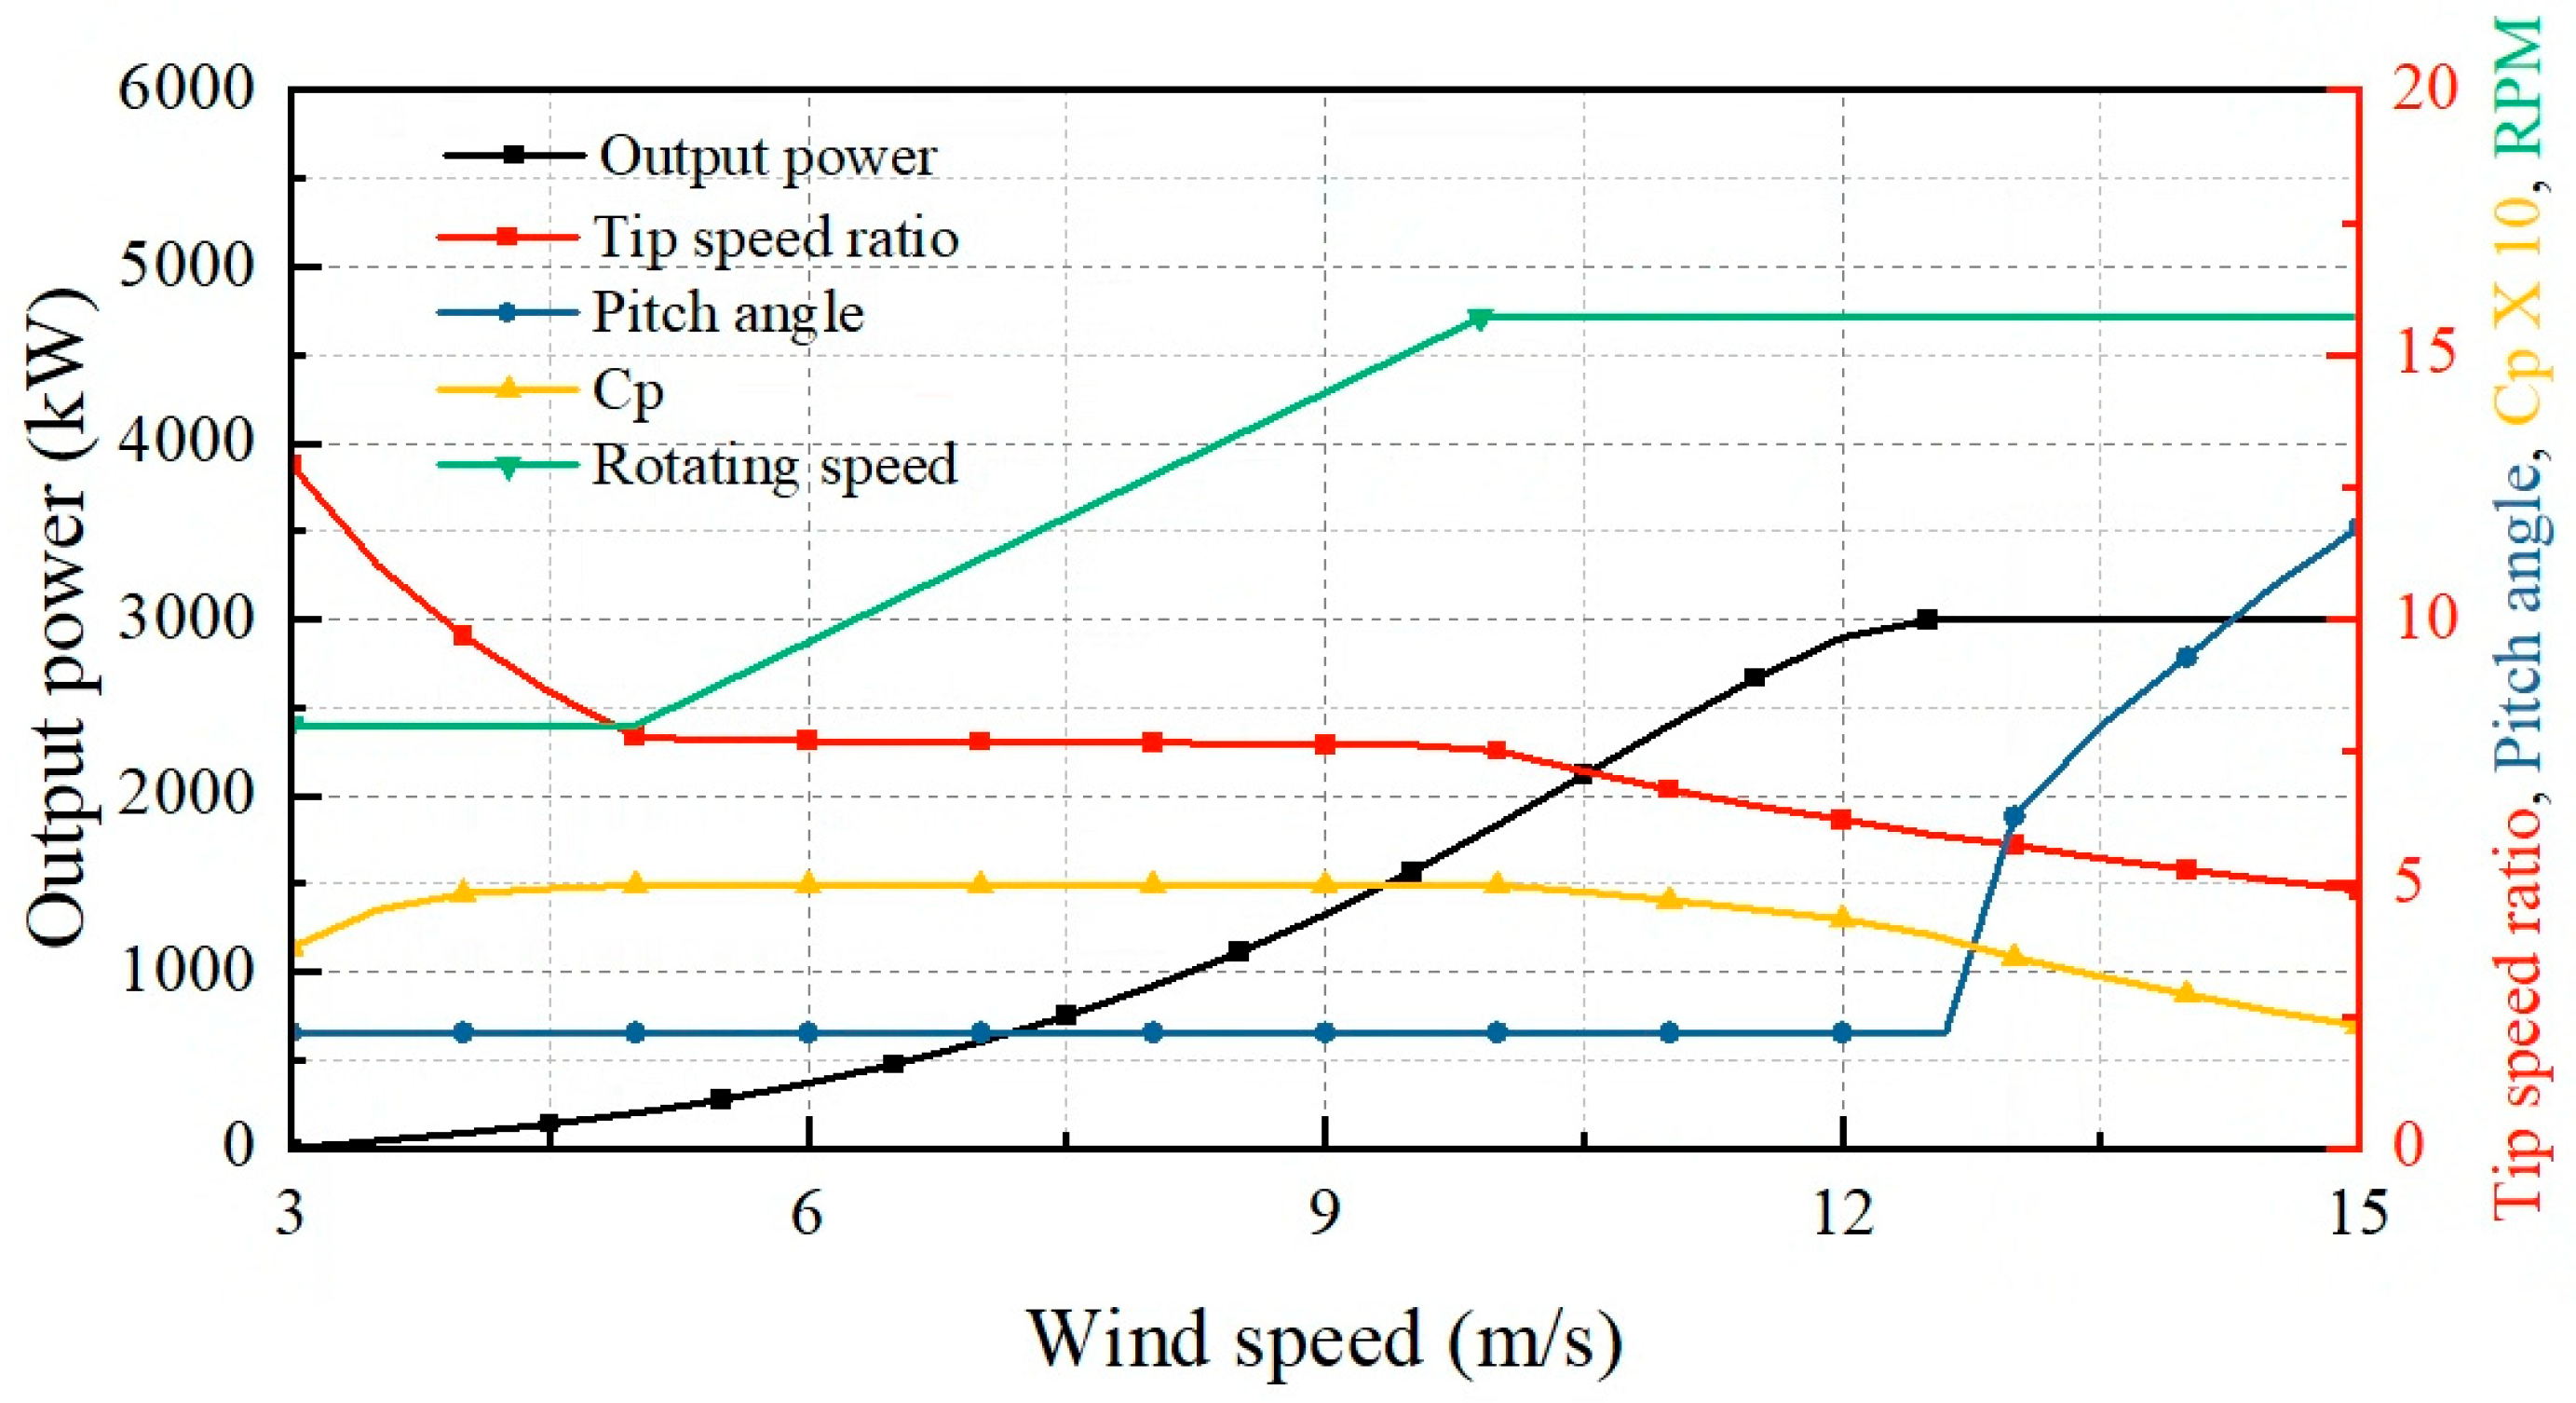
Figure 2 illustrates the characteristic curves of the target wind turbine, representing the design specifications. These curves describe the theoretical aerodynamic behavior of the wind turbine operating at the wind farm. The graph presents the output power, rotational speed, pitch angle, power coefficient, and tip-speed ratio as functions of wind speed. Above a wind speed of 10 m/s, the wind turbine reaches its rated rotational speed, and the combined effect of increasing wind speed and constrained rotor speed leads to a reduction in the tip-speed ratio, which in turn affects the power coefficient. In this operating region, torque control is employed to enhance power extraction through maximum power point tracking. As the wind speed approaches the rated value of 13 m/s, pitch control is activated to reduce the aerodynamic power capture by adjusting the blade angle, thereby maintaining the output power at the rated value of 3 MW. The relationships between the rotor speed, blade tip speed ratio, and wind speed follow the standard kinematic definition of the tip speed ratio, as summarized in Equation (1), where λ, R, v, and w are the tip speed ratio, rotor radius, wind speed, and rotor angular speed, respectively. These curves represent the design specifications provided by the manufacturer and are used as reference characteristics for the physics-based numerical model.
Figure 2.
Design curves of the 3 MW turbine: power, rotor speed, pitch angle, Cp, and tip-speed ratio versus wind speed.
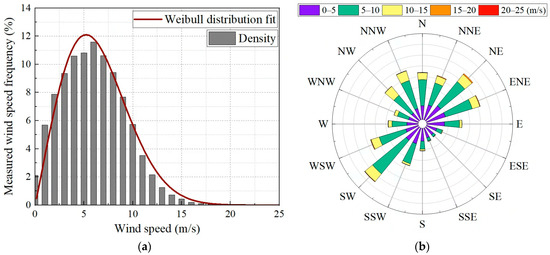
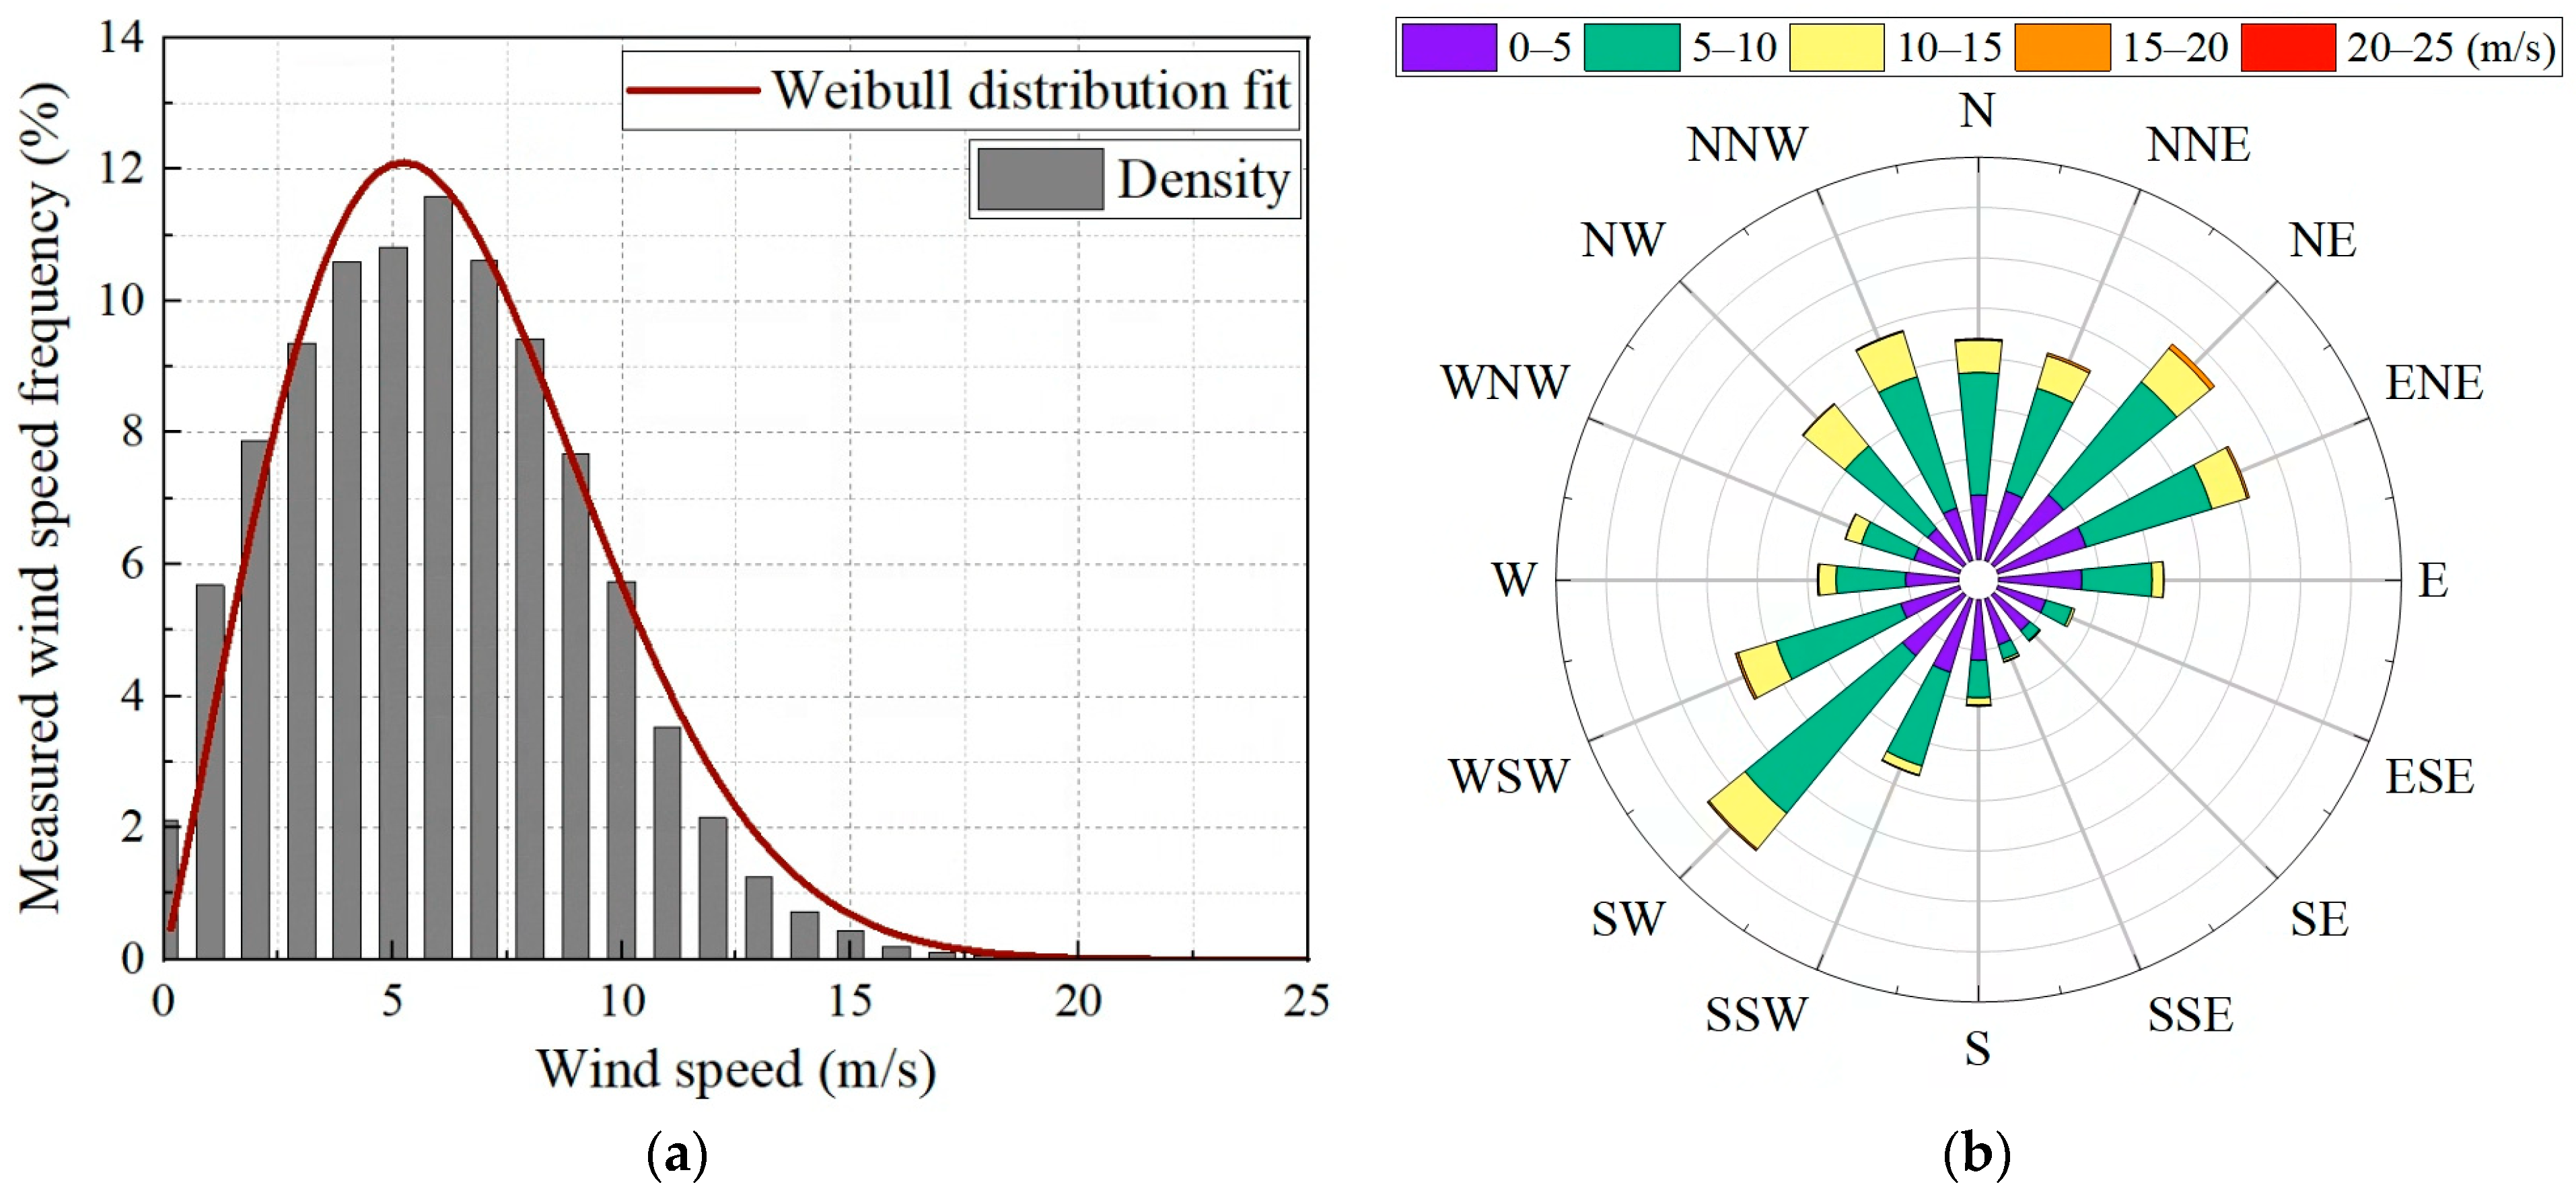
The wind characteristics of the installation site are summarized in Figure 3. In addition to wind speed, wind direction also significantly influences the output power of a wind turbine. However, a detailed analysis of wind direction using SCADA data is challenging due to nacelle movements induced by the yaw control system.
Figure 3.
Wind characteristics of the installation site: (a) wind speed probability density function; (b) wind rose diagram.
Therefore, a preliminary assessment of the wind conditions at the wind farm site was conducted to characterize the ambient wind regime. Figure 3a shows the probability density function of the wind speed. The gray histogram represents the measured wind speed frequency, while the red curve illustrates the fitted Weibull distribution, which characterizes the statistical behavior of wind speed at the site. The Weibull distribution is commonly used in wind energy engineering due to its flexibility in representing the shape and scale characteristics of wind speed variability. It provides a compact statistical description of site wind conditions and is widely adopted for wind resource assessment and long-term wind characterization. It can be observed that the most frequent wind speeds range between 4 m/s and 7 m/s. Figure 3b depicts the wind rose diagram, visualizing the distribution of wind speed and direction. The site exhibits distinct prevailing wind directions concentrated in the southwest and northeast sectors. High wind speed occurrences exceeding 10 m/s are predominantly observed in the southwest direction.
2.2. SCADA Data Acquisition and Preprocessing
A comprehensive operational dataset was collected from the SCADA system of the target wind turbine to develop and validate the proposed digital twin model. The dataset covers a period of one full year, capturing seasonal variations in wind conditions and turbine performance. The data include 10 min averaged records, which are standard for power curve analysis. The collected signals are categorized into environmental inputs, control parameters, and system states. The key variables include wind speed and direction measured at the nacelle, output power, pitch angle, rotational speed, and ambient temperature. Furthermore, to monitor the thermal health of the drivetrain, temperatures of critical components, such as the gearbox and generator windings, were recorded. The raw SCADA data inevitably contain missing values and outliers caused by sensor malfunctions or communication issues. As the quality of the input data directly influences the accuracy of the ROM, a rigorous preprocessing strategy is required. Table 2 summarizes the measurement ranges and units of the collected SCADA parameters.
Table 2.
Operational ranges of the monitored SCADA parameters.
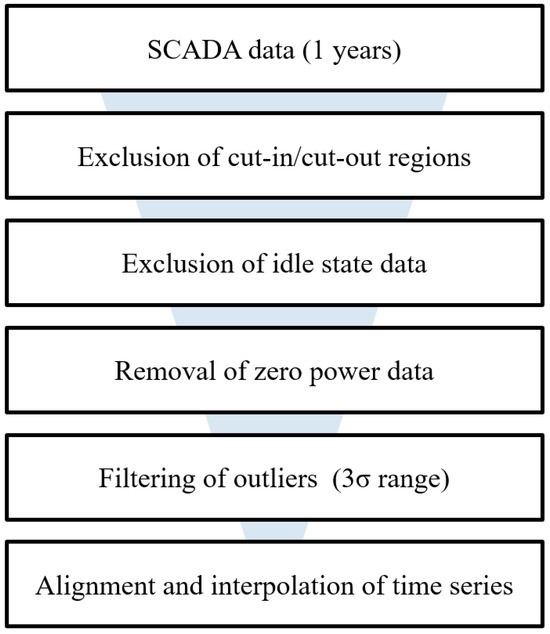
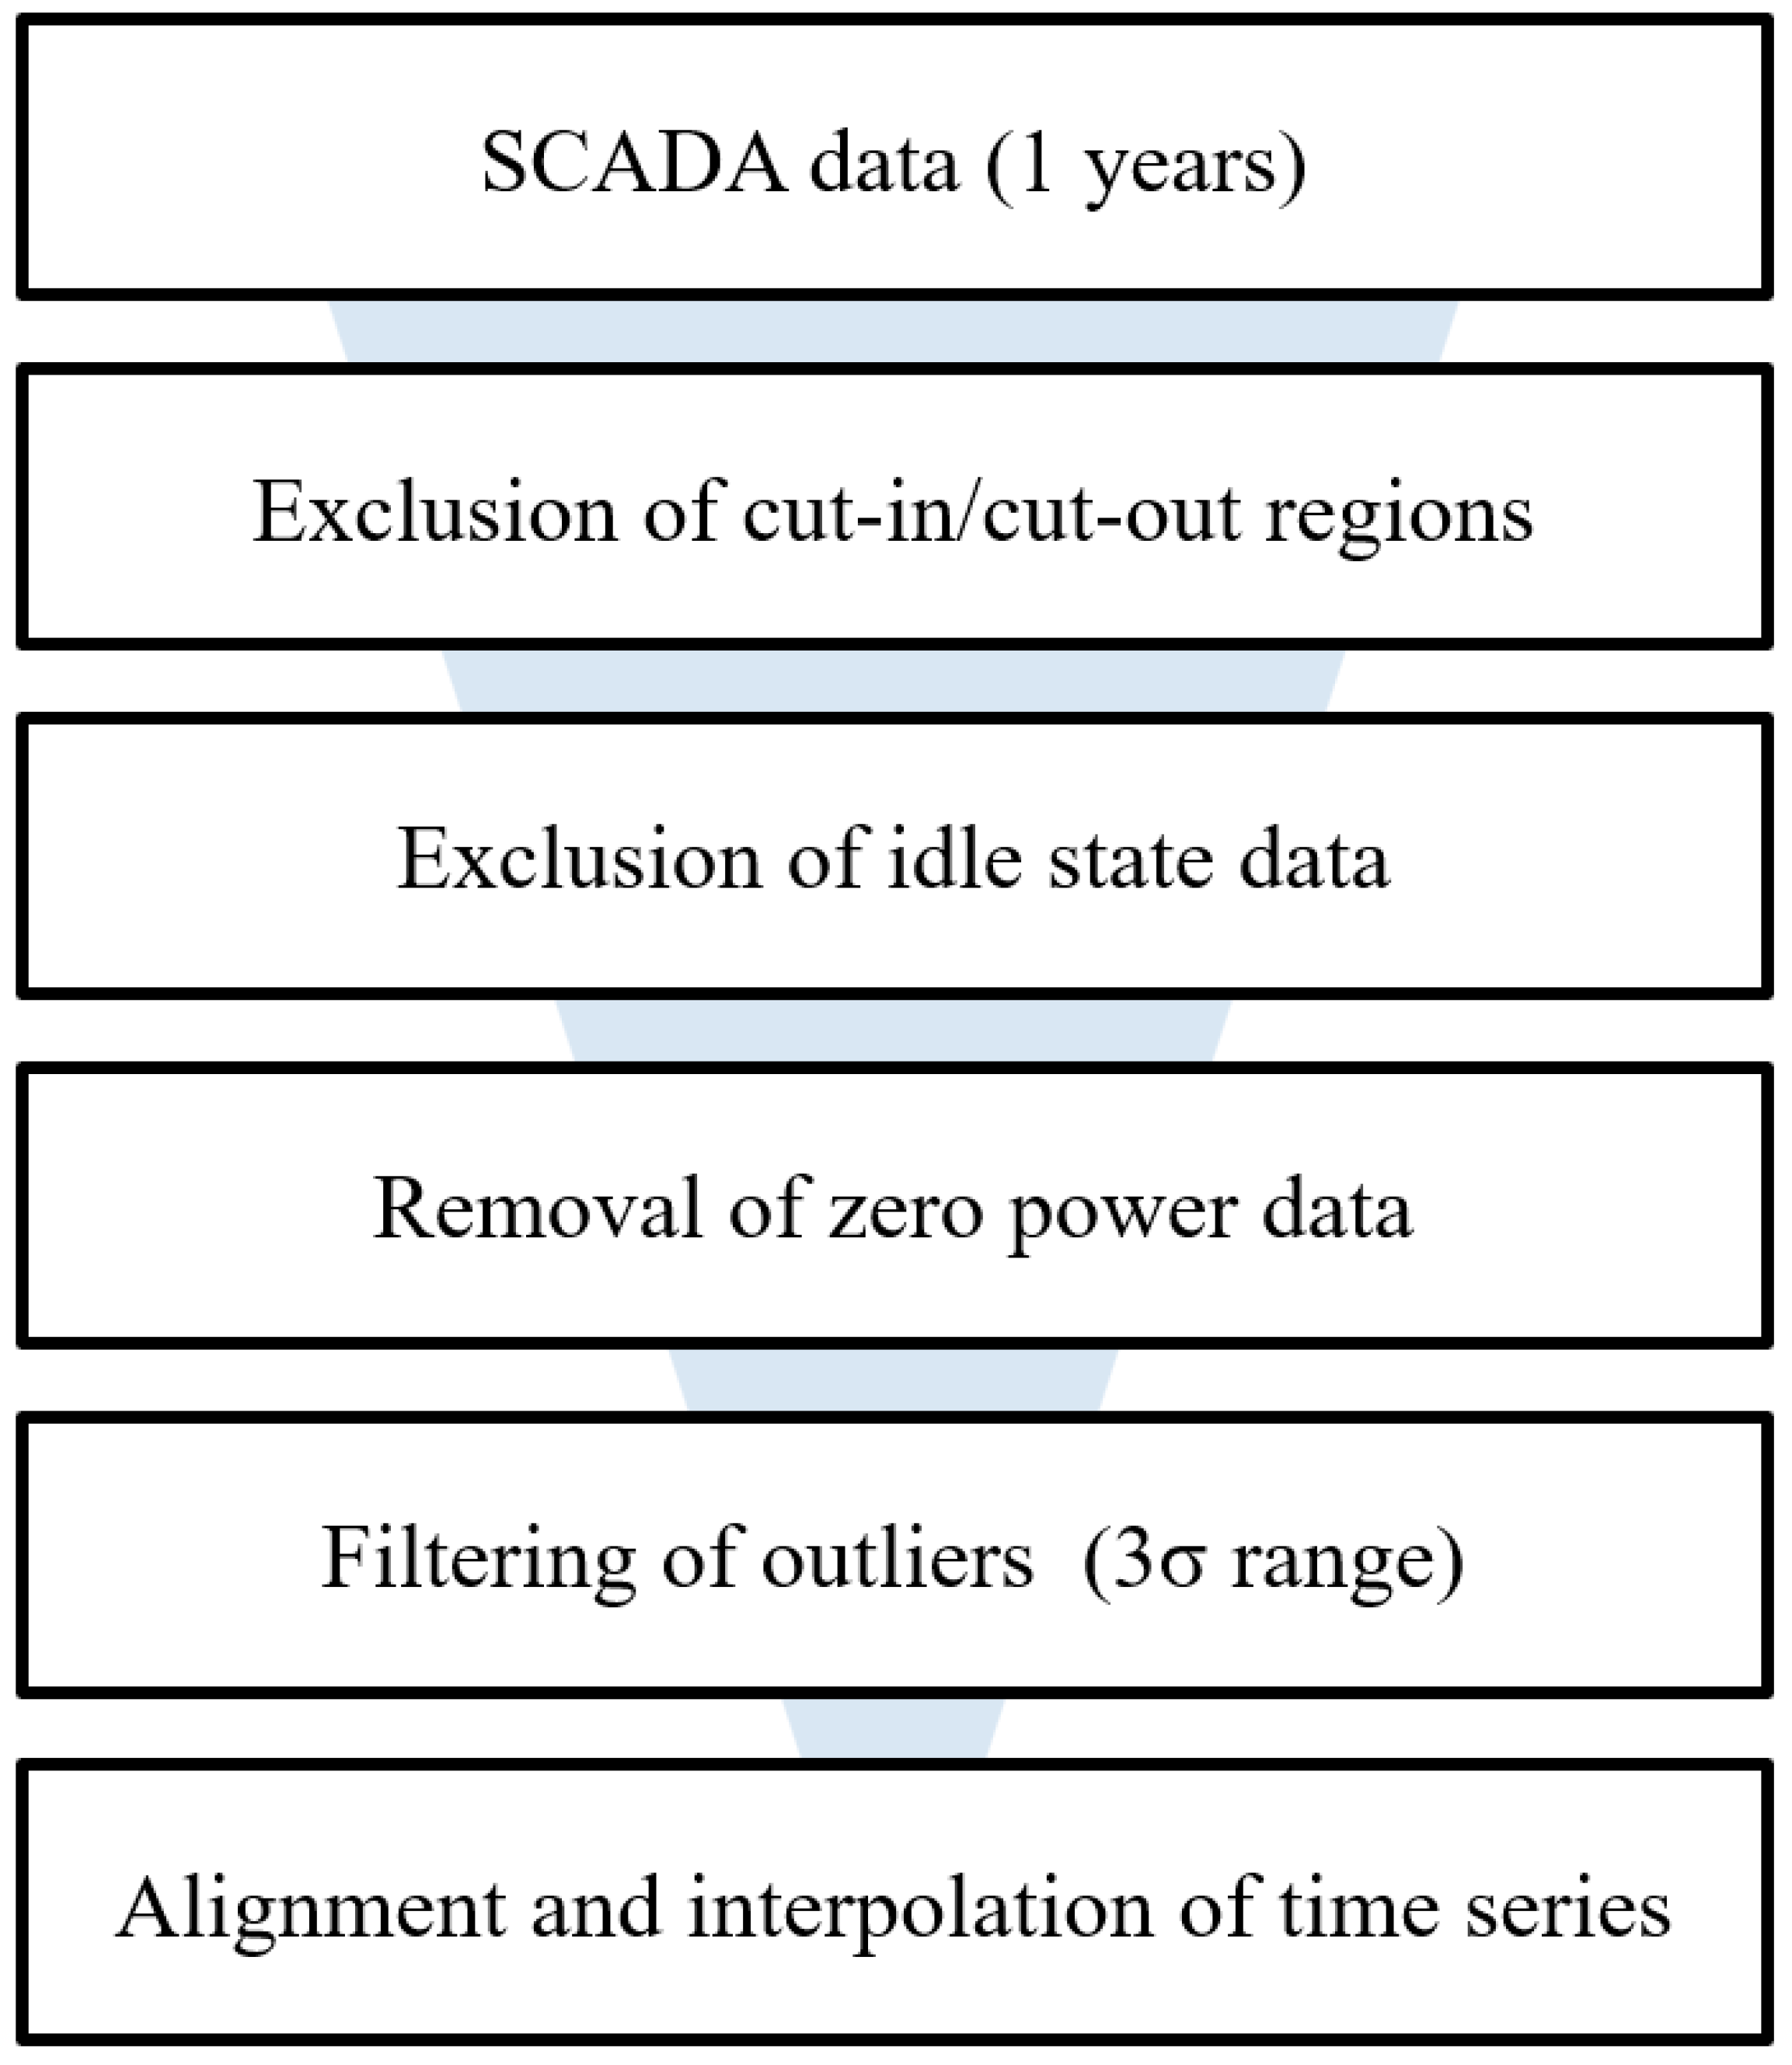
As shown in the table, the dataset encompasses operational variables, including wind speed, wind direction, active power, and component temperatures, which define the physical boundaries of the 3 MW wind turbine. The SCADA data within these ranges may still include non-operational periods or sensor-related anomalies. The multi-stage data preprocessing procedure was implemented to extract a clean dataset suitable for model development, as illustrated in Figure 4.
Figure 4.
Treatment of the SCADA data for modeling of the 3 MW wind turbine.
The preprocessing procedure of the SCADA data begins with the exclusion of cut-in and cut-out regions by removing data points corresponding to wind speeds outside the turbine operational design limits. The operational status of the turbine is categorized using discrete state codes, as summarized in Table 3. Most of the data utilized corresponds to the production state with code 7. However, owing to the 10 min averaged SCADA data structure, some power-generating data were also recorded under other operational state codes. Periods corresponding to error, start, initialization, and low temperature states were excluded to prevent the model from learning abnormal behaviors caused by wind turbine system faults or shutdowns. Following the state-based filtering, data points with zero power output were removed. These cases correspond to conditions where the wind speed was sufficient for power generation, but no electrical power was produced due to curtailment or other operational constraints. Statistical outliers were eliminated using the three-sigma criterion, in which values deviating by more than three standard deviations from the mean were discarded to further improve data integrity. This criterion is widely used in statistical data cleaning because it effectively removes extreme outliers while preserving the majority of physically meaningful data [17]. Finally, alignment and interpolation of time series were performed to synchronize the sampling intervals of different signal groups, ensuring a coherent dataset for physics-based model construction.
Table 3.
Operational state code of the 3 MW wind turbine.
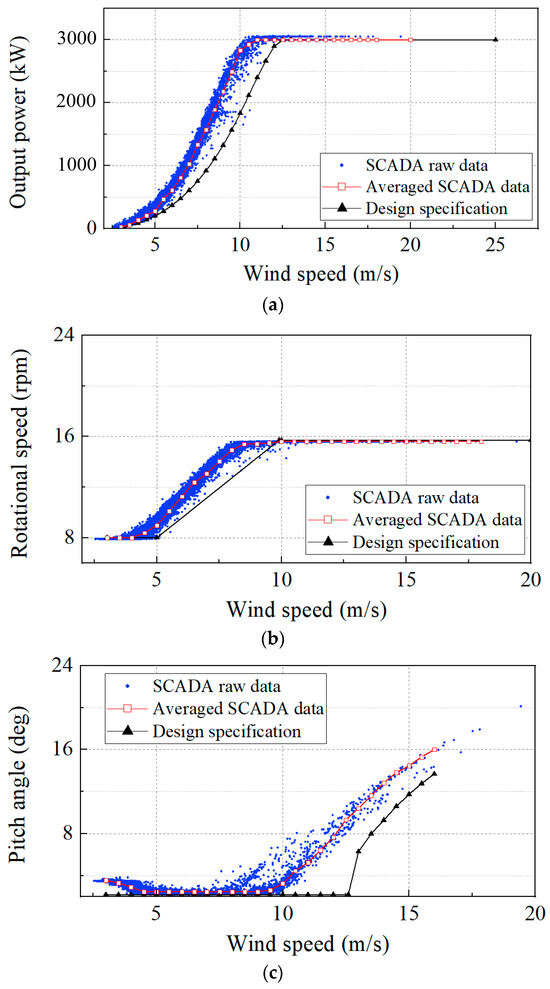
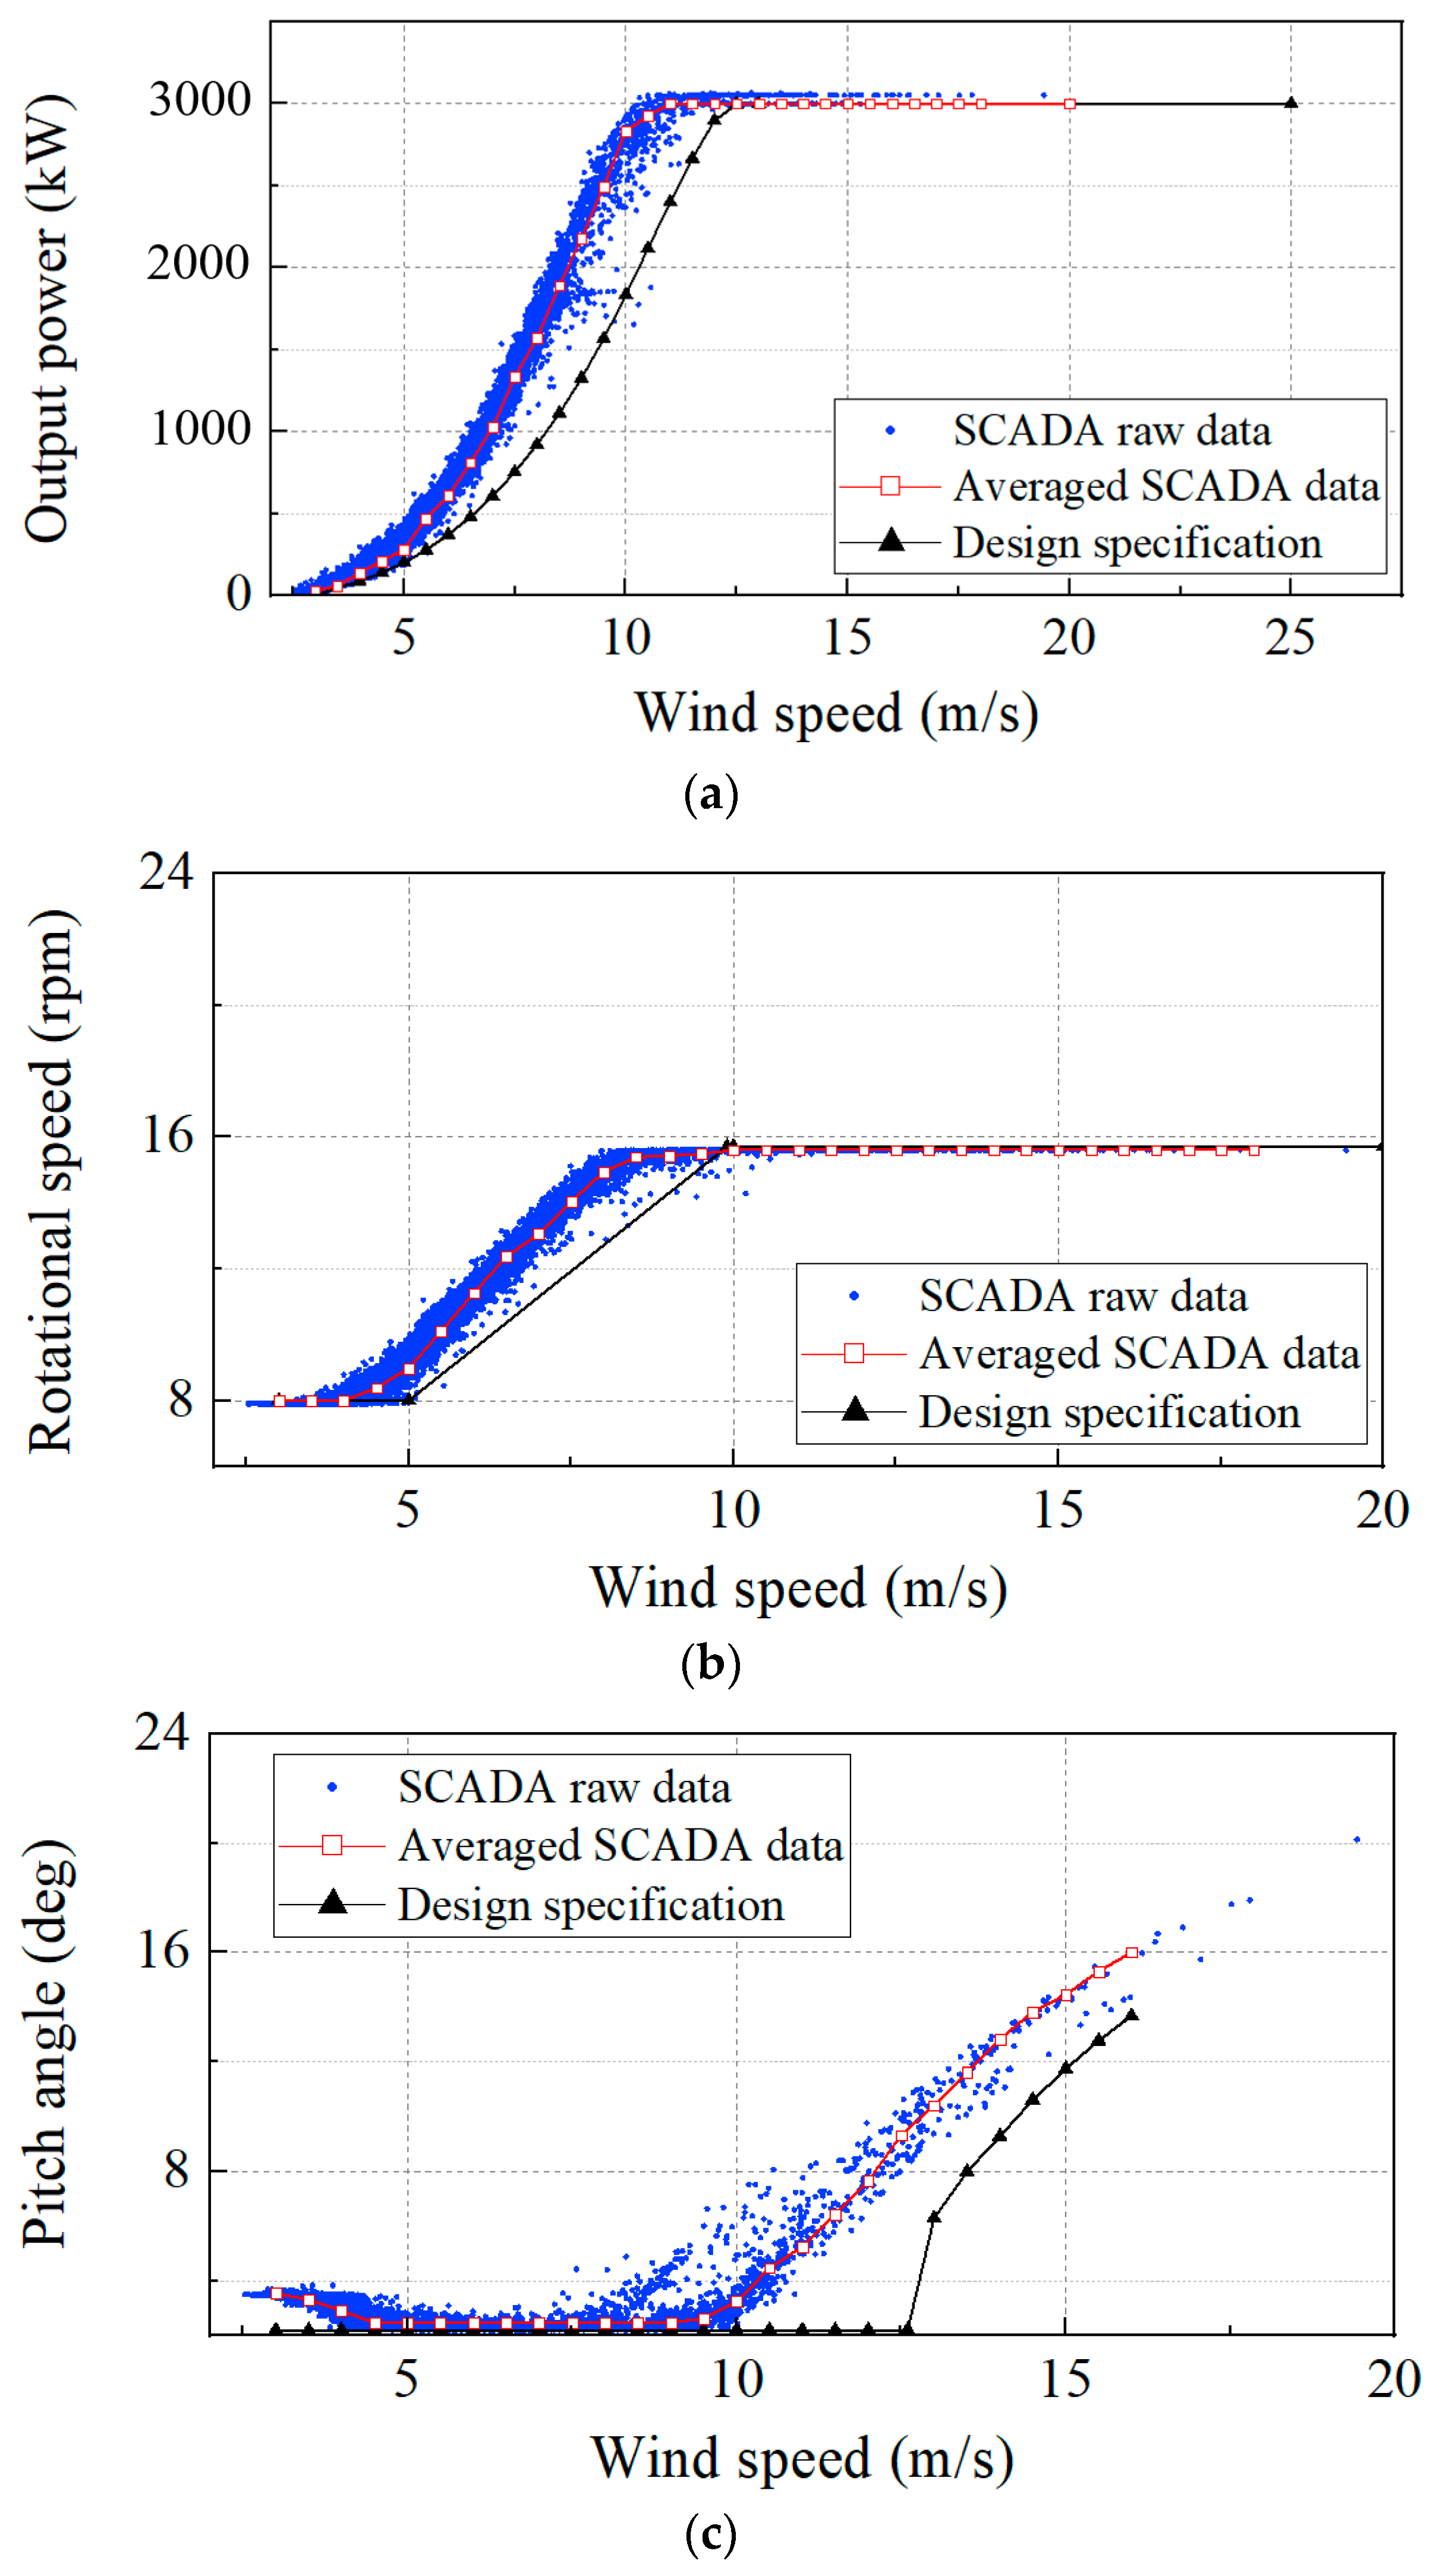
Figure 5 presents a comparative analysis between the field-measured operational characteristics and the theoretical design specifications of the wind turbine. The blue scatter points represent the raw SCADA data, filtered for wind directions close to 0 deg to minimize the influence of yaw misalignment. The red line denotes the bin-averaged SCADA data, reflecting the actual operational trend of the turbine, while the black line indicates the design baseline. A noticeable discrepancy is observed between the measured data and the design curves. As shown in the output power and rotational speed plots, the actual turbine reaches its rated operating conditions at a measured wind speed of approximately 11 to 11.5 m/s, which is significantly lower than the design rated wind speed of 13 m/s. This early attainment of rated operating conditions is also evident in the pitch angle response, where blade pitch control is activated at around 10.5 m/s, considerably earlier than the design setpoint. This discrepancy is primarily attributed to the location of the nacelle-mounted anemometer. Since the wind speed is measured behind the rotor, the recorded values are affected by the wake generated by the rotating blades and the nacelle structure, leading to an underestimation of the actual wind speed. The physics-based model would suffer from substantial errors if the raw SCADA wind speed were used without correction. Therefore, a wind speed calibration procedure is essential to reconstruct the actual wind speed and ensure the accuracy of the digital twin. Therefore, this preprocessing strategy combines statistical filtering with operation-state-based data selection, rather than relying solely on purely mathematical methods, thereby reflecting wind turbine operational characteristics and sensor-level measurement conditions.
Figure 5.
Comparison of SCADA-based operational characteristics and design specifications: (a) output power, (b) rotating speed, and (c) pitch angle.
3. Design of the Physics-Based Model of the 3 MW Wind Turbine
The primary objective of developing a physics-based numerical model is to construct a digital twin representation of the target 3 MW wind turbine using Modelica 4.0.0. The developed model enables real-time simulation by utilizing measured SCADA inputs, such as wind speed and wind direction. These inputs are used to compute the operational state of the wind turbine, as represented by output power, rotational speed, and pitch angle. This virtual representation serves as an integral component of the proposed health monitoring framework by enabling condition diagnosis through direct comparison between real-time measured signals and model-generated outputs. Such comparisons make it possible to identify deviations from normal operating behavior and to detect performance degradation or system faults. The physics-based model is used to generate design-consistent turbine outputs based on SCADA inputs, which serve as inputs to a ROM for thermal state prediction. In particular, the ROM is employed to predict complex component temperatures, such as gearbox oil and bearing temperatures, which are difficult to estimate accurately through real-time simulation. Implementation of the physics-based model requires the integration of the original design specifications with actual operational states captured in the SCADA dataset. As discussed in Section 2, measurement distortions introduced by nacelle-mounted anemometry prevent the raw SCADA data from directly matching the ideal design curves. This chapter focuses on the implementation of the physics-based model and the calibration of wind input data, ensuring that the wind speed and wind direction signals processed by the virtual model produce outputs consistent with the actual turbine performance.
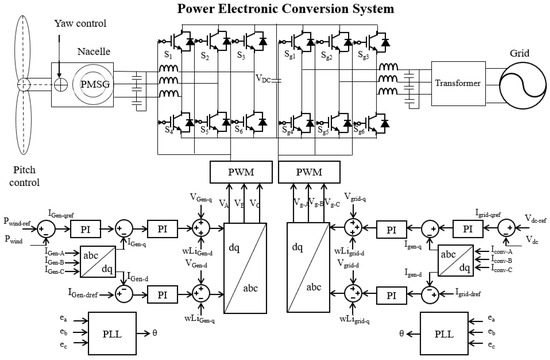
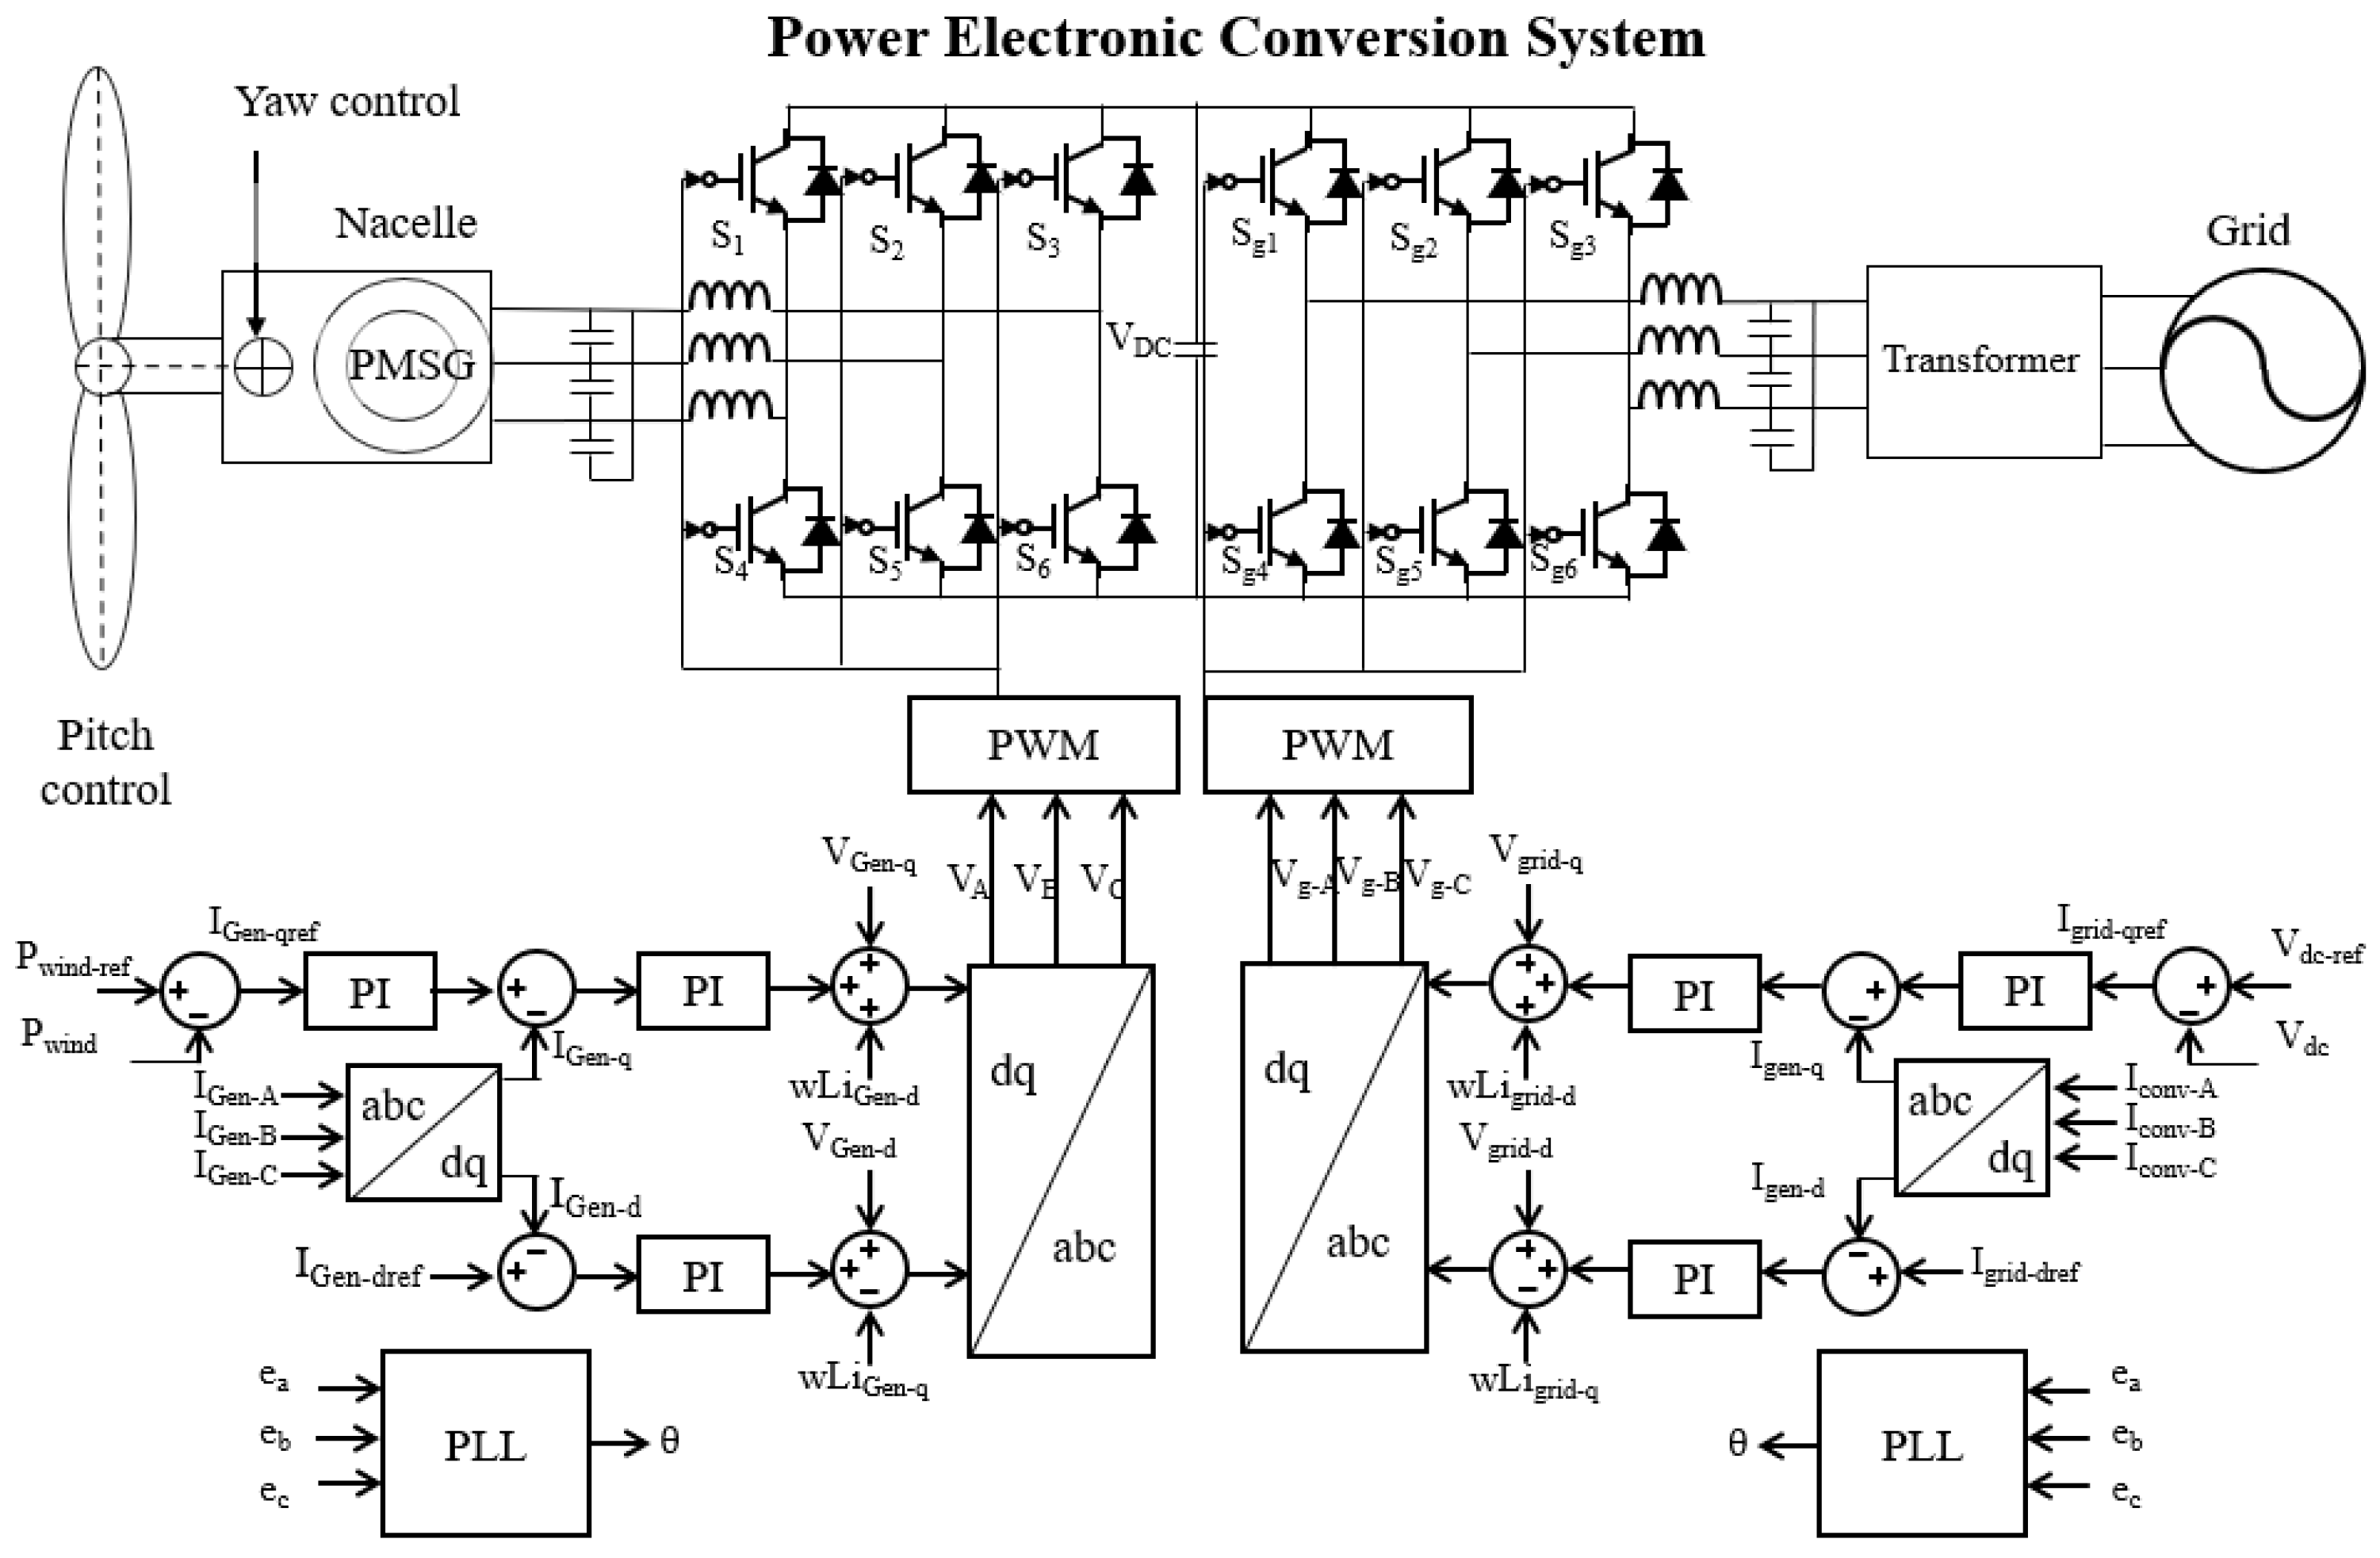
Figure 6 illustrates the overall configuration of the 3 MW wind turbine system. The physics-based model of the wind turbine consists of the generator unit, a back-to-back power electronic converter, and the grid side. The generator-side converter regulates the electrical output of the generator to enable efficient energy extraction from the wind. The grid-side converter maintains the DC-link voltage and ensures stable power delivery to the grid through the transformer. A DC-link capacitor connects the two converters and acts as an energy buffer to decouple generator-side and grid-side dynamics.
Figure 6.
Configuration of the 3 MW wind turbine.
The wind turbine and power conversion system is implemented as a numerical model within the Modelica environment to replicate the electrical behavior of the operational turbine in real-time. By simulating the performance of the wind turbine illustrated in the block diagrams, the model provides a baseline for comparing virtual output data with SCADA measurements.
Based on this system configuration, the physical behavior of the wind turbine is described using a set of governing equations that represent the aerodynamic power conversion and rotational dynamics. The following equations were applied to the wind turbine system, Equations (2)–(5):
where P is the output power of the wind turbine, p is the air density, Cp (λ,β) is the power coefficient as a function of the tip speed ratio λ and blade pitch angle β. The rotational dynamics are described by the wind turbine inertia J, and the mechanical and electrical torques Tm and Te.
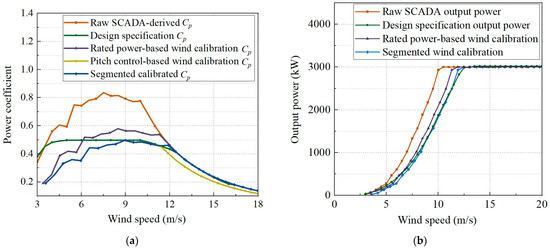
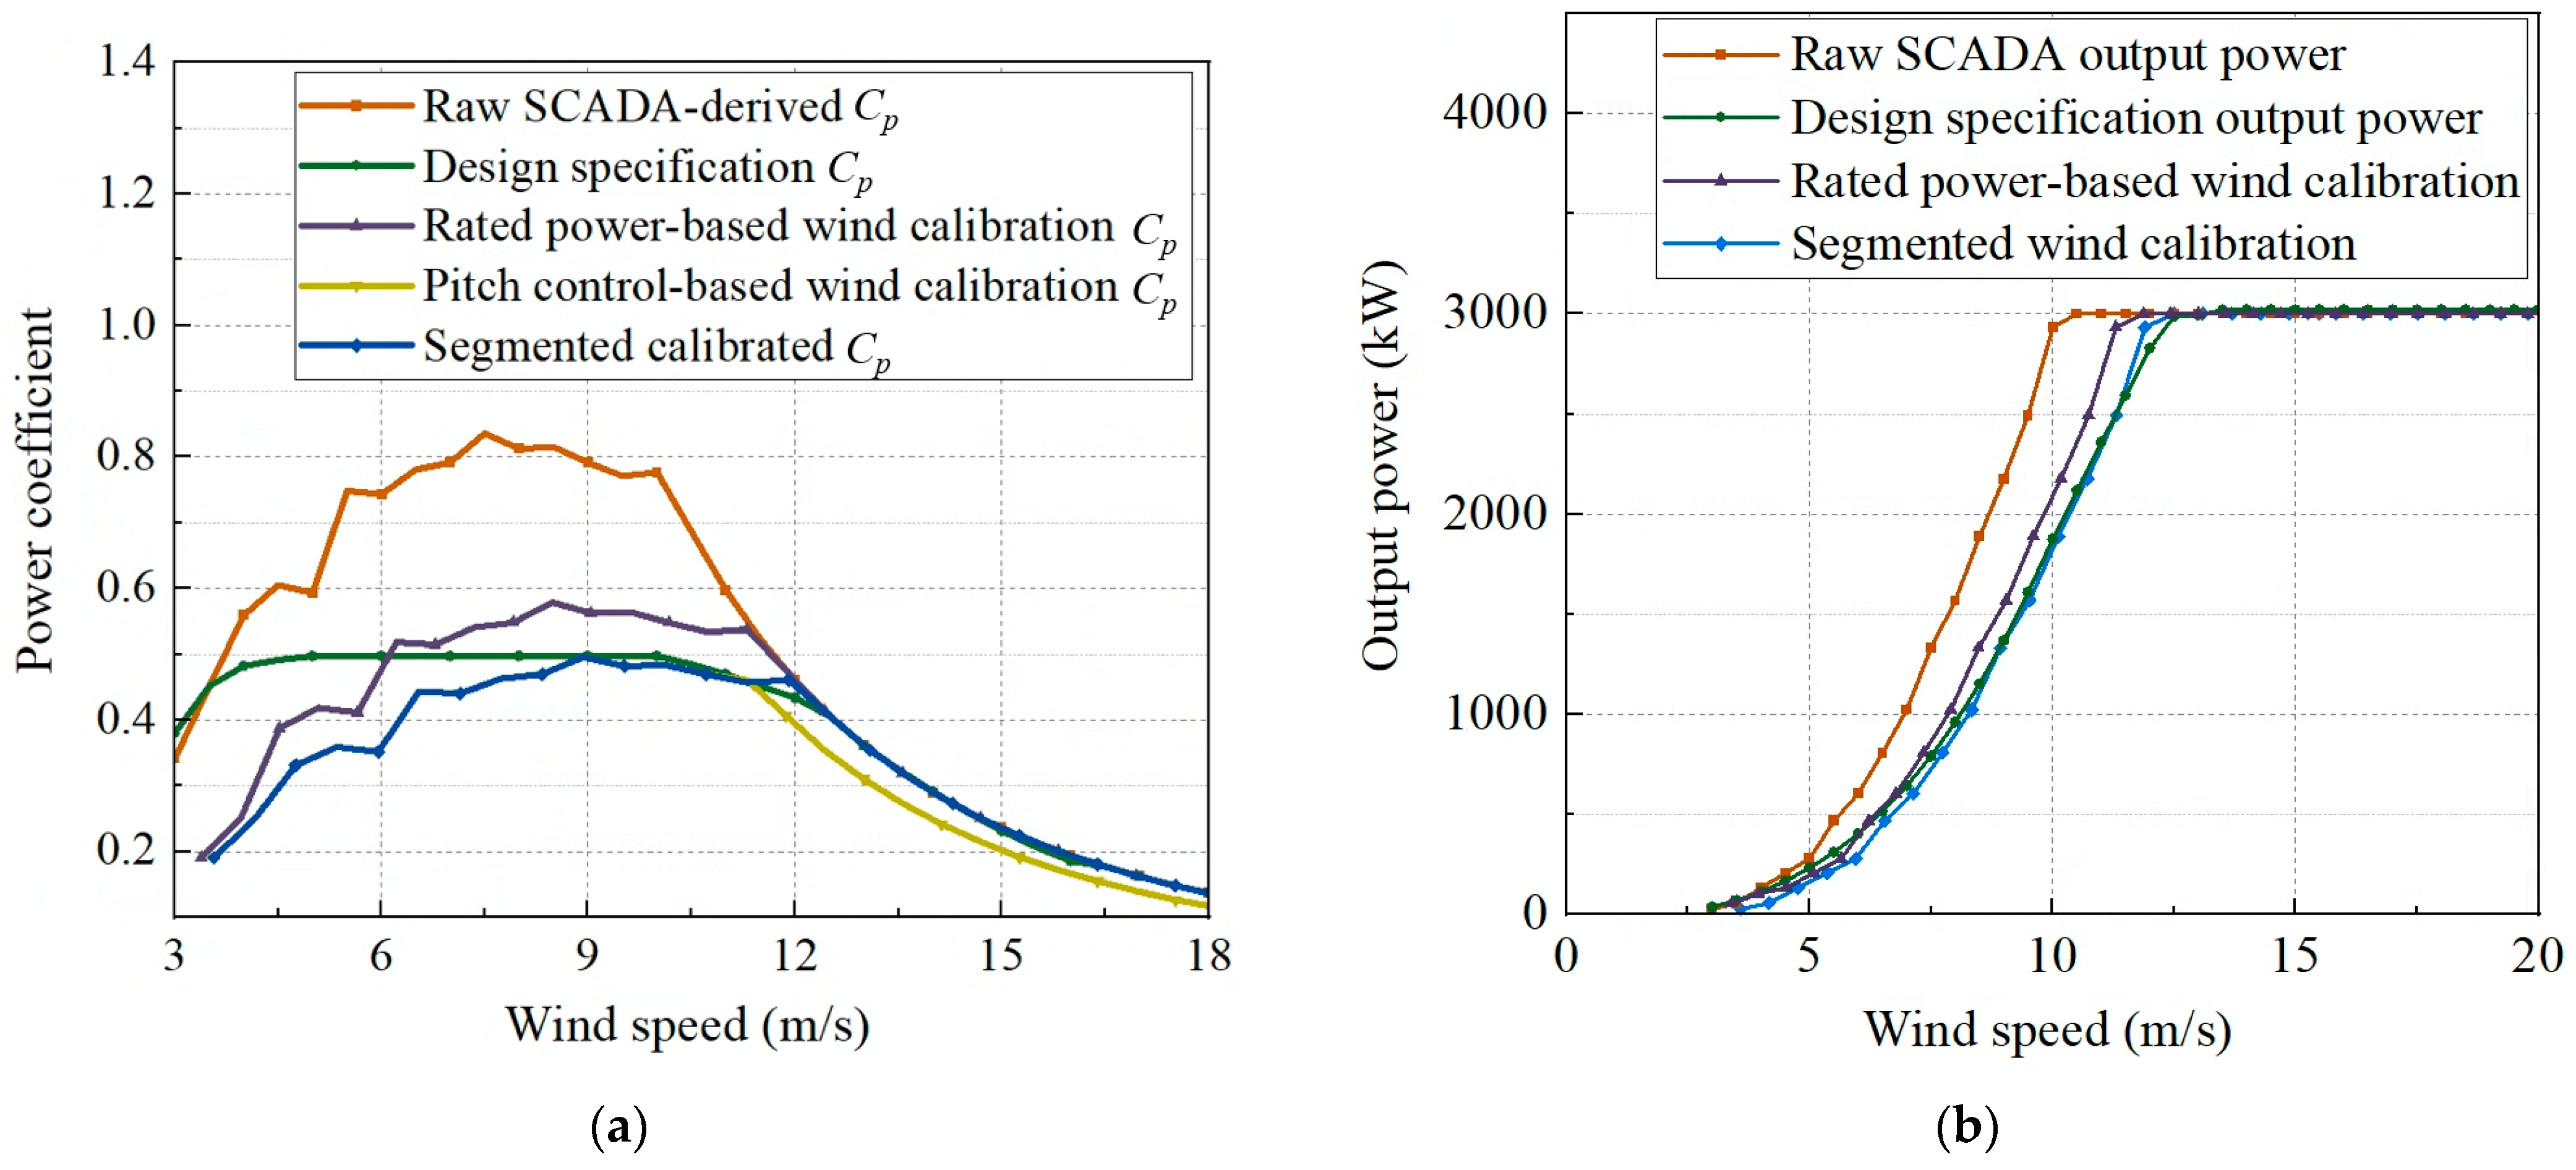
Figure 7a illustrates the calibration process of the power coefficient of a wind turbine using SCADA data to improve the accuracy of the digital twin model.
Figure 7.
(a) Power coefficient calibration process using SCADA data, incorporating wind speed corrections based on rated power and pitch control characteristics; (b) comparison of wind turbine output power curves derived from raw SCADA data, design specifications, and calibrated wind speeds, including the rated power-based wind calibration and the segmented wind calibration.
An initial comparison between the power coefficient derived from raw SCADA measurements and the design specification shows that the Cp values from SCADA are consistently higher than the nominal design curve in the load operating region.
This discrepancy is due to the wind speed being measured behind the nacelle, where wake effects cause the recorded values to be lower than the actual inflow wind speed. Therefore, to develop a digital twin model that utilizes SCADA inputs, it is essential to calibrate the measured wind speed into an effective wind speed.
An analysis comparing the SCADA measurements with the original wind turbine specifications revealed a systematic discrepancy in the wind speed associated with the rated output. While the turbine is designed to reach its rated power at a wind speed of 13 m/s, the SCADA data indicate that the rated output is achieved at approximately 11.5 m/s. Based on this difference, an initial wind speed calibration was performed using the ratio of the rated power wind speeds derived from the design specifications and the SCADA data. However, the initial rated power-based wind speed calibration was insufficient to fully reconcile the operational behavior with the design baseline. While the design specifications indicate that pitch angle control initiates at 12.5 m/s, the SCADA data show that pitch control begins at approximately 10.5 m/s. Accordingly, an additional wind speed correction was applied based on the ratio of these pitch control initiation points, resulting in improved agreement of the power coefficient curve near the rated power region.
Despite this improvement, a decrease in the SCADA-based Cp values was observed beyond approximately 11 m/s, which could lead to inaccuracies in reproducing the rated power behavior and pitch control response. Therefore, a segmented wind speed calibration strategy based on piecewise linear scaling was adopted. The calibration gains were determined from the ratios between the design specifications and the corresponding SCADA-observed wind speeds at the pitch activation point and the rated power point. As formulated in Equation (6), the effective wind speed Veff is obtained by applying segment-dependent calibration gains to the measured wind speed Vm. The gains kpitch and krated are computed as the ratios between the design-reference wind speeds and the corresponding SCADA-observed wind speeds at the pitch activation and rated power points, respectively. For wind speeds below 11 m/s, the wind speed was calibrated using a pitch control-based approach, in which the correction factor was derived from the ratio of pitch angle variation between the SCADA data and the design specifications. For wind speeds above 11 m/s, a rated power-based wind speed calibration was applied based on the ratio associated with the rated power condition. This segmented approach enabled the definition of an effective wind speed that consistently satisfies the design specifications across the entire operating range.
Figure 7b presents a comparative analysis of the wind turbine output power curves obtained from raw SCADA data, design specifications, and calibrated wind speeds after the proposed multi-stage wind speed calibration process. The results demonstrate that the calibration effectively aligns the output characteristics of the virtual model with the intended design specifications. While the raw SCADA data indicate that the rated output power is reached at a wind speed of approximately 10.5 m/s due to nacelle-based wind speed underestimation, the segmented calibrated wind speed shifts the rated power point to the design-rated wind speed of 13 m/s, as specified by the manufacturer. By compensating for the discrepancies in nacelle-measured wind speed through the previously discussed segmented calibration strategy, the calibrated output power curve exhibits a high degree of agreement with the theoretical design baseline.
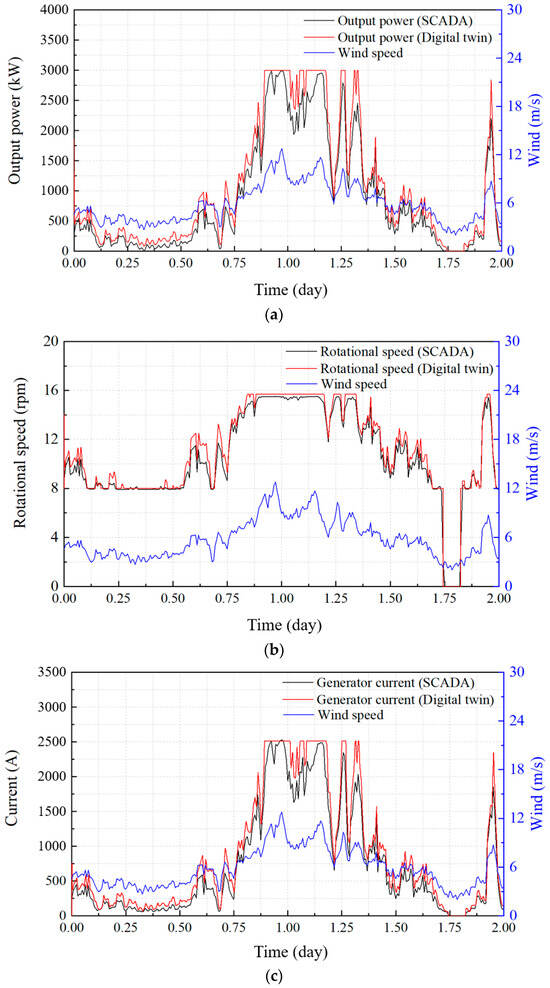
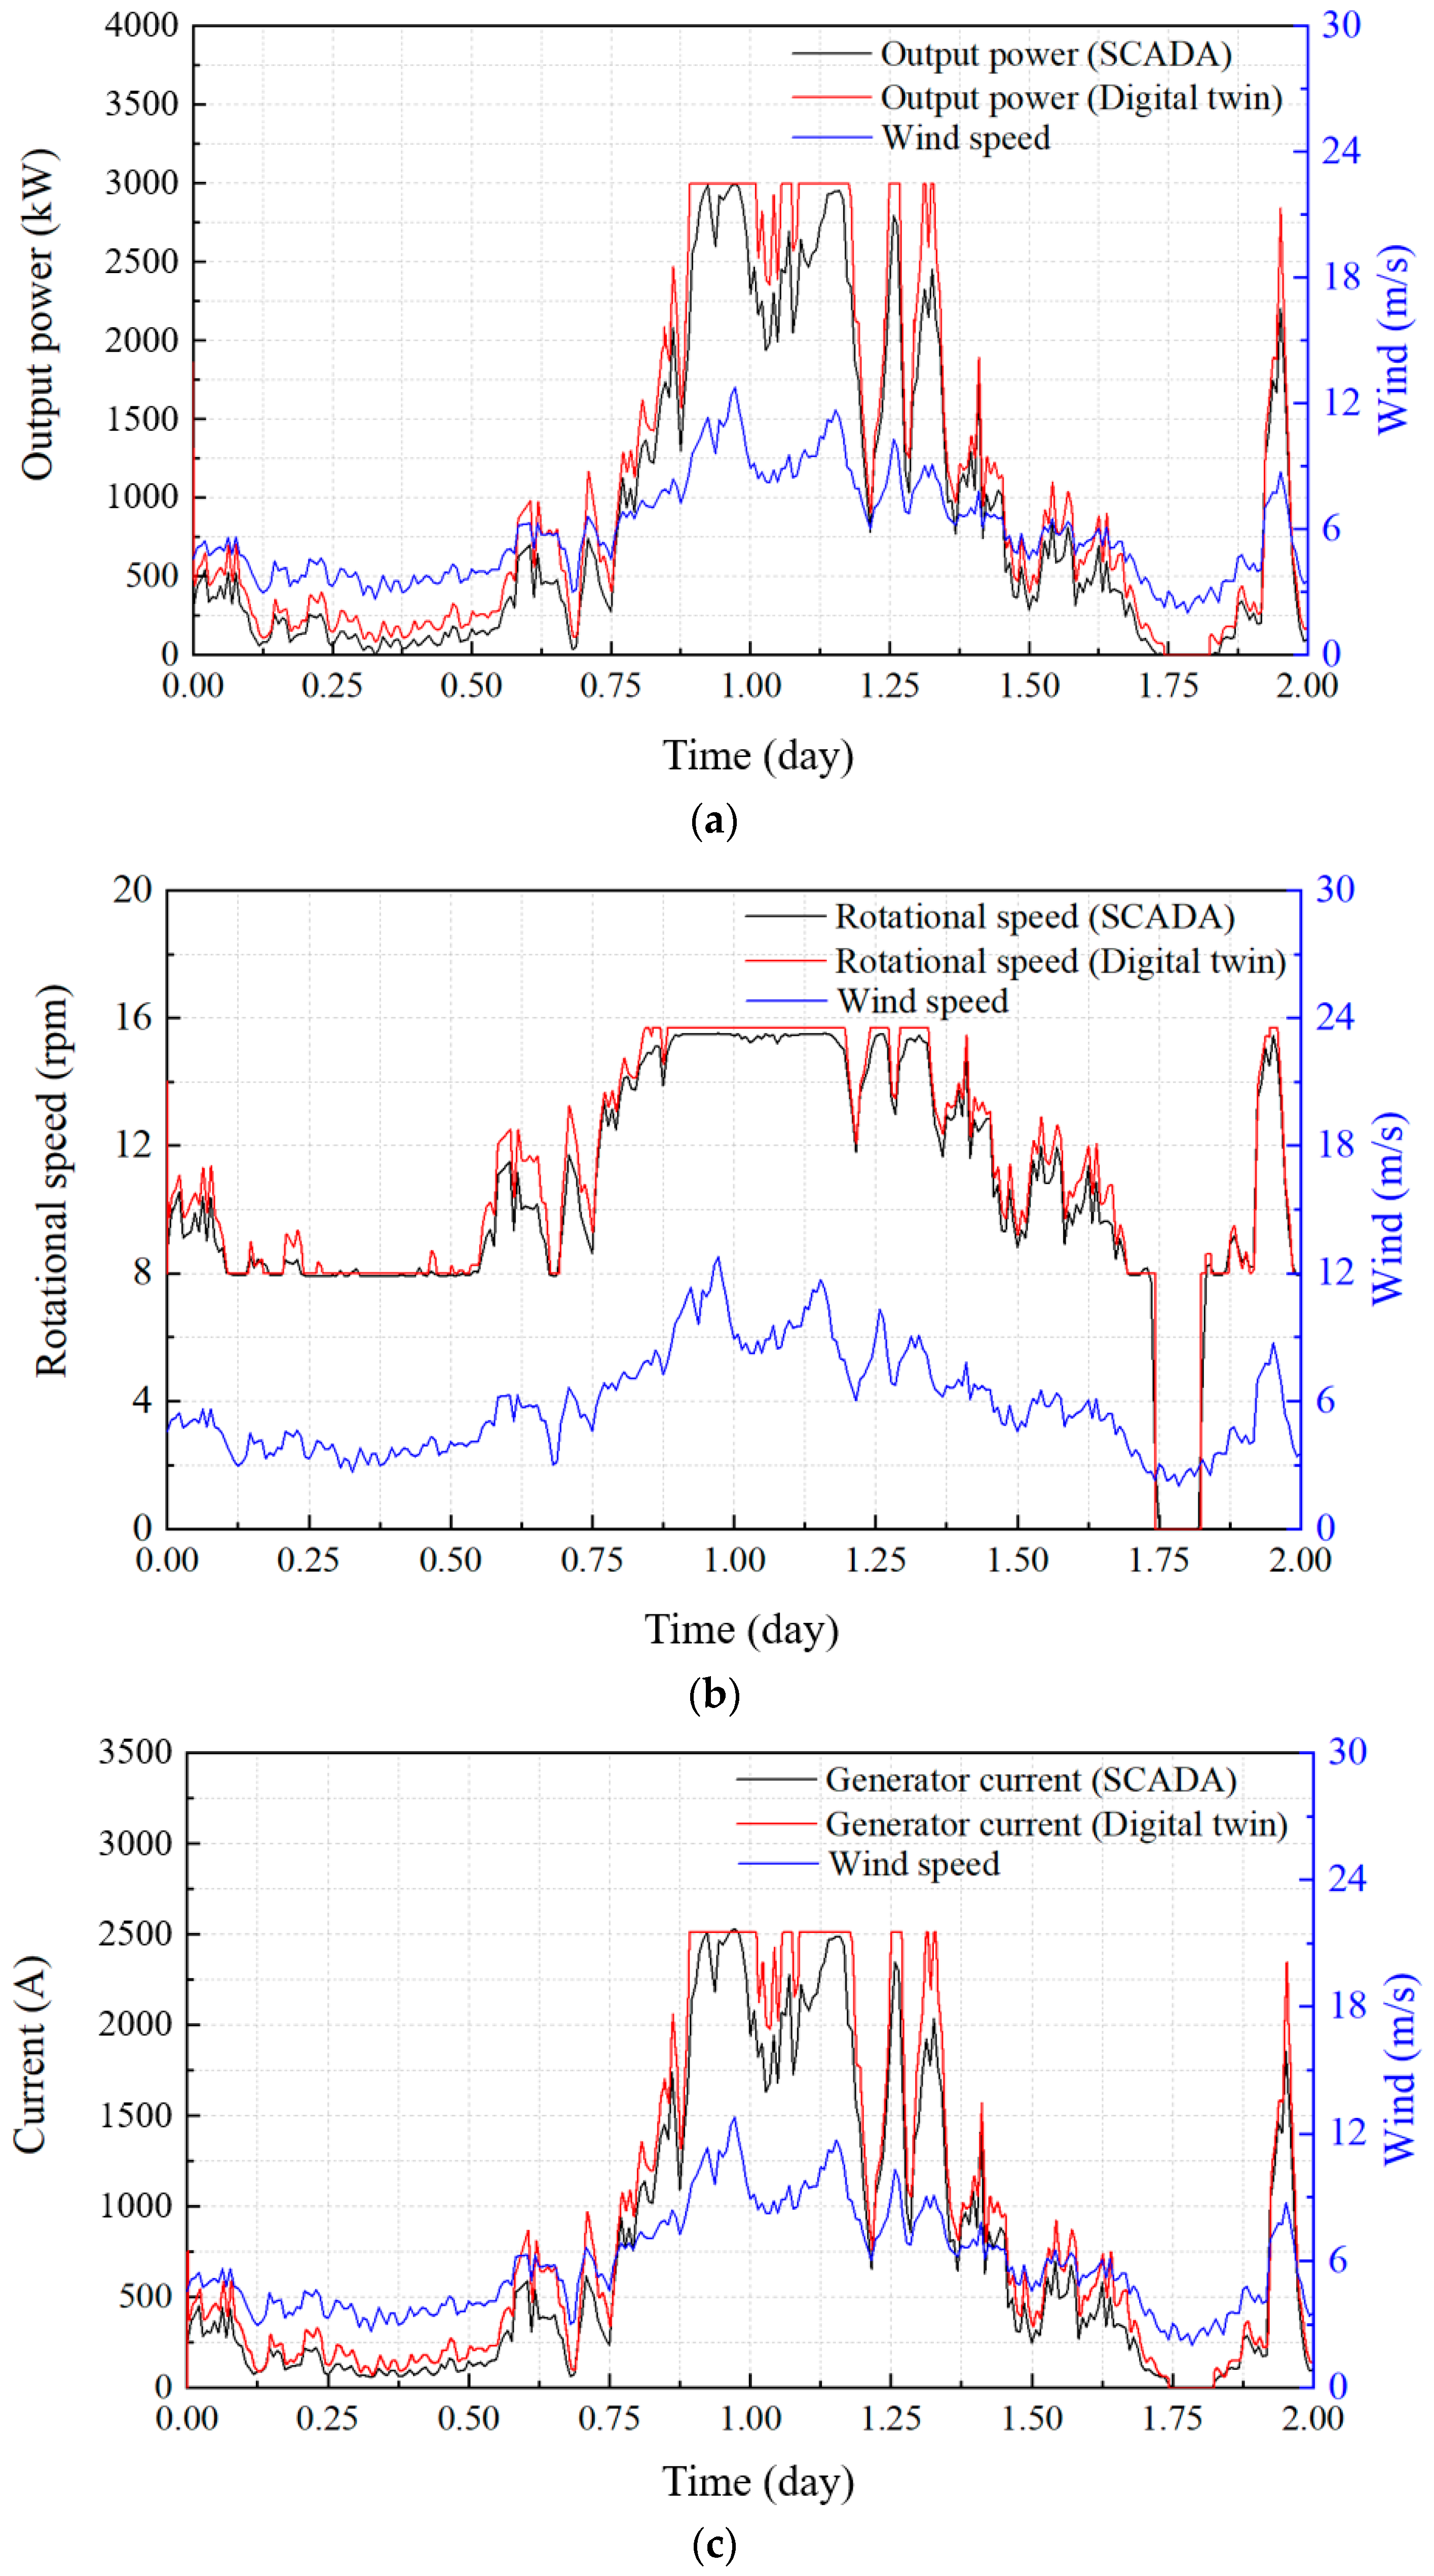
The fidelity of the developed digital twin was evaluated through a time-domain comparison between the SCADA-measured signals and the outputs simulated by the physics-based model. Figure 8 illustrates the comparative results for the output power, rotational speed, and generator current, respectively, over a two-day period under varying wind conditions. The output power simulated by the physics-based digital twin demonstrates agreement with the measured power, effectively reproducing the dynamic power response to time-varying wind conditions. The model accurately reproduces the rapid fluctuations in output power induced by sudden changes in wind speed, particularly around days 0.6 and 1.25. Furthermore, in high wind speed conditions, such as around day 1.0, the simulated power is maintained at the rated capacity of approximately 3000 kW, indicating that the limited power control logic of the physical turbine is precisely replicated within the digital twin environment. The validation of the rotational speed response further confirms that the simulation results closely reproduce the operational behavior observed in the SCADA data. The model successfully captures the transition between the variable-speed region and the constant-speed rated region. When the wind speed exceeds 10 m/s, pitch control is activated, and the rotor speed is regulated to remain close to the rated value of 15.7 rpm, consistent with actual turbine operation.
Figure 8.
Comparison between SCADA-measured data and physics-based digital twin simulations: (a) output power, (b) rotational speed, and (c) generator current.
While the SCADA data contains high-frequency oscillations likely caused by mechanical vibrations and sensor noise, the digital twin provides a stable representation of the underlying physical response. Consistent with the output power results, the simulated current closely follows the measured trend throughout the evaluation period, confirming the electrical consistency of the physics-based model.
Table 4 presents the quantitative accuracy of the physics-based digital twin in reproducing the output power, rotational speed, and generator current, evaluated using the root mean square error (RMSE) and the mean absolute percentage error (MAPE). The results indicate that the digital twin achieves accuracy across all evaluated variables, with RMSE values of 128 kW for output power, 0.68 rpm for rotational speed, and 162 A for generator current. The two-day period was selected as a representative window within the normal operating power range, during which wind speed fluctuations were particularly pronounced. When the model performance was evaluated over a one-month period, the proposed framework showed improved agreement with the SCADA measurements, indicating that the two-day case represents a conservative scenario for assessing dynamic tracking performance. The observed MAPE of approximately 8% in output power and rotational speed can be partly attributed to the mismatch in temporal resolution between the physics-based model outputs, which are generated at a 1 s resolution, and the available SCADA signals, which are provided as 10 min averaged data. In addition, measurement noise and reduced-order modeling assumptions may also contribute to the remaining discrepancy.
Table 4.
Accuracy of the physics-based digital twin model for the wind turbine.
4. ROM-Based Health Monitoring for a 3 MW Wind Turbine
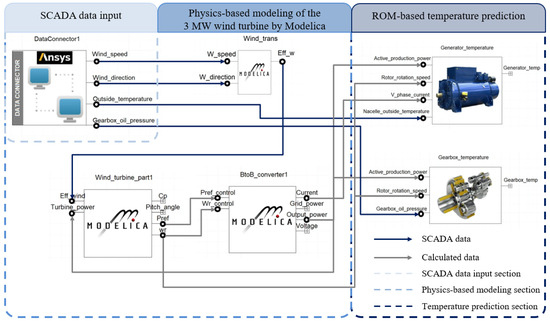
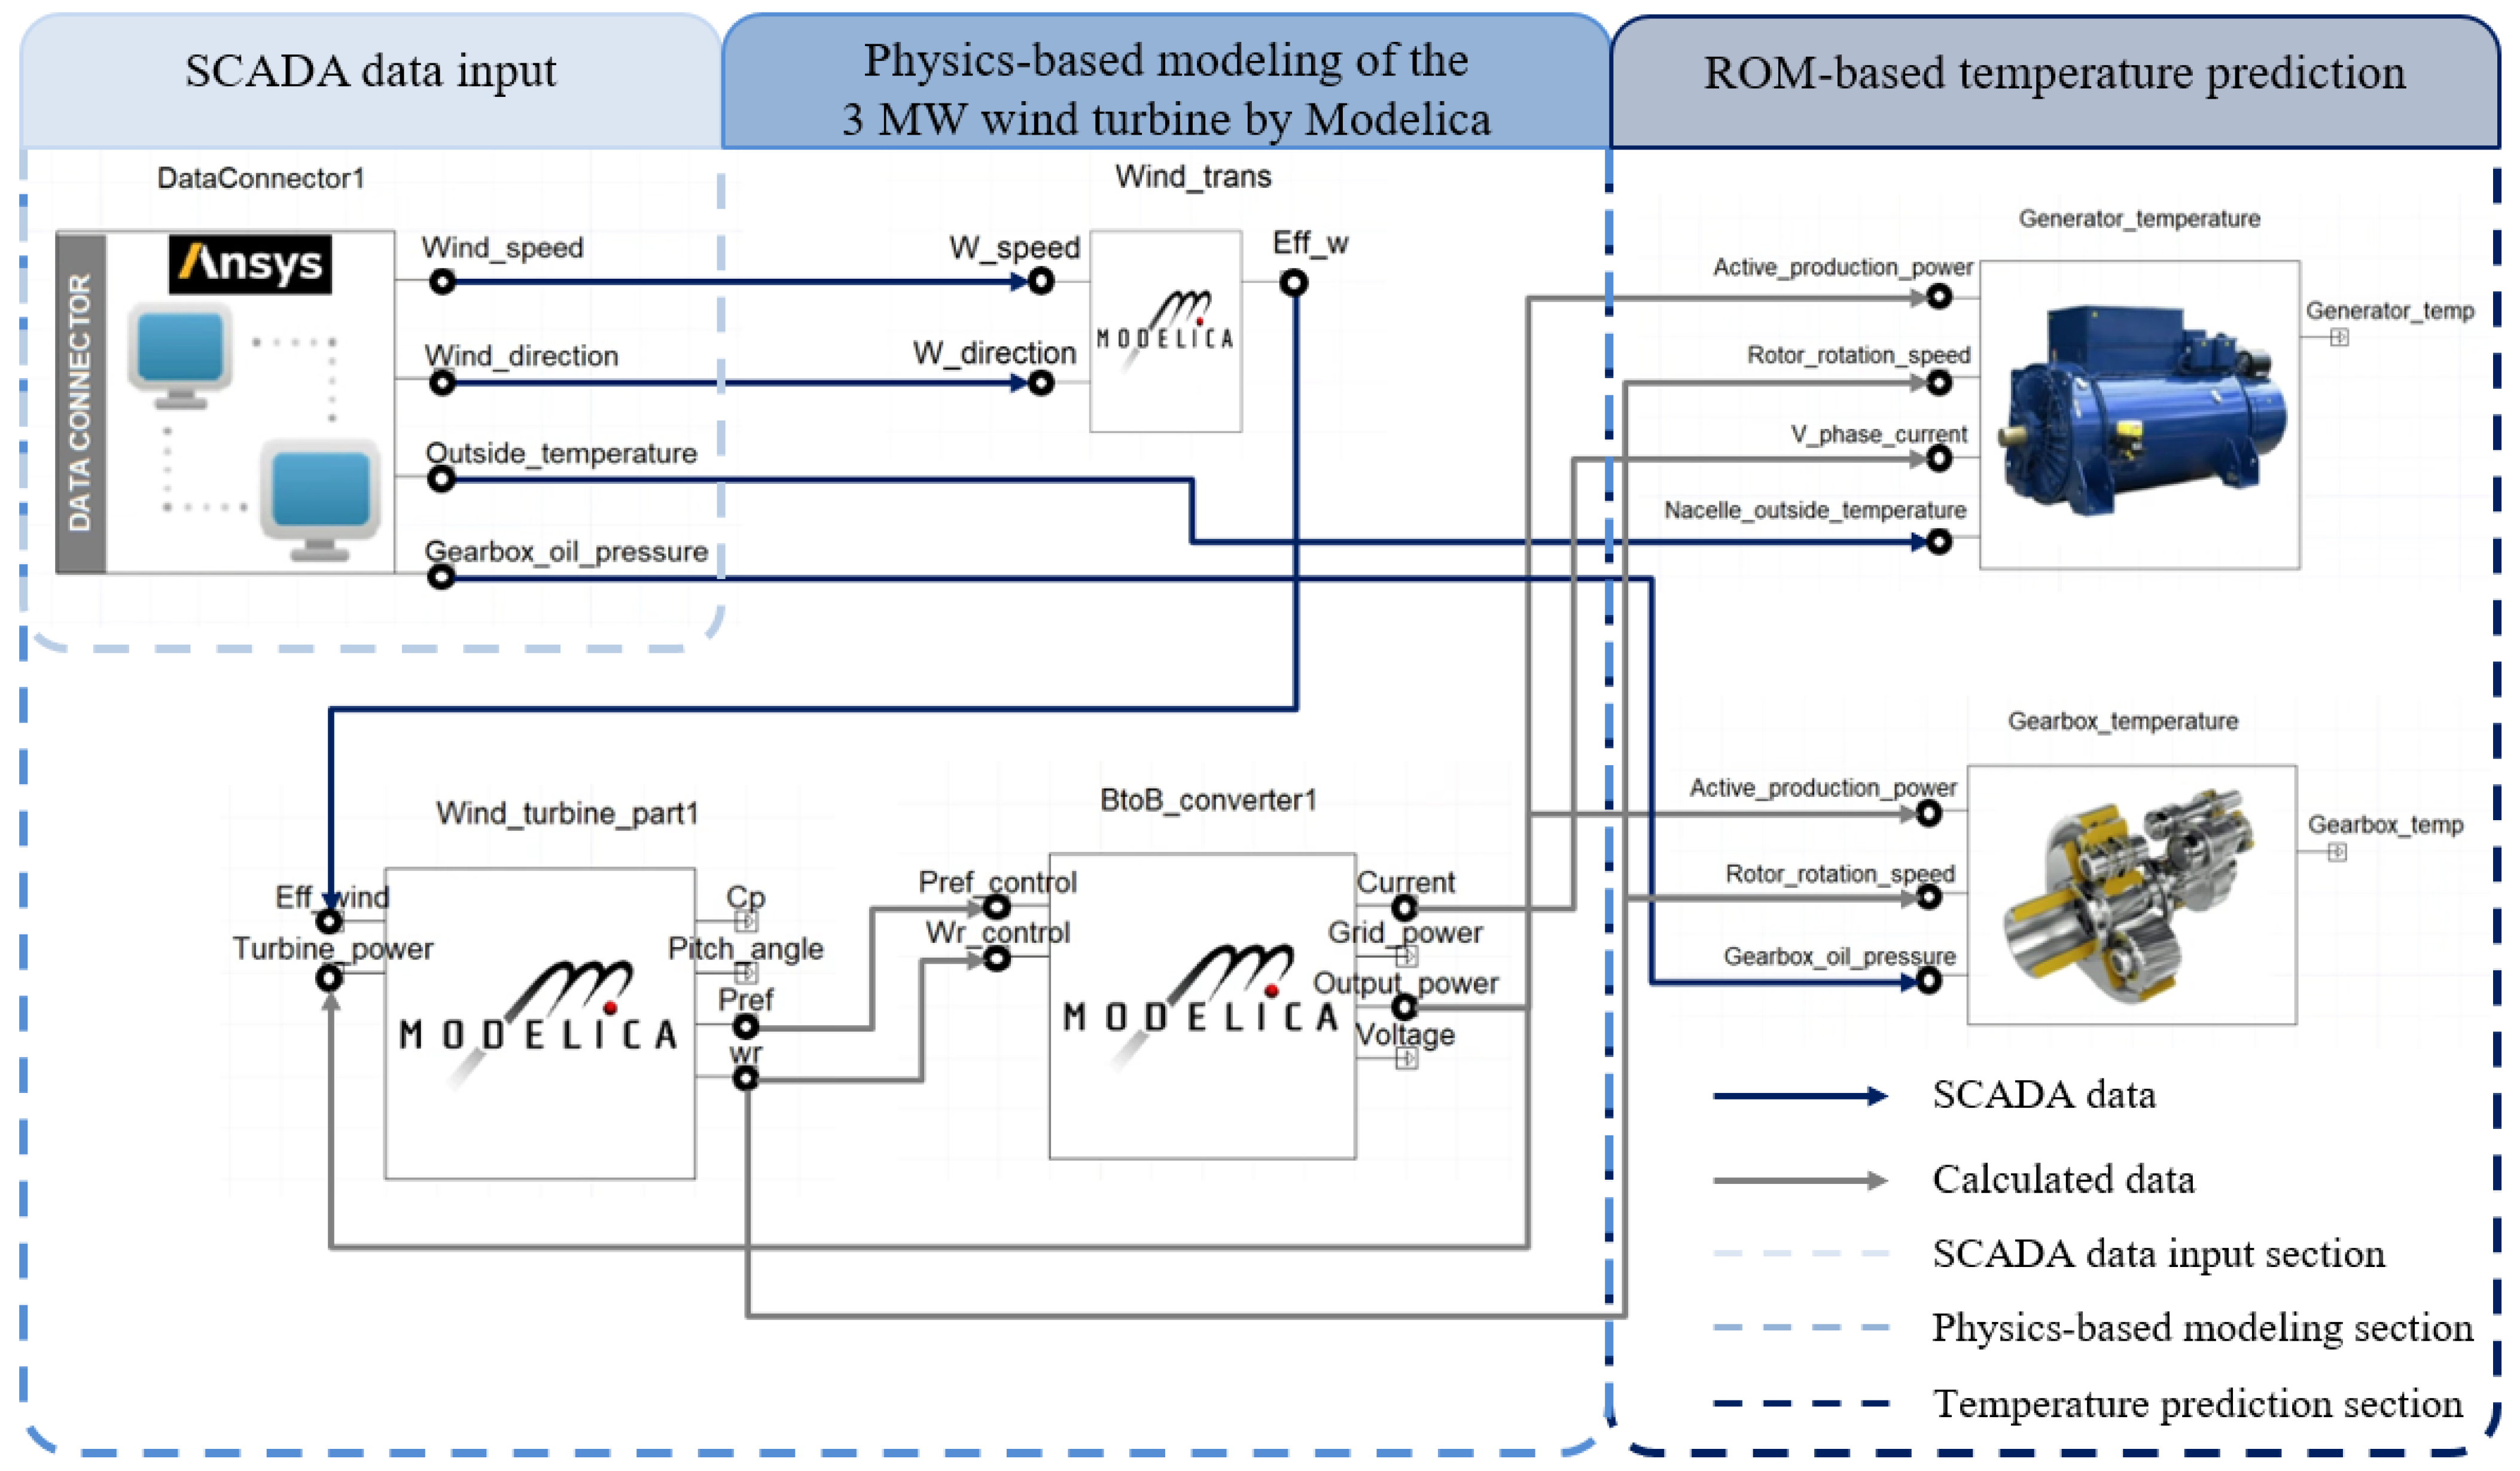
The physics-based model enables real-time estimation of key operational parameters, including output power, rotational speed, pitch angle, and yaw angle, using wind conditions derived from SCADA data. Building upon these computed results, a state prediction framework based on a ROM is introduced to address the challenges associated with modeling generator and gearbox temperatures. The ROM-based approach reduces the mathematical complexity associated with detailed thermal modeling while maintaining sufficient predictive accuracy, thereby providing a robust and computationally efficient solution for monitoring the internal thermal states of the wind turbine system. The overall system architecture implemented in Ansys Twin Builder version 2023 R2 is illustrated in Figure 9. The system employs the DataConnector interface to acquire real-time data from the operational server, which serves as the primary input for the physics-based model. Within this framework, the SCADA-derived wind speed and wind direction are processed through Modelica-based libraries to simulate the electrical and mechanical behavior of the 3 MW wind turbine. The thermal behavior of the generator and gearbox is estimated by combining the simulated outputs from the physics-based model with additional environmental parameters obtained from the SCADA system. These combined inputs are used to drive the temperature prediction models for the generator and gearbox. Prior to the development of the ROMs, a correlation analysis was performed to identify the operational variables that significantly influence the thermal states of each component.
Figure 9.
Integrated framework of the digital twin system, illustrating real-time SCADA data acquisition, physics-based numerical modeling of the 3 MW wind turbine, and ROM-based temperature prediction for the generator and gearbox.
The selected variables were subsequently used as optimized training and input datasets for the ROM-based temperature prediction, thereby ensuring fidelity in capturing the complex thermal dynamics of the wind turbine system.
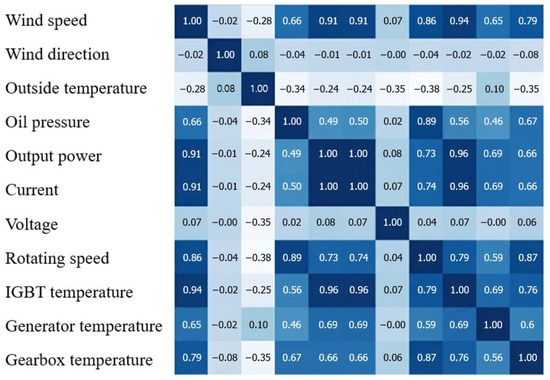
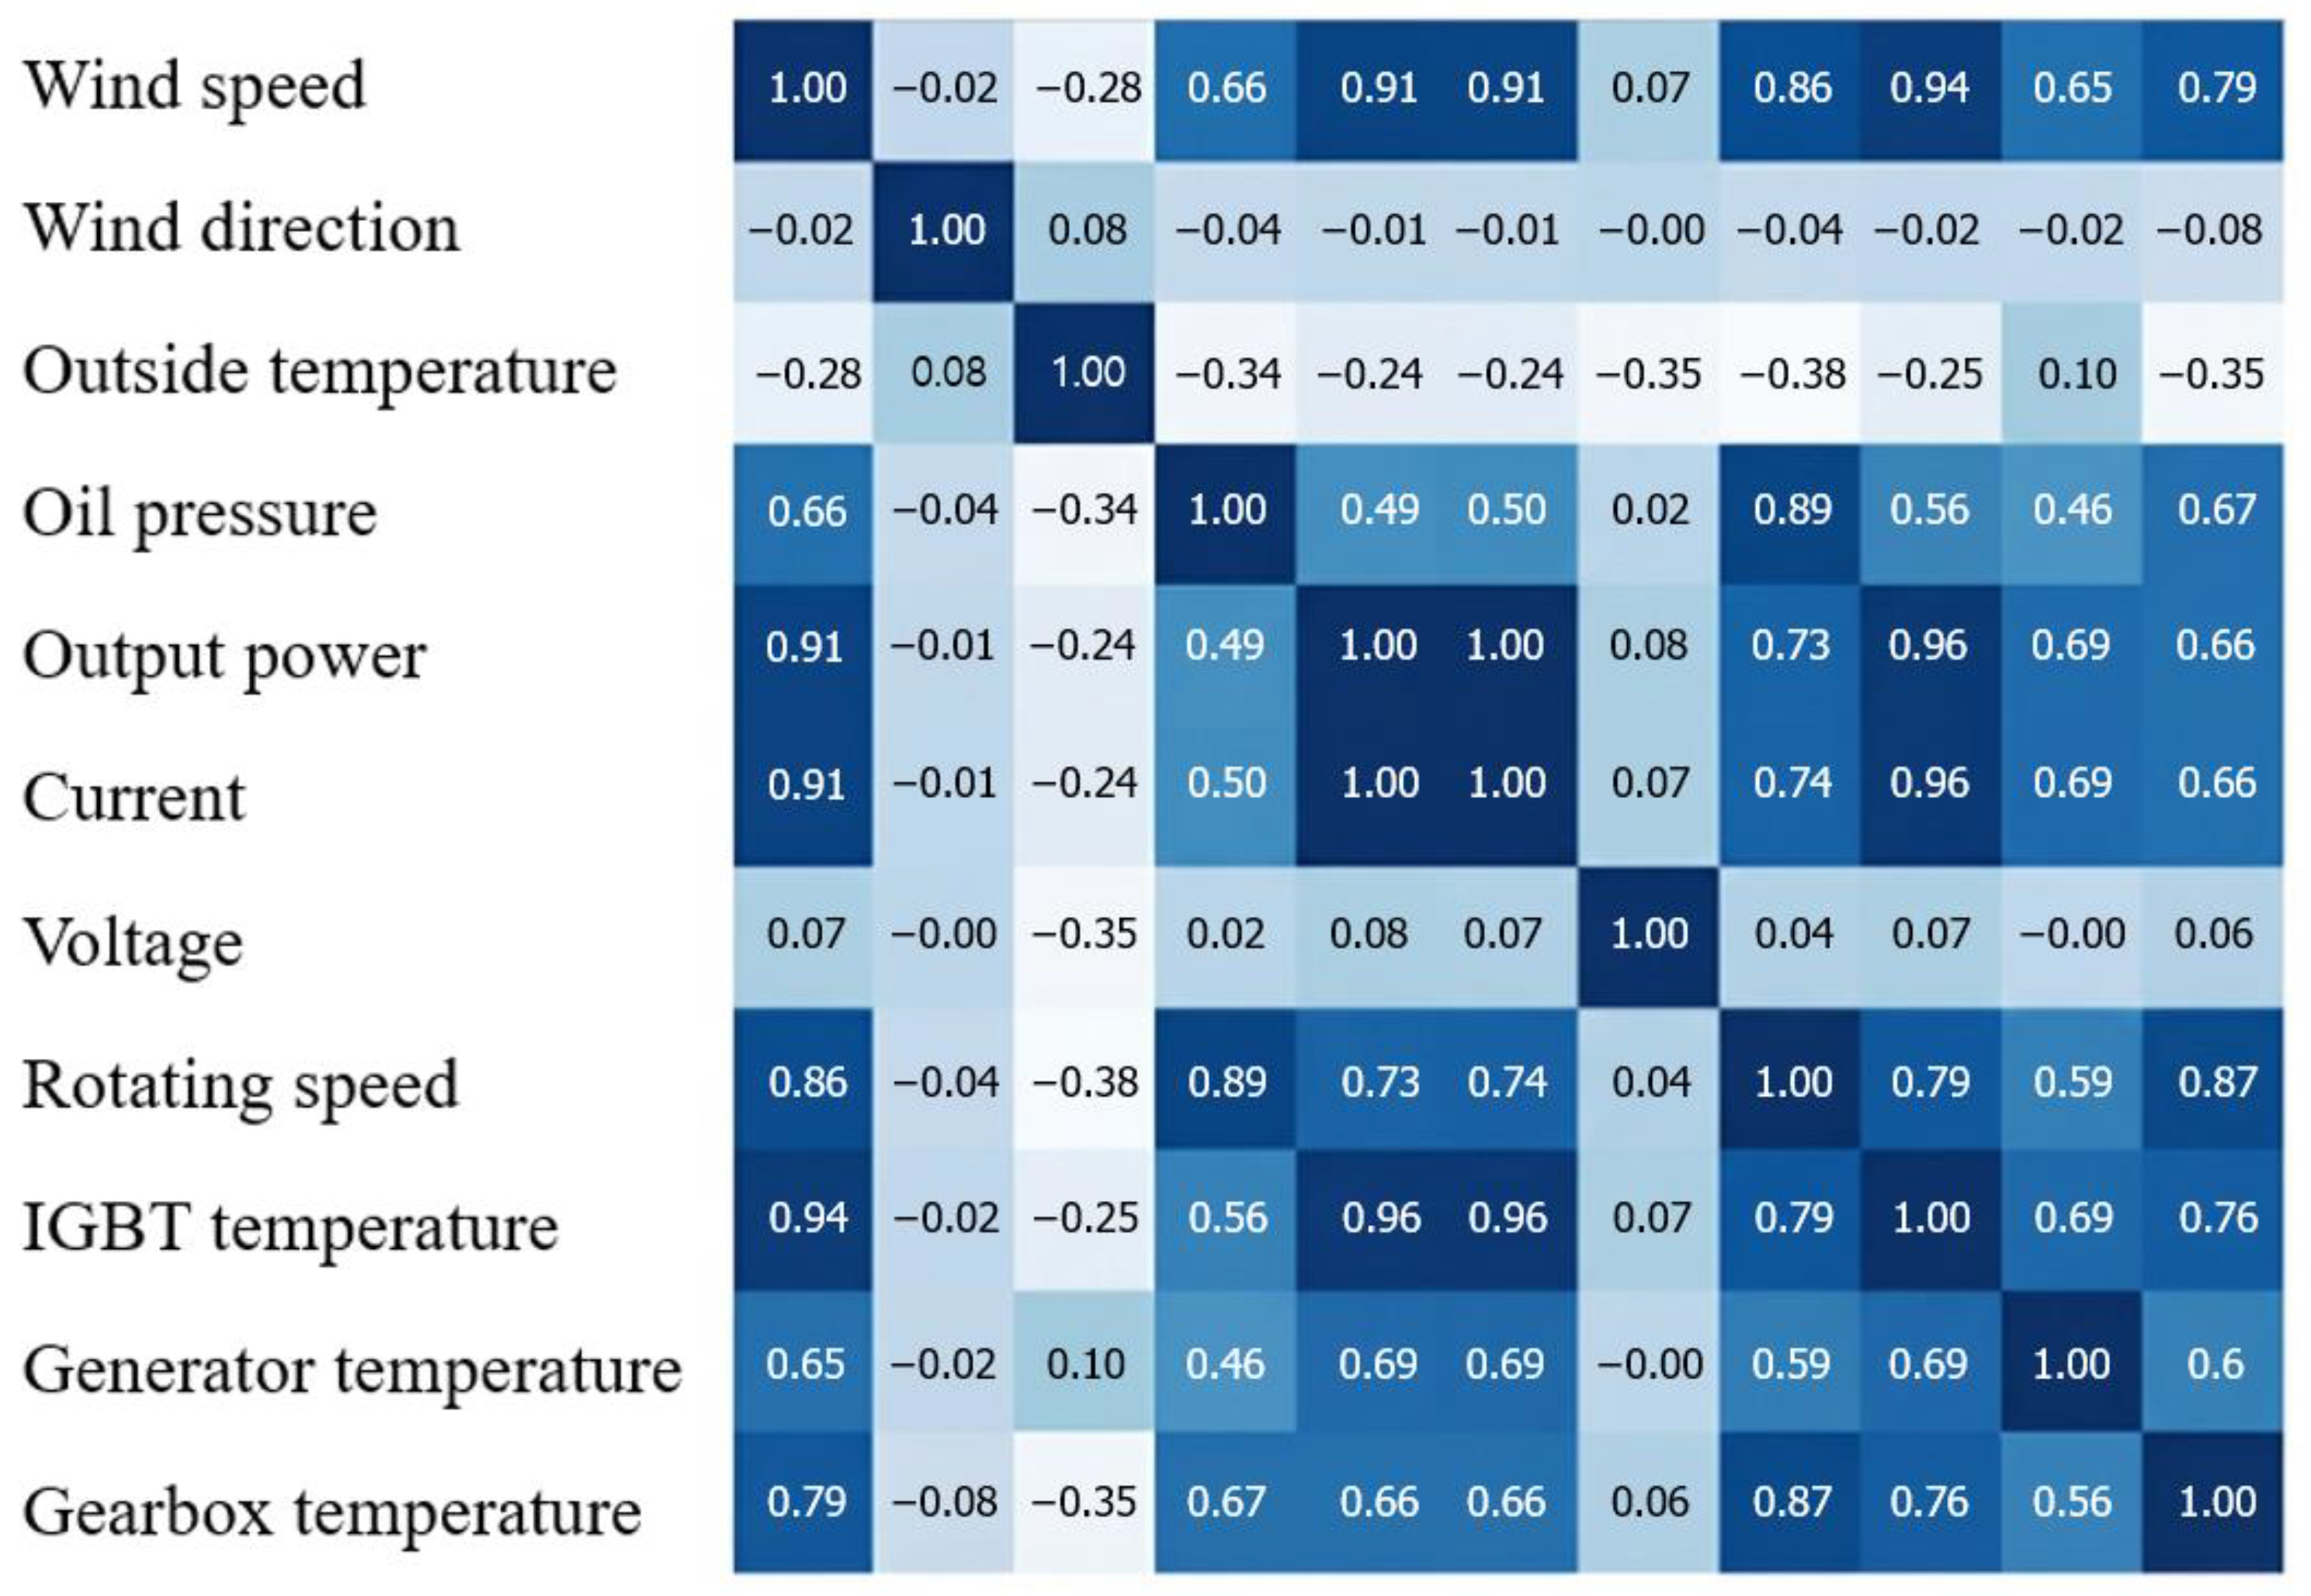
Figure 10 presents the results of the correlation analysis performed to identify the most influential input variables for the thermal state prediction models. A SCADA dataset covering one year of operation with a 10 min sampling interval was used, and redundant or statistically insignificant variables were removed during the data pre-processing stage. By restricting the analysis to a quasi-steady operating regime with physically constrained power and rotational speed, Pearson correlation provides a stable and interpretable criterion for identifying relevant input variables, while nonlinear thermal effects are addressed within the ROM framework. For the generator temperature ROM, four key variables were identified as primary drivers: output power, rotational speed, phase current, and ambient temperature. In the case of the gearbox temperature ROM, output power and rotational speed were used in conjunction with gearbox oil pressure, which provides critical information related to mechanical friction and lubrication conditions. For example, the high correlation coefficient of 0.87 between rotational speed and gearbox temperature justifies its inclusion as a dominant input feature. This strategic feature selection enables the digital twin framework to capture the complex thermal dynamics of the 3 MW wind turbine system using a streamlined set of input variables.
Figure 10.
Correlation analysis results between SCADA operational variables and component temperatures for input feature selection in the ROM-based thermal prediction models.
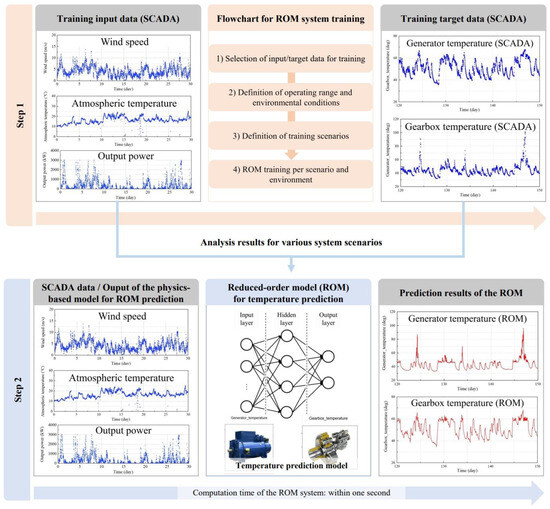
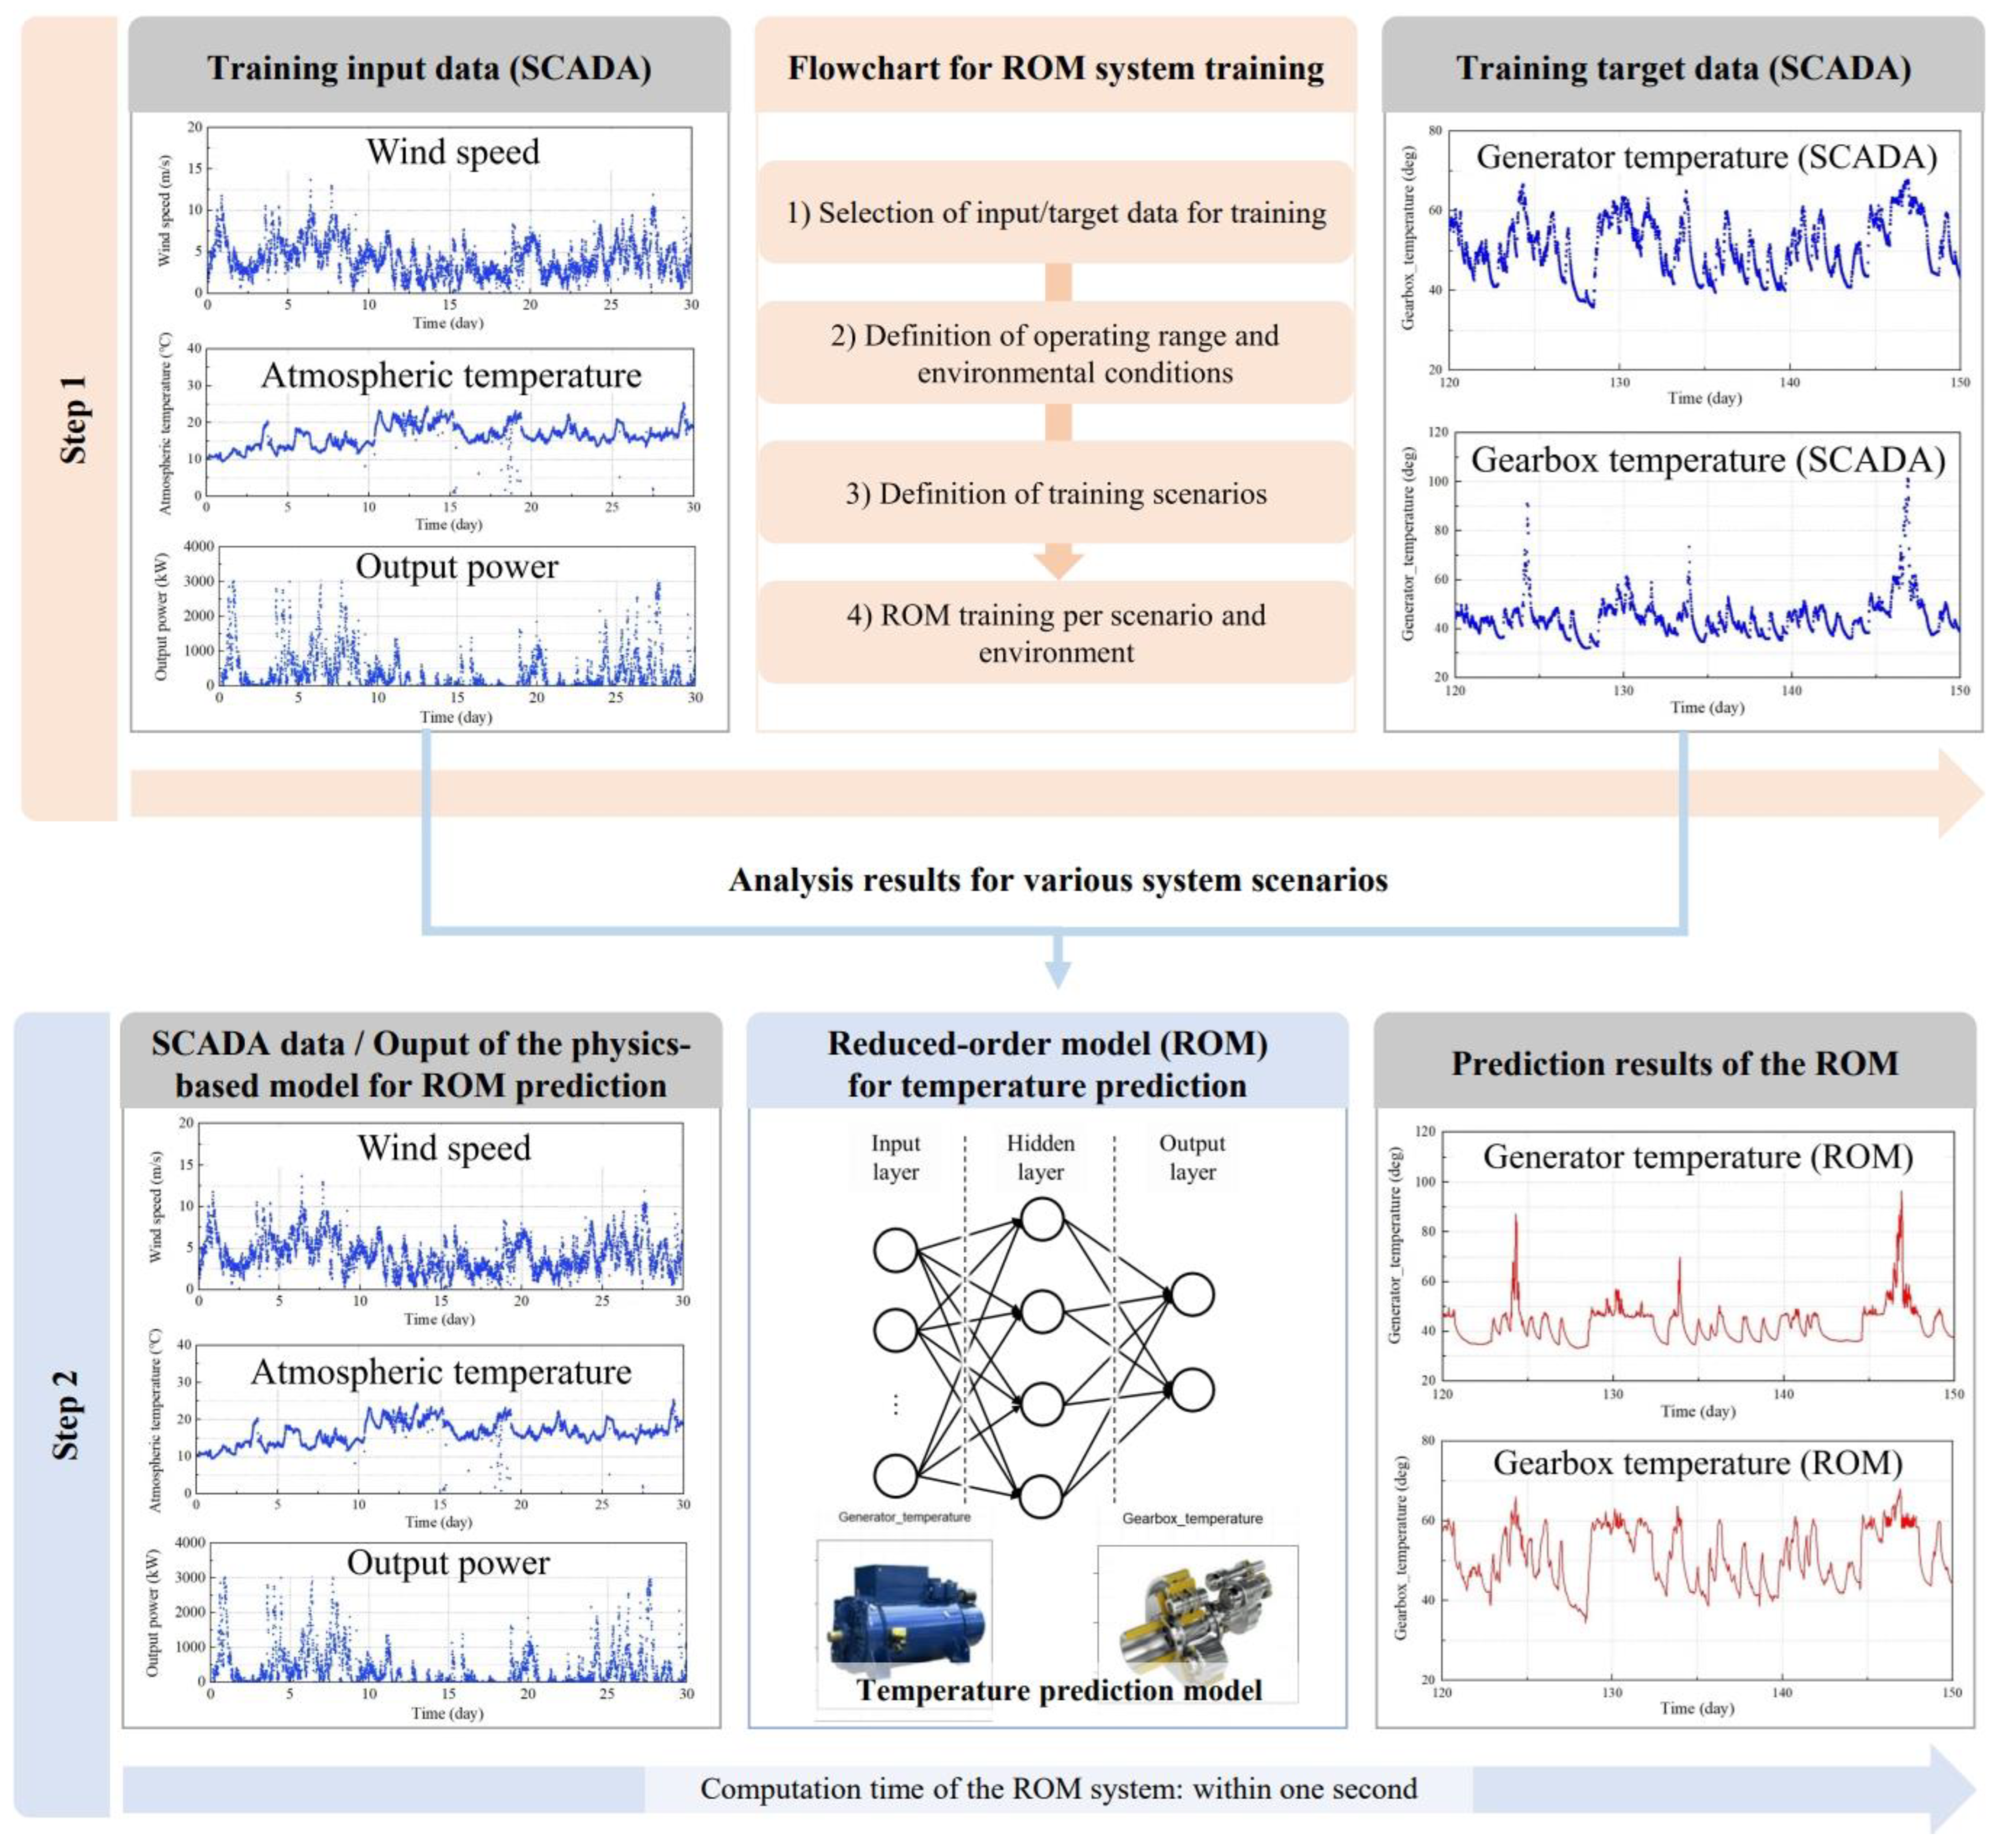
Figure 11 illustrates the systematic procedure for developing and deploying the ROM for monitoring the thermal states of the generator and gearbox. In the training phase, denoted as Step 1, a comprehensive SCADA dataset was partitioned into training input variables and target outputs. Operational parameters such as wind speed, ambient temperature, output power, and rotational speed were used as inputs, while the measured generator and gearbox temperatures served as the target data. To ensure robust model performance over a wide range of operating conditions, the training data were categorized into multiple scenarios based on predefined operating ranges and environmental conditions. Using the built-in ROM generation framework provided by Ansys Twin Builder, the high-dimensional thermal dynamics of the wind turbine system were compressed into a low-dimensional and computationally efficient model. The training process relies on the built-in data-driven nonlinear reduced-order modeling framework of ANSYS Twin Builder 2023 R2, which internally constructs a surrogate model without requiring explicit user specification of the learning algorithm. The operational stage of the framework, referred to as Step 2, focuses on the real-time prediction of component temperatures using the pre-trained ROMs. In this stage, time-synchronized SCADA measurements, together with selected outputs from the physics-based model, are continuously supplied to the ROM as input variables. The ROM leverages a data-driven nonlinear reduced-order modeling architecture within the Ansys Twin Builder environment to establish a computationally efficient mapping between SCADA-derived inputs and internal thermal states. As illustrated by the hidden-layer structure in Figure 11, the incoming data streams are processed sequentially to generate instantaneous temperature predictions for the generator and gearbox. The predicted temperatures are updated at each sampling interval, enabling continuous monitoring of the thermal behavior of critical components.
Figure 11.
Workflow for ROM development and real-time deployment for generator and gearbox temperature prediction, including SCADA-based training, scenario definition, and fast online inference.
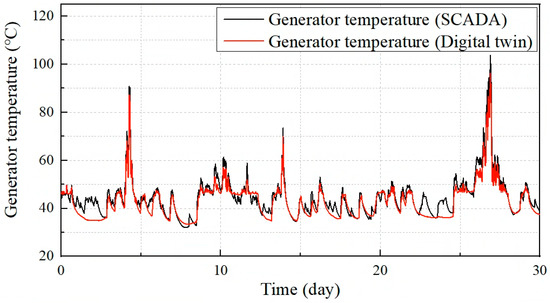
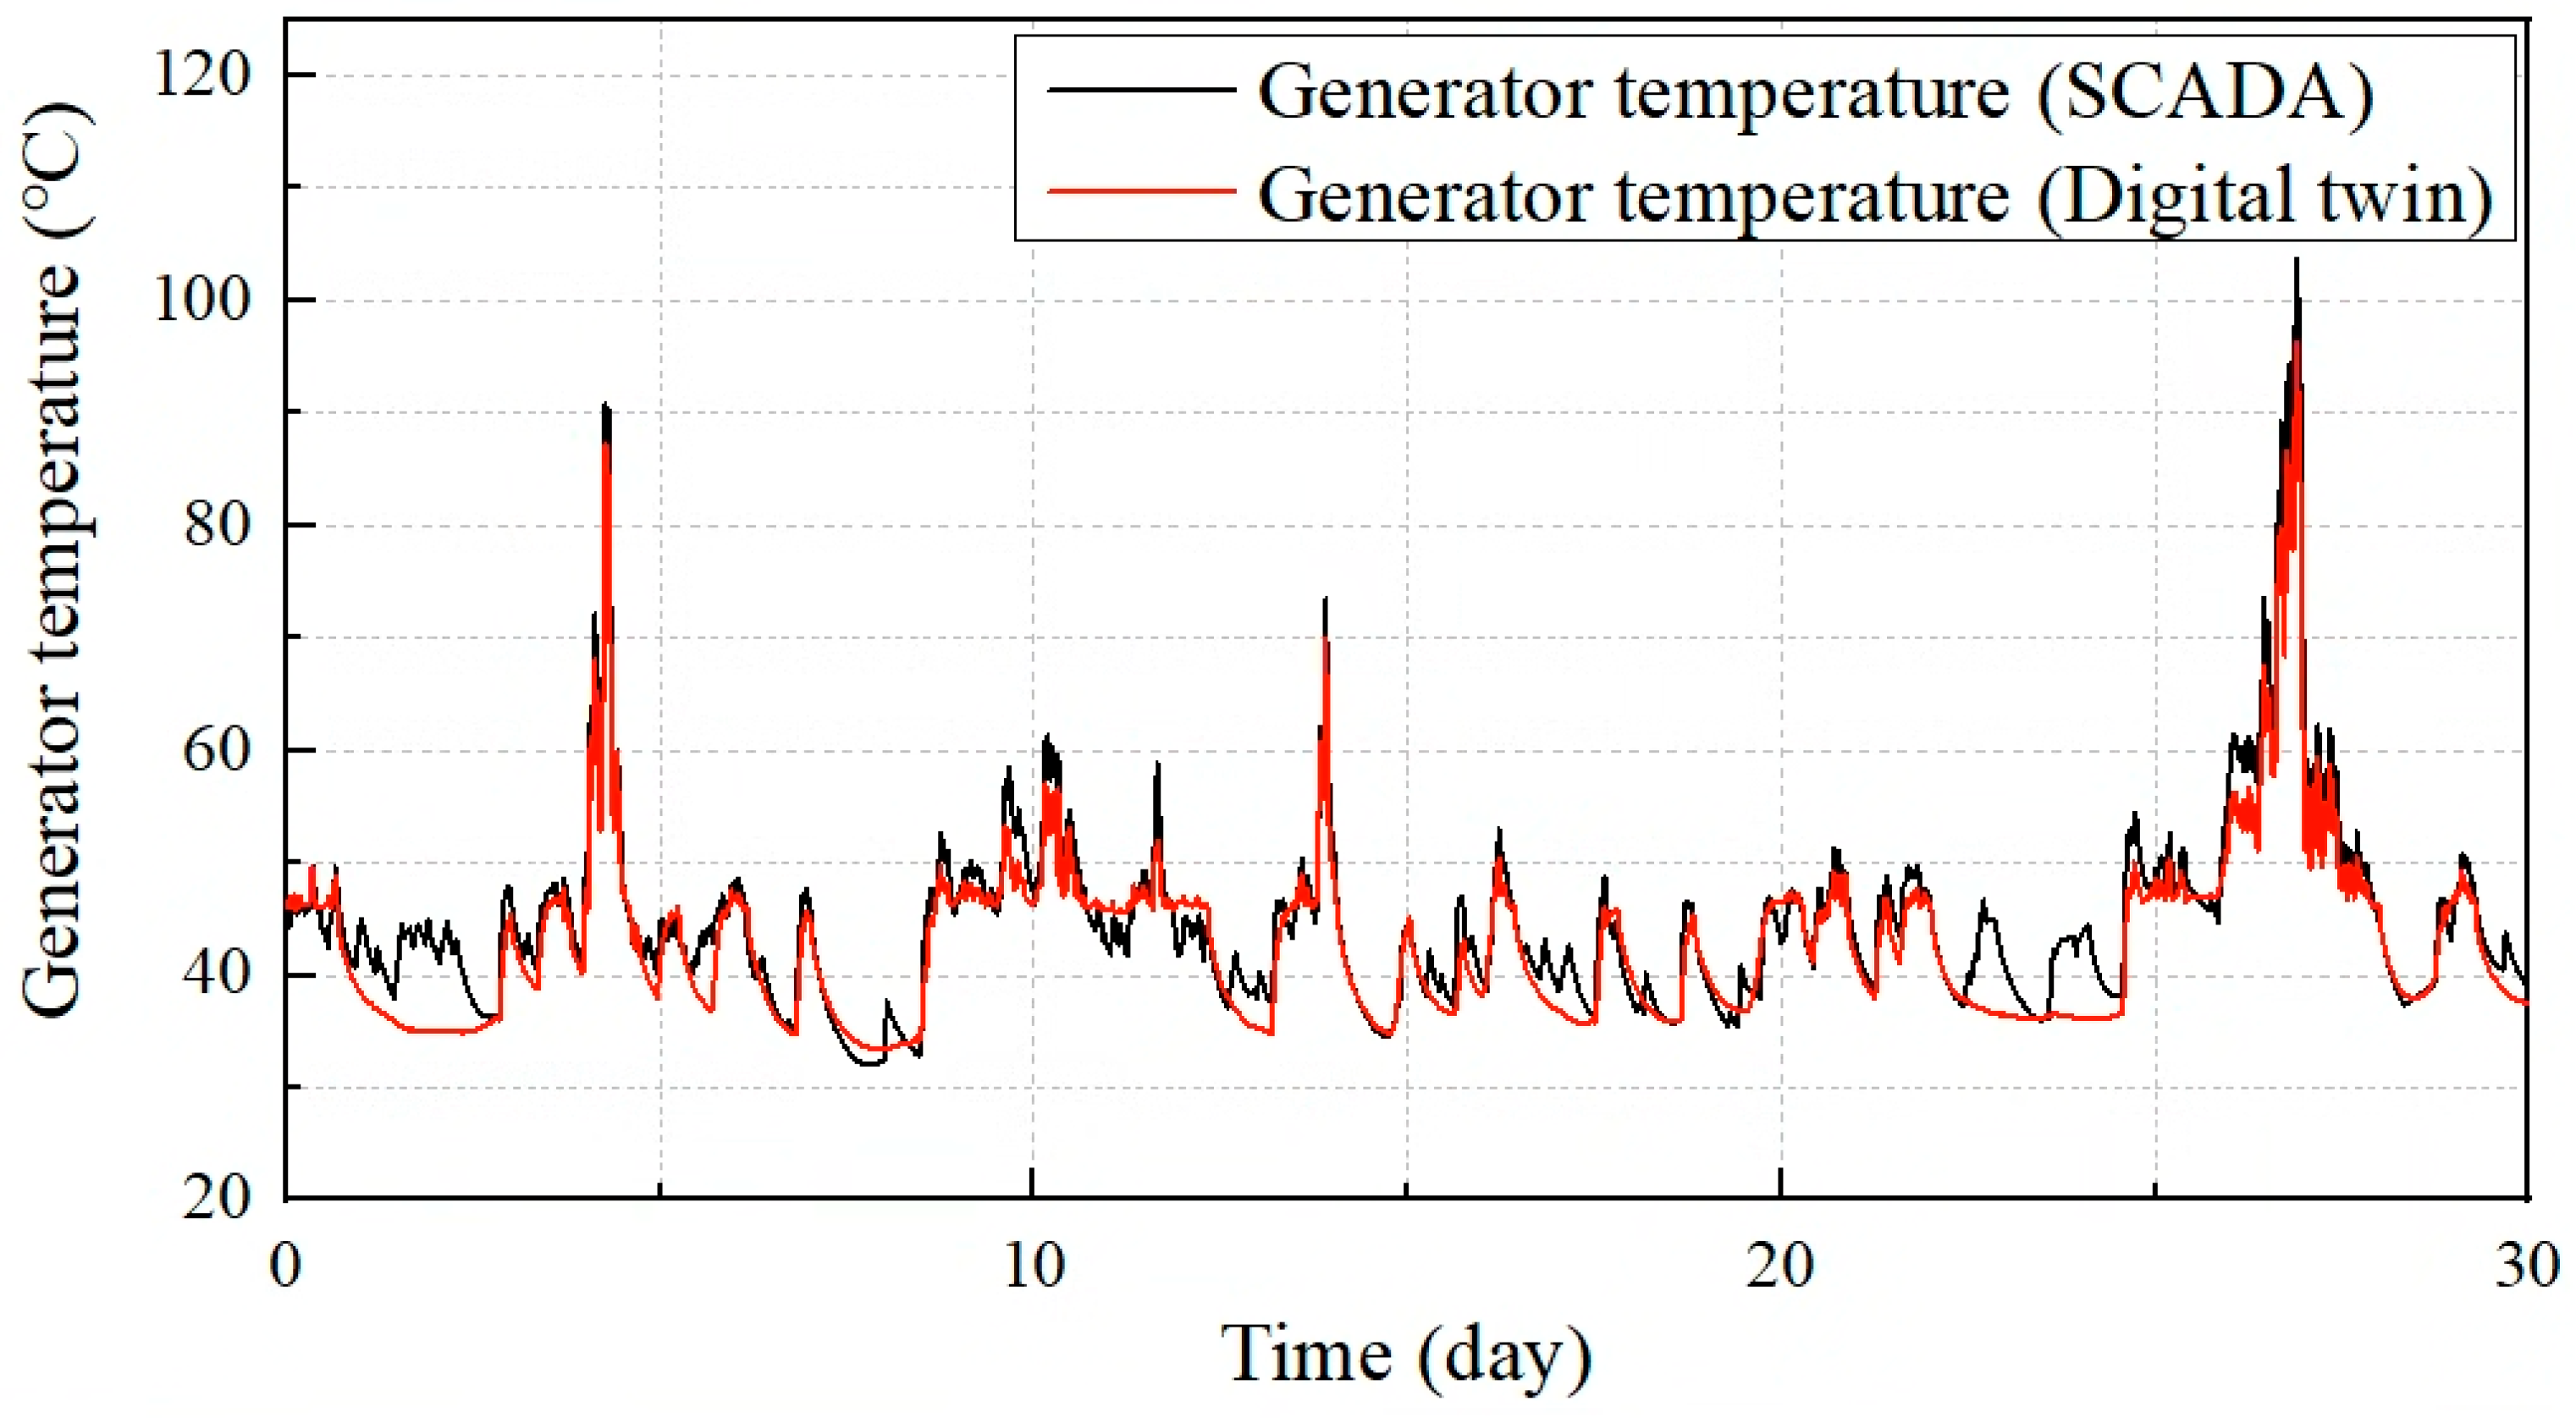
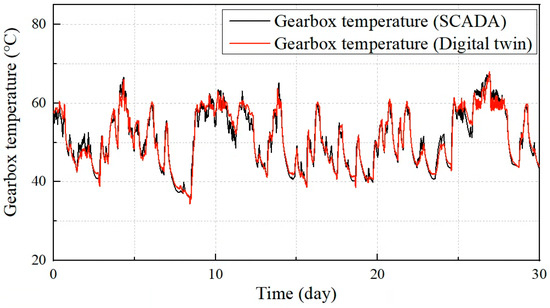
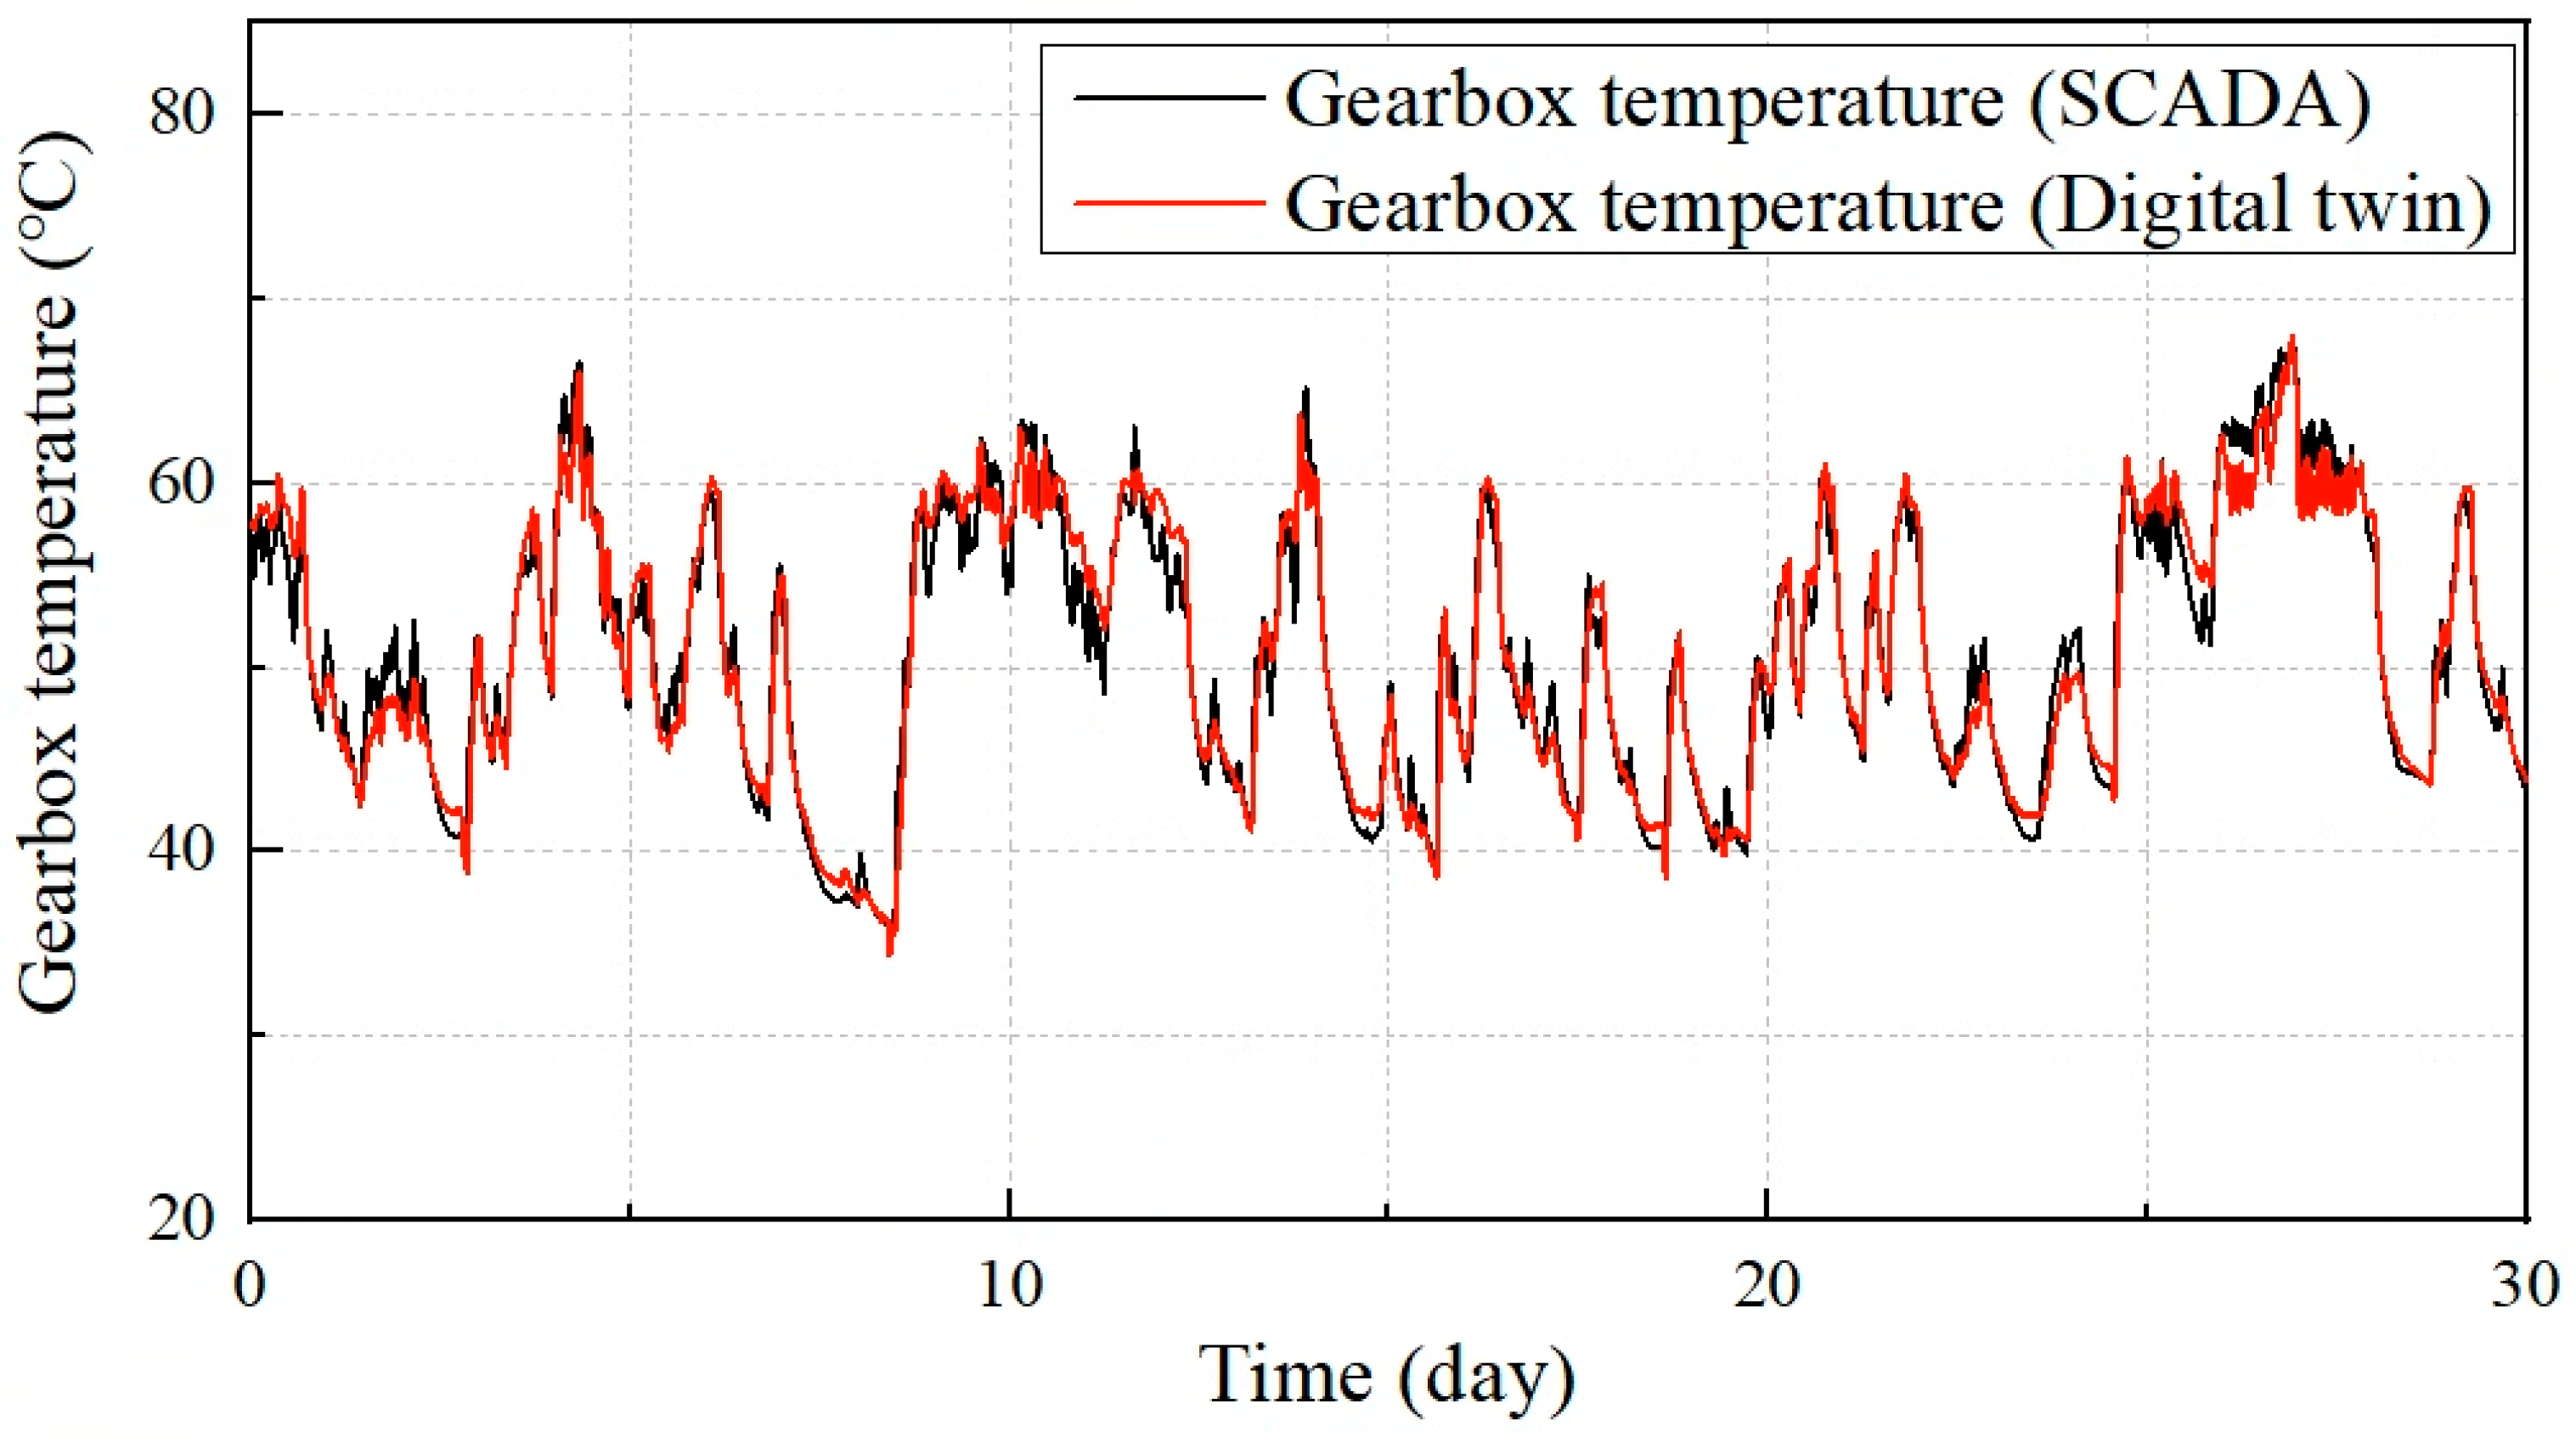
The predictive performance of the developed ROMs for generator and gearbox temperatures was validated through direct comparison with SCADA-measured data, as presented in Figure 12 and Figure 13.
Figure 12.
Comparison of the SCADA data and the temperature prediction model of the generator.
Figure 13.
Comparison of the SCADA data and the temperature prediction model of the gearbox.
The validation was conducted over a 30-day period using an independent dataset that was not utilized during the ROM training process, in order to assess the stability of the model and accuracy under continuous operational conditions. The 30-day validation period was selected to include representative operating conditions such as transient behavior and frequent pitch activity near the rated region. The objective of this validation is to assess short- to mid-term predictive robustness under realistic operating conditions, while seasonal variations are primarily addressed through the one-year training dataset and physics-based constraints.
As shown in Figure 12, the ROM-predicted generator temperature exhibits agreement in tracking the actual SCADA measurements. Figure 13 illustrates the temperature prediction results for the gearbox. The ROM reproduces the complex thermal behavior of the gearbox, which is influenced by mechanical friction and lubrication conditions, as reflected in the selected input features. Table 5 summarizes the quantitative accuracy of the proposed ROM-based temperature prediction models for the generator and gearbox, evaluated using RMSE and MAPE. For the prediction of the generator, the ROM achieved the RMSE of 3.06 °C and the MAPE of 5.4%. The temperature prediction model of the gearbox, with an RMSE of 1.49 °C and an MAPE of 2.8%, was obtained. These results indicate that the proposed ROMs provide accurate and stable temperature predictions under real operating conditions, demonstrating their suitability for real-time thermal monitoring within the digital twin framework of the 3 MW wind turbine system.
Table 5.
Accuracy of the temperature prediction model of the generator and gearbox.
5. Conclusions
This paper presented the development and validation of a hybrid digital twin framework for a 3 MW class wind turbine, integrating a physics-based model with reduced-order thermal prediction. The proposed framework enables real-time estimation of generator and gearbox temperatures while preserving physical interpretability and computational efficiency. From a practical perspective, the results demonstrate that the proposed digital twin can serve as a reliable foundation for real-time condition monitoring and predictive maintenance by establishing operational baselines under normal operating conditions. The hierarchical integration of physics-based modeling and ROMs allows the framework to balance modeling fidelity and computational cost, which is critical for deployment in utility-scale wind turbines. Despite these advantages, several limitations should be noted. The ROMs were trained and validated using SCADA data collected under normal operating conditions, and their performance under extreme events or rare fault scenarios was not explicitly evaluated. In addition, the temporal resolution mismatch between the physics-based model and SCADA measurements may introduce uncertainty in transient operating regimes. Future research will focus on extending the framework to incorporate fault-labeled datasets, extreme operating conditions, and long-term seasonal variations, and improving uncertainty quantification and adaptive updating of the ROMs during operation. These extensions are expected to further enhance the robustness and general applicability of the proposed digital twin framework.
Funding
This work was supported by the Technology Innovation Program funded by the Korea Evaluation Institute of Industrial Technology (KEIT) of the Republic of Korea (Project Name: Development of marine safety equipment in response to changes and reinforcement of international technical standards for fire safety, Project Number: 00508521).
Institutional Review Board Statement
Not applicable.
Informed Consent Statement
Not applicable.
Data Availability Statement
The datasets presented in this article are not readily available because they were provided by a third party for research and technical support purposes only and are subject to restrictions regarding external distribution. Requests to access the datasets should be directed to the corresponding author.
Conflicts of Interest
The author declares no conflicts of interest.
References
- Bouckaert, S.; Pales, A.F.; McGlade, C.; Remme, U.; Wanner, B.; Varro, L.; Davide, D.; Spencer, T. Net Zero by 2050: A Roadmap for the Global Energy Sector; International Energy Agency: Paris, France, 2021. [Google Scholar]
- McCoy, A.; Musial, W.; Hammond, R.; Mulas Hernando, D.; Duffy, P.; Beiter, P.; Pérez, P.; Baranowski, R.; Reber, G.; Spitsen, P. Offshore Wind Market Report: 2024 Edition. No. NREL/TP-5000-90525; National Renewable Energy Laboratory (NREL): Golden, CO, USA, 2024.
- Alšauskas, O. World Energy Outlook 2024; International Energy Agency: Paris, France, 2024. [Google Scholar]
- Shields, M.; Beiter, P.; Nunemaker, J.; Cooperman, A.; Duffy, P. Impacts of turbine and plant upsizing on the levelized cost of energy for offshore wind. Appl. Energy 2021, 298, 117189. [Google Scholar] [CrossRef] [Scilit]
- Thomas, B.; Costoya, X.; Decastro, M.; Iglesias, G.; Gómez-Gesteira, M. Levelized cost of energy for various floating offshore wind farm designs in the areas covered by the Spanish maritime spatial planning. Appl. Energy 2025, 381, 125165. [Google Scholar] [CrossRef] [Scilit]
- Mehta, M.; Zaaijer, M.; von Terzi, D. Drivers for optimum sizing of wind turbines for offshore wind farms. Wind. Energy Sci. 2024, 9, 141–163. [Google Scholar] [CrossRef] [Scilit]
- Lantz, E.J.; Roberts, J.O.; Nunemaker, J.; DeMeo, E.; Dykes, K.L.; Scott, G.N. Increasing Wind Turbine Tower Heights: Opportunities and Challenges; National Laboratory of the Rockies: Golden, CO, USA, 2019.
- Bošnjaković, M.; Katinić, M.; Santa, R.; Marić, D. Wind turbine technology trends. Appl. Sci. 2022, 12, 8653. [Google Scholar] [CrossRef] [Scilit]
- Leon-Medina, J.X.; Tibaduiza, D.A.; Parés, N.; Pozo, F. Digital twin technology in wind turbine components: A review. Intell. Syst. Appl. 2025, 26, 200535. [Google Scholar] [CrossRef] [Scilit]
- Kim, C.; Dinh, M.-C.; Sung, H.-J.; Kim, K.-H.; Choi, J.-H.; Graber, L.; Yu, I.-K.; Park, M. Design, implementation, and evaluation of an output prediction model of the 10 MW floating offshore wind turbine for a digital twin. Energies 2022, 15, 6329. [Google Scholar] [CrossRef] [Scilit]
- Feng, K.; Ji, J.; Zhang, Y.; Ni, Q.; Liu, Z.; Beer, M. Digital twin-driven intelligent assessment of gear surface degradation. Mech. Syst. Signal Process. 2023, 186, 109896. [Google Scholar] [CrossRef] [Scilit]
- Jorgensen, J.; Hodkiewicz, M.; Cripps, E.; Hassan, G.M. Requirements for the application of the Digital Twin Paradigm to offshore wind turbine structures for uncertain fatigue analysis. Comput. Ind. 2023, 145, 103806. [Google Scholar] [CrossRef] [Scilit]
- Yucesan, Y.A.; Viana, F.A.C. A physics-informed neural network for wind turbine main bearing fatigue. Int. J. Progn. Health Manag. 2020, 11, 1–17. [Google Scholar] [CrossRef] [Scilit]
- Yucesan, Y.A.; Viana, F.A.C. Hybrid physics-informed neural networks for main bearing fatigue prognosis with visual grease inspection. Comput. Ind. 2021, 125, 103386. [Google Scholar] [CrossRef] [Scilit]
- Park, J.; Kim, C.; Dinh, M.-C.; Park, M. Design of a condition monitoring system for wind turbines. Energies 2022, 15, 464. [Google Scholar] [CrossRef] [Scilit]
- Li, T.; Ai, L.; Yang, Q.; Zhang, X.; Li, H.; Lu, D.; Shen, H. Short-term wind power prediction based on multiscale numerical simulation coupled with deep learning. Renew. Energy 2025, 246, 122951. [Google Scholar] [CrossRef] [Scilit]
- Zhang, S.; Yao, R.; Du, C.; Essah, E.; Li, B. Analysis of outlier detection rules based on the ASHRAE global thermal comfort database. Build. Environ. 2023, 234, 110155. [Google Scholar] [CrossRef] [Scilit]

Disclaimer/Publisher’s Note: The statements, opinions and data contained in all publications are solely those of the individual author(s) and contributor(s) and not of MDPI and/or the editor(s). MDPI and/or the editor(s) disclaim responsibility for any injury to people or property resulting from any ideas, methods, instructions or products referred to in the content. |
© 2026 by the author. Licensee MDPI, Basel, Switzerland. This article is an open access article distributed under the terms and conditions of the Creative Commons Attribution (CC BY) license.