


Abstract
This study investigates the spatiotemporal evolution of the temperature field during coal spontaneous combustion in the goaf of the No. 40202 fully mechanized top-coal caving face at Gaojialiang Coal Mine. Simultaneous TG-DSC analysis and temperature-programmed oxidation experiments were used to determine the characteristic temperatures, oxygen consumption rate, CO/CO2 generation rates and heat release intensity. These measurements supplied the source terms for a two-dimensional transient model coupling seepage, heat transfer and oxygen transport. The critical, dry-cracking, ignition and exothermic peak temperatures were 70 °C, 110 °C, 285 °C and 406.7 °C, respectively. The measured rates and heat release intensity followed piecewise Arrhenius relationships, with apparent activation energies increasing across successive temperature intervals. The heat release intensity was 78.04 W/m3 at 30 °C. The limiting oxygen concentration for sustained spontaneous combustion was 7–9%, and the limiting residual coal thickness was 0.60–0.85 m. Along the strike, the temperature increased from the working face to a maximum within the oxidation zone and then decreased towards the deep goaf. At a residual coal thickness of 0.8 m, the maximum temperature reached the critical temperature on day 46 (44–56), the dry-cracking temperature on day 62 (60–77) and the ignition temperature of 285 °C on day 71 (69–88). Subsequent oxygen depletion caused the high-temperature zone to migrate towards the working face. Residual coal thickness was the dominant factor: ignition occurred after 25.2 d at 1.6 m, whereas the temperature remained below the ignition threshold throughout 150 d at 0.5 m. These results support temperature monitoring, the timing of early warnings and the prevention and control of spontaneous combustion in the goaf.
1. Introduction
Coal spontaneous combustion is a thermodynamic hazard that poses a persistent threat to mine safety [1]. Residual coal accumulation and the continuous oxygen supply from air leakage make the goaf particularly susceptible to spontaneous combustion [2]. Coal oxidation is highly sensitive to temperature, while air leakage and the distribution of residual coal govern oxygen supply and heat dissipation. The temperature, flow and oxygen concentration fields are therefore strongly coupled, and their spatiotemporal evolution depends on the interaction of these factors [3,4].
Research on coal spontaneous combustion encompasses four main approaches. Thermal analysis using TG-DTG-DSC and temperature-programmed oxidation [5,6,7,8,9,10,11] identifies oxidation stages, characteristic temperatures, apparent activation energies and free-radical reaction mechanisms [10,11]. These analyses draw on thermogravimetric and calorimetric measurements, including the characteristic-temperature definitions established by Zhang [8] and Wen et al. [9]. Their application to the goaf requires accounting for specimen size, heating-rate dependence and the conversion of heat flow in mW·mg−1 into a volumetric heat source. Differences between model-free and model-fitting methods [5,6,7] also contribute to the inconsistent activation-energy trends reported in the literature. Indicator-gas studies [12,13,14] establish early-warning thresholds by correlating CO, CO2 and other gases with the thermal state of coal. These thresholds depend on the coal seam and experimental apparatus, and their use for predicting temperature evolution is affected by the delay between heating and gas detection. Studies of limiting parameters [15,16,17] use steady heat-balance criteria for loose coal layers [15] to determine the limiting oxygen concentration, limiting residual coal thickness and upper limit of air-leakage intensity. These criteria identify conditions conducive to spontaneous combustion under assumptions such as steady leakage and uniformly distributed residual coal; predicting the time required to reach a critical temperature requires a transient analysis. Numerical models [2,4,18,19,20] calculate flow, oxygen and temperature fields and delineate the three spontaneous-combustion zones. Developments include transient coupling of seepage, heat transfer and oxygen transport, dynamic-goaf models [18], DEM-COMSOL coupling [2] and moving meshes [4]. Validation commonly uses measured air-leakage rates and oxidation-zone positions [19,20]. Further development requires coal-specific source terms and quantitative descriptions of temperature evolution, high-temperature-zone migration and the effects of residual coal thickness.
Three issues require further investigation. First, reported trends in apparent activation energy vary with temperature, and the selection of fitting intervals often relies on empirical judgement. Converting measured reaction rates into model source terms also requires a consistent procedure. Second, transient calculations are needed to relate static limiting criteria to the time required to reach characteristic temperatures under specified residual coal thicknesses and air-leakage conditions. Third, models using empirical source terms or kinetic data from other mines require stronger links to site-specific measurements, together with quantitative predictions of high-temperature-zone migration and the limiting residual coal thickness.
This study examines the 40202 fully mechanized top-coal caving face at Gaojialiang Coal Mine, where the coal has a strong tendency towards spontaneous combustion, a short incubation period and pronounced CO fluctuations in the upper corner [21]. TG-DSC analysis and temperature-programmed oxidation experiments were used to determine characteristic temperatures, oxygen consumption, CO/CO2 generation and heat release. The measured characteristic temperatures defined the intervals for piecewise Arrhenius fitting, and Equations (1)–(3) converted the measured rates into source terms. These parameters were incorporated into a two-dimensional transient model coupling seepage, heat transfer and oxygen transport to predict temperature evolution from ambient conditions to ignition. The model quantified the times required to reach characteristic temperatures and the effects of residual coal thickness and air leakage on the incubation period and high-temperature-zone position. Section 4.4 and Section 4.5 present the corresponding migration behaviour and thickness thresholds. Laboratory measurements are denoted by the suffix “exp” (T1,exp; T2,exp; and T3,exp), and simulation results by “sim” (Tmax,sim; xHT,sim; and Tign,sim).
2. Engineering Background and Experimental Programme
2.1. Engineering Background
The principal mineable seams at Gaojialiang Coal Mine consist of non-caking coal with a minor proportion of long-flame coal. The 40202 fully mechanized top-coal caving face extracts the 4-2 seam, which is 6.3 m thick and dips at 1–3°. Machine cutting and top-coal caving account for 3.5 m and 2.8 m of the seam thickness, respectively. The face uses U-shaped ventilation, with an air supply of 36.2 m3/s and a measured pressure difference of approximately 45 Pa between the two roadways. Residual coal originates mainly from caving losses and collapsed top coal. Its average thickness in the oxidation zone is approximately 0.8 m, and the caving zone is approximately 10 m high. Abnormal CO fluctuations were recorded in the upper corner on several occasions during mining. The measured oxygen adsorption capacity of 0.92 cm3/g places the coal in Class I, indicating a high tendency towards spontaneous combustion [22]. The shortest incubation period was measured using a kilogram-scale adiabatic self-heating apparatus. Run-of-mine coal from the same face was crushed to a mass-mean diameter of 2.2 mm. A 7.1 kg sample was packed into an 8 L furnace, occupying 8.4 × 10⁻³ m3, with a bulk density of approximately 0.85 g/cm3 and a void fraction of 0.37. The sample was equilibrated at 21 °C and supplied with air at 0.72 L/h (0.10 L/(h·kg)). The surrounding jacket was maintained 0.1–1.0 °C below the highest coal temperature to suppress radial heat loss. The incubation period was defined as the time from the start of ventilation until the coal reached T3 = 285 °C. The shortest measured period was 40 d; this near-adiabatic result provides the reference for the limiting-case check in Section 4.3.
2.2. Coal Sampling and Preparation
Representative samples were collected from the freshly exposed coal wall of the 40202 face in accordance with GB/T 482-2008 [23]. Approximately 20 mm of weathered surface material was removed to obtain unoxidised coal. The blocks were sealed on site in labelled, moisture-proof bags, transported to the laboratory, stored below 20 °C and prepared within 72 h. Following GB/T 474-2008 [24], the blocks were crushed using a jaw crusher and screened into 60–80 mesh (0.18–0.25 mm) particles for temperature-programmed oxidation and 80–100 mesh (0.125–0.18 mm) particles for TG-DSC analysis. A 1.0 kg sample of the 60–80 mesh fraction occupied a packed volume of 1.2 × 10⁻³ m3, giving a bulk density of approximately 0.83 g/cm3. The 80–100 mesh fraction was tested in 14 mg portions. Each fraction was sealed and numbered immediately after screening and tested within 24 h to minimise pre-oxidation during storage. Proximate and ultimate analyses followed GB/T 212-2008 [25] and GB/T 31391-2015 [26], respectively. The results are presented in Table 1.
Table 1.
Proximate (air-dry basis) and ultimate (dry ash-free basis) analysis of the coal sample.
2.3. Experimental Programme
2.3.1. TG-DSC Simultaneous Thermal Analysis
An HTC-1 simultaneous thermal analyser was used to record TG-DTG-DSC curves. A 14 mg coal sample of 80–100 mesh was heated from room temperature to 800 °C at 15 °C/min under an air flow of 50 mL/min. Oxidation stages and the exothermic peak temperature were identified from mass changes in the TG curve, extrema in the DTG curve and endothermic–exothermic transitions in the DSC curve. Three replicate tests gave a range of less than 5 °C for the characteristic temperatures.
2.3.2. Temperature-Programmed Oxidation Experiment
A 1.0 kg coal sample of 60–80 mesh, with a packed volume of 1.2 × 10⁻³ m3, was heated from 21 °C to 200 °C at 0.3 °C/min under an air flow of 200 mL/min. At 10 °C intervals, the temperature was held for 45 min before gas sampling. The volume fractions of O2, CO and CO2 were measured by gas chromatography. Oxygen consumption and CO/CO2 generation rates were calculated from the inlet–outlet concentration differences, using Equation (1).
The two experiments provided complementary measurements. TG-DSC analysis of a 14 mg sample at 15 °C/min captured the thermal response from room temperature to 800 °C, enabling identification of the macroscopic oxidation stages and characteristic temperatures. Temperature-programmed oxidation of a 1.0 kg loose coal sample at 0.3 °C/min represented the packing and gradual heating of residual coal and provided oxygen consumption, CO/CO2 generation and heat release data at individual temperatures. Characteristic temperatures obtained by the two methods were compared for consistency. At the air-to-coal ratio used here, approximately 0.2 mL/(min·g), the outlet O2 concentration fell below 9.5% above 180 °C, accompanied by increased CO selectivity. Piecewise Arrhenius fits to the temperature-programmed measurements supplied the kinetic source terms for the goaf model, linking the experimental stage divisions to transient numerical predictions.
where V(T) is the oxygen consumption or gas generation rate at temperature T (mol/(m3·s)); Q is the air flow rate (m3/s); C,in and C,out are the inlet and outlet volume fractions, respectively; Vm is the molar volume (m3/mol); and Vc is the packed coal volume (m3).
3. Experimental Results and Analysis
3.1. Stage Division, Characteristic Temperatures and Heat Release Intensity of Coal Oxidation
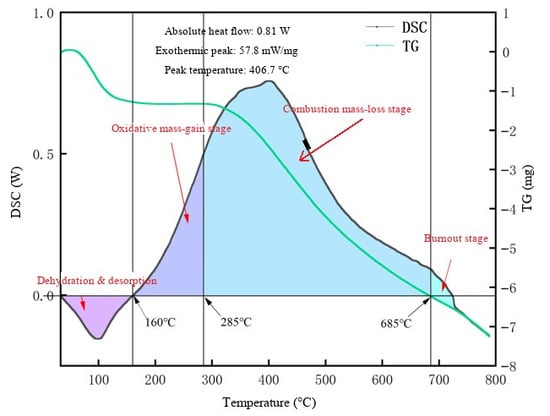
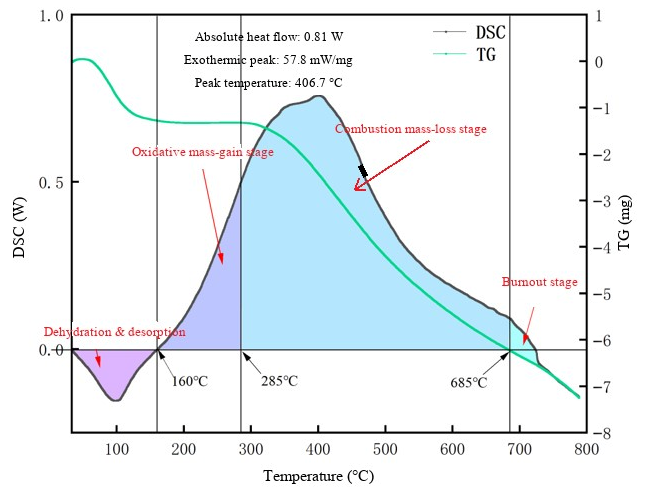
Figure 1 presents the combined TG-DSC curves. Mass changes in the TG curve, extrema in the DTG curve and endothermic–exothermic transitions in the DSC curve identify four stages of coal oxidation and combustion: dehydration and desorption, oxidative mass gain, combustion mass loss, and burnout. Their temperature ranges and thermal characteristics are described below.
Figure 1.
Combined TG-DSC curves of the coal sample.
During dehydration and desorption (room temperature–160 °C), moisture evaporates and adsorbed gases are released. The DSC curve shows an endothermic dehydration peak at 75–100 °C, while the TG curve records a gradual mass loss of approximately 8%, consistent with the sample’s total moisture content of 8.2%. Physical adsorption dominates the coal–oxygen interaction during this stage, with negligible net heat release. During oxidative mass gain (160–285 °C), oxygen chemisorption intensifies and peroxide complexes form. Oxygen uptake exceeds the mass loss from pyrolysis, producing a gradual mass increase in the TG curve. The DSC response changes from endothermic to weakly exothermic, indicating the onset of net heat accumulation from oxidation.
During combustion mass loss (285–685 °C), extensive cleavage of aliphatic side chains and bridging bonds releases volatile matter that participates in gas-phase combustion. The TG curve shows rapid mass loss, and the DSC curve reaches an exothermic peak of 57.8 mW/mg at 406.7 °C. During burnout (>685 °C), most combustible material has been consumed, the TG curve levels off and heat release decreases rapidly. The simultaneous mass gain and heat release during the oxidative mass-gain stage demonstrate that coal can generate heat before ignition, providing evidence of low-temperature oxidative heat accumulation relevant to spontaneous-combustion risk assessment.
The DSC curve characterises the heat-flow response of a milligram-scale sample heated at a constant rate, identifying the onset and peak of net heat release. Applying this response to a volumetric goaf model requires conversion from mW/mg and consideration of the sample’s packing conditions. Here, the heat release intensity q(T) per unit volume of loose coal is estimated using a chemical bond-energy balance based on the measured oxygen consumption and CO/CO2 generation rates. This quantity describes the heat generated by coal oxidation and supplies the heat source for the temperature-field calculation in Equation (2):
where ΔHO2 = 284.97 kJ/mol, ΔHCO = 311.9 kJ/mol and ΔHCO2 = 446.7 kJ/mol are the bond energies (reaction heats) associated with coal oxidation, CO generation and CO2 generation, respectively; V denotes the corresponding rate in 10−9 mol/(cm3·s).
q(T) = ΔHO2 · (VO2 − VCO − VCO2) + ΔHCO · VCO + ΔHCO2 · VCO2
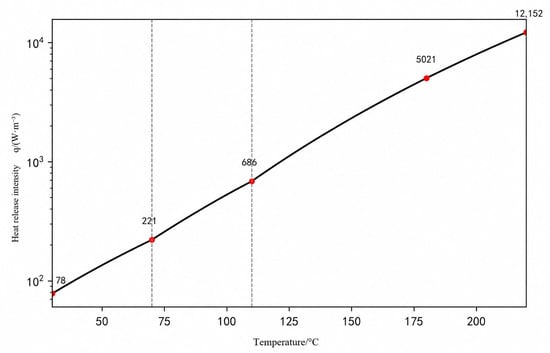
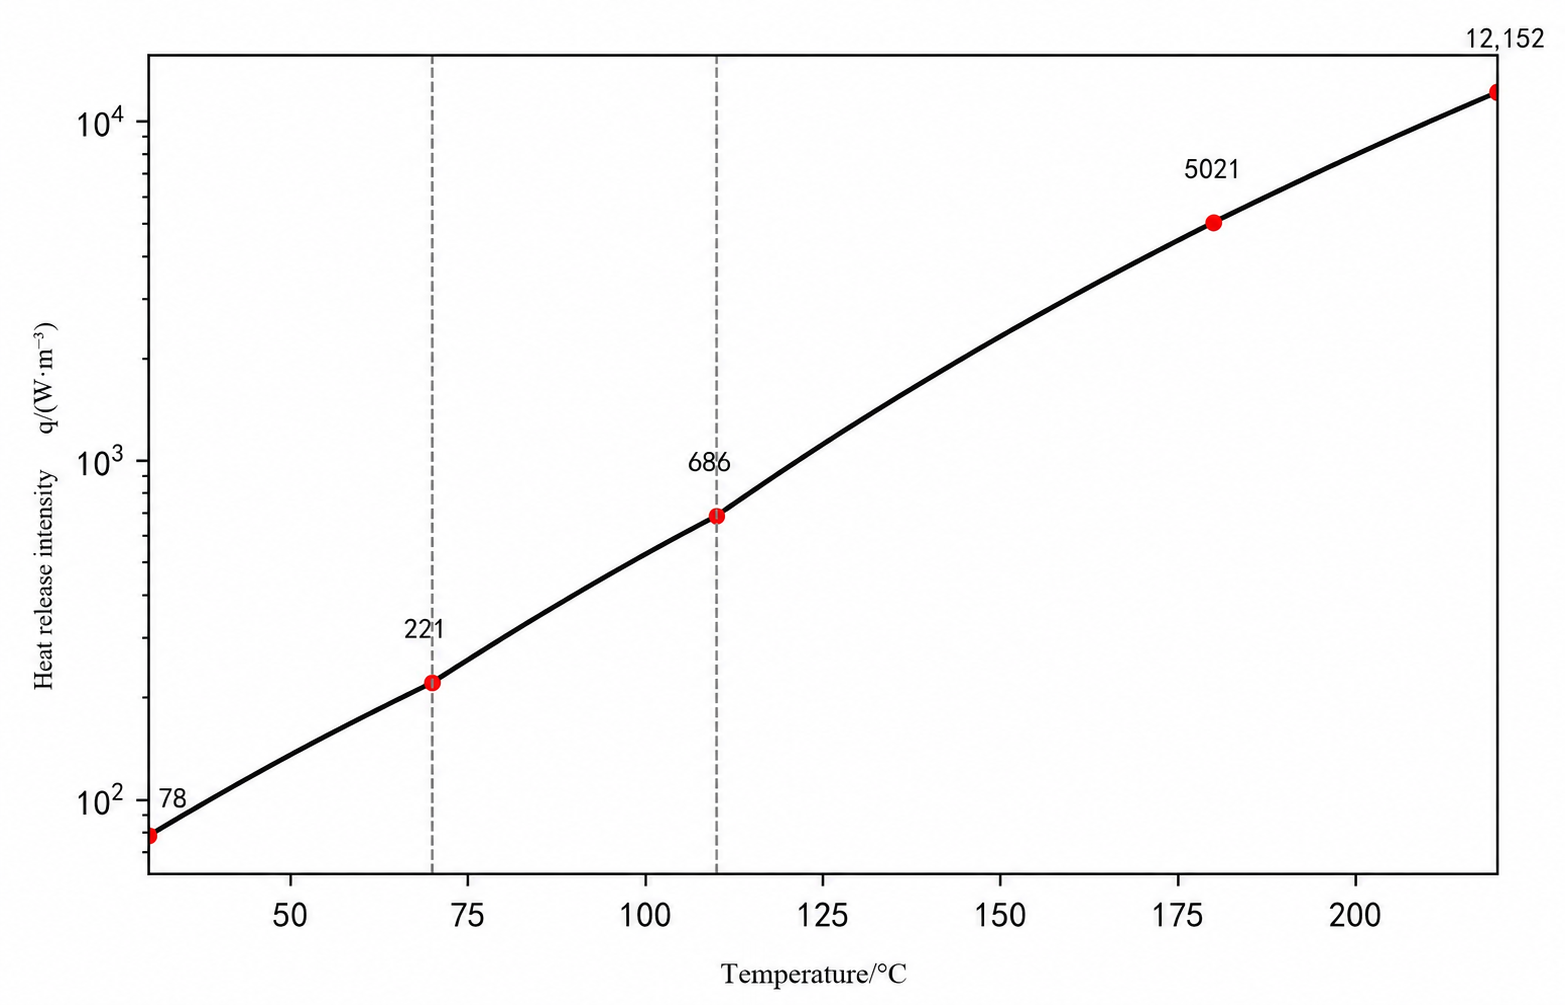
Heat release intensity is expressed throughout this paper in W/m3 (=10−6 J/(cm3·s)). The experiments extended to 200 °C; rates and heat release intensities above this temperature were calculated using the piecewise Arrhenius relationship in Equation (3) for the high-temperature stage of the simulation. Heat release increases gradually from 30 °C to 110 °C and rises rapidly above 110 °C. When heat generation exceeds dissipation, sustained heat accumulation raises the goaf temperature towards spontaneous combustion (Figure 2). The measured gas concentrations, reaction rates and heat release intensities are listed in Table 2.
Figure 2.
Variation of the heat release intensity with temperature.
Table 2.
Experimental data of gas release and heat release intensity.
The ignition temperature T3 = 285 °C corresponds to the transition from oxidative mass gain to combustion mass loss. Below this temperature, surface oxidation kinetics govern the coal–oxygen reaction and heating remains gradual. Above it, volatile release and gas-phase combustion intensify, and the reaction becomes self-accelerating. T3 is therefore used as the ignition threshold in the numerical simulation.
The thermal changes near the critical temperature T1 and dry-cracking temperature T2 are too weak for reliable identification from the TG-DSC curves. These temperatures were therefore determined from inflection points in the gas generation rates measured during temperature-programmed oxidation (Section 3.2). At T1 = 70 °C, the first marked acceleration in CO generation indicates a shift towards chemisorption-dominated coal–oxygen interactions. At T2 = 110 °C, both CO and CO2 generation accelerate sharply, accompanied by extensive cleavage of side chains and bridging bonds as the coal enters accelerated oxidation.
The gas-derived temperatures T1 and T2 complement the TG-DSC stage boundaries at 160, 285 and 685 °C. The former describe changes in low-temperature oxidation kinetics, while the latter identify transitions in the macroscopic thermal response. T1 and T2 are 215 °C and 175 °C below T3, respectively, indicating that spontaneous-combustion risk develops well before ignition becomes evident in the thermal curves. These earlier transitions support early warning during low-temperature oxidation.
3.2. Gas Release Behaviour
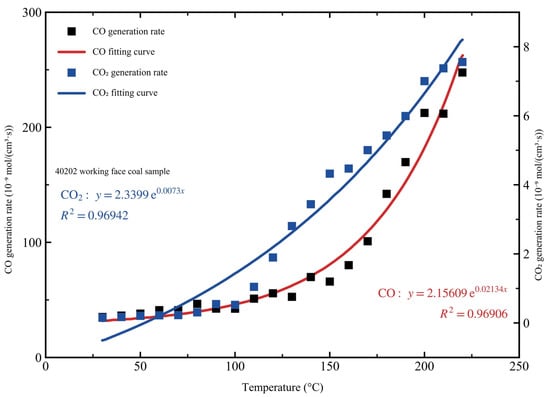
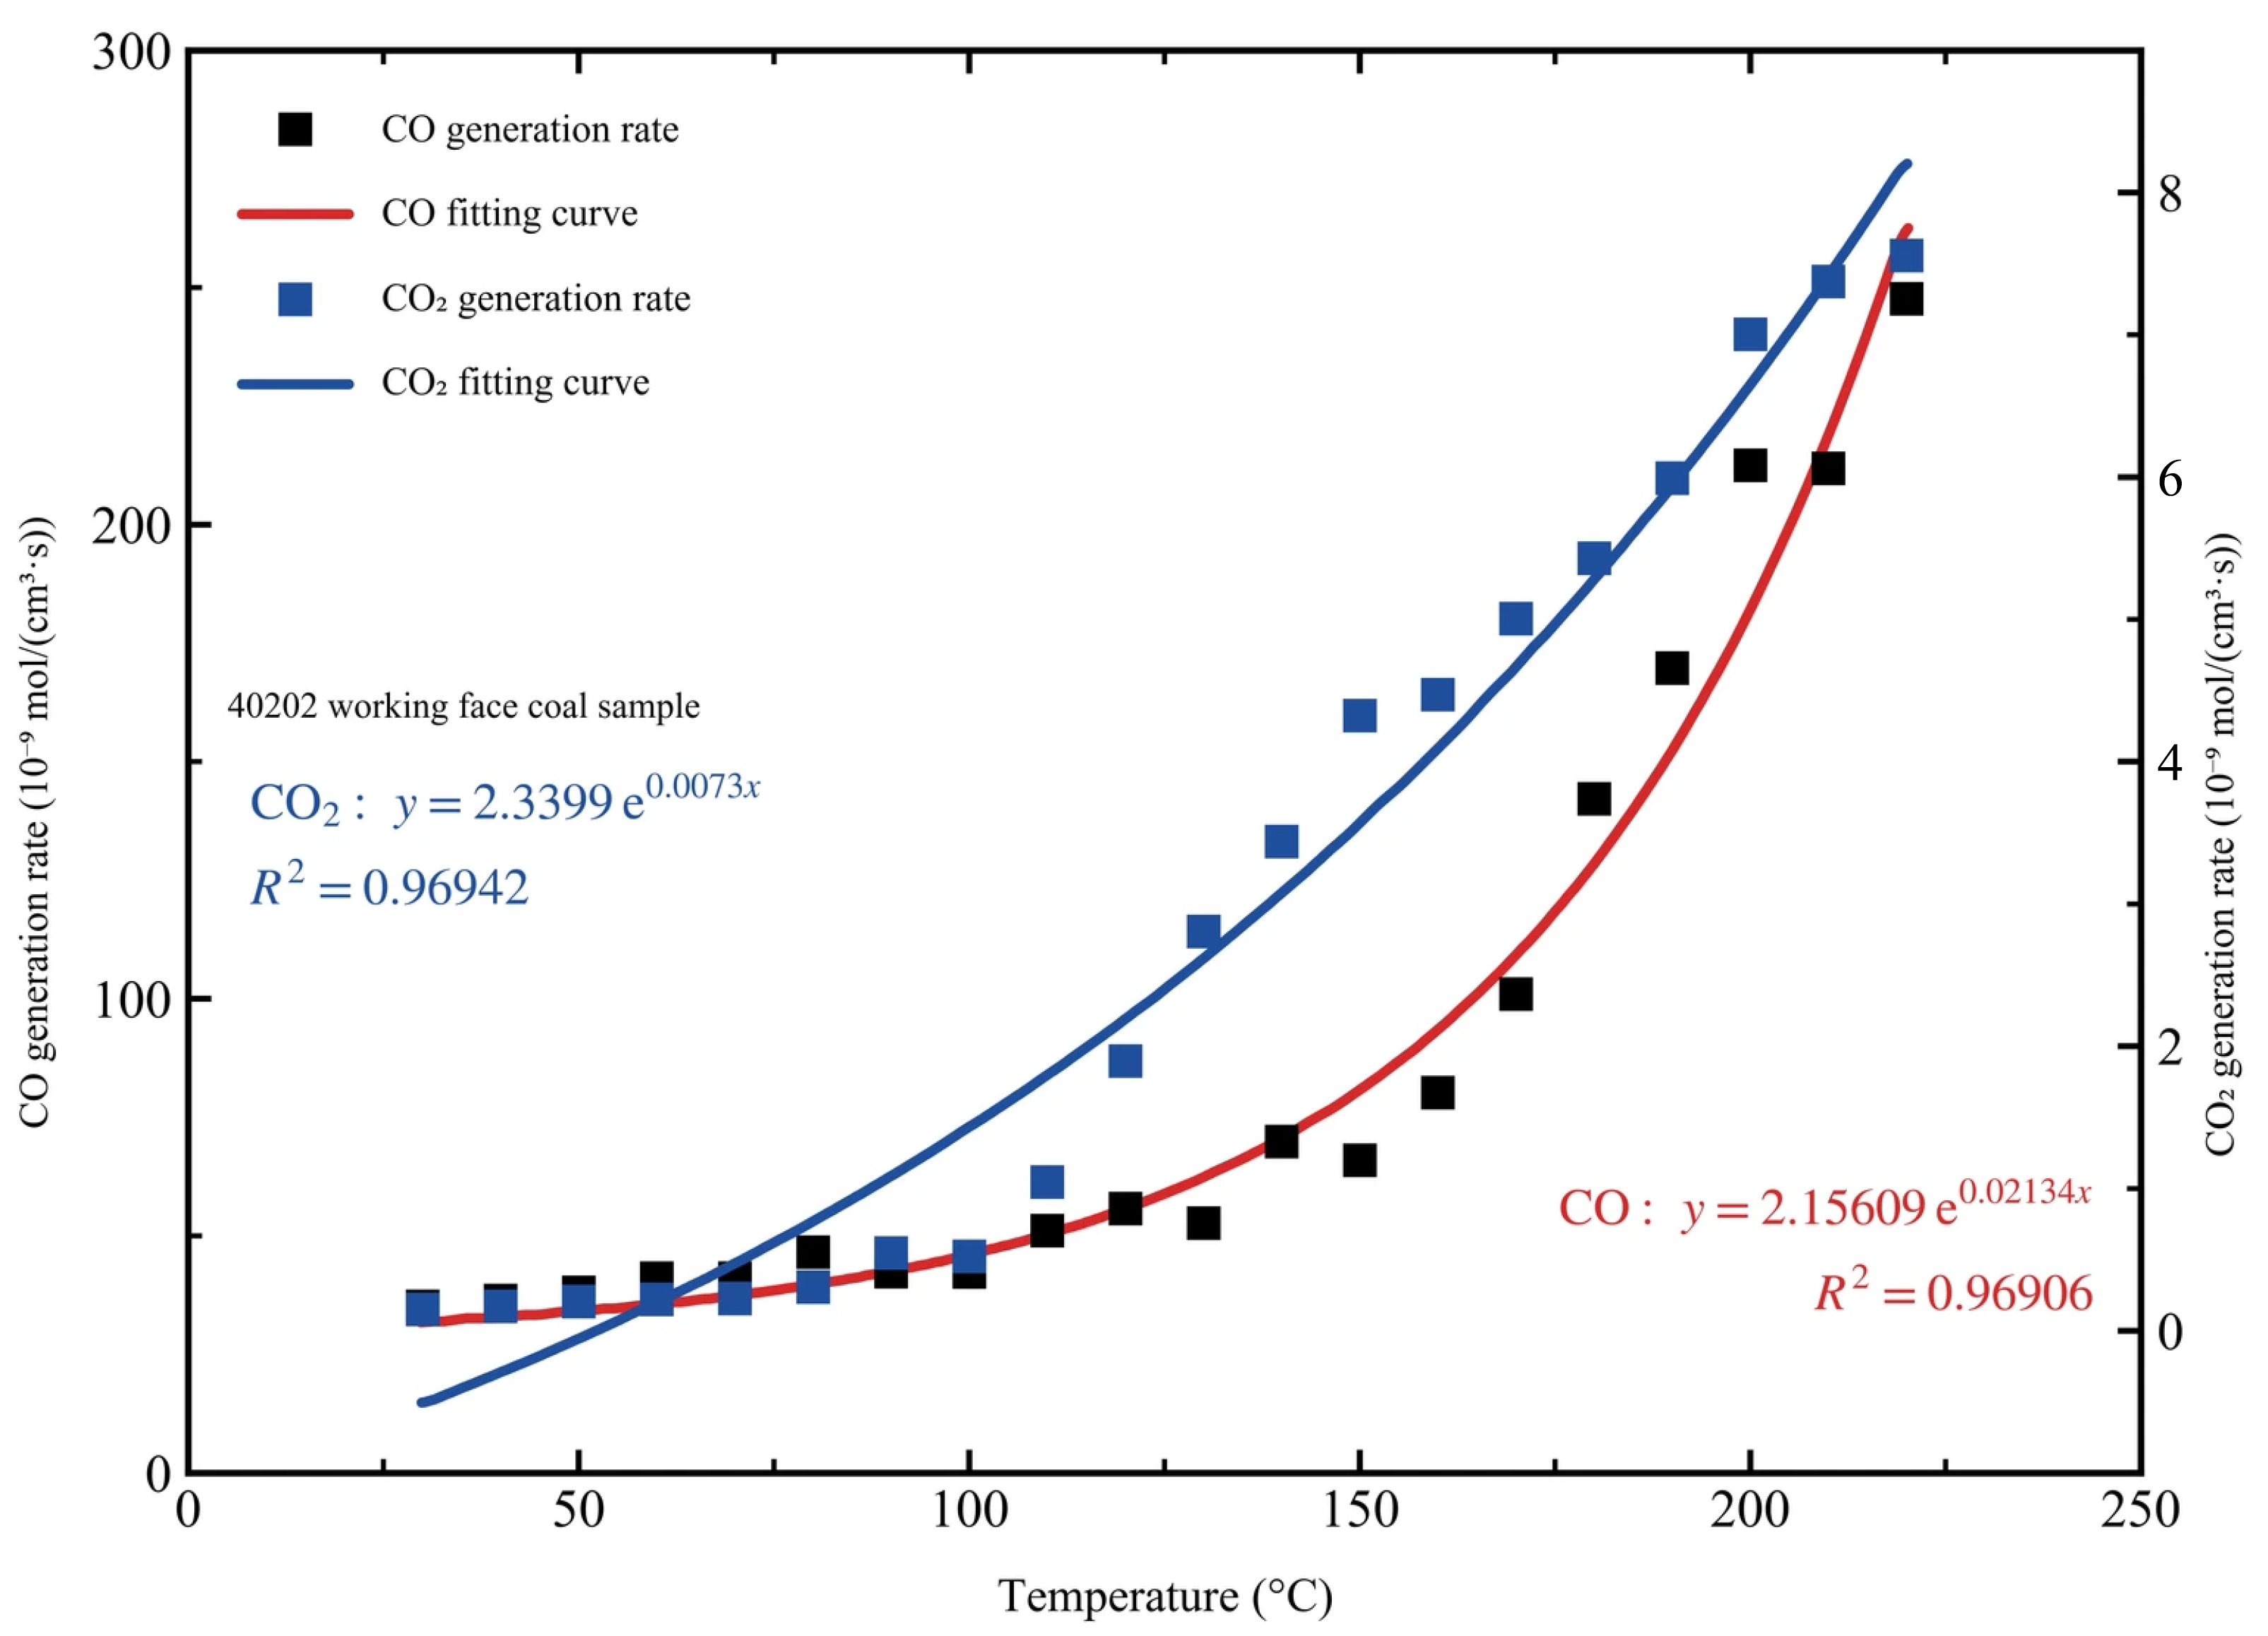
Figure 3 shows the temperature dependence of CO and CO2 generation during temperature-programmed oxidation. Both rates increase approximately exponentially, with changes in their growth trends at the critical and dry-cracking temperatures. The lnV–T relationships exhibit three intervals with progressively increasing slopes, supporting the stage divisions at T1 and T2 in Section 3.1. Below 70 °C, gas generation is slow and coal–oxygen interactions are dominated by physical adsorption and weak chemisorption. Between 70 °C and 110 °C, CO generation accelerates more strongly than CO2 generation as chemisorption becomes more prominent. Above 110 °C, extensive side-chain cleavage increases the abundance of reactive structures, and both gas generation rates rise rapidly. The outlet gas concentrations change accordingly: over 30–200 °C, the CO volume fraction increases from 5.6 × 10⁻⁶ to 5.76 × 10⁻² and the CO2 volume fraction from 3.71 × 10⁻⁶ to 7.02 × 10⁻². Meanwhile, outlet O2 decreases from 21.0% to 2.95%, a reduction of 18.05 percentage points. Oxygen depletion and increasing carbon oxide generation provide complementary measures of oxidation.
Figure 3.
Variation of the CO and CO2 generation rates with temperature.
At each temperature, the CO2 generation rate exceeds the CO generation rate, although the difference narrows as temperature rises. The CO/CO2 ratio increases monotonically from 0.15 at 30 °C to 0.82 at 200 °C. Mechanistic studies describe parallel pathways with different energy barriers: CO forms through two-step free-radical decomposition of aldehyde groups (6.90 and 9.89 kcal/mol), with generation beginning at 30 °C and accelerating above 70 °C; CO2 formation through oxidation and decarboxylation of carboxyl groups involves higher barriers (13.48 and 17.51 kcal/mol) and becomes significant above 90–100 °C [27]. Li et al. [28] linked both gases to a common peroxide intermediate through alkoxy radicals, while Wang et al. [29] attributed the predominance of CO2 at low temperatures to decomposition of the initial chemisorption intermediate. These pathways help explain the increasing CO/CO2 ratio and the stronger temperature response of CO generation. Consistently, the fitted apparent activation energies for CO (32.49–58.85 kJ/mol) exceed those for CO2 (26.30–44.61 kJ/mol) in every interval (Section 3.3). The ratio can therefore support identification of oxidation stages, with its absolute value depending on the coal.
3.3. Reaction Kinetic Parameters
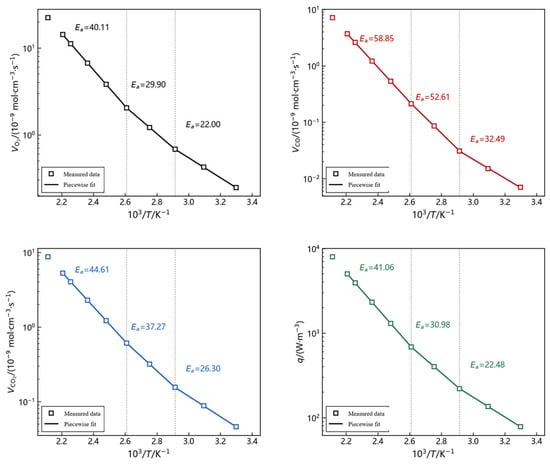
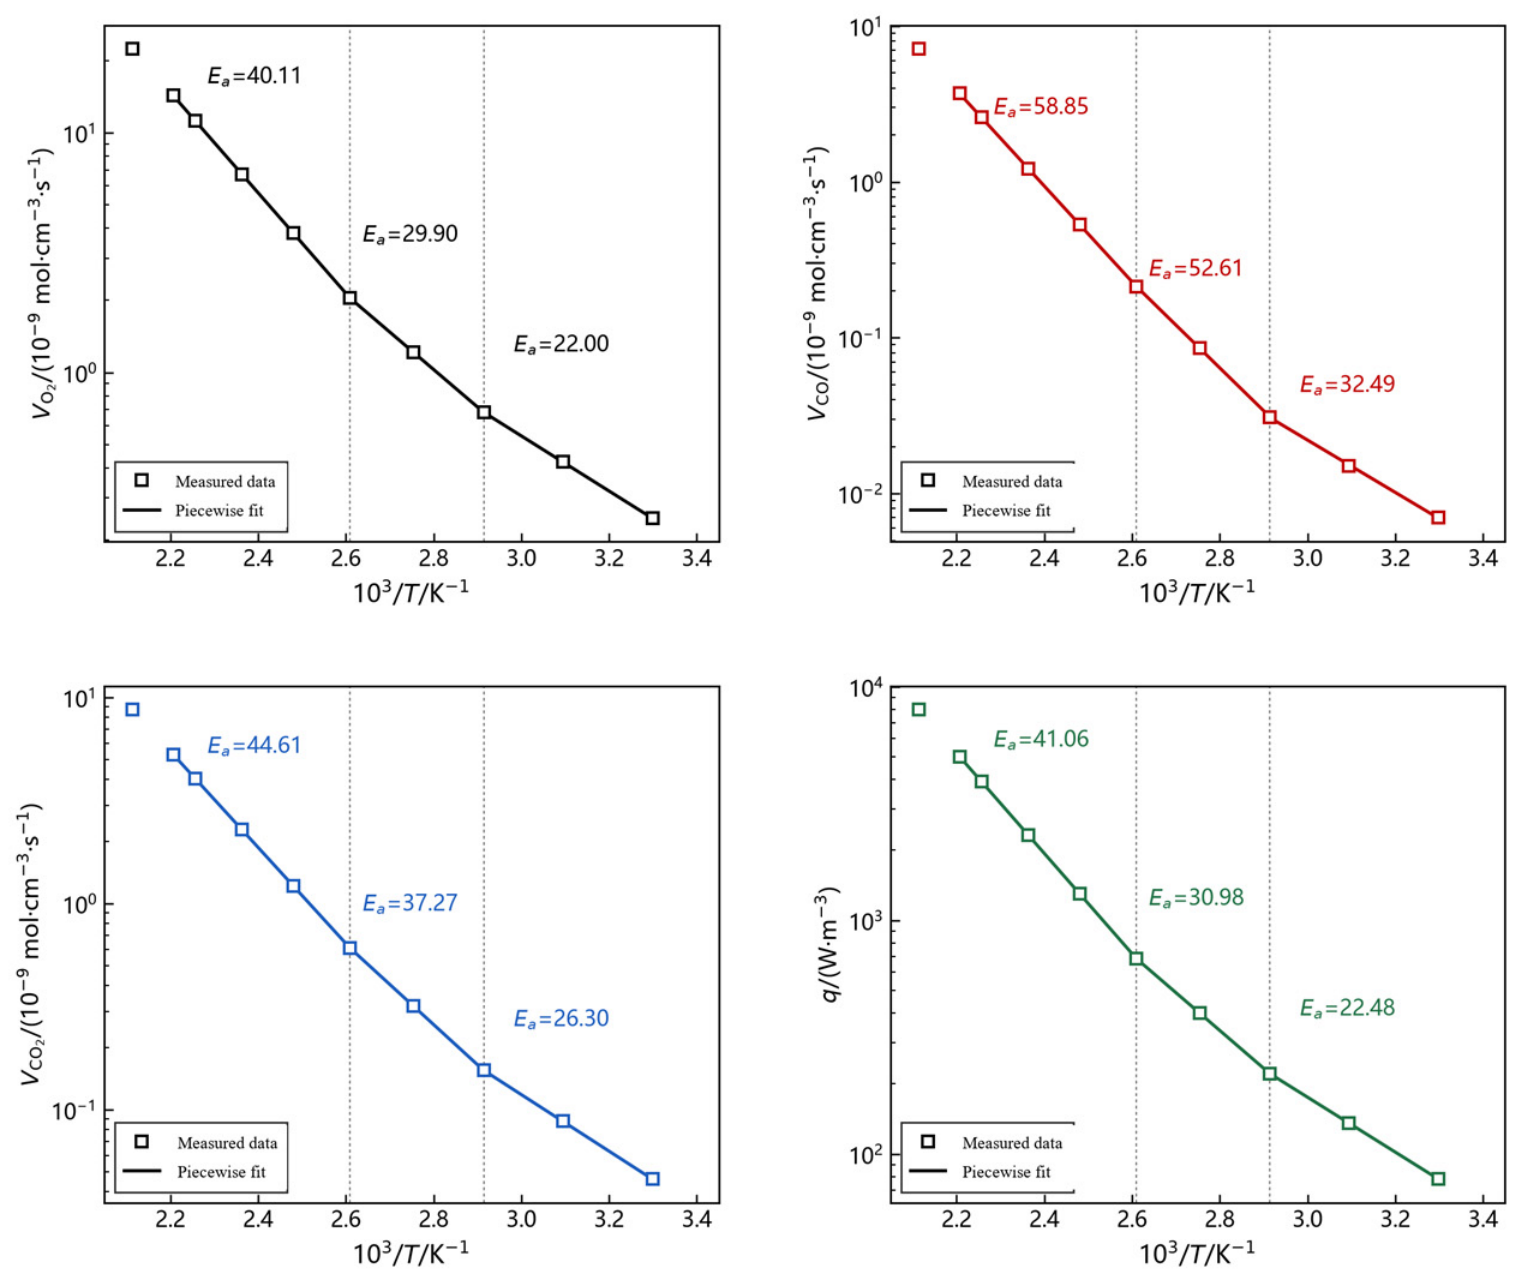
The temperature dependence of coal oxidation is described by the Arrhenius relationship, in which the logarithm of the rate constant varies linearly with 1/T, with a slope of −Ea/R. Changes in the dominant reaction mechanisms and rate-controlling steps can produce different apparent activation energies across temperature intervals. Piecewise regression was therefore used to characterise these changes. The critical temperature of 70 °C and dry-cracking temperature of 110 °C defined three fitting intervals: 30–70, 70–110 and 110–180 °C. Separate Arrhenius regressions were performed for oxygen consumption, CO/CO2 generation and heat release intensity.
The fitted apparent activation energies increase across the three intervals of 30–70, 70–110 and 110–180 °C. The respective values are 22.00, 29.90 and 40.11 kJ/mol for oxygen consumption; 32.49, 52.61 and 58.85 kJ/mol for CO generation; 26.30, 37.27 and 44.61 kJ/mol for CO2 generation; and 22.48, 30.98 and 41.06 kJ/mol for heat release intensity. All interval-specific coefficients of determination exceed 0.999. The residual patterns and activation-energy trends provide further support for the selected intervals.
The fitting boundaries at 70 and 110 °C correspond to the measured T1,exp and T2,exp in Section 3.1, with the number of observations in each interval determined by the sampling schedule. A single Arrhenius fit to all ten observations from 30 to 200 °C gives R2 = 0.985. Its heat-release residuals show a systematic pattern: +37.7, +5.9, −16.0, −19.5, −22.5, −12.4, −2.1, +8.3, +13.6 and +24.0% at 30, 50, 70, 90, 110, 130, 150, 170, 180 and 200 °C, respectively. Positive residuals at the ends and negative residuals in the middle indicate increasing apparent activation energy with temperature. Deviations of 20–38% exceed the approximately 1% measurement scatter of CO, the most variable of the four measured quantities. All four activation-energy series increase across successive intervals (Figure 4), consistent with the trends reported by Lu and Zhang et al. The corresponding mechanisms progress from physical adsorption and oxidation of surface active groups at 30–70 °C, through chemisorption and peroxide formation and decomposition at 70–110 °C, to side-chain and bridging-bond cleavage above 110 °C. The pre-exponential factor also increases as oxidation accelerates. A stoichiometric check gives a minimum oxygen demand of 20.0–54.9% of measured oxygen consumption over 30–200 °C, using requirements of 1 mol O2 per mol CO2 and 0.5 mol O2 per mol CO. The experiments ended at 200 °C because outlet oxygen fell below 9.5% above 180 °C at the applied air-to-coal ratio of approximately 0.2 mL/(min·g), and self-heating increasingly affected temperature control. The simulation extended to T3 = 285 °C using the fitted high-temperature branch over 200–285 °C. Scaling this branch by 0.80 or 1.25 changed the predicted ignition time by +0.22 d or −0.18 d, respectively (Section 4.6.1).
Figure 4.
Piecewise Arrhenius fitting of the kinetic parameters. (Squares denote measured data, and solid lines represent piecewise fits. The apparent activation energies are given in kJ/mol).
3.4. Limiting Parameters of Coal Spontaneous Combustion in the Goaf
Limiting oxygen concentration: Comparative temperature-programmed tests used inlet oxygen volume fractions of 5%, 7%, 9%, 15% and 21%. Below 9%, heating slowed markedly and exothermic acceleration was absent up to 200 °C; at 7%, oxidative heat release was substantially suppressed. These observations place the limiting oxygen concentration for sustained spontaneous combustion at 7–9%. This threshold describes the loss of self-sustained heat accumulation, while oxidation can continue at lower oxygen concentrations, as observed at an outlet O2 concentration of 2.95% at 200 °C in Section 3.2. For a 0.8 m layer with λe = 0.30 W/(m·K), a heat release intensity of 57.5 W/m3 at 20 °C and an apparent activation energy of 22.48 kJ/mol over 30–70 °C, the Frank-Kamenetskii slab parameter is δ = q·Ea·(h/2)2/(λe·R·T02) = 0.965. Relative to δcr = 0.878, this gives δ/δcr = 1.10, placing the layer slightly above the critical condition. This proximity is consistent with an incubation period of approximately 70 d. Reducing the source term to 0.91 of its value in air makes the layer subcritical, allowing thermal extinction at 7–9% O2, while oxidation continues at a substantial rate. The measured range is used to define the oxidation–suffocation boundary at 8% (Section 4.4) and to calibrate the oxygen dependence of the source term (Section 4.2).
Limiting residual coal thickness: following the theory of hazardous-zone determination for coal spontaneous combustion [15], the residual coal is represented as a thin layer between the roof and floor, with a uniform internal heat source and conductive heat loss. Sustained spontaneous combustion becomes possible when the centre of the layer reaches the critical temperature. The minimum thickness is obtained from the one-dimensional steady heat-balance solution:
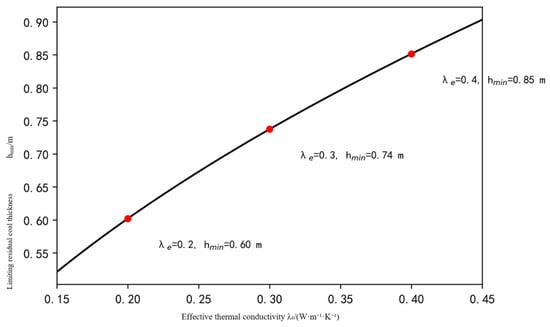
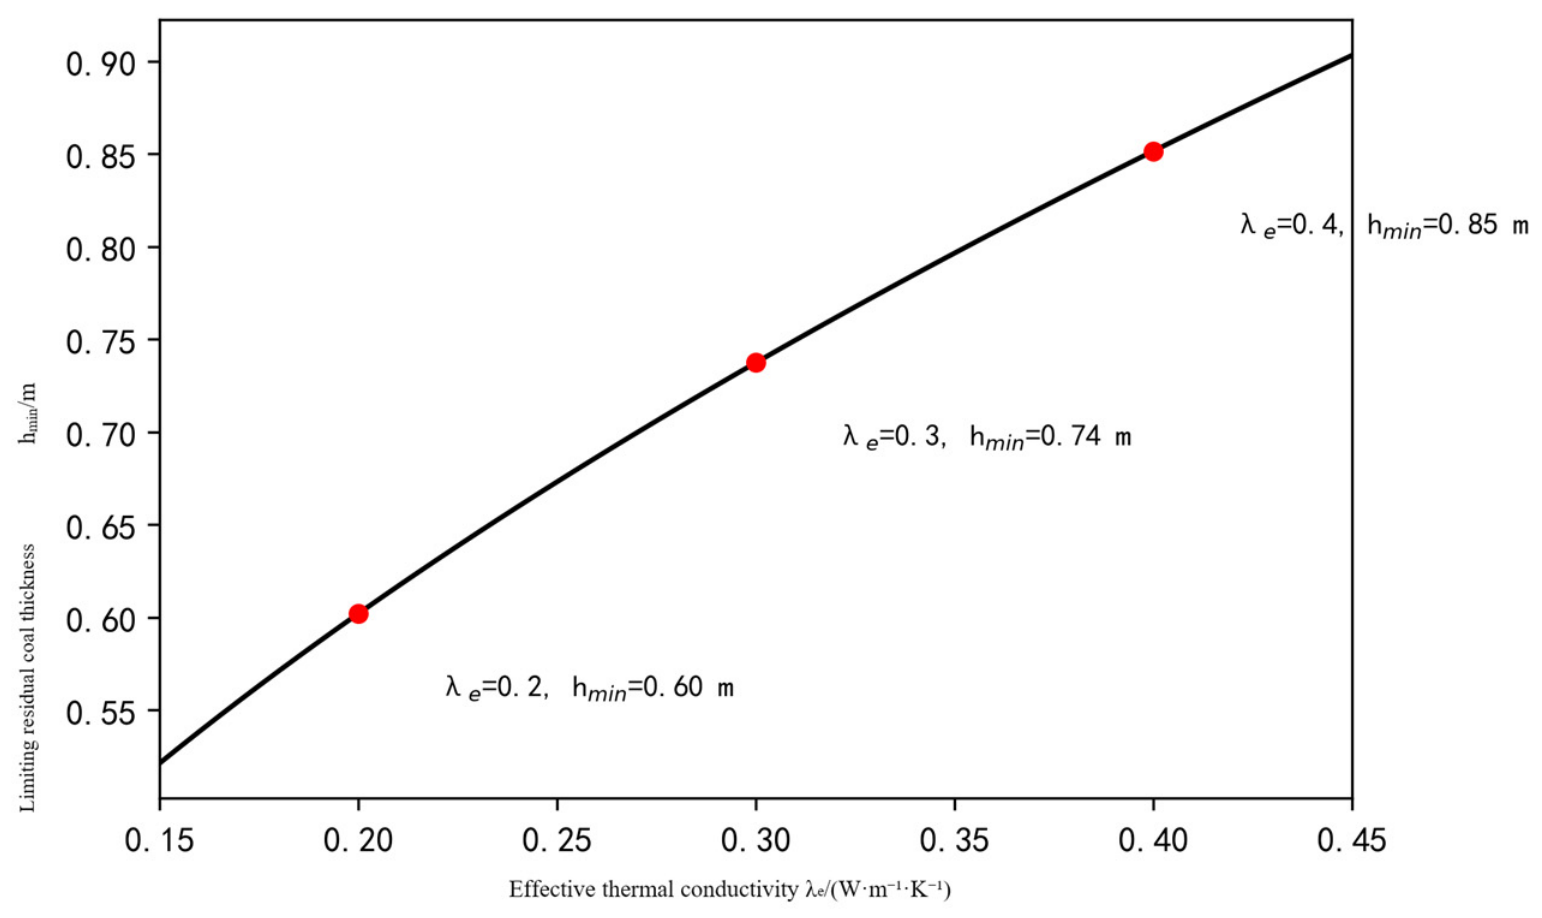
where λe is the effective thermal conductivity of loose caved coal, taken as 0.2–0.4 W/(m·K), consistent with the reference value of 0.30 W/(m·K) in Table 3; Tc is the measured critical temperature of 70 °C (Section 3.1); T0 is the surrounding-rock temperature of 20 °C; and q(Tc) is the measured heat release intensity of 220.7 W/m3 at Tc (Table 2). Equation (4) gives a limiting residual coal thickness of 0.60–0.85 m (Figure 5). Considering conductive loss alone gives a conservative thickness estimate relative to conditions with additional convective cooling from air leakage. The average residual coal thickness of approximately 0.8 m in the oxidation zone approaches the upper end of this range, indicating a risk of spontaneous combustion. The simulations in Section 4.5 support this estimate: the 0.5 m layer remains below the ignition threshold for 150 d, while the 0.8 m layer ignites after 71 d.
Table 3.
Main parameters of the numerical simulation.
Figure 5.
Relationship between the limiting residual coal thickness and the effective thermal conductivity.
4. Numerical Simulation of the Goaf Temperature Field
4.1. Physical Model and Basic Assumptions
The experiments in Section 3 quantified coal reaction rates and heat release under controlled gas-supply and boundary conditions. In the goaf, oxygen supply through air leakage, heat transfer to surrounding rock and oxidative heat generation interact across a heterogeneous porous region. A model coupling seepage, heat transfer and oxygen transport was developed to predict the high-temperature-zone position and the times required to reach the critical, dry-cracking and ignition temperatures. The fitted oxygen consumption rate V(T) supplies the oxygen sink, and q(T) supplies the heat source. The measured limiting oxygen concentration of 7–9% defines the oxidation–suffocation boundary at 8% and provides the calibration target for the oxygen-dependence function f(C) (Section 4.2). The characteristic temperatures T1, T2 and T3 (70, 110 and 285 °C) define the thermal thresholds, and the limiting residual coal thickness of 0.60–0.85 m guides the thickness sensitivity analysis. The depth-averaged two-dimensional domain extends from x = 0 to 160 m along the strike, with x = 0 at the working face, and from y = 0 to 60 m along the dip. The caving-zone height is H = 10 m. The model assumes that (1) the caving zone is an anisotropic porous medium governed by Darcy’s law; (2) leakage air is incompressible and the oxygen field is quasi-steady because the air residence time, approximately 103 s, is much shorter than the coal heating time, approximately 105 s; (3) residual coal is uniformly distributed with equivalent thickness hc; (4) heat transfer to the roof and floor follows transient conduction; and (5) radiative transfer and secondary moisture condensation are negligible, while the latent heat of evaporation is represented through an increase in apparent specific heat.
Compaction of the caved rock increases along the strike. The bulking factor is represented by Kp = 1.12 + 0.38exp(−x/65), where x is the distance from the working face in metres. The corresponding porosity, φ = 1 − 1/Kp, decreases from 0.26 near the working face to 0.11 in the deep goaf, consistent with the “O”-ring compaction pattern.
The model uses a fixed geometry, with t = 0 defined as the time when caving has stabilised and residual coal first contacts leakage air. The predicted incubation periods therefore represent a conservative scenario in which working-face advance has stopped. Experimental rates were measured per unit packed volume of 60–80 mesh loose coal and applied as volumetric reaction intensities for the residual coal. The difference between experimental and field particle sizes is incorporated into the field-derived equivalent thickness of 0.8 m, with its influence examined through the sensitivity analysis in Section 4.5. Simulation outputs are denoted by “sim”: Tmax,sim is the maximum temperature, xHT,sim is the high-temperature-zone position, and t_ign,sim is the ignition time. Section 4.6 presents the uncertainty budget for the predicted times.
4.2. Mathematical Model
The governing equations describe seepage, oxygen transport and energy conservation.
(1) Seepage: leakage airflow satisfies mass conservation and Darcy’s law. Permeability is estimated using the Kozeny–Carman relationship:
where u is the seepage velocity (m/s); K is permeability (m2); μ is the dynamic viscosity of air, set to 1.81 × 10⁻⁵ Pa·s; p is pore pressure (Pa); dp is the characteristic size of the caved material, set to 0.03 m; and φ is porosity.
∇·u = 0
(2) Oxygen transport:
where C is the molar oxygen concentration (mol/m3), and De is the effective diffusion–dispersion coefficient. Its longitudinal and transverse components are Dm + αL|u| and Dm + αT|v|, respectively, with Dm = 2.0 × 10⁻⁴ m2/s, longitudinal dispersivity αL = 3.0 m and transverse dispersivity αT = 0.6 m.
∇·(HCu) − ∇·(φHDe∇C) = −VO2(T) · hc
(3) Energy equation:
where CA is the equivalent volumetric heat capacity (J/(m3·K)), combining the sensible heat capacity of residual coal, the heat capacity of thermally affected surrounding rock and the latent heat of moisture evaporation: CA = capp(T)·hc + ρRcR·δ. The effective thermal conductivity of residual coal is λe = 0.30 W/(m·K), and the surrounding-rock properties are λR = 2.0 W/(m·K) and αR = 8.9 × 10⁻⁷ m2/s. The volumetric heat capacity of air is ρgcg = 1206 J/(m3·K). Oxygen inhibition is represented by f(C) = (C/C_air)^n, where C_air is the oxygen concentration in air (21%) and n = 0.10 is calibrated against the limiting-oxygen tests. The apparent specific heat capp(T) includes the latent heat of moisture evaporation, distributed sinusoidally over 40–160 °C. The total moisture content after air-drying in the goaf is set to 2.5%.
The oxygen-dependence function f(C) = (C/C_air)^n, with C_air = 0.21 and 0 ≤ C ≤ 0.21, decreases continuously as oxygen availability declines. The exponent n is calibrated against the limiting-oxygen tests in Section 3.4. The Frank-Kamenetskii condition gives δ/δcr = 1.10, requiring the heat source to fall to 0.91 of its value in air for extinction. This calibration yields n = 0.10 and a modelled extinction threshold of 8.1% O2, within the measured range of 7–9%. Applying the steady-balance criterion in Equation (4) to the 0.8 m layer gives n = 0.19 and a corresponding threshold of 12.7%. These calibration approaches give an exponent range of n = 0.10–0.19; the model adopts n = 0.10 (Table 3), and a wider range of n is considered in the uncertainty analysis in Section 4.6.2. The exponent represents the effective response inferred from macroscopic thermal criticality. Near this condition, a small change in the heat source can substantially alter the thermal outcome, accounting for its lower value relative to the intrinsic oxygen reaction orders of approximately 0.5–0.7 measured isothermally for other coals. At 7% O2, the adopted function gives f = 0.896, below the critical value of 0.91, consistent with the suppression of self-accelerating heating observed experimentally.
At the working face (x = 0), pressure is prescribed as p = Δp(1 − y/W), where Δp = 45 Pa is the pressure difference between the two roadways. Inflow boundaries have fixed oxygen and temperature values of 21% and 20 °C; outflow boundaries have zero gradients for both quantities. Zero-flux conditions apply at x = 160 m, corresponding to the open-off-cut coal pillar, and at y = 0 and y = 60 m. Initially, the domain is at the surrounding-rock temperature of 20 °C, and the oxygen and pressure fields are equilibrated with the initial seepage field.
4.3. Numerical Method and Model Validation
The equations are discretised on structured grids using the two-point flux approximation (TPFA) finite-volume method. Pressure and oxygen concentration are obtained by direct solution of sparse linear systems, convection uses first-order upwinding, and temperature advances explicitly in time. The grid and time-step checks in Table 4 show that refining the grid from 40 × 15 to 160 × 60 changes the maximum temperature at 40 d by less than 0.05 °C. Reducing the time step from 7200 s to 900 s changes it by less than 0.25%. The reference case uses an 80 × 30 grid and a time step of 1800 s. The broad temperature maximum makes its position more sensitive to grid resolution: refinement from 40 × 15 to 160 × 60 changes the maximum by 0.04 °C (60.92 → 60.88 °C) and shifts its position by 6.5 m. Approximating the peak as quadratic, ΔT = ½|T″|(Δx)2, gives |T″| ≈ 1.9 × 10⁻³ °C/m2, corresponding to a temperature variation below 0.1 °C within ±10 m of the maximum. Maximum temperatures are therefore taken from the 80 × 30 grid, with convergence better than 0.05 °C, while positions are reported to the nearest metre, with a grid-related spread of ±3.5 m.
Table 4.
Grid- and time-step-independence verification (t = 40 d).
Three checks were used to assess the model. First, a limiting-case calculation suppressed heat transfer to the surrounding rock and air leakage while maintaining sufficient oxygen. Including reactor thermal inertia and sensible heat carried away by the carrier gas gave an incubation period of approximately 40 d, consistent with the kilogram-scale self-heating experiment and supporting the kinetic source terms under near-adiabatic conditions. Second, simulated air leakage was 2.43 m3/s, or 6.7% of the working-face air supply, within the measured range of 5–15% for U-ventilated fully mechanized top-coal caving faces. Third, the simulated oxidation zone extended 46–68 m from the working face, broadly consistent with beam-tube monitoring at the mine.
4.4. Evolution of the Temperature Field
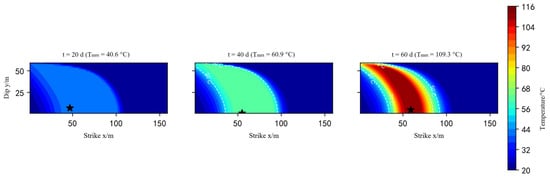
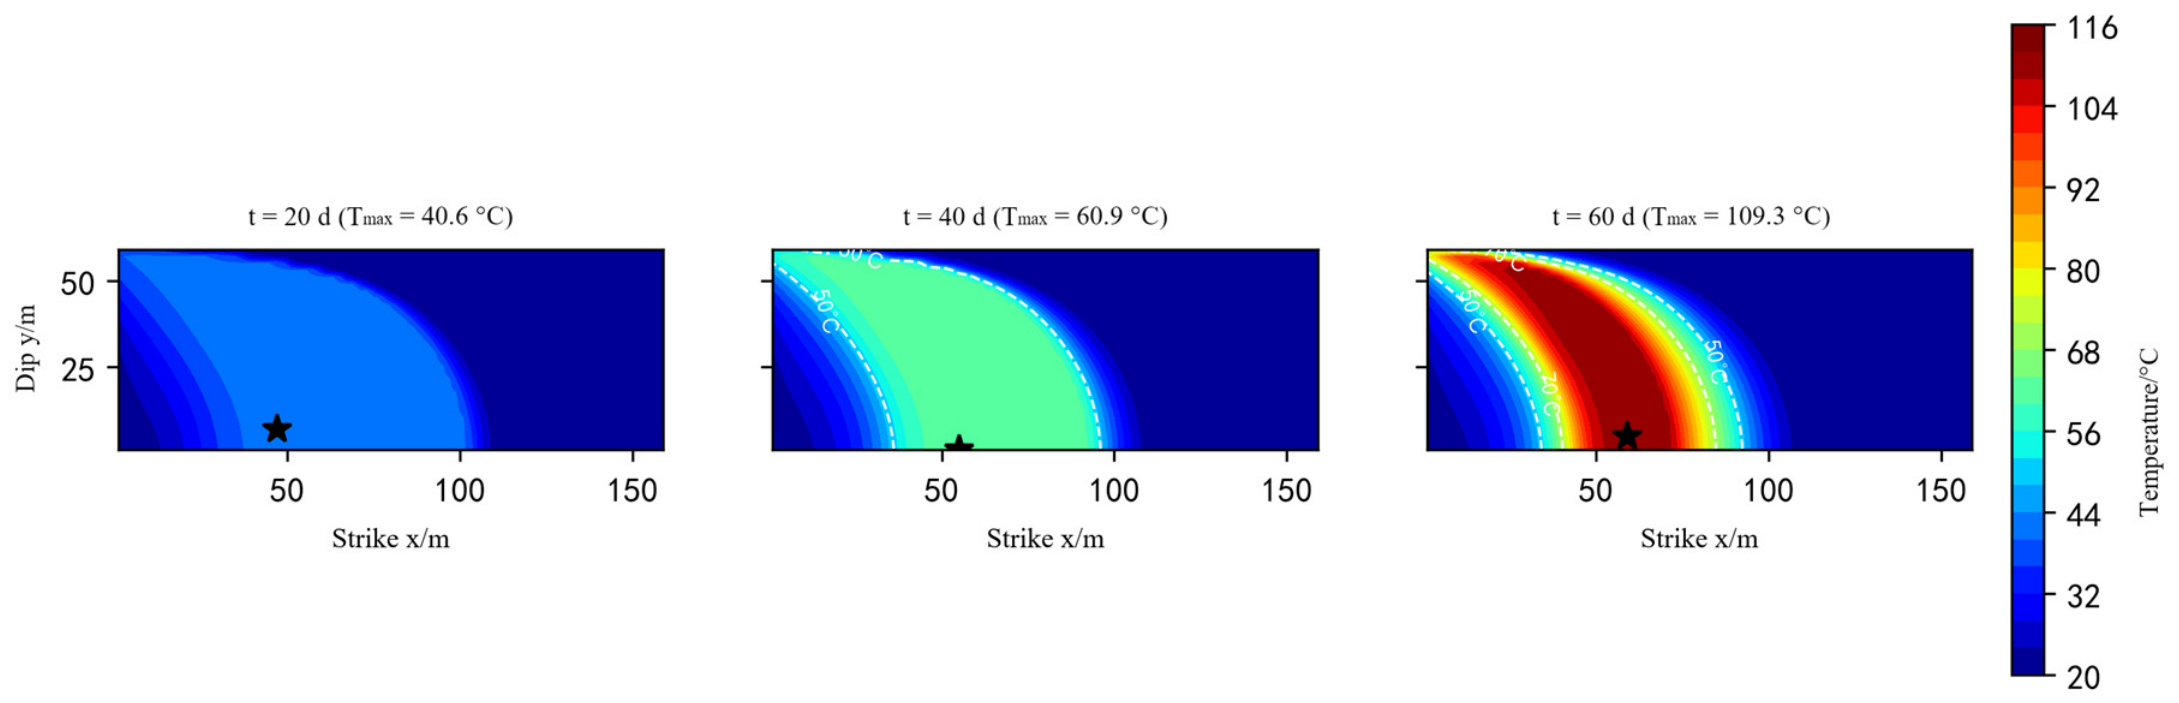
Figure 6 presents the goaf temperature fields on days 20, 40 and 60. Along the strike, temperature rises from the working face to a maximum in the middle goaf and then decreases towards the deep goaf. Fresh airflow maintains temperatures of 20–30 °C within 15 m of the working face. At x = 40–70 m, moderate leakage and sufficient oxygen allow oxidative heat to accumulate, forming a high-temperature zone. Beyond 90 m, the sharp decline in seepage velocity and oxygen concentration suppresses oxidation, and temperatures decrease.
Figure 6.
Evolution of the goaf temperature field (dashed lines are the 50 and 70 °C isotherms; the star symbol indicates the highest temperature point at each time).
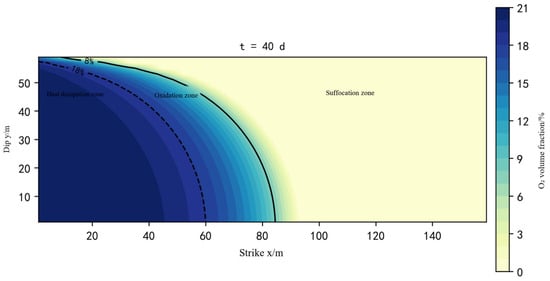
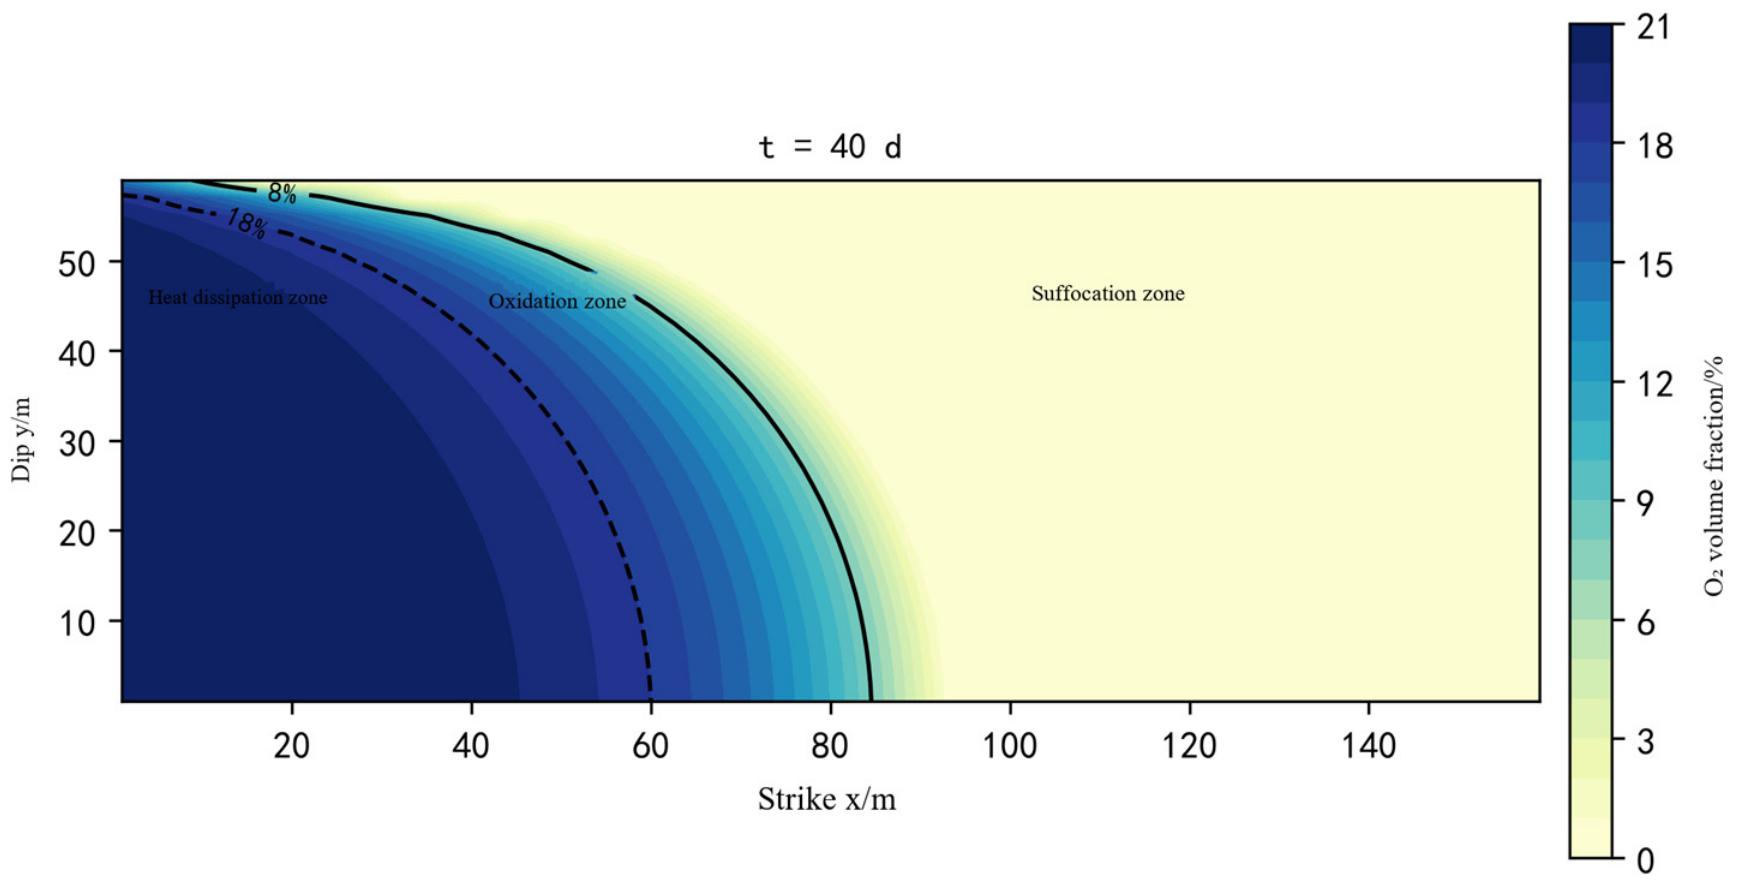
Figure 7 shows the oxygen concentration field and the three spontaneous-combustion zones on day 40, using oxygen volume fractions of 18% and 8% as boundaries.
Figure 7.
Oxygen concentration field and three-zone division of the goaf on day 40.
The heat-dissipation zone extends from 0 to 46.3 m, where high airflow promotes cooling. The oxidation zone extends from 46.3 to 68.2 m, where oxygen supply remains sufficient and weaker heat dissipation favours spontaneous combustion. The suffocation zone extends from 68.2 to 160 m, where oxygen concentrations below the limiting value strongly suppress oxidation. The high-temperature zone lies within the oxidation zone, consistent with the coupled oxygen and temperature distributions.
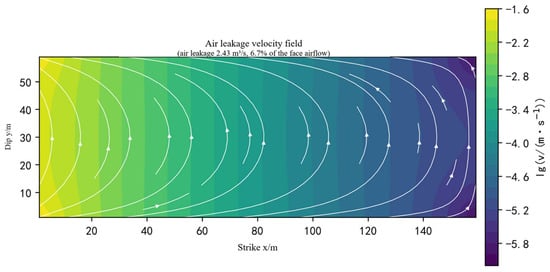
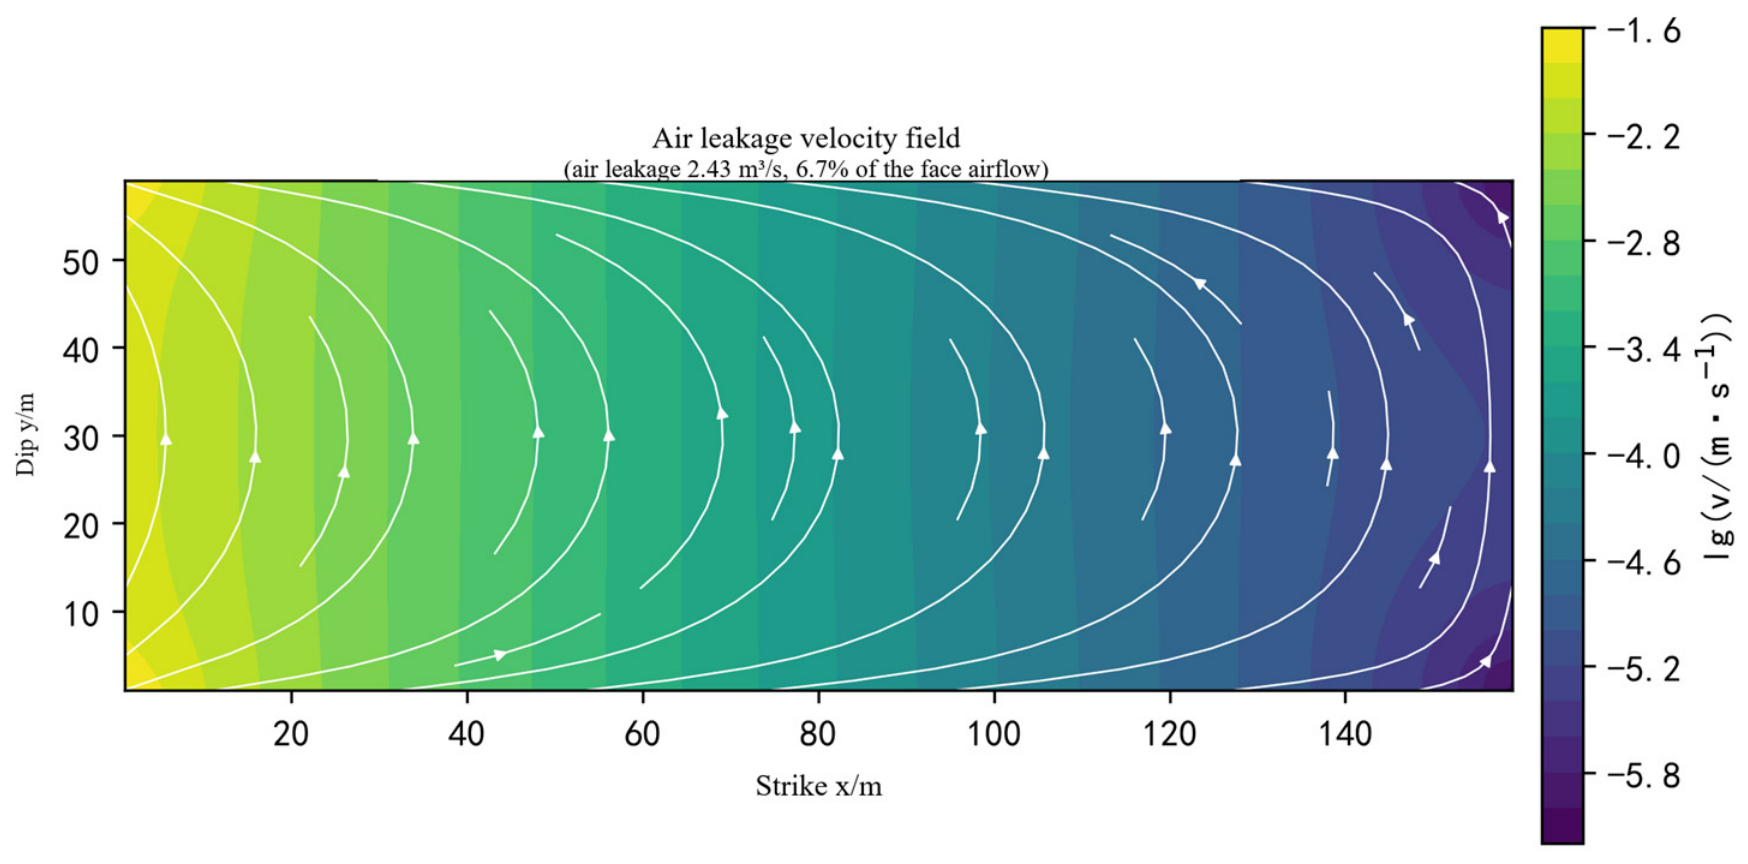
Figure 8 shows air entering the goaf from the intake side (y = 0) and flowing through the caving zone towards the return side. Leakage velocity is highest within 15 m of the working face, reaching approximately 2.5 × 10⁻² m/s at the upper end of the figure’s scale. Progressive compaction produces an approximately exponential decline with depth, reducing velocities to 10−5–10−4 m/s beyond 90 m. Within the oxidation zone at 46.3–68.2 m, Darcy velocities are of the order of 10−3–10−2 m/s, within the range of 0.001–0.01 m/s favourable to oxidation.
Figure 8.
Air-leakage flow field of the goaf (white streamlines; background colour is the velocity magnitude).
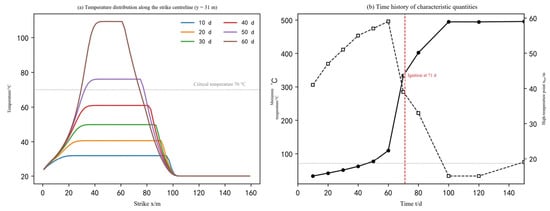
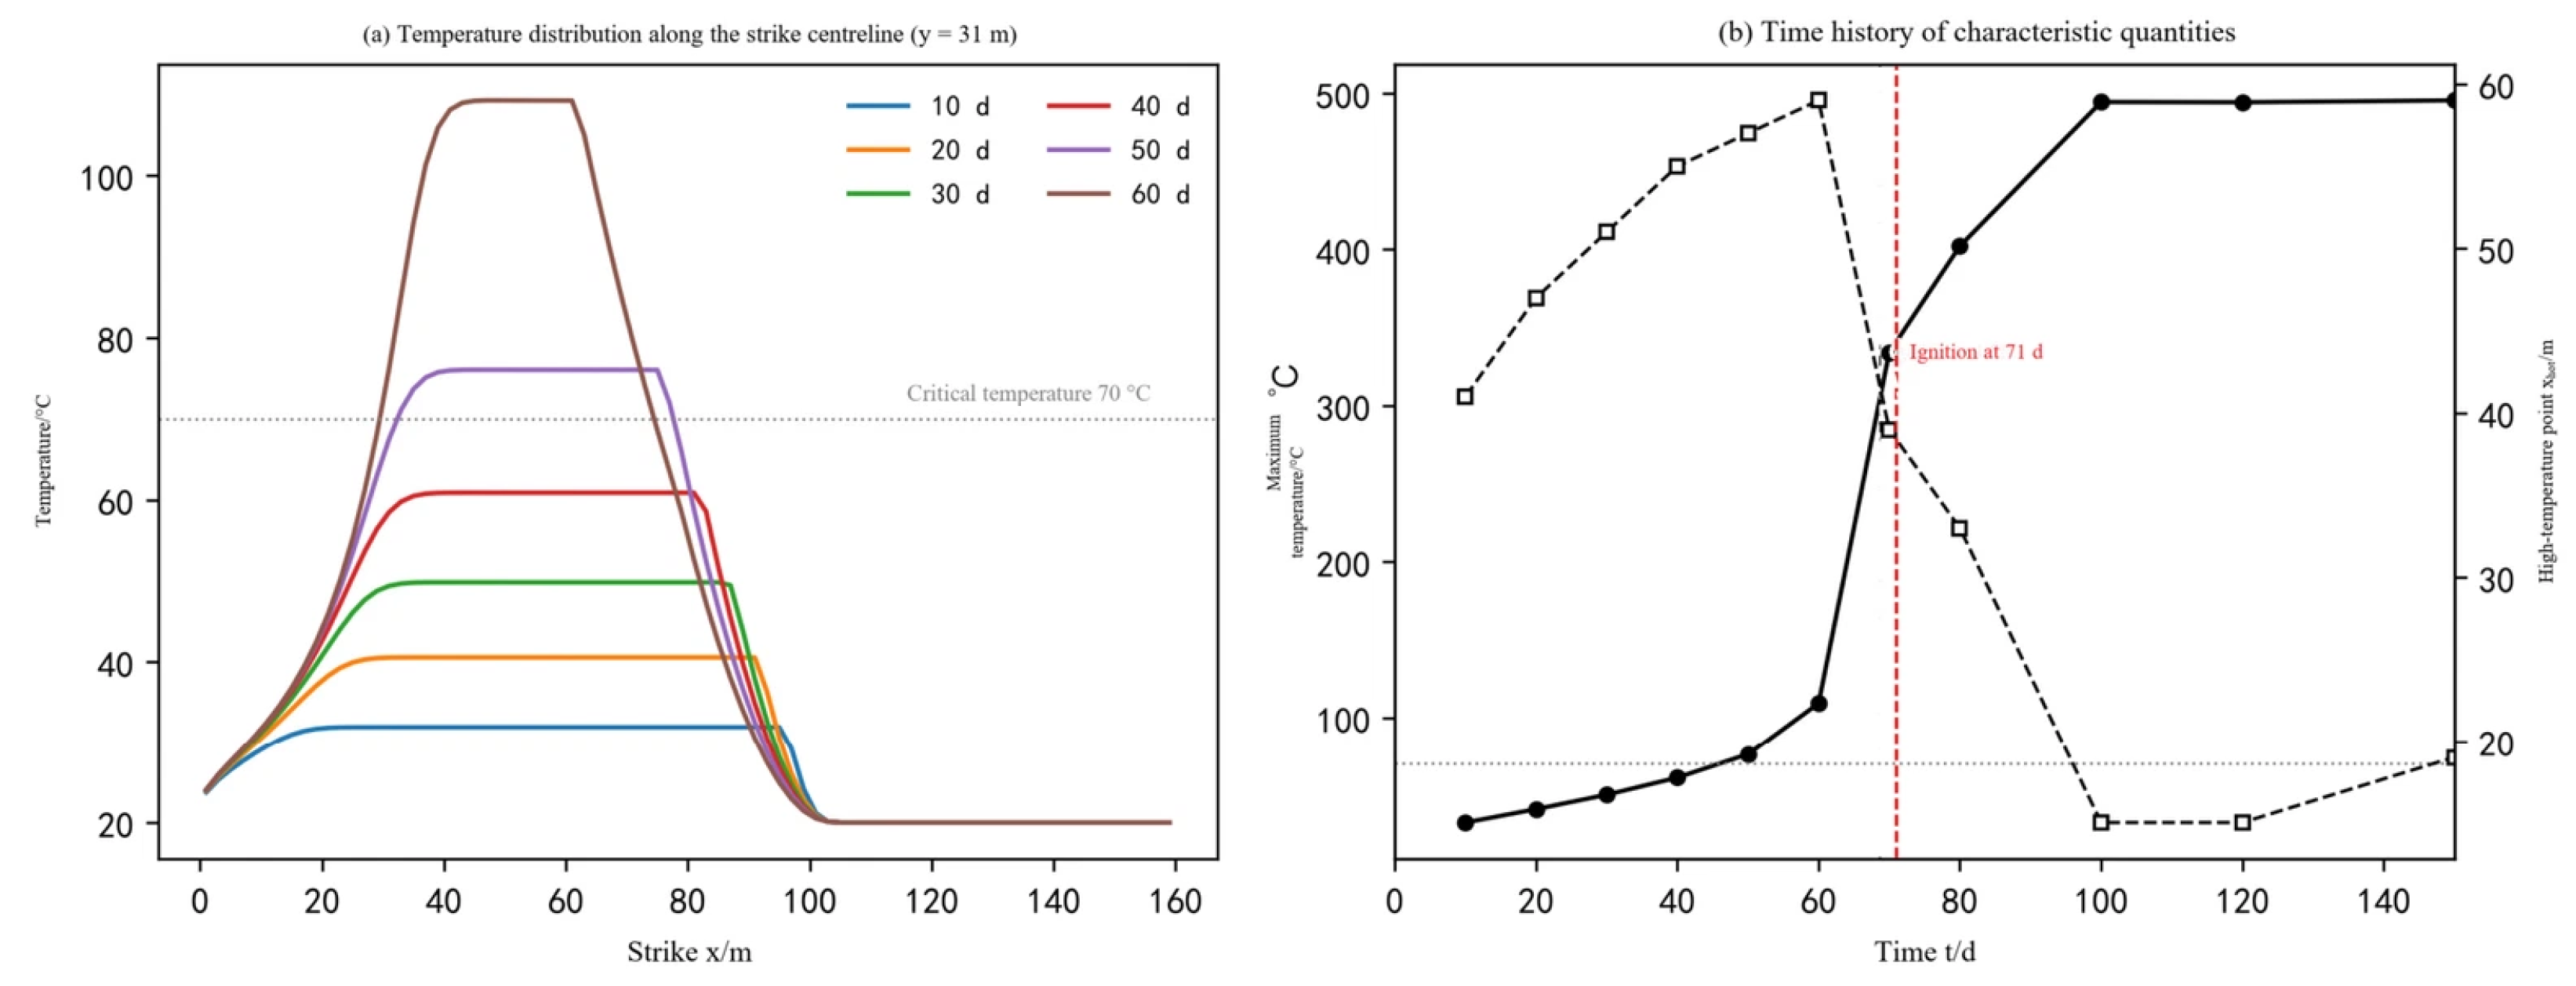
Figure 9 presents strike-centreline temperature profiles and the evolution of characteristic temperature-field quantities for the reference case in Table 3, with a residual coal thickness of 0.8 m.
Figure 9.
Temperature distribution along the strike centreline and the time history of the characteristic quantities of the temperature field.
Four stages are identified. (1) Slow oxidative heat accumulation (0–40 d): The maximum temperature rises from 20 °C to 60.9 °C, approximately 10 °C per 10 d. The high-temperature zone lies at 46.3–55 m within the oxidation zone and moves gradually deeper. The critical temperature of 70 °C is reached on day 46. (2) Accelerated heating (40–62 d): the maximum reaches 109.3 °C on day 60 and the dry-cracking temperature of 110 °C on day 62, while the high-temperature zone advances to 59 m. (3) Thermal runaway: The maximum reaches the ignition temperature of 285 °C on day 71, with an average heating rate exceeding 20 °C/d. Raising the ignition criterion to 350 °C changes the predicted time by 0.19 d, indicating low sensitivity to this threshold. (4) Post-ignition migration: Oxygen depletion in the deep goaf causes the oxidation front and high-temperature zone to move towards the leakage-air supply, from 59 m to approximately 15 m from the working face. Volatile release and gas-phase combustion intensify above the ignition temperature. The initial movement deeper into the goaf followed by migration towards the working face agrees with Wu et al. Their results also link the return movement to greater oxygen availability near the face. Zhang and Chen similarly found that greater residual coal thickness shifts the high-temperature zone towards the working face.
4.5. Parameter Sensitivity Analysis
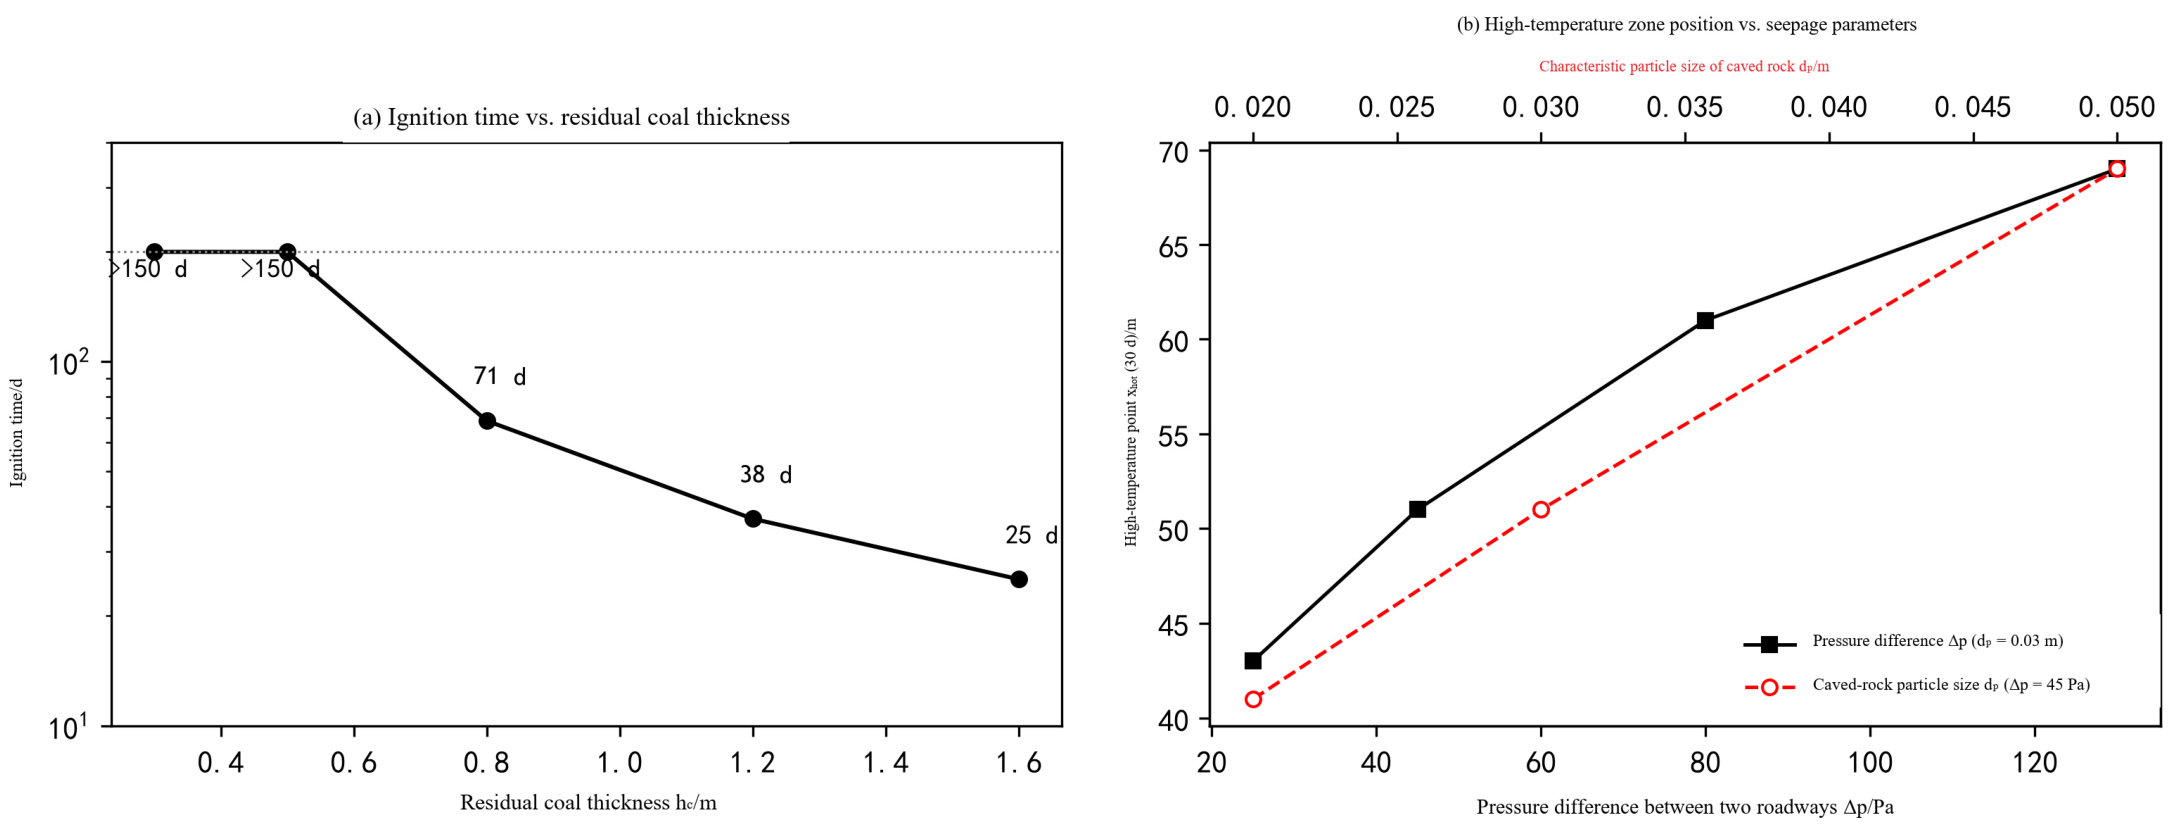
The effects of residual coal thickness, roadway pressure difference and caved-material particle size were evaluated using ignition time and high-temperature-zone position as response variables (Table 5 and Figure 10).
Table 5.
Case settings and computation results of the parameter sensitivity analysis.
Figure 10.
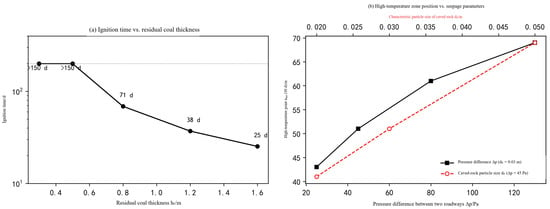
Parameter sensitivity analysis ((a) variation of the ignition time with the residual coal thickness, (b) response of the high-temperature-point position to the pressure difference and the particle size).
Each parameter was varied individually relative to the reference case in Table 3. All cases used the same grid, time step and initial and boundary conditions, and were evaluated against ignition and a 150 d observation period. Ignition time is defined as the first time the maximum temperature reaches 285 °C; “>150” indicates that the maximum temperature remained below the threshold for 150 d. Tmax(30 d) and Tmax(60 d) are the maximum temperatures on days 30 and 60. The high-temperature-point position is the distance from the working face to the maximum temperature on day 30. The rows for 0.8 m, 45 Pa and 0.030 m represent the same reference case and give identical values of 49.8 °C, 109.3 °C, 51 m and 71.0 d. Positions have the grid-related spread of ±3.5 m described in Section 4.3.
Residual coal thickness has the strongest and a markedly nonlinear effect on ignition time. At 0.5 m, the maximum temperature remains below the ignition threshold for 150 d; at 1.6 m, ignition occurs after 25.2 d. In Semenov thermal-equilibrium theory, increasing thickness raises heat generation while heat-dissipation capacity remains approximately constant, allowing the system to pass from stable equilibrium to thermal runaway. This behaviour supports the limiting thickness of 0.60–0.85 m estimated in Section 3.4. Roadway pressure difference and caved-material particle size primarily affect the high-temperature-zone position through the seepage field. Across these cases, the maximum temperatures at 30 and 60 d remain 49.8 °C and 109.3 °C, respectively. Increasing pressure difference from 25 to 130 Pa moves the high-temperature point from 43 to 69 m, while increasing particle size from 0.02 to 0.05 m moves it from 41 to 69 m. The reported ignition times of 72.0–77.2 d indicate a comparatively small effect, reflecting competition between oxygen supply and convective cooling. Deeper high-temperature points encounter lower oxygen concentrations and slightly later ignition, compared with 71.0 d in the reference case. The reported values are 77.2 d at 130 Pa and 75.7 d at dp = 0.05 m; cases closer to the well-oxygenated part of the oxidation zone give 73.4 d at 25 Pa and 72.0 d at dp = 0.02 m.
4.6. Sensitivity and Uncertainty of the Reported Milestones
This section quantifies how the fitted high-temperature source terms and the effective oxygen reaction order affect the predicted times to reach characteristic temperatures.
4.6.1. High-Temperature Branch of the Kinetic Source Term
During thermal runaway, heat generation greatly exceeds heat loss, so the time spent within a temperature interval is approximately proportional to ∫dT/q(T). Integration of the fitted branches gives 0.0452 K·m3·W−1 over 110–200 °C and 0.00513 K·m3·W−1 over 200–285 °C. The interval above the experimental limit therefore accounts for, at most, 10.2% of the runaway duration. This is an upper bound because heat losses are proportionally greater at 110–200 °C, increasing the time spent in that lower interval. Scaling the high-temperature branch by 0.80 or 1.25 changes the predicted ignition time by +0.22 d or −0.18 d, respectively. Raising the ignition criterion from 285 to 350 °C adds 0.19 d. These changes remain below 0.3 d. The extrapolated source terms complete the energy equation over the 85 K interval from 200 °C to T3, where q increases from the measured 7.96 × 10³ W/m3 to 3.90 × 10⁴ W/m3 at 285 °C using Ea = 41.06 kJ/mol.
4.6.2. Uncertainty Budget of the Milestones
Table 6 summarises the quantified uncertainty contributions. With the adopted calibration of n = 0.10, the reference ignition time is t_ign,sim = 71 d, with a range of 69–88 d. The corresponding times are 46 d (44–56) for the critical temperature and 62 d (60–77) for the dry-cracking temperature. The effective oxygen reaction order contributes most strongly to these ranges and is the parameter to which the predicted times are most sensitive.
Table 6.
Uncertainty budget of the predicted milestones.
The predicted ignition time of 71 d is of the same order as spontaneous-combustion periods reported for comparable faces: field-derived estimates of 59 d and 63 d, and kilogram- and ton-scale adiabatic test results of 34–40 d. The shorter adiabatic periods are consistent with the suppression of heat losses that occur in a real goaf. Together with the checks in Section 4.3, these comparisons support the plausibility of the transient prediction.
5. Conclusions
(1) Coal from the 40202 face at Gaojialiang Coal Mine is classified as Class I, indicating a high tendency towards spontaneous combustion, with an oxygen adsorption capacity of 0.92 cm3/g. Its shortest measured incubation period is 40 d under near-adiabatic conditions. Four oxidation and combustion stages are identified: dehydration and desorption (room temperature—160 °C), oxidative mass gain (160–285 °C), combustion mass loss (285–685 °C) and burnout (>685 °C). Gas generation inflection points yield a critical temperature of 70 °C and a dry-cracking temperature of 110 °C. TG-DSC analysis gives an ignition temperature of 285 °C at the transition from oxidative mass gain to combustion mass loss, and an exothermic peak of 57.8 mW/mg at 406.7 °C.
(2) Oxygen consumption, CO/CO2 generation and heat release intensity follow piecewise Arrhenius relationships, with apparent activation energies increasing across successive temperature intervals. The apparent activation energy for oxygen consumption rises from 22.00 to 40.11 kJ/mol. The dry-cracking temperature of 110 °C marks the transition to accelerated oxidation. Heat release intensity increases from 78.04 W/m3 at 30 °C to 7958 W/m3 at 200 °C. The measured data satisfy the stoichiometric and oxygen-supply balance checks.
(3) The limiting oxygen concentration for sustained spontaneous combustion is 7–9%, and the limiting residual coal thickness is 0.60–0.85 m for an effective thermal conductivity of 0.2–0.4 W/(m·K). The average residual coal thickness of approximately 0.8 m in the oxidation zone approaches the upper end of this range, indicating a high spontaneous-combustion risk.
(4) Along the strike, temperature rises from the working face to a maximum within the oxidation zone and then declines towards the deep goaf. The temperature evolution comprises slow heat accumulation (0–40 d, reaching 60.9 °C), accelerated heating (40–62 d, reaching 110 °C on day 62), thermal runaway, and ignition (285 °C on day 71), followed by migration of the high-temperature zone towards the working face. Oxygen depletion narrows the oxidation zone and expands the suffocation zone into the deep goaf. The predicted times to reach the critical, dry-cracking and ignition temperatures are 46 d (44–56), 62 d (60–77) and 71 d (69–88), respectively.
(5) Residual coal thickness dominates ignition time: the 0.5 m layer remains below the ignition threshold for 150 d, while the 1.6 m layer ignites after 25.2 d. Roadway pressure difference and caved-material particle size mainly affect the high-temperature-zone position, which ranges from 41 to 69 m across the sensitivity cases. Their effect on ignition time is comparatively small, with reported values of 72.0–77.2 d. Controlling residual coal thickness in the oxidation zone and managing the pressure difference between roadways are therefore suggested as the main preventive measures for the 40202 face. Nitrogen injection and inhibitor application are recommended during the identified risk window of 40–65 d after mining.
Author Contributions
Conceptualization, J.C.; Formal analysis, B.S.; Investigation, B.S.; Writing—original draft, X.L.; Writing—review & editing, J.C., B.S., G.L., Y.L. and X.L.; Visualization, X.L. All authors have read and agreed to the published version of the manuscript.
Funding
This research received no external funding.
Institutional Review Board Statement
Not applicable.
Informed Consent Statement
Not applicable.
Data Availability Statement
The original contributions presented in this study are included in the article. Further inquiries can be directed to the corresponding author.
Conflicts of Interest
Authors Jianting Cui and Guangzhu Li were employed by Haohua Precision Coal Co., Ltd. The remaining authors declare that the research was conducted in the absence of any commercial or financial relationships that could be construed as a potential conflict of interest.
References
- Wang, D.M. Mine Fire Science; China University of Mining and Technology Press: Xuzhou, China, 2008. [Google Scholar]
- Zhou, A.; Yang, Y.; Wang, K.; He, Y.; Wang, S.; Yuan, Y.; Wang, Y. Air leakage migration and coal spontaneous combustion evolution in goaf: A coupled DEM-COMSOL modeling approach. Therm. Sci. Eng. Prog. 2025, 68, 104261. [Google Scholar] [CrossRef] [Scilit]
- Wu, X.; Si, G.; Zhang, J.; An, J.; Yu, Z.; Jing, Y.; Mostaghimi, P.; Ren, T. Upscaling coal self-heating reaction models from the laboratory to field applications. Int. J. Heat Mass. Transf. 2025, 245, 127002. [Google Scholar] [CrossRef] [Scilit]
- Zhang, P.Y.; Chen, X.K. Multi-physical field coupling model for thermal evolution analysis in coal mine goaf: A numerical investigation. Appl. Therm. Eng. 2025, 273, 126551. [Google Scholar] [CrossRef] [Scilit]
- Yan, H.; Nie, B.; Kong, F.; Liu, Y.; Liu, P.; Wang, Y.; Chen, Z.; Yin, F.; Gong, J.; Lin, S.; et al. Experimental investigation of coal particle size on the kinetic properties of coal oxidation and spontaneous combustion limit parameters. Energy 2023, 270, 126890. [Google Scholar] [CrossRef] [Scilit]
- Zang, L. Experimental study on the kinetic parameters and oxidation reaction stages of coal spontaneous combustion. China Min. Mag. 2023, 32, 165–172. [Google Scholar]
- He, S.; Zhou, N.; Zhan, S.B.; Zeng, X.F.; Ma, X.L. Study on the spontaneous combustion characteristics and ignition-period prediction of coals with different metamorphic degrees based on DSC. Mod. Min. 2026, 42, 194–200. [Google Scholar] [CrossRef]
- Zhang, D.; Tang, R.; Wang, Z.; Deng, J.; Zhang, X.H. Study on the thermal kinetics of coal spontaneous combustion of Hongqinghe coal based on thermogravimetric analysis. J. Xi’an Univ. Sci. Technol. 2020, 40, 974–980. [Google Scholar]
- Wen, H.; Lu, Y.B.; Liu, W.Y. Study on the influence of different oxygen concentrations on the spontaneous combustion characteristics of coal by thermogravimetry. Min. Saf. Environ. Prot. 2021, 48, 1–5+10. [Google Scholar]
- Lu, W.; Wang, D.M.; Zhong, X.X. Study on the variation law of the activation energy during coal spontaneous combustion. J. China Coal Soc. 2010, 35, 249–253. [Google Scholar]
- Li, Z.H. Free-radical reaction mechanism of coal spontaneous combustion. J. China Coal Soc. 2002, 27, 631–634. [Google Scholar]
- Shi, W.L. Study on the spontaneous combustion characteristics and critical values of marker gases of coal seams. Coal Process Compr. Util. 2025, 75–79. [Google Scholar]
- Zhao, X.G.; Yuan, H.B.; Li, H. Experimental analysis of the characteristic parameters of coal spontaneous combustion and study on the hierarchical early-warning system of spontaneous combustion indicators. Labour Prot. 2025, 84–86. [Google Scholar]
- Wang, Y.J. Study on the spontaneous combustion law and prevenstion technology of coal in Baiyanghe mining area under complex oxidation conditions. Shaanxi Coal 2026, 20–25. [Google Scholar]
- Xu, J.C.; Deng, J.; Wen, H. Theory of the hazardous-zone determination of coal spontaneous combustion. J. China Coal Soc. 2001, 26, 621–625. [Google Scholar]
- Feng, B.; Wang, B.S.; Jin, F.D.; Wang, R.; Yu, X.W.; Chen, G.L. Study and application of the limiting characteristic parameters of spontaneous combustion of the extra-thick steeply inclined coal seam of Chicheng Coal Mine. Coal Technol. 2025, 44, 163–169. [Google Scholar] [CrossRef]
- Wu, X.R. Study on the indicator gases and limiting parameters of the spontaneous combustion of coking coal in Huainan mining area. Shandong Coal Sci. Technol. 2024, 42, 77–81. [Google Scholar]
- Lei, C.K.; Jiang, L.J.; Bao, R.Y.; Deng, C.; Wang, C. Study on multifield migration and evolution law of the oxidation heating process of coal spontaneous combustion in dynamic goaf. ACS Omega 2023, 8, 14197–14207. [Google Scholar] [CrossRef] [Scilit] [PubMed]
- Sun, Y.M.; Xue, P.; Zhou, A.T.; Yang, Y.X.; Liu, M.Y. Distribution characteristics of the “three zones” of coal spontaneous combustion in goaf with complex residual coal and the prevention by three-dimensional low-temperature nitrogen injection. China Coal 2026. [Google Scholar]
- Chen, W.J.; Li, Z.W.; Guo, W.Z.; Luo, Z.Z.; Cao, R.P. Study on the evolution of the characteristic temperatures of coal spontaneous combustion in a coal seam goaf and the fire-extinguishing technology. Mod. Min. 2025, 41, 206–213. [Google Scholar]
- Lu, Q.S.; Wu, J.H.; Li, L.Y. Prevention and control technology of spontaneous combustion fire in the fully mechanized mining face of Gaojialiang Coal Mine. Coal Eng. 2020, 52, 89–93. [Google Scholar]
- GB/T 20104-2006; Method for Identifying the Tendency of Coal to Spontaneous Combustion by Chromatographic Oxygen Adsorption. Standards Press of China: Beijing, China, 2006.
- GB/T 482-2008; Sampling of Coal Seams. Standards Press of China: Beijing, China, 2008.
- GB/T 474-2008; Method for Preparation of Coal Samples. Standards Press of China: Beijing, China, 2008.
- GB/T 212-2008; Proximate Analysis of Coal. Standards Press of China: Beijing, China, 2008.
- GB/T 31391-2015; Ultimate Analysis of Coal. Standards Press of China: Beijing, China, 2015.
- Chen, L.; Zhao, J.; Lu, W.; Liang, Z.; Li, J.; Qi, X. Reaction pathways and functional group transformation in CO/CO2 generation from low-rank coal at low temperature oxidation. Case Stud. Therm. Eng. 2025, 74, 106773. [Google Scholar] [CrossRef] [Scilit]
- Li, J.; Li, D.; Tong, X.; Li, D.; Ye, C.; Chen, Y. Dynamic evolution patterns and mechanism of unstable oxygen-containing intermediates in coal spontaneous combustion. Case Stud. Therm. Eng. 2026, 81, 107937. [Google Scholar] [CrossRef] [Scilit]
- Wang, H.H.; Dlugogorski, B.Z.; Kennedy, E.M. Pathways for production of CO2 and CO in low-temperature oxidation of coal. Energy Fuels 2003, 17, 150–158. [Google Scholar] [CrossRef] [Scilit]

Disclaimer/Publisher’s Note: The statements, opinions and data contained in all publications are solely those of the individual author(s) and contributor(s) and not of MDPI and/or the editor(s). MDPI and/or the editor(s) disclaim responsibility for any injury to people or property resulting from any ideas, methods, instructions or products referred to in the content. |
© 2026 by the authors. Licensee MDPI, Basel, Switzerland. This article is an open access article distributed under the terms and conditions of the Creative Commons Attribution (CC BY) license.