


Abstract
This paper proposes a multi-objective distributed energy storage planning method that couples distribution-level electricity market simulation to improve the coordination between storage investment, market participation, and distribution network operation. The method incorporates technical–market-based candidate-bus screening, joint energy and frequency regulation market clearing with endogenous price formation, and life-cycle economic assessment. An improved NSGA-II algorithm is employed to obtain the Pareto-optimal solutions, while the Technique for Order Preference by Similarity to Ideal Solution (TOPSIS) is used to select a compromise solution among annualized life-cycle net cost, nodal voltage deviations, and network losses. The proposed method is evaluated on an extended IEEE 33-bus distribution system using 24-h typical-day load and renewable generation profiles. Compared with the baseline scenario, the selected storage configuration reduces average network losses from 0.20135 MW to 0.08235 MW and average nodal voltage deviations from 0.028 p.u. to 0.019 p.u., while increasing the renewable energy accommodation rate from 81.73% to 95.63%. The resulting storage investment achieves a life-cycle net present value of CNY 0.8745 million with a simple payback period of 7.33 years. In addition, compared with the PSO-based energy storage planning method, the method proposed in this paper achieves greater economic benefits while effectively improving the system operating state. These results demonstrate the effectiveness of integrating electricity market simulation and life-cycle economic evaluation into distributed energy storage planning.
1. Introduction
As carbon-reduction targets and the development of new power systems continue to advance, the penetration of distributed renewable energy resources, particularly wind and photovoltaic (PV) generation, is steadily increasing in distribution networks [1,2]. Consequently, distribution systems are evolving from conventional unidirectional power supply toward bidirectional operation involving coordinated interactions among generation, networks, loads, and storage [3,4,5]. The stochastic, variable, and intermittent nature of distributed renewable generation alters power-flow patterns and may lead to local voltage deviations, reverse power flows, and increased network losses [6,7,8]. Furthermore, high dependence on weather-driven renewable generation may affect power system supply adequacy, particularly when renewable output and electricity demand are influenced by correlated atmospheric variables. Reference [9] investigated this issue using Monte Carlo and bootstrap approaches, highlighting the importance of accounting for atmospheric correlations in adequacy assessments. Moreover, temporal mismatches between renewable generation and electricity demand exacerbate peak-to-valley load variations and localized supply–demand imbalances, creating challenges for conventional network expansion and traditional regulating resources [1,10]. Against this background, exploiting the energy-shifting capability, rapid power regulation, and flexible response of energy storage to improve voltage profiles, reduce losses, and increase renewable energy accommodation has become a major research direction in modern distribution system planning and operation. Reference [11] proposed a multi-objective optimal operation method for distributed energy storage that comprehensively considers voltage regulation, network loss reduction, and peak-shaving demand, thereby validating the effectiveness of energy storage in enhancing the load and distributed generation hosting capacity of distribution networks. Reference [12] achieved coordinated improvement of nodal voltage deviation, line losses, and line loading levels by optimizing the installation locations and capacities of distributed energy storage. Reference [13] established a two-stage optimal configuration model for photovoltaic and battery energy storage, with the objectives of reducing system losses, operating costs, and voltage deviations, thereby validating the technical advantages of coordinated planning of energy storage and renewable energy. Reference [14] further constructed a hierarchical optimal configuration model for energy storage oriented toward multiple service demands, taking into account both voltage regulation and full life-cycle economics, thus providing a reference for multi-objective energy storage planning.
Appropriate siting and sizing of distributed energy storage are essential to realizing its system-level value. Existing studies have examined storage allocation primarily in terms of distribution network security, power losses, renewable energy accommodation, and investment economics. In [15], an optimal allocation method for distributed storage in active distribution networks was developed by jointly considering network operating constraints and storage investment costs. Reference [16] incorporated network reconfiguration and uncertainty into the storage planning problem to coordinate capacity allocation and network operation. To address voltage fluctuations caused by high PV penetration, Reference [17] employed a bi-level optimization method to determine storage locations and capacities and verified its effectiveness in improving nodal voltage characteristics. Other studies have investigated the effects of storage technologies, operational strategies, and network topology on losses and renewable energy accommodation [18,19,20]. Although these contributions provide a sound technical foundation for distributed storage planning, most evaluate storage value from the physical-operation perspective. Storage is frequently treated as a passive distribution network flexibility resource, and its economics are estimated using fixed time-of-use tariffs or predefined operating costs, without adequately representing the dynamic formation of storage value in electricity markets.
As electricity markets evolve, storage is transitioning from a resource used primarily for peak shaving and valley filling into an active market participant capable of energy arbitrage, frequency regulation, reserve provision, peak regulation, and network support [21,22,23]. Owing to its fast response characteristics, storage can provide frequency-regulation ancillary services while simultaneously participating in energy and ancillary service markets to stack revenue streams. With continuing improvements in ancillary service market mechanisms, the economic value of frequency regulation has received increasing attention. Relevant studies indicate that frequency-regulation services can constitute an important source of storage revenue and that participation in multiple markets can further improve asset utilization and investment returns [23,24,25,26]. For example, Reference [26] jointly evaluated storage revenues from energy, regulation, and capacity markets, showing that participation across markets can substantially increase revenue while revealing capacity-allocation trade-offs and opportunity costs among market products. More recent investigations have examined value stacking and the effects of market rules on storage revenues, suggesting that storage planning cannot be assessed independently of market operating mechanisms [27,28].
Nevertheless, an important disconnect persists between storage planning and electricity market clearing. On the one hand, conventional storage siting and sizing models generally estimate revenues using peak–off-peak electricity tariffs, historical average prices, or assumed ancillary service prices. Because market prices are specified exogenously, such formulations cannot capture the feedback of storage location, installed capacity, and operation on market supply–demand conditions and price formation. On the other hand, many market-oriented storage studies focus on operating or bidding strategies without feeding endogenous market revenues back into long-term investment decisions. Consequently, planning, market clearing, and operation remain weakly linked in a unified mathematical framework. Existing evidence indicates that storage value depends not only on energy price spreads but also on network location, ancillary service market design, and coordinated participation in multiple markets [26,29].
Based on the above literature review, three major research gaps can be identified. First, existing storage siting methods primarily focus on network-oriented technical indicators, such as voltage deviations and power losses, while the market value of different installation locations is often insufficiently considered during candidate-bus selection. To address this limitation, this study develops a comprehensive screening method integrating voltage sensitivity, network-loss sensitivity, market-value sensitivity, and renewable energy proximity, together with an electrical-distance constraint. Second, conventional storage planning models commonly estimate economic benefits using predefined electricity tariffs or ancillary service prices, making it difficult to capture the interactions among storage location, installed capacity, network operating conditions, and market price formation. To overcome this limitation, a network-constrained joint energy and frequency regulation market-clearing model is established to endogenously determine electricity prices, regulation capacity prices, and regulation mileage prices. Third, the coordination of market revenues, life-cycle economic performance, and distribution network operating objectives remains insufficiently addressed in existing planning frameworks. Accordingly, this study incorporates the revenues derived from joint market clearing into a life-cycle economic assessment and develops a multi-objective planning model that simultaneously minimizes annualized net cost, nodal voltage deviations, and network losses. The resulting model is solved using an improved NSGA-II algorithm, and TOPSIS is employed to identify a preferred compromise solution. Through these methodological components, the proposed framework establishes an integrated relationship among storage siting and sizing, electricity market simulation, and long-term economic and technical performance.
The main contributions of this study are summarized as follows:
- (1)
- An integrated technical–market screening method is proposed for candidate storage buses. By combining technical and market value indicators with an electrical-distance constraint, the method evaluates the potential benefits of storage interconnection and promotes spatially dispersed installations, extending conventional network-oriented siting assessment to a coordinated technical–market framework.
- (2)
- A network-constrained energy–frequency-regulation co-clearing model is developed to represent competition for storage power capacity across market products and location-dependent network value. The clearing process incorporates distribution power flows, voltage limits, and line capacity constraints, derives distribution locational marginal prices (DLMPs) from nodal marginal costs, and jointly determines regulation capacity and mileage prices. Accordingly, storage location, market operating conditions, and stacked revenues are endogenously linked.
- (3)
- A multi-objective distributed energy storage planning framework integrating life-cycle economic assessment and market revenues is established to minimize annualized net cost, nodal voltage deviations, and network losses. The model is solved using an improved NSGA-II algorithm, and TOPSIS is employed to identify a preferred compromise among the three objectives. The effectiveness of the framework is evaluated using an extended IEEE 33-bus distribution system.
The remainder of this paper is organized as follows. Section 2 introduces the comprehensive screening method for candidate storage buses. Section 3 formulates the energy and frequency-regulation co-clearing model and describes endogenous price formation and revenue transfer. Section 4 develops the life-cycle economic model. Section 5 presents the multi-objective siting and sizing formulation. Section 6 describes the improved NSGA-II algorithm and TOPSIS-based decision procedure. Section 7 reports case studies on an extended IEEE 33-bus distribution system, and Section 8 concludes the paper and identifies future research directions.
2. Comprehensive Screening of Candidate Buses for Distributed Energy Storage
For clarity and dimensional consistency, the units of the physical quantities used in the mathematical formulations are specified as follows. Active power, reactive power, and network power losses are expressed in MW, MVar, and MW, respectively, while energy and energy storage capacity are expressed in MWh. Voltage magnitudes are expressed in per-unit (p.u.) values, unless otherwise specified. Electricity prices are expressed in CNY/MWh, and economic costs and revenues are expressed in CNY. Frequency regulation capacity and regulation mileage are expressed in MW. In the calculation of each sensitivity indicator, electrical physical quantities such as voltage, power, and network losses are expressed in per-unit values, while economic physical quantities such as electricity prices and market revenues retain their conventional units of measurement.
The optimal siting and sizing of distributed energy storage systems (DESSs) are fundamental tasks in distribution network planning. These tasks involve determining the installation locations, rated power, and rated energy capacities of storage systems to optimize technical performance and economic benefits while satisfying distribution network security constraints.
Candidate-bus screening is the first step in storage siting and sizing, aiming to identify buses with high technical and economic potential. This process reduces the search space of the optimization model, improves computational efficiency, and enhances convergence performance. In this study, a multidimensional sensitivity analysis method is adopted to evaluate voltage sensitivity, network-loss sensitivity, market-value sensitivity, and renewable energy proximity at each bus. These indicators are integrated into a composite sensitivity index, and an electrical-distance constraint is subsequently introduced to determine the candidate buses.
Voltage sensitivity quantifies the impact of a unit change in active power injection at a bus on its voltage magnitude, thereby reflecting the potential of storage installed at that bus to regulate the distribution network voltage profile. A higher voltage sensitivity indicates a greater potential for voltage regulation through energy storage integration. The voltage sensitivity is calculated as
where SV,i denotes the voltage sensitivity of bus i; ΔUi represents the voltage variation caused by a change in active power injection at bus i; and ΔPinj,i is the corresponding change in active power injection.
Network-loss sensitivity quantifies the impact of a unit change in active power injection at a bus on the total network losses, thereby indicating the potential of energy storage installed at that location to reduce distribution network losses. A higher network-loss sensitivity indicates a greater potential for loss reduction. The network-loss sensitivity is expressed as
where Sloss,i denotes the network-loss sensitivity of bus i, and ΔPloss represents the variation in total network losses caused by the change in active power injection at bus i.
Market-value sensitivity evaluates the potential economic benefits of energy storage integration at a given bus, which are closely associated with energy arbitrage opportunities and frequency regulation ancillary service prices. A higher market-value sensitivity indicates greater potential economic benefits from storage deployment. To avoid circular dependence between candidate-bus screening and subsequent storage planning, market clearing is first performed under a baseline scenario without energy storage. The resulting typical-day nodal electricity price profiles are then used to evaluate the market arbitrage potential at different buses. The market-value sensitivity of bus i is defined as
where
In these equations, Smarket,i denotes the market-value sensitivity of bus i; represents the electricity price spread at bus i over a typical day, characterizing the potential for energy arbitrage through intertemporal energy shifting; and denotes the electricity price at bus i during period t. Furthermore, represents the average frequency regulation value available to energy storage at bus i, and T is the total number of frequency regulation periods. The parameters and denote the regulation capacity price and regulation mileage price during period t, respectively, while is the regulation mileage factor of the storage system. represents the renewable energy accommodation value indicator at bus i, which can be determined by considering surplus renewable generation and local curtailment risks. The weighting coefficients wE, wFR, and wRE correspond to energy market value, frequency regulation ancillary service value, and renewable energy accommodation value, respectively.
Renewable energy proximity measures the electrical distance between a candidate bus and distributed renewable energy generation buses, reflecting the potential contribution of energy storage at that location to renewable energy accommodation. A shorter electrical distance to renewable generation buses generally indicates greater potential for improving renewable energy utilization. The renewable energy proximity indicator is calculated as
where Sdg,i denotes the renewable energy proximity indicator of bus i; Ωdg represents the set of distributed renewable generation buses; and delec(i,j) is the electrical distance between buses i and j, determined by the shortest electrical path in the distribution network topology.
Based on the four indicators described above, a composite bus sensitivity index is constructed as
where Stotal,i denotes the composite sensitivity index of bus i; , , , and represent the normalized voltage sensitivity, network-loss sensitivity, market-value sensitivity, and renewable energy proximity indicators, respectively. The weighting coefficients wV, wloss, wmarket, and wdg correspond to these four indicators and can be adjusted according to the distribution network planning objectives.
To prevent excessive concentration of storage installations, promote distributed deployment, and enhance network-wide regulation capability, a minimum electrical-distance constraint is introduced. Specifically, the electrical distance between any two selected candidate buses must satisfy
where dmin denotes the minimum allowable electrical distance.
The composite sensitivity index of each bus is calculated using (5), and all buses are ranked in descending order of their index values. Candidate buses are then selected sequentially according to this ranking. A bus is added to the candidate set only if its electrical distance from all previously selected buses satisfies the minimum electrical-distance constraint in (6). Otherwise, the bus is excluded, and the next bus in the ranking is evaluated. This procedure continues until the predefined number of candidate buses is reached.
The proposed screening method combines physical interpretability with computational efficiency. The composite sensitivity index prioritizes buses with high technical and market value, while the electrical-distance constraint promotes spatially dispersed storage deployment. Consequently, the selected candidate buses can support coordinated regulation across different feeders and operating scenarios, thereby enhancing the overall operational flexibility of the distribution network.
3. Market Clearing and Endogenous Price Formation Model
For clarity and conciseness, this section presents the main formulation of the joint energy and frequency regulation market clearing model, focusing on the objective function, essential operating constraints, and endogenous price formation mechanism. Detailed expressions of conventional unit constraints, storage operating constraints, and intermediate mathematical derivations are provided in Appendix A.
3.1. Joint Clearing Model for the Energy and Frequency Regulation Ancillary Service Markets
Under the joint clearing mechanism of the energy and frequency regulation ancillary service markets, the market operator considers the bids and offers submitted by conventional generating units, renewable energy generators, energy storage systems, and loads. Subject to system power balance, frequency regulation requirements, and available resource capacity constraints, the cleared energy dispatch, regulation capacity, and regulation mileage of each market participant are jointly determined. Compared with sequential clearing, joint clearing coordinates energy and frequency regulation transactions within a unified optimization framework, thereby preventing the same rated power capacity of energy storage systems from being simultaneously allocated to multiple markets.
Let g, r, and i denote conventional generating units, renewable energy generators, and DESSs, respectively, with loads also participating in the market. The decision variables of the joint clearing model include the power output of conventional generating units Pg,t, renewable energy curtailment , energy storage charging and discharging powers and , cleared regulation capacities of energy storage systems and conventional generating units , and cleared regulation mileages of energy storage systems and conventional generating units at time t. With the objective of minimizing the total procurement cost of energy and frequency regulation ancillary services, the objective function of the joint clearing model is formulated as
where FJ denotes the total joint clearing cost; T is the number of operating periods; Cg(Pg,t) represents the generation cost function or piecewise bidding function of conventional generating unit g at time t; and is the penalty coefficient for renewable energy curtailment. The parameters and denote the discharging and charging bid prices submitted by energy storage unit i, respectively; and represent its regulation capacity and regulation mileage bid prices; and and denote the corresponding regulation capacity and mileage bid prices submitted by conventional generating unit g.
The joint clearing model explicitly incorporates nodal power balance and distribution network operating constraints. Unlike conventional market clearing models based on aggregate system power balance, the proposed model embeds nodal power balance constraints into the joint clearing process. This enables the coordinated determination of nodal loads, distributed renewable generation, energy storage charging and discharging, and branch power flows within a unified optimization framework, thereby capturing the impacts of storage locations and network operating conditions on market clearing outcomes.
For any bus j at time t, the nodal active power balance constraint is expressed as
The nodal reactive power balance constraint is given by
The branch voltage drop equation is formulated as
The relationship between branch power flow and current is expressed as
where Ωin(j) and Ωout(j) denote the sets of branches terminating at and originating from bus j, respectively; L is the set of distribution network branches; Pij,t and Qij,t represent the active and reactive power flows from bus i to bus j at time t, respectively; and Iij,t denotes the current flowing from bus i to bus j at time t. The parameters Rij and Xij are the resistance and reactance of branch ij, respectively. The variables , , , , and denote the active and reactive power outputs of conventional generators, the active power output of distributed renewable generation, and the discharging and charging powers of energy storage at bus j, respectively. Furthermore, and represent the active and reactive power demands at bus j, while Uj,t denotes its voltage magnitude.
When energy storage systems simultaneously participate in the energy and frequency regulation ancillary service markets, a coupling relationship exists between energy trading power and reserved regulation capacity. Specifically, the total power allocated to charging, discharging, and frequency regulation capacity reservation must not exceed the rated power of the storage system. This operational requirement is expressed as
where denotes the rated power of energy storage unit i, and κi is the regulation capacity availability coefficient, which characterizes the proportion of rated storage power occupied by reserved regulation capacity. Constraint (12) is a key feature distinguishing the proposed joint clearing model from an energy-only market clearing model, as it prevents the same rated storage power from being simultaneously committed to energy transactions and frequency regulation services.
The clearing of frequency regulation ancillary services must satisfy both the system-wide regulation capacity requirement and the regulation mileage requirement:
where and denote the system regulation capacity requirement and regulation mileage requirement at time t, respectively.
3.2. Market-Clearing Price Formation Mechanism
Under a marginal pricing mechanism, the DLMP at bus i and time t can be expressed as the marginal change in the optimal joint clearing cost with respect to the load demand at that bus:
where FJ,∗ denotes the optimal objective function value of the joint clearing model, and represents the distribution locational marginal price at bus i and time t. The DLMP reflects not only the electricity supply cost of the upstream grid or marginal generating unit but also the effects of marginal network losses, line congestion, and voltage constraints through the shadow prices associated with network constraints. Consequently, when energy storage systems are installed at different buses, their charging and discharging operations may alter local power flows and network constraint conditions, thereby affecting nodal marginal prices and their corresponding market revenues.
It should be noted that, since the market-clearing problem is formulated as a mixed-integer linear programming (MILP) model, the dual variables cannot be directly obtained from the original MILP solution in the conventional manner. Therefore, a two-stage solution procedure is adopted to determine the DLMPs. First, the original MILP model is solved to obtain the optimal integer decisions, including the unit commitment and energy storage charging/discharging states. Subsequently, these integer decisions are fixed at their optimal values, and the resulting continuous linear programming (LP) model is re-solved. The dual variables associated with the nodal active power balance constraints are then extracted from the LP pricing problem to calculate the DLMPs. This procedure provides conditional marginal prices under the optimal integer decisions obtained from the original market-clearing model.
Frequency regulation ancillary service prices can be determined from the marginal costs associated with the regulation capacity and regulation mileage requirement constraints. Alternatively, depending on specific market rules, prices may be determined using uniform clearing pricing, the highest accepted bid price, pay-as-bid pricing, or weighted pricing mechanisms. Under marginal pricing, the regulation capacity and regulation mileage prices are expressed as
where and denote the regulation capacity price and regulation mileage price during period t, respectively. Since the available power capacities of energy storage systems and conventional generating units must be allocated between energy transactions and frequency regulation services, energy and regulation prices are not entirely independent. When regulation resources become scarce, regulation capacity prices increase, potentially encouraging energy storage systems to reserve more capacity for frequency regulation. Conversely, when energy price spreads widen, storage systems may allocate more capacity to charging and discharging for energy arbitrage. The joint clearing mechanism captures these opportunity-cost relationships among different market products through a unified marginal pricing framework.
3.3. Transfer of Market-Clearing Results to Energy Storage Revenues
Based on the final electricity market clearing results, the revenues obtained by energy storage systems from different markets can be calculated using the cleared energy dispatch, awarded regulation reserve capacity, regulation mileage, and corresponding market-clearing prices. Let s denote a typical operating day or operating scenario. The energy market revenue of energy storage unit i under scenario s is expressed as
where denotes the energy market revenue of storage unit i under scenario s; represents the distribution locational marginal price; and and denote the cleared discharging and charging powers of energy storage, respectively. In this formulation, discharging generates electricity sales revenue, whereas charging incurs electricity purchasing costs.
The frequency regulation ancillary service revenue of energy storage unit i under scenario s is calculated as
where denotes the frequency regulation ancillary service revenue of energy storage unit i under scenario s; and represent the regulation capacity price and regulation mileage price, respectively; and and denote the cleared regulation capacity and regulation mileage of the energy storage system, respectively.
Accordingly, the proposed joint market-clearing model establishes an explicit relationship among energy storage charging and discharging operations, frequency regulation capacity reservation, and endogenous market price formation, thereby providing a consistent basis for annual revenue estimation and life-cycle economic assessment. Compared with conventional revenue estimation methods based solely on peak–off-peak electricity price differences, the proposed approach enables a more comprehensive evaluation of energy storage revenues and provides a unified framework for analyzing capacity allocation and opportunity costs associated with participation in multiple electricity markets.
4. Life-Cycle Economic Model of Distributed Energy Storage Considering Market Revenues
The life-cycle economic performance of DESSs is jointly determined by initial investment costs, O&M costs, degradation costs, residual value recovery, and market revenues. The proposed life-cycle economic model serves as a key component of the economic objective in energy storage planning, enabling a comprehensive evaluation of alternative storage configurations while accounting for market revenues. The net present value (NPV) is adopted as the primary indicator for evaluating the life-cycle economic performance of DESSs. It represents the present value of the net cash flows generated over the entire project lifetime, discounted to the initial investment year, and is calculated as
where Cinv denotes the initial investment cost of the energy storage system; Y is the project lifetime in years; r represents the discount rate; Ry denotes the total market revenue in year y; Com,y and Cdeg,y represent the O&M cost and degradation cost in year y, respectively; and Vsal is the residual value of the energy storage system at the end of its service life.
The initial investment cost of the energy storage system is calculated as
where Prated and cp denote the rated power of the energy storage system and the unit power investment cost, respectively; Erated and cE represent the rated energy capacity and the unit energy capacity investment cost, respectively.
The O&M costs of energy storage systems mainly include equipment inspection, system maintenance, and routine operating expenses. In this study, the baseline annual O&M cost is estimated as a fixed proportion of the initial investment cost, while the annual escalation of operating expenses is also considered. Accordingly, the O&M cost in year y is expressed as
where kom denotes the annual O&M cost rate, and kcost,esc represents the annual cost escalation rate.
The annual degradation cost of energy storage systems is directly related to their annual charging and discharging energy throughput, reflecting the economic cost associated with battery capacity degradation caused by repeated cycling. The degradation cost is calculated as
where Ethroughput,y denotes the charging and discharging energy throughput of the energy storage system in year y, and cdeg represents the degradation cost per unit of energy throughput.
The degradation cost model in this study is based on energy throughput, which provides a computationally tractable approximation of battery aging. However, battery degradation is also affected by operating conditions, particularly the depth of discharge (DoD) and the charging/discharging C-rate. These factors are not explicitly represented in the current model. Consequently, the degradation cost may not fully capture the lifetime differences between operating cycles with different DoD and C-rate levels, even when their energy throughputs are similar.
At the end of the evaluation period, energy storage equipment may retain a certain residual asset value or recoverable value. In this study, the residual value is estimated using a fixed salvage-value ratio, expressed as a proportion of the initial investment cost:
where ksal denotes the salvage-value ratio of the energy storage system at the end of its service life.
The annual market revenue of the energy storage system consists of revenues from the energy market and frequency regulation ancillary service market, expressed as
where and denote the annual revenues obtained from the energy market and frequency regulation ancillary service market, respectively. Both revenue components are determined based on the joint market-clearing results.
5. Planning Objective Functions and Constraints
5.1. Objective Functions
The proposed energy storage planning model takes storage siting, sizing, and operating strategies as the primary decision variables while accounting for multiple factors, including investment costs, O&M expenses, degradation costs, market revenues, voltage deviations, and network losses. Accordingly, a multi-objective optimization model is developed. By adjusting storage locations, rated power, energy capacities, and power flow distributions, the planning decisions further affect nodal electricity prices, frequency regulation market-clearing outcomes, and net storage revenues. To ensure dimensional consistency among different cost and revenue components, investment, O&M, and degradation costs are converted into equivalent annual values. The objective functions are formulated as follows.
5.1.1. Minimization of Annualized Life-Cycle Net Cost
5.1.2. Minimization of Nodal Voltage Deviations
5.1.3. Minimization of System Network Losses
Accordingly, the multi-objective planning model is formulated as
5.2. Constraints
The constraints of the proposed planning model are classified into planning constraints and market-clearing and operational constraints. Since the market-clearing and operational constraints have been described in the preceding sections, only the planning constraints are presented here.
5.2.1. Energy Storage Power and Capacity Constraints
The rated power and energy capacity of each energy storage system must remain within predefined lower and upper limits. In addition, the storage duration must satisfy the specified duration requirements, as expressed in (29)–(31).
where Pmin and Pmax denote the minimum and maximum rated power capacities of an individual energy storage system, respectively; Emin and Emax represent the corresponding lower and upper limits of the rated energy capacity; Tmin and Tmax denote the minimum and maximum allowable storage durations, respectively; and Ωess is the set of buses selected for energy storage installation.
5.2.2. Constraint on the Number of Energy Storage Installations
The total number of energy storage installations must remain within predefined limits to ensure an appropriate distributed deployment of storage resources, as expressed in (32).
where Ness,min and Ness,max denote the minimum and maximum allowable numbers of energy storage installations, respectively.
5.2.3. Investment Budget Constraint
The total initial investment cost of the energy storage systems must not exceed the predefined investment budget, as expressed in (33).
where Cinv,max denotes the maximum allowable total investment budget.
6. Solution Method for the Planning Model
The proposed distributed energy storage planning model involves multiple decision variables, including storage siting, sizing, and market operation strategies. Specifically, storage installation locations are discrete decision variables, whereas rated power and energy capacities are continuous decision variables. Furthermore, the model is subject to various constraints, including power flow equations, SOC limits, voltage limits, line capacity limits, and market trading rules. Therefore, the proposed model is formulated as a mixed-integer nonlinear multi-objective optimization problem (MINMOP).
Due to the nonconvexity of the objective functions, high dimensionality of the decision variables, complex constraint relationships, and unknown distribution of the Pareto-optimal solution set, obtaining globally optimal solutions using conventional mathematical programming methods is computationally challenging. In contrast, evolutionary multi-objective optimization algorithms do not require convexification of the objective functions and can generate a representative set of Pareto-optimal solutions [30]. These algorithms have been widely applied to power system planning problems [31]. Compared with other multi-objective optimization algorithms, such as multi-objective particle swarm optimization (MOPSO) and multi-objective evolutionary algorithms based on decomposition (MOEA/D), NSGA-II offers advantages in efficient non-dominated sorting, elitist preservation, and solution diversity [30,31,32]. Therefore, an improved NSGA-II algorithm is adopted to solve the proposed planning model, and the technique for order preference by similarity to an ideal solution (TOPSIS) is subsequently employed to identify the preferred compromise solution from the Pareto-optimal solution set.
6.1. Decision Variable Encoding and Constraint Handling
The proposed planning model is a typical mixed-integer optimization problem involving different types of decision variables that cannot be adequately represented using a single encoding scheme. Therefore, a hybrid encoding strategy is adopted to construct the chromosome structure, in which different planning variables are incorporated into a unified genetic representation. This strategy preserves the physical meanings of decision variables during genetic operations while improving search efficiency.
Assuming that the distribution network contains N candidate buses for energy storage installation, the k-th individual is represented as
where L = [l1,l2,⋯,lN] denotes the storage siting variables; P = [P1,P2,⋯,PN] represents the rated power variables; and E = [E1,E2,⋯,EN] denotes the rated energy capacity variables.
These variables characterize the installation locations and capacities of energy storage systems, which jointly determine the technical and economic performance of the planning solution. Specifically, binary encoding is adopted for the storage siting variables, defined as
Binary encoding explicitly represents whether an energy storage system is installed at a given bus and facilitates crossover and mutation operations while preventing non-integer solutions during genetic evolution. The rated power variables Pi and energy capacity variables Ei are encoded as real numbers, with their values restricted by the corresponding equipment capacity limits. Real-valued encoding avoids the quantization errors associated with conventional binary encoding, improves sizing accuracy, and better represents the continuously adjustable characteristics of energy storage systems.
Since NSGA-II is primarily designed for unconstrained multi-objective optimization, whereas the proposed planning model incorporates various engineering constraints, including power flow balance, voltage security, line transfer capacity, storage SOC limits, and installation capacity requirements, these constraints must be incorporated into the fitness evaluation process to ensure that the resulting planning solutions satisfy distribution network operating requirements.
In this study, a dynamic penalty function method is employed for constraint handling. This method imposes additional penalties on individuals that violate constraints, thereby reducing their fitness and decreasing their probability of being selected for subsequent generations. Compared with directly discarding infeasible solutions, the penalty function method retains potentially promising individuals near the boundaries of the feasible region, which can improve search efficiency and global exploration capability.
Let F denote the original objective function value. The penalized fitness function is defined as
where denotes the penalized fitness value; F represents the original objective function value; λ is the penalty coefficient determining the severity of penalties imposed on constraint violations; and P denotes the aggregate penalty function used to quantify the overall degree of constraint violation. Its specific composition is presented in Appendix B.
Individuals violating the constraints receive increased penalized objective values and are therefore progressively eliminated during the evolutionary process. This mechanism promotes the generation of a Pareto-optimal solution set that satisfies the operational security constraints of the distribution network.
6.2. Design of the Improved NSGA-II Algorithm
Although the conventional NSGA-II algorithm exhibits satisfactory global search capability, increasing the dimensionality of planning variables may lead to reduced population diversity, premature convergence to local optima, and slow convergence [31,33]. To address these limitations, three improvements are introduced in this study, focusing on population initialization, adaptive crossover and mutation strategies, and elitist preservation. The specific formulas of the improved NSGA-II algorithm are provided in Appendix B.
First, Latin hypercube sampling (LHS) is employed to initialize the population and improve the coverage of the initial search space. Compared with conventional random initialization, LHS generates individuals that are more uniformly distributed throughout the search space, thereby improving search efficiency during the early evolutionary stages.
Second, adaptive crossover and mutation probabilities are introduced to balance global exploration and local exploitation. As the number of iterations increases, the crossover probability is gradually decreased, while the mutation probability is increased.
Furthermore, to improve the quality of the Pareto front, a local perturbation search strategy is applied to elite individuals identified through non-dominated sorting in each generation.
During each generation of NSGA-II evolution, individuals are first ranked through fast non-dominated sorting, after which the crowding distance is calculated to guide elitist preservation. Selection, crossover, and mutation operations are subsequently performed to progressively approximate the true Pareto front.
For the proposed planning model, a three-level nested solution framework integrating planning, market clearing, and operation is developed. The main computational procedure is summarized as follows:
- (1)
- Initialize the energy storage planning population based on the screened candidate buses.
- (2)
- Determine the installation locations, rated power, and rated energy capacities of energy storage systems according to the chromosome encoding of each individual.
- (3)
- Integrate each storage planning solution into the distribution network model and solve the joint energy and frequency regulation ancillary service market-clearing model to obtain storage charging and discharging schedules, cleared frequency regulation quantities, network power flow conditions, and market-clearing results.
- (4)
- Derive the DLMPs, regulation capacity prices, and regulation mileage prices from the marginal values associated with the nodal active power balance constraints and frequency regulation requirement constraints.
- (5)
- Calculate the annual market revenues of energy storage systems based on the cleared energy quantities, frequency regulation service quantities, and corresponding market prices, and subsequently determine the annualized life-cycle net cost.
- (6)
- Calculate nodal voltage deviations and system network losses using the bus voltages and branch power flows obtained from the same joint market-clearing solution.
- (7)
- Evaluate the annualized life-cycle net cost F1, nodal voltage deviations F2, and system network losses F3, and adjust the fitness values using the penalty functions.
- (8)
- Perform fast non-dominated sorting and crowding-distance ranking, followed by selection, crossover, mutation, and elitist preservation operations.
- (9)
- Check whether the maximum number of iterations has been reached. If the termination criterion is satisfied, output the Pareto-optimal solution set; otherwise, return to Step (2) and continue the iterative optimization process.
6.3. Selection of the Best Compromise Solution Using TOPSIS
The Pareto-optimal solution set obtained using the improved NSGA-II algorithm contains multiple non-dominated solutions, each representing a different trade-off among the optimization objectives. Therefore, a multi-criteria decision-making method is required to identify the preferred compromise solution. In this study, TOPSIS is employed to evaluate and rank the Pareto-optimal solutions. The fundamental principle of TOPSIS is to identify the solution that is simultaneously closest to the positive ideal solution and farthest from the negative ideal solution [34]. The detailed procedure is described in Appendix B.
The overall planning and optimization procedure is illustrated in Figure 1.
Figure 1.
Flowchart of distributed energy storage planning based on the improved NSGA-II algorithm.
7. Case Study
7.1. Description of the Test System
Case studies are conducted on an extended IEEE 33-bus distribution network, whose topology is illustrated in Figure 2. The system has a base voltage of 12.66 kV and a base power of 10 MVA, with the upper and lower bus voltage limits set to 1.07 p.u. and 0.93 p.u., respectively. Wind power generators are connected at buses 5 and 13, while PV systems are installed at buses 21 and 28. Time-series simulations are performed using 24-h load and renewable generation profiles for a typical operating day, as shown in Figure 3.
Figure 2.
Topology of the extended IEEE 33-bus distribution network.
Figure 3.
24-h load and renewable energy generation profiles.
Lithium-ion batteries are adopted as the energy storage technology, and their main technical and economic parameters are summarized in Table 1.
Table 1.
Technical and economic parameters of the energy storage systems.
To simulate the electricity market environment, the upstream grid connected to the slack bus is represented by an equivalent conventional generating unit, G1. Its main market-related parameters are presented in Table 2.
Table 2.
Market parameters of the equivalent conventional generating unit representing the upstream grid.
All simulations and algorithm implementations are conducted on a workstation equipped with an AMD Ryzen 7 8845H CPU and 32 GB of RAM in the MATLAB 2024a.
7.2. Candidate-Bus Screening Results
In this paper, the analytic hierarchy process (AHP) is employed to determine the subjective weights of different sensitivity indicators. First, a judgment matrix is constructed, and a four-level scale is used to judge the relative importance of each indicator. When simulating the decision-maker’s consideration of the importance of each indicator for a node, the network loss sensitivity and market value are regarded as equally important, while the voltage sensitivity indicator is considered the most important. Accordingly, the comparison matrix is formed as shown in Table 3. A consistency check is then performed, yielding a consistency ratio CR = 0.0038 < 0.1. The eigenvector corresponding to the maximum eigenvalue is normalized to obtain the weights, giving the weights of the voltage sensitivity, network loss sensitivity, market value, and renewable energy proximity indicators as 0.424, 0.227, 0.227, and 0.122, respectively. The comprehensive sensitivity indicator values of the nodes are then calculated according to Equation (5), as shown in Figure 4.
Table 3.
Comparison matrix.
Figure 4.
Composite sensitivity indices of distribution network buses.
As shown in Figure 4, the five buses with the highest composite sensitivity indices are ranked in descending order as 5, 14, 31, 28, and 21. These five buses are therefore selected as candidate locations for distributed energy storage installation.
To evaluate the robustness of the candidate-bus selection results against variations in weighting coefficients, a weight sensitivity analysis was conducted. Specifically, each weighting coefficient was independently increased and decreased by 20%, while additional scenarios were generated by simultaneously perturbing all four coefficients. The perturbed weights were normalized to ensure that their sum remained equal to one. A total of 25 scenarios, including the baseline case, were considered.
The results show that the five selected candidate buses (buses 5, 14, 31, 28, and 21) remained unchanged across all 25 scenarios. The Jaccard similarity coefficient between each perturbed candidate set and the baseline set was consistently 1.000. Although buses 28 and 31 exchanged their relative ranking in one combined perturbation scenario, the overall candidate-bus set was unaffected. These results demonstrate that the proposed candidate-bus screening method is robust against moderate variations in weighting coefficients. The variation ranges of the comprehensive sensitivity of each candidate bus under different disturbance scenarios are shown in Table 4.
Table 4.
Variation ranges of comprehensive sensitivity of candidate buses.
7.3. Analysis of Planning Results
The proposed improved NSGA-II algorithm is employed to solve the planning model, with the maximum number of generations set to 70 and the population size set to 100. The convergence performance of the algorithm is illustrated in Figure 5. Compared with the conventional NSGA-II algorithm, the proposed improved algorithm exhibits a rapid increase in the normalized hypervolume (HV) indicator during the first 10 generations, followed by a gradual reduction in the improvement rate. The HV value eventually stabilizes at approximately 0.89, indicating relatively rapid convergence toward the Pareto front. These results demonstrate that the improved NSGA-II algorithm achieves favorable multi-objective convergence performance while maintaining solution diversity, enabling the efficient generation of a higher-quality and more uniformly distributed Pareto-optimal solution set.
Figure 5.
Comparison of convergence performance between the conventional and improved NSGA-II algorithms.
The total computation time for 7000 evaluations by the algorithm is 28.4 min, and the average evaluation time per individual is 0.24 s. It should be noted that, since the improved NSGA-II algorithm actually converges relatively quickly, the market clearing computation does not require 70 iterations, and therefore the computation time will also be reduced. In addition, as the scale of the distribution network increases, the number of network variables and constraints increases accordingly, and the number of energy storage candidate connection nodes and integer decision variables will also affect the computational complexity of the algorithm. Therefore, the computation time does not necessarily grow linearly with the number of nodes.
To reflect the equal importance of the three optimization objectives, equal weights are adopted for them when the TOPSIS method is used to screen the Pareto optimal solutions in this paper. The best compromise solution selects buses 5, 14, and 31 for distributed energy storage installation. The total initial investment cost of the proposed configuration is CNY 4.6688 million. The detailed storage allocation results are presented in Table 5.
Table 5.
Optimal energy storage configuration parameters.
To evaluate the robustness of the selected compromise solution, a weight sensitivity analysis was conducted. Each objective weight was independently perturbed by ±20%, followed by normalization of the perturbed weights. For each weight combination, the TOPSIS ranking was recalculated using the same Pareto-optimal solution set. The results show that the same compromise solution was selected in 24 out of the 27 weight scenarios, including the baseline weighting scenario, corresponding to a selection stability rate of 88.9%. These results demonstrate that the selected compromise solution exhibits good robustness against variations in objective weights.
The joint clearing of the energy and frequency regulation ancillary service markets is further analyzed under a typical daily operating scenario. The resulting market-clearing prices are illustrated in Figure 6 and Figure 7. As shown in Figure 6, electricity prices differ across buses during the same operating period due to variations in marginal network losses and local network constraints. In addition, nodal electricity prices exhibit pronounced temporal variations in response to changes in system net load and renewable energy generation. The regulation capacity and regulation mileage prices shown in Figure 7 reflect variations in the scarcity of system regulation resources and the intensity of regulation requirements.
Figure 6.
Distribution of DLMPs.
Figure 7.
Market-clearing prices for frequency regulation ancillary services.
The operational response and SOC variations in the energy storage systems during a typical operating day are illustrated in Figure 8.
Figure 8.
Typical daily operating profiles and SOC variations in the energy storage systems.
As shown in Figure 8, the energy storage systems adjust their charging and discharging schedules according to market prices and system regulation requirements while reserving a portion of their power and energy capacities for frequency regulation services. The SOC remains within the permissible operating limits throughout the scheduling horizon, demonstrating the consistency between the joint market-clearing results and the operational constraints of the energy storage systems.
A comparison between the proposed planning solution and the baseline scenario without energy storage is presented in Table 6.
Table 6.
Comparison of key technical performance indicators before and after energy storage installation.
As shown in Table 6, the proposed energy storage configuration reduces system network losses, nodal voltage deviations, power fluctuations, and line loading ratios while substantially improving renewable energy accommodation. These results indicate that the proposed planning method can effectively enhance distribution network operating performance and increase its capability to accommodate renewable energy generation.
The annual market revenue breakdown of the optimal energy storage planning solution is presented in Figure 9.
Figure 9.
Annual market revenues and revenue breakdown of the energy storage systems.
As illustrated in Figure 9, revenues from the energy market and frequency regulation ancillary service market jointly contribute to the total market revenue of the energy storage project. Since participation in these two markets involves competing demands for the rated power capacity of energy storage systems, joint market clearing enables coordinated capacity allocation between energy arbitrage and frequency regulation services. This coordination improves storage asset utilization and enhances the overall economic performance of the project.
The financial performance of the energy storage project over its entire life cycle is summarized in Table 7.
Table 7.
Life-cycle financial performance of the energy storage project.
As shown in Table 7, the total initial investment of the energy storage project is CNY 4.6688 million, with an annual net revenue of CNY 636,700. Over the project evaluation period, the life-cycle NPV reaches CNY 874,500, indicating that the discounted net cash flows are sufficient to recover the initial investment and generate additional economic value. Furthermore, the simple payback period is 7.33 years, which is shorter than the expected service life of the energy storage system, demonstrating that the initial investment can be recovered within the project lifetime. Overall, the proposed planning method, which incorporates revenues from multiple electricity markets, effectively improves the economic viability of distributed energy storage projects and demonstrates potential for commercial deployment.
To further investigate the adaptability of the proposed planning method under different economic conditions, a single-factor perturbation method is adopted in this paper to conduct sensitivity analyses on the energy storage investment cost, discount rate, and battery degradation cost, respectively, so as to evaluate the impact of changes in key parameters on the planning results. The specific data are presented in Table 8.
Table 8.
Sensitivity analysis results of key parameters.
The above results show that the relevant parameters affect the energy storage planning results and economic benefits. However, since the multi-objective planning method constructed in this paper optimizes the system operating state while taking economic benefits into account, the impact of perturbations in the relevant parameters on the planning results is limited in magnitude, which demonstrates the favorable economic and technical performance of the proposed method.
To further validate the effectiveness and advantages of the proposed distributed energy storage planning method, the particle swarm optimization (PSO)-based energy storage planning method presented in Refence [15] is selected as a benchmark for comparison. This benchmark method determines the optimal locations and capacities of energy storage systems by minimizing a system cost function incorporating network losses, peak load, and nodal voltage deviations. A comparison of the key performance indicators is presented in Table 9.
Table 9.
Comparison of key performance indicators for different planning methods.
The comparative results in Table 9 indicate that the method in Ref. [15] primarily focuses on distribution network operational performance. Although it requires less computational time and can improve the operational conditions of the system, it lacks market-oriented revenue incentives, resulting in limited economic benefits. In contrast, the proposed method incorporates endogenous market-clearing outcomes from the energy and frequency regulation markets and simultaneously optimizes annualized net cost, nodal voltage deviations, and network losses, thereby improving the system operating state while achieving substantial economic benefits.
7.4. Discussion
The results demonstrate that integrating distribution network constraints, energy market transactions, and frequency regulation services into the storage planning process can provide a coordinated assessment of the economic and technical benefits of distributed energy storage. From the economic perspective, participation in both the energy and frequency regulation markets allows storage systems to obtain revenue from multiple market products, thereby improving their investment attractiveness. From the technical perspective, the selected storage locations and capacities are influenced not only by market revenue but also by their impacts on nodal voltage profiles and network losses. This indicates that storage planning based solely on investment cost or market revenue may overlook important distribution network operating requirements. The proposed framework provides a means of balancing these economic and technical considerations through a unified multi-objective optimization model.
It should be noted that the current case study adopts a deterministic typical-day approach based on 24-h load and renewable generation profiles. This approach facilitates the representation of daily operating characteristics and reduces the computational burden associated with the coupled market-clearing and multi-objective planning models. However, it cannot fully capture the temporal variability and uncertainty of load demand, renewable generation, and electricity market prices over different seasons and operating conditions. In particular, extreme weather events, unexpected renewable generation fluctuations, and forecast errors may lead to operating conditions that are not represented by the selected typical day. Therefore, the planning results should be interpreted within the scope of the adopted representative operating conditions. Future work will incorporate multiple representative days, year-dependent load and renewable generation profiles, and market scenarios to improve the accuracy of long-term economic assessments.
Regarding its applicability, the proposed framework is not restricted to the specific test system or the baseline market parameters considered in this study. Its overall structure, including candidate-bus screening, joint energy and frequency regulation market clearing, life-cycle economic evaluation, and multi-objective planning, can be adapted to distribution networks with different renewable penetration levels, load characteristics, and network configurations. In addition, the market-clearing module can be adjusted according to different market rules, settlement mechanisms, and ancillary service products. For example, the relative contribution of energy arbitrage and frequency regulation revenue can be reassessed under different electricity-price spreads and frequency regulation price levels. Nevertheless, the specific planning results depend on the network parameters, market rules, and economic assumptions of the target system.
8. Conclusions
To address the insufficient consideration of electricity market mechanisms and energy storage revenue assessment in conventional distribution network planning under high penetration of distributed renewable energy, this study proposes a distributed energy storage planning method incorporating joint market clearing. A unified framework integrating candidate-bus screening, joint market clearing, life-cycle economic assessment, and planning optimization is developed and solved using an improved NSGA-II algorithm. The effectiveness of the proposed method is validated through case studies on an IEEE 33-bus distribution network. The main conclusions are summarized as follows.
- (1)
- A comprehensive candidate-bus screening method integrating voltage sensitivity, network-loss sensitivity, market-value sensitivity, and renewable energy proximity is proposed. By jointly considering the technical and market values of different buses and incorporating electrical-distance constraints, the proposed method enables the spatially distributed selection of candidate storage locations, providing a technically and economically justified basis for energy storage siting.
- (2)
- A market-level model incorporating the joint clearing of the energy and frequency regulation ancillary service markets is developed to endogenously determine energy prices, regulation capacity prices, and regulation mileage prices. The resulting market price signals are directly incorporated into storage revenue calculations, forming the basis of a life-cycle economic assessment model. By coordinating energy trading power and reserved frequency regulation capacity, the proposed model captures capacity competition and opportunity costs across different markets, providing a consistent market-based foundation for evaluating the economic performance of energy storage planning solutions.
- (3)
- A multi-objective energy storage planning model is established to minimize annualized life-cycle net cost, nodal voltage deviations, and system network losses. The model is solved using an improved NSGA-II algorithm combined with TOPSIS. By incorporating Latin hypercube sampling, adaptive crossover and mutation strategies, and local perturbation search, the proposed algorithm enhances population diversity, global search capability, and Pareto-front convergence performance, enabling the efficient identification of planning solutions with favorable overall performance.
The case study results demonstrate that, compared with the baseline scenario, the proposed planning solution reduces average system network losses from 0.20135 MW to 0.08235 MW and average nodal voltage deviations from 0.028 p.u. to 0.019 p.u., while increasing the renewable energy accommodation rate from 81.73% to 95.63%. The average line loading ratio decreases to 37.40%. Furthermore, the energy storage project achieves a life-cycle net present value of CNY 874,500 and a simple payback period of 7.33 years. These results demonstrate that the proposed method can simultaneously enhance distribution network operational security, renewable energy accommodation capability, and the economic viability of energy storage projects, indicating its potential for practical engineering applications and broader deployment.
Future research will focus on incorporating stochastic scenarios and robust optimization into the coordinated planning of energy storage systems and distribution networks. Furthermore, by considering the coordinated operation of electricity spot markets, ancillary service markets, and capacity markets, a multi-level and multi-timescale planning framework can be developed to better capture the operational characteristics of emerging power systems, thereby improving the adaptability and practical applicability of planning solutions under complex electricity market conditions.
Author Contributions
Conceptualization, D.W., M.D., Z.W. and X.W.; methodology, Y.Z., G.Z., G.L. and X.L.; software, S.C.; validation, F.L.; formal analysis, D.W. and M.D.; investigation, Z.W. and X.W.; resources, D.W., M.D., Z.W., X.W., Y.Z., G.Z., G.L., X.L., F.L. and S.C.; data curation, F.L. and S.C.; writing—original draft preparation, S.C.; writing—review and editing, F.L. All authors have read and agreed to the published version of the manuscript.
Funding
The authors declare that this study received funding from the Science and Technology Projects of the State Grid Jizhou Power Supply Company (SGTJJX00DKJS2500650).
Data Availability Statement
The original contributions presented in this study are included in the article. Further inquiries can be directed to the corresponding authors.
Acknowledgments
The authors would also like to thank the anonymous reviewers for their valuable comments and suggestions to improve the quality of the paper.
Conflicts of Interest
Authors Dacheng Wang, Minghui Duan, Xuchen Wang, Gaozhong Lv and Xin Liu were employed by the State Grid Jizhou Power Supply Company. Author Zhe Wang was employed by the State Grid Tianjin Electric Power Company. Author Yaoxiang Zhang was employed by the State Grid Tianjin Economic and Technological Research Institute. Author Guoqiang Zu was employed by the State Grid Tianjin Electric Power Research Institute. The remaining authors declare that the research was conducted in the absence of any commercial or financial relationships that could be construed as potential conflicts of interest. The authors declare that this study received funding from State Grid Jizhou Power Supply Company. The funder was not involved in the study design, collection, analysis, interpretation of data, the writing of this article or the decision to submit it for publication.
Appendix A
The nodal voltage constraints ensure that the voltage magnitudes at all buses remain within their permissible operating limits throughout the scheduling horizon, as expressed in (A1).
where Umin and Umax denote the lower and upper limits of the nodal voltage magnitude, respectively.
The line loading constraints require the apparent power flow through each branch to remain within its allowable capacity during all operating periods, thereby preventing excessive loading and line overloads. These constraints are expressed as
where denotes the rated apparent power capacity of branch ij, and λmax is the maximum allowable line loading ratio.
The minimum and maximum power output constraints of conventional generating units are formulated as
where and denote the minimum and maximum technical output limits of conventional generating unit g, respectively, and ug,t is its commitment status variable at time t.
The ramping constraints of conventional generating units are expressed as
where and denote the upward and downward ramp rates of conventional generating unit g, respectively, and Δt represents the time interval between two consecutive periods.
The coupling constraints between conventional generation output and reserved frequency regulation capacity are formulated as
where denotes the maximum frequency regulation capacity available from conventional generating unit g.
The active power output of renewable energy generators must not exceed their maximum available generation, as expressed in (A7).
where denotes the actual active power output of renewable energy generator r at time t, and Pr,t,max represents its maximum available output.
Renewable energy generation and curtailment are further constrained by
where denotes the forecast power output of renewable energy generator r at time t.
DESSs are connected to the distribution network through bidirectional power converters. Owing to converter capacity limitations, the charging and discharging powers of distributed energy storage unit i must not exceed its rated power Pmax, as expressed in (A9) and (A10).
where and are binary variables indicating the charging and discharging states of the energy storage system, respectively. To prevent simultaneous charging and discharging during the same operating period, the following mutual-exclusivity constraint is imposed:
The state of charge (SOC) is a key variable describing the remaining energy in an energy storage system. It is defined as the ratio of the remaining stored energy to the rated energy capacity:
where represents the remaining stored energy of storage unit i at time t, and denotes its rated energy capacity. The temporal evolution of SOC is determined by the charging and discharging powers, as follows:
where ηch and ηdis denote the charging and discharging efficiencies, respectively. These efficiencies account for energy losses during the charging and discharging processes. To prevent excessive charging and discharging, which may accelerate battery degradation and shorten its service life, the SOC must remain within its permissible operating range:
In this study, the SOC limits are set to SOCmin = 0.05 and SOCmax = 0.95. Furthermore, to ensure scheduling continuity across different typical operating days and prevent excessive discharge at the end of a scheduling period from causing SOC violations on the following day, a terminal SOC constraint is introduced:
where SOCi,0 and SOCi,T denote the SOC values at the beginning and end of the scheduling horizon, respectively.
To ensure that energy storage systems can fulfill their frequency regulation obligations, sufficient energy margins must also be reserved for regulation services:
where Ei,t denotes the stored energy of storage unit i at time t; and represent its minimum and maximum allowable stored energy, respectively; Ei denotes its rated energy capacity; and Δt represents the duration of a frequency regulation interval.
Regulation mileage is generally related to regulation capacity through a proportional relationship, which can be expressed as
where and denote the regulation mileage factors of energy storage unit i and conventional generating unit g, respectively. These factors characterize the regulation mileage that can be delivered per unit of regulation capacity during a scheduling interval.
Appendix B
The aggregate penalty function P is expressed as
where PV, PL, and PSOC represent the penalty terms associated with nodal voltage constraints, line capacity constraints, and energy storage SOC constraints, respectively.
For nodal voltage constraints, penalties are imposed only when the bus voltage exceeds its permissible operating range. Accordingly, the voltage penalty function is defined as
where Ui denotes the voltage magnitude at bus i, and Ui,max and Ui,min represent its upper and lower permissible voltage limits, respectively. When the bus voltage remains within the allowable range, the corresponding penalty is zero. Otherwise, the penalty increases quadratically with the magnitude of the voltage violation, thereby effectively suppressing solutions with severe voltage deviations.
The line capacity penalty function is formulated as
where Sl denotes the actual apparent power flow through line l, and Sl,max is its maximum allowable transfer capacity. This penalty function prevents planning solutions from causing line overloads due to energy storage charging and discharging or renewable energy integration.
The penalty function for energy storage SOC constraints is defined as
where SOCt denotes the SOC of the energy storage system during period t, while SOCmin and SOCmax represent its lower and upper permissible operating limits, respectively. This constraint prevents overcharging and overdischarging, ensuring that storage operation satisfies battery lifetime and safety requirements.
The initial value of the i-th decision variable in LHS is expressed as
where ri denotes a random variable generated using Latin hypercube sampling.
The corresponding expressions of adaptive crossover and mutation probabilities are given by
where t denotes the current iteration number, and T represents the maximum number of iterations. During the early evolutionary stages, a higher crossover probability facilitates exploration of a broader search space. In later stages, a higher mutation probability helps prevent premature convergence to local optima and improves the convergence accuracy of the Pareto-optimal solution set.
The updating rule is expressed as
where ε ~ N(0,σ2) denotes a small perturbation following a Gaussian distribution. This strategy refines the local search around high-quality individuals while preserving their favorable characteristics, thereby improving the uniformity and convergence performance of the Pareto front.
The detailed procedure of TOPSIS is described as follows.
- (1)
- Construct the decision matrix.
Assume that the Pareto-optimal solution set contains M solutions, each evaluated using K objective functions. An M×K decision matrix is constructed as , where xmk denotes the value of the k-th objective function for the m-th solution.
- (2)
- Normalize the decision matrix.
To eliminate the effects of different units and numerical scales among the objective functions, the decision matrix is normalized as
where xk,max and xk,min denote the maximum and minimum values of the k-th objective function, respectively.
- (3)
- Construct the weighted normalized decision matrix.
A weighting vector is introduced to construct the weighted normalized decision matrix , where zmk = wk ⋅ rmk.
- (4)
- Determine the positive and negative ideal solutions.
The positive ideal solution Z+ consists of the best values of all objective functions, whereas the negative ideal solution Z− consists of their worst values. These solutions are defined as
- (5)
- Calculate the Euclidean distances from the ideal solutions.
For each solution, the Euclidean distances to the positive and negative ideal solutions are calculated as
- (6)
- Calculate the relative closeness coefficient.
The relative closeness coefficient Cm of each solution is calculated as
The relative closeness coefficient Cm ranges from 0 to 1. A higher value indicates that the corresponding solution is closer to the positive ideal solution and farther from the negative ideal solution, thereby representing a more favorable compromise among the optimization objectives.
- (7)
- Select the best compromise solution.
The solution with the highest relative closeness coefficient is selected as the best compromise solution and recommended as the final energy storage planning scheme.
References
- Chen, G.P.; Dong, Y.; Liang, Z.F. Analysis and Reflection on High-quality Development of New Energy with Chinese Characteristics in Energy Transition. Proc. CSEE 2020, 40, 5493–5506. [Google Scholar]
- Mahmud, N.; Zahedi, A. Review of control strategies for voltage regulation of the smart distribution network with high penetration of renewable distributed generation. Renew. Sustain. Energy Rev. 2016, 64, 582–595. [Google Scholar] [CrossRef] [Scilit]
- Wang, S.Y.; Luo, F.Z.; Fo, J.C.; Lv, Y.Q.; Wang, C.S. Two-stage spatiotemporal decoupling configuration of SOP and multi-level electric-hydrogen hybrid energy storage based on feature extraction for distribution networks with ultra-high DG penetration. Appl. Energy 2025, 398, 126438. [Google Scholar] [CrossRef] [Scilit]
- Wang, S.Y.; Luo, F.Z.; Wang, C.S.; Lv, Y.Q.; Mu, R.F.; Fo, J.C.; Ge, L.K. Collaborative Configuration Optimization of Soft Open Points and Distributed Multi-Energy Stations with Spatiotemporal Coordination and Complementarity. J. Mod. Power Syst. Clean Energy 2025, 13, 2086–2097. [Google Scholar] [CrossRef] [Scilit]
- Luo, F.Z.; Wang, S.Y.; Lv, Y.Q.; Mu, R.F.; Fo, J.C.; Zhang, T.Y.; Xu, J.; Wang, C.S. Domain knowledge-enhanced graph reinforcement learning method for Volt/Var control in distribution networks. Appl. Energy 2025, 398, 126409. [Google Scholar] [CrossRef] [Scilit]
- Babacan, O.; Torre, W.; Kleissl, J. Siting and sizing of distributed energy storage to mitigate voltage impact by solar PV in distribution systems. Sol. Energy 2017, 146, 199–208. [Google Scholar] [CrossRef] [Scilit]
- Boonluk, P.; Siritaratiwat, A.; Fuangfoo, P.; Khunkitti, S. Optimal Siting and Sizing of Battery Energy Storage Systems for Distribution Network of Distribution System Operators. Batteries 2020, 6, 56. [Google Scholar] [CrossRef] [Scilit]
- Wu, X.; Conejo, A.J.; Mathew, S. Optimal Siting of Batteries in Distribution Systems to Enhance Reliability. IEEE Trans. Power Deliv. 2021, 36, 3118–3127. [Google Scholar] [CrossRef] [Scilit]
- Nicolosi, C.F.; Tina, G.M. Monte Carlo and bootstrap approaches for power system adequacy: A study on atmospheric variables correlations. Int. J. Electr. Power Energy Syst. 2025, 169, 110827. [Google Scholar] [CrossRef] [Scilit]
- Duan, M.R.; Jiang, H.; Qin, R.S. Problems and Solutions for Distribution Network Under High-permeability Distributied Photovoltaics. Electr. Eng. 2022, 113–115. [Google Scholar] [CrossRef]
- Jayasekara, N.; Masoum, M.A.S.; Wolfs, P.J. Optimal Operation of Distributed Energy Storage Systems to Improve Distribution Network Load and Generation Hosting Capability. IEEE Trans. Sustain. Energy 2016, 7, 250–261. [Google Scholar] [CrossRef] [Scilit]
- Das, C.K.; Bass, O.; Mahmoud, T.S.; Kothapalli, G.; Mousavi, N.; Habibi, D.; Masoum, M.A.S. Optimal allocation of distributed energy storage systems to improve performance and power quality of distribution networks. Appl. Energy 2019, 252, 113468. [Google Scholar] [CrossRef] [Scilit]
- Chedid, R.; Sawwas, A. Optimal placement and sizing of photovoltaics and battery storage in distribution networks. Energy Storage 2019, 1, e46. [Google Scholar] [CrossRef] [Scilit]
- Zheng, Y.; Song, Y.; Huang, A.; Hill, D.J. Hierarchical Optimal Allocation of Battery Energy Storage Systems for Multiple Services in Distribution Systems. IEEE Trans. Sustain. Energy 2020, 11, 1911–1921. [Google Scholar] [CrossRef] [Scilit]
- Khunkitti, S.; Boonluk, P.; Siritaratiwat, A. Optimal Location and Sizing of BESS for Performance Improvement of Distribution Systems with High DG Penetration. Int. Trans. Electr. Energy Syst. 2022, 6361243. [Google Scholar] [CrossRef] [Scilit]
- Hoseini, S.E.; Simab, M.; Bahmani-Firouzi, B. AI-based multi-objective distribution network reconfiguration considering optimal allocation of distributed energy storages and renewable resources. Int. J. Smart Electr. Eng. 2025, 14, 67–82. [Google Scholar]
- Zhang, J.H.; Zhu, L.D.; Zhao, S.C.; Yan, J.; Lv, L.L. Optimal Configuration of Energy Storage Systems in High PV Penetrating Distribution Network. Energies 2023, 16, 2168. [Google Scholar] [CrossRef] [Scilit]
- Ghaffari, A.; Askarzadeh, A.; Fadaeinedjad, R. Optimal allocation of energy storage systems, wind turbines and photovoltaic systems in distribution network considering flicker mitigation. Appl. Energy 2022, 319, 119253. [Google Scholar] [CrossRef] [Scilit]
- Li, C.P.; Dong, Z.M.; Li, J.H.; Li, H.J.; Zhou, H.Y.; Jin, Q. Optimal Control Strategy of Distributed Energy Storage Cluster for Prompting Renewable Energy Accomodation in Distribution Network. Autom. Electr. Power Syst. 2021, 45, 76–83. [Google Scholar]
- Huang, H.Q.; Huang, X.W.; Jiang, W.; Wang, Y.Y.; Wang, Y.F.; Ding, H.; Zuo, J.W.; Xia, C.Y. A Review of Distributed Energy Storage System Solutions and Configurations for New Distribution Grids. South. Energy Constr. 2024, 11, 42–53. [Google Scholar]
- Garttan, G.; Alahakoon, S.; Emami, K.; Jayasinghe, S.G. Battery Energy Storage Systems: Energy Market Review, Challenges, and Opportunities in Frequency Control Ancillary Services. Energies 2025, 18, 4174. [Google Scholar] [CrossRef] [Scilit]
- McConnell, D.; Forcey, T.; Sandiford, M. Estimating the value of electricity storage in an energy-only wholesale market. Appl. Energy 2015, 159, 422–432. [Google Scholar] [CrossRef] [Scilit]
- Berrada, A.; Loudiyi, K.; Zorkani, I. Valuation of energy storage in energy and regulation markets. Energy 2016, 115, 1109–1118. [Google Scholar] [CrossRef] [Scilit]
- Li, G.Q.; Yan, K.F.; Fan, G.F.; Bian, J.; Yu, G.K.; Yu, Z.P. Transaction Decision-making of Energy Storage Stations Participating in the Spot Energy and Frequency Modulation Ancillary Service Market. Power Syst. Prot. Control 2022, 50, 45–54. [Google Scholar]
- Chen, Z.W.; Wu, J.L.; Wang, S.L.; Zhang, J.Y.; Fang, B.; Yan, P.; Huang, J.H. New Energy Storage Business Models and Revenue Levels Based on Simulation Calculation. South. Energy Constr. 2024, 11, 142–152. [Google Scholar]
- Mohamed, A.; Rigo-Mariani, R.; Debusschere, V.; Pin, L. Stacked revenues for energy storage participating in energy and reserve markets with an optimal frequency regulation modeling. Appl. Energy 2023, 350, 121721. [Google Scholar] [CrossRef] [Scilit]
- Gu, C.J.; Wang, J.X.; Li, Q.T.; Zhang, Y. Review on Large-Scale Centralized Energy Storage Planning under Centralized Grid Integration of Renewable Energy. Electr. Power 2022, 55, 2–12+83. [Google Scholar]
- Tang, X.S.; Li, W.; Shen, X.D. Research Progress and Prospect of Energy Storage Planning Method for New Power System. Autom. Electr. Power Syst. 2024, 48, 178–191. [Google Scholar]
- Liu, J.C.; Liu, K.X.; Ke, X.B.; Tang, Z.Y.; Deng, J.H. Participation of Energy Storage in Electric Energy-Inertia-Primary Frequency Regulation Multi-market Trading Method Under a New Power System. Power Syst. Technol. 2025, 49, 1018–1031. [Google Scholar]
- Deb, K.; Pratap, A.; Agarwal, S.; Meyarivan, T. A fast and elitist multiobjective genetic algorithm: NSGA-II. IEEE Trans. Evol. Comput. 2002, 6, 182–197. [Google Scholar] [CrossRef] [Scilit]
- Ma, H.P.; Zhang, Y.J.; Sun, S.Y.; Liu, T.; Shan, Y. A comprehensive survey on NSGA-II for multi-objective optimization and applications. Artif. Intell. Rev. 2023, 56, 15217–15270. [Google Scholar] [CrossRef] [Scilit]
- Ramesh, S.; Kannan, S.; Baskar, S. Application of modified NSGA-II algorithm to multi-objective reactive power planning. Appl. Soft Comput. 2012, 12, 741–753. [Google Scholar] [CrossRef] [Scilit]
- Deb, K.; Jain, H. An Evolutionary Many-Objective Optimization Algorithm Using Reference-Point-Based Nondominated Sorting Approach, Part I: Solving Problems with Box Constraints. IEEE Trans. Evol. Comput. 2014, 18, 577–601. [Google Scholar] [CrossRef] [Scilit]
- Behzadian, M.; Otaghsara, S.K.; Yazdani, M.; Ignatius, J. A state-of the-art survey of TOPSIS applications. Expert Syst. Appl. 2012, 39, 13051–13069. [Google Scholar] [CrossRef] [Scilit]
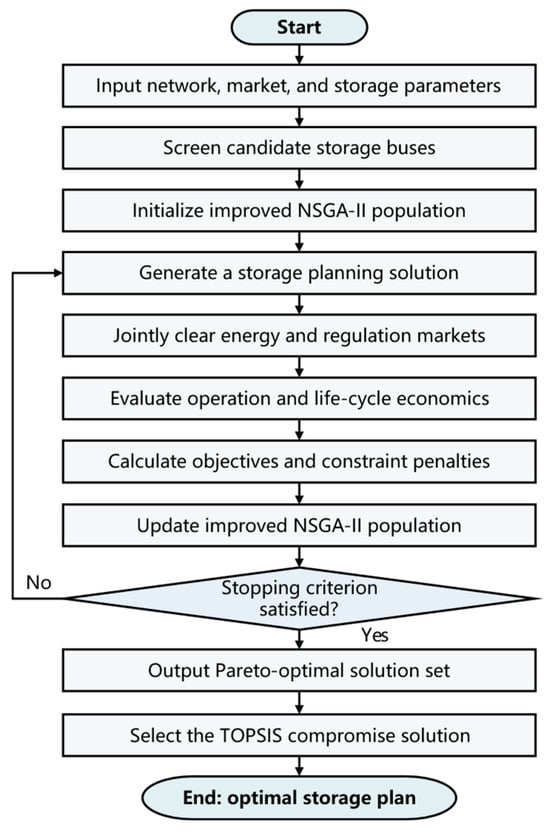
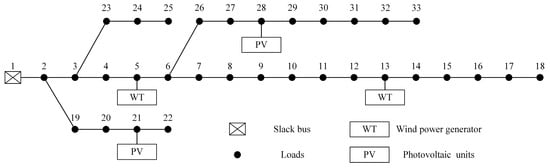
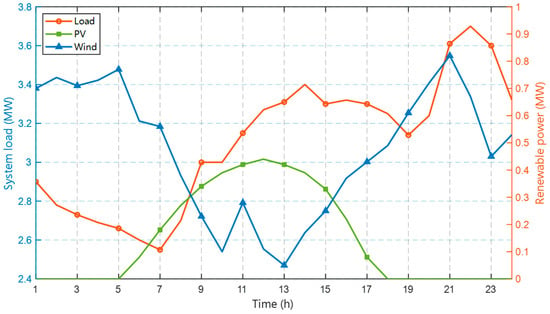
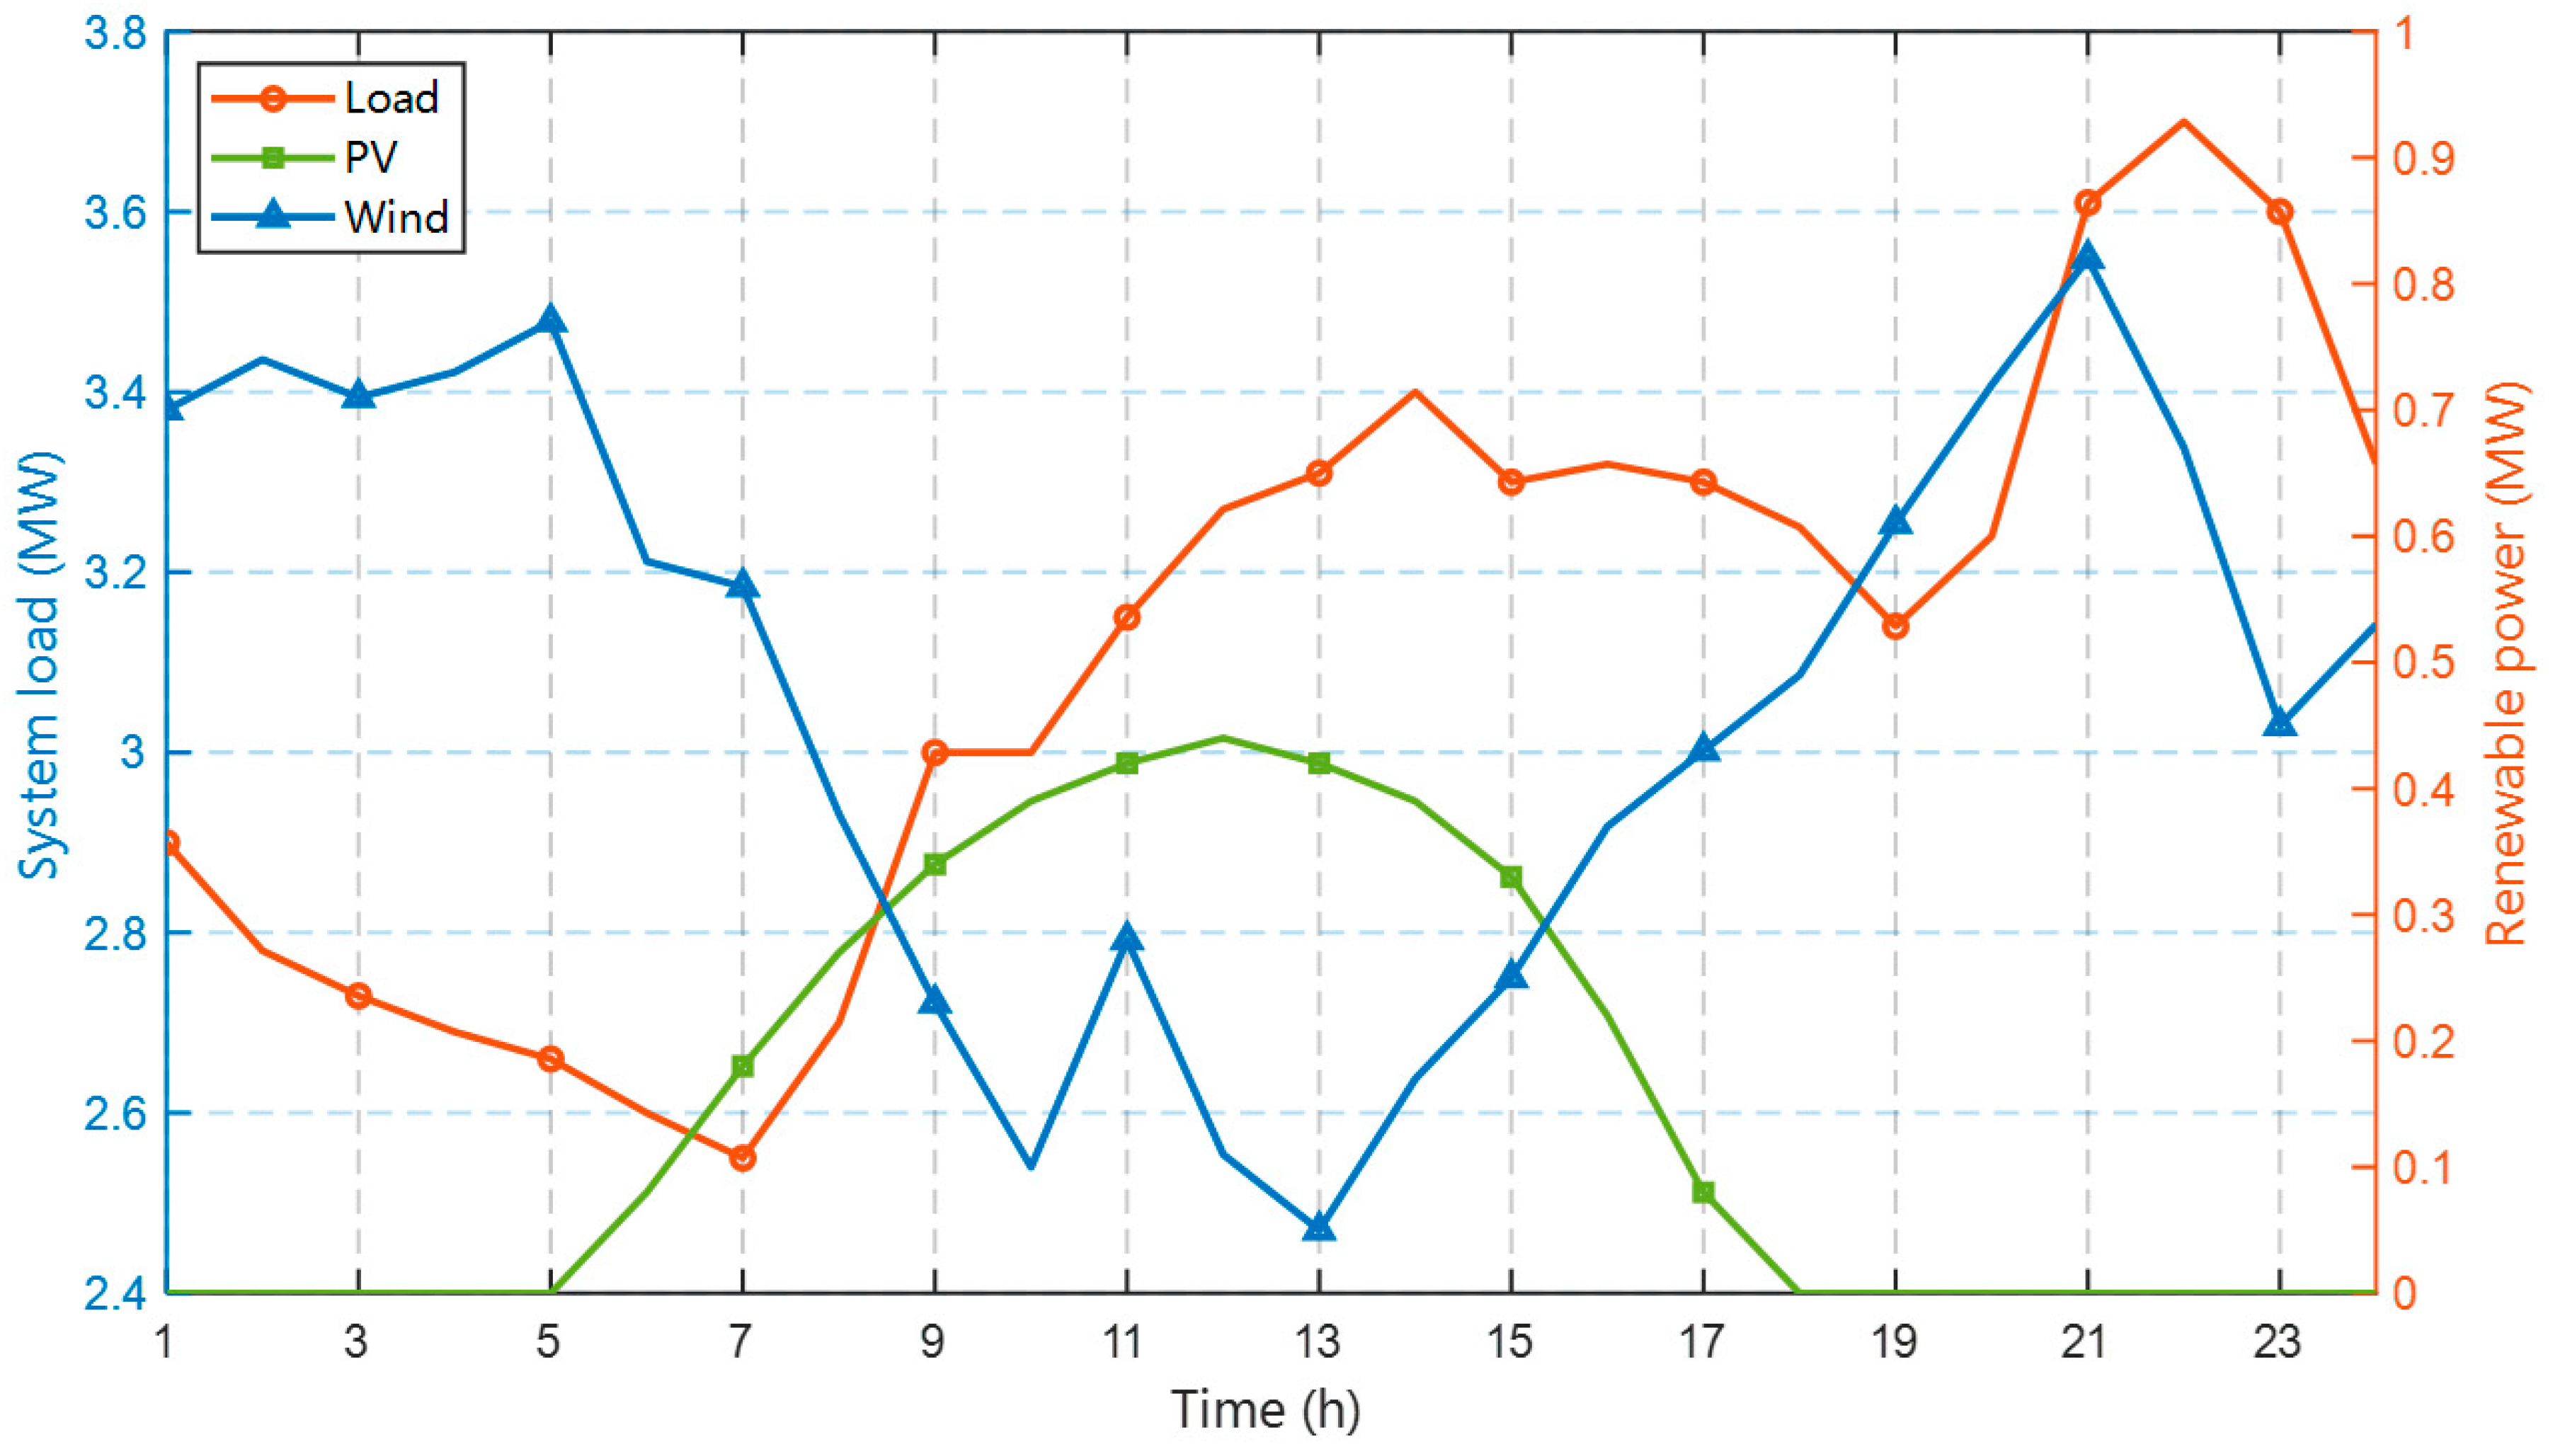
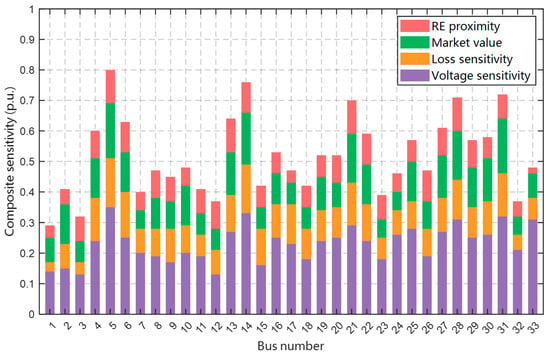
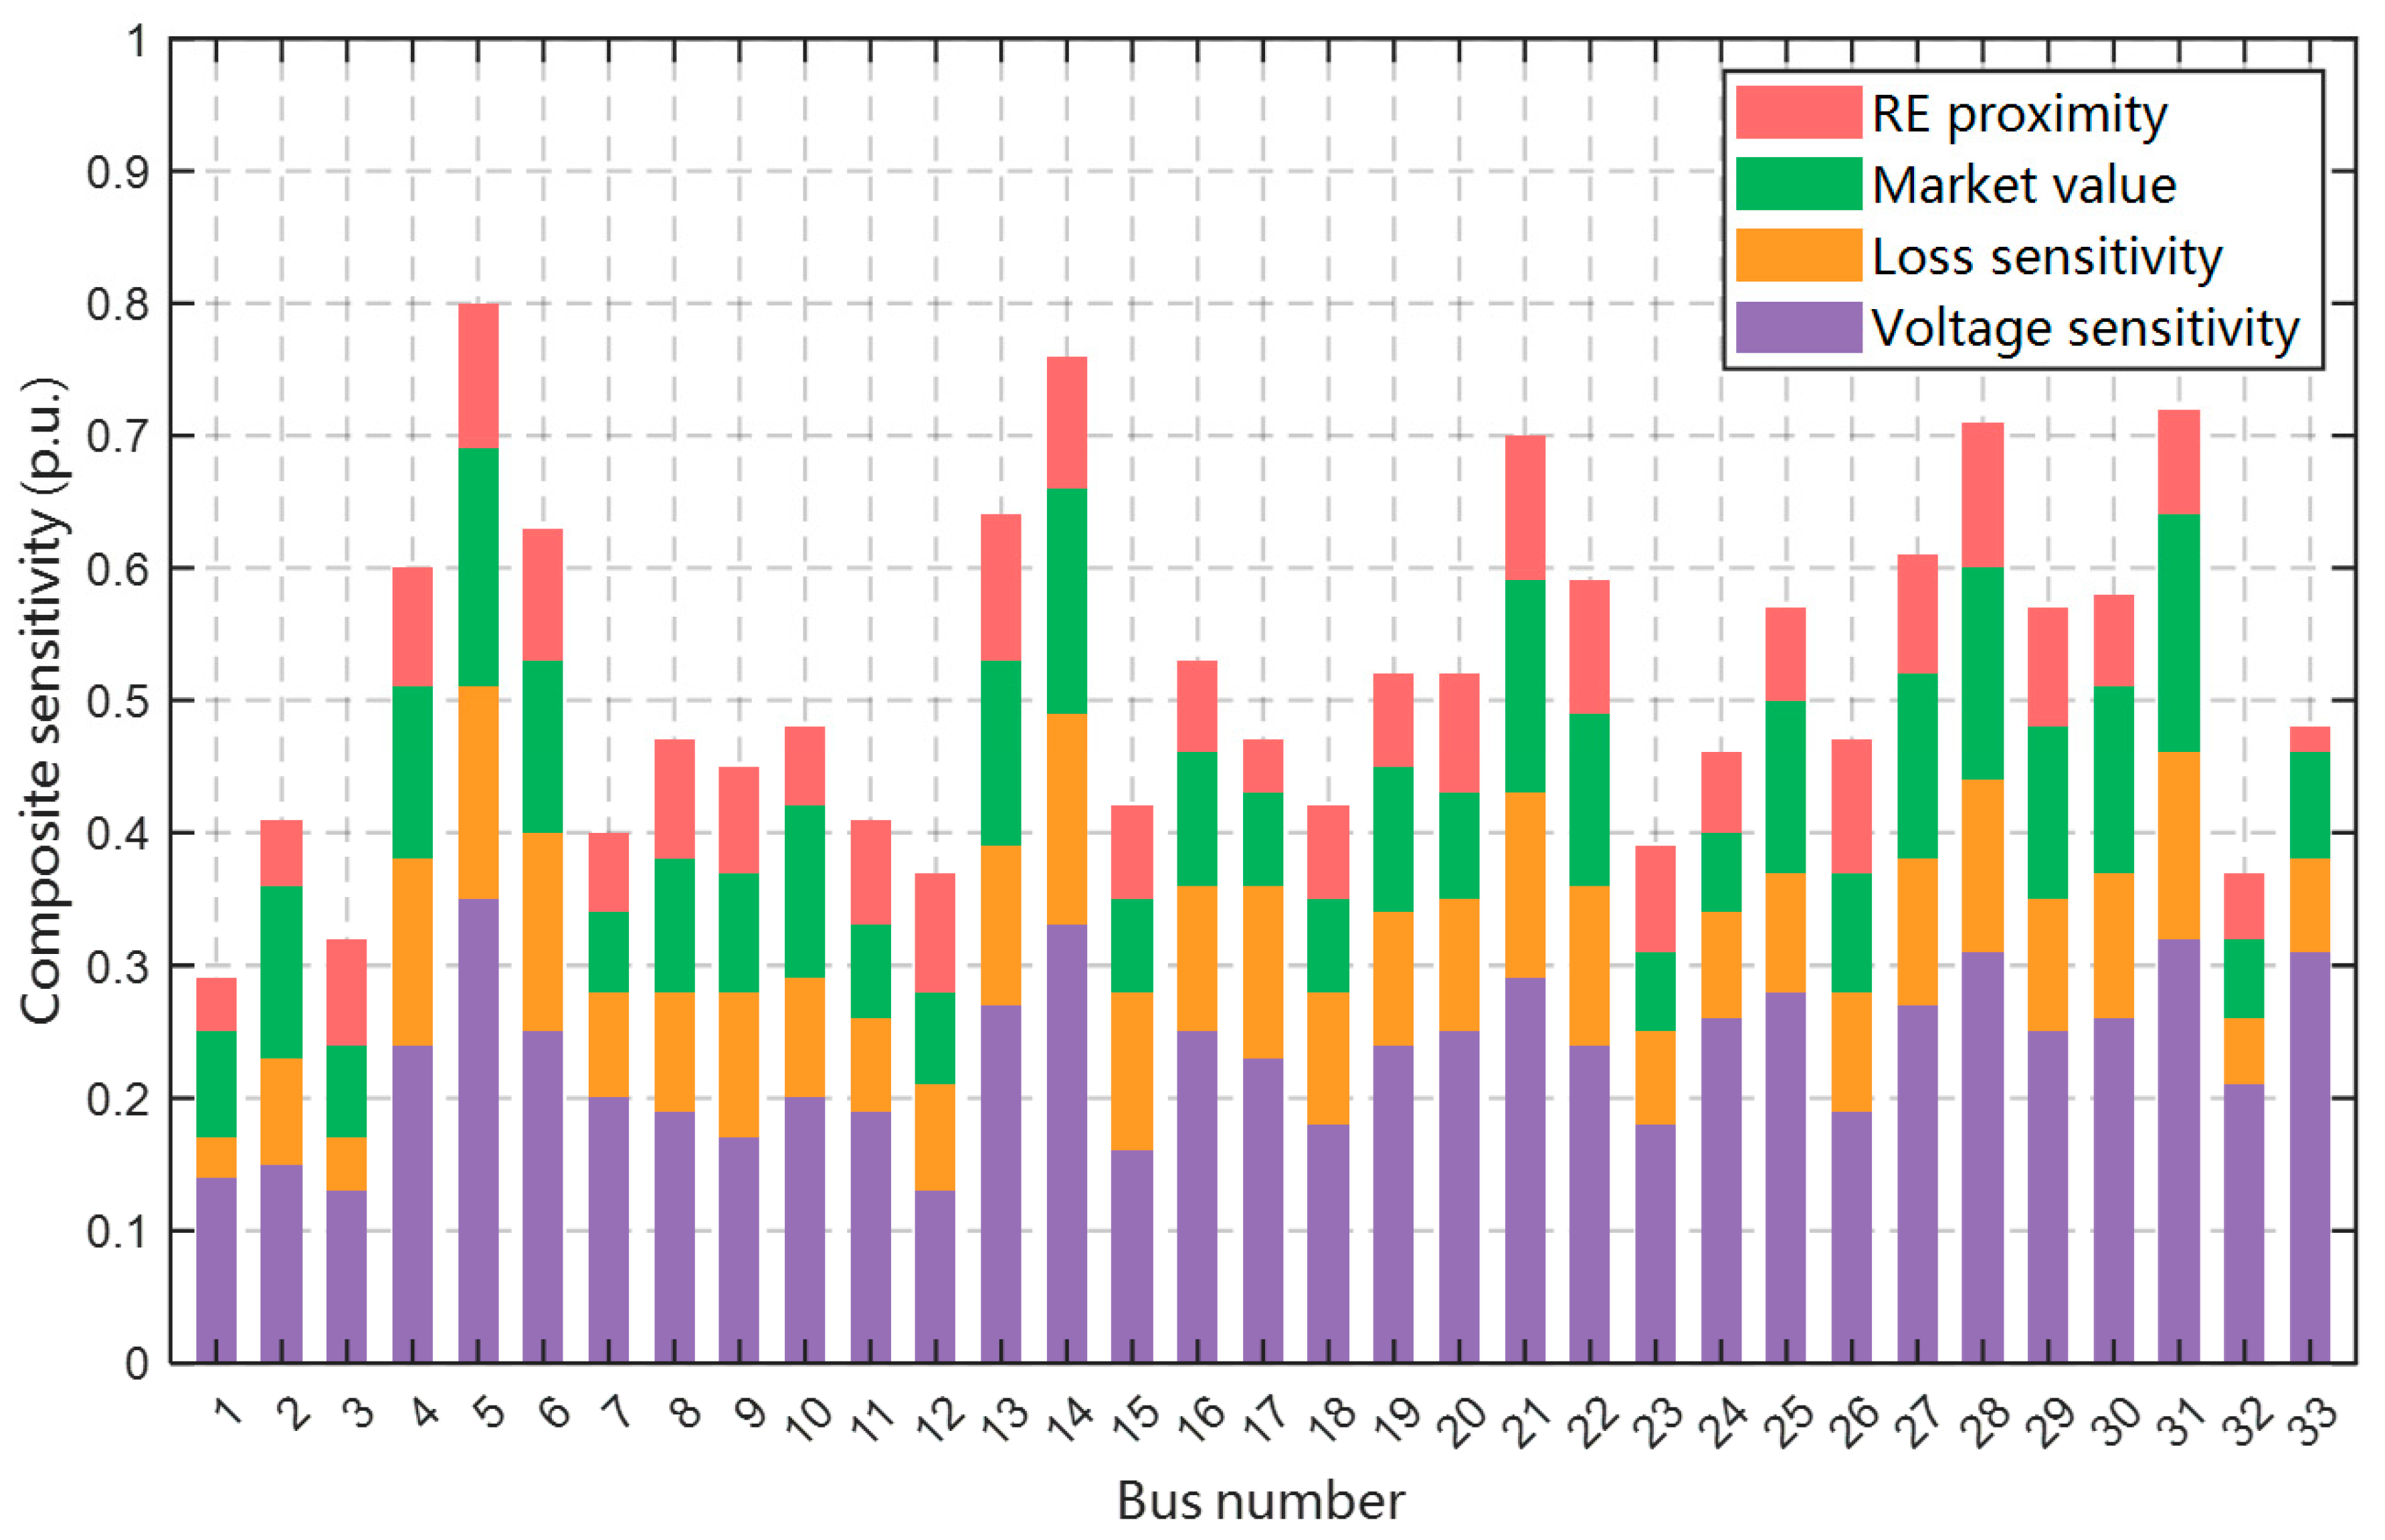
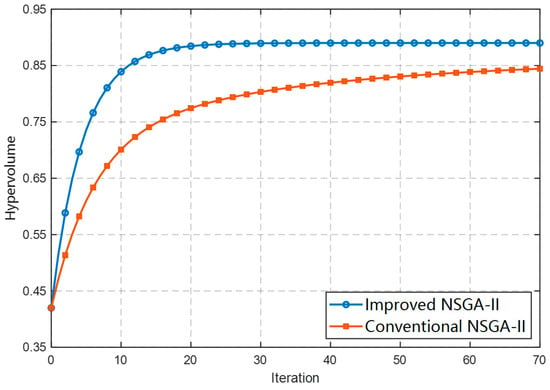
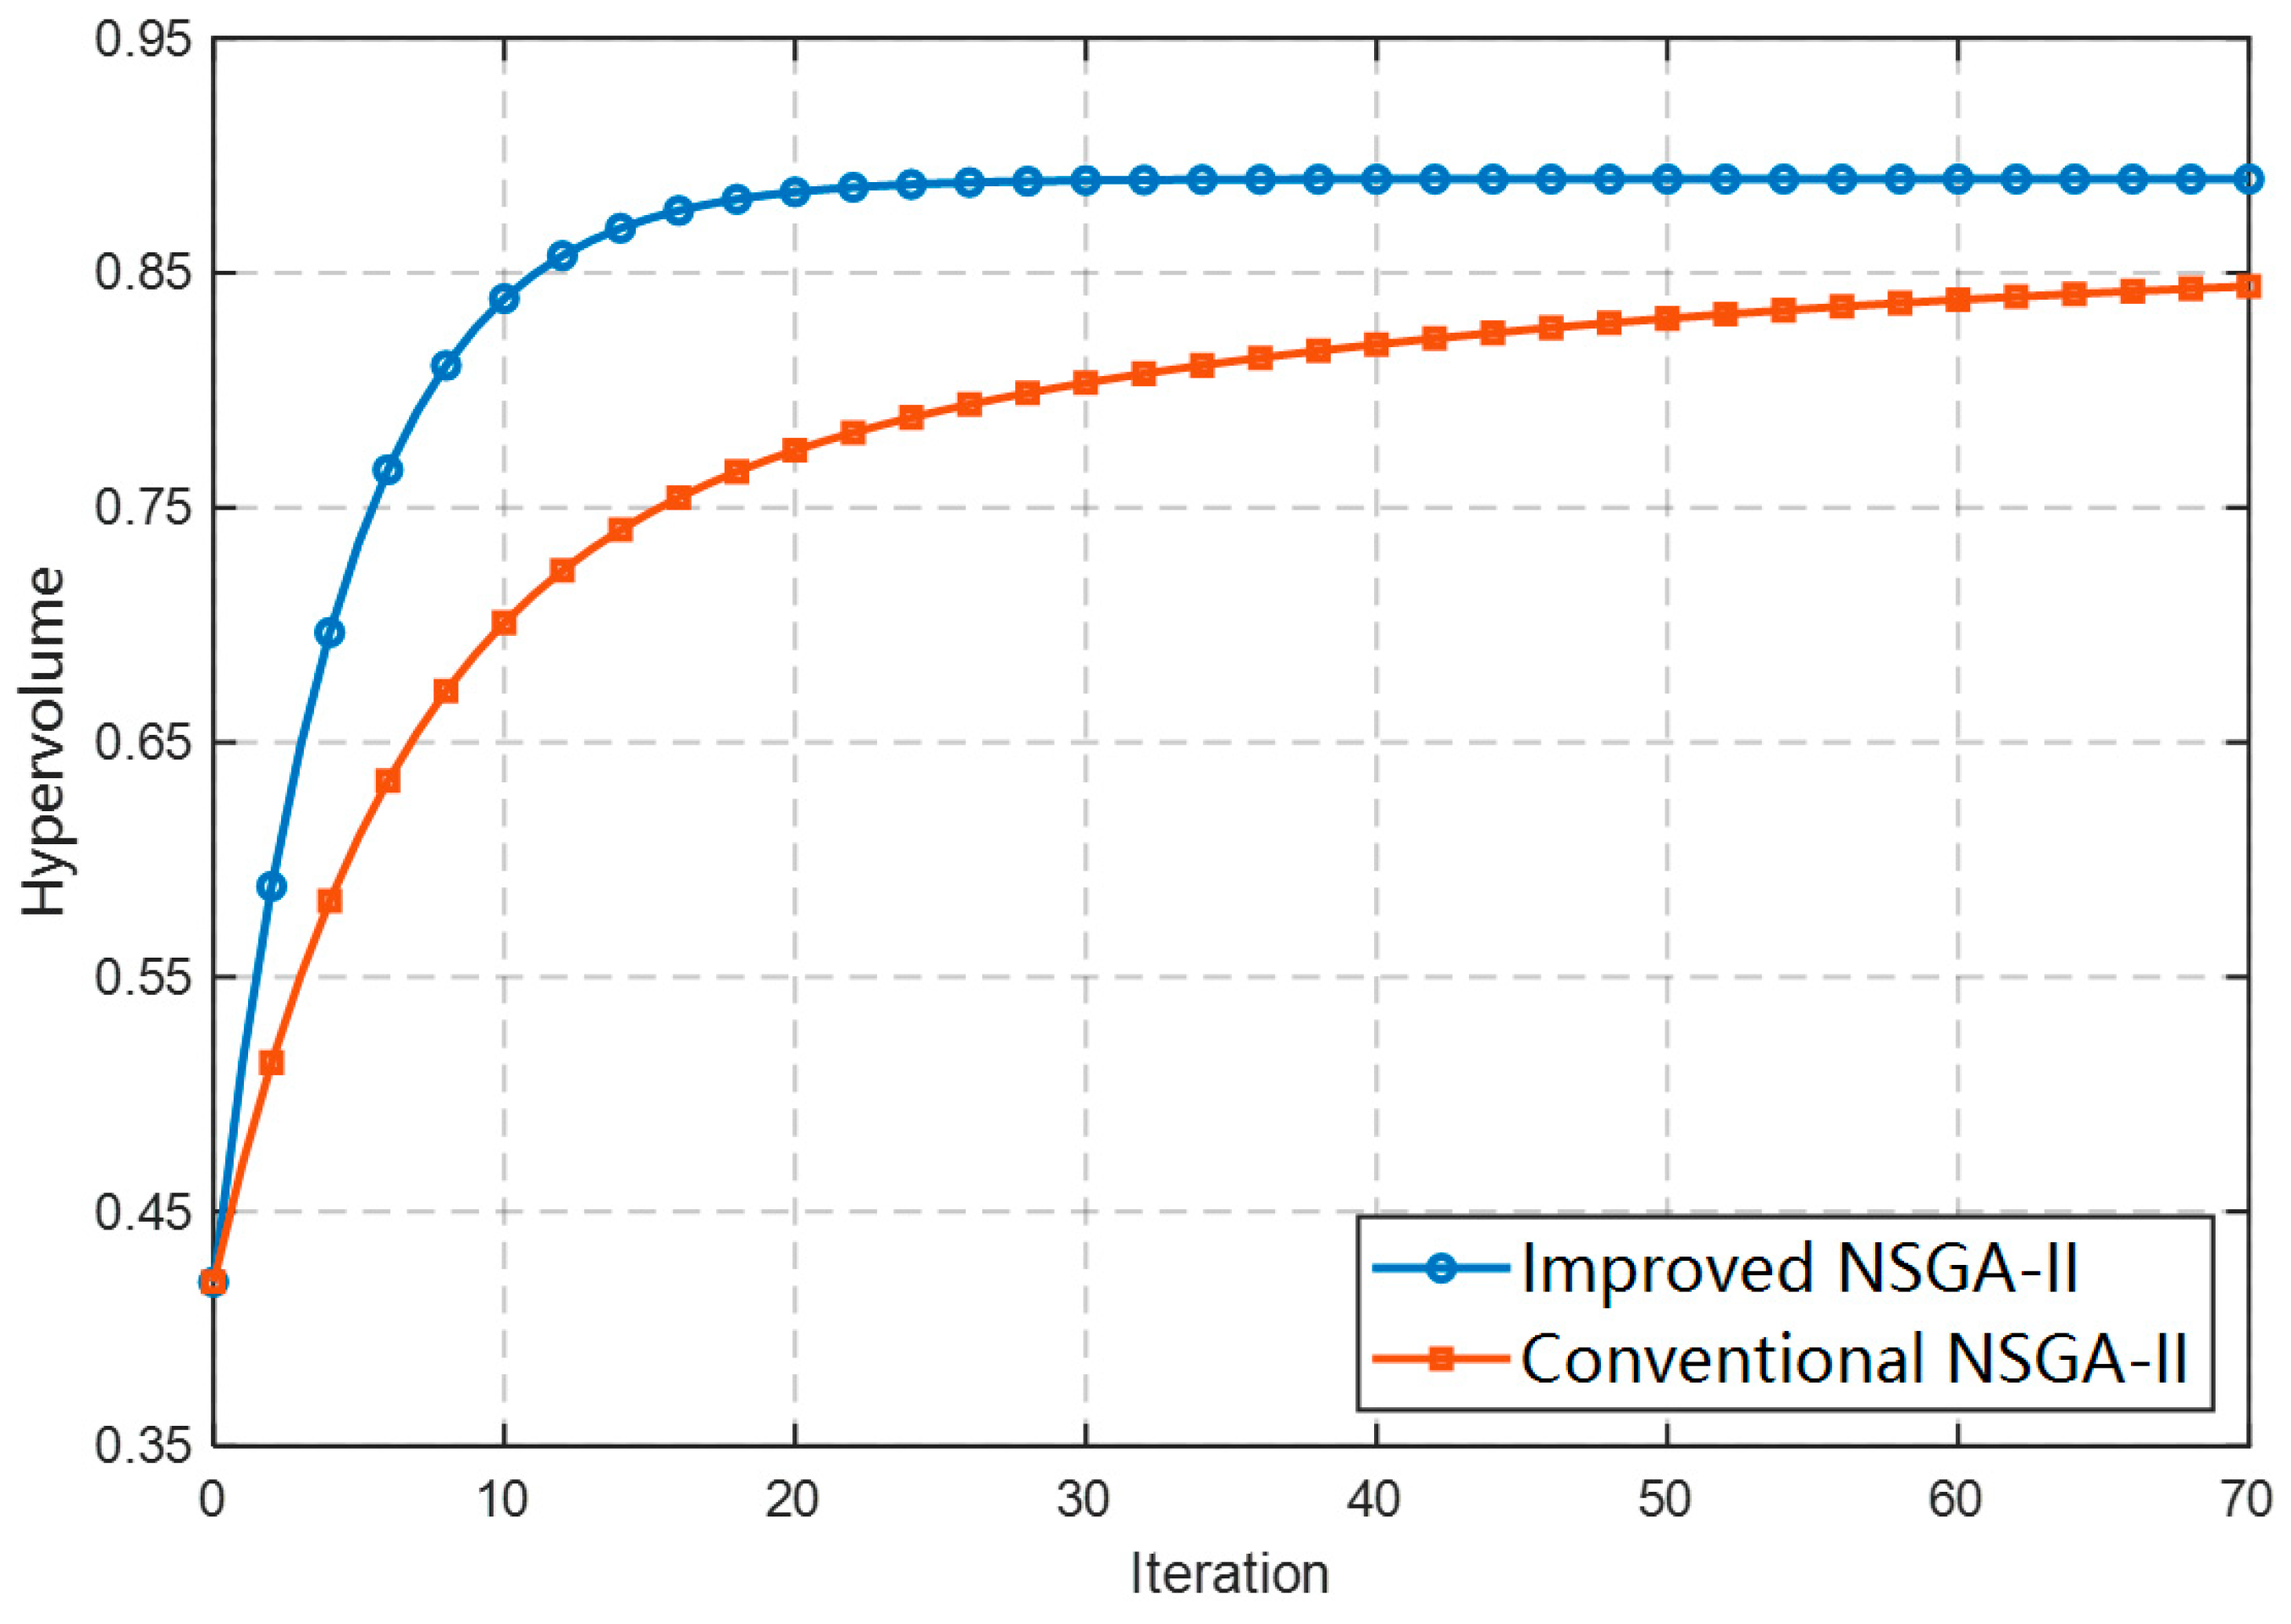
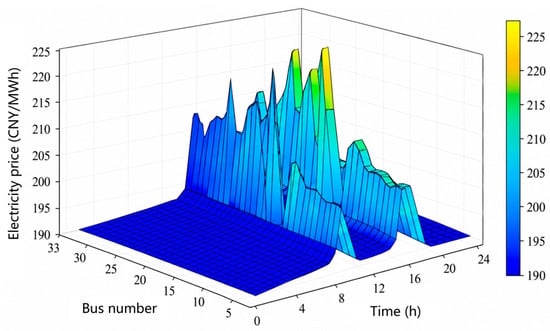
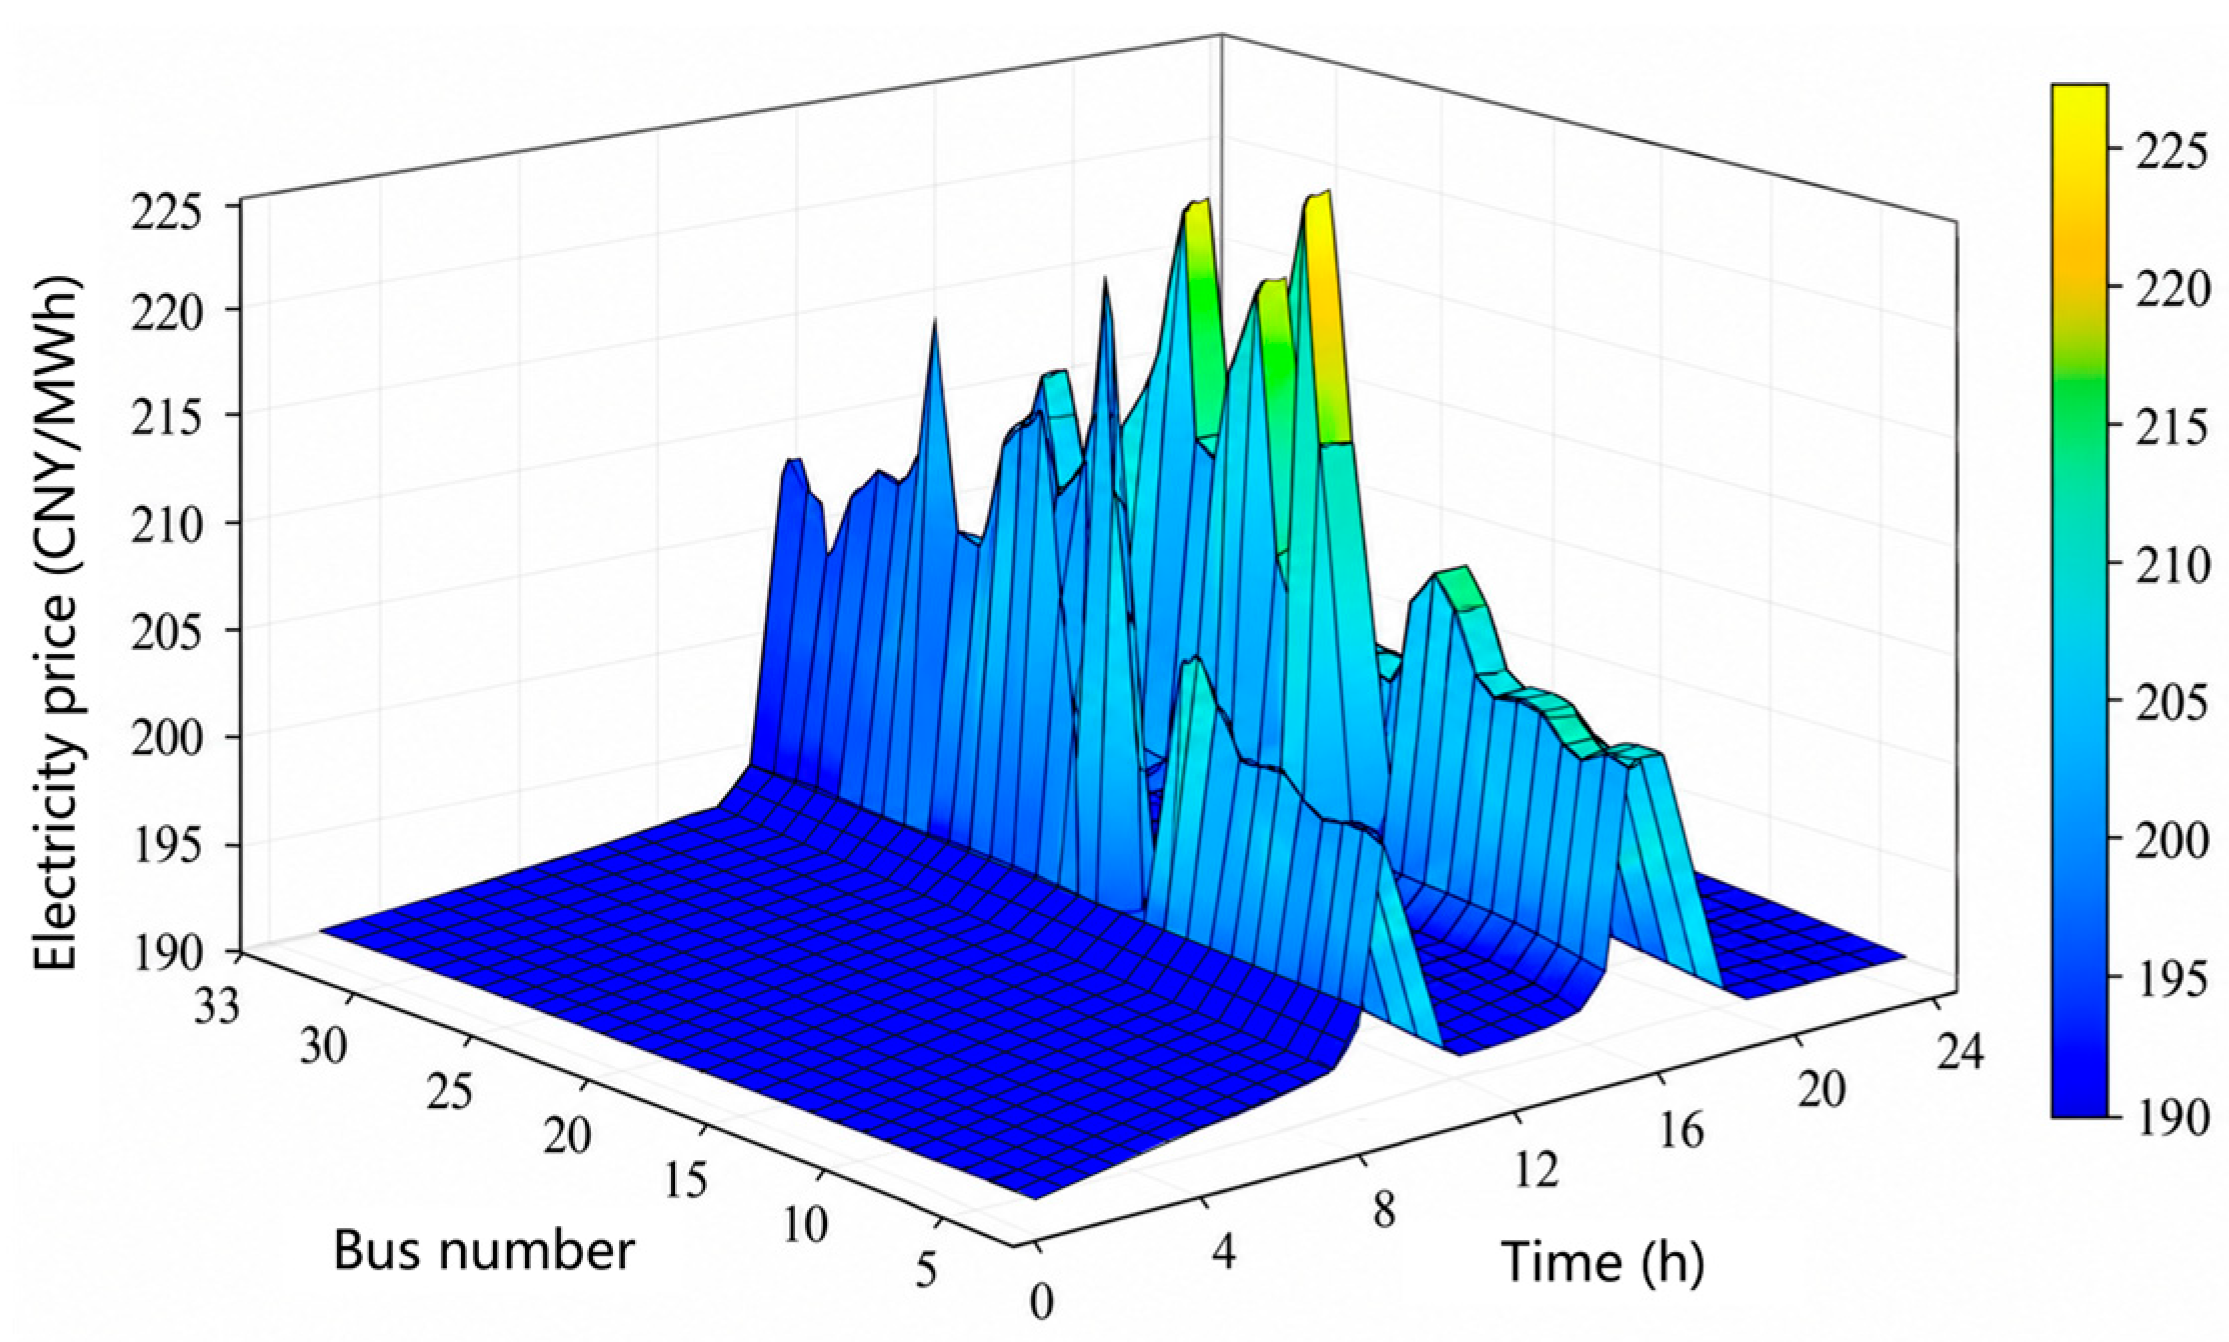
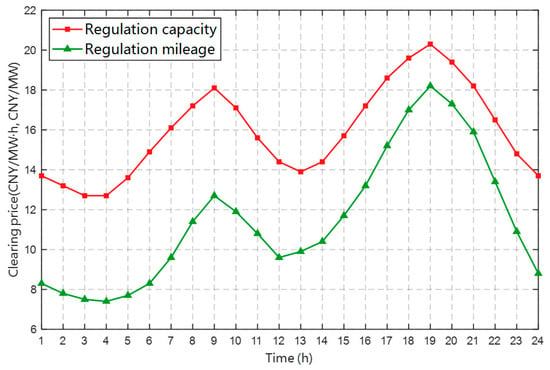
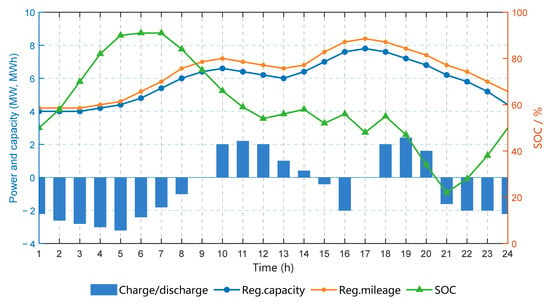
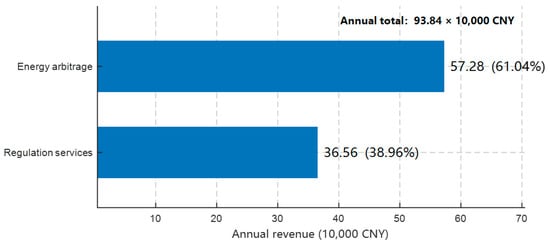

Disclaimer/Publisher’s Note: The statements, opinions and data contained in all publications are solely those of the individual author(s) and contributor(s) and not of MDPI and/or the editor(s). MDPI and/or the editor(s) disclaim responsibility for any injury to people or property resulting from any ideas, methods, instructions or products referred to in the content. |
© 2026 by the authors. Licensee MDPI, Basel, Switzerland. This article is an open access article distributed under the terms and conditions of the Creative Commons Attribution (CC BY) license.