


Abstract
Effective renewable energy policy requires benchmarks that reflect countries’ structural energy characteristics rather than generic performance rankings. This study develops an explainable machine-learning framework that identifies structurally comparable peers and derives peer-relative priorities, using annual World Bank data for 37 Organisation for Economic Co-operation and Development (OECD) countries over 2010–2021. Thirteen energy, economic and demographic indicators are standardized and analysed with principal component analysis, Ward hierarchical clustering and cosine similarity, supported by bootstrap, density-based, temporal, scaling and leave-one-country-out robustness checks. Random Forest with Gini, permutation and SHAP importance is used descriptively to characterize the clusters, and directionally filtered standardized gaps between Türkiye and its closest peer form a Strategic Gap Priority Index (SGPI). Three weakly separated regimes emerge: renewable-intensive economies, larger urbanized fossil-based economies, and less urbanized lower-income economies. Under historical averages, Türkiye and the United Kingdom are mutually closest peers, and coal-based electricity generation and net energy import dependence are the two leading SGPI priorities under all weighting schemes tested. These results are conditional on the profile definition: adding annual trends makes Hungary the closest peer, and excluding hydropower makes non-hydro renewable generation the second priority.
1. Introduction
The global energy transition has accelerated as countries seek to reduce greenhouse gas emissions while strengthening energy security and long-term sustainability. However, transition pathways remain highly heterogeneous because countries differ in their energy infrastructures, resource endowments, economic structures, and dependence on fossil fuels [1]. Even within the comparatively homogeneous group of Organisation for Economic Co-operation and Development (OECD) economies, the share of renewables in electricity generation ranges from near-complete renewable systems to systems still dominated by coal and natural gas, and net energy import dependence ranges from net exporter positions to values above 70% of energy use. This heterogeneity limits the effectiveness of uniform policy prescriptions and increases the need for transition strategies that reflect country-specific conditions [2]. For energy-policy analysts, country comparisons should help identify relevant peers and clarify which differences deserve further policy assessment. A framework that connects these tasks should therefore explain how the benchmark country is selected and why some gaps receive greater priority than others.
Multidimensional benchmarking provides a useful basis for identifying such differences and comparing countries with structurally relevant peers. Recent research shows that energy-transition performance cannot be adequately represented by a single indicator because countries differ simultaneously in energy efficiency, electricity generation structure, accessibility, emissions, and broader socioeconomic characteristics [3]. Accordingly, clustering and multidimensional assessment methods have increasingly been used to identify countries or regions with similar energy and sustainability profiles [4]. For OECD countries in particular, comparative benchmarking can reveal heterogeneous transition trajectories that may be obscured by aggregate rankings [5].
At the same time, artificial intelligence (AI) and machine learning (ML) are increasingly used in renewable energy systems for forecasting, optimization, and decision support [6]. Recent applications also demonstrate the value of combining clustering and ML to identify different energy-transition patterns and their underlying drivers [7]. Explainable and data-driven approaches are particularly relevant for policy analysis because identifying influential transition dimensions is more useful for decision makers than generating predictive outputs alone [8]. Nevertheless, benchmarking, structural similarity analysis, and ML-based characterization are still often treated as separate analytical tasks, and the step from “which countries are similar” to “which dimensions a particular country should prioritize” remains largely unformalized.
To address this gap, this study develops an explainable decision-support framework for renewable energy transition benchmarking across the OECD countries and applies it to Türkiye as an illustrative target country. Rather than asking only which countries perform best overall, the study asks which countries constitute structurally relevant benchmarks, and which energy-transition dimensions should receive greater strategic attention once such a benchmark has been identified.
The study makes four contributions:
- •
- It reframes cross-country energy benchmarking as a problem of structural comparability rather than performance ranking, and operationalizes this through multidimensional profiling, hierarchical clustering, and similarity analysis.
- •
- It uses three complementary variable-importance measures (Mean Decrease Gini, permutation importance, and SHapley Additive exPlanations (SHAP) values) with bootstrap confidence intervals as a descriptive tool to characterize transition profiles, and compares them with conditional permutation importance and simpler descriptive separation measures, so that the characterization does not depend on a single, potentially biased importance metric.
- •
- It proposes the Strategic Gap Priority Index (SGPI), a transparent and directionally filtered heuristic that combines standardized benchmark gaps with ML importance to rank policy-actionable dimensions for a target country.
- •
- It subjects the cluster structure, the benchmark identification and the priority ranking to an extensive robustness protocol—internal validity indices, bootstrap Jaccard stability, density-based re-clustering, alternative distance metrics, scaling procedures and indicator transformations, temporal subsamples, leave-one-country-out resampling and alternative weighting schemes—and reports explicitly which results are conditional on how country profiles are defined.
The remainder of the paper is organized as follows. Section 2 reviews the literature on cross-country energy benchmarking, AI-based energy decision support, and the translation of benchmarking results into strategic priorities. Section 3 describes the data and the analytical framework. Section 4 reports the empirical results. Section 5 discusses the findings, their policy implications, and the study’s limitations. Section 6 concludes the paper.
2. Literature Review
2.1. Renewable Energy Transition and Cross-Country Benchmarking
The renewable energy transition is a multidimensional process shaped by differences in national energy structures, resource availability, economic conditions, and policy environments. Consequently, countries following similar decarbonization objectives may exhibit substantially different transition pathways and constraints. Bigerna et al. [1], for example, demonstrate how fossil-fuel dependence and resource structures can create persistent barriers to energy transition. Complementing this perspective, Liu et al. [9] show across 21 Asia–Pacific Economic Cooperation (APEC) economies that energy-transition and energy-efficiency outcomes are closely associated with economic productivity and industrial structure, emphasizing that transition performance should be interpreted within broader country-specific structural conditions. Such structural heterogeneity highlights the importance of evaluating countries within their specific energy-system contexts rather than relying solely on aggregate performance rankings.
This multidimensional perspective also extends to energy security. Habibi and Barkhordar [10] demonstrate that renewable energy transition pathways involve important trade-offs among renewable deployment, import dependence, material availability, and system-level energy security. Their findings further support the need to evaluate transition pathways through multiple interconnected energy-system dimensions rather than renewable penetration alone.
Cross-country benchmarking provides a systematic approach for identifying these structural similarities and differences. Shabanpour et al. [5] evaluate decarbonization performance across OECD countries using energy-efficiency and emission dimensions, illustrating the value of comparative assessment for distinguishing national transition trajectories. Similarly, Gouveia and Henriques [4] combine efficiency assessment with cluster analysis to identify groups of European countries exhibiting comparable low-carbon characteristics. Sompolska-Rzechuła et al. [11] further demonstrate that typological methods can reveal distinct energy-economic country profiles that may not be apparent from individual indicators.
Related evidence further demonstrates the usefulness of multidimensional benchmarking across different geographical and sectoral contexts. Halkos et al. [12] combine eco-efficiency benchmarking with convergence analysis for the green transition, while Phan and Hufnagel [13] and Rađenović et al. [14] employ multi-indicator frameworks to compare sustainability and transition trajectories. More broadly, Visbal-Cadavid et al. [15] demonstrate the value of multivariate approaches for identifying structural patterns within complex sustainability systems.
Recent research has therefore moved toward multidimensional and cluster-based benchmarking rather than simple country rankings. Chen et al. [7] combine clustering with ML to identify heterogeneous energy-transition patterns and investigate their underlying drivers. This literature suggests that identifying structurally comparable countries can provide a more meaningful basis for policy learning. However, benchmarking studies generally emphasize classification or relative performance, with less attention to identifying the most strategically relevant peer country and quantifying the differences between a country and that peer.
2.2. Artificial Intelligence and Data-Driven Energy Decision Support
AI and ML have become increasingly prominent in energy research, particularly for forecasting, optimization, system management, and renewable energy integration. Saadi et al. [6] document the expanding application of AI across different dimensions of the renewable energy transition, while recent reviews further emphasize its growing role in sustainable energy modelling, optimization, governance, and photovoltaic systems [16,17]. Adefarati et al. [18] similarly show how AI-enabled technologies can support the operation and management of renewable-dominant power systems. Recent applications extend these techniques to renewable generation, load forecasting, carbon-emission prediction, and energy-transition forecasting [19,20,21].
Beyond forecasting, AI is increasingly being incorporated into strategic energy analysis and decision-support applications. Asraf et al. [22] develop an ML framework linking electricity and economic conditions to support regional energy-transition planning. Mizrak and Yasar [8] apply an explainable decision-support framework to strategic energy investment prioritization across countries, illustrating how data-driven methods can translate multidimensional information into interpretable priorities. Chen et al. [7] further demonstrate how ML can be combined with clustering to identify the drivers underlying different energy-transition patterns. The growing integration of AI with energy-policy analysis further indicates its potential to connect computational insights with broader environmental, socioeconomic, and policy objectives [23,24]. Explainable methods have also been applied to Türkiye specifically: Adıgüzel Tüylü [25] uses SHAP and LIME to interpret the drivers of primary energy consumption in Europe and Türkiye and finds that fossil-fuel reliance and income still dominate Turkish energy demand.
Despite these developments, the strategic value of ML depends on interpretability. For policy applications, identifying the variables that distinguish countries or transition pathways can be more informative than predictive accuracy alone. Accordingly, explainable methods such as SHAP [26] can support policy-relevant interpretation of computational results. However, reliance on a single importance measure can be misleading: impurity-based measures may favour variables with many distinct values, while correlated predictors can complicate importance attribution [27]. These limitations warrant consideration when interpreting cross-country indicator data. In the present study, ML is therefore used for post-hoc characterization, supported by three complementary feature importance measures. The three measures provide complementary perspectives, although correlations among predictors may still complicate the interpretation of individual feature importance. The purpose is to describe observed patterns, rather than to estimate causal effects or prioritize predictive performance.
2.3. From Benchmarking to Country-Specific Strategic Priorities
A central challenge in energy-transition benchmarking is translating comparative results into actionable strategic information. Identifying a high-performing country does not necessarily imply that it constitutes an appropriate benchmark for another country, because differences in energy structure, demand, resource endowment, and economic conditions may limit policy transferability. Castrejon-Campos et al. [2] emphasize the importance of context-specific policy mixes in designing clean-energy transitions, demonstrating that policy effectiveness depends strongly on national structural conditions.
Recent decision-support studies have consequently moved toward multidimensional frameworks that integrate several criteria rather than relying on isolated performance indicators. Yüksel et al. [28], for example, use a multi-criteria decision-support framework to evaluate renewable-powered mobility investment strategies. Rafipour et al. [29] similarly integrate AI and multi-criteria analysis for renewable-energy planning, illustrating the increasing role of combined analytical frameworks in strategic energy decisions. Comparable decision-support applications have also been developed for equitable infrastructure planning and energy-system optimization, illustrating how multidimensional analytical frameworks can translate complex technical and socioeconomic information into policy-relevant priorities [30,31].
A related development is the use of clustering not only for descriptive segmentation but also as a basis for differentiated policy design. Sadabadi and Rahimirad [32], for example, employ hierarchical agglomerative clustering to identify heterogeneous solar-adoption profiles and subsequently link these profiles to targeted policy instruments. Although their analysis focuses on household-level prosumer behaviour, it demonstrates the broader potential of cluster-based segmentation to translate heterogeneous energy profiles into differentiated policy strategies.
However, despite these advances, an important gap remains at the cross-country level between structural classification, benchmark identification, and country-specific strategic prioritization. Existing studies generally address these tasks separately: clustering identifies similar groups, benchmarking compares performance, and ML identifies influential variables. The closest precedent to the present study is Mizrak and Yasar [8], who construct an explainable multi-criteria framework for energy investment prioritization across countries. The present framework differs from that work in three respects. First, priorities are derived relative to an endogenously identified structural peer rather than against the full country sample or an externally imposed criteria hierarchy. Second, the framework weights benchmark gaps according to each indicator’s importance in distinguishing the observed country groups. This differs from Mizrak and Yasar [8], who assess investment readiness using an equal-weight baseline and objective weighting benchmarks. The weights used here reflect structural differences between country profiles; they do not measure the effectiveness of the policy interventions. Third, the prioritization step is explicitly directional, distinguishing gaps in which the benchmark is more favourable from gaps that merely reflect differences in scale or demand.
The present study therefore integrates structural profiling, peer identification, explainable characterization, and directional gap prioritization within a single reproducible workflow. The resulting contribution is a peer-relative screening procedure: it identifies dimensions on which a target country is less favourably positioned than a structurally comparable country and ranks those differences for further policy assessment.
3. Data and Methodology
3.1. Research Design
This study employs a multidimensional data-driven framework to benchmark renewable energy transition profiles across OECD countries and identify structurally relevant peers for policy learning. The analytical workflow integrates descriptive analysis, dimensionality reduction, hierarchical clustering, similarity analysis, robustness assessment, and post-hoc ML interpretation. Rather than constructing a single performance ranking, the framework evaluates countries according to their broader energy-system structures and subsequently identifies the dimensions that differentiate Türkiye from its most comparable benchmark.
The analysis proceeds in four stages. First, country-level structural profiles are constructed from standardized energy, economic, and demographic indicators. Second, multivariate and clustering techniques are used to identify similarities and heterogeneous country groups. Third, cosine similarity is applied to identify Türkiye’s structurally closest benchmark, with alternative distance metrics and scaling procedures used for robustness assessment. Finally, Random Forest classification with three complementary importance measures is used to characterize the variables associated with the identified cluster structure, while directionally filtered standardized benchmark gaps are used to derive strategic priority dimensions. Figure 1 summarizes the workflow.
Figure 1.
Workflow diagram.
3.2. Data Collection and Variables
The empirical analysis uses publicly available indicators from the World Bank Open Data database [33]. The initial sample covered all current OECD member countries; Iceland was excluded because of substantial missingness in several key indicators, resulting in a final sample of 37 countries. Because the sample is defined by current membership, it includes Colombia and Costa Rica, which acceded to the OECD in 2020 and 2021 respectively; they are retained because the analysis characterizes structural energy-system profiles rather than the effects of OECD membership.
The analysis covers the period 2010–2021. The starting year of 2010 was chosen to focus on the contemporary phase of the renewable energy transition and to avoid comparability problems associated with substantially different earlier technological and institutional conditions. The endpoint was determined by joint data availability rather than by design: 2021 is the most recent year for which all thirteen indicators are reported for all 37 countries. From 2022 onwards the renewable shares of electricity output (EG.ELC.RNEW.ZS) and of final energy consumption (EG.FEC.RNEW.ZS) are not reported for any of the 37 countries, the coal share of electricity output (EG.ELC.COAL.ZS) is missing for five countries and the natural-gas share (EG.ELC.NGAS.ZS) for one; energy intensity is unavailable from 2023, and net energy imports and electricity access from 2024 (Table A6). Extending the window would therefore require either imputation of entire indicator-years or a reduced indicator set, and either would compromise the comparability of the distance-based analyses. Supplementary sources were considered but not combined with the World Bank series: Ember reports electricity-generation shares but not the renewable share of final energy consumption, net energy imports or energy intensity, and the International Energy Agency’s energy balances are not openly available; mixing sources would combine different definitions and statistical boundaries within a single country profile.
Thirteen indicators were used to represent energy intensity, electricity access and generation structure, renewable energy deployment, energy dependence and consumption, and relevant economic and demographic characteristics. Complete definitions, World Bank indicator codes, units, and dimensions are reported in Appendix A (Table A1), and descriptive statistics are reported in Table A2. Because the objective is to compare long-term structural characteristics rather than short-term annual fluctuations, observations were averaged at the country level over 2010–2021. The World Bank data were extracted on 1 July 2026; the urbanization rate (main specification) and the non-hydro renewable electricity share (sensitivity analysis) were retrieved from the same database in October 2026. Country–indicator averages for 2010–2021 were calculated using arithmetic means. Inclusion required complete annual data for all thirteen indicators over this period. No annual observations were missing in the final sample; therefore, no imputation was required. All 481 country–indicator averages (37 countries × 13 indicators) were based on the full 12 annual observations, with no exceptions. The stated coverage, including the 2021 endpoint, was verified with a year-by-year completeness check, which showed that 2021 is the most recent year for which all 481 values are available. This design choice means that the analysis characterizes the structural configuration of national energy systems rather than the dynamics of transition; the implications of this are addressed in Section 5.5, and a trend-based sensitivity analysis is reported in Appendix C.
The indicator set was selected to cover the dimensions through which energy-transition performance is commonly assessed. The World Economic Forum’s Energy Transition Index evaluates energy-system performance along security, equity and sustainability dimensions [34], and the quantitative targets of Sustainable Development Goal 7 concern access to electricity, the renewable share of final energy consumption and the improvement of energy intensity [35]. Accordingly, the thirteen indicators form five groups (Table A1). (i) Decarbonization of supply is represented by the renewable shares of final energy consumption and electricity generation and by the shares of coal, natural gas and oil in electricity output. (ii) Efficiency and demand are represented by energy intensity and by per-capita electricity consumption and energy use. (iii) Supply security is represented by net energy import dependence, which, together with the composition of the generation mix, is among the most widely used quantitative proxies of energy security [36,37,38]. (iv) Access is represented by the share of the population with electricity. (v) Socioeconomic and scale context is represented by GDP per capita, total population (in logarithms) and the urbanization rate, which condition energy demand and the size of national energy systems. Three practical criteria guided the final choice: each indicator has a clear transition direction or a clearly contextual role (Section 3.4.4); all indicators come from a single harmonized source with consistent definitions across countries; and each is available for all countries and years, which distance-based methods require. Emissions were not included in the main specification because, in an energy-system profile, they are largely an outcome of the generation mix and energy use already represented; CO2 emissions per capita is added as a sensitivity analysis (Section 4.6). Dimensions that are central to transition analysis but not available on this basis—energy prices and taxation, policy-instrument coverage, grid flexibility and storage—are discussed in Section 5.5.
3.3. Data Preprocessing and Variable Screening
The indicator datasets were harmonized using common country-year identifiers and merged into a unified panel. Missingness was assessed at both the variable and country levels before constructing country profiles. No statistical imputation was introduced into the main analysis; instead, the final analytical sample was restricted to countries with complete annual data for all thirteen indicators over 2010–2021 (Section 3.2).
Three preprocessing decisions require explicit justification because they affect all distance-based results.
First, total population and urban population are almost perfectly correlated in the sample (r = 0.998), so including both counts, as in the original submission, would give demographic scale double weight in every distance and similarity calculation. The main specification therefore represents demographic scale by the logarithm of total population and urban structure by the urbanization rate (urban population as a share of the total, SP.URB.TOTL.IN.ZS). The logarithm also limits the influence of the United States, whose population is about two and a half times that of the next-largest country in the sample. The specification with the two population counts is reported as sensitivity specification (i) in Table A13, together with specifications that use log population alone (vi) or the urbanization rate alone (vii). All three retain the UK as Türkiye’s benchmark and coal-based generation as the leading priority, although cluster membership changes (Table A18). Population and urbanization contribute to structural profiling but are not assessed as SGPI priority dimensions (Section 3.4.4).
Second, access to electricity is close to invariant across OECD countries (mean 99.9%, standard deviation 0.31 percentage points, minimum 98.2%; Table A2), so it can contribute little to structural differentiation; consistent with this, it ranks last among the thirteen indicators under both Gini and SHAP importance (Section 4.4). The variable is retained in the main specification for completeness, and results excluding it are reported in Appendix C (Table A13).
Third, net energy imports range from −616% to 108% of energy use (standard deviation 127.65; Table A2) because four countries—Norway, Colombia, Australia and Canada—are net energy exporters, and Norway alone obtains a z-score of −5.0. These values inflate the standard deviation and compress the z-scores of the importing countries: Türkiye (75.4%) and the UK (39.6%) obtain z-scores of only 0.43 and 0.15. The effect on benchmark identification is small, because net imports contribute 0.010 of the Türkiye–UK cosine similarity of 0.784, and the leave-one-country-out procedure, which removes each net exporter in turn and recomputes the z-scores, retains the UK in every replication. In the SGPI, however, the compression understates the import gap. Four alternative treatments are therefore reported in Table A13: net imports truncated at zero, which turns the indicator into a bounded import-dependence share between 0% and 100% (specification a); winsorized at the 5th and 95th percentiles (b); converted to rank-based normal scores (c); and all thirteen indicators converted to rank-based normal scores (d).
Country-level averages were then standardized using z-scores,
where denotes the value of indicator j for country i, and and denote its cross-country mean and standard deviation, respectively. Standardization prevents indicators with larger numerical scales from disproportionately influencing distance-based analyses. Min–max and robust median/interquartile range (IQR) scaling were additionally examined as sensitivity specifications.
3.4. Analytical Framework
3.4.1. Multivariate Structure and Clustering
Principal Component Analysis (PCA) [39] was first applied to examine the dominant dimensions of cross-country variation and to support visualization of the multidimensional indicator space. Country groups were subsequently identified using agglomerative hierarchical clustering based on Euclidean distances and Ward’s minimum-variance criterion [40], implemented through the Ward.D2 algorithm, which applies the squared-distance updating rule consistent with Ward’s original objective function [41]. Clustering was performed on the full set of standardized indicators rather than on principal-component scores, so that the resulting groups remain directly interpretable in terms of the original indicators. PCA was used for description and visualization only; because clustering, similarity and the SGPI are computed on all thirteen standardized indicators, the number of retained components does not enter any subsequent step. The cumulative-variance rule (commonly set between 70% and 90% [42]), the Kaiser criterion (eigenvalues greater than one [43]) and Horn’s parallel analysis [44] are nevertheless reported in Table A4, and clustering and benchmarking based on principal-component scores are reported in Table A5.
Candidate cluster solutions were evaluated using multiple complementary internal validation criteria, including average silhouette width [45], the Calinski–Harabasz index [46], the Davies–Bouldin index [47], and the Dunn index [48]. Because individual validity indices may favour different levels of cluster granularity, cluster robustness was additionally assessed using bootstrap Jaccard stability [49] with 500 resamples, cluster-size distributions, and the occurrence of singleton clusters. As a supplementary reproducibility diagnostic, Random Forest out-of-bag (OOB) classification accuracy was used to assess the extent to which the original indicator space could reproduce the resulting cluster assignments. The final number of clusters was selected through joint consideration of internal validity, resampling stability, reproducibility, parsimony, and substantive interpretability rather than optimization of any single criterion.
Cluster profiles are described using standardized indicator means and rank-based effect sizes. Table A8 also report exploratory Kruskal–Wallis results, with p-values adjusted using the Benjamini–Hochberg procedure. The same indicators were used to form the clusters and compare them, so these tests cannot independently validate the separation between groups. Adjusting for multiple comparisons does not resolve this dependence.
Uniform Manifold Approximation and Projection (UMAP) [50] was used as a nonlinear two-dimensional representation of the country profiles (parameters: n_neighbors = 8, min_dist = 0.15, metric = Euclidean) for visualization rather than as the basis for cluster estimation; with only 37 observations, UMAP embeddings are sensitive to parameter choice and are interpreted here as descriptive only. Hierarchical Density-Based Spatial Clustering of Applications with Noise (HDBSCAN) [51] (minPts = 4) was employed as an exploratory density-based robustness check to assess whether similar local structures emerged without imposing the hierarchical clustering solution.
3.4.2. Benchmark Identification and Robustness
Pairwise cosine similarity was calculated from the standardized country profiles to identify structurally comparable countries. For countries i and j, cosine similarity is defined as
Because the profiles are z-scored, the origin of the vector space is the OECD mean, so measures the extent to which two countries deviate from the OECD average in the same direction across the thirteen dimensions, rather than their absolute proximity. This is the intended notion of structural comparability: two countries are treated as peers when their energy systems depart from the OECD norm in a similar configuration. Because cosine similarity is insensitive to the magnitude of deviation, Euclidean and Manhattan distances—which are magnitude-sensitive—are reported alongside it as convergent measures.
Türkiye’s highest-scoring peer was treated as its primary structural benchmark. The robustness of this benchmark was evaluated in four ways: (i) alternative similarity and distance metrics; (ii) alternative scaling procedures (z-score, min–max, robust median/IQR); (iii) temporal subsamples (2010–2014 and 2015–2021); and (iv) a leave-one-country-out (LOCO) procedure in which each of the 35 remaining comparator countries was sequentially excluded while retaining Türkiye and the benchmark. In the LOCO procedure, standardization was recomputed within each reduced sample before recalculating similarities, so that the exclusion of a third country genuinely alters the geometry of the indicator space; without re-computation the test would be uninformative, because the pairwise cosine between two fixed vectors is invariant to the removal of other observations.
3.4.3. Post-Hoc ML Interpretation
Random Forest classification [52] was used to characterize the indicator structure associated with the hierarchical clusters (ntree = 1000, mtry = 3, standard bootstrap sampling over all 37 countries). Importantly, the model was not interpreted as an independent predictor of future transition performance or as evidence of causal relationships; rather, it served as a post-hoc explanatory tool for identifying variables that differentiate the observed country groups. Because the cluster labels are derived from the same indicators, the out-of-bag (OOB) accuracy reported below should be read as a reproducibility diagnostic for the cluster assignment rather than as a measure of predictive performance; the out-of-bag confusion matrix and per-class accuracies are reported in Appendix C (Table A14).
Variable relevance was evaluated using three complementary measures: Mean Decrease Gini, permutation importance (the increase in classification error when an indicator is randomly permuted, averaged over 50 repetitions), and SHAP values [26], computed with the kernelshap implementation using the 37 country profiles as background data. Impurity-based importance is known to be biased in the presence of correlated predictors and variables with differing numbers of distinct values [27]; reporting permutation and SHAP importance alongside it, and averaging ranks across the three measures, reduces reliance on any single metric. The stability of Random Forest importance estimates was additionally assessed through bootstrap resampling (300 replicates) and 95% confidence intervals.
SHAP values [26] attribute a model prediction to the input variables using the Shapley value from cooperative game theory [53]. Treating the indicators as players and the predicted class probability as the payoff, the contribution of indicator j to the prediction for country i is given by Equation (3), where P is the set of p indicators, S is a coalition of indicators not containing j, and fi(S) is the expected prediction for country i when only the indicators in S are known:
φij is therefore the average marginal contribution of indicator j over all orders in which the indicators can be added. Shapley values are the unique attribution that satisfies local accuracy (the contributions sum to the difference between the prediction for country i and the average prediction), consistency, and the property that an indicator that never changes the prediction receives zero [26,54]. Global importance is obtained as the mean absolute contribution across countries, (1/n)Σi|φij|, averaged over the three class probabilities. Because Equation (3) requires 2p coalitions, the values were estimated with KernelSHAP, which recovers Shapley values through a weighted linear regression over sampled coalitions [26,55]. SHAP is suitable for this study for three reasons: it is model-agnostic and can therefore be compared directly with Gini and permutation importance; unlike impurity-based importance, it does not favour indicators with many distinct values; and it provides country-level attributions that can be inspected. Its main limitation is that KernelSHAP replaces absent indicators with values drawn independently from the background data, so with strongly correlated indicators the attribution can be shared among, or shifted between, correlated variables [56]. SHAP values are therefore read as descriptions of how the fitted classifier uses the indicators, not as causal effects, and they are combined with the other two measures rather than interpreted alone.
Because the forest is trained on few observations and strongly correlated indicators, three additional checks were performed (Table A17). First, conditional permutation importance [27], which permutes each indicator only within strata defined by its correlated indicators, was computed from a conditional inference forest (1000 trees, mtry = 3). Second, the combined importance ranking was compared with simpler descriptive measures of how strongly each indicator separates the clusters: the Kruskal–Wallis ε2, the analysis-of-variance (ANOVA) η2, and the absolute difference between the means of the two largest clusters. Third, the forest was re-estimated on the two largest clusters only, and a nearest-centroid classifier was evaluated by leave-one-out cross-validation as a simpler benchmark.
3.4.4. Strategic Gap Prioritization
After identifying Türkiye’s primary benchmark, standardized indicator gaps were calculated to quantify the magnitude of structural differences between the two countries. The Strategic Gap Priority Index (SGPI) for indicator j is defined as
where ∈ [0, 1] is the absolute standardized gap between the target country and its benchmark divided by the largest such gap, ∈ [0, 1] is the indicator’s combined ML importance—the mean of its max-normalized Gini, permutation and SHAP importances—divided by the largest value among the policy-actionable indicators, and ∈ {0,1} is a direction indicator.
The structure of the index follows importance–performance analysis [57], which prioritizes attributes by jointly considering the size of the performance gap and the attribute’s importance. The multiplicative form implements a conjunctive rule: a dimension receives high priority only when the gap is large and the dimension is relevant, whereas an additive form would allow a large value on one component to compensate for a negligible value on the other. Max-normalization places both components on a common [0,1] scale without altering their ordering. The weight Ij measures how strongly an indicator separates the structural regimes; applied to a within-regime comparison, it gives more weight to gaps along the dimensions that define transition pathways across the OECD. Because other weights are equally defensible for a within-regime comparison, these choices are examined explicitly in the sensitivity analysis described below.
Two filters are applied through . First, four of the thirteen indicators—access to electricity, GDP per capita, population and the urbanization rate—are treated as contextual rather than policy-actionable: they describe the structural setting within which energy policy operates but are not instruments of energy-transition policy, and they are therefore assigned = 0. Second, among the nine remaining energy-system indicators, = 1 only when the benchmark’s position is more favourable with respect to transition objectives (a higher renewable share, a lower coal, oil or gas share, lower import dependence, or lower energy intensity). Gaps in which the target country is already better positioned than its benchmark are not treated as priorities. Per-capita electricity consumption and per-capita energy use are retained in the reported index for completeness but are interpreted separately in Section 4.5, because a lower per-capita value is not in itself a transition deficit; these two dimensions are read as indicators of demand-convergence pressure rather than as gaps to be closed.
To evaluate ranking sensitivity, the directional index was compared with three alternative formulations: an undirected multiplicative index in which = 1 for all nine indicators, a gap-only index, and an equal-weight additive index (Table A12). The SGPI is interpreted as a decision-support heuristic for prioritizing structural differences, rather than as an estimator of causal policy effects. A low SGPI value indicates only that the joint product of gap size and differentiating importance is small; it does not imply that the dimension is politically or economically unimportant.
Because the central question is whether the directional ranking depends on how gaps are measured and weighted, the main index (D) was also compared with six directional variants that retain Dj (Table A16): (E) the gap alone, Dj × Gj; (F) an equal-weight additive form, Dj × (0.5Gj + 0.5Ij); (G) weights based on PCA communalities on the components retained by the Kaiser criterion, which measure the share of an indicator’s variance lying on the main structural axes of the full sample; (H) objective-balanced weights that give equal weight to decarbonization, supply security and efficiency, split equally among the indicators of each objective; (I) a within-regime gap, in which the Türkiye–benchmark difference is divided by the indicator’s standard deviation within Türkiye’s own cluster; and (J) the within-regime gap multiplied by Ij. Agreement among the variants was summarized by Kendall’s W. In addition, 10,000 weight vectors were drawn from a flat Dirichlet distribution and applied to the standardized gaps of the directional indicators, to determine how often each indicator ranks first irrespective of the weighting scheme.
3.5. Reproducibility
All statistical analyses were conducted in R version 4.6.0 using RStudio 2026.06.0+242 (Posit Software, PBC, Boston, MA, USA), with a fixed random seed (123) to ensure the reproducibility of stochastic procedures. The principal packages used were tidyverse (2.0.0), cluster (2.1.8.2), factoextra (2.1.0), fpc (2.2.14), clusterCrit (1.3.0), proxy (0.4.29), randomForest (4.7.1.2), iml (0.11.4), kernelshap (0.9.1), uwot (0.2.4), dbscan (1.2.5), mclust (6.1.2) and effectsize (1.0.2). The analytical workflow documents the World Bank indicator codes and data sources, country inclusion criteria, data preprocessing and standardization procedures, model specifications and parameters, package versions, and random seed settings, so that the empirical results can be reproduced from the sources reported in Table A1. Conditional permutation importance was computed with party (1.3.23). Generative AI tools were used only in a supporting role during manuscript preparation. One author (T.E.Y.) used Claude (Anthropic) for language editing. Another author (M.A.) used ChatGPT (OpenAI) to review the manuscript and to suggest revisions to the methodological explanations and policy discussion, including selected numerical consistency checks and the identification of supporting sources. GenAI tools were not used to collect or generate data, to design the study or to perform the statistical analyses, which were conducted in R as described above. All AI-assisted suggestions were reviewed and verified by the authors, who take full responsibility for the content of this article.
4. Results
4.1. Multivariate Structure of OECD Energy-Transition Profiles
Figure 2 presents the correlation structure among the thirteen energy-transition indicators. Several groups of strongly associated variables are evident. The two renewable indicators move together (r = 0.78 between renewable electricity generation and renewable energy consumption), as do the scale-related consumption and income variables (electricity consumption per capita and energy use per capita, r = 0.86; electricity consumption per capita and GDP per capita, r = 0.71; energy intensity and energy use per capita, r = 0.66). Fossil and renewable dimensions are inversely related, most strongly for coal (r = −0.61 with renewable electricity) and natural gas (r = −0.52 with renewable energy consumption). Import dependence is negatively associated with renewable energy consumption (r = −0.46) and with per-capita electricity consumption (r = −0.53). Log population and the urbanization rate, which represent demographic scale and urban structure in the main specification, replace the two population counts of the original submission, which were almost perfectly correlated (r = 0.998; Section 3.3). Overall, the correlation pattern is consistent with interrelated dimensions of energy production, consumption, and economic structure and supports using multivariate methods to examine national energy-transition profiles.
Figure 2.
Correlation matrix of renewable energy transition indicators across OECD countries.
Figure 3 reports the proportion of variance explained by the principal components. The first component accounts for 29.3% of total variance, the second for 20.7%, the third for 13.9%, and the fourth for 11.5%; the first two components jointly explain 50.0% and the first four explain 75.5%, while six components (86.0%) are required to exceed the commonly used 85% threshold. Retention rules differ in their recommendation: the Kaiser criterion retains four components and parallel analysis three (Table A4). No single component dominates, confirming that cross-country differences in energy-transition structure are genuinely multidimensional and cannot be collapsed into a one-dimensional performance ranking without substantial information loss. Because PCA is used here only for description and visualization, the choice of retention rule does not affect the subsequent results. Repeating the Ward clustering on the scores of the first three components reproduces the main partition exactly (adjusted Rand index = 1.000), and four components reproduce it closely (0.910); with six components the partition differs more (0.351), but the UK is again Türkiye’s closest peer under both cosine similarity and Euclidean distance (Table A5). With two to four components the closest peer changes (to Hungary or Greece), because components on which Türkiye differs from these countries are discarded. Component loadings are reported in Appendix A (Table A3).
Figure 3.
Explained variance of the principal components derived from the standardized energy transition indicators.
The PCA projection in Figure 4 illustrates substantial heterogeneity among OECD countries while also revealing groups with relatively similar multidimensional profiles. Norway, Canada, Sweden, Finland and Luxembourg occupy the negative region of the first component, and Mexico, Greece, Türkiye, Italy, Israel and Japan its positive region. The second component separates Colombia and Costa Rica, at its positive end, from the United States, Korea and Australia at its negative end, which anticipates the cluster structure reported below.
Figure 4.
PCA map of OECD countries based on standardized energy transition indicators.
4.2. Cluster Selection and Structural Transition Profiles
As shown in Table 1, the internal validity indices do not identify a clearly superior number of clusters, and average silhouette widths are low for all five solutions (0.159–0.207). The two-cluster solution has the highest silhouette width (0.207), Calinski–Harabasz index (8.47) and mean bootstrap Jaccard coefficient (0.676), but it separates only the nine renewable-intensive economies from the remaining 28 countries. That residual group would combine large, urbanized, fossil-based and import-exposed economies with less urbanized, lower-income economies, which differ markedly in population scale, urbanization, income and the role of natural gas in electricity generation; the two-cluster solution also has the lowest out-of-bag accuracy among the solutions without singleton clusters (89.2%). The k = 8 solution yields the highest Dunn index (0.374), the lowest Davies–Bouldin index (0.996) and the highest minimum bootstrap Jaccard coefficient (0.609), but it contains two singleton clusters, as does k = 6. Between the remaining solutions, k = 3 and k = 4 have almost the same silhouette width (0.169 and 0.172); k = 3 has the higher mean bootstrap Jaccard coefficient (0.554 against 0.544) and the higher out-of-bag accuracy (94.6% against 91.9%), whereas k = 4 has a lower Davies–Bouldin and a higher Dunn index.
Table 1.
Comparative Validation, Stability, and Reproducibility of Alternative Hierarchical Clustering Solutions.
The three-cluster solution was retained on grounds of parsimony and interpretability: it is the coarsest solution that separates the renewable-intensive economies from two distinct fossil-based groups, and it contains no singleton cluster. This choice should not be read as evidence of a well-defined three-group structure. It is, however, consequential only for the descriptive cluster narrative: benchmark identification does not depend on the clustering, and under the four-cluster solution the United Kingdom (UK) remains Türkiye’s benchmark and the same three leading priorities are recovered, with coal-based electricity generation first (Table A13, specification v).
Two properties of this solution should be stated explicitly. First, the level of separation is weak: an average silhouette width of 0.169 indicates little cluster structure, which is expected in a sample of structurally similar, mostly high-income economies, and means that the clusters should be read as broad structural regimes rather than as sharply bounded types. Second, resampling stability is limited: the mean bootstrap Jaccard coefficient is 0.554, and two of the three clusters fall below the 0.60 threshold commonly used to indicate instability (Table A7). Consistently, the exploratory density-based HDBSCAN analysis (minPts = 4) does not identify any dense cluster and classifies all 37 countries as noise (adjusted Rand index with the hierarchical solution = 0.000; Figure A1), indicating that the country profiles do not form clearly separated high-density groups.
Given the low ratio of cases to variables (37 to 13), a silhouette width of 0.169 and a minimum bootstrap Jaccard coefficient of 0.429, the clusters are best regarded as tentative structural regimes rather than robust classifications. Cluster membership is also sensitive to the variable specification: with the two population counts of the original submission, the solution is 27/9/1 and the United States forms a single-country cluster (Table A18). In every variable-set, transformation and sample variant in Table A13, however, Türkiye’s closest peer remains the UK. The benchmark identification, which does not depend on the clustering, is therefore the more robust of the two results, and the substantive conclusions of the paper rest primarily on it.
Table 2 reports the full cluster membership of all 37 countries, which is the basis for every subsequent step of the analysis.
Table 2.
Cluster membership of the 37 OECD countries under the retained three-cluster solution.
Cluster 1 (17 countries) contains most Western European economies together with the United States, Japan, Korea, Australia, Israel, Mexico and Chile, as well as Greece and Türkiye. It combines the largest population scale and an above-average urbanization rate with above-average shares of natural gas, oil and coal in electricity generation, below-average renewable shares and above-average import dependence. Cluster 2 (nine countries) groups the renewable-intensive economies: strongly above-average renewable electricity generation and renewable energy consumption, high per-capita electricity consumption and income, below-average coal and gas shares, and below-average import dependence. Cluster 3 (eleven countries) consists of Central and Eastern European, Baltic and Iberian economies together with Colombia and Costa Rica; it is characterized above all by a low urbanization rate, below-average income and per-capita energy consumption, and renewable shares at or slightly above the OECD average.
Unlike the original specification, in which the United States formed a single-country cluster, the revised specification no longer isolates the United States: it joins the larger fossil-based economies of Cluster 1, together with Türkiye and the UK. The classification problem is therefore no longer degenerate. The out-of-bag confusion matrix (Table A14) recovers 16 of the 17 countries in Cluster 1, all nine countries in Cluster 2 and 10 of the 11 countries in Cluster 3 (overall accuracy 94.6%), which should be read as a reproducibility diagnostic rather than as predictive performance.
Excluding the United States changes the cluster sizes (22/9/5) but neither Türkiye’s benchmark nor its leading priorities (Table A13, specification iii).
A Random Forest estimated on the two largest clusters alone reaches an out-of-bag accuracy of 96.4%, and its importance ranking correlates with the main ranking at ρ = 0.825 (Table A17).
Figure 5 and Table 3 summarize the profiles of the retained clusters. The renewable-intensive Cluster 2 differs from the other two groups mainly in its generation mix, per-capita consumption and income, whereas Clusters 1 and 3 differ mainly in population scale, urbanization, income and the role of natural gas in electricity generation. Net energy import dependence is above the sample average in Cluster 1 and below it in Cluster 2. These comparisons describe the groups formed in this analysis; they should not be read as independent statistical confirmation of the clustering.
Figure 5.
Standardized Energy-Transition Profiles of the Three OECD Country Clusters.
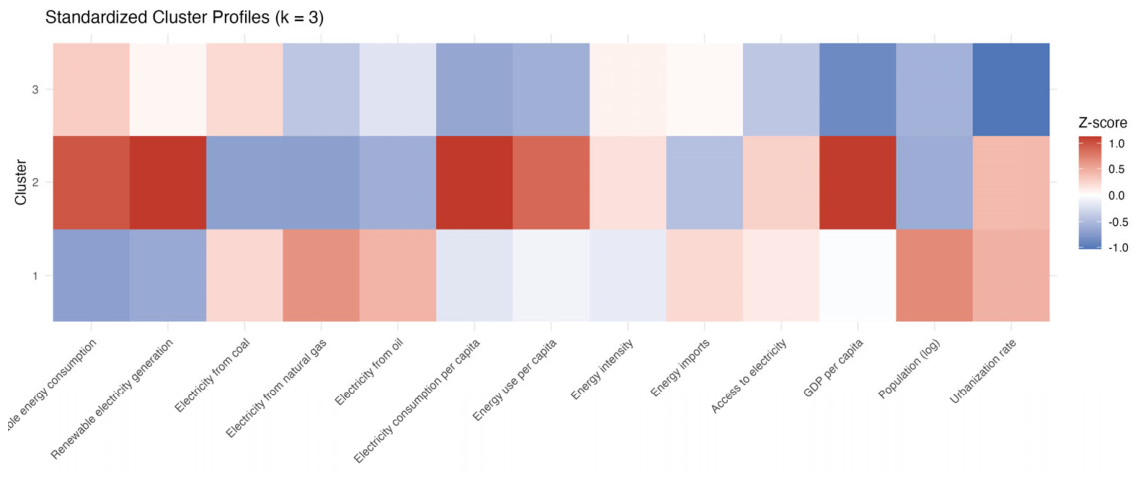
Table 3.
Cluster-level means of the standardized indicators.
The hierarchical structure shown in Figure 6 further illustrates the separation of the three country groups and shows that Türkiye and the UK merge at a low linkage distance within Cluster 1. The UMAP representation in Figure 7 provides complementary visual evidence, showing that countries assigned to the same hierarchical cluster generally occupy similar regions of the multidimensional space.
Figure 6.
Hierarchical clustering dendrogram of OECD countries based on standardized energy transition indicators and the selected three-cluster solution. Dashed boxes and branch colours identify the three retained clusters.
Figure 7.
UMAP Projection of OECD Countries According to the Selected Three-Cluster Solution.
4.3. Structural Similarity and Benchmark Identification
Figure 8 visualizes the similarity relationships among OECD countries based on their standardized energy-transition profiles, with each country linked to its nearest structural peer. The network reveals localized groups of structurally comparable countries—a Nordic–Canadian group, a Central and Eastern European group centred on Czechia and Estonia, a Baltic–Iberian chain, and pairs such as Italy–Spain and Korea–United States—and provides a complementary representation of the peer relationships identified through the multivariate analysis. Türkiye and the UK appear as a reciprocal pair in this network: each is the other’s nearest structural peer, so the relationship is mutual rather than one-directional. Reciprocity is a stronger condition than proximity, because a country can be the closest peer of another without the converse holding, and it is satisfied for only a subset of the pairs shown in Figure 8.
Figure 8.
Country similarity network based on standardized energy transition profiles.
Table 4 shows agreement in Türkiye’s benchmark identification across alternative similarity measures. The UK ranks first under cosine similarity, Euclidean distance, and Manhattan distance, while Spain ranks second under cosine similarity and Euclidean distance and Germany under Manhattan distance. Agreement between one direction-based and two magnitude-based measures supports identifying the UK as Türkiye’s closest structural benchmark within the OECD sample under the historical-average specification.
Table 4.
Türkiye’s Benchmark Robustness Across Alternative Similarity Specifications.
Importantly, the benchmark and the target country belong to the same structural cluster: both Türkiye and the UK are members of Cluster 1 (Table 2). The benchmark is therefore not an externally imposed high performer but a within-regime peer, which is the condition under which policy experience is most plausibly transferable.
The robustness of the benchmark identification was further assessed using the LOCO procedure, in which each of the 35 remaining comparator countries was sequentially excluded and the standardization and similarity computations were repeated within the reduced sample. Across all 35 replications, the UK remained Türkiye’s top-ranked benchmark (100% rank-1 retention).
The temporal robustness analysis provides further support for this result, as the UK remains Türkiye’s highest-ranked benchmark in both the 2010–2014 and 2015–2021 subperiods (Table A10). The benchmark identification is also robust to alternative scaling procedures, with the UK remaining Türkiye’s highest-ranked peer under z-score, min–max and robust median/IQR scaling (Table A11).
4.4. ML Characterization of Transition Profiles
Table 5 reports the three complementary importance measures and their average rank. GDP per capita is the most influential indicator (average rank 3.00), ranking first under Gini and SHAP importance, followed by renewable electricity generation (3.67), the urbanization rate (4.33), renewable energy consumption (5.00) and log population (5.67). The dimensions that most strongly separate the three regimes are therefore income, renewable penetration and demographic structure, whereas the fossil composition of the electricity mix, energy intensity and import dependence play a subordinate role (average ranks between 7.00 and 10.33).
Table 5.
Robust ML Characterization of Energy-System Indicators.
Gini and SHAP importance produce almost identical orderings, but this agreement should not be read as independent confirmation: both are computed from the same fitted forest, and both can attribute importance to correlated predictors in ways that do not isolate each indicator’s own contribution [27,56]. Permutation importance is uninformative in this setting: measured as the increase in classification error when an indicator is randomly permuted, it is zero for all thirteen indicators, because with strongly correlated indicators permuting any single indicator does not change the predicted cluster of any country. Conditional permutation importance, which permutes each indicator only within groups of countries with similar values of its correlated indicators [27], places renewable electricity generation, the urbanization rate and renewable energy consumption in the first three positions and GDP per capita fourth, and its ranking correlates with the combined importance at ρ = 0.945 (Table A17). The importance measures are therefore read as descriptions of which indicators separate the observed groups, not as evidence of causal drivers of transition outcomes [58].
Access to electricity ranks last under both Gini and SHAP importance. The variable spans only 1.8 percentage points across the entire sample (98.2% to 100%; Table A2), so it cannot plausibly carry substantive differentiating information, and it is excluded from the strategic prioritization step in Section 4.5 as a contextual indicator.
Bootstrap confidence intervals for Random Forest Gini importance are reported in Table A9. The intervals of the five leading indicators—the urbanization rate, renewable electricity generation, GDP per capita, renewable energy consumption and log population—overlap considerably, so their relative ordering should be read as indicative. The substantive conclusion supported by the data is the separation between this leading group and a trailing group comprising energy imports, energy intensity and access to electricity, whose mean importance is less than one-third of that of the three leading indicators.
The Random Forest ranking also agrees closely with simpler descriptive measures of separation: its Spearman correlation is 0.896 with the Kruskal–Wallis ε2 and 0.951 with ANOVA η2, but only 0.632 with the absolute difference between the means of the two largest clusters, which captures a single contrast rather than the separation of all three groups (Table A17). A nearest-centroid classifier reproduces the cluster labels with a leave-one-out accuracy of 97.3%, slightly above the forest’s out-of-bag accuracy of 94.6%. The classifier therefore adds little to the cluster means as a description of which indicators separate the regimes; its role in this study is limited to providing a single importance score that can be used as a weight in the SGPI, and Section 4.6 shows that the leading priorities do not depend on this weight.
4.5. Strategic Gap Prioritization for Türkiye
Figure 9 and Table 6 translate the identified Türkiye–UK structural differences into strategic priorities. Nine of the thirteen indicators are policy-actionable and enter the index; access to electricity, GDP per capita, population and the urbanization rate are excluded as contextual rather than policy-actionable dimensions (Section 3.4.4). Of the nine, four satisfy the directional condition that the benchmark is more favourably positioned.
Figure 9.
Strategic gap priority index for Türkiye (benchmark: the UK; k = 3 main solution).
Table 6.
Strategic Gap Priority Index for Türkiye relative to the UK benchmark.
Coal-based electricity generation is the leading priority by a wide margin (SGPI = 0.284). Türkiye’s coal share of electricity output exceeds the UK’s by 13.3 percentage points (31.3% against 18.0%), the largest standardized gap among the directional indicators (G = 0.951). Net energy import dependence follows (0.101), reflecting a gap of 35.8 percentage points (75.4% against 39.6%), with energy intensity (0.021) and natural-gas-based generation (0.005) completing the directional set. In both leading cases the priority is driven mainly by the size of the gap rather than by differentiating importance: coal and import dependence are only moderate differentiators of OECD transition regimes (I = 0.299 and 0.236).
This pattern reflects a central result of the analysis. Among the policy-actionable indicators, those that most strongly separate transition regimes—renewable electricity generation (I = 1.000) and renewable energy consumption (I = 0.882)—are precisely those on which Türkiye does not lag its benchmark. Türkiye’s renewable share of electricity output exceeds the UK’s by 6.1 percentage points (31.3% against 25.2%), and its renewable share of final energy consumption by 5.0 percentage points (12.9% against 7.9%); the direction filter therefore excludes both. This finding depends on how renewable electricity is defined: EG.ELC.RNEW.ZS includes hydropower, which accounts for a large share of Türkiye’s renewable generation, whereas the UK’s renewable expansion has been predominantly wind-based. When the hydro-excluding series is substituted, renewable electricity generation becomes Türkiye’s second priority, after coal-based generation and ahead of energy imports (Table A13, specification iv). The two definitions answer different questions—total renewable penetration versus non-hydro renewable deployment—and the difference between them is itself policy-relevant.
The per-capita indicators behave differently again. Türkiye’s electricity consumption per capita (3024 kWh) and energy use per capita (1665 kg of oil equivalent) are well below those of its benchmark (5078 kWh and 2745 kg), and energy use per capita records the largest standardized gap in the index (G = 1.000). A lower per-capita value is not a transition deficit, and these dimensions are not treated as policy targets. They are nevertheless strategically informative, because they quantify the extent of latent demand convergence: if Türkiye’s per-capita consumption moves toward the level of its closest structural peer, total demand will grow substantially, and coal displacement will have to be achieved against a rising rather than a static demand baseline.
The direction filter is therefore not a cosmetic adjustment. Without it, the ranking would be led by the renewable and per-capita dimensions, and the rank correlation between the undirected and the directional index is negative (ρ = −0.267; Table A12). Among the undirected formulations, the multiplicative and equal-weight additive indices produce similar orderings (ρ = 0.917), and both correlate moderately with the gap-only formulation (ρ = 0.650 and 0.567). The robustness of the directional ordering to alternative weighting schemes, indicator definitions and profile definitions is examined in Section 4.6.
4.6. Specification-Conditional Results
The benchmark and the priority ranking reported above are robust in several respects, but some results are conditional on how a country profile is defined and how the SGPI is weighted. Table 7 summarizes the specifications that change the substantive message, and Table A16 reports the directional SGPI variants.
Table 7.
Specification-conditional results for Türkiye’s closest peer and leading directional priorities.
Weighting: Coal-based generation and net import dependence are the two leading directional priorities in all seven SGPI variants (Table A16), and the rankings agree closely (Kendall’s W = 0.902). Coal ranks first in six variants; import dependence ranks first only under objective-balanced weights, which give import dependence—the only supply-security indicator—five times the weight of coal. Across 10,000 random weight vectors, coal ranks first in 67.1% of draws, import dependence in 29.2% and energy intensity in 3.8%; natural-gas-based generation never ranks first. Because the standardized coal gap is 2.2 times the import gap, import dependence ranks first only when it receives more than 2.2 times the weight of coal; energy intensity and gas would require 8.2 and 97.7 times. The robust conclusion is therefore that these two dimensions are Türkiye’s leading peer-relative priorities, while their relative order depends on how supply security is weighted against decarbonization.
Indicator transformations: Treating net imports as a bounded import-dependence share or as rank-based normal scores enlarges the import gap that the z-score compresses (Section 3.3), and import dependence then becomes the leading priority, followed by coal (Table A13, specifications a and c); winsorizing imports or converting all indicators to rank-based scores leaves coal first (b, d). Adding CO2 emissions per capita as a fourteenth indicator (ix) leaves the benchmark (cosine 0.791) and the three leading priorities unchanged; Türkiye’s per-capita emissions over 2010–2021 (4.85 t CO2e) were below the UK’s (6.32 t CO2e), so this indicator does not enter as a directional priority. In every one of these specifications the UK remains Türkiye’s closest peer and, except when all indicators are converted to rank-based scores (d), a member of the same cluster.
Profile definition: When the 2010–2021 averages are augmented with the annual rates of change in the policy-actionable indicators, Hungary replaces the UK as Türkiye’s closest peer (cosine 0.576), and the cluster structure changes markedly (8/28/1; Table A15). The level-based specification identifies countries whose energy systems are configured in the same way, whereas the trend-augmented specification identifies countries moving along similar trajectories; the UK is therefore Türkiye’s structural peer and Hungary its trajectory-adjusted peer. Relative to Hungary, coal-based generation remains the leading directional priority, although narrowly (SGPI = 0.088 against 0.087 for natural-gas-based generation), followed by import dependence and renewable energy consumption (Table 7). The coal priority is thus common to both peers, whereas the remaining priorities depend on the choice of peer.
Renewable definition: When renewable electricity is measured excluding hydropower, renewable generation becomes Türkiye’s second priority, after coal-based generation and ahead of energy imports (Table A13, specification iv), because much of Türkiye’s renewable electricity is hydro-based whereas the UK’s is mainly wind-based. The two definitions answer different questions—total renewable penetration versus non-hydro deployment—and both are policy-relevant.
Recent developments: Electricity data published after the study window provide context but do not update the analysis. In 2024, coal supplied 35.6% of Türkiye’s electricity—above its 2010–2021 average of 31.3% in the World Bank data, although below the 36.9% recorded in 2023—while coal-fired generation reached a record level and wind and solar together reached 18% [59]. In the UK, coal’s share of generation fell to about 1% in 2023, and coal-fired generation ended in September 2024 with the closure of the last coal power plant [60]. Because these figures come from a different source and refer to individual years, they cannot show whether the UK would remain Türkiye’s closest peer or whether the SGPI ranking would change in an updated panel; they indicate only that the coal gap remains substantively relevant after the study window.
5. Discussion
5.1. Structural Heterogeneity and the Limits of Performance Rankings
The findings demonstrate that renewable energy transitions across OECD countries cannot be adequately characterized through a single performance dimension. The principal component analysis shows that no component accounts for more than 30% of cross-country variation and that four components are required to reach three-quarters of total variance; countries therefore differ simultaneously in electricity generation structure, renewable deployment, energy efficiency, consumption patterns, and broader socioeconomic characteristics. The three-cluster solution provides a parsimonious, if weakly separated, representation of this heterogeneity, distinguishing a renewable-intensive, low-import regime from a regime of larger, urbanized, fossil-based and import-exposed economies and a regime of less urbanized, lower-income economies with intermediate renewable shares. This is consistent with recent studies emphasizing that energy-transition performance reflects heterogeneous national structures and that cluster-based approaches can reveal patterns that conventional country rankings may overlook [4,7,11].
At the same time, the low silhouette value (0.169) and limited bootstrap stability indicate that the boundaries between these regimes are gradual rather than sharp. This is a substantive finding rather than a methodological failure: within a group of high-income economies pursuing broadly similar decarbonization objectives, structural differences are matters of degree. The appropriate interpretation is that the clusters describe tentative regimes of structural similarity within which peer comparison is meaningful, not a taxonomy of discrete country types.
5.2. Structural Comparability Versus Performance Leadership
An important finding concerns the distinction between overall performance and structural comparability. Rather than selecting a benchmark according to a predefined ranking, the proposed framework identifies countries whose multidimensional energy profiles are most similar. Under the historical-average specification, the UK emerges consistently as Türkiye’s closest structural benchmark, and the two countries belong to the same cluster. Within the historical-average framework, the UK remains Türkiye’s closest peer across cosine similarity, Euclidean and Manhattan distances, three scaling procedures, two temporal subsamples, leave-one-country-out checks, alternative indicator transformations and an emissions-augmented indicator set (Table A13). The choice of peer changes, however, when trends are included alongside historical averages: Hungary becomes Türkiye’s closest peer under this specification (Table A15).
The similarity between Türkiye and the UK can be traced to specific features of their energy systems, because cosine similarity is the sum of indicator-level contributions (Table 8). The two countries lie on the same side of the OECD mean on eleven of the thirteen indicators. The largest single contribution comes from demographic scale: both are among the most populous OECD members (78.8 and 65.1 million inhabitants), and both are highly urbanized (82.9% and 82.0% of the population, against an OECD average of 76.9%). Among the energy indicators, the electricity mix contributes most: both generate a little over a third of their electricity from natural gas (36.7% and 36.6%, against an OECD average of 21.9%), so gas is the largest single source of electricity in both systems. Both economies are less energy-intensive than the OECD average (2.68 and 2.60 MJ per PPP dollar against 3.59) and use oil only marginally for power generation (0.5% and 0.7%). Both have renewable shares below the OECD average—31.3% and 25.2% of electricity and 12.9% and 7.9% of final energy consumption, against averages of 38.6% and 20.7%—and both are net energy importers with below-average per-capita electricity consumption and energy use. Log population and the urbanization rate together account for 0.244 of the total similarity of 0.784, and the gas share, energy intensity, renewable energy consumption, per-capita energy use and per-capita electricity consumption for a further 0.490. Because population is the largest single contributor, the peer relationship is partly one between two large economies; excluding population altogether nevertheless retains the UK as the closest peer (cosine 0.731; Table A13, specification vii). Two dimensions pull the profiles apart: coal-based generation, on which Türkiye (31.3%) is above and the UK (18.0%) below the OECD average, and GDP per capita, on which the UK is above and Türkiye well below it. Income alone accounts for 56.6% of the squared Euclidean distance between the two countries, and per-capita energy use and coal for a further 14.0% and 12.6%. In short, the two countries share a gas-centred, import-dependent, moderately renewable and comparatively efficient system configuration at a large, highly urbanized scale, while differing mainly in income and in their reliance on coal.
Table 8.
Decomposition of the Türkiye–UK structural similarity by indicator (2010–2021 averages).
Notably, the UK is not the OECD’s strongest renewable performer; the countries in Cluster 2 occupy that position. A ranking-based benchmarking exercise would therefore have directed Türkiye toward Norway, Sweden or Denmark—economies whose renewable positions rest on hydro, wind and biomass endowments, population scales, and institutional histories that are not directly transferable. The persistence of the UK as the closest structural peer suggests that peer selection based on structural similarity provides a more defensible basis for policy learning than comparison with countries selected solely for high renewable performance. This supports the broader argument that effective transition strategies should account for national structural conditions when evaluating the transferability of policy experience [2].
The comparison nevertheless has limits that should be stated alongside the result. Structural similarity in the thirteen measured dimensions is a necessary but not sufficient condition for policy transfer. The two countries differ in resource endowment, market design, institutional capacity and income: the UK’s renewable expansion rests heavily on offshore wind resources and on a specific combination of contracts-for-difference auctions and carbon price support, and its GDP per capita was about four times Türkiye’s over the study period (Table A2)—one of only two dimensions on which the two countries lie on opposite sides of the OECD mean (Table 8). Türkiye’s renewable growth, by contrast, has relied on hydropower and, more recently, on onshore wind and solar supported by its own auction mechanisms. Whether a given UK instrument would perform similarly in Türkiye therefore cannot be inferred from this analysis and requires country-specific causal or longitudinal evaluation. The framework identifies where comparison is informative; it does not establish that a given instrument will transfer.
5.3. ML Characterization and Strategic Priorities for Türkiye
The ML results provide additional insight into the dimensions underlying cross-country differences. GDP per capita, renewable electricity generation and the urbanization rate are the most influential indicators across the complementary importance measures (Table 5). Structural differentiation among OECD countries is therefore associated primarily with income, renewable penetration in electricity and demographic structure, and much less with the fossil composition of the electricity mix, energy intensity or import dependence. Conditional permutation importance, which accounts for correlations among indicators, gives a similar ordering, whereas standard permutation importance is zero for all indicators; this contrast illustrates why reliance on a single importance measure is inadvisable in small, correlated indicator panels [27]. This use of explainable ML as a post-hoc characterization tool, rather than as a predictive objective in itself, complements recent research combining clustering and ML to investigate heterogeneous energy-transition pathways [7].
For Türkiye, the benchmark comparison shows that structural similarity does not imply the absence of strategically important gaps, but it also relocates where those gaps lie. Among directionally actionable dimensions, the SGPI identifies coal-based electricity generation as the leading priority, followed by net energy import dependence (Table 6); these two dimensions lead under every weighting scheme tested, although their order depends on how supply security is weighted (Section 4.6). Türkiye’s renewable shares, by contrast, already exceed those of its closest structural peer when hydropower is included, so a peer-relative assessment does not support framing the Turkish transition primarily as a shortfall in renewable deployment—although it does so once hydropower is excluded (Table A13). Read together with the large per-capita consumption gaps, which indicate convergence pressure on future demand rather than a present deficit, the results suggest that Türkiye’s transition challenge is one of displacement under growth: coal-based generation must be reduced and import exposure lowered while total energy demand is expected to rise toward benchmark levels. This framing is consistent with evidence emphasizing the role of governance, institutional capacity, and fossil-fuel lock-in in shaping transition outcomes [61].
The results also clarify what a relative benchmarking framework can and cannot show. Coal and import dependence surface as priorities because the gaps between Türkiye and its benchmark on these dimensions are large, not because they differentiate OECD regimes strongly; the indicators that differentiate regimes most strongly are those on which Türkiye matches or exceeds its peer, which is consistent with the two countries belonging to the same regime. Conversely, a dimension on which a country and its peer are jointly disadvantaged will not surface as a priority even if it is nationally salient, and such dimensions must be identified through absolute rather than relative assessment. The SGPI is therefore a tool for allocating attention among peer-relative differences, not a complete diagnosis of a country’s energy-policy agenda.
5.4. Theoretical and Policy Implications
This study contributes to the energy-transition literature by reframing cross-country benchmarking as a problem of structural comparability rather than performance ranking, and by formalizing the step from peer identification to dimension-level prioritization. Countries with the highest renewable-energy performance are not necessarily the most appropriate reference cases for every national context, and the framework provides a systematic and reproducible procedure for identifying which peers are informative and which dimensions distinguish them.
From a policy perspective, the findings suggest that Türkiye can benefit from using the UK as a structural reference point under the historical-average specification rather than treating it as a model to be replicated directly. The robustness of this benchmark across alternative similarity measures, scaling procedures, temporal subsamples, and leave-one-country-out analysis strengthens its relevance for comparative policy learning. The framework’s contribution in this setting is not to propose new capacity targets but to provide an evidence-based ordering among competing strategic dimensions—coal displacement and the reduction in import exposure as the two leading dimensions, against a background of rising per-capita demand—derived from a peer whose energy structure is genuinely comparable.
The priorities can guide subsequent policy assessment by identifying questions that require country-specific evidence. Coal displacement calls for examining replacement generation, system flexibility, and transition support for affected communities. Import dependence calls for assessing demand reduction and domestic low-carbon supply together. These assessments should consider emissions, affordability, reliability, and implementation capacity; the SGPI does not establish which intervention would perform best.
Table 9 connects the identified benchmark gaps with options for further policy assessment, implementation constraints, and outcomes to monitor. The policy context draws on the IEA’s Türkiye 2026 Energy Policy Review [62].
Table 9.
Illustrative policy-assessment pathways for Türkiye.
More broadly, the framework provides a transparent basis for identifying areas that warrant strategic attention and can be updated as new data become available. By combining peer-relative structural gaps with classifier-derived indicator importance, the SGPI supports prioritization for further assessment. Its use requires expert judgement and country-specific evidence on policy feasibility and effectiveness.
5.5. Limitations and Future Research
This study has several limitations that should be considered when interpreting the findings.
First, the analysis is based on 37 OECD countries and thirteen World Bank indicators. With 37 observations and 13 dimensions, the ratio of cases to variables is low for distance-based clustering, and the resulting structures are correspondingly sensitive; this is the principal reason for the extensive stability and resampling protocol reported here, and for interpreting the clusters as broad regimes rather than definitive classifications. Clustering on the scores of three or four principal components, which raises the ratio of cases to dimensions, reproduces the main partition closely (adjusted Rand index 1.000 and 0.910), whereas six components or the original population variables change it (Table A5 and Table A10).
Second, the study window ends in 2021 because four World Bank series are not reported for the full sample thereafter (Table A6), and it therefore does not capture more recent developments in energy markets and transition policies, including the post-2021 shift in European gas supply conditions and the acceleration of solar deployment in Türkiye. The benchmark and priority rankings reflect country profiles during 2010–2021. Electricity data for 2024 show that coal remained Türkiye’s largest source of electricity, with a share above its 2010–2021 average, while coal-fired generation ended in the UK (Section 4.6); these observations are contextual and do not establish whether the benchmark or the ranking would change. Other dimensions, notably import dependence after the 2022 gas-price shock, may have shifted. Before these findings inform current policy decisions, the analysis should be updated once the remaining World Bank series become available for all countries, or with harmonized sources that provide consistent definitions for all thirteen indicators.
Third, because indicators are averaged over the study period, the analysis characterizes structural configuration rather than transition dynamics. Two countries with identical period averages but opposite trajectories would be treated as similar. This distinction affects the findings: adding annual trends in the policy indicators to the country-level averages produces markedly different clusters and changes Türkiye’s closest peer from the UK to Hungary (Table A15), although coal-based generation remains the leading priority relative to both peers (Section 4.6). Levels and trends capture different notions of similarity—the main specification identifies countries whose energy systems are configured in the same way, whereas a trend-based specification identifies countries moving along similar trajectories irrespective of their starting positions. The benchmark reported here is therefore a structural peer, and the framework does not claim that it is also a trajectory peer. The trend-augmented analysis provides an initial comparison of levels and changes; future work could extend this approach by modelling countries’ year-by-year transition trajectories.
Fourth, the retained three-cluster solution has weak separation (average silhouette width 0.169) and limited resampling stability (mean bootstrap Jaccard coefficient 0.554, with two clusters below 0.60), and cluster membership changes with the treatment of the population variables. The clustering results should therefore be interpreted as tentative structural groupings within the observed data rather than fixed country classifications.
Fifth, the indicator set omits dimensions that are central to transition analysis but not consistently available for all OECD countries over the study period, notably energy prices and taxation, policy-instrument coverage, grid flexibility and interconnection, storage capacity, and technological investment. Adding CO2 emissions per capita does not change Türkiye’s benchmark or its leading priorities (Table A13, specification ix), but the remaining dimensions could alter both the clustering and the prioritization. Price and policy variables in particular may separate countries that are structurally similar in physical terms, such as Türkiye and the UK, which differ markedly in carbon pricing and market design. Extending the framework with these dimensions—potentially by combining World Bank data with IEA, Eurostat or OECD environmental-policy data where coverage allows—would strengthen its policy relevance.
Finally, the framework could be applied to non-OECD countries or alternative regional groups to examine whether structurally similar benchmarking relationships persist across different institutional and development contexts, and the SGPI could be combined with longitudinal econometric, scenario-based, or causal methods to evaluate whether interventions in the identified priority areas subsequently improve transition outcomes.
6. Conclusions
This study developed an integrated, explainable framework for benchmarking renewable energy transition strategies across OECD countries by combining multivariate analysis, hierarchical clustering, similarity-based peer identification, three complementary ML importance measures, and directional strategic gap prioritization. Rather than evaluating countries through aggregate rankings, the framework focuses on structural comparability across multiple energy, economic, and demographic dimensions, and translates cross-country differences into an interpretable ordering of policy-actionable dimensions.
Three weakly separated structural regimes were identified across the OECD sample—a renewable-intensive, low-import group of nine countries, a group of seventeen larger, urbanized, fossil-based and import-exposed economies, and a group of eleven less urbanized, lower-income economies—and these regimes are tentative and sensitive to the specification. Under the historical-average specification, Türkiye and the UK belong to the same regime and are each other’s closest structural peers, a relationship that is stable across similarity and distance measures, scaling procedures and indicator transformations, sub-periods, sample perturbations and leave-one-country-out resampling. The peer is, however, conditional on the profile definition: when annual trends are added to the averages, Hungary becomes Türkiye’s closest, trajectory-adjusted peer. The ML analysis identifies GDP per capita, renewable electricity generation and the urbanization rate as the dimensions that most strongly differentiate national transition profiles, a result that simpler descriptive measures largely reproduce. Relative to the UK, the SGPI identifies coal-based electricity generation and net energy import dependence as Türkiye’s two leading actionable priorities under every weighting scheme tested, with their order depending on how supply security is weighted against decarbonization; coal-based generation also leads relative to Hungary, although narrowly. When hydropower is excluded from renewable electricity, non-hydro renewable generation becomes the second priority after coal. Türkiye’s renewable shares exceed those of its benchmark only when hydropower is included, and the large per-capita consumption gaps indicate that these priorities must be pursued against a rising demand baseline.
This study therefore demonstrates that renewable energy benchmarking can move beyond descriptive country comparisons toward a transparent and reproducible decision-support process. The proposed framework does not prescribe specific policy interventions or estimate their causal effects; instead, it provides a systematic basis for identifying structurally relevant peers and prioritizing areas for further policy assessment. As updated and more comprehensive energy data become available, the framework can be periodically recalibrated and extended to other countries and regional contexts, supporting more context-sensitive and evidence-informed energy-transition strategies.
Author Contributions
Conceptualization, C.Z. and T.E.Y.; methodology, C.Z. and T.E.Y.; software, T.E.Y.; validation, C.Z., T.E.Y., M.A. and M.R.Ö.; formal analysis, T.E.Y.; investigation, T.E.Y.; resources, C.Z. and T.E.Y.; data curation, T.E.Y.; writing—original draft preparation, C.Z. and T.E.Y.; writing—review and editing, C.Z., T.E.Y., M.R.Ö. and M.A. visualization, T.E.Y.; supervision, C.Z.; T.E.Y., M.R.Ö. and M.A. project administration, C.Z., T.E.Y., M.R.Ö. and M.A.; funding acquisition, C.Z., T.E.Y., M.R.Ö. and M.A. All authors have read and agreed to the published version of the manuscript.
Funding
This research received no external funding.
Data Availability Statement
The data analysed in this study are publicly available from the World Bank Open Data database (https://data.worldbank.org/indicator) accessed on 1 October 2026; the indicator codes used are listed in Table A1. The derived country-level dataset and the R code required to reproduce the reported results are available from the corresponding author upon reasonable request.
Acknowledgments
One author (T.E.Y.) used Claude (Opus 5.5; Anthropic, San Francisco, CA, USA) for language editing. Another author (M.A.) used ChatGPT (OpenAI; GPT-6 family, San Francisco, CA, USA) to support manuscript review and suggested revisions to methodological explanations and policy discussion, including selected numerical consistency checks and identification of supporting sources. The authors who used these tools reviewed and edited their respective AI-assisted contributions.
Conflicts of Interest
The authors declare no conflicts of interest.
Abbreviations
The following abbreviations are used in this manuscript:
| AI | Artificial Intelligence |
| ANOVA | Analysis of Variance |
| APEC | Asia–Pacific Economic Cooperation |
| BH | Benjamini–Hochberg |
| CI | Confidence Interval |
| GDP | Gross Domestic Product |
| HDBSCAN | Hierarchical Density-Based Spatial Clustering of Applications with Noise |
| IEA | International Energy Agency |
| IQR | Interquartile Range |
| LOCO | Leave-One-Country-Out |
| ML | Machine Learning |
| OECD | Organisation for Economic Co-operation and Development |
| OOB | Out-of-Bag |
| PCA | Principal Component Analysis |
| PPP | Purchasing Power Parity |
| RF | Random Forest |
| SGPI | Strategic Gap Priority Index |
| SHAP | SHapley Additive exPlanations |
| UMAP | Uniform Manifold Approximation and Projection |
Appendix A. Renewable Energy Transition Indicators
This appendix summarizes the renewable energy transition indicators used throughout the empirical analysis. For each variable, the table reports the corresponding World Bank indicator code, measurement unit, variable category, and a brief description to facilitate transparency and reproducibility of the proposed analytical framework [33].
Table A1.
Renewable energy transition indicators, World Bank indicator codes, measurement units, and variable descriptions used in the empirical analysis.
Table A2.
Descriptive statistics of the country-level indicator averages (2010–2021, n = 37).
Table A3.
Principal component loadings for the first four components.
Table A4.
Principal-component retention criteria.
Table A5.
Clustering and benchmark identification based on principal-component scores.
Table A6.
Indicator coverage after the 2021 endpoint (World Bank, extraction of 1 July 2026).
Appendix B. Cluster Validation and Robustness Analysis
This appendix provides supplementary evidence on the validity and robustness of the clustering results. Table A7 reports bootstrap-based cluster stability across alternative numbers of clusters, while Figure A1 presents the exploratory HDBSCAN solution as a density-based robustness assessment of the identified country structure; HDBSCAN classifies all countries as noise, consistent with the weak separation of the clusters.
Table A7.
Bootstrap Stability of Alternative Hierarchical Clustering Solutions.
Table A8.
Exploratory Kruskal–Wallis summaries and descriptive effect sizes across the three clusters.
Figure A1.
HDBSCAN clustering projected onto the UMAP representation of OECD countries as a density-based robustness assessment (all countries are classified as noise).
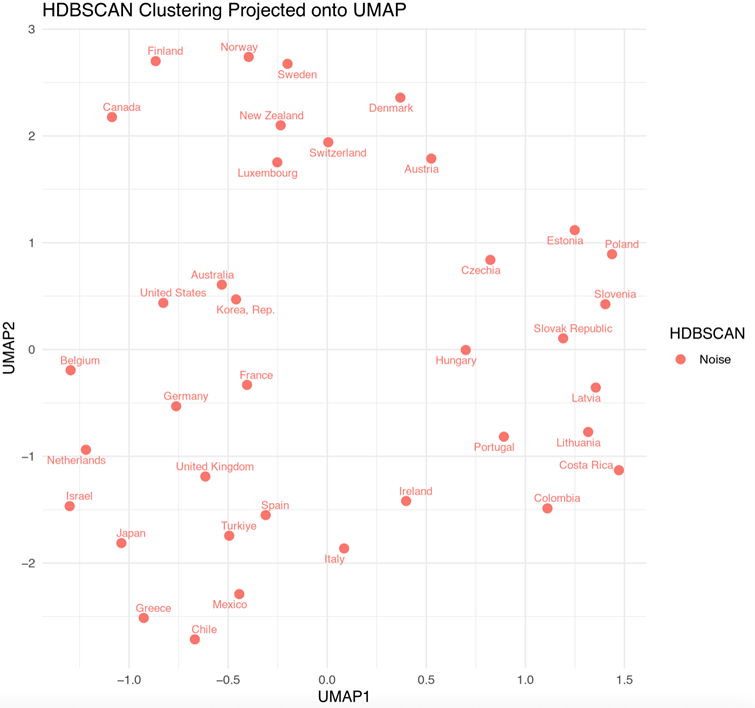
Appendix C. ML, Benchmark, and Policy-Prioritization Robustness
This appendix presents supplementary robustness analyses for the ML characterization, benchmark identification, and strategic priority rankings. Table A9 evaluates the stability of Random Forest variable importance through bootstrap confidence intervals, Table A10 examines the temporal robustness of Türkiye’s nearest-country benchmark, Table A11 assesses the robustness of benchmark identification under alternative scaling procedures, and Table A12 evaluates the sensitivity of the SGPI rankings to alternative index specifications. Moreover, Table A13 reports variable-screening, sample and cluster-number sensitivity analyses, Table A14 the out-of-bag confusion matrix of the Random Forest model, Table A15 a trend-based sensitivity analysis of the benchmark identification, Table A16 directional variants of the SGPI, Table A17 a comparison of the Random Forest characterization with conditional permutation importance, simpler separation measures and alternative classifiers, and Table A18 the cluster membership under the original specification (i) of Table A13.
Table A9.
Bootstrap Confidence Intervals for Random Forest Gini Importance.
Table A10.
Temporal Robustness of Türkiye’s Nearest-Country Benchmark.
To further assess the robustness of Türkiye’s benchmark identification, cosine similarity was recalculated using three alternative data-scaling procedures: z-score standardization, min–max scaling, and robust median/IQR scaling. As reported in Table A11, the UK remains Türkiye’s highest-ranked structural benchmark under all three specifications. Although the composition and ordering of lower-ranked peers vary across scaling procedures, the stability of the first-ranked benchmark indicates that the primary benchmark identification is not sensitive to the choice of scaling method.
Table A11.
Robustness of Türkiye’s Benchmark under Alternative Scaling Procedures.
Table A12.
Sensitivity of Strategic Gap Priority rankings to the index specification.
Table A13.
Variable-screening, transformation and sample sensitivity.
Table A14.
Random Forest per-class out-of-bag accuracy.
Table A15.
Trend-based sensitivity analysis.
Table A16.
Directional SGPI variants: ranks of the four directional indicators.
Table A17.
Random Forest importance compared with conditional permutation importance, simpler separation measures and a two-cluster model (ranks).
Table A18.
Cluster membership under the original specification (i) (population and urban population counts).
References
- Bigerna, S.; Gattone, T.; Magazzino, C. Fossil lock-in, resource dependence, and energy transition policy in the Global South. Energy Policy 2026, 216, 115281. [Google Scholar] [CrossRef] [Scilit]
- Castrejon-Campos, O.; Aye, L.; Hui, F.K.P.; Vaz-Serra, P. Unlocking clean energy transitions in developing countries: A robust policy mix exploration for Mexico. Util. Policy 2026, 101, 102229. [Google Scholar] [CrossRef] [Scilit]
- Gao, G.; Nyamoko, T.J.; Li, Y.; Ding, Y.; Li, F. Multidimensional efficiency evaluation of Africa’s energy system, accessibility, and low-carbon performance. Energy 2026, 348, 140615. [Google Scholar] [CrossRef] [Scilit]
- Gouveia, M.C.; Henriques, C.O. Assessing the efficiency of low-carbon economy within the European Union: A value-based DEA approach combined with cluster analysis. Sustain. Energy Technol. Assess. 2025, 81, 104430. [Google Scholar] [CrossRef] [Scilit]
- Shabanpour, H.; Lieske, S.N.; Wadley, D.; Dargusch, P.; Saen, R.F. How to assess national decarbonization policies? A dynamic framework for evaluating energy efficiency and CO2 emissions in OECD nations aligned with the SDGs. Socio-Econ. Plan. Sci. 2026, 105, 102478. [Google Scholar] [CrossRef] [Scilit]
- Saadi, S.A.; Katekhaye, D.; Magda, R. Applications of artificial intelligence in renewable energy transition: A systematic literature review. Energies 2026, 19, 1839. [Google Scholar] [CrossRef] [Scilit]
- Chen, Y.; Cai, S.; He, J.; Wen, X. Analyzing different energy transition patterns and their drivers using clustering and machine learning models: Unveiling the role of digital technological innovation. Energy Econ. 2026, 160, 109428. [Google Scholar] [CrossRef] [Scilit]
- Mizrak, F.; Yasar, O. A secondary-data-driven decision support framework for strategic energy investment prioritization: An explainable multi-criteria application across countries. Energies 2026, 19, 3243. [Google Scholar] [CrossRef] [Scilit]
- Liu, Z.; Lu, S.; Zhong, Y.; Zhang, J. Energy transition, economic efficiency, and resource use: Evidence on energy efficiency in APEC economies. Energy Strategy Rev. 2026, 66, 102324. [Google Scholar] [CrossRef] [Scilit]
- Habibi, A.; Barkhordar, Z.S. Assessing energy security during renewable energy system transitions under material constraints. Energy Strategy Rev. 2026, 67, 102335. [Google Scholar] [CrossRef] [Scilit]
- Sompolska-Rzechuła, A.; Becker, A.; Oleńczuk-Paszel, A. Energy economics in European Union countries—Typological analysis using Kohonen networks. Energies 2025, 18, 6202. [Google Scholar] [CrossRef] [Scilit]
- Halkos, G.; Bampatsou, C.; Aslanidis, P.S. Combining policymaking tools for green transition: Eco-efficiency benchmarking and club convergence. Empir. Econ. 2026, 71, 2. [Google Scholar] [CrossRef] [Scilit]
- Phan, T.T.N.; Hufnagel, L. Benchmarking Vietnam’s regions: A standardized indicator-based comparison of ecological sustainability. Environ. Sustain. Indic. 2025, 28, 100933. [Google Scholar] [CrossRef] [Scilit]
- Rađenović, Ž.; Adamos, G.; Rajić, M.; Rađenović, T.; Mančić, M. Benchmarking EU road transport transition trajectories against 1.5 °C-oriented mitigation expectations: A multi-indicator assessment. Future Transp. 2026, 6, 69. [Google Scholar] [CrossRef] [Scilit]
- Visbal-Cadavid, D.; Mendoza-Mendoza, A.; Causado-Rodriguez, E. Multivariate analysis of the Sustainable Society Index: A structural assessment of global sustainability. Sustainability 2026, 18, 4761. [Google Scholar] [CrossRef] [Scilit]
- Alka, T.A.; Suresh, M.; Mandal, S.; Filho, W.L.; Raman, R. Large language models in sustainable energy systems: A systematic review on modeling, optimization, governance, and alignment to sustainable development goals. Energies 2026, 19, 1588. [Google Scholar] [CrossRef] [Scilit]
- Wu, Y.; Fu, X. Machine learning and artificial intelligence for data-driven photovoltaic power systems: A review. Energies 2026, 19, 3151. [Google Scholar] [CrossRef] [Scilit]
- Adefarati, T.; Sharma, G.; Bokoro, P.N.; Kumar, R. Advancing renewable-dominant power systems through internet of things and artificial intelligence: A comprehensive review. Energies 2025, 18, 5243. [Google Scholar] [CrossRef] [Scilit]
- Aleassa, O.; Bekhit, M.; Hussain, W.; Fattah, I.M.R. Harnessing AI-driven large language models (LLMs) for enhanced forecasting and optimisation of wind and solar energy generation and load demand profiles. Renew. Sustain. Energy Rev. 2026, 239, 117171. [Google Scholar] [CrossRef] [Scilit]
- Begum, A.M.; Mobin, M.A. A machine learning approach to carbon emissions prediction of the top eleven emitters by 2030 and their prospects for meeting Paris agreement targets. Sci. Rep. 2025, 15, 19469. [Google Scholar] [CrossRef] [Scilit]
- Bozkurt, M.A. Energy transition and geopolitical risk in clean and fossil energy with multiscale time-varying connectedness and deep learning forecasts. Appl. Energy 2026, 413, 127728. [Google Scholar] [CrossRef] [Scilit]
- Asraf, M.S.; Rasheduzzaman, M.; Shamim, C.A.H. A machine learning framework for regional electricity–economic forecasting: Developing the US Regional Energy Economic Index (REEI) for equitable energy transition planning. Appl. Energy 2026, 413, 127705. [Google Scholar] [CrossRef] [Scilit]
- Mundu, M.M.; Basajja, M.; Kweyu, E.; Manjula, V.S.; Uti, D.E. Harnessing AI in renewable energy systems: Driving environmental and socio-economic transformation. Energy Inform. 2026, 9, 13. [Google Scholar] [CrossRef] [Scilit]
- Okulicz-Kozaryn, W.; Artyukhov, A.; Artyukhova, N. Matrix analysis of structural convergence of energy-relevant and policy-relevant AI research: Implications for energy policy. Energies 2026, 19, 2240. [Google Scholar] [CrossRef] [Scilit]
- Adıgüzel Tüylü, A.N. Interpreting primary energy consumption in Europe and Türkiye using explainable artificial intelligence. Electrica 2026, 26, 1–12. [Google Scholar] [CrossRef] [Scilit]
- Lundberg, S.M.; Lee, S.-I. A unified approach to interpreting model predictions. In Advances in Neural Information Processing Systems 30 (NIPS 2017); Curran Associates: Red Hook, NY, USA, 2017; pp. 4765–4774. [Google Scholar]
- Strobl, C.; Boulesteix, A.-L.; Kneib, T.; Augustin, T.; Zeileis, A. Conditional variable importance for random forests. BMC Bioinform. 2008, 9, 307. [Google Scholar] [CrossRef] [Scilit]
- Yüksel, S.; Dinçer, H.; Eti, S.; Demir, C.; Pamucar, D.; Simic, V. Policy strategies assessment for renewable-powered urban mobility investments: A novel fractional fuzzy decision support system. Energy Rep. 2026, 16, 109444. [Google Scholar] [CrossRef] [Scilit]
- Rafipour, F.; Tabibian, M.; Saati, M. An AI and multi-criteria framework for siting renewable energy systems enhanced by graphene photovoltaics in a coastal city. Energy Inform. 2026, 9, 40. [Google Scholar] [CrossRef] [Scilit]
- Sajith, S.; Aswani, R.S. A just energy location framework for equitable and sustainable electric vehicle charging infrastructure planning: Techno-economic assessment and policy benchmarking in Kerala. Energy Inform. 2026, 9, 58. [Google Scholar] [CrossRef] [Scilit]
- Obeng, M.; Frimpong, E.A.; Aboagye, B. Accelerating the energy transition in Sub-Saharan Africa: A stochastic programming framework. Renew. Sustain. Energy Transit. 2026, 10, 100156. [Google Scholar] [CrossRef] [Scilit]
- Sadabadi, A.A.; Rahimirad, Z. Cluster-based policy design for rooftop solar deployment in residential buildings: A decision-support framework for low-carbon built environments. Energy Strategy Rev. 2026, 65, 102251. [Google Scholar] [CrossRef] [Scilit]
- World Bank. World Development Indicators. Available online: https://data.worldbank.org/indicator (accessed on 1 July 2026).
- World Economic Forum. Fostering Effective Energy Transition 2025; World Economic Forum: Geneva, Switzerland, 2025. [Google Scholar]
- IEA; IRENA; UNSD; World Bank; WHO. Tracking SDG 7: The Energy Progress Report 2025; World Bank: Washington, DC, USA, 2025. [Google Scholar]
- Kruyt, B.; van Vuuren, D.P.; de Vries, H.J.M.; Groenenberg, H. Indicators for energy security. Energy Policy 2009, 37, 2166–2181. [Google Scholar] [CrossRef] [Scilit]
- Sovacool, B.K.; Mukherjee, I. Conceptualizing and measuring energy security: A synthesized approach. Energy 2011, 36, 5343–5355. [Google Scholar] [CrossRef] [Scilit]
- Ang, B.W.; Choong, W.L.; Ng, T.S. Energy security: Definitions, dimensions and indexes. Renew. Sustain. Energy Rev. 2015, 42, 1077–1093. [Google Scholar] [CrossRef] [Scilit]
- Jolliffe, I.T.; Cadima, J. Principal component analysis: A review and recent developments. Philos. Trans. R. Soc. A 2016, 374, 20150202. [Google Scholar] [CrossRef] [Scilit]
- Ward, J.H. Hierarchical grouping to optimize an objective function. J. Am. Stat. Assoc. 1963, 58, 236–244. [Google Scholar] [CrossRef]
- Murtagh, F.; Legendre, P. Ward’s hierarchical agglomerative clustering method: Which algorithms implement Ward’s criterion? J. Classif. 2014, 31, 274–295. [Google Scholar] [CrossRef] [Scilit]
- Jolliffe, I.T. Principal Component Analysis, 2nd ed.; Springer: New York, NY, USA, 2002. [Google Scholar]
- Kaiser, H.F. The application of electronic computers to factor analysis. Educ. Psychol. Meas. 1960, 20, 141–151. [Google Scholar] [CrossRef] [Scilit]
- Horn, J.L. A rationale and test for the number of factors in factor analysis. Psychometrika 1965, 30, 179–185. [Google Scholar] [CrossRef] [Scilit]
- Rousseeuw, P.J. Silhouettes: A graphical aid to the interpretation and validation of cluster analysis. J. Comput. Appl. Math. 1987, 20, 53–65. [Google Scholar] [CrossRef] [Scilit]
- Caliński, T.; Harabasz, J. A dendrite method for cluster analysis. Commun. Stat. 1974, 3, 1–27. [Google Scholar] [CrossRef] [Scilit]
- Davies, D.L.; Bouldin, D.W. A cluster separation measure. IEEE Trans. Pattern Anal. Mach. Intell. 1979, PAMI-1, 224–227. [Google Scholar] [CrossRef] [Scilit]
- Dunn, J.C. Well-separated clusters and optimal fuzzy partitions. J. Cybern. 1974, 4, 95–104. [Google Scholar] [CrossRef] [Scilit]
- Hennig, C. Cluster-wise assessment of cluster stability. Comput. Stat. Data Anal. 2007, 52, 258–271. [Google Scholar] [CrossRef] [Scilit]
- McInnes, L.; Healy, J.; Melville, J. UMAP: Uniform manifold approximation and projection for dimension reduction. arXiv 2018, arXiv:1802.03426. [Google Scholar] [CrossRef] [Scilit]
- Campello, R.J.G.B.; Moulavi, D.; Sander, J. Density-based clustering based on hierarchical density estimates. In Advances in Knowledge Discovery and Data Mining, PAKDD 2013; Lecture Notes in Computer Science; Springer: Berlin/Heidelberg, Germany, 2013; Volume 7819, pp. 160–172. [Google Scholar] [CrossRef] [Scilit]
- Breiman, L. Random forests. Mach. Learn. 2001, 45, 5–32. [Google Scholar] [CrossRef] [Scilit]
- Shapley, L.S. A value for n-person games. In Contributions to the Theory of Games II; Kuhn, H.W., Tucker, A.W., Eds.; Princeton University Press: Princeton, NJ, USA, 1953; pp. 307–317. [Google Scholar]
- Lundberg, S.M.; Erion, G.; Chen, H.; DeGrave, A.; Prutkin, J.M.; Nair, B.; Katz, R.; Himmelfarb, J.; Bansal, N.; Lee, S.-I. From local explanations to global understanding with explainable AI for trees. Nat. Mach. Intell. 2020, 2, 56–67. [Google Scholar] [CrossRef] [Scilit]
- Štrumbelj, E.; Kononenko, I. Explaining prediction models and individual predictions with feature contributions. Knowl. Inf. Syst. 2014, 41, 647–665. [Google Scholar] [CrossRef] [Scilit]
- Aas, K.; Jullum, M.; Løland, A. Explaining individual predictions when features are dependent: More accurate approximations to Shapley values. Artif. Intell. 2021, 298, 103502. [Google Scholar] [CrossRef] [Scilit]
- Martilla, J.A.; James, J.C. Importance-performance analysis. J. Mark. 1977, 41, 77–79. [Google Scholar] [CrossRef] [Scilit]
- Hooker, G.; Mentch, L.; Zhou, S. Unrestricted permutation forces extrapolation: Variable importance requires at least one more model, or there is no free variable importance. Stat. Comput. 2021, 31, 82. [Google Scholar] [CrossRef] [Scilit]
- Alparslan, U. Türkiye Electricity Review 2025; Ember: London, UK, 2025; Available online: https://ember-energy.org/latest-insights/turkiye-electricity-review-2025/ (accessed on 26 October 2026).
- Mayo, F. The UK’s Journey to a Coal Power Phase-Out; Ember: London, UK, 2024; Available online: https://ember-energy.org/latest-insights/the-uks-journey-to-a-coal-power-phase-out (accessed on 28 October 2026).
- Choudhary, P.; Yadav, P. Policy governance failures and institutional asymmetries shaping Global North–South energy transitions. Energy Strategy Rev. 2026, 66, 102294. [Google Scholar] [CrossRef] [Scilit]
- International Energy Agency (IEA). Türkiye 2026: Energy Policy Review; IEA: Paris, France, 2026; Available online: https://www.iea.org/reports/turkiye-2026 (accessed on 3 October 2026).


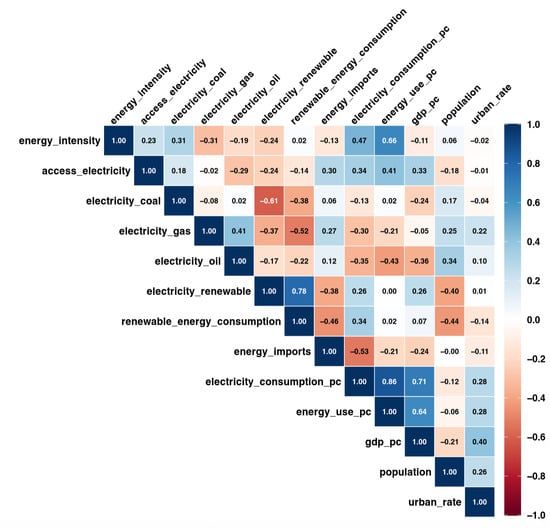
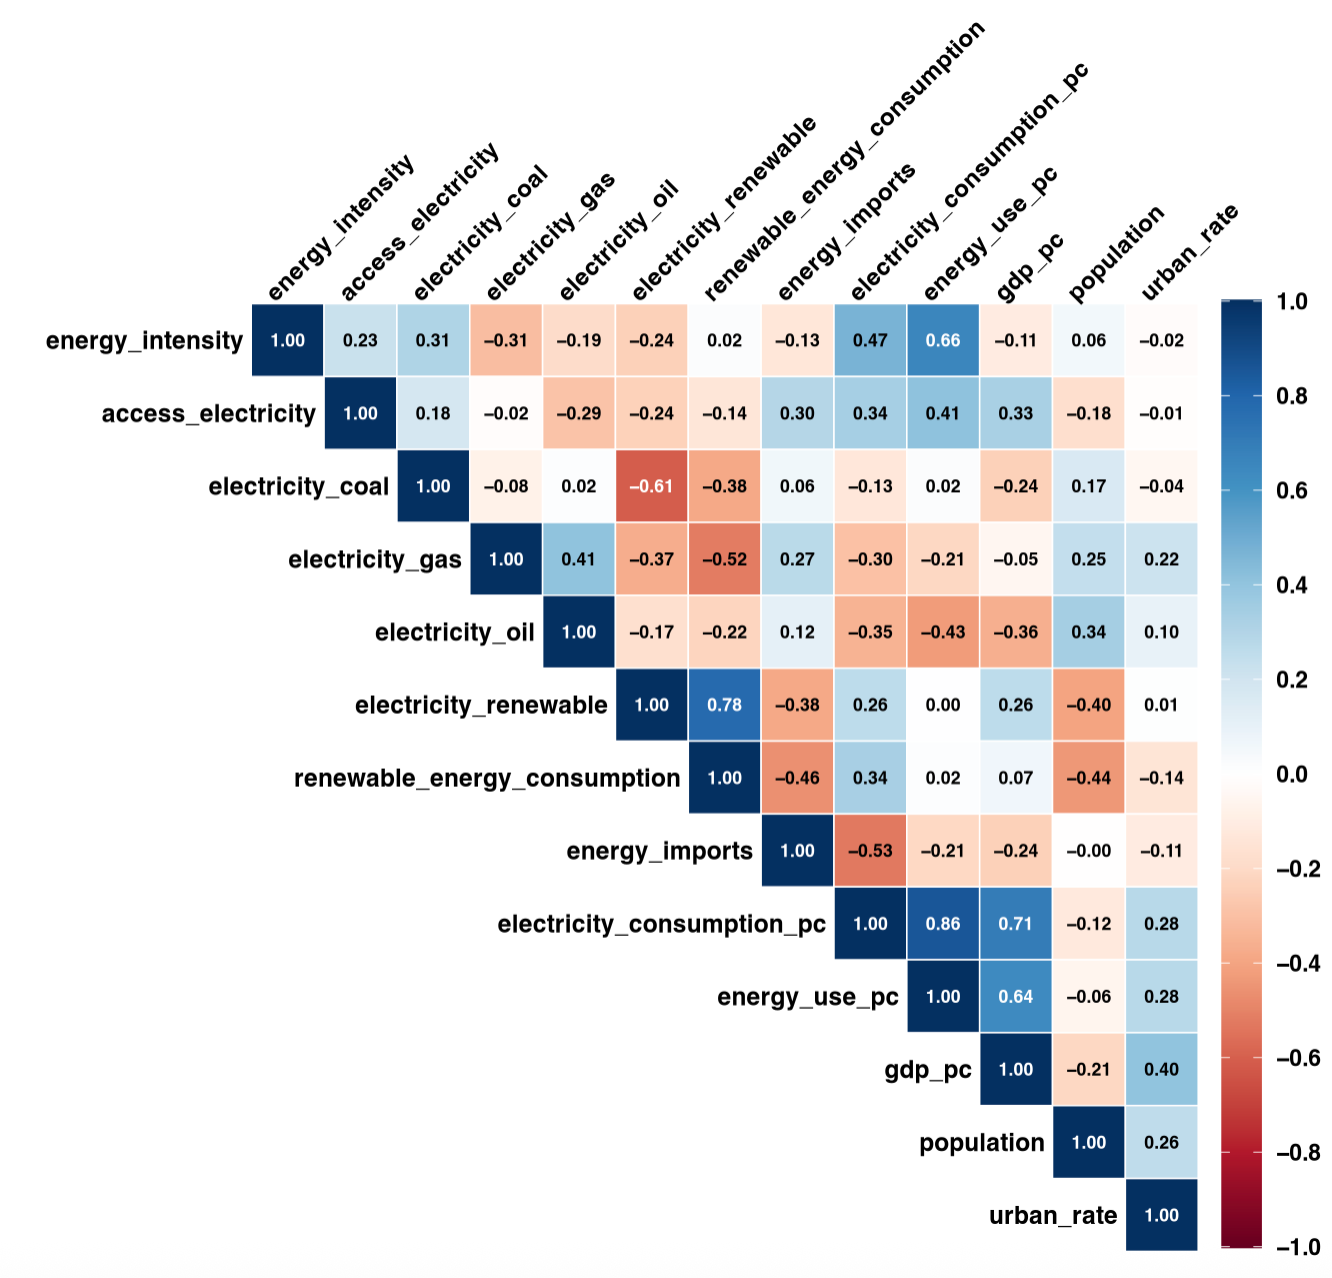
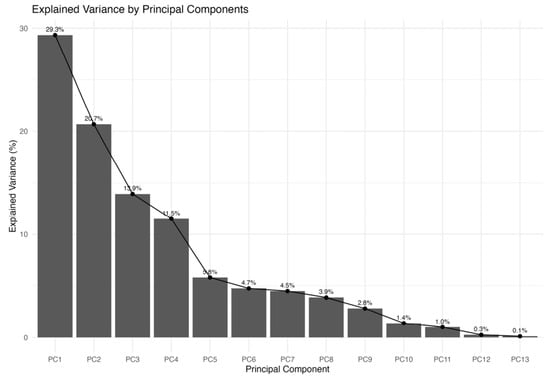
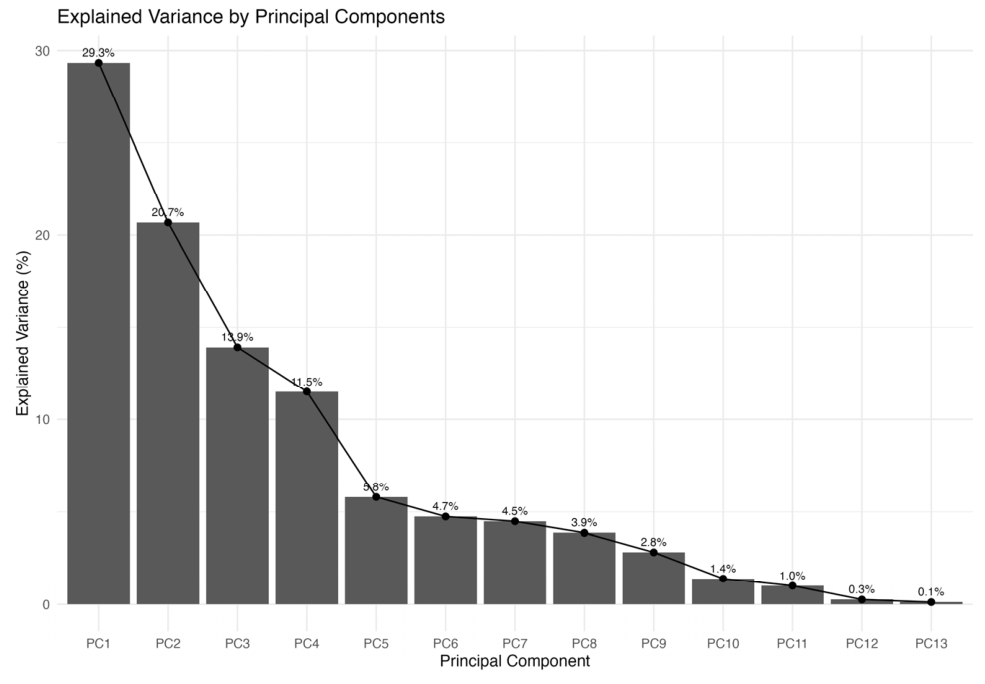
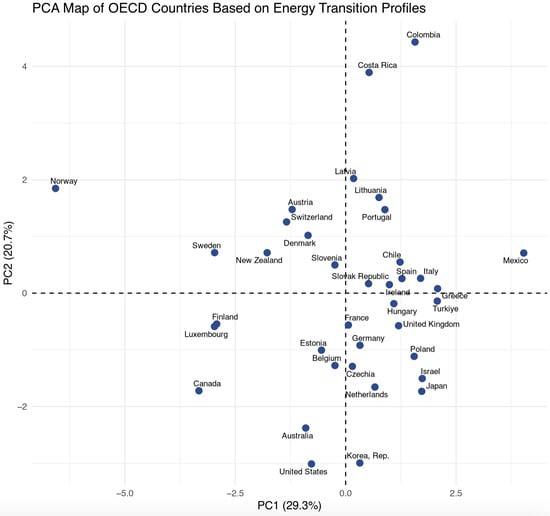
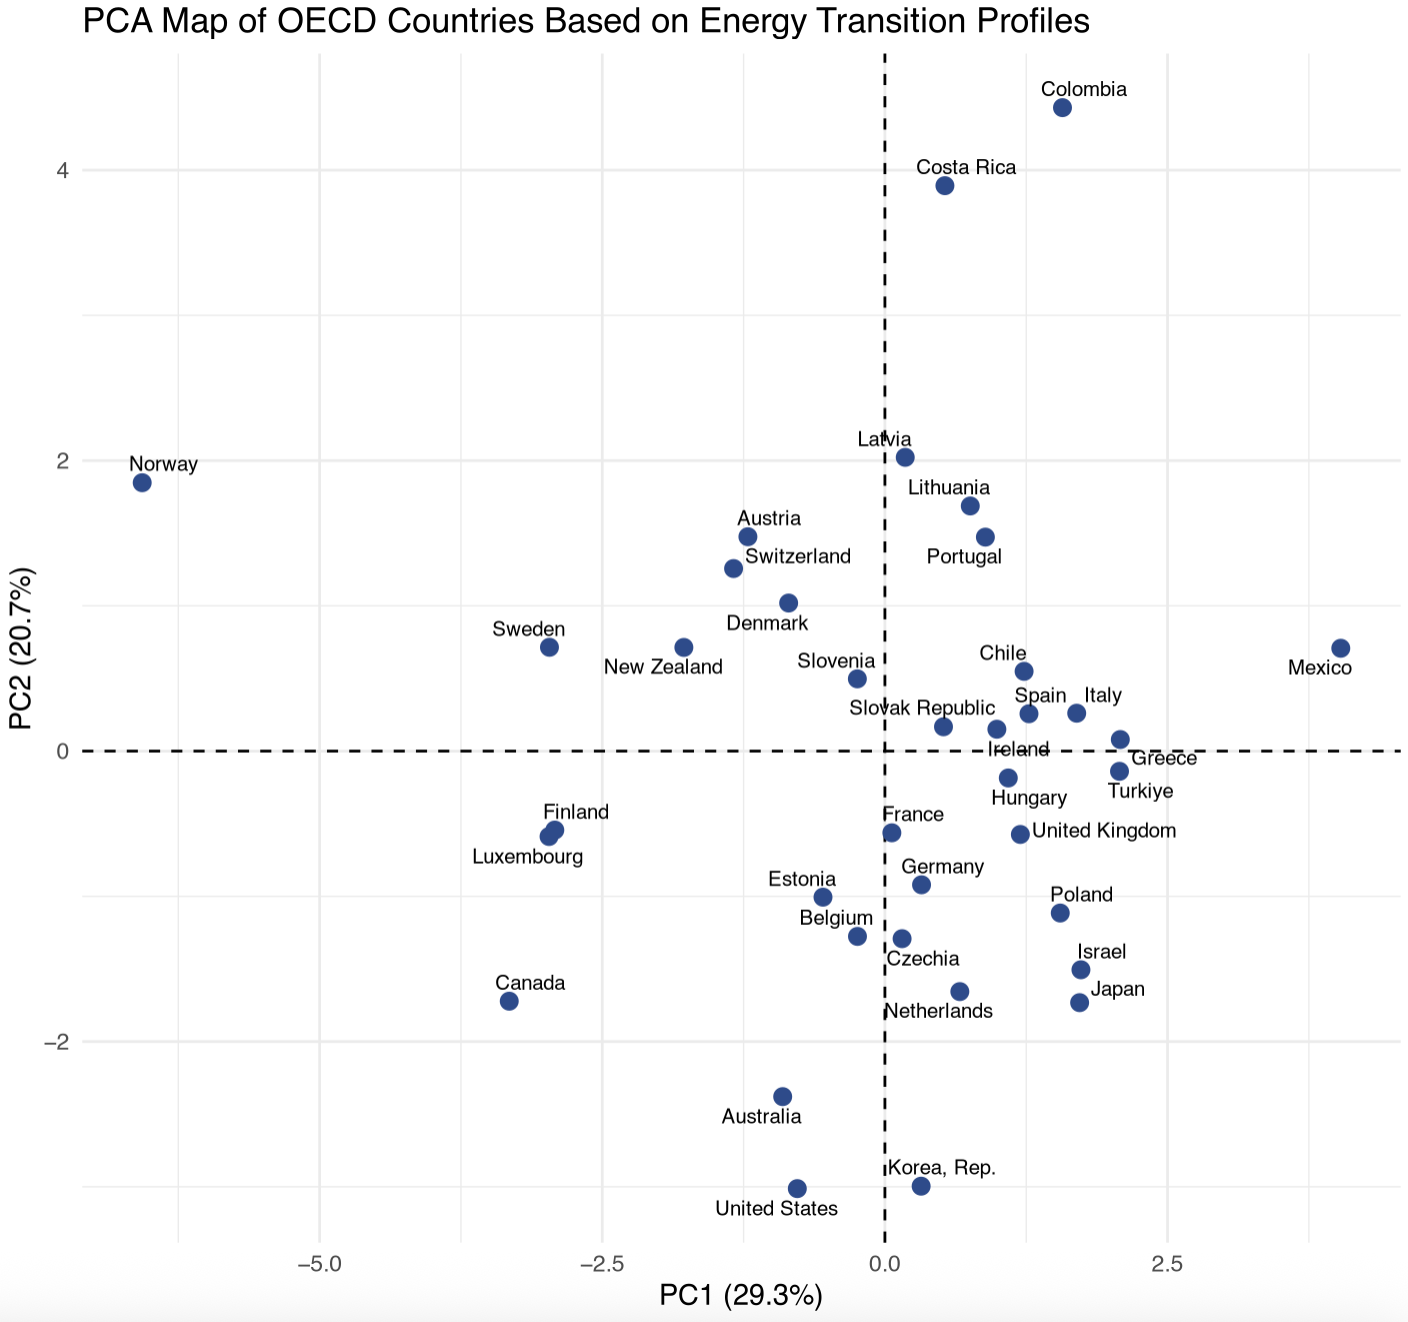
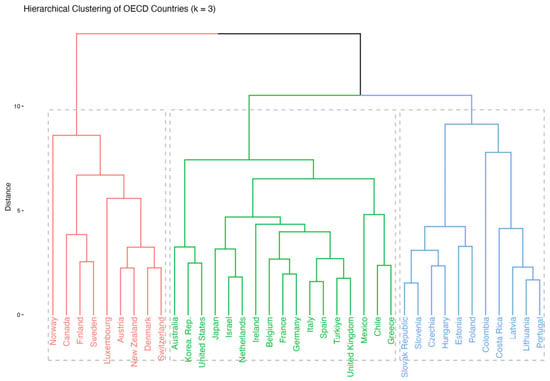
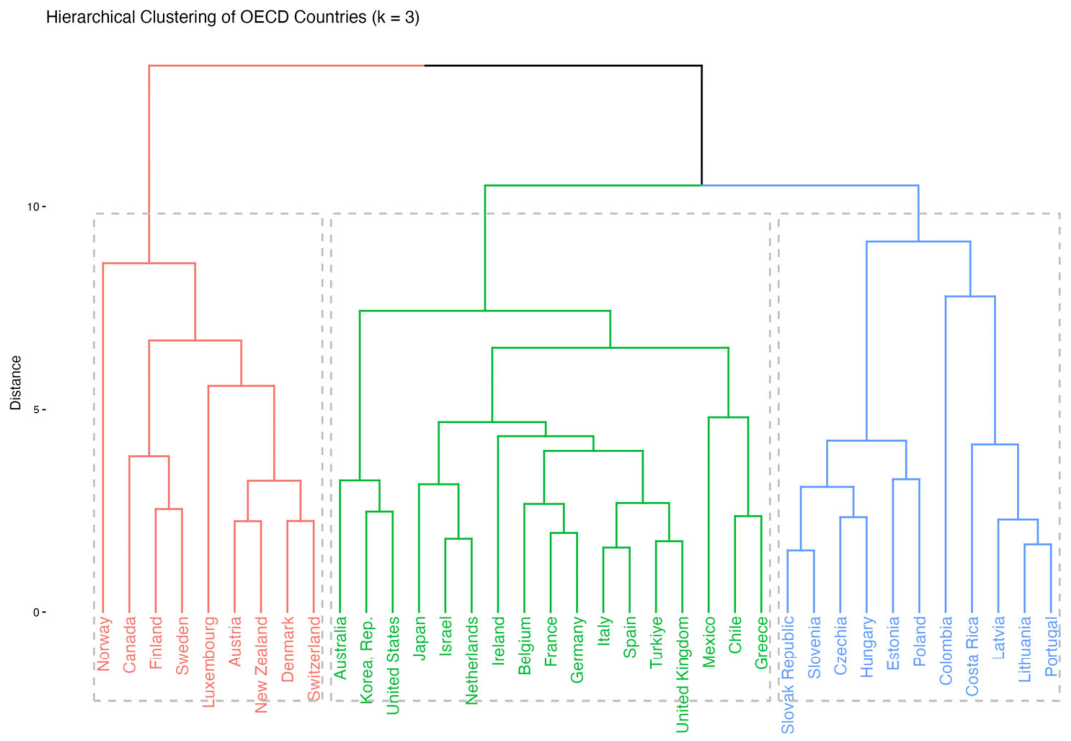
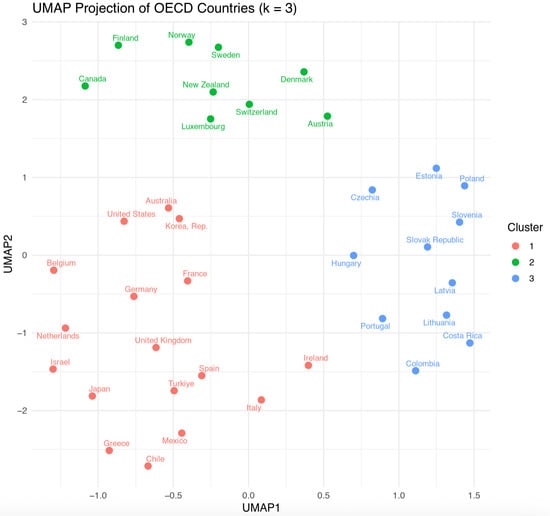
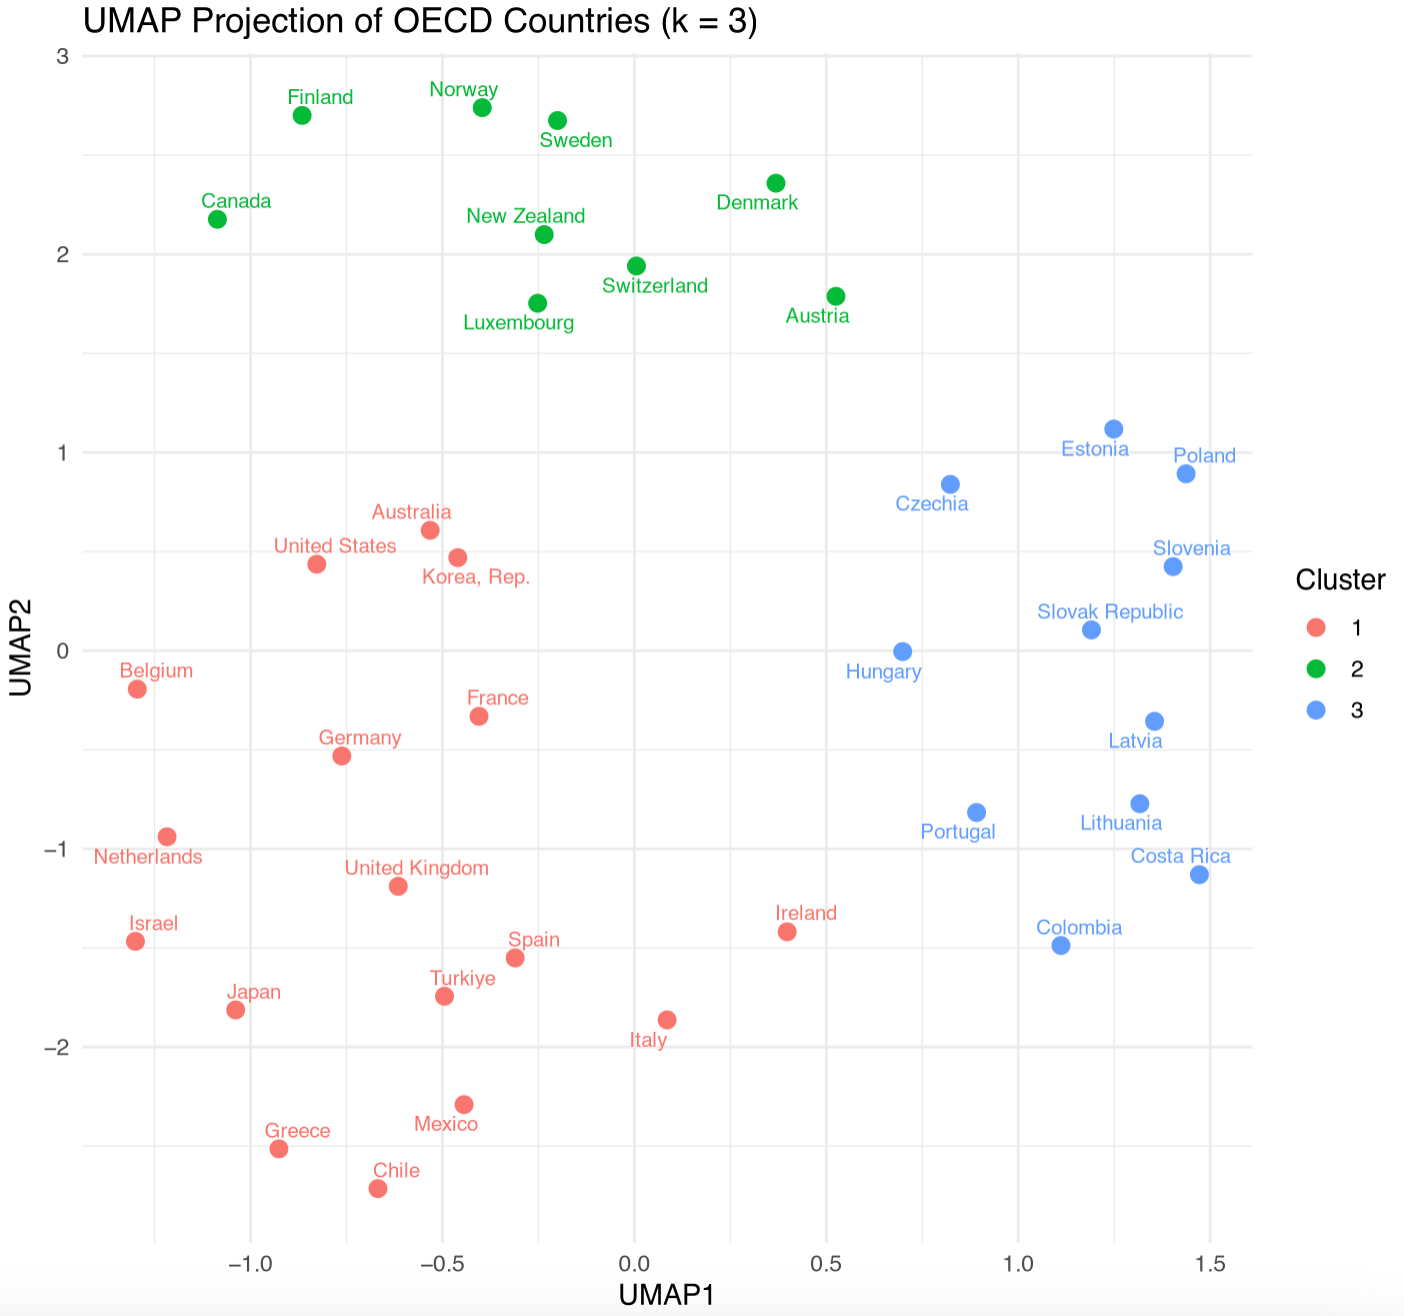
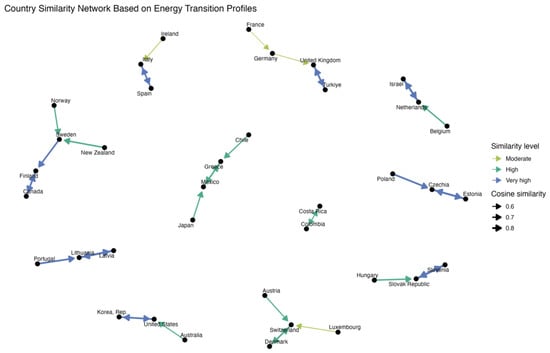
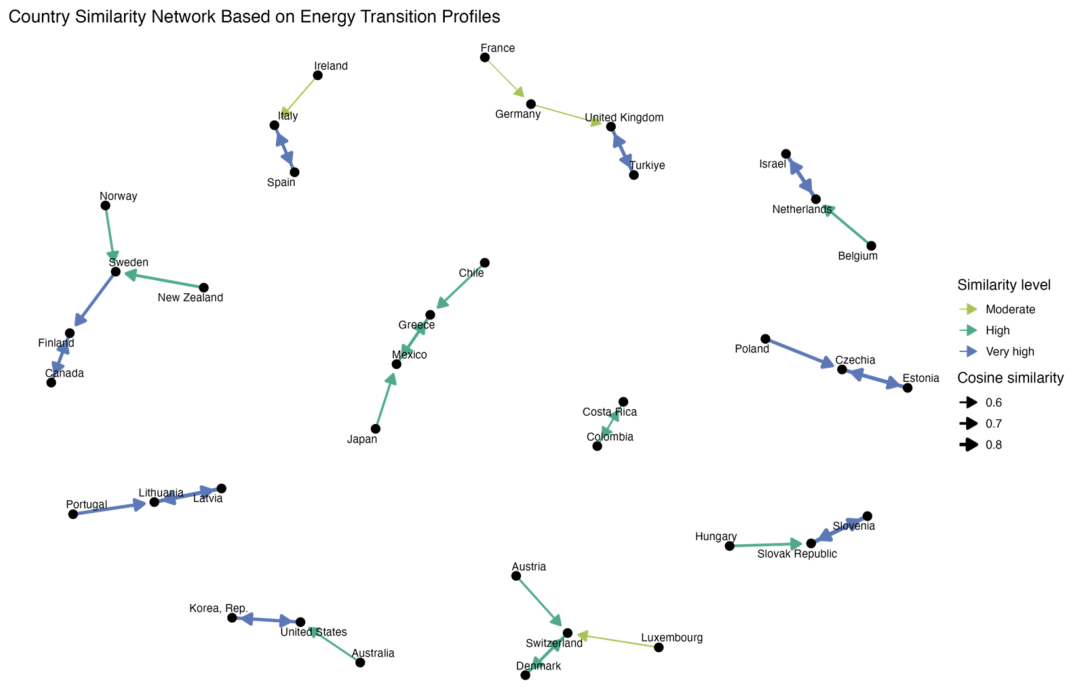
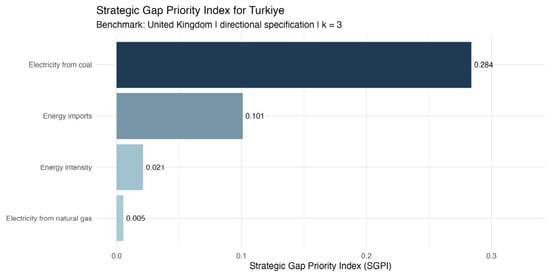
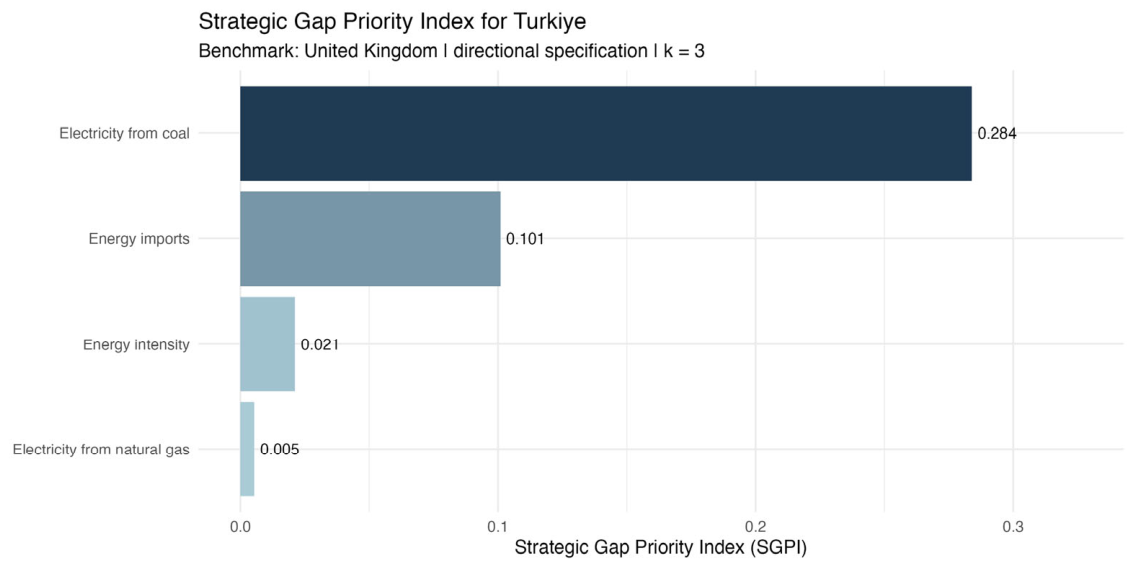

Disclaimer/Publisher’s Note: The statements, opinions and data contained in all publications are solely those of the individual author(s) and contributor(s) and not of MDPI and/or the editor(s). MDPI and/or the editor(s) disclaim responsibility for any injury to people or property resulting from any ideas, methods, instructions or products referred to in the content. |
© 2026 by the authors. Licensee MDPI, Basel, Switzerland. This article is an open access article distributed under the terms and conditions of the Creative Commons Attribution (CC BY) license.