


Abstract
Microbial carbon dioxide (CO2) utilization can supply biomass and chemicals while reducing fossil feedstock demand. This critical review compares microalgae, cyanobacteria, acetogens, hydrogen-oxidizing bacteria, and microbial electrosynthesis for integration with energy systems. Evidence is organized by measurement endpoint, reactor scale, and operating duration within a common process boundary. Photosynthetic cultivation favors sites with natural light, land, and local nutrients; annual productivity, harvesting, and contaminant transfer constrain implementation. Engineered cyanobacteria offer target metabolites when culture stability and product recovery are demonstrated. Hydrogen-oxidizing bacteria favor protein or polymer production with low-emission H2, efficient gas delivery, and explosion protection. Acetogens suit anaerobic chemical production where reductant supply and product inhibition can be managed. Recent electrosynthesis results support reactor and recovery integration, while electricity demand, selectivity, and component durability determine whole-process feasibility. Laboratory experiments, pilot demonstrations, and sustained operation provide different levels of validation. Practical selection depends on complete energy inputs, product quality, and a defined market or treatment function. The climate benefit also depends on CO2 origin, the displaced product, and subsequent carbon release; biomass formation alone does not establish durable removal.
1. Introduction
Rising temperatures and persistently high emissions justify the development of technologies that limit CO2 release to the atmosphere and reduce the use of fossil carbon as a feedstock. According to the World Meteorological Organization (WMO), the global mean surface temperature in 2025 was approximately 1.43 °C above the 1850–1900 average [1]. The Global Carbon Budget 2025, published in 2026, provisionally estimated fossil CO2 emissions in 2025 at 38.1 Gt, approximately 1.0% higher than in 2024 [2]. In the European Union, the low-carbon transition is guided by targets to reduce net emissions by at least 55% by 2030 relative to 1990, by 90% by 2040 under the 2026 amendment to the European Climate Law, and to achieve climate neutrality by 2050 [3]. The Fit for 55 package links delivery of the 2030 target to changes in energy systems, industry, transport, and fuel policy [4]. For bioconversion, the relevant requirement is to demonstrate a reduction in net emissions for a defined energy input and product use.
Physicochemical capture approaches include liquid absorption, adsorption on porous materials, membrane separation, and cryogenic processes [5]. Separated CO2 can subsequently be injected into suitable geological formations, mineralized, or converted into chemical products [6]. Carbon capture and storage (CCS) and carbon capture and utilization (CCU) nevertheless serve different purposes: the former provides long-term isolation [5], whereas the latter supplies a feedstock for a subsequent process [6]. Biological CO2 fixation can complement these approaches through biomass and metabolite synthesis at relatively mild temperatures and pressures [7]. When the carbon source is biogenic or atmospheric CO2 and energy is supplied by sunlight or low-emission sources, the input of additional fossil carbon can be reduced [8]. Closing the carbon loop nevertheless requires accounting for subsequent carbon release, gas losses, and the energy consumed by all operations [6,9].
Microalgae, cyanobacteria, and non-photosynthetic bacteria differ primarily in how they obtain energy and electrons. Microbial systems exhibit different performance in biomass and metabolite production as well as CO2 fixation. For Nannochloropsis, areal biomass productivity reached 19–24 g total solids (TS)·m−2·d−1 in vertical photobioreactors (PBRs) compared to 12–15 g TS·m−2·d−1 in the horizontal systems evaluated. These values do not quantify the percentage capture efficiency for the CO2 supplied [10]. In hydrogen-oxidizing bacteria (HOB), gas feeding allows substantially higher cell concentrations to be maintained without illumination. In Cupriavidus necator cultures, medium optimization increased the final biomass concentration from 15 to 53 g TS·L−1, while gas supply control reduced gas consumption by 67% relative to the reference configuration. In the reference configuration without gas recirculation, H2 utilization was approximately 5% [11]. Experiments using real gases confirm the importance of operational constraints. Feeding Chlorella vulgaris with flue gas from biogas combustion increased the growth-phase biomass production rate to 0.0778 ± 0.0031 g volatile solids (VS)·L−1·d−1 but also caused acidification and earlier culture decline; the CO2 fraction in the gas decreased from 13 ± 1 to 1 ± 0.5% [12]. In a study using flue gas from a municipal heating plant, sulfur oxides (SOx) caused culture collapse on day eight. After desulfurization, the production rate reached 0.2810 ± 0.0162 g VS·L−1·d−1, and the reported CO2 utilization efficiency (CO2UE) increased from 24.1 to 41.4% [13]. A different constraint was observed with Synechocystis sp. PCC 6803: with the pH maintained at approximately 7.5, growth on gas containing 30% CO2 was 2.7-fold slower than at 4% CO2 [14]. Carbon availability, contaminant tolerance, and photosynthetic regulation therefore require separate assessments; increasing the CO2 concentration alone does not guarantee process intensification.
Recent publications address complementary aspects of microbial CO2 utilization. Sadvakasova et al. [15] connected microalgal metabolic engineering and carbon-concentrating mechanisms with bioprocess design, consortia, and hybrid cultivation. Zhang et al. [16] reviewed Wood–Ljungdahl energetics, genetic tools, and engineering for diversified acetogenic products. Rovira-Alsina et al. [17] examined electricity-driven protein production by HOB, including recycled nitrogen, gas utilization, downstream processing, economics, and commercialization. Jourdin et al. [18] modeled electrochemical and electricity cost effects on electrosynthesis feasibility. Ali et al. [19] integrated algal wastewater treatment, CO2 capture, cultivation design, biomass valorization, and deployment barriers. Onyeaka and Ekwebelem [20] focused on bacterial fixation pathways as well as genetic and metabolic engineering. De Souza Sevalho et al. [21] combined systematic scoping and bibliometrics with fixation pathways, production platforms, products, and industrial constraints. The present review complements these contributions with a cross-platform comparison specifically for energy system CO2 streams. Its synthesis links distinct measurement endpoints and whole-process boundaries to reactor scale, operating duration, and deployment constraints. Product carbon origin is separated from CO2 feed recovery; compact reactor performance is considered together with reductant production, gas delivery, and recovery. Laboratory maxima, pilot demonstrations, and sustained operation support different conclusions rather than a universal efficiency ranking.
This review aims to determine the conditions under which microbial CO2 capture and bioconversion from energy systems can provide process, energy, or climate advantages. It compares the strengths and limitations of microalgae, cyanobacteria, acetogenic bacteria, hydrogen-oxidizing bacteria, and electrobiological systems using data on gas composition, reactor scale, productivity, and product quality. Biomass utilization is considered only in relation to the captured carbon balance and process value. Figure 1 presents the comparison framework.
Figure 1.
Microbial platforms for CO2 utilization from energy systems and the scope of whole-process assessment. CBB, Calvin–Benson–Bassham cycle; WLP, Wood–Ljungdahl pathway; HOB, hydrogen-oxidizing bacteria; PHB, poly(3-hydroxybutyrate). Authors’ schematic based on [6,10,11].
2. Literature Selection and Analytical Criteria
Publications were identified through targeted searches of PubMed, Europe PMC, publisher resources, and institutional repositories, supplemented by citation tracking. Queries combined microorganism and platform names with CO2 fixation, flue gas, gas fermentation, microbial electrosynthesis, pilot operation, carbon balance, and techno-economic assessment. The main publication period was 2010–2026, with a literature cut-off of 28 October 2026; earlier sources supported foundational mechanisms. The bibliography contains 135 sources, including contextual documents and a published correction. Reference identities were checked by DOI and title.
Comparative analysis included only publications addressing microbial inorganic carbon assimilation, cultivation or reactor performance, gas stream integration, or associated energy, environmental, and economic assessments. Experimental studies and process models supplied quantitative evidence; reviews and institutional documents supported mechanisms and context. Numerical comparisons required identifiable units and measurement bases. Evidence was appraised by feed identity, scale, duration, reported uncertainty, and balance coverage, distinguishing laboratory results, pilot demonstrations, and long-term operation. Missing operating details and inventories were not reconstructed. In the tables, n.r. means not reported and n.v. indicates not verified for the comparison; neither denotes zero performance.
Comparisons were grouped by gas flow CO2 removal, biomass or product productivity, product carbon origin, electron recovery, and whole-system energy or climate performance. Concentrations and volumetric productivities use g·L−1 and g·L−1·d−1 where justified; areal, electrode-normalized, illumination-hour, and biochemical bases remain explicit. Daily equivalents of hourly maxima are conversions, not measured 24 h averages. TS/VS and the stated ground, biofilm, electrode, and catholyte bases were retained. CO2UE retains the definition used in each study.
3. CO2 Stream Composition and Integration Conditions
A carbon-containing stream should be characterized by its origin, CO2 fraction, flow rate, accompanying constituents, and temporal variability [22]. The CO2 fraction affects its partial pressure and availability in the liquid phase but does not determine reactor loading alone: the same composition at a different flow rate implies a different carbon supply and contact time [23]. CO2 dissolution changes inorganic carbon equilibria and pH; increasing the supply can therefore alleviate substrate limitation or impair growth conditions [13]. Fossil or biogenic origin also affects the climate assessment of the product [6].
The significance of individual constituents depends on the platform biology. O2 serves as an electron acceptor for HOB and is produced during oxygenic photosynthesis, whereas it presents an obstacle during anaerobic acetogenesis that requires gas conditioning [24]. H2 supplies reducing equivalents in non-photosynthetic systems, while N2 may primarily dilute the feed or serve as a substrate for nitrogen-fixing cultures [25]. CO introduces a different carbon and electron balance from that of pure CO2 [26]. Sulfur and nitrogen oxides, gas temperature, and substances introduced with the medium require assessment of tolerance and treatment costs [13]. Stream suitability depends on matching the complete feed to the organism and product.
The CO2 source simultaneously affects carbon loading, gas conditioning, and the physiological requirements of the culture [27]. In a Tetraselmis subcordiformis study, biogas supplied for combustion contained 63.1 ± 1.2% CH4, 32.9 ± 1.7% CO2, 1.2 ± 0.3% O2, and 3.4 ± 0.6% N2, together with 70 ± 5 parts per million (ppm, by volume) H2S. Combustion produced gas containing 13.4 ± 1.2% CO2, 8.2 ± 0.9% O2, and 75.8 ± 2.3% N2; the corresponding fractions for coal–biomass co-combustion were 14.9 ± 1.7%, 6.9 ± 2.1%, and 73.7 ± 1.9% [23]. These compositions characterize specific streams and depend on fuel, excess air, and treatment. In PBRs with a working volume of 10 L, the gases were cooled to 20 °C, with a CO2 supply of 8.0 mg·min−1 and gas recirculation of 10.8 L·min−1. The gas–liquid contact intensity was therefore an important contributor to the result, alongside the CO2 concentration itself [23].
A lower CO2 fraction does not necessarily make a stream less suitable. In a C. vulgaris experiment using flue gas from a municipal heating plant, untreated gas contained 5.92 ± 0.31% CO2, 10.2 ± 2.1% O2, 801 ± 91 mg SOx·m−3, and 284 ± 21 mg nitrogen oxides (NOx)·m−3. After additional treatment, the CO2 fraction remained similar at 5.61 ± 0.22%, while SOx was reported as undetectable. The growth-phase biomass production rate increased from 0.1472 ± 0.0121 to 0.2810 ± 0.0162 g VS·L−1·d−1 [13]. This comparison shows that the observed benefit can arise from inhibitor removal rather than an increased carbon supply. The study used PBRs with a working volume of 120 L and pH-triggered gas feeding, limiting direct comparison with continuously sparged cultures.
Oxygen levels compatible with photosynthetic processes or aerobic HOB cultivation present a substantial obstacle during acetogenesis. Mohr et al. investigated a sequential system in which Parageobacillus thermoglucosidasius first removed O2 from a 50:50 CO/air mixture, after which Clostridium ljungdahlii utilized the H2 and CO2 produced. The first stage lasted 70 h; an initial 3.3 mmol CO yielded 0.52 mmol acetate, equivalent to 0.16 mol·mol−1 CO and approximately 63% of the theoretical maximum [24]. This result demonstrates biological feed conditioning rather than acetogen tolerance to oxygen-containing gas. The additional stage increases the process duration and requires its own medium and energy balance.
Gas separated during biogas upgrading differs from the flue gas produced through biogas combustion, and methane retention matters to the overall energy balance. Photosynthetic O2 production during contact with raw biogas can alter outlet gas quality even when CO2 is effectively removed. Conversely, supplying separated CO2 with external H2 enables gas-fed systems to operate without light. A pilot demonstration of biological methanation using contaminated CO2 from a biogas plant comprised two 1000 L trickle beds [28]. Such validation confirms the importance of real-stream operation, although archaeal activity cannot be directly extrapolated to bacteria or microalgae.
Carbon supplied as CO requires separate interpretation. CO oxidation can supply electrons while also producing CO2; syngas fermentation is therefore not process-equivalent to the reduction of pure CO2 with hydrogen [29]. An industrial pilot using engineered Clostridium autoethanogenum for acetone and isopropanol synthesis achieved continuous productivity of up to approximately 72 g·L−1·d−1 (daily equivalent of 3 g·L−1·h−1) and approximately 90% selectivity [26]. This is an advanced example of gas bioconversion, but its energetic conditions and electron balance differ from those of H2–CO2 operation. Any such comparison should account for the uptake of each gaseous constituent and CO2 formation through CO oxidation.
Supplying a dissolved one-carbon (C1) carrier reduces gas transfer dependence but adds a carrier production stage. Engineered Escherichia coli initially doubled in approximately 70 h on formate and CO2, with a yield of 1.5 g TS·mol−1 formate; adaptation reduced the doubling time below 8 h and increased the yield to 2.3 g TS·mol−1 [30]. Bicarbonate can provide a dissolved carbon and alkalinity reservoir, as demonstrated by an alkalihalophilic cyanobacterium [31]. Carrier carbon and production energy therefore belong in the system boundary. Table 1 summarizes stream compositions and outcomes. For T. subcordiformis, the reported CO2UE is estimated as 1.88 times the increase in dry biomass divided by supplied CO2 mass [23]. This metric represents a biomass-derived CO2 estimate rather than the biomass weight divided by the CO2 mass alone or a measured inlet–outlet molar flow removal efficiency.
Table 1.
Carbon stream compositions, operating parameters, and outcomes of biological utilization.
4. Assimilation Pathways and Energetic Constraints
4.1. The Calvin–Benson–Bassham Cycle and Carbon Concentration
The Calvin–Benson–Bassham (CBB) cycle comprises ribulose-1,5-bisphosphate (RuBP) carboxylation, 3-phosphoglycerate (3-PGA) reduction, and regeneration of the CO2 acceptor. The carboxylating enzyme is ribulose-1,5-bisphosphate carboxylase/oxygenase (RuBisCO). Synthesis of one triose phosphate molecule from three CO2 molecules requires nine adenosine triphosphate (ATP) molecules and six reduced nicotinamide adenine dinucleotide phosphate (NADPH) molecules, equivalent to three ATP and two NADPH per CO2 [37]. Pathway comparisons must use the same product basis: the cost of producing a triose is not equivalent to that of synthesizing acetate, lipids, or protein. CBB stoichiometry excludes cellular maintenance, biosynthesis, and the energy required to supply substrates.
RuBisCO also reacts with O2; local CO2–O2 availability affects carboxylation and competing reactions [38]. Carbon-concentrating mechanisms (CCMs) combine inorganic carbon transport and intracellular organization to increase CO2 near the enzyme [39]. Cyanobacterial carboxysomes depend on microcompartment structure [40] and scaffold interactions [41]. In many microalgae, the chloroplast pyrenoid serves a corresponding role; Essential Pyrenoid Component 1 (EPYC1) mediates RuBisCO condensation in Chlamydomonas reinhardtii [42].
Carbon supply must match energy availability. In Nannochloropsis oceanica, the favorable CO2 fraction rose from 6% to 50% as irradiance increased from 20 to 80 µmol photons·m−2·s−1 [32]. Synechocystis instead grew 2.7-fold more slowly at 30% than at 4% CO2 despite pH control at approximately 7.5 [14]. Process limitations therefore shift between carbon delivery, photon supply, and photosynthetic regulation according to the strain and conditions.
The CBB cycle also operates in non-photosynthetic bacteria. In C. necator, H2 oxidation and aerobic respiration generate ATP and reductant. Cultivation with an initial H2/CO2/O2 ratio of 85:10:2 and dissolved O2 below 1.6 mg·L−1 yielded 13.1 ± 0.4 g TS·L−1 [35]. Engineering a bacterial CCM into E. coli provides another route to improve carbon delivery [43]; however, transport costs and system stability remain relevant to host selection. Figure 2 links the CBB cycle to carbon concentration.
Figure 2.
Inorganic carbon concentration and assimilation through the Calvin–Benson–Bassham (CBB) cycle in microalgae and cyanobacteria. (A) Inorganic carbon transport and increased CO2 availability near RuBisCO. (B) Carboxylation, reduction, RuBP regeneration, and diversion of triose phosphates into biosynthesis. CCM, carbon-concentrating mechanisms; RuBisCO, ribulose-1,5-bisphosphate carboxylase/oxygenase; RuBP, ribulose-1,5-bisphosphate; 3-PGA, 3-phosphoglycerate; ATP, adenosine triphosphate; NADPH, reduced nicotinamide adenine dinucleotide phosphate. Authors’ schematic based on [37,40,41,42,43].
4.2. The Wood–Ljungdahl Pathway and Energy Conservation
The Wood–Ljungdahl pathway (WLP) channels two carbon units into acetyl-CoA, a derivative of coenzyme A (CoA): the methyl branch reduces CO2 through formate and tetrahydrofolate derivatives, whereas the carbonyl branch reduces it to CO [44]. The carbon monoxide dehydrogenase/acetyl-CoA synthase complex catalyzes the final combination of these units [45]. In homoacetogenesis, the overall product is acetic acid, with four H2 molecules required stoichiometrically per two CO2 molecules, as shown in Equation (1):
4 H2 + 2 CO2 → CH3COOH + 2 H2O
The ATP demand of the methyl branch is offset by substrate-level phosphorylation during acetate synthesis, whereas growth energy depends on additional coupling of redox reactions to an ion gradient [46]. CO2 assimilation in Acetobacterium woodii has been linked to the generation and use of a sodium gradient [47]. Aceticella autotrophica, an obligate autotroph using an energy-converting hydrogenase complex, exhibits a different organization. This species had a doubling time of 4.5 h at 60 °C and pH 6.0 without added NaCl; the reported standard free energy change for acetate formation was approximately −104 kJ·mol−1 [48]. This value does not represent the energy available in any reactor: at actual H2 and CO2 partial pressures and product concentrations, the thermodynamic driving force can be substantially smaller.
Engineering A. woodii yielded 438 mmol·L−1 acetic acid, 7.6 mmol·L−1 acetone, and 14.5 mmol·L−1 isopropanol [49], retaining acetate as the main product. In C. autoethanogenum, ATP homeostasis affected carbon partitioning [50]. Product engineering must therefore preserve energy conservation while improving selectivity and formation rates. Figure 3 outlines WLP organization.
Figure 3.
Organization of the Wood–Ljungdahl pathway (WLP) in acetogenic bacteria, including ATP synthesis mechanisms. The methyl branch supplies a methyl group, while the carbonyl branch supplies CO; ACS combines these with CoA to form acetyl-CoA. Subsequent conversion yields acetate, biomass, or reduced products. FDH, formate dehydrogenase; THF, tetrahydrofolate; CFeSP, corrinoid iron–sulfur protein; CODH, carbon monoxide dehydrogenase; ACS, acetyl-CoA synthase; CoA, coenzyme A; ATP, adenosine triphosphate. Authors’ schematic based on [45,47,48,50].
4.3. Alternative Natural Carbon Fixation Pathways
The reductive tricarboxylic acid (rTCA) cycle fixes CO2 through ferredoxin-dependent carboxylation reactions [51]. Reductive conversion of succinyl-CoA and 2-oxoglutarate, followed by citrate cleavage, supplies acetyl-CoA and regenerates the acceptor [52]. Classical experiments established ferredoxin involvement [53]. On a common glyceraldehyde-3-phosphate (G3P) basis, biochemical analysis yields five ATP for rTCA versus nine for CBB, with different electron-donor requirements [37].
When Chlorobium limicola M1 was grown phototrophically at 30 °C in a 1 L bottle with a CO2 gas phase, cell extract ATP-citrate lyase activity was 0.01–0.02 µmol acetyl-CoA·min−1·mg−1 protein; equimolar ADP and ATP caused approximately 50% inhibition [54]. These measurements describe enzyme regulation, which represents the relevant endpoint for this mechanistic example.
The 3-hydroxypropionate (3-HP) system of Chloroflexus aurantiacus combines acyl-CoA carboxylation and intermediate reduction [55]. Purified malonyl-CoA reductase had an activity of 10 µmol·min−1·mg−1 at 55 °C and an optimal pH of 7.8, whereas extracts of autotrophic and heterotrophic cells showed activities of 0.08 and 0.03 µmol·min−1·mg−1 protein, respectively [56]. While these pathways expand metabolic engineering options, such enzyme activities require cultivation-scale validation before flue gas applications. Figure 4 summarizes these mechanisms.
Figure 4.
Simplified organization of selected natural carbon fixation pathways. (A) The reductive tricarboxylic acid (rTCA) cycle, shown in the ATP-citrate lyase (ACL) variant. Citrate cleavage regenerates oxaloacetate and supplies acetyl-CoA for biosynthesis. (B) The 3-hydroxypropionate (3-HP) bicycle of Chloroflexus aurantiacus. CoA, coenzyme A; ATP, adenosine triphosphate. Authors’ schematic based on [37,53,54,56].
4.4. Synthetic Pathways and Host Engineering
Synthetic pathways can operate in cell-free systems [57,58] or be introduced into hosts that previously depended on organic carbon. Host engineering must integrate assimilation with energy supply, growth, and whole-cell regulation, as demonstrated for E. coli [59] and Pichia pastoris [60].
The synthetic crotonyl-CoA/ethylmalonyl-CoA/hydroxybutyryl-CoA (CETCH) cycle combines 17 enzymes from nine organisms and fixes approximately 5 nmol CO2·min−1·mg−1 protein in a cell-free system [58]. The protein-normalized rate characterizes the reaction network rather than a cultivation process.
Converting E. coli to growth with CO2-derived biomass carbon required approximately 200 days of adaptive evolution and yielded a doubling time of 18 ± 4 h [59]. Formate oxidation still supplied energy and could release CO2. A separate reductive-glycine strategy enabled formate-supported growth with a doubling time below 8 h after adaptation [30]. Both routes therefore require including the energy–substrate balance.
Engineering Pichia pastoris involved eight heterologous genes and three native gene deletions. With CO2 as the carbon source and methanol supplying energy, maximum specific growth increased from 0.008 to 0.018 h−1 after adaptation [60]. Deployment requires stable target product formation without continuous selection, acceptable cofactor and energy inputs, and recovery. Table 2 relates these mechanisms to their experimental endpoints.
Table 2.
CO2 assimilation pathways with examples of organisms, conditions, and outcomes.
5. Microalgae and Cyanobacteria
5.1. Biological Basis and Microorganism Selection
Microalgae and cyanobacteria both use light to generate the energy and reducing power required for CO2 assimilation [62]. From a process perspective, they form a photosynthetic platform, although eukaryotic microalgae [42] and prokaryotic cyanobacteria [40] differ in cellular organization, carbon-concentrating mechanisms, and opportunities for metabolic modification. Their joint assessment should consider photon availability, inorganic carbon speciation, nutrients, and product recovery. Increasing the CO2 supply does not resolve light limitation or nitrogen and phosphorus deficiencies [10].
Organism selection depends on medium properties and intended product use. Chlorella vulgaris is a representative host for freshwater cultivation [13], whereas Nannochloropsis [10] and Tetraselmis [23] require appropriate salinity. Among cyanobacteria, Arthrospira platensis is used for biomass production [63], while Synechococcus elongatus [64] and Synechocystis sp. PCC 6803 [65] also serve as hosts for secreted metabolite synthesis. Wastewater cultivation additionally requires assessment of mixotrophy and bacterial interactions. Biomass growth may incorporate organic carbon from the medium or CO2 generated by its oxidation; consequently, gas removal alone does not establish the origin of the product carbon [66].
Photosynthetic biomass does not have a constant composition. In T. subcordiformis supplied with different gases, protein accounted for 28.9–30.0% TS, lipids for 7.2–8.1% TS, and carbohydrates for 36.5–37.2% TS; the total carbon content was 539–577 mg·g−1 TS [23]. Product selection therefore changes the optimization criterion: maximizing biomass growth, sugar secretion, or polymer accumulation requires different conditions [67]. Cyanobacteria producing sucrose [64] or isoprene [65] allow metabolite recovery without harvesting all cells each time, but they require construct stability and effective product separation.
5.2. Operating Conditions and Process Parameters
The principal parameters are photon flux, optical path length, temperature, pH, salinity, nutrient supply, and CO2 loading [68]. Gas delivery should ensure carbon availability while limiting acidification and outlet losses. In suspension cultures, increasing the cell concentration intensifies self-shading [10]; in attached systems, biofilm thickness and resistance within the support become important [69]. Reactor geometry therefore affects both gas transfer and light availability [70].
In the outdoor Nannochloropsis comparison introduced in Section 1, vertical configurations outperformed horizontal systems under the same climate. The maximum photosynthetic efficiencies were 4.2% for the vertical tubular reactor, 3.8% for the flat panel, 1.8% for the horizontal tubular system, and 1.5% for the raceway [10]. The flat panel yielded the highest average productivity and efficiency among vertical configurations. Annual designs must also allow for fouling, seasonal changes, and restart losses.
Rao et al. reported 1.24 g TS·L−1 at 6% CO2 and 20 µmol photons·m−2·s−1, 2.12 g TS·L−1 at 30% and 60 µmol·m−2·s−1, and 2.45 g TS·L−1 at 50% and 80 µmol·m−2·s−1 with N. oceanica [32]. The contrasting Synechocystis response highlights strain-dependent regulation [14]. For S. elongatus in a capillary PBR, favorable conditions included 10% CO2, an initial pH of 8.2, BG11 medium, 27 °C, and 3000 lx; medium recirculation ranged from 34.4 to 86.6 mL·min−1. The culture reached 2.1 g TS·L−1, a specific growth rate of 1.76 d−1, and reported biofixation of 2.08 g CO2·L−1·d−1 [33]. Lux cannot be converted to photon flux without the light spectrum.
Immobilization and biofilms increase cell retention but do not eliminate loading constraints [71]. In the system studied by Dębowski et al. using a model gas containing 25% CO2, increasing the flow rate from 25 to 200 L·h−1 reduced the percentage removal from approximately 40 to 5.9% [69]. In a year-round greenhouse pilot with 15 panels and 90 m2 of biofilm area, the average productivity was 3.07 g TS·m−2 system footprint·d−1 [70]. The first result describes the effect of contact time; the second describes sustained operation with a specific geometry. The system-footprint basis and year-long averaging distinguish this result from seasonal PBR maxima. Figure 5 compares these cultivation configurations.
Figure 5.
Photosynthetic cultivation in three configurations: (A) an open raceway with suspended cells; (B) a flat-panel photobioreactor (PBR); (C) a biofilm on a support surface. Authors’ schematic based on [10,69,70].
5.3. Research Findings and Deployment Constraints
Real-gas cultivation is constrained by inhibitors, acidification, and declining activity during the cultivation cycle [72]. Gas loading and conditioning should therefore be selected for sustained production rather than maximum short-term removal.
C. vulgaris on biogas-combustion flue gas reached 0.780 ± 0.058 g VS·L−1, with a growth-phase production rate of 0.0778 ± 0.0031 g VS·L−1·d−1 [12]. A. platensis achieved 0.209 ± 0.017 g VS·L−1·d−1 and 2.040 ± 0.049 g VS·L−1, with gas-phase CO2 decreasing from approximately 13 to 1.3% [63]. Both studies also reported acidification and premature culture decline. The desulfurization experiment described in Section 1 and Section 3 identifies gas conditioning as an actionable intervention [13]; its value depends on the additional stable production relative to conditioning costs.
For T. subcordiformis on coal–biomass flue gas, the reported biomass production rate was 0.286 ± 0.009 g VS·L−1·d−1 with a maximum concentration of 2.710 ± 0.091 g VS·L−1 and CO2UE of 46.7 ± 2.4%. With biogas-combustion flue gas, CO2UE was 43.1 ± 3.1%, whereas the reported reduction in the gas-phase CO2 fraction was 90.3 ± 3.2% [23]. The biomass-based estimate and gas-fraction change quantify different endpoints. A separate 6000 L Chlorella LJ34 pilot reportedly removed 85.3% of the nitrogen and 76.7% of the phosphorus from an industrial concentrate supplied with flue gas containing 13% CO2 [73]. This result supports an integrated treatment function, while biomass quality remains a separate requirement.
Engineered cyanobacteria enable targeted synthesis [74]. S. elongatus expressing CscB secreted up to 0.0361 g sucrose·L−1·h−1 of illumination and exceeded a cumulative sucrose production of 10 mmol·L−1 [64]. An engineered PCC 7942 strain sustained 2,3-butanediol production for 21 d, with a cumulative production of 2.38 g·L−1 and a maximum 3-day average rate equivalent to 0.236 g·L−1·d−1 [75]. Synechocystis PCC 6803 produced up to 0.148 g isoprene·L−1·d−1 without continuous antibiotic selection [65]. PHB accumulation during nitrogen starvation can instead use previously stored glycogen; a 21-day experiment recorded final optical densities of approximately 0.51 for an enhanced-lysis variant and 1.15 for the other variants and the wild type [76]. Product secretion, construct stability, and whole-cycle yield therefore guide process design.
Deployment prospects combine natural light, local nutrients, and a defined product market [77]. The main constraints are seasonality [10], dilute biomass recovery [78], and contaminants; wastewater-treatment value can materially affect economics [79]. Carbonate precipitation adds another carbon-containing product [80,81]. A newer cultivation model further identifies inoculum design and culture failure frequency as cost drivers [82]. Table 3 separates production, CO2 metrics, and this economic benchmark.
Table 3.
Microalgae and cyanobacteria: production, CO2 metrics, and an updated cultivation-cost benchmark.
6. Acetogenic Bacteria
6.1. Biological Basis and Microorganism Selection
Acetogens use the Wood–Ljungdahl pathway to assimilate C1 units and conserve energy, enabling anaerobic production of acetate and other metabolites without illumination [45]. In H2–CO2 operation, carbon and electrons are supplied separately [47]; in CO-containing gas, one molecule can serve both functions [50]. Distinguishing these feeds is fundamental to assessing the amount of CO2 actually converted into product and the energy input associated with the reductant [84].
Strain selection depends on energy conservation, product tolerance, growth, and engineering potential. A. woodii uses a sodium gradient [47], whereas C. ljungdahlii uses proton-coupled electron transport involving the Rnf complex [85]. A comparison of eight less-characterized acetogens with A. woodii identified S. ovata and A. wieringae as promising hosts [86]. Their process performance still depends on cultivation and recovery conditions.
Redirecting synthesis from acetate to a solvent must preserve the cell’s capacity to obtain energy [87]. In C. autoethanogenum, changes in ATP homeostasis affected carbon partitioning [50]. Metabolic engineering can increase product value but requires parallel comparison of selectivity, formation rate, and gas consumption. Acetogenesis is particularly attractive when low-emission H2 and CO2 can be supplied continuously and the product can be recovered before inhibitory concentrations are reached.
6.2. Operating Conditions and Process Parameters
The parameters governing the process rate include the anaerobic conditions, H2 and CO2 partial pressures, gas–liquid transfer, temperature, pH, as well as cell and product residence times [88]. An insufficient H2 supply limits both carbon reduction and the energetic driving force. Acidification changes the fraction of undissociated acid, while increasing cell retention without adequate product recovery can sustain biomass with declining activity [61].
The operating range is organism-dependent. Aceticella autotrophica 3443-3AcT had a doubling time of 4.5 h at 60 °C and pH 6.0 without added NaCl [48]. A thermophilic mixed-culture biofilm reactor was operated at 55 °C and a hydraulic retention time (HRT) of 1 d [89]. The trickle-bed reactor studied by Steger et al. was supplied with H2/CO2 = 70:30 at a gas flow rate of 3.8 mL·min−1 and a medium recirculation rate of 10 mL·min−1; the pH was adjusted to 7 ± 0.3 once daily [34]. These represent different cultivation strategies rather than the limits of a shared operating tolerance.
Product recovery and biocatalyst maintenance can be more important than simply increasing the cell concentration. In A. woodii cultures with microfiltration, complete cell retention decoupled the biomass residence time from the medium exchange rate, but inhibition was still observed above 8–12 g acetate·L−1 [61]. Medium composition also requires control: yeast extract supplies growth factors and organic carbon, while glucose used during trickle-bed start-up changes product partitioning [34]. Their contributions must be included in the assessment of autotrophy.
6.3. Research Findings and Deployment Constraints
For a fixed target product, volumetric productivity determines vessel capacity, product concentration affects separation duty, and cell retention controls washout. Joint optimization is more informative than maximizing any one of these variables.
S. ovata cultures achieved 17.96 g acetate·L−1·d−1, a specific rate of 21.03 g acetate·g−1 TS·d−1 and a final concentration of 32.2 g·L−1 [86]. Continuous A. woodii cultivation with full cell retention reached almost 14 g TS·L−1 and a maximum of 148 g acetate·L−1·d−1 under the highest dilution rate and increased yeast extract supply [61]. These results underscore that performance depends on process selection rather than species-specific differences alone.
A thermophilic biofilm at 55 °C achieved 42.4 g acetate·L−1 in batch and up to 10.5 g·L−1·d−1 continuously; acetate represented more than 98.5 and 99.1% of the total volatile acids, respectively [89]. A trickle-bed reactor without initial glucose addition produced approximately 1 g acetate·L−1·d−1, with at least 85% of the acetate carbon derived from CO2 [34]. This last percentage is a product carbon origin metric.
The engineered A. woodii product distribution described in Section 4.2 retained acetate as the main stream [49]. The industrial C. autoethanogenum solvent pilot reached approximately 90% selectivity with a daily-equivalent productivity of up to 72 g·L−1·d−1 on CO-containing gas [26], but switching to H2–CO2 changes the electron and energy supply. Reductant availability, product recovery, and real-gas stability determine deployment. Table 4 provides daily unit comparisons where the source basis permits them.
Table 4.
Acetogens, HOB, and electrosynthesis: production and CO2 metrics with selected daily unit conversions.
7. Hydrogen-Oxidizing Bacteria
7.1. Biological Basis and Microorganism Selection
Hydrogen-oxidizing bacteria use H2 as an electron and energy source, with O2 as the terminal respiratory electron acceptor [35,97]. CO2 assimilation is therefore coupled to the supply of three gaseous substrates, the demand for which changes with growth and biomass composition. Production without illumination is an advantage; however, dependence on H2 generation, gas transfer, and the control of their relative supplies are constraints [11].
C. necator H16 is a well-characterized host for biomass and PHB production [35,98]. Choosing between protein or polymer changes the cultivation requirements: growth and protein synthesis require available nitrogen [25], whereas nitrogen limitation can redirect carbon into storage material [36]. A final cell concentration that includes polymers is therefore not equivalent to the active biomass concentration or protein yield.
The nitrogen source also affects the culture structure and metabolic cost. Studies have compared ammonium assimilation with N2 fixation [25] and examined co-cultures of nitrogen-fixing bacteria [99]. Single-cell protein (SCP) production may increase product value [100], but the crude protein content calculated from nitrogen must be complemented by amino acid composition, digestibility, and contaminant measurements [101]. For waste gas cultivation, product specifications must be assessed together with feed conditioning [102].
7.2. Operating Conditions and Process Parameters
Control should match H2, CO2, and O2 supplies to consumption rates while accounting for gas lost at the outlet. Increasing pressure improves substrate availability but changes the compression energy demand [90]; increasing the O2 supply must be consistent with the cellular activity and equipment conditions [103]. Feed gas composition and dissolved O2 concentration describe different levels of control and should be reported separately [35].
The C. necator H16 gas cultivation example used explosion-protected equipment [35]. A diluted H2/O2/CO2/N2 mixture at a ratio of 3.6:7.6:12.3:76.5 was used over 144 h in another configuration [36]. Continuous electrolysis-coupled cultivation operated at 6 A, equivalent to 133 A·m−2, and an HRT of 1.55 d [91]. These configurations require separate consideration of headspace composition, dissolved O2, and medium exchange.
Hydrogen–oxygen cultivation also requires an operating safety envelope for feed lines, headspace, and off-gas. Dissolved O2 control alone does not demonstrate a nonflammable gas phase. The H16 study used explosion-protected equipment, separate gas supplies, gas monitoring, non-return protection, inert purging, and strong ventilation [35]; dilution was explored in another approach [36]. Scale-up must assess gas accumulation during normal operation, start-up, shutdown, and feed or mixing failure. Monitoring, interlocked isolation, ventilation, and appropriately rated equipment add capital, maintenance, and utility costs.
A two-stage process comprising growth on glycerol followed by PHB accumulation from CO2 increases the initial biocatalyst mass available for the gas-fed phase [104]. Product formation must nevertheless be accounted for separately from biomass originating from organic carbon. Models separating residual biomass and polymers show that their formation rates and limitations differ [105]. Similarly, medium and gas supply optimization must be considered jointly, rather than attributing the entire improvement to pressure or a single constituent.
7.3. Research Findings and Deployment Constraints
HOB assessment should prioritize biomass productivity and composition, substrate consumption, and energy per unit of the intended protein or polymer. Nitrogen-based crude protein estimates require complementary quality measurements, while polymer accumulation must be distinguished from residual cell growth.
The laboratory H16 culture described in Section 4.1 contained 79 ± 2% PHB, with approximately 98% of the polymer derived from CO2 [35]. PHB reached 70% of the cell mass under nitrogen limitation in a diluted gas mixture [36]. Model-based gas control and medium optimization enabled approximately 75% PHB at a biomass concentration of 53 g TS·L−1 [11]. These findings support polymer production, while reductant losses and recovery determine whole-process performance.
In pressurized fermentation, the PHB concentration increased from 10.8 g·L−1 at 1.5 bar to 29.6 g·L−1 at 3 bar, but increasing the pressure to 4 bar did not maintain a simple trend [90]. Studies of automatic O2 control likewise demonstrated the importance of matching supply to demand [103]. Intensification therefore requires confirmation of productivity and energy consumption across the full cycle, alongside final concentration; increased gas solubility alone does not guarantee a proportional benefit.
Continuous SCP cultivation reportedly achieved 0.89 g TS·L−1·d−1, 72% protein, approximately 94% CO2 utilization, and nearly complete H2 and O2 utilization; productivity was 7.4-fold higher than the batch comparison [91]. A separate atmospheric pressure 100 L pilot reported 10.8 ± 0.6 g TS·L−1·d−1, with a maximum near 12 g TS·L−1·d−1, and approximately 60% crude protein [92]. Testing an energy advantage requires matched electricity, gas delivery, and recovery inventories per unit of SCP.
HOB deployment requires low-emission energy and H2 [106], stable cultivation, and verified product quality. Photovoltaic–protein models include energy-generation land and equipment in addition to the fermenter [107]. Gas supply interruptions, restart losses, and safe feeding protocols also affect plant utilization. Table 4 records production and gas utilization endpoints separately.
8. Microbial Electrosynthesis and Hybrid Systems
8.1. Biological Basis and Microorganism Selection
Microbial electrosynthesis (MES) supplies electrons for CO2 reduction from an external electrical circuit [108]. The biocatalyst may be a pure acetogenic culture or an enriched microbial community [109]. Electron transfer occurs through interaction with the electrode or via H2 generated at the cathode [93]. Biofilm presence alone does not establish which mechanism dominates [110]; culture selection should be linked to the electron supply mechanism and product selectivity.
This process configuration partly uses the same metabolic functions as gas-fed acetogenesis [111] or HOB cultivation. Hybrid systems couple water electrolysis with microbial CO2 assimilation [112], while photosensitization can supply reducing equivalents through a semiconductor [113]. A comparison with a photosynthetic reactor therefore requires accounting for electricity generation and the regeneration of non-biological components.
8.2. Operating Conditions and Process Parameters
Key parameters include electrode potential, current, whole-cell voltage, cathode area, catholyte volume, pH [114], and the residence times of the medium and biocatalyst. Increasing the current can increase electron and H2 supplies without necessarily increasing the fraction of electrons directed to the target metabolite. Comparisons should distinguish electrode area from reactor volume and coulombic efficiency from energy efficiency [94].
A porous biocathode experiment used approximately 102 A·m−2 electrode area [93], while a continuous carbon-foam system operated at 8 A·L−1 catholyte [94]. Geometry is therefore needed to compare current intensity. Membrane acid extraction limits product accumulation [115] but introduces electrical resistance and durability requirements [116].
Reactor development should couple biological productivity to gas recovery and separation energetics [18]. In particular, H2 leaving a cathode-fed culture must be included in the electron and energy accounting [94].
8.3. Research Findings and Deployment Constraints
For acetate production, the volumetric rate and product concentration provide useful engineering comparisons when the volume basis and averaging interval are explicit.
A porous biocathode reportedly achieved 685 ± 30 g acetic acid·m−2 electrode area·d−1, up to 11 g·L−1, 94 ± 2% CO2 recovery in the product, and 100 ± 4% electron recovery [93]. The carbon-foam system achieved a daily-equivalent maximum of 18.72 g acetate·L−1·d−1 (0.78 g·L−1·h−1). The combined H2 and acetate coulombic and energy efficiencies were approximately 80–100% and 35–42%; acetate alone reached maxima of 35% and 12%, respectively [94]. This identifies product selectivity, rather than total electron recovery, as the relevant improvement target.
Recent MES benchmarks change the rate assessment. A compact plate reactor with Thermoanaerobacter kivui reportedly reached a daily-equivalent maximum of 84 g acetic acid·L−1 catholyte·d−1 (3.5 g·L−1·h−1), at 14 g·L−1 [95]. An ED–MES system reported a mean acetate rate of 4.32 g·L−1·d−1, 84% whole-process coulombic efficiency, and 98.7% lower NaOH consumption [96]. While these results shift attention toward sustained selectivity and integrated recovery, they do not encompass a complete energy inventory. Furthermore, the NaOH saving is not an equivalent reduction in total cost.
Coupling water splitting with C. necator yielded a reported CO2 reduction energy efficiency of nearly 50% relative to the electricity input and approximately 180 g of CO2 removed·kWh−1 [117]. CdS-based photosensitization enabled acetic acid synthesis by a non-photosynthetic bacterium [113]. Solar and electrical conversion efficiencies retain different denominators [118]; catalyst regeneration and constituent release also require assessment.
Further intensification should combine active biofilm retention [119] with target product recovery and acceptable whole-cell energy demand [18,94]. Table 4 preserves reactor volume and measurement period qualifications alongside daily unit rates.
9. Reactors, Gas Transfer, and Operational Stability
9.1. Substrate Supply and Membrane Functions
In gas-fed bioprocesses, the production rate depends on substrate delivery to the active biomass [120]. For suspensions, this is described in part by the volumetric mass transfer coefficient (kLa); biofilms introduce additional resistance within the biofilm and support. Increasing the contact area, recirculation, or pressure can improve gas supply while also increasing energy demand. Configurations should therefore be assessed in terms of gas transfer, biological performance, and operational stability [121].
A comparison of hollow-fiber, trickle-bed, and stirred reactors found maximum mass transfer coefficients of 1062, 421, and 114 h−1, respectively. However, these measurements used O2 as the test gas, and the best-performing hollow-fiber module was made from non-porous polydimethylsiloxane [121]. These results describe specific configurations rather than H2 or CO2 transfer measurements during cultivation.
For CO in a composite hollow-fiber module, a maximum of 946.6 h−1 was measured at a liquid recirculation rate of 1500 mL·min−1 and a gas overpressure of 206.8 kPa; the tested ranges were 300–1500 mL·min−1 and 34.5–206.8 kPa [122]. Intensification required changes to the hydraulic conditions and pressure, which are both associated with energy consumption. A comparison with a bubble-based culture should consider production and gas utilization per unit of energy input rather than the highest transfer coefficient alone.
Membranes can separate gases, deliver substrates, or retain cells. Direct CO2 delivery to an H2-fed biofilm has been demonstrated [123]. In S. elongatus, hollow-fiber wetting and gas composition affected both transfer and cultivation [33]. Cell-retaining filtration instead decouples the biomass residence time from the medium exchange rate, as demonstrated for A. woodii [61]. Figure 6 distinguishes gas delivery from cell retention; active membrane area, culture volume, and pumping or filtration energy are separate design quantities.
Figure 6.
Membrane functions in bioreactors. (A) H2 and CO2 delivery. (B) Cell retention by a submerged filtration membrane, with independent culture sparging and permeate recovery. SRT, solids retention time; HRT, hydraulic retention time. Authors’ schematic based on [61,123,124].
9.2. Biofilms, Retention, and Variable Supply
In biofilms supplied with gas from the fiber side and nutrients from the liquid side, increasing thickness does not proportionally increase active biomass. A mixed H2–CO2 culture on hollow fibers reached 7.4 g·L−1 acetate, 1.8 g·L−1 butyrate, 0.98 g·L−1 caproate, and 0.42 g·L−1 caprylate, with reported complete H2 utilization [124]. A broader product range was an advantage, whereas separation of the mixture remained a constraint. H2 uptake efficiency in such a system does not establish target compound selectivity or isolation cost.
Retention limits washout of slow-growing cells but can also sustain low-activity biomass and inhibitor accumulation. Assessing functional recovery after cleaning requires parallel measurements of active biomass, production rate, and substrate consumption [61]. In photosynthetic cultures, a support or contactor additionally changes the light distribution [33]. Increasing the CO2 transfer area can shift the limitation toward photon availability, which should be assessed under comparable illuminations and geometries [10].
Variable renewable energy supply makes restart performance important. Two 1000 L biological methanation beds tolerated H2 interruptions of 12–72 h and recovered previous performance within 6–12 h [28]. Another 800 L bed was validated over approximately 450 days with two shutdowns [125]. These archaeal examples provide benchmarks for test duration and interruption protocols.
Year-round biofilm operation [70] complements seasonal PBR measurements [10] by revealing annual performance. For hydrogen-based systems, gas control improvements [11] should likewise be tested across start-up and interruptions. Table 5 summarizes the equipment evidence.
Table 5.
Reactor configurations and quantitative examples of intensification.
10. Capture Balance, Energy, and Costs
10.1. Consistent Metrics and System Boundary
CO2 removal efficiencies should be calculated using inlet and outlet molar flow rates rather than the difference in volume fractions alone. O2 production, H2 uptake, humidity, and auxiliary gas supply change the total flow rate. In the T. subcordiformis experiment, comparing 13.4% inlet CO2 with 1.3% at the outlet, alongside an increase in O2 from 8.2 to 21.3% [23], does not automatically yield a reduction in CO2 molar flow identical to the reduction in its fraction. Equation (2) provides the basis for calculating gas removal efficiency:
where qCO2,in and qCO2,out denote the inlet and outlet CO2 molar flow rates, respectively, and ηCO2 is the percentage removal efficiency.
Biologically retained carbon includes increases in cellular and metabolite carbon, accounting for initial biomass, organic carbon inputs, and changes in dissolved inorganic carbon. The relationship between biomass productivity and the equivalent CO2 flux uses the measured carbon fraction and a molar mass ratio of 44:12, as shown in Equation (3). A carbon fraction of 50% corresponds to 1.83 kg CO2 per kilogram of newly formed TS biomass. This is not a universal constant: T. subcordiformis contained 539–577 mg total carbon·g−1 TS, whereas productivity was reported on a VS basis [23]. Conversion therefore requires the TS/VS relationship and identification of carbon origin.
where PX is biomass productivity on a TS basis, fC is the mass fraction of carbon in TS, and rCO2,biomass is the equivalent CO2 retention rate. Units of mass and time, as well as the areal or volumetric reference basis, must be consistent.
A common cradle-to-grave boundary covers CO2 origin and conditioning; electricity, heat, and H2 generation; gas delivery; nutrients and cultivation; product recovery; equipment manufacture and replacement; and product use and end of life. Energy and emissions should be reported per functionally equivalent product or treatment service, with the same counterfactual and allocation rules. Avoided fossil production and captured carbon must not receive duplicate credits. Table 6 applies this boundary to platform selection; missing inventories are retained as gaps rather than assigned zero burdens.
Table 6.
Common resource requirements, validation evidence, and deployment limits of microbial platforms.
Electron accounting in H2-fed and electrochemical processes should include target products, biomass, byproducts, and unconsumed H2. The selectivity contrast in Section 8.3 [94] illustrates why aggregate electron recovery is insufficient for product valuation. Energy inventories should include gas treatment and delivery, mixing, temperature control, illumination, electrolysis, and recovery.
10.2. Energy Demand and Illustrative Cost Cases
Equation (1) yields a stoichiometric minimum of approximately 0.092 kg H2 per kilogram of CO2 converted to acetic acid. At an explicitly assumed 50 kWh·kg−1 H2, the electrolysis-only minimum is 4.6 kWh·kg−1 CO2, costing EUR 0.23–0.46 at illustrative electricity prices of EUR 0.05–0.10·kWh−1. Alternatively, purchasing H2 at an assumed EUR 2–6·kg−1 yields a reductant cost of EUR 0.18–0.55·kg−1 CO2; this replaces the electrolysis electricity term. These are sensitivity calculations, not market quotations or plant costs. Actual gas losses, biomass formation, compression, and recovery increase the requirements.
The 2020 MES assessment [18] provides a model-based case rather than a plant energy measurement. It includes reactor assets, electricity, medium, and CO2, initially without product separation; recovery is assessed in a separate purification scenario. No external H2 production unit is required in this electrochemical configuration. Electricity costs were varied from EUR 0.03 to 0.09·kWh−1; the base scenario became profitable near EUR 0.045·kWh−1 or below. Product use lay outside the model boundary. This threshold depends on the modeled performance and cannot be generalized to present-day MES installations.
Historical costs provide context rather than a common price scale [126]. A 2016 model estimated EUR 3.4·kg−1 TS for cultivation and projected EUR 0.5·kg−1 after ten years; the latter was not a measured outcome [127]. A 2017 floc-based assessment reported EUR 0.25–0.50·m−3 wastewater treated and EUR 5.29–8.07·kg−1 TSS [79]. Aquafeed assessment also depends on lighting and product value [128]. Different cost years, functions, and boundaries prevent direct price ranking [129].
A newer algal model [82] covers inoculum production, raceway cultivation, and dewatering. The minimum biomass selling prices were USD 1130–1200·t−1 for semi-continuous operation and USD 1380–2040·t−1 for batch operation. The semi-continuous advantage disappeared at a modeled mean time to culture failure of 26 d; batch cultivation reached comparable costs at productivities above 28 g·m−2·d−1. This strengthens the emphasis on culture reliability and seed-train design; the prices exclude subsequent fuel conversion and are not costs per tonne of CO2 removed.
A pilot-based algal fuel assessment [130] followed direct flue gas feeding through PBR cultivation, flotation and centrifugation, hydrothermal liquefaction, H2-assisted upgrading, and fuel use. Reactor, compressor, and LED electricity consumption was 0.93 kWh·kg−1 dry algae, excluding building climate control; upgrading H2 was derived from natural gas reforming with CO2 capture. At the model electricity price of USD 69·MWh−1, the fuel costs were USD 12–16 per gasoline gallon equivalent. The net emissions were approximately 68 g CO2-equivalent·MJ−1 for fossil CO2 and −4 for biogenic CO2. These scenarios included source and displacement credits but excluded construction burdens. The negative result is conditional on those boundaries [131]. Protein assessments likewise require the appropriate product function and the published correction to earlier calculations [132]. LCA and TEA should therefore be interpreted for a defined configuration [133].
10.3. Carbon Fate and Remaining Inventory Gaps
Biomineralization adds a mineral carbon output to biomass production. N. oceanica IMET1 was tested at 1 and 500 L with 10 and 5% CO2, respectively, and 0.02 mol·L−1 NaHCO3. At 1 L, biomass reached 1.52 g TS·L−1 on day 12, with an additional carbonate-associated capture of 9.3%. At 500 L, additional cell retention reached 60% on day 40, while the maximum reported capture rate was 63.2 g CO2·m−2·d−1 on day 35 [81]. CaCl2-assisted Chlorella HS2 cultivation increased the cumulative biomass production 4.67-fold and the source fixation metric 10.9-fold [83]. Net retention additionally requires reagent origin and alkalinity accounting, phase stability, and end-of-life evidence; dissolved carbon inputs cannot be credited again as newly captured gaseous CO2.
11. Deployment Barriers and Development Prospects
Deployment requires matching the platform to the feedstock, energy, land, and product demand [134]. Waste CO2 integration may combine treatment and production value [79], but the relevant comparator must provide the same function [6]. Table 6 translates the evidence into engineering selection criteria under the system boundary defined in Section 10.1.
The scale constraint on photosynthesis can be estimated from published productivities. For a hypothetical stream of 1 t CO2·h−1, a carbon fraction of 50%, and a productivity of 19–24 g TS·m−2·d−1 from the outdoor vertical configuration experiment [10], Equation (3) yields approximately 55–69 ha of productive area to fix the entire stream. This calculation excludes service spacing and seasonal deterioration. The productivity range reflects only the experimental period; it is not a forecast of annual plant performance. Deployment may be justified for part of the CO2 stream if cultivation also treats a liquid stream or produces a product of sufficient value to cover the inputs.
Integration with waste streams requires contaminant control and product specifications [135]. The industrial concentrate pilot [73] supports a combined treatment function; desulfurization [13] supports stable cultivation. Neither observation alone demonstrates that biomass meets food or feed specifications because removed contaminants may enter the product.
For HOB, energy-generation land and electrolysis capacity must be included alongside the compact fermenter [107]. Safe gas delivery, biomass recovery, and quality assurance also contribute to the equipment and operating requirements.
For acetogens, the central decisions concern H2 delivery, retention, inhibition, and acid or solvent recovery [34,61]. New MES rate benchmarks strengthen the case for process intensification, but electricity consumption and extraction remain decisive. Selecting MES over separate electrolysis and fermentation requires a demonstrated whole-process advantage [18,94].
Technology selection should first test light, land, and low-emission reductant availability, then gas compatibility and the intended product. Productivity, recovery, stability, and cost should subsequently be compared within that application. Table 6 provides this sequence without assigning a universal platform ranking.
Laboratory results establish biological feasibility or short-term rate potential; pilot demonstrations establish operation at a stated scale and feed. The 6000 L algal [73] and 100 L HOB [92] pilots demonstrate scale, while one-year biofilm monitoring [70] addresses seasonal operation. Approximately 450 d for archaeal methanation [125] remains a reactor stability comparator. Neither scale nor continuous operation alone establishes industrial durability. Further validation should test feed variability, shutdown/restart, material life, and product quality. Figure 7 links these requirements to specific installations.
Figure 7.
Evidence required to assess the deployment potential of biological CO2 conversion.
12. Conclusions
Microbial CO2 utilization should be selected for a defined site, feedstock, and product. Practical advantage depends on matching biological conversion to energy supply, recovery, and market requirements.
Microalgae and cyanobacteria suit sites with natural light, land, and local nutrients. Annual net productivity per occupied area, seasonality, harvesting, and contaminant transfer govern scale-up. CO2 tolerance does not establish tolerance to the complete flue gas; desulfurization, pH control, and biomass quality remain important for integration with waste streams.
Acetogens enable anaerobic chemical production with reliable reductant supply and effective product recovery. Cell retention does not eliminate product inhibition or gas transfer limitations. Results from CO-containing feeds require separate validation for H2–CO2 operation because their carbon and electron balances differ.
HOB support protein and polymer production with low-emission H2, safe gas feeding, and verified product quality. Protein-rich biomass requires nutritional and purity assessment. Compact fermenters must be assessed together with electrolysis, gas recirculation, reductant losses, and biomass separation.
Engineered cyanobacteria require stable product formation without continuous selection and effective recovery. While recent MES benchmarks improve rate feasibility, selectivity, electricity demand, electrode/membrane life, and extraction determine whole-process advantage.
Climate assessment must include CO2 origin, energy and reductant production, conditioning, cultivation, recovery, equipment, and product fate against a functionally equivalent reference. Biomass and biodegradable products generally retain carbon temporarily. Durable removal requires verified storage. Biomineralization also requires accounting for bicarbonate and alkalinity origin, reagent consumption, and mineral stability.
The priority evidence for technological readiness comprises closed mass and energy balances, sustained operation on real gases, recovery after interruptions, material durability, and product quality. Economic assessments should test energy prices, emission intensity, plant availability, and separation duties, with missing inventories stated explicitly.
Author Contributions
Conceptualization, M.Z., J.K., and M.D.; methodology, M.Z., J.K., and M.D.; investigation, M.Z., J.K., and M.D.; resources, M.Z., J.K., and M.D.; visualization, M.Z., J.K., and M.D.; writing—original draft preparation, M.Z., J.K., and M.D.; writing—review and editing, M.Z., J.K., and M.D. All authors have read and agreed to the published version of the manuscript.
Funding
This research was financially supported by Grant Nos. 29.610.023-110 of the University of Warmia and Mazury in Olsztyn and WZ/WB-IIŚ/3/2025 of the Bialystok University of Technology, funded by the Ministry of Science and Higher Education.
Institutional Review Board Statement
Not applicable.
Informed Consent Statement
Not applicable.
Data Availability Statement
No new experimental data were generated in this review. The information discussed is available in the cited publications.
Acknowledgments
During the preparation of this manuscript, the authors used ChatGPT (OpenAI, GPT-6, Codex Work Mode) to assist with literature searches, English translation, and language editing. The authors take responsibility for the content of this publication.
Conflicts of Interest
The authors declare no conflicts of interest.
Abbreviations
The following abbreviations are used in this manuscript:
| ADP | Adenosine diphosphate |
| ATP | Adenosine triphosphate |
| BG11 | Mineral culture medium for cyanobacteria |
| CBB | Calvin–Benson–Bassham cycle |
| CCM | Carbon-concentrating mechanism |
| CCS | Carbon capture and storage |
| CCU | Carbon capture and utilization |
| CETCH | Synthetic crotonyl-CoA/ethylmalonyl-CoA/hydroxybutyryl-CoA cycle |
| CoA | Coenzyme A |
| CODH | Carbon monoxide dehydrogenase |
| CO2UE | CO2 utilization efficiency as defined in the individual study |
| DOI | Digital object identifier |
| G3P | Glyceraldehyde-3-phosphate |
| HOB | Hydrogen-oxidizing bacteria |
| HRT | Hydraulic retention time |
| IPCC | Intergovernmental Panel on Climate Change |
| kLa | Volumetric mass transfer coefficient |
| LCA | Life cycle assessment |
| MES | Microbial electrosynthesis |
| NADPH | Reduced nicotinamide adenine dinucleotide phosphate |
| PBR | Photobioreactor |
| PHB | Poly(3-hydroxybutyrate) |
| Rnf | Membrane-bound electron transport complex coupled to ion translocation |
| rTCA | Reductive tricarboxylic acid cycle |
| RuBisCO | Ribulose-1,5-bisphosphate carboxylase/oxygenase |
| RuBP | Ribulose-1,5-bisphosphate |
| SCP | Single-cell protein |
| SRT | Solids retention time |
| TEA | Techno-economic assessment |
| THF | Tetrahydrofolate |
| TIC | Total inorganic carbon |
| TRL | Technology readiness level |
| TS | Total solids (dry biomass) |
| TSS | Total suspended solids |
| VS | Volatile solids |
| WLP | Wood–Ljungdahl pathway |
| WMO | World Meteorological Organization |
| 3-HP | 3-Hydroxypropionate pathway |
| 3-PGA | 3-Phosphoglycerate |
References
- World Meteorological Organization. State of the Global Climate 2025; WMO: Geneva, Switzerland, 2025; Available online: https://wmo.int/publication-series/state-of-global-climate/state-of-global-climate-2025 (accessed on 14 October 2026).
- Friedlingstein, P.; O’Sullivan, M.; Jones, M.W.; Andrew, R.M.; Bakker, D.C.E.; Hauck, J.; Landschützer, P.; Le Quéré, C.; Li, H.; Luijkx, I.T.; et al. Global Carbon Budget 2025. Earth Syst. Sci. Data 2026, 18, 3211–3288. [Google Scholar] [CrossRef] [Scilit]
- European Parliament and Council of the European Union. Regulation (EU) 2021/1119 Establishing the Framework for Achieving Climate Neutrality, as Amended by Regulation (EU) 2026/667 of 11 March Consolidated Text of 7 April EUR-Lex. Available online: https://eur-lex.europa.eu/eli/reg/2021/1119/2026-04-07/eng (accessed on 13 October 2026).
- European Commission. 2030 Climate Targets. The Fit for 55 Package and the Target to Reduce Net Emissions by at Least 55%. Available online: https://climate.ec.europa.eu/areas-action/climate-strategies-targets/2030-climate-targets_en (accessed on 13 October 2026).
- Bui, M.; Adjiman, C.S.; Bardow, A.; Anthony, E.J.; Boston, A.; Brown, S.; Fennell, P.S.; Fuss, S.; Galindo, A.; Hackett, L.A.; et al. Carbon capture and storage (CCS): The way forward. Energy Environ. Sci. 2018, 11, 1062–1176. [Google Scholar] [CrossRef] [Scilit]
- von der Assen, N.; Jung, J.; Bardow, A. Life-cycle assessment of carbon dioxide capture and utilization: Avoiding the pitfalls. Energy Environ. Sci. 2013, 6, 2721–2734. [Google Scholar] [CrossRef] [Scilit]
- Claassens, N.J.; Sousa, D.Z.; dos Santos, V.A.P.M.; de Vos, W.M.; van der Oost, J. Harnessing the power of microbial autotrophy. Nat. Rev. Microbiol. 2016, 14, 692–706. [Google Scholar] [CrossRef] [Scilit] [PubMed]
- IPCC. Climate Change 2023 Synthesis Report; Lee, H., Romero, J., Eds.; IPCC: Geneva, Switzerland, 2023. [Google Scholar] [CrossRef] [Scilit]
- Cuéllar-Franca, R.M.; Azapagic, A. Carbon capture, storage and utilisation technologies: A critical analysis and comparison of their life cycle environmental impacts. J. CO2 Util. 2015, 9, 82–102. [Google Scholar] [CrossRef] [Scilit]
- de Vree, J.H.; Bosma, R.; Janssen, M.; Barbosa, M.J.; Wijffels, R.H. Comparison of four outdoor pilot-scale photobioreactors. Biotechnol. Biofuels 2015, 8, 215. [Google Scholar] [CrossRef] [Scilit] [PubMed]
- Lambauer, V.; Hagenbuchner, C.; Graber, M.; Wiltsche, H.; Subotić, V.; Hochenauer, C.; Reichhartinger, M.; Kratzer, R. Cost-Efficient Autotrophic High-Cell-Density Cultivation of Cupriavidus necator Enabled by Model-Based Gas Supply. Biotechnol. Bioeng. 2026, 123, 92–103. [Google Scholar] [CrossRef] [Scilit] [PubMed]
- Zieliński, M.; Kazimierowicz, J.; Dębowski, M. The Possibility of Deploying CO2 from Biogas Combustion to Improve the Productivity of a Periodical Chlorella vulgaris Culture. Front. Biosci. Elite 2023, 15, 3. [Google Scholar] [CrossRef] [Scilit] [PubMed]
- Zieliński, M.; Barczak, Ł.; Kisielewska, M.; Vdovychenko, A.; Kazimierowicz, J.; Dębowski, M. Carbon Dioxide Bio-Sequestration and Biomass Production for Energy Purposes During C. vulgaris Cultivation Powered by Real Exhaust Gases from a Municipal Thermal Power Plant. Energies 2025, 18, 6086. [Google Scholar] [CrossRef] [Scilit]
- Carrasquer-Alvarez, E.; Hoffmann, U.A.; Geissler, A.S.; Knave, A.; Gorodkin, J.; Seemann, S.E.; Hudson, E.P.; Frigaard, N.U. Photosynthesis in Synechocystis sp. PCC 6803 is not optimally regulated under very high CO2. Appl. Microbiol. Biotechnol. 2025, 109, 33. [Google Scholar] [CrossRef] [Scilit] [PubMed]
- Sadvakasova, A.K.; Balouch, H.; Bauenova, M.O.; Kossalbayev, B.D.; Allakhverdiev, S.I.; Shabala, S. Strategies to intensify CO2 capture by microalgae for the circular bioeconomy. Trends Plant Sci. 2026, 31, 456–468. [Google Scholar] [CrossRef] [Scilit] [PubMed]
- Zhang, J.-Z.; Li, Y.-Z.; Xi, Z.-N.; Gao, H.-P.; Zhang, Q.; Liu, L.-C.; Li, F.-L.; Ma, X.-Q. Engineered acetogenic bacteria as microbial cell factory for diversified biochemicals. Front. Bioeng. Biotechnol. 2024, 12, 1395540. [Google Scholar] [CrossRef] [Scilit] [PubMed]
- Rovira-Alsina, L.; Pous, N.; Balaguer, M.D.; Matassa, S.; Zhang, Y.; Puig, S. Power-to-Protein: Electro-cultivation of microbial proteins from recycled nitrogen and carbon dioxide. J. Power Sources 2025, 638, 236499. [Google Scholar] [CrossRef] [Scilit]
- Jourdin, L.; Sousa, J.; van Stralen, N.; Strik, D.P.B.T.B. Techno-economic assessment of microbial electrosynthesis from CO2 and/or organics: An interdisciplinary roadmap towards future research and application. Appl. Energy 2020, 279, 115775. [Google Scholar] [CrossRef] [Scilit]
- Ali, S.S.; Fodah, A.E.M.; Jiao, H.; Ahmad, I.; Liu, J. Microalgae-based wastewater treatment and carbon dioxide capture: From mechanisms to scalable circular bioeconomy systems. Process Saf. Environ. Prot. 2026, 214, 109044. [Google Scholar] [CrossRef] [Scilit]
- Onyeaka, H.; Ekwebelem, O.C. A review of recent advances in engineering bacteria for enhanced CO2 capture and utilization. Int. J. Environ. Sci. Technol. 2023, 20, 4635–4648. [Google Scholar] [CrossRef] [Scilit] [PubMed]
- de Souza Sevalho, E.; da Silva, D.S.; de Sousa Gomes, K.; da Conceição, L.; Okamura, L.A.; Medina-Gallardo, J.C. Microbial CO2 bioconversion: Integrating carbon fixation pathways and sustainable biomanufacturing. Front. Microbiol. 2026, 17, 1961758. [Google Scholar] [CrossRef] [Scilit] [PubMed]
- Pires, J.C.M.; Alvim-Ferraz, M.C.M.; Martins, F.G.; Simões, M. Carbon dioxide capture from flue gases using microalgae: Engineering aspects and biorefinery concept. Renew. Sustain. Energy Rev. 2012, 16, 3043–3053. [Google Scholar] [CrossRef] [Scilit]
- Dębowski, M.; Kazimierowicz, J.; Świca, I.; Zieliński, M. Sustainable Utilization of CO2 from Exhaust Gases for the Autotrophic Cultivation of the Biohydrogen-Producing Microalga Tetraselmis subcordiformis. Sustainability 2025, 17, 8612. [Google Scholar] [CrossRef] [Scilit]
- Mohr, T.; Infantes, A.; Biebinger, L.; de Maayer, P.; Neumann, A. Acetogenic Fermentation from Oxygen Containing Waste Gas. Front. Bioeng. Biotechnol. 2019, 7, 433. [Google Scholar] [CrossRef] [Scilit] [PubMed]
- Wang, H.; Zhang, L.; Tian, C.; Fan, S.; Zheng, D.; Song, Y.; Gao, P.; Li, D. Effects of nitrogen supply on hydrogen-oxidizing bacterial enrichment to produce microbial protein: Comparing nitrogen fixation and ammonium assimilation. Bioresour. Technol. 2024, 394, 130199. [Google Scholar] [CrossRef] [Scilit] [PubMed]
- Liew, F.E.; Nogle, R.; Abdalla, T.; Rasor, B.J.; Canter, C.; Jensen, R.O.; Wang, L.; Strutz, J.; Chirania, P.; De Tissera, S.; et al. Carbon-negative production of acetone and isopropanol by gas fermentation at industrial pilot scale. Nat. Biotechnol. 2022, 40, 335–344. [Google Scholar] [CrossRef] [Scilit] [PubMed]
- Doucha, J.; Straka, F.; Lívanský, K. Utilization of flue gas for cultivation of microalgae (Chlorella sp.) in an outdoor open thin-layer. photobioreactor. J. Appl. Phycol. 2005, 17, 403–412. [Google Scholar] [CrossRef] [Scilit]
- Jønson, B.D.; Tsapekos, P.; Tahir Ashraf, M.; Jeppesen, M.; Ejbye Schmidt, J.; Bastidas-Oyanedel, J.R. Pilot-scale study of biomethanation in biological trickle bed reactors converting impure CO2 from a Full-scale biogas plant. Bioresour. Technol. 2022, 365, 128160. [Google Scholar] [CrossRef] [Scilit] [PubMed]
- Diender, M.; Stams, A.J.M.; Sousa, D.Z. Pathways and Bioenergetics of Anaerobic Carbon Monoxide Fermentation. Front. Microbiol. 2015, 6, 1275. [Google Scholar] [CrossRef] [Scilit] [PubMed]
- Kim, S.; Lindner, S.N.; Aslan, S.; Yishai, O.; Wenk, S.; Schann, K.; Bar-Even, A. Growth of E. coli on formate and methanol via the reductive glycine pathway. Nat. Chem. Biol. 2020, 16, 538–545. [Google Scholar] [CrossRef] [Scilit] [PubMed]
- Chi, Z.; Xie, Y.; Elloy, F.; Zheng, Y.; Hu, Y.; Chen, S. Bicarbonate-based Integrated Carbon Capture and Algae Production System with alkalihalophilic cyanobacterium. Bioresour. Technol. 2013, 133, 513–521. [Google Scholar] [CrossRef] [Scilit] [PubMed]
- Rao, M.; Zou, X.; Ye, J.; Kuang, C.; Chen, C.; Huang, C.; Chen, G.; Qin, S.; Wang, Z.; Feng, L.; et al. Light Conditions Determine Optimal CO2 Concentrations for Nannochloropsis oceanica Growth with Carbon Fixation. ACS Sustain. Chem. Eng. 2022, 10, 8799–8814. [Google Scholar] [CrossRef] [Scilit]
- Mortezaeikia, V.; Tavakoli, O.; Yegani, R.; Faramarzi, M. Cyanobacterial CO2 biofixation in batch and semi-continuous cultivation, using hydrophobic and hydrophilic hollow fiber membrane photobioreactors. Greenh. Gases Sci. Technol. 2016, 6, 218–231. [Google Scholar] [CrossRef] [Scilit]
- Steger, F.; Ergal, İ.; Daubek, A.; Loibl, N.; Rachbauer, L.; Fuchs, W.; Rittmann, S.K.M.R.; Bochmann, G. Trickle-Bed Bioreactors for Acetogenic H2/CO2 Conversion. Front. Energy Res. 2022, 10, 842284. [Google Scholar] [CrossRef] [Scilit]
- Lambauer, V.; Kratzer, R. Lab-Scale Cultivation of Cupriavidus necator on Explosive Gas Mixtures: Carbon Dioxide Fixation into Polyhydroxybutyrate. Bioengineering 2022, 9, 204. [Google Scholar] [CrossRef] [Scilit] [PubMed]
- Miyahara, Y.; Yamamoto, M.; Thorbecke, R.; Mizuno, S.; Tsuge, T. Autotrophic biosynthesis of polyhydroxyalkanoate by Ralstonia eutropha from non-combustible gas mixture with low hydrogen content. Biotechnol. Lett. 2020, 42, 1655–1662. [Google Scholar] [CrossRef] [Scilit] [PubMed]
- Bar-Even, A.; Noor, E.; Lewis, N.E.; Milo, R. Design and analysis of synthetic carbon fixation pathways. Proc. Natl. Acad. Sci. USA 2010, 107, 8889–8894. [Google Scholar] [CrossRef] [Scilit] [PubMed]
- Erb, T.J.; Zarzycki, J. A short history of RubisCO: The rise and fall (?) of Nature’s predominant CO2 fixing enzyme. Curr. Opin. Biotechnol. 2018, 49, 100–107. [Google Scholar] [CrossRef] [Scilit] [PubMed]
- Price, G.D.; Badger, M.R.; Woodger, F.J.; Long, B.M. Advances in understanding the cyanobacterial CO2-concentrating-mechanism (CCM): Functional components, Ci transporters, diversity, genetic regulation and prospects for engineering into plants. J. Exp. Bot. 2008, 59, 1441–1461. [Google Scholar] [CrossRef] [Scilit] [PubMed]
- Bonacci, W.; Teng, P.K.; Afonso, B.; Niederholtmeyer, H.; Grob, P.; Silver, P.A.; Savage, D.F. Modularity of a carbon-fixing protein organelle. Proc. Natl. Acad. Sci. USA 2012, 109, 478–483. [Google Scholar] [CrossRef] [Scilit] [PubMed]
- Oltrogge, L.M.; Chaijarasphong, T.; Chen, A.W.; Bolin, E.R.; Marqusee, S.; Savage, D.F. Multivalent interactions between CsoS2 and Rubisco mediate α-carboxysome formation. Nat. Struct. Mol. Biol. 2020, 27, 281–287. [Google Scholar] [CrossRef] [Scilit] [PubMed]
- Mackinder, L.C.M.; Meyer, M.T.; Mettler-Altmann, T.; Chen, V.K.; Mitchell, M.C.; Caspari, O.; Freeman Rosenzweig, E.S.; Pallesen, L.; Reeves, G.; Itakura, A.; et al. A repeat protein links Rubisco to form the eukaryotic carbon-concentrating organelle. Proc. Natl. Acad. Sci. USA 2016, 113, 5958–5963. [Google Scholar] [CrossRef] [Scilit] [PubMed]
- Flamholz, A.I.; Dugan, E.; Blikstad, C.; Gleizer, S.; Ben-Nissan, R.; Amram, S.; Antonovsky, N.; Ravishankar, S.; Noor, E.; Bar-Even, A.; et al. Functional reconstitution of a bacterial CO2 concentrating mechanism in Escherichia coli. eLife 2020, 9, e59882. [Google Scholar] [CrossRef] [Scilit] [PubMed]
- Ragsdale, S.W.; Pierce, E. Acetogenesis and the Wood–Ljungdahl pathway of CO2 fixation. Biochim. Biophys. Acta Proteins Proteom. 2008, 1784, 1873–1898. [Google Scholar] [CrossRef] [Scilit] [PubMed]
- Ragsdale, S.W.; Wood, H.G. Acetate biosynthesis by acetogenic bacteria. Evidence that carbon monoxide dehydrogenase is the condensing enzyme that catalyzes the final steps of the synthesis. J. Biol. Chem. 1985, 260, 3970–3977. [Google Scholar] [CrossRef] [Scilit]
- Schuchmann, K.; Müller, V. Autotrophy at the thermodynamic limit of life: A model for energy conservation in acetogenic bacteria. Nat. Rev. Microbiol. 2014, 12, 809–821. [Google Scholar] [CrossRef] [Scilit] [PubMed]
- Poehlein, A.; Schmidt, S.; Kaster, A.K.; Goenrich, M.; Vollmers, J.; Thürmer, A.; Bertsch, J.; Schuchmann, K.; Voigt, B.; Hecker, M.; et al. An Ancient Pathway Combining Carbon Dioxide Fixation with the Generation and Utilization of a Sodium Ion Gradient for ATP Synthesis. PLoS ONE 2012, 7, e33439. [Google Scholar] [CrossRef] [Scilit] [PubMed]
- Frolov, E.N.; Elcheninov, A.G.; Gololobova, A.V.; Toshchakov, S.V.; Novikov, A.A.; Lebedinsky, A.V.; Kublanov, I.V. Obligate autotrophy at the thermodynamic limit of life in a new acetogenic bacterium. Front. Microbiol. 2023, 14, 1185739. [Google Scholar] [CrossRef] [Scilit] [PubMed]
- Arslan, K.; Schoch, T.; Höfele, F.; Herrschaft, S.; Oberlies, C.; Bengelsdorf, F.; Veiga, M.C.; Dürre, P.; Kennes, C. Engineering Acetobacterium woodii for the production of isopropanol and acetone from carbon dioxide and hydrogen. Biotechnol. J. 2022, 17, 2100515. [Google Scholar] [CrossRef] [Scilit] [PubMed]
- Valgepea, K.; de Souza Pinto Lemgruber, R.; Meaghan, K.; Palfreyman, R.W.; Abdalla, T.; Heijstra, B.D.; Behrendorff, J.B.; Tappel, R.; Köpke, M.; Simpson, S.D.; et al. Maintenance of ATP Homeostasis Triggers Metabolic Shifts in Gas-Fermenting Acetogens. Cell Syst. 2017, 4, 505–515.e5. [Google Scholar] [CrossRef] [Scilit] [PubMed]
- Fuchs, G. Alternative Pathways of Carbon Dioxide Fixation: Insights into the Early Evolution of Life? Annu. Rev. Microbiol. 2011, 65, 631–658. [Google Scholar] [CrossRef] [Scilit] [PubMed]
- Berg, I.A. Ecological Aspects of the Distribution of Different Autotrophic CO2 Fixation Pathways. Appl. Environ. Microbiol. 2011, 77, 1925–1936. [Google Scholar] [CrossRef] [Scilit] [PubMed]
- Evans, M.C.; Buchanan, B.B.; Arnon, D.I. A new ferredoxin-dependent carbon reduction cycle in a photosynthetic bacterium. Proc. Natl. Acad. Sci. USA 1966, 55, 928–934. [Google Scholar] [CrossRef] [Scilit] [PubMed]
- Kanao, T.; Fukui, T.; Atomi, H.; Imanaka, T. ATP-citrate lyase from the green sulfur bacterium Chlorobium limicola is a heteromeric enzyme composed of two distinct gene products. Eur. J. Biochem. 2001, 268, 1670–1678. [Google Scholar] [CrossRef] [Scilit]
- Hügler, M.; Sievert, S.M. Beyond the Calvin Cycle: Autotrophic Carbon Fixation in the Ocean. Annu. Rev. Mar. Sci. 2011, 3, 261–289. [Google Scholar] [CrossRef] [Scilit] [PubMed]
- Hügler, M.; Menendez, C.; Schägger, H.; Fuchs, G. Malonyl-Coenzyme A Reductase from Chloroflexus aurantiacus, a Key Enzyme of the 3-Hydroxypropionate Cycle for Autotrophic CO2 Fixation. J. Bacteriol. 2002, 184, 2404–2410. [Google Scholar] [CrossRef] [Scilit] [PubMed]
- Antonovsky, N.; Gleizer, S.; Noor, E.; Zohar, Y.; Herz, E.; Barenholz, U.; Zelcbuch, L.; Amram, S.; Wides, A.; Tepper, N.; et al. Sugar Synthesis from CO2 in Escherichia coli. Cell 2016, 166, 115–125. [Google Scholar] [CrossRef] [Scilit] [PubMed]
- Schwander, T.; Schada von Borzyskowski, L.; Burgener, S.; Cortina, N.S.; Erb, T.J. A synthetic pathway for the fixation of carbon dioxide in vitro. Science 2016, 354, 900–904. [Google Scholar] [CrossRef] [Scilit] [PubMed]
- Gleizer, S.; Ben-Nissan, R.; Bar-On, Y.M.; Antonovsky, N.; Noor, E.; Zohar, Y.; Jona, G.; Krieger, E.; Shamshoum, M.; Bar-Even, A.; et al. Conversion of Escherichia coli to Generate All Biomass Carbon from CO2. Cell 2019, 179, 1255–1263.e12. [Google Scholar] [CrossRef] [Scilit] [PubMed]
- Gassler, T.; Sauer, M.; Gasser, B.; Egermeier, M.; Troyer, C.; Causon, T.; Hann, S.; Mattanovich, D.; Steiger, M.G. The industrial yeast Pichia pastoris is converted from a heterotroph into an autotroph capable of growth on CO2. Nat. Biotechnol. 2020, 38, 210–216. [Google Scholar] [CrossRef] [Scilit] [PubMed]
- Kantzow, C.; Mayer, A.; Weuster-Botz, D. Continuous gas fermentation by Acetobacterium woodii in a submerged membrane reactor with full cell retention. J. Biotechnol. 2015, 212, 11–18. [Google Scholar] [CrossRef] [Scilit] [PubMed]
- Zhu, X.-G.; Long, S.P.; Ort, D.R. What is the maximum efficiency with which photosynthesis can convert solar energy into biomass? Curr. Opin. Biotechnol. 2008, 19, 153–159. [Google Scholar] [CrossRef] [Scilit] [PubMed]
- Dębowski, M.; Zieliński, M.; Vdovychenko, A.; Kazimierowicz, J. The Use of the Autotrophic Culture of Arthrospira platensis for CO2 Fixation from Biogas Combustion. Processes 2024, 12, 396. [Google Scholar] [CrossRef] [Scilit]
- Ducat, D.C.; Avelar-Rivas, J.A.; Way, J.C.; Silver, P.A. Rerouting Carbon Flux To Enhance Photosynthetic Productivity. Appl. Environ. Microbiol. 2012, 78, 2660–2668. [Google Scholar] [CrossRef] [Scilit] [PubMed]
- Janssen, K.N.; Bolay, P.; Tüllinghoff, A.; Toepel, J.; Spindler, D.; Bühler, B.; Lindberg, P. Engineering Cyanobacteria for High-Yield Photosynthetic Isoprene Production with Long-Term Phenotypic Stability. Plant Biotechnol. J. 2026, 24, 1014–1030. [Google Scholar] [CrossRef] [Scilit] [PubMed]
- Lacroux, J.; Mahieux, M.; Llamas, M.; Bonnafous, A.; Trably, E.; Steyer, J.P.; van Lis, R. Mixotrophic cultivation of microalgae-bacteria consortia enhances dark fermentation effluent treatment. Bioresour. Technol. 2024, 414, 131616. [Google Scholar] [CrossRef] [Scilit] [PubMed]
- Ducat, D.C.; Way, J.C.; Silver, P.A. Engineering cyanobacteria to generate high-value products. Trends Biotechnol. 2011, 29, 95–103. [Google Scholar] [CrossRef] [Scilit] [PubMed]
- Carvalho, A.P.; Meireles, L.A.; Malcata, F.X. Microalgal Reactors: A Review of Enclosed System Designs and Performances. Biotechnol. Prog. 2006, 22, 1490–1506. [Google Scholar] [CrossRef] [Scilit] [PubMed]
- Dębowski, M.; Krzemieniewski, M.; Zieliński, M.; Kazimierowicz, J. Immobilized Microalgae-Based Photobioreactor for CO2 Capture (IMC-CO2PBR): Efficiency Estimation, Technological Parameters, and Prototype Concept. Atmosphere 2021, 12, 1031. [Google Scholar] [CrossRef] [Scilit]
- Fernández, J.; Martín-Girela, I.; Gamonal, A.; Aguado, P.L.; Curt, M.D. Proof-of-concept of a hollow biofilm photobioreactor using engine exhaust gases. Algal Res. 2025, 92, 104416. [Google Scholar] [CrossRef] [Scilit]
- Gross, M.; Jarboe, D.; Wen, Z. Biofilm-based algal cultivation systems. Appl. Microbiol. Biotechnol. 2015, 99, 5781–5789. [Google Scholar] [CrossRef] [Scilit] [PubMed]
- Wang, B.; Li, Y.; Wu, N.; Lan, C.Q. CO2 bio-mitigation using microalgae. Appl. Microbiol. Biotechnol. 2008, 79, 707–718. [Google Scholar] [CrossRef] [Scilit] [PubMed]
- Li, J.; Wu, Y.; Liang, S.; Chen, Z.; Hong, Y.; Zhao, Y.; Li, J.; Hao, N.; Hu, H. Microalgae-mediated treatment of steel industry reverse osmosis concentrate integrated with flue gas carbon fixation: From laboratory selection to pilot-scale verification. Water Res. 2026, 288, 124561. [Google Scholar] [CrossRef] [Scilit] [PubMed]
- Savakis, P.; Hellingwerf, K.J. Engineering cyanobacteria for direct biofuel production from CO2. Curr. Opin. Biotechnol. 2015, 33, 8–14. [Google Scholar] [CrossRef] [Scilit] [PubMed]
- Oliver, J.W.K.; Machado, I.M.P.; Yoneda, H.; Atsumi, S. Cyanobacterial conversion of carbon dioxide to 2,3-butanediol. Proc. Natl. Acad. Sci. USA 2013, 110, 1249–1254. [Google Scholar] [CrossRef] [Scilit] [PubMed]
- Koch, M.; Doello, S.; Gutekunst, K.; Forchhammer, K. PHB is Produced from Glycogen Turn-over during Nitrogen Starvation in Synechocystis sp. PCC 6803. Int. J. Mol. Sci. 2019, 20, 1942. [Google Scholar] [CrossRef] [Scilit] [PubMed]
- Christenson, L.; Sims, R. Production and harvesting of microalgae for wastewater treatment, biofuels, and bioproducts. Biotechnol. Adv. 2011, 29, 686–702. [Google Scholar] [CrossRef] [Scilit] [PubMed]
- Molina Grima, E.; Belarbi, E.-H.; Acién Fernández, F.G.; Robles Medina, A.; Chisti, Y. Recovery of microalgal biomass and metabolites: Process options and economics. Biotechnol. Adv. 2003, 20, 491–515. [Google Scholar] [CrossRef] [Scilit] [PubMed]
- Vulsteke, E.; Van Den Hende, S.; Bourez, L.; Capoen, H.; Rousseau, D.P.L.; Albrecht, J. Economic feasibility of microalgal bacterial floc production for wastewater treatment and biomass valorization: A detailed up-to-date analysis of up-scaled pilot results. Bioresour. Technol. 2017, 224, 118–129. [Google Scholar] [CrossRef] [Scilit] [PubMed]
- Lee, Y.Y.; Jonas, L.; Hill, R.; Place, A.; Silsbe, G.; Hunsicker, S.; North, E.; Li, Y. Engineering whiting events in culture: A microalgae-driven calcium carbonate and biomass production process at high pH and alkalinity with the marine microalga Nannochloropsis oceanica IMET1. J. CO2 Util. 2024, 80, 102669. [Google Scholar] [CrossRef] [Scilit]
- Jonas, L.; Lee, Y.Y.; Mroz, R.; Hill, R.T.; Li, Y. Nannochloropsis oceanica IMET1 and its bacterial symbionts for carbon capture, utilization, and storage: Biomass and calcium carbonate production under high pH and high alkalinity. Appl. Environ. Microbiol. 2025, 91, e00133-25. [Google Scholar] [CrossRef] [Scilit] [PubMed]
- Quiroz, D.; McGowen, J.A.; Quinn, J.C. Techno-economic analysis of microalgae cultivation strategies: Batch and semi-continuous approaches. Algal Res. 2025, 90, 104109. [Google Scholar] [CrossRef] [Scilit]
- Yu, B.S.; Yang, H.E.; Sirohi, R.; Sim, S.J. Novel effective bioprocess for optimal CO2 fixation via microalgae-based biomineralization under semi-continuous culture. Bioresour. Technol. 2022, 364, 128063. [Google Scholar] [CrossRef] [Scilit] [PubMed]
- Valgepea, K.; de Souza Pinto Lemgruber, R.; Abdalla, T.; Binos, S.; Takemori, N.; Takemori, A.; Tanaka, Y.; Tappel, R.; Köpke, M.; Simpson, S.D.; et al. H2 drives metabolic rearrangements in gas-fermenting Clostridium autoethanogenum. Biotechnol. Biofuels 2018, 11, 55. [Google Scholar] [CrossRef] [Scilit] [PubMed]
- Köpke, M.; Held, C.; Hujer, S.; Liesegang, H.; Wiezer, A.; Wollherr, A.; Ehrenreich, A.; Liebl, W.; Gottschalk, G.; Dürre, P. Clostridium ljungdahlii represents a microbial production platform based on syngas. Proc. Natl. Acad. Sci. USA 2010, 107, 13087–13092, Correction in Proc. Natl. Acad. Sci. USA 2010, 107, 15305. [Google Scholar] [CrossRef] [Scilit] [PubMed]
- Groher, A.; Weuster-Botz, D. Comparative reaction engineering analysis of different acetogenic bacteria for gas fermentation. J. Biotechnol. 2016, 228, 82–94. [Google Scholar] [CrossRef] [Scilit] [PubMed]
- Bertsch, J.; Müller, V. Bioenergetic constraints for conversion of syngas to biofuels in acetogenic bacteria. Biotechnol. Biofuels 2015, 8, 210. [Google Scholar] [CrossRef] [Scilit] [PubMed]
- Bengelsdorf, F.R.; Straub, M.; Dürre, P. Bacterial synthesis gas (syngas) fermentation. Environ. Technol. 2013, 34, 1639–1651. [Google Scholar] [CrossRef] [Scilit] [PubMed]
- Wang, Y.Q.; Yu, S.J.; Zhang, F.; Xia, X.Y.; Zeng, R.J. Enhancement of acetate productivity in a thermophilic (55 °C) hollow-fiber membrane biofilm reactor with mixed culture syngas (H2/CO2) fermentation. Appl. Microbiol. Biotechnol. 2017, 101, 2619–2627. [Google Scholar] [CrossRef] [Scilit] [PubMed]
- Vlaeminck, E.; Acuña Lopez, P.; Uitterhaegen, E.; Quataert, K.; Delmulle, T.; De Winter, K.; Soetaert, W.K. Pressure fermentation to boost CO2-based poly(3-hydroxybutyrate) production using Cupriavidus necator. Bioresour. Technol. 2024, 408, 131162. [Google Scholar] [CrossRef] [Scilit] [PubMed]
- Cui, K.; Yu, J.; Zhang, H.; Guo, Y.; Cao, J.; Yi, Y.; Cai, W.; Guo, K. Continuous and long-term production of single-cell protein from CO2 in an electrolytic gas-lift reactor. Biochem. Eng. J. 2026, 231, 110171. [Google Scholar] [CrossRef] [Scilit]
- Zhang, H.; Cao, J.; Yu, J.; Wang, X.; Li, Y.; Wang, B.; Cai, W.; Cui, K.; Guo, K. Pilot-scale electricity-driven production of single-cell protein from CO2 by hydrogen-oxidizing bacteria. Chem. Eng. J. 2026, 545, 179749. [Google Scholar] [CrossRef] [Scilit]
- Jourdin, L.; Grieger, T.; Monetti, J.; Flexer, V.; Freguia, S.; Lu, Y.; Chen, J.; Romano, M.; Wallace, G.G.; Keller, J. High Acetic Acid Production Rate Obtained by Microbial Electrosynthesis from Carbon Dioxide. Environ. Sci. Technol. 2015, 49, 13566–13574. [Google Scholar] [CrossRef] [Scilit] [PubMed]
- LaBelle, E.V.; May, H.D. Energy Efficiency and Productivity Enhancement of Microbial Electrosynthesis of Acetate. Front. Microbiol. 2017, 8, 756. [Google Scholar] [CrossRef] [Scilit] [PubMed]
- Deutzmann, J.S.; Callander, G.; Spormann, A.M. Improved reactor design enables productivity of microbial electrosynthesis on par with classical biotechnology. Bioresour. Technol. 2025, 416, 131733. [Google Scholar] [CrossRef] [Scilit] [PubMed]
- Pan, Z.; Yu, J.; Guo, Y.; Yin, W.; Zhang, H.; Sha, J.; Hu, X.; Guo, K. Coupling electrodialysis with microbial electrosynthesis enables high-rate, high-titer, and cost-effective acetate production from CO2. Bioresour. Technol. 2025, 424, 132280. [Google Scholar] [CrossRef] [Scilit] [PubMed]
- Cramm, R. Genomic View of Energy Metabolism in Ralstonia eutropha H16. J. Mol. Microbiol. Biotechnol. 2009, 16, 38–52. [Google Scholar] [CrossRef] [Scilit] [PubMed]
- Pohlmann, A.; Fricke, W.F.; Reinecke, F.; Kusian, B.; Liesegang, H.; Cramm, R.; Eitinger, T.; Ewering, C.; Pötter, M.; Schwartz, E.; et al. Genome sequence of the bioplastic-producing “Knallgas” bacterium Ralstonia eutropha H16. Nat. Biotechnol. 2006, 24, 1257–1262, Correction in Nat. Biotechnol. 2007, 25, 478. https://doi.org/10.1038/nbt0407-478e. [Google Scholar] [CrossRef] [Scilit] [PubMed]
- Hu, X.; Vandamme, P.; Boon, N. Co-cultivation enhanced microbial protein production based on autotrophic nitrogen-fixing hydrogen-oxidizing bacteria. Chem. Eng. J. 2022, 429, 132535. [Google Scholar] [CrossRef] [Scilit]
- Matassa, S.; Verstraete, W.; Pikaar, I.; Boon, N. Autotrophic nitrogen assimilation and carbon capture for microbial protein production by a novel enrichment of hydrogen-oxidizing bacteria. Water Res. 2016, 101, 137–146. [Google Scholar] [CrossRef] [Scilit] [PubMed]
- Ritala, A.; Häkkinen, S.T.; Toivari, M.; Wiebe, M.G. Single Cell Protein—State-of-the-Art, Industrial Landscape and Patents 2001–2016. Front. Microbiol. 2017, 8, 2009. [Google Scholar] [CrossRef] [Scilit] [PubMed]
- Matassa, S.; Boon, N.; Pikaar, I.; Verstraete, W. Microbial protein: Future sustainable food supply route with low environmental footprint. Microb. Biotechnol. 2016, 9, 568–575. [Google Scholar] [CrossRef] [Scilit] [PubMed]
- Lambauer, V.; Permann, A.; Petrášek, Z.; Subotić, V.; Hochenauer, C.; Kratzer, R.; Reichhartinger, M. Automatic Control of Chemolithotrophic Cultivation of Cupriavidus necator: Optimization of Oxygen Supply for Enhanced Bioplastic Production. Fermentation 2023, 9, 619. [Google Scholar] [CrossRef] [Scilit]
- Garcia-Gonzalez, L.; Mozumder, M.S.I.; Dubreuil, M.; Volcke, E.I.P.; De Wever, H. Sustainable autotrophic production of polyhydroxybutyrate (PHB) from CO2 using a two-stage cultivation system. Catal. Today 2015, 257, 237–245. [Google Scholar] [CrossRef] [Scilit]
- Islam Mozumder, M.S.; Garcia-Gonzalez, L.; De Wever, H.; Volcke, E.I.P. Poly(3-hydroxybutyrate) (PHB) production from CO2: Model development and process optimization. Biochem. Eng. J. 2015, 98, 107–116. [Google Scholar] [CrossRef] [Scilit]
- Yu, J. Bio-based products from solar energy and carbon dioxide. Trends Biotechnol. 2014, 32, 5–10. [Google Scholar] [CrossRef] [Scilit] [PubMed]
- Leger, D.; Matassa, S.; Noor, E.; Shepon, A.; Milo, R.; Bar-Even, A. Photovoltaic-driven microbial protein production can use land and sunlight more efficiently than conventional crops. Proc. Natl. Acad. Sci. USA 2021, 118, e2015025118. [Google Scholar] [CrossRef] [Scilit] [PubMed]
- Rabaey, K.; Rozendal, R.A. Microbial electrosynthesis—revisiting the electrical route for microbial production. Nat. Rev. Microbiol. 2010, 8, 706–716. [Google Scholar] [CrossRef] [Scilit] [PubMed]
- Nevin, K.P.; Hensley, S.A.; Franks, A.E.; Summers, Z.M.; Ou, J.; Woodard, T.L.; Snoeyenbos-West, O.L.; Lovley, D.R. Electrosynthesis of Organic Compounds from Carbon Dioxide Is Catalyzed by a Diversity of Acetogenic Microorganisms. Appl. Environ. Microbiol. 2011, 77, 2882–2886. [Google Scholar] [CrossRef] [Scilit] [PubMed]
- Tremblay, P.-L.; Faraghiparapari, N.; Zhang, T. Accelerated H2 Evolution during Microbial Electrosynthesis with Sporomusa ovata. Catalysts 2019, 9, 166. [Google Scholar] [CrossRef] [Scilit]
- Nevin, K.P.; Woodard, T.L.; Franks, A.E.; Summers, Z.M.; Lovley, D.R. Microbial Electrosynthesis: Feeding Microbes Electricity to Convert Carbon Dioxide and Water to Multicarbon Extracellular Organic Compounds. mBio 2010, 1, e00103-10. [Google Scholar] [CrossRef] [Scilit] [PubMed]
- Torella, J.P.; Gagliardi, C.J.; Chen, J.S.; Bediako, D.K.; Colón, B.; Way, J.C.; Silver, P.A.; Nocera, D.G. Efficient solar-to-fuels production from a hybrid microbial–water-splitting catalyst system. Proc. Natl. Acad. Sci. USA 2015, 112, 2337–2342, Correction in Proc. Natl. Acad. Sci. USA 2015, 112, E1507. https://doi.org/10.1073/pnas.1503606112. [Google Scholar] [CrossRef] [Scilit] [PubMed]
- Sakimoto, K.K.; Wong, A.B.; Yang, P. Self-photosensitization of nonphotosynthetic bacteria for solar-to-chemical production. Science 2016, 351, 74–77. [Google Scholar] [CrossRef] [Scilit] [PubMed]
- LaBelle, E.V.; Marshall, C.W.; Gilbert, J.A.; May, H.D. Influence of Acidic pH on Hydrogen and Acetate Production by an Electrosynthetic Microbiome. PLoS ONE 2014, 9, e109935. [Google Scholar] [CrossRef] [Scilit] [PubMed]
- Gildemyn, S.; Verbeeck, K.; Slabbinck, R.; Andersen, S.J.; Prévoteau, A.; Rabaey, K. Integrated Production, Extraction, and Concentration of Acetic Acid from CO2 through Microbial Electrosynthesis. Environ. Sci. Technol. Lett. 2015, 2, 325–328. [Google Scholar] [CrossRef] [Scilit]
- Verbeeck, K.; Gildemyn, S.; Rabaey, K. Membrane Electrolysis Assisted Gas Fermentation for Enhanced Acetic Acid Production. Front. Energy Res. 2018, 6, 88. [Google Scholar] [CrossRef] [Scilit]
- Liu, C.; Colón, B.C.; Ziesack, M.; Silver, P.A.; Nocera, D.G. Water splitting–biosynthetic system with CO2 reduction efficiencies exceeding photosynthesis. Science 2016, 352, 1210–1213. [Google Scholar] [CrossRef] [Scilit] [PubMed]
- Blankenship, R.E.; Tiede, D.M.; Barber, J.; Brudvig, G.W.; Fleming, G.; Ghirardi, M.; Gunner, M.R.; Junge, W.; Kramer, D.M.; Melis, A.; et al. Comparing Photosynthetic and Photovoltaic Efficiencies and Recognizing the Potential for Improvement. Science 2011, 332, 805–809. [Google Scholar] [CrossRef] [Scilit] [PubMed]
- Jourdin, L.; Raes, S.M.T.; Buisman, C.J.N.; Strik, D.P.B.T.B. Critical Biofilm Growth throughout Unmodified Carbon Felts Allows Continuous Bioelectrochemical Chain Elongation from CO2 up to Caproate at High Current Density. Front. Energy Res. 2018, 6, 7. [Google Scholar] [CrossRef] [Scilit]
- Yu, J.; Munasinghe, P. Gas Fermentation Enhancement for Chemolithotrophic Growth of Cupriavidus necator on Carbon Dioxide. Fermentation 2018, 4, 63. [Google Scholar] [CrossRef] [Scilit]
- Orgill, J.J.; Atiyeh, H.K.; Devarapalli, M.; Phillips, J.R.; Lewis, R.S.; Huhnke, R.L. A comparison of mass transfer coefficients between trickle-bed, hollow fiber membrane and stirred tank reactors. Bioresour. Technol. 2013, 133, 340–346. [Google Scholar] [CrossRef] [Scilit] [PubMed]
- Munasinghe, P.C.; Khanal, S.K. Syngas fermentation to biofuel: Evaluation of carbon monoxide mass transfer and analytical modeling using a composite hollow fiber (CHF) membrane bioreactor. Bioresour. Technol. 2012, 122, 130–136. [Google Scholar] [CrossRef] [Scilit] [PubMed]
- Xia, S.; Xu, X.; Zhou, C.; Wang, C.; Zhou, L.; Rittmann, B.E. Direct delivery of CO2 into a hydrogen-based membrane biofilm reactor and model development. Chem. Eng. J. 2016, 290, 154–160. [Google Scholar] [CrossRef] [Scilit]
- Zhang, F.; Ding, J.; Zhang, Y.; Chen, M.; Ding, Z.W.; van Loosdrecht, M.C.M.; Zeng, R.J. Fatty acids production from hydrogen and carbon dioxide by mixed culture in the membrane biofilm reactor. Water Res. 2013, 47, 6122–6129. [Google Scholar] [CrossRef] [Scilit] [PubMed]
- Feickert Fenske, C.; Kirzeder, F.; Strübing, D.; Koch, K. Biogas upgrading in a pilot-scale trickle bed reactor—Long-term biological methanation under real application conditions. Bioresour. Technol. 2023, 376, 128868. [Google Scholar] [CrossRef] [Scilit] [PubMed]
- Slade, R.; Bauen, A. Micro-algae cultivation for biofuels: Cost, energy balance, environmental impacts and future prospects. Biomass Bioenergy 2013, 53, 29–38. [Google Scholar] [CrossRef] [Scilit]
- Ruiz, J.; Olivieri, G.; de Vree, J.; Bosma, R.; Willems, P.; Reith, J.H.; Eppink, M.H.M.; Kleinegris, D.M.M.; Wijffels, R.H.; Barbosa, M.J. Towards industrial products from microalgae. Energy Environ. Sci. 2016, 9, 3036–3043. [Google Scholar] [CrossRef] [Scilit]
- Vázquez-Romero, B.; Perales, J.A.; de Vree, J.H.; Böpple, H.; Steinrücken, P.; Barbosa, M.J.; Kleinegris, D.M.M.; Ruiz, J. Techno-economic analysis of microalgae production for aquafeed in Norway. Algal Res. 2022, 64, 102679. [Google Scholar] [CrossRef] [Scilit]
- Quinn, J.C.; Davis, R. The potentials and challenges of algae based biofuels: A review of the techno-economic, life cycle, and resource assessment modeling. Bioresour. Technol. 2015, 184, 444–452. [Google Scholar] [CrossRef] [Scilit] [PubMed]
- Singh, U.; Naaz, F.; Hawkins, T.R.; Weinberg, E.; Banerjee, S.; Mroz, R.; Ohri, N.; Zhang, J.; Lee, Y.-Y.; Chen, F.; et al. Direct flue gas capture for algae cultivation and subsequent valorization: Evaluating life cycle emissions and costs. Sustain. Energy Fuels 2025, 9, 4392–4403. [Google Scholar] [CrossRef] [Scilit]
- Tanzer, S.E.; Ramírez, A. When are negative emissions negative emissions? Energy Environ. Sci. 2019, 12, 1210–1218. [Google Scholar] [CrossRef] [Scilit]
- Sillman, J.; Uusitalo, V.; Ruuskanen, V.; Ojala, L.; Kahiluoto, H.; Soukka, R.; Ahola, J. A life cycle environmental sustainability analysis of microbial protein production via power-to-food approaches. Int. J. Life Cycle Assess. 2020, 25, 2190–2203, Correction in Int. J. Life Cycle Assess. 2022, 27, 189. [Google Scholar] [CrossRef] [Scilit]
- Artz, J.; Müller, T.E.; Thenert, K.; Kleinekorte, J.; Meys, R.; Sternberg, A.; Bardow, A.; Leitner, W. Sustainable Conversion of Carbon Dioxide: An Integrated Review of Catalysis and Life Cycle Assessment. Chem. Rev. 2018, 118, 434–504. [Google Scholar] [CrossRef] [Scilit] [PubMed]
- Hepburn, C.; Adlen, E.; Beddington, J.; Carter, E.A.; Fuss, S.; Mac Dowell, N.; Minx, J.C.; Smith, P.; Williams, C.K. The technological and economic prospects for CO2 utilization and removal. Nature 2019, 575, 87–97. [Google Scholar] [CrossRef] [Scilit] [PubMed]
- Douskova, I.; Doucha, J.; Livansky, K.; Machat, J.; Novak, P.; Umysova, D.; Zachleder, V.; Vitova, M. Simultaneous flue gas bioremediation and reduction of microalgal biomass production costs. Appl. Microbiol. Biotechnol. 2009, 82, 179–185. [Google Scholar] [CrossRef] [Scilit] [PubMed]
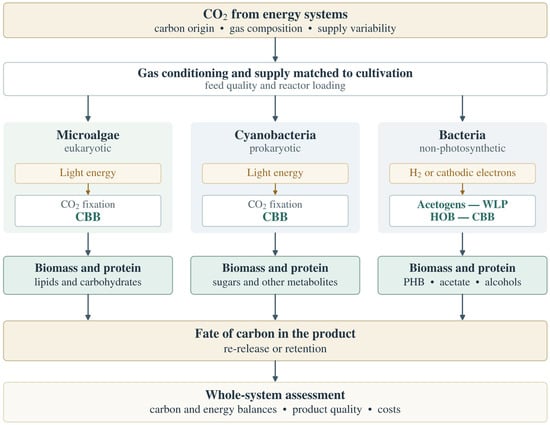
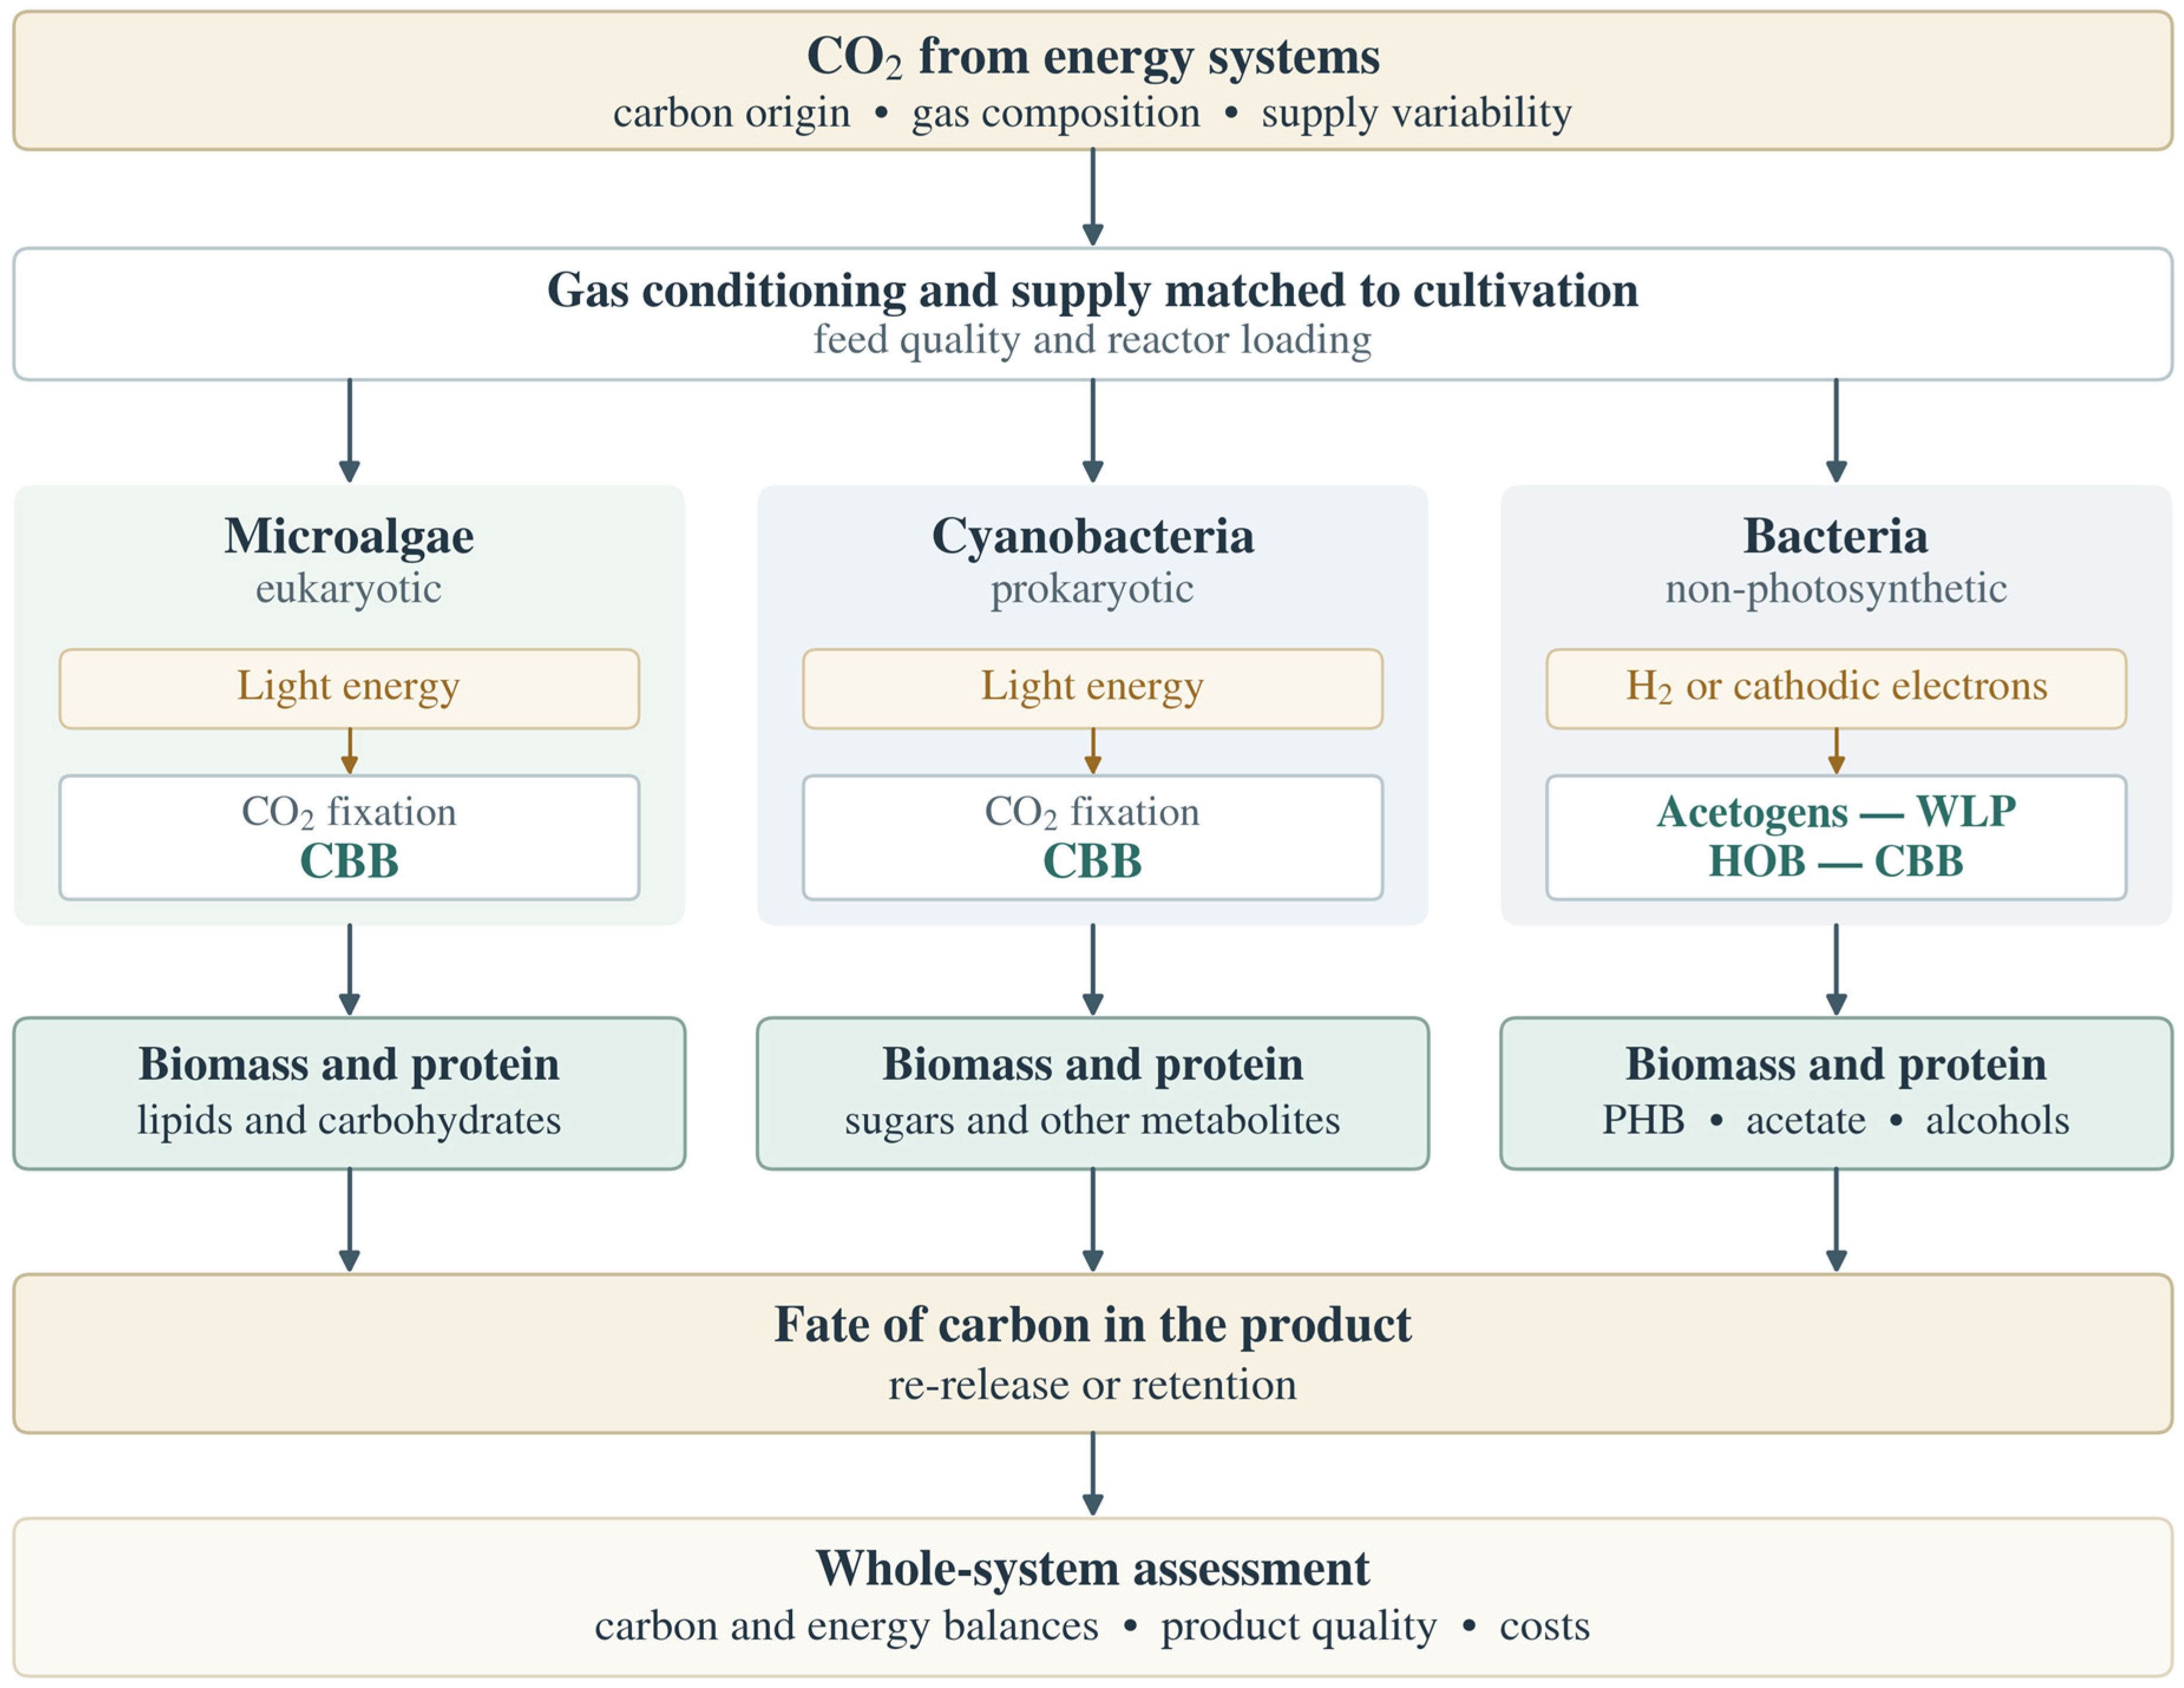
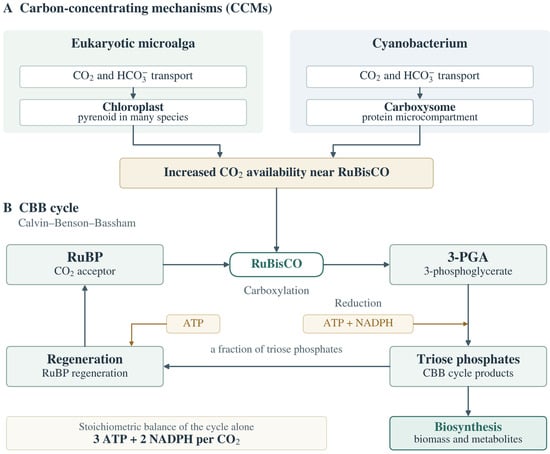
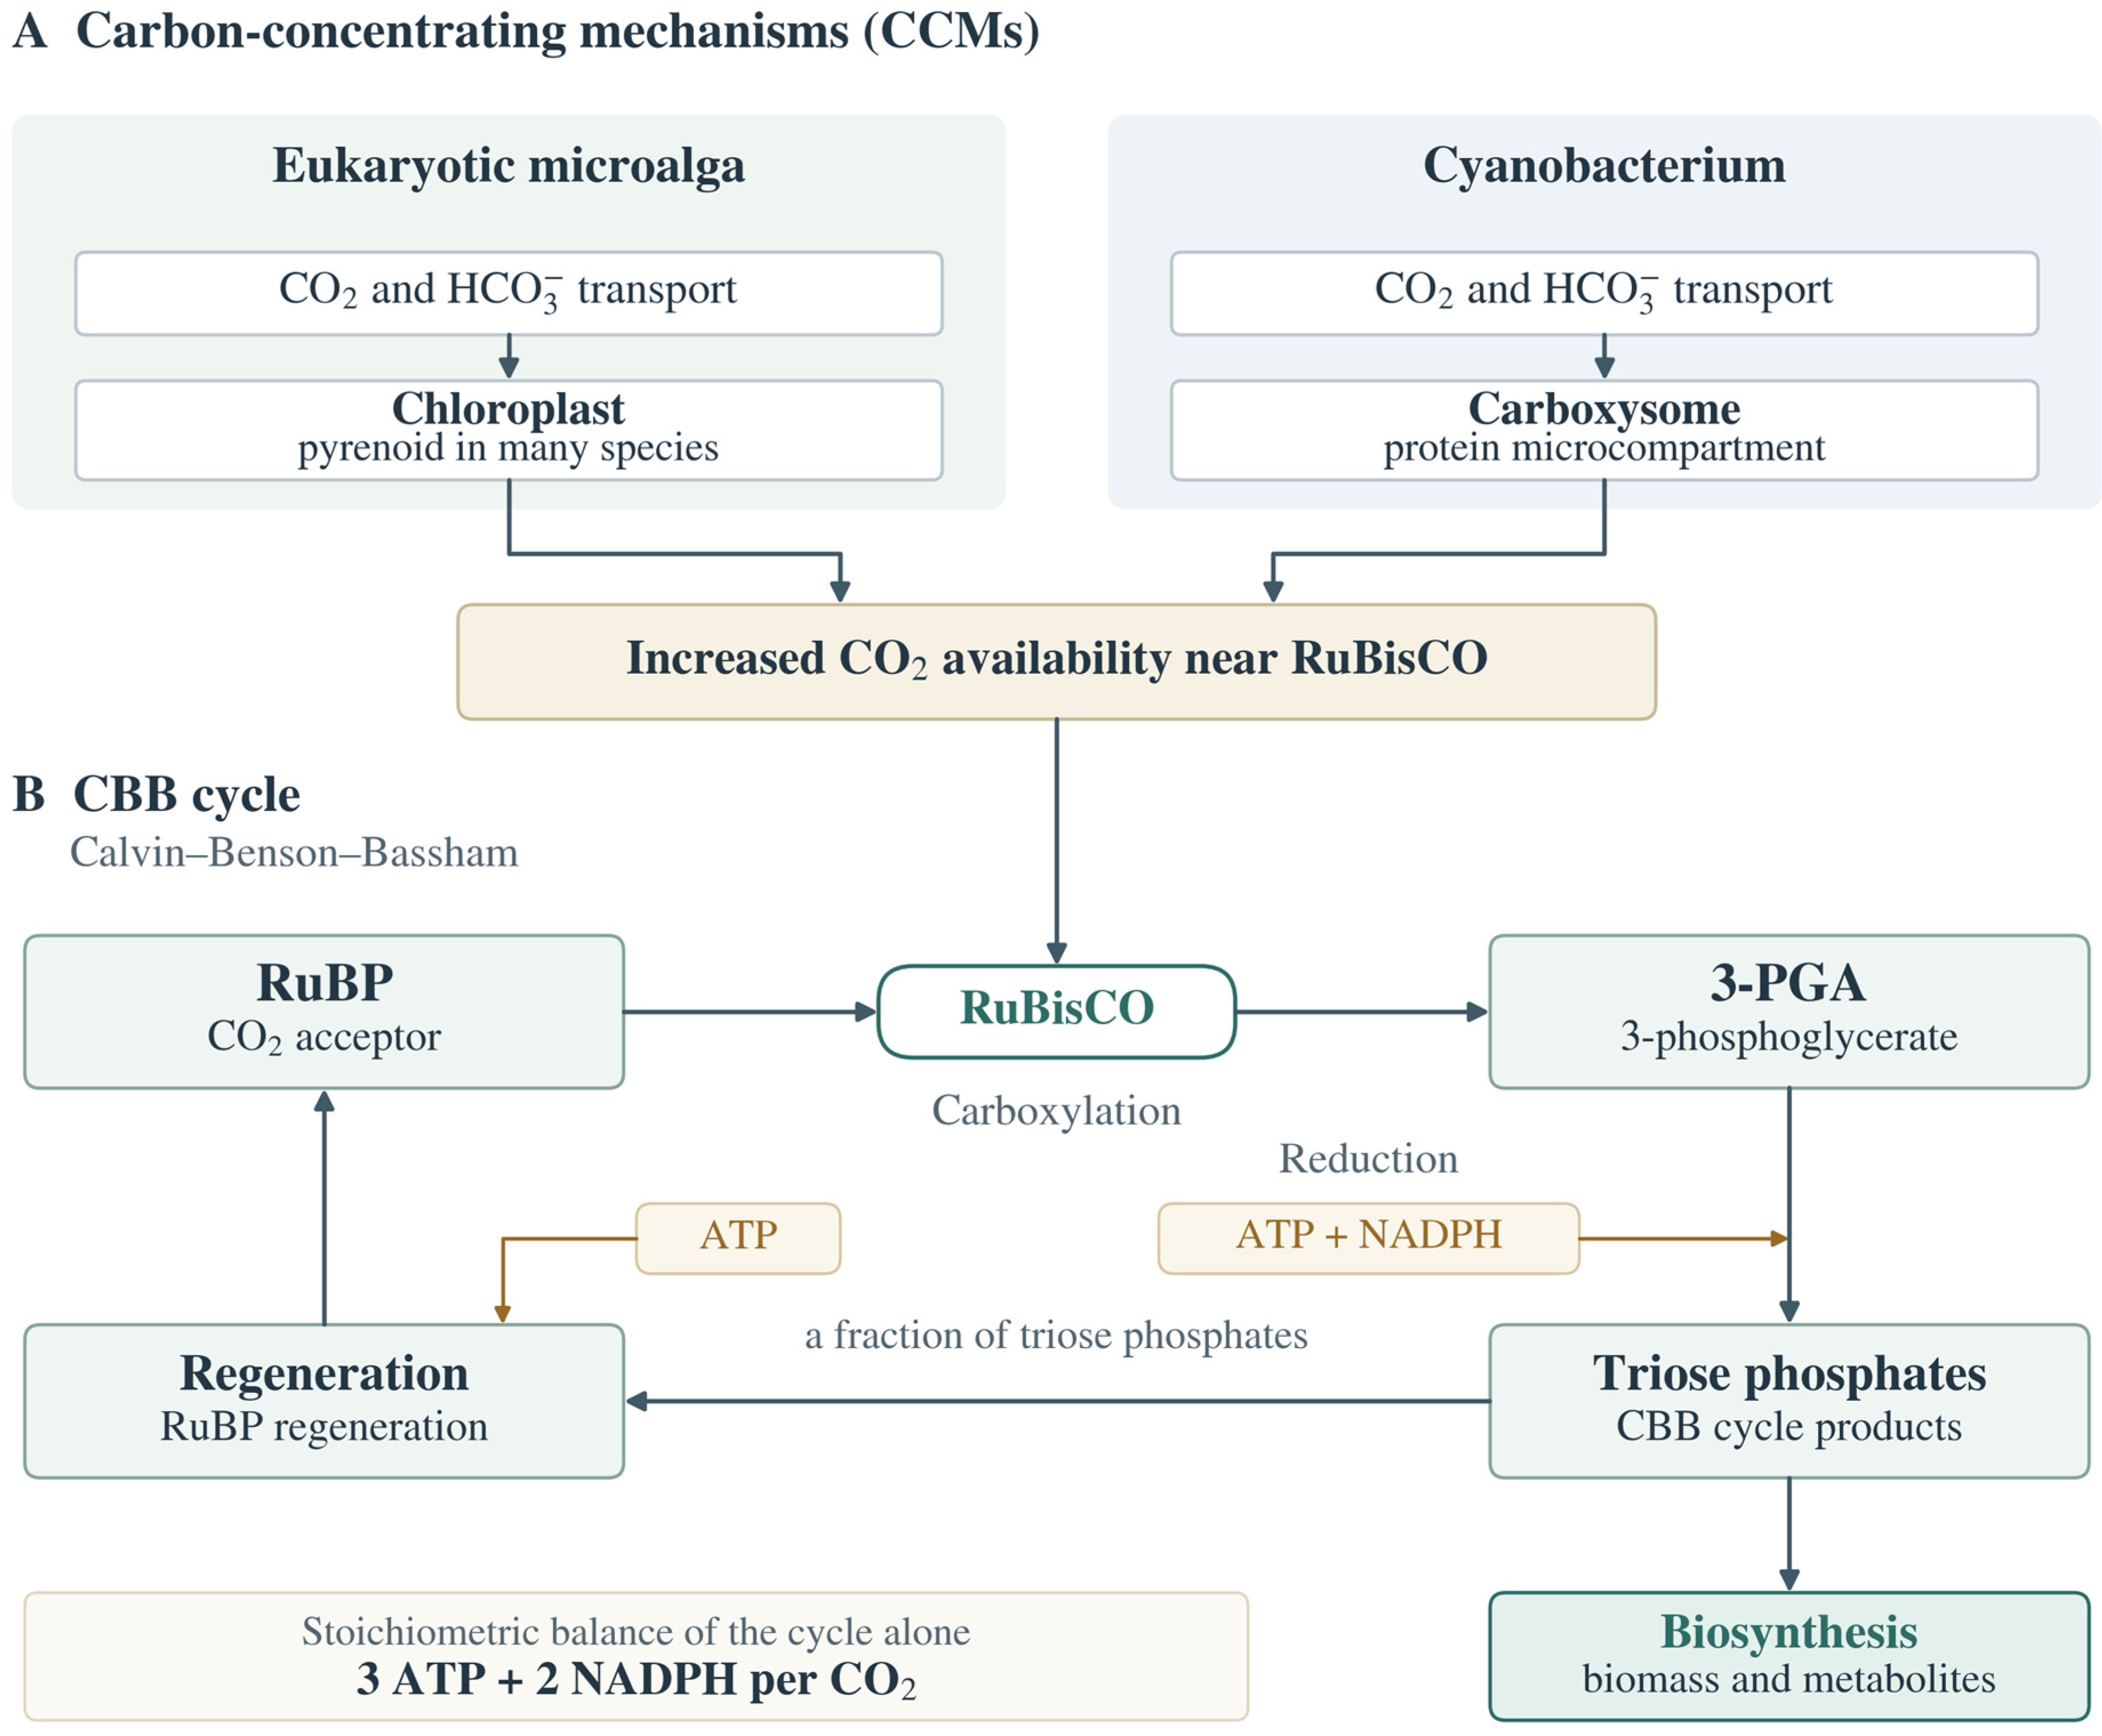
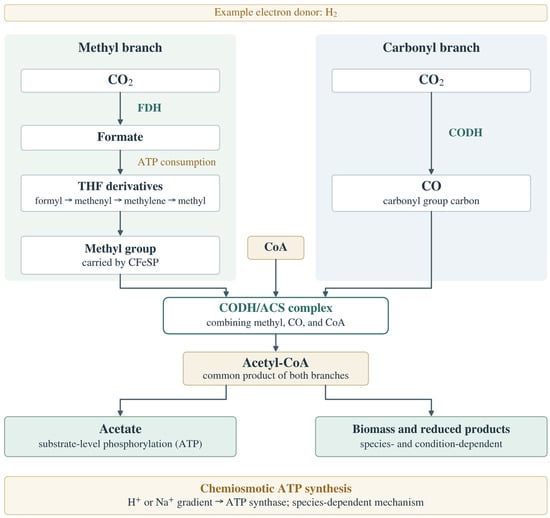
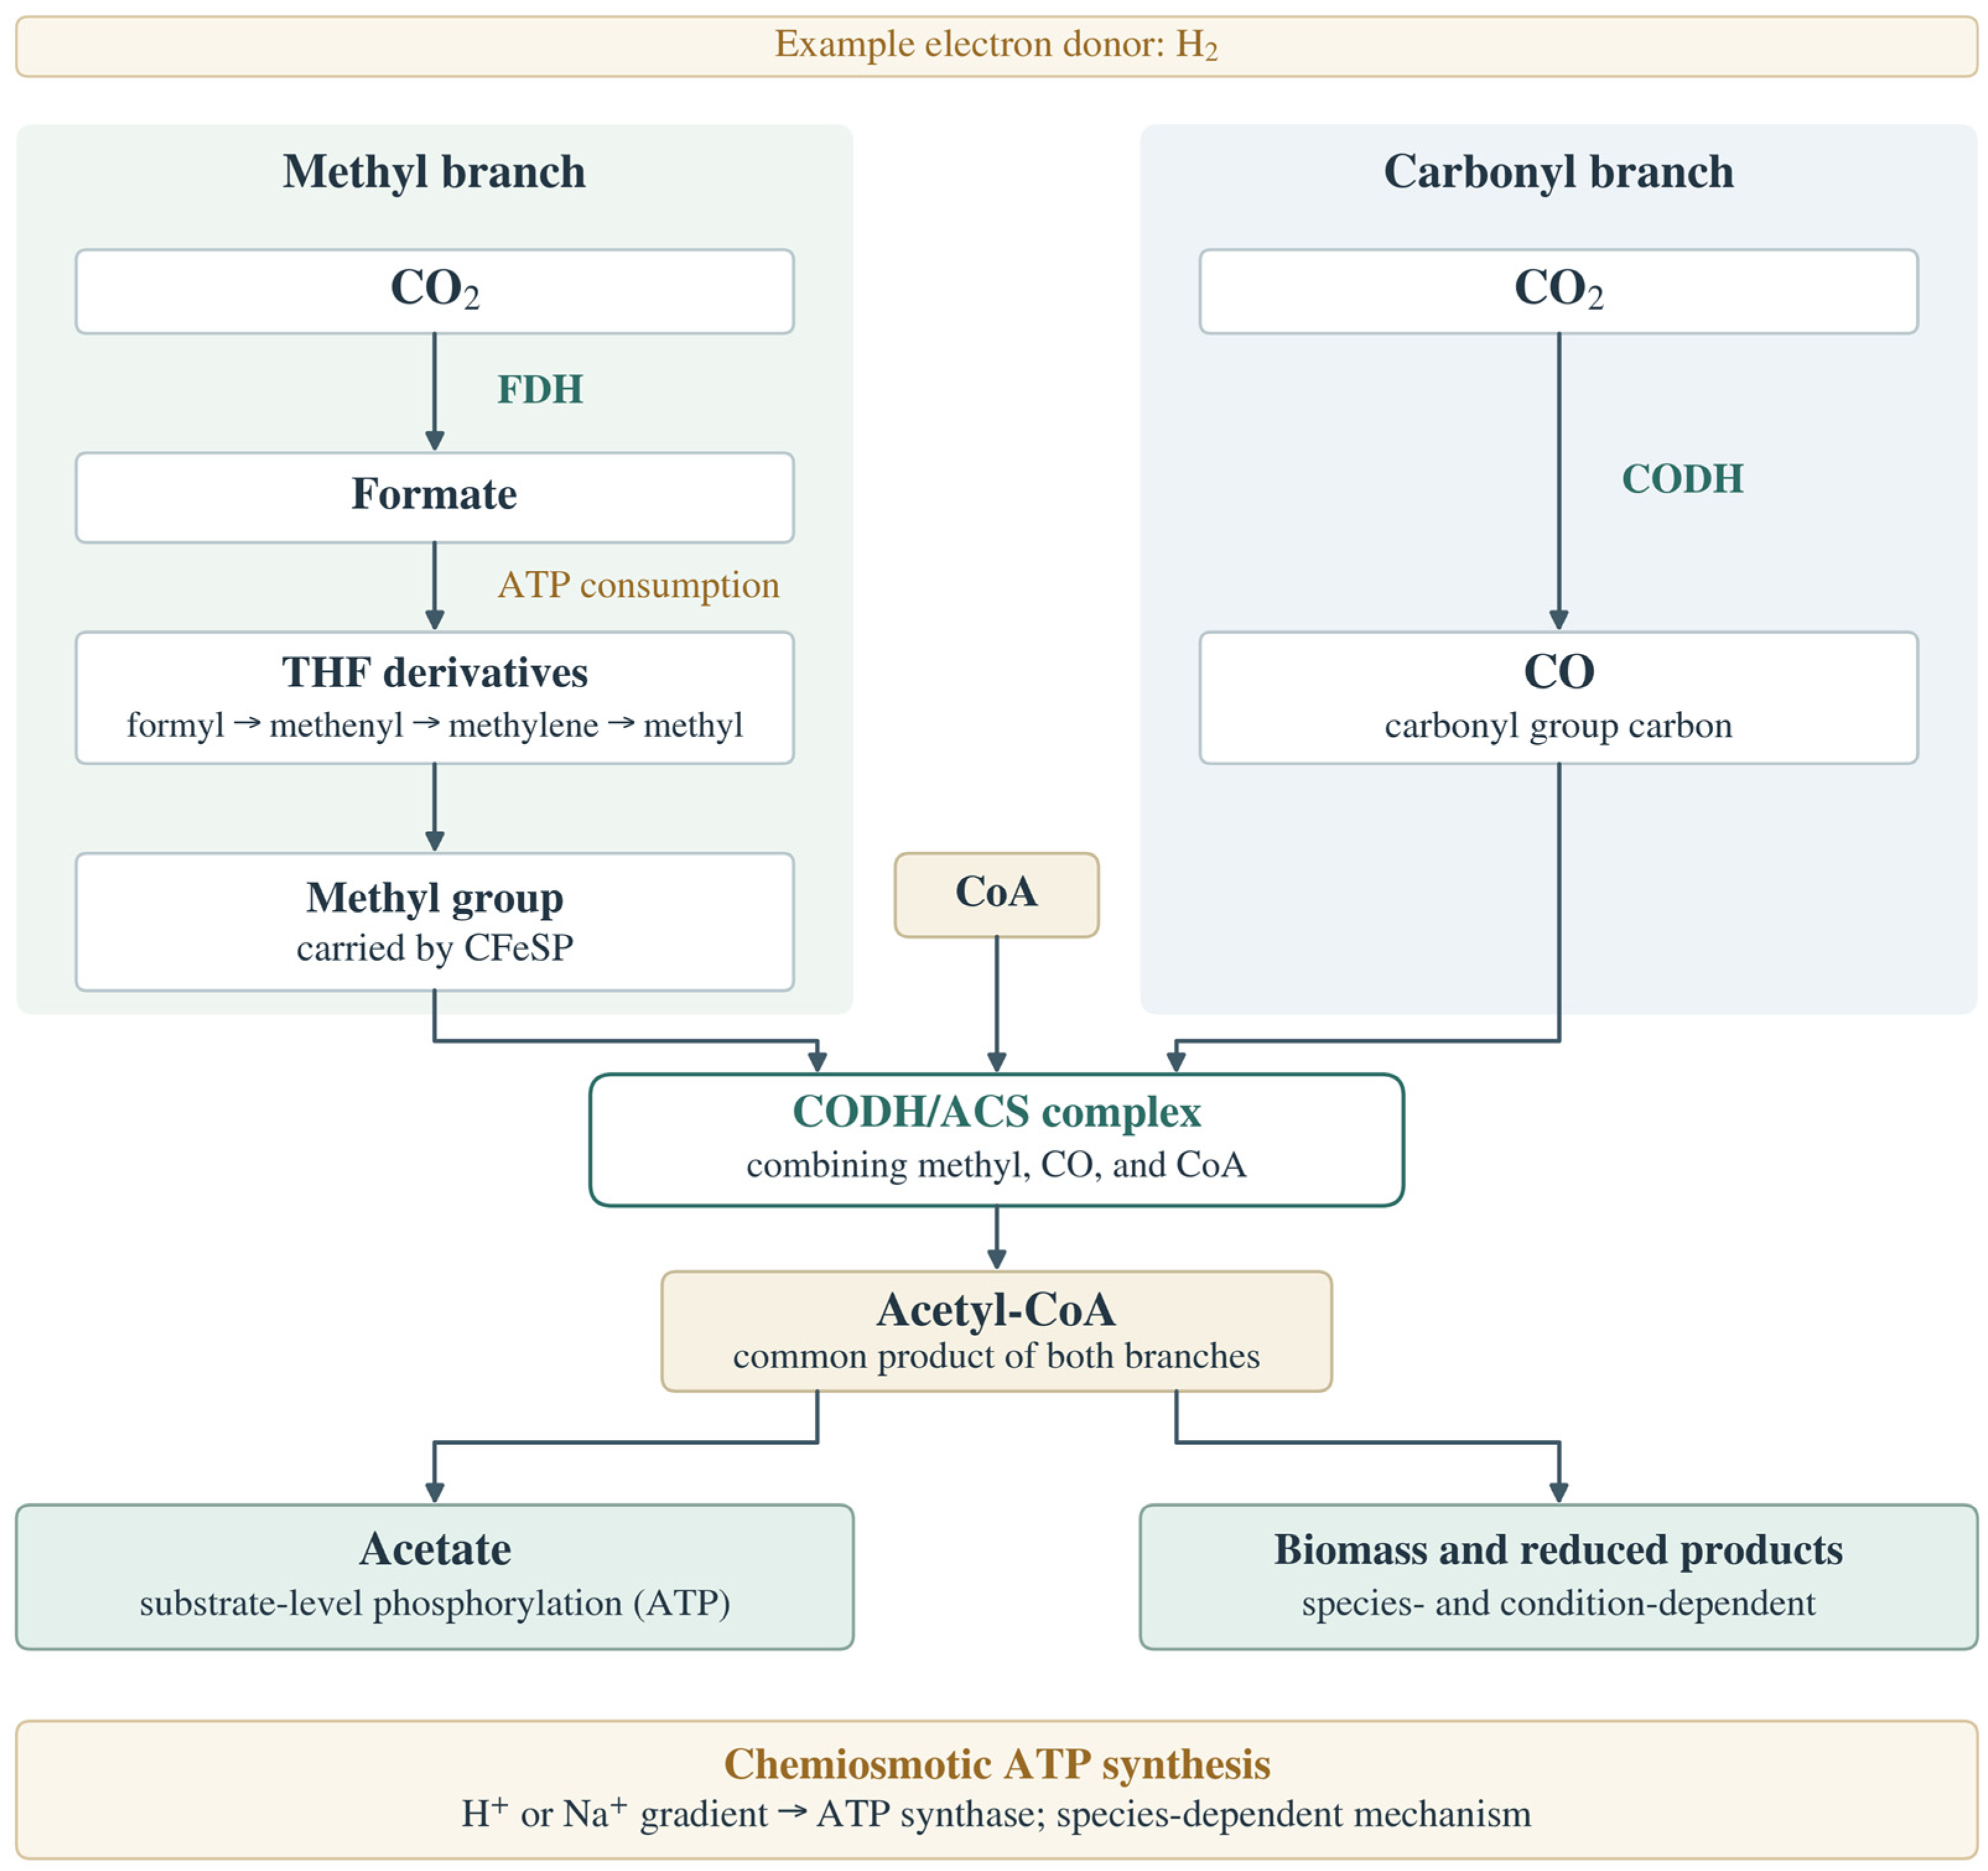
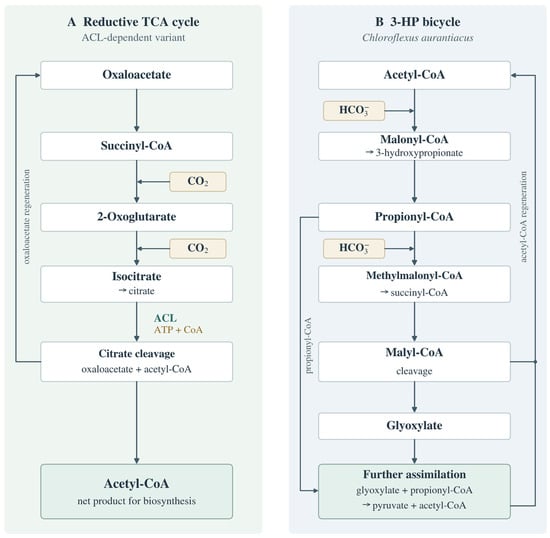
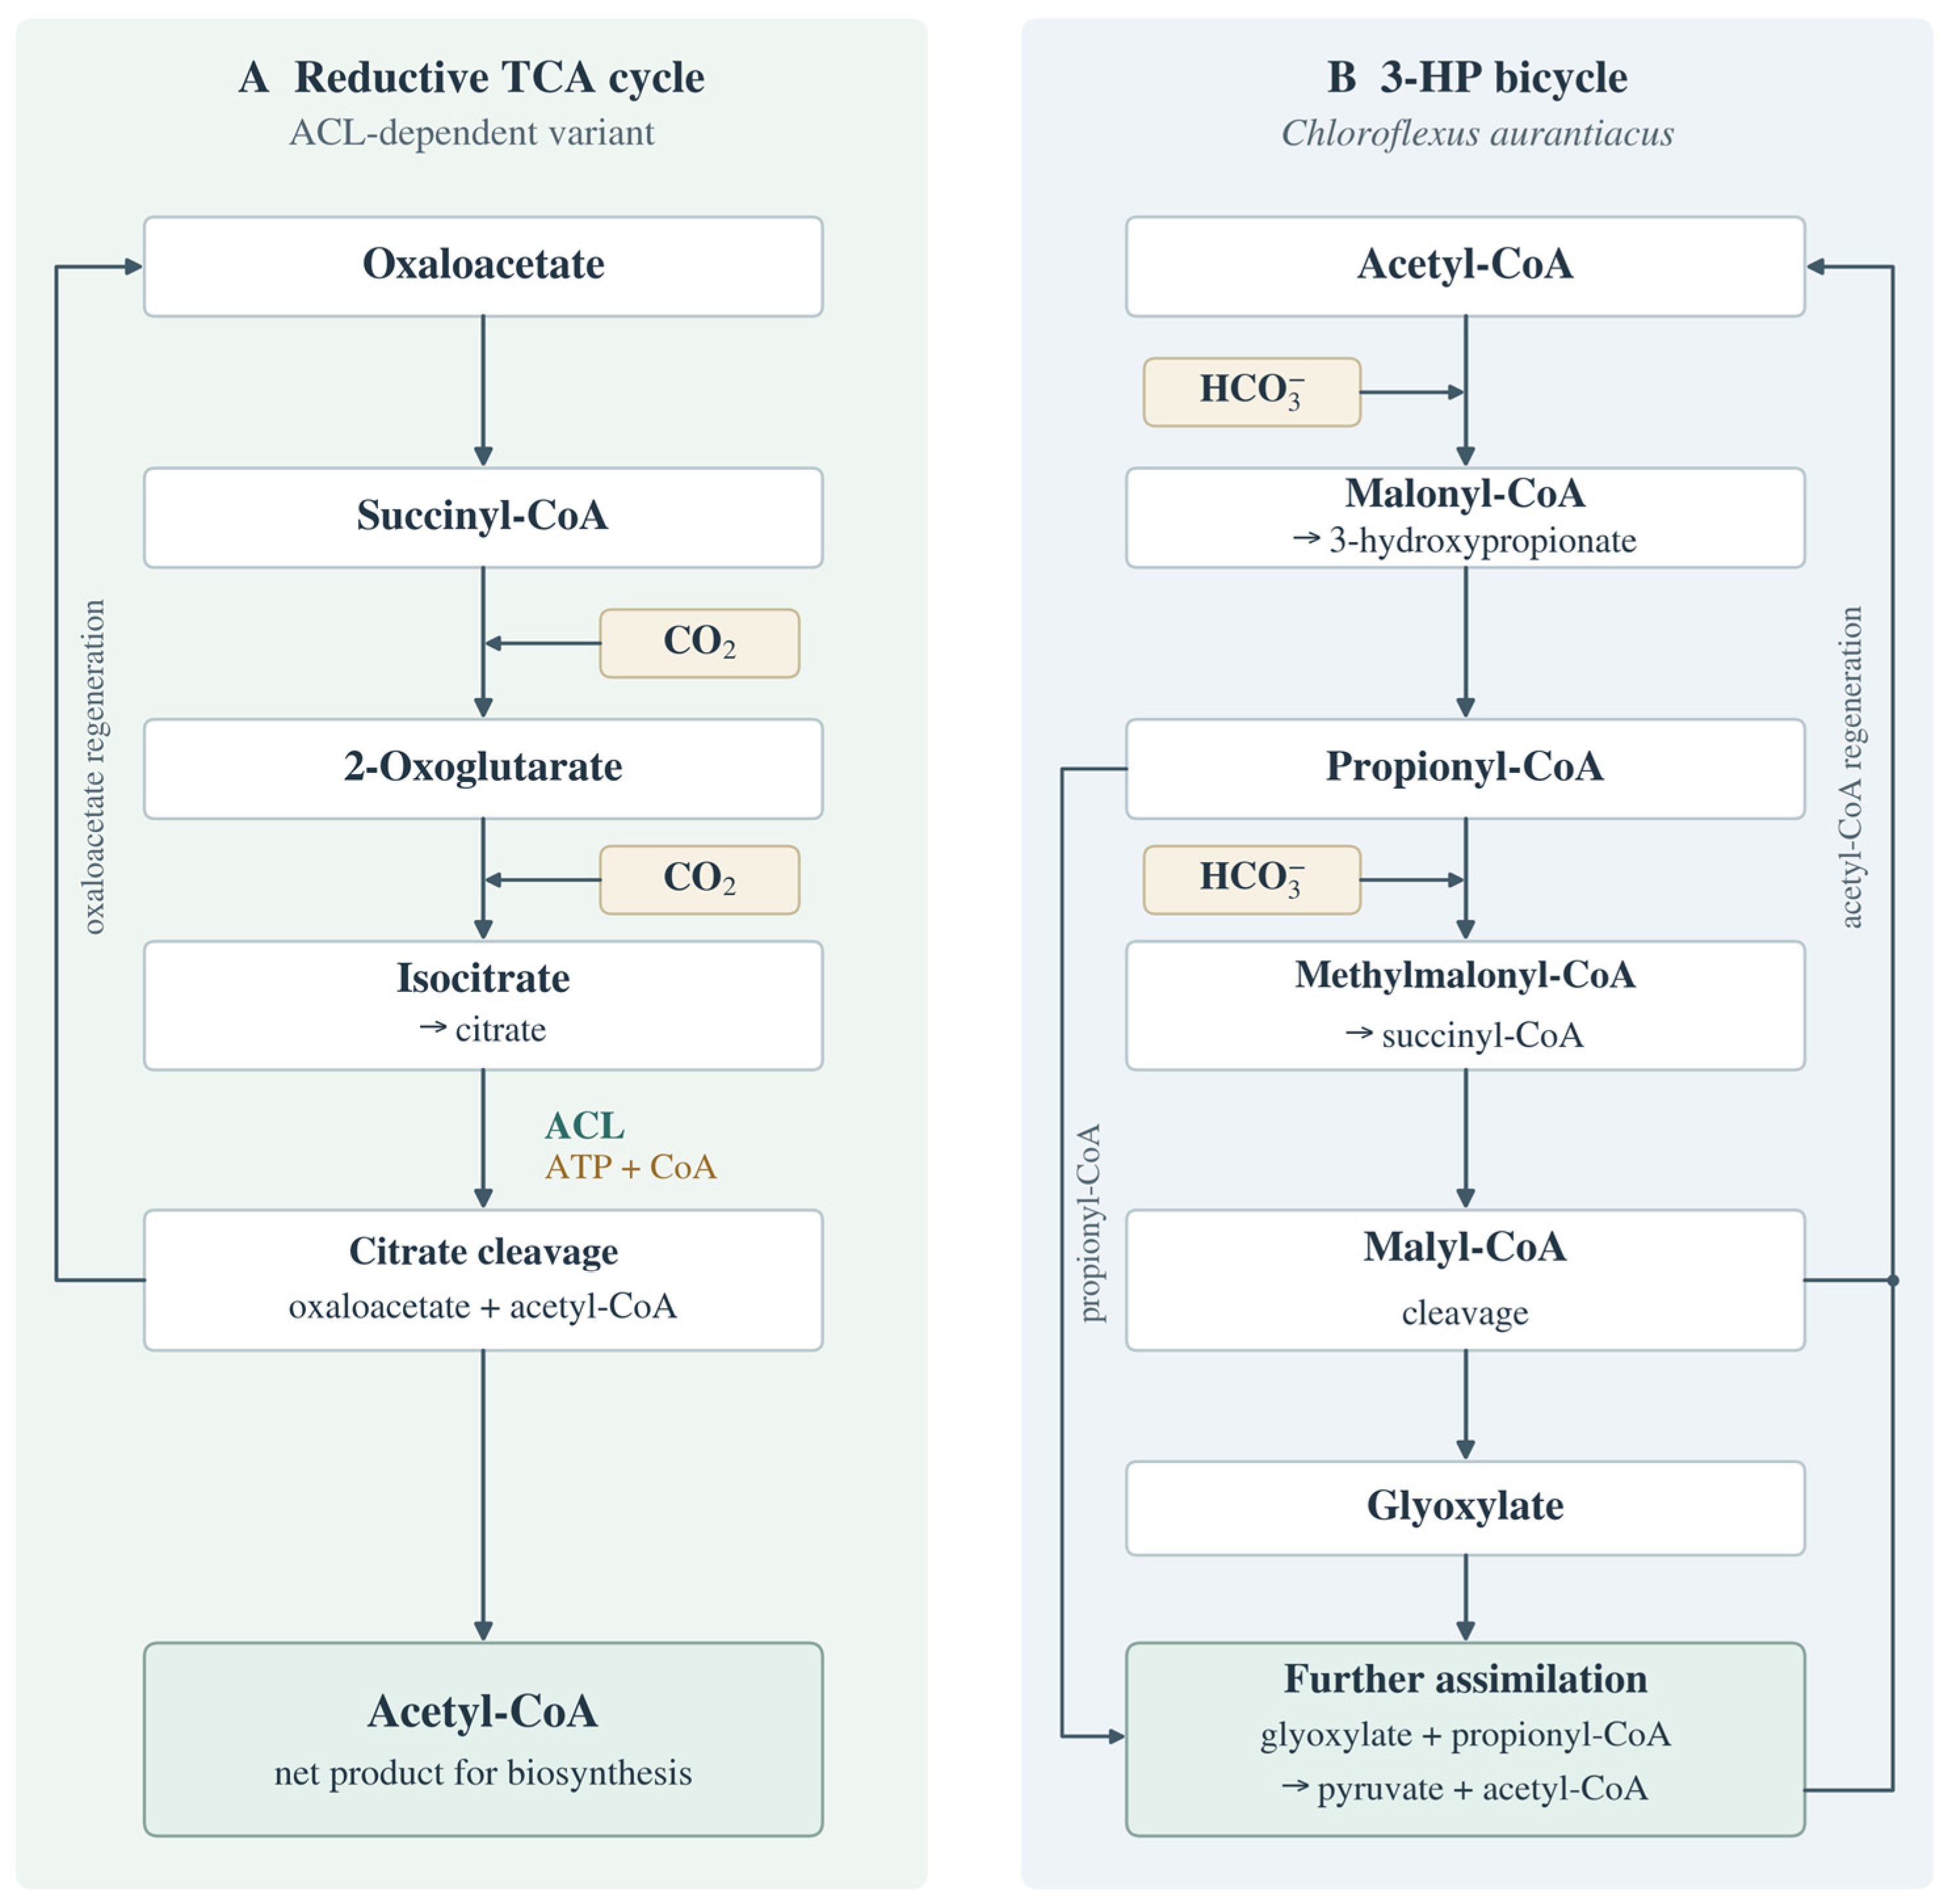
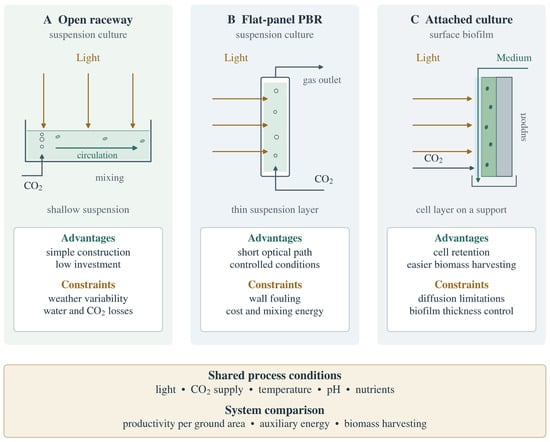
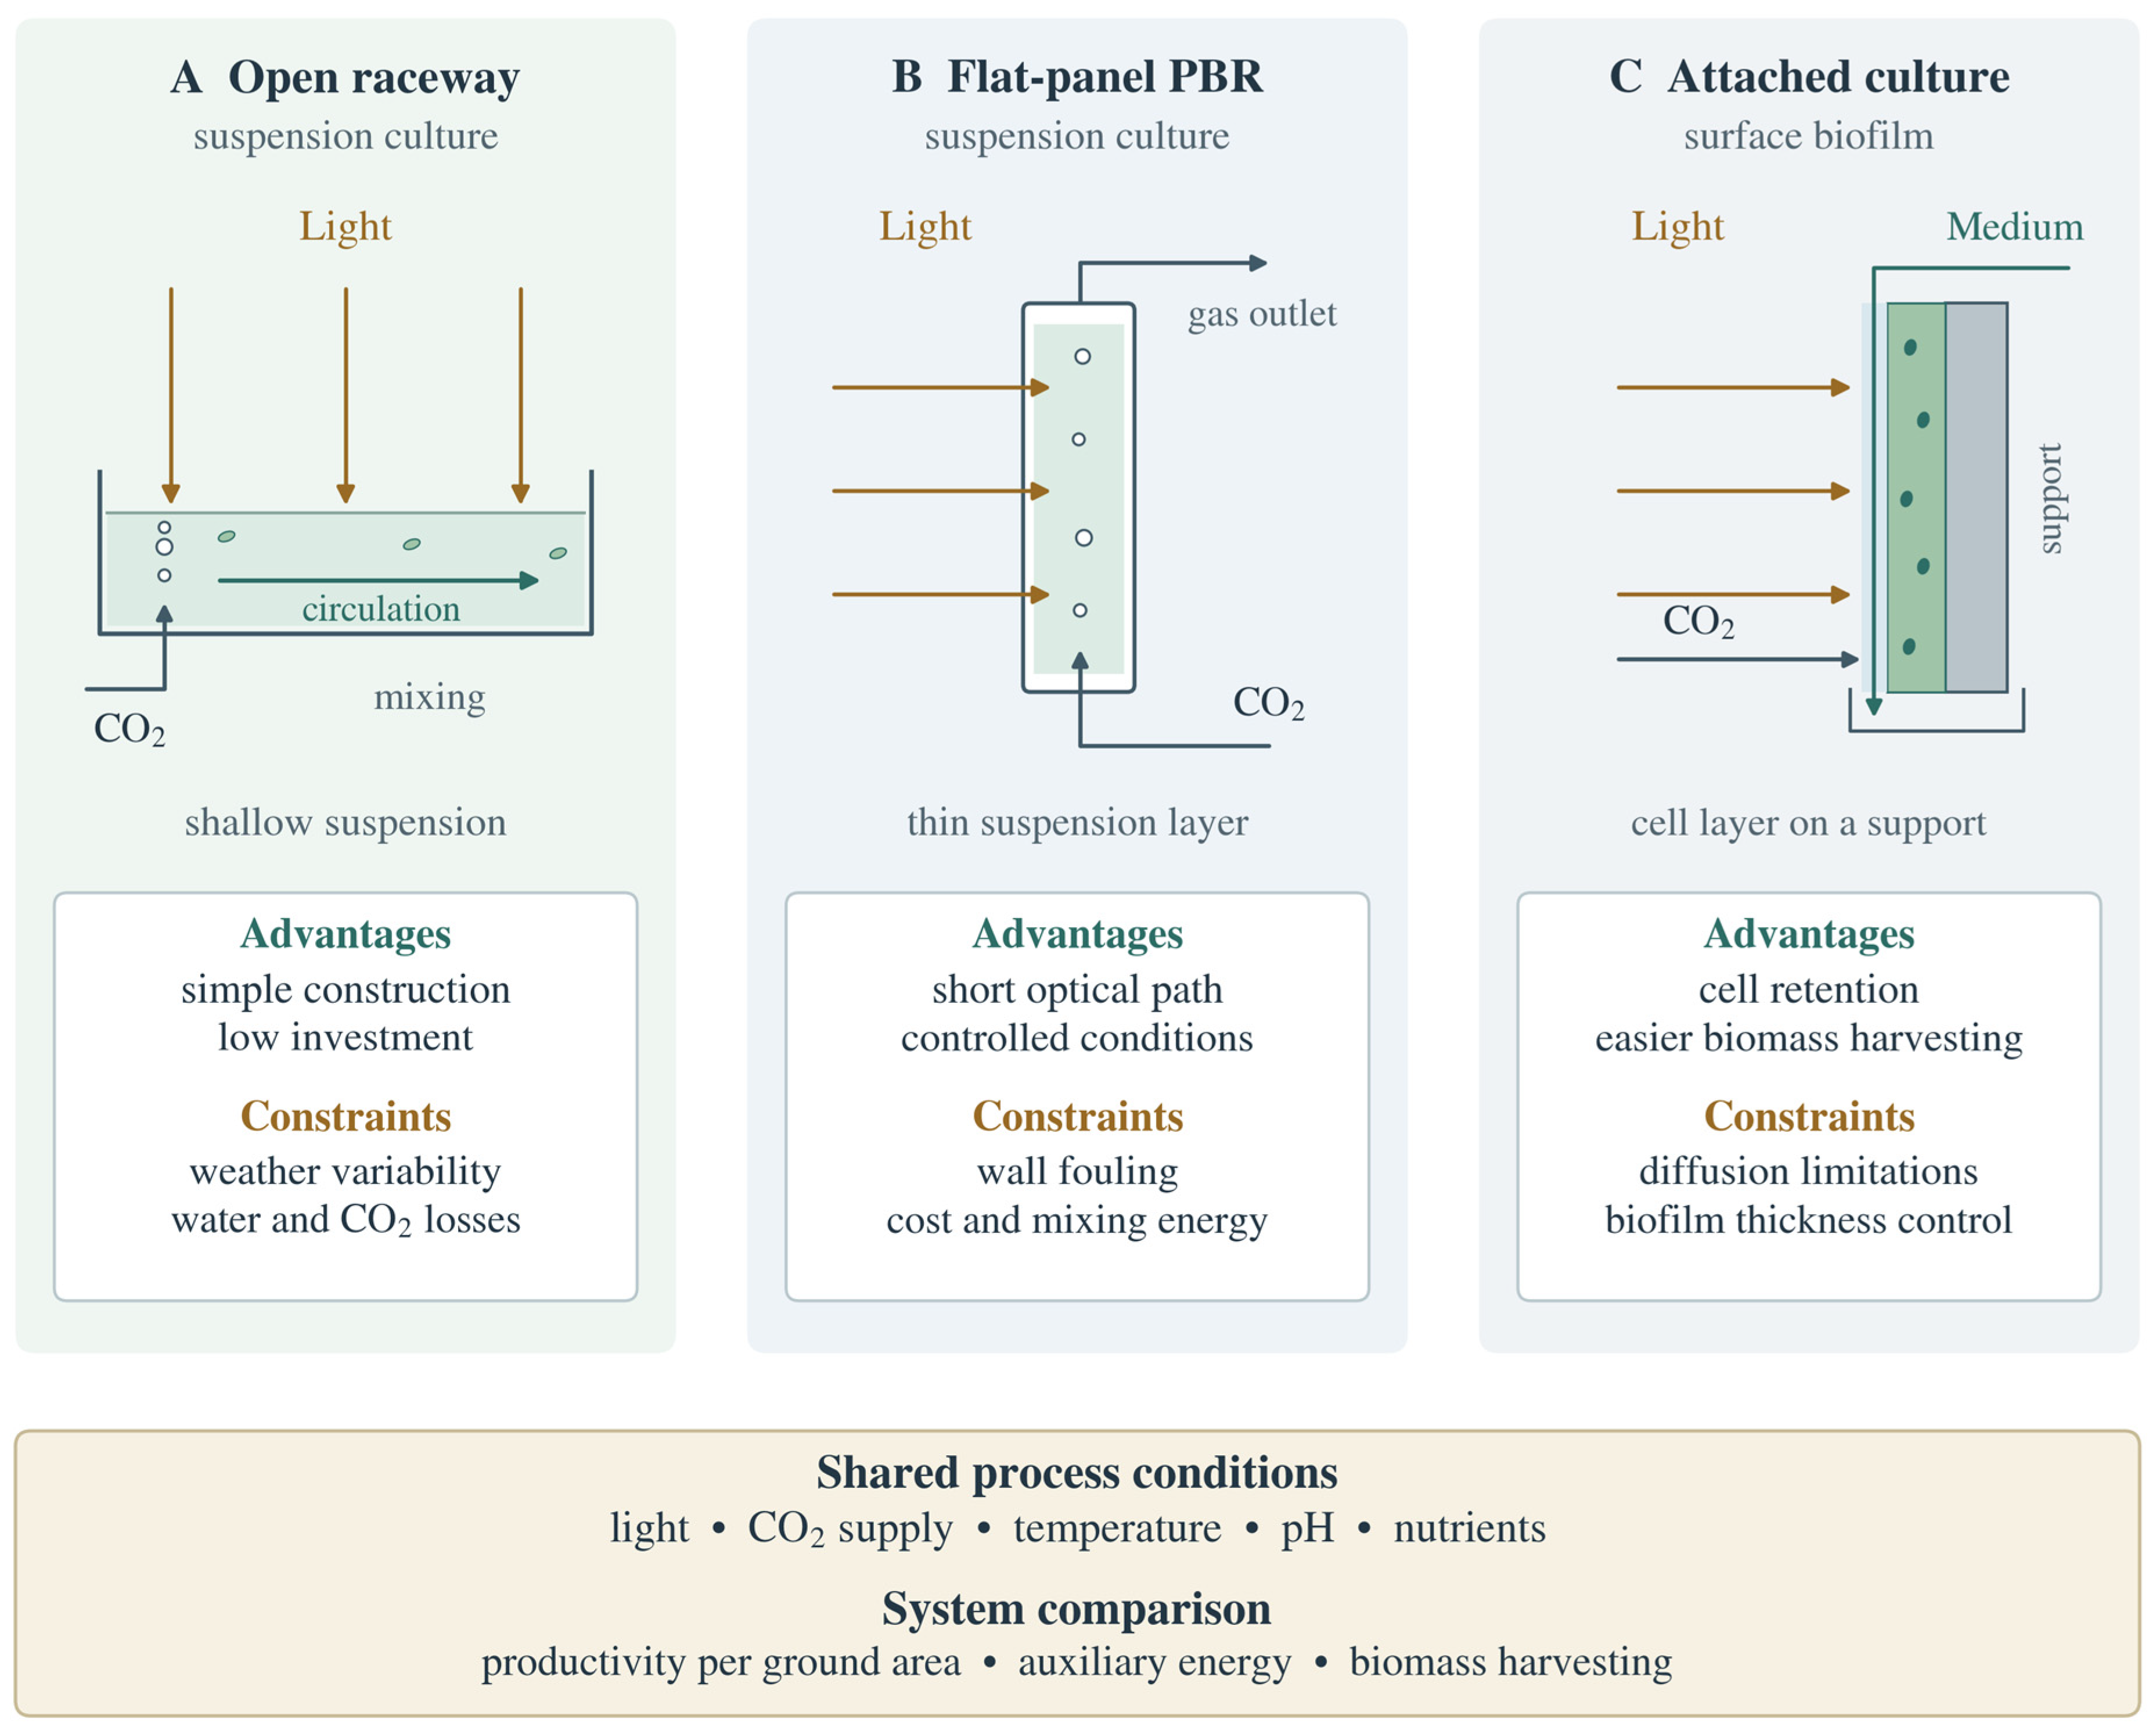
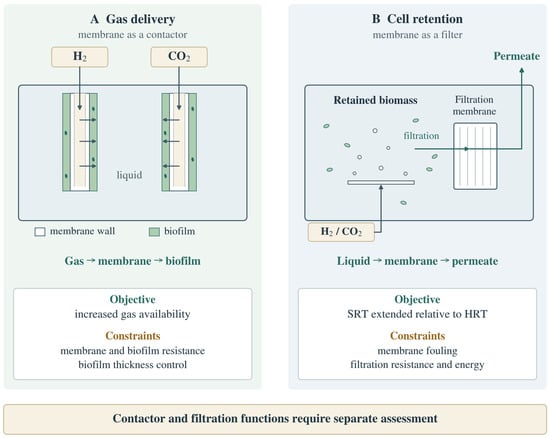
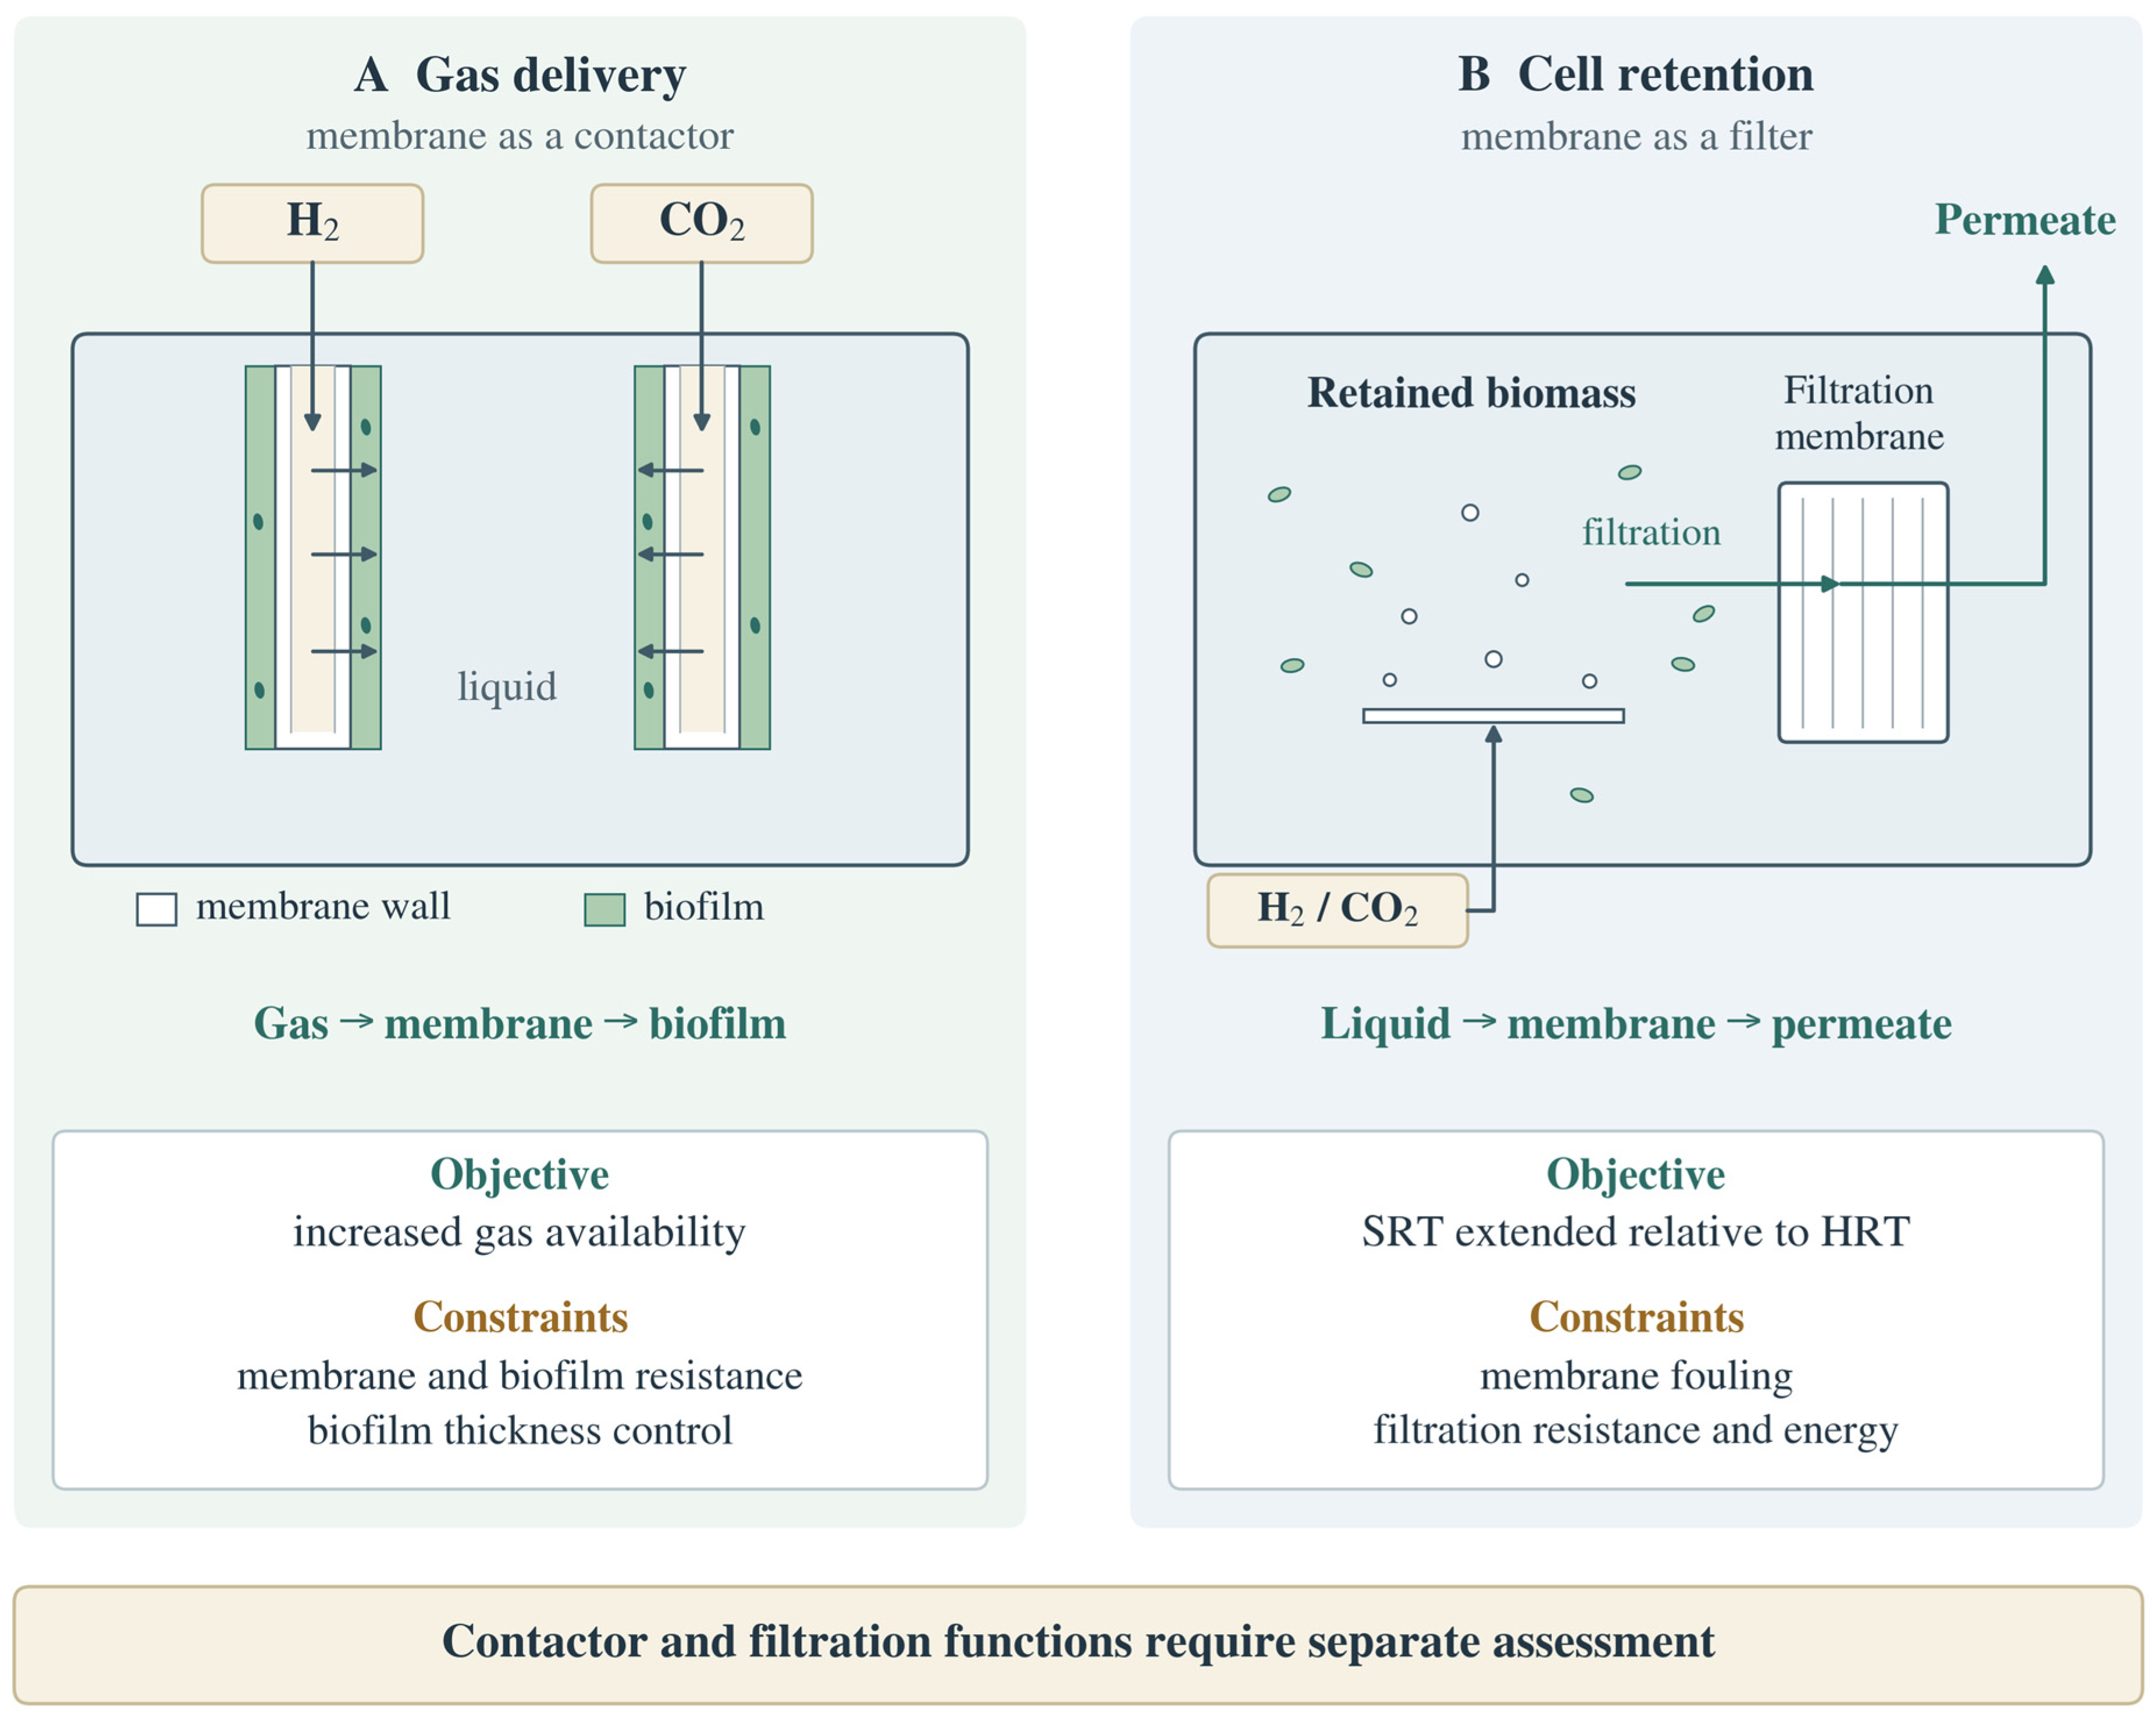
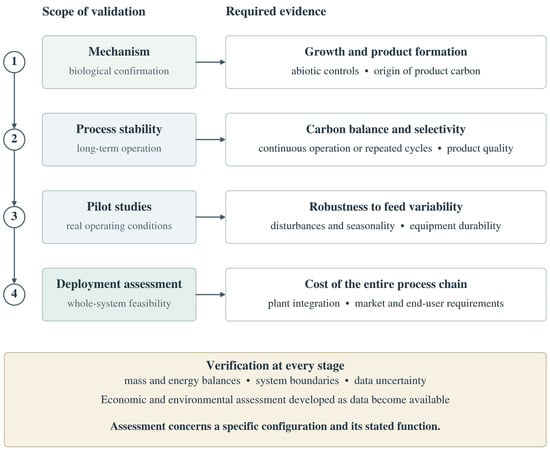
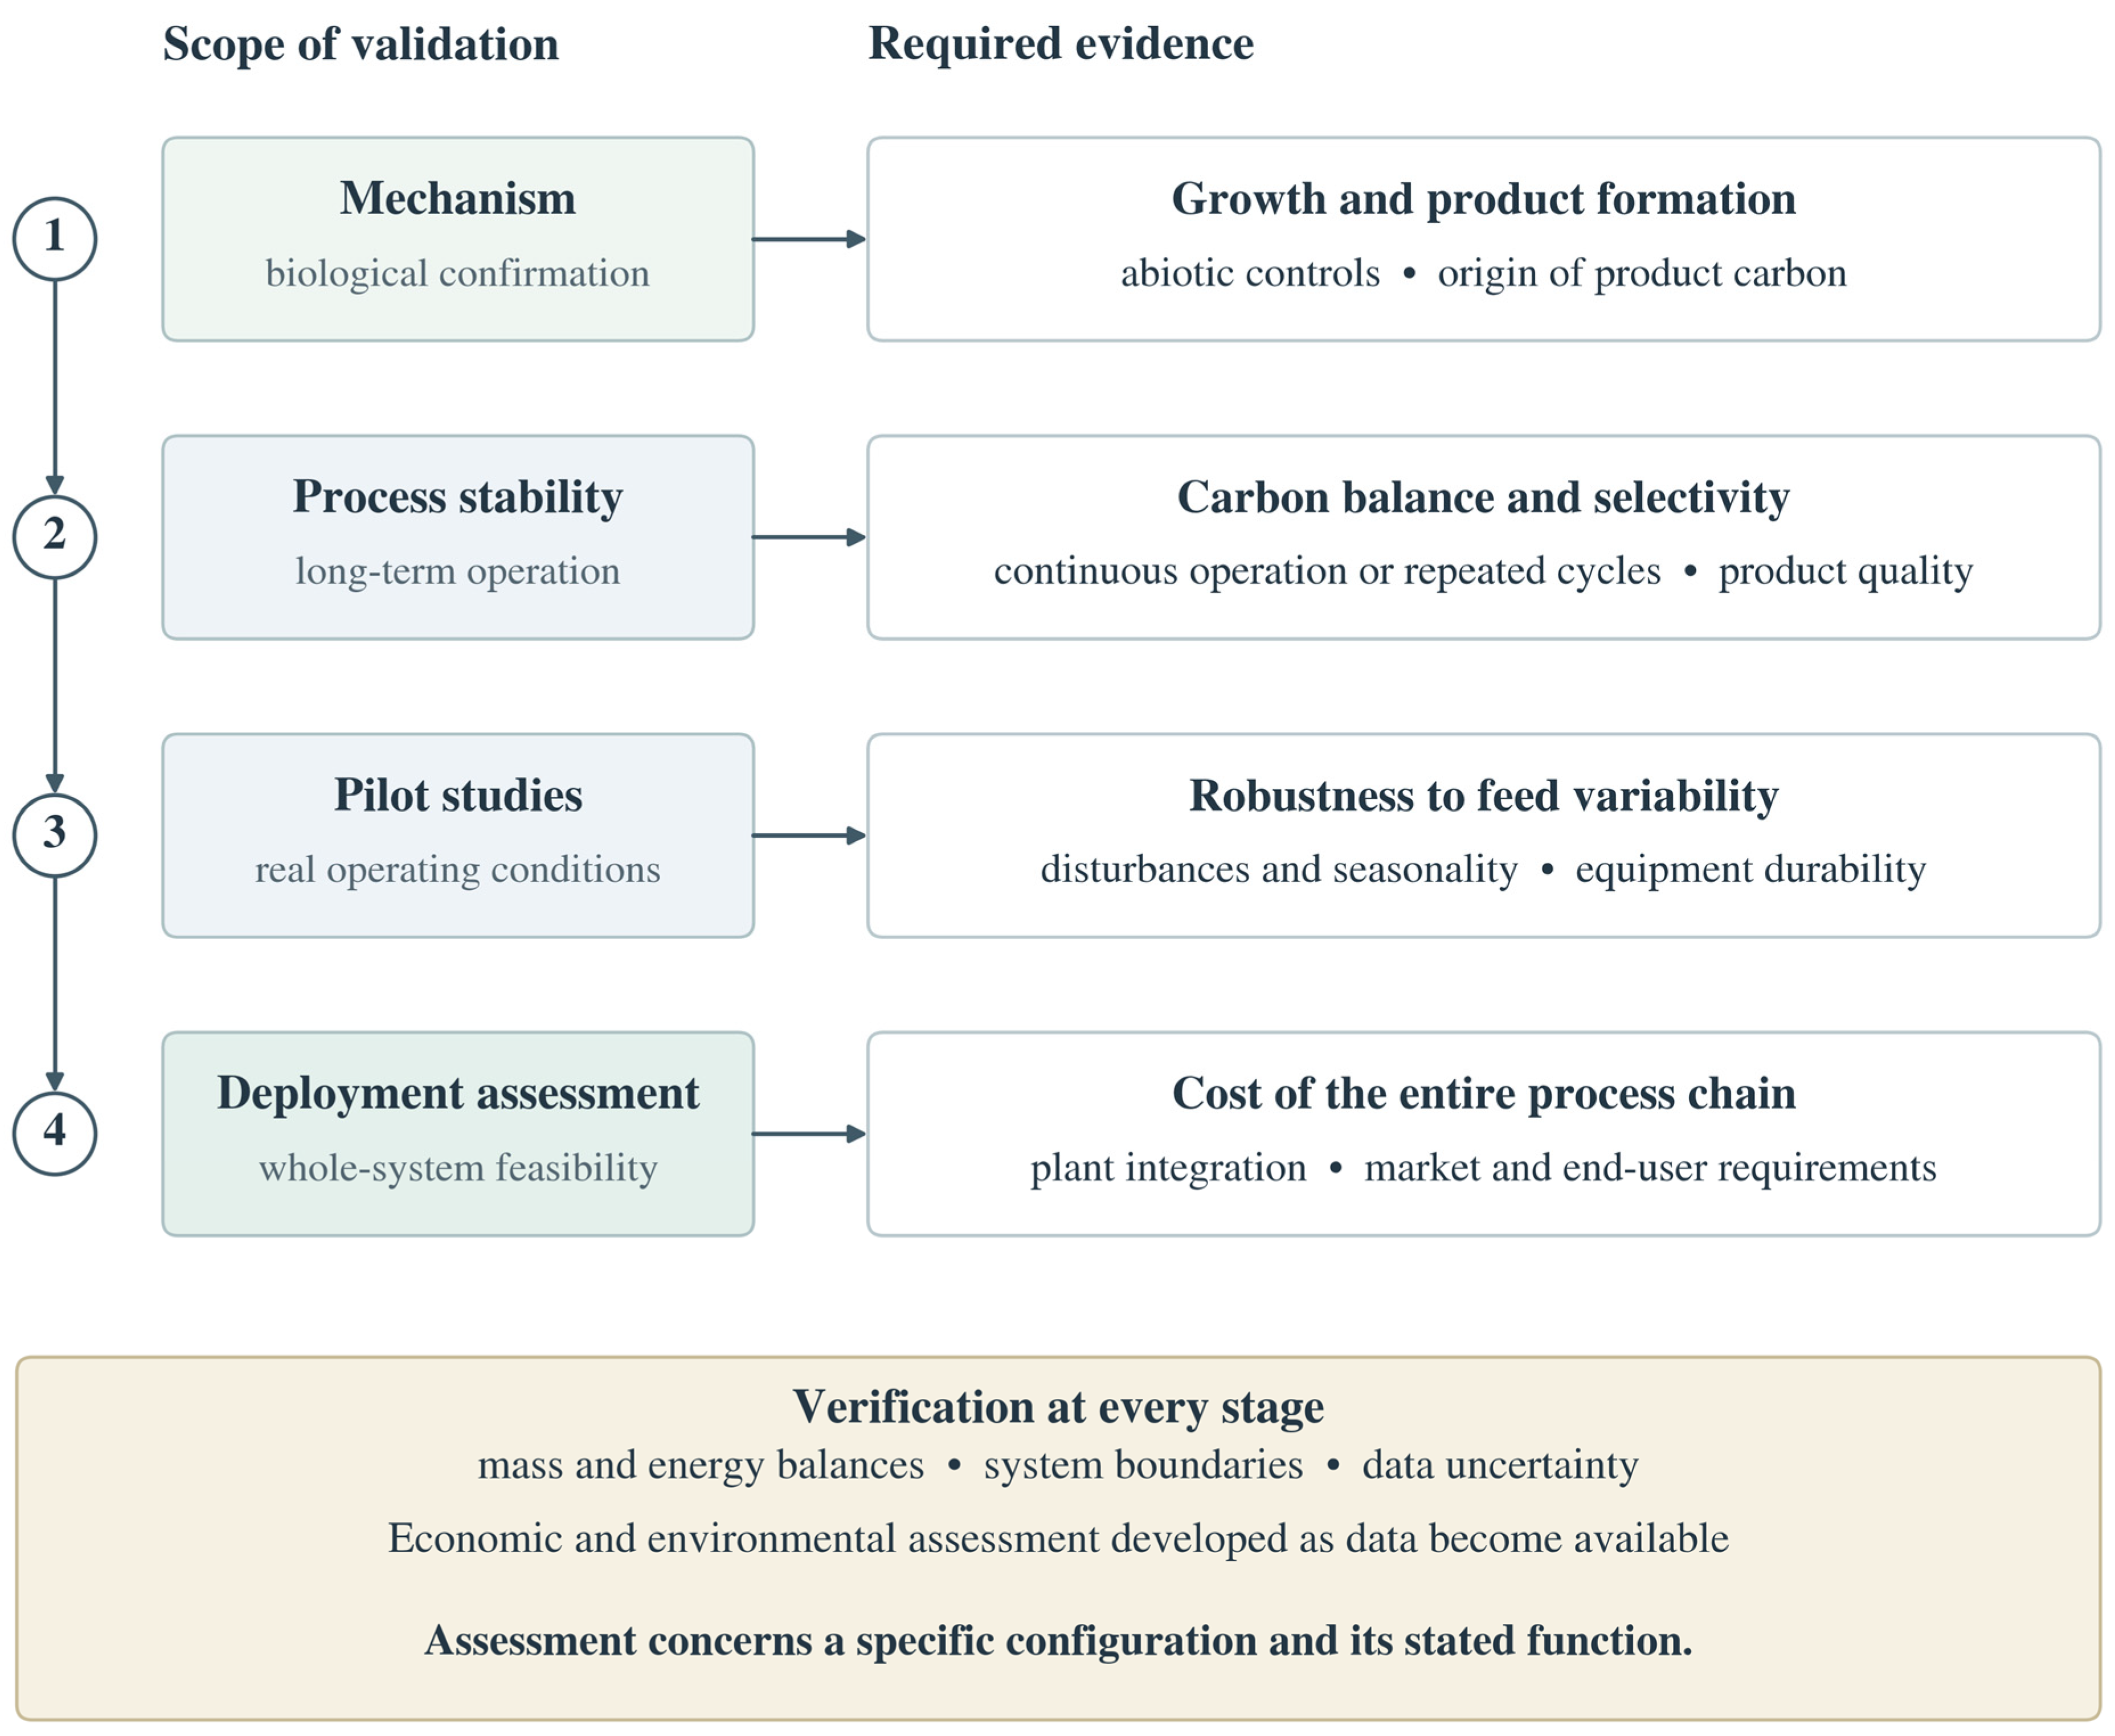

Disclaimer/Publisher’s Note: The statements, opinions and data contained in all publications are solely those of the individual author(s) and contributor(s) and not of MDPI and/or the editor(s). MDPI and/or the editor(s) disclaim responsibility for any injury to people or property resulting from any ideas, methods, instructions or products referred to in the content. |
© 2026 by the authors. Licensee MDPI, Basel, Switzerland. This article is an open access article distributed under the terms and conditions of the Creative Commons Attribution (CC BY) license.