


Abstract
Rapeseed oil has a viscosity several times higher and a lower cetane number than diesel fuel; therefore, its use in engines with a common rail injection system requires adjustment of the injection control. The addition of 10% n-hexane (OR90Hex10) brings the physicochemical properties of rapeseed oil closer to those of conventional fuel; however, the factory maps of the engine control unit remain calibrated for diesel fuel. The aim of this study was to assess the effect of the start of injection (SOI) of the second pilot injection and of the main injection on the combustion parameters of the OR90Hex10 blend under urban driving conditions. The tests were carried out on a complete vehicle (Fiat Qubo 1.3 Multijet, Euro 5) on a chassis dynamometer at a constant speed of 50 km/h and a load resulting from road resistance, at an operating point at which the production control unit does not execute the first pilot injection, so that the injection sequence consisted of the second pilot injection and the main injection, whose common start angle was the parameter varied in this study. The injection timing map was modified in WinOLS, obtaining a coupled shift in both phases from −6 to +3 °CA. The indicating parameters were recorded using the AVL IndiMicro system and averaged over 100 cycles. The highest indicated mean effective pressure, 0.537 MPa, was obtained at the nominal setting, and each correction reduced it by 5.0–12.1%. Advancing by 6 °CA increased the maximum rate of pressure rise to 0.575 MPa/°CA and the maximum pressure to 7.33 MPa, whereas retarding by 3 °CA reduced them by 18.6% and 14.4%, respectively. A correction of −1 °CA reproduced the combustion parameters of diesel fuel to within 1.5%, with differences in maximum pressure, rate of pressure rise and angle of maximum pressure that were not statistically significant. The SOI of both injection phases therefore makes it possible to limit mechanical loads rather than to increase the indicated mean effective pressure.
1. Introduction
Despite the dynamic development and growing share of electric vehicles, diesel engines will continue to play a significant role in road transport, particularly in long-haul and heavy-duty transport, where limitations related to range, charging time, payload and the availability of charging infrastructure hinder the widespread adoption of battery-electric powertrains [1,2,3,4]. Stringent emission standards, currently in force in many regions of the world, are difficult to reconcile with the actual direction of change in road transport. While a global trend of emissions reduction persists across most sectors of the economy, transport remains one of the few sectors in which emissions continue to rise as demand grows. This phenomenon has been confirmed, for example, in the European Union, where in the years 2013–2024 most sectors of the economy reduced their emissions, while the transport and storage sector increased its emissions by 14%. This problem is particularly concerning for heavy-duty transport, which in the European Union remains 97.9% dependent on fossil fuels, while full electrification of this segment is, in the short and medium term, limited by universal technological and economic barriers, independent of any specific jurisdiction [1]. In this context, the path to meeting the imposed emission standards for the existing fleet primarily involves using alternative fuels such as fatty acid methyl ester (FAME) or hydrotreated vegetable oil (HVO) [1,5,6,7,8]. However, none of these solutions was free from limitations: in the case of FAME, concerns were raised regarding long-term engine durability, and in the case of HVO, the need for further research on its effect on NOx emissions and fuel lubricity was indicated, which prompted the consideration of HVO/FAME blends as a solution mitigating the drawbacks of each of these fuels individually. Moreover, the problem of using alternative fuels in diesel engines was not limited solely to the durability of the injection system, but also concerned the course of the combustion process itself. Numerous studies have shown that the higher viscosity and lower cetane number of some vegetable fuels prolong the ignition delay relative to diesel fuel, resulting in a shift in the start of combustion (SOC) [9,10]. The same mechanism was reported for blends containing 50% and 80% straight soybean oil, in which the heat release rate derived from the pressure trace showed a delayed start and a prolonged course of combustion [11], and in a constant-volume combustion apparatus, in which the ignition delay was resolved into its physical and chemical parts and the fuels were ordered according to their ignition quality [12]. It was also shown that a change in the SOC significantly affected both the energy indicators (thermal efficiency, specific fuel consumption, maximum heat release rate) and the emission parameters, including CO, HC, and NOx emissions and exhaust smoke opacity, which remain particularly sensitive in view of the applicable exhaust emission standards [13]. Engine measurements of the cylinder pressure for blends of rapeseed oil showed the same direction of change, with the oil burning over a longer period than the reference fuel [14]. Moreover, the different physicochemical properties of alternative fuels, primarily their higher bulk modulus relative to diesel fuel, cause faster pressure wave propagation in the injection system (despite their higher density, which acts in the opposite direction), which results in a shift in the actual SOI relative to the value factory-programmed for diesel fuel [15,16,17,18]. Consequently, the use of such fuels requires appropriate adjustment of the injection settings (e.g., retarding the injection timing) relative to the engine manufacturer’s nominal calibration in order to maintain the intended combustion characteristics and mitigate an undesirable increase in NOx emissions [15]. This has been confirmed experimentally for pure rapeseed oil methyl ester, whose earlier start of injection and steeper heat release raised nitrogen oxide emissions, and for which retarding the injection by 2 °CA restored the emission level of diesel fuel without a measurable penalty in the remaining parameters [19]. A shift in the start of injection by ±5 °CA in a common rail engine fuelled with waste-cooking-oil biodiesel and its alcohol blends changed the ignition delay and the nitrogen oxide emissions in the same direction [20]. In parallel, other attempts to use alternative fuels were also undertaken, employing, among others, rapeseed oil with the addition of n-hexane. Its selection (in proportions of the order of 10–15%) was determined in the authors’ previous publications, which characterized the physicochemical properties of the resulting blend, including its viscosity, surface tension, and ignition delay characteristics, and compared the obtained results with those of diesel fuel (Df) [10,16,21,22]. These studies revealed, among other things, the need to change the fuel injection parameters, dictated by the different physicochemical properties of the resulting blend relative to Df [22,23].
Previous studies on the use of alternative fuels, including fuels of plant origin, were dominated by analyses conducted at the level of vehicle operation in real-world traffic (RDE) or in reproduced driving tests (WLTP), which primarily assessed fuel consumption and exhaust emissions without a deeper analysis of the causes of the observed changes in these parameters. These studies showed, among other things, that HVO was characterized by fuel consumption similar to that of Df in both the NEDC and WLTP cycles (a difference of the order of 0.05%), whereas in the WLTP cycle, an increase in NOx emissions relative to the NEDC was observed, attributed to the higher dynamics and higher speeds of this cycle [24]. Similar road tests on vehicles fuelled with blends of Df and renewable fuels showed a beneficial effect of these fuels on the emissions of selected exhaust components at comparable fuel consumption [25,26], while chassis dynamometer tests in the WLTC cycle confirmed the possibility of reducing pollutant emissions using blends of HVO with pyrolysis oils, also without deterioration in fuel consumption [27]. These studies can be regarded as an analysis of the effects of using alternative fuels at the vehicle level; however, they did not assess the effect of these fuels on engine parameters, including the powertrain control settings dedicated to Df fuelling, nor the possible need to correct individual control parameters in modern common rail fuel injection systems [28]. The potential of such corrections has been demonstrated directly on the pressure trace of an automotive diesel engine, in which the control of the rail pressure and of the exhaust gas recirculation shifted the combustion timing, its duration and the resulting combustion noise indicator [29]. It should be emphasized that the operating parameters of a powertrain are usually assessed on an engine dynamometer, where, in addition to fuel consumption and exhaust emissions, high-frequency parameters describing the operation of the injection system and the course of the combustion process are also analyzed (including the actual SOI and injection duration, the in-cylinder pressure trace, the SOC and the ignition delay), while the engine settings, including injection timings, remain constant throughout the measurement range in such studies [10,17,28,30,31,32]. Studies conducted on the engine of an actual vehicle equipped with factory control (ECU), whether in road traffic or under conditions reproduced on a chassis dynamometer or in driving tests, make it possible to verify its operation, taking into account the effect of engine auxiliaries and ambient conditions; however, they do not include an analysis of the injection parameters or the course of the combustion process. The factors that differentiate the results of such studies include the exhaust gas recirculation (EGR) system, whose operation in dynamic driving cycles differs significantly from its behavior under steady-state conditions [33]; the turbocharging system; the exhaust aftertreatment system, together with diesel particulate filter (DPF) regeneration cycles; as well as the ambient temperature and the thermal state of the engine, which, for a vehicle meeting the Euro 6 standard, may increase NOx emissions by as much as 30–55% relative to reference conditions [34]. These factors, together with the other operating and design conditions of the vehicle, significantly differentiate the results obtained on a chassis dynamometer from those of engine tests [35].
However, no publication was found in which fuel consumption and exhaust emissions, investigated under RDE or WLTP conditions, were analyzed simultaneously with the course of the processes occurring inside the engine combustion chamber (such as the combustion pressure trace, the SOC, or the ignition delay). These issues have so far been the subject of separate studies by the authors. The authors of the present work have long been conducting test bench studies of the combustion of rapeseed oil–n-hexane blends, demonstrating, among other things, that the addition of n-hexane to rapeseed oil improved its physicochemical properties (surface tension, viscosity, and density) without a significant reduction in calorific value, albeit at the cost of reduced engine torque and power, and that higher n-hexane contents delayed the start of combustion [10]. It was also shown that the assessment of ignition delay in a constant-volume combustion chamber did not fully reflect the beneficial effect of this additive observed during tests on an actual engine equipped with a common rail system [30]. However, the previous studies did not cover the effect of a coupled change in the injection timings of the second pilot injection (P2) and the main injection (G) on the course of combustion of the OR90Hex10 blend under low-load conditions, in which the ECU executes only two injection pulses, without the first pilot injection (P1), the modification of which was described in a separate publication [36]. Multiple injection strategies are themselves a recognised means of shaping the combustion process. Pilot–pilot–main and pilot–main–after strategies in a passenger car common rail engine were assessed through the heat release and related to the emissions, the combustion noise and the fuel consumption [37]; in an optically accessible common rail engine the pilot injection was shown to shorten the ignition delay of the main dose and thereby to control the premixed part of combustion [38] and the quantity and timing of the pilot injection were shown to govern the high-frequency component of the combustion noise, which follows directly from the rate of pressure rise [39]. The effect of shifting the injection timing of the pilot and main injections (P2 and G) on the time course of the combustion process, including the SOC and the crank angle of maximum pressure, as well as on the combustion dynamics expressed by the rate of pressure rise, has not yet been sufficiently investigated. This constitutes a research gap, the filling of which may make it possible to assess the extent to which changes in the injection timings (P2 and G) can be used to shape the combustion process of a fuel with physicochemical properties different from those of Df.
Two of the authors’ earlier studies concern the same vehicle and the same blend and therefore require delimitation. The first [21] compares diesel fuel, neat rapeseed oil, and the blend at the production calibration and reports the ignition delay, determined from the start of injection relative to the main injection and the start of combustion, defined as approximately 5% of the fuel mass burned. The second [23] concerns a vehicle speed of 90 km/h and a correction of the pilot injection. The present work differs from both in the operating point, in the injection phases that are modified, and in the fact that the control maps themselves are altered rather than only the fuel being changed; the quantities characterizing the injection are also referred to a different point of the injection sequence, which is stated explicitly in Section 2.5.
The analysis was carried out at an operating point corresponding to a vehicle speed of 50 km/h, with the engine speed, torque, load, and drivetrain gear ratio specified in the methodology section. The selection of this point is justified by the following premises: (1) 50 km/h is the statutory speed limit in built-up areas in many countries; (2) this speed falls within the speed range of the Low and Medium phases of the WLTC cycle, which reproduce driving conditions of low and medium vehicle dynamics, as specified in the WLTP procedure [40]; (3) the urban section is also distinguished as a mandatory part of real driving emissions (RDE) tests. The selected point, therefore, enables analysis of the combustion process under conditions corresponding to vehicle operation in urban traffic, as assessed both in standardized type-approval tests and under real driving conditions.
The novelty of the present work consists of four elements. First, the indicating measurements were carried out on a complete vehicle with its production engine control unit, operated on a chassis dynamometer in road-load simulation mode, and not on an engine dynamometer with a fixed calibration; the injection timing was changed by modifying the original maps of the control unit, so that the engine operated under its own closed-loop control throughout the measurements. Second, the analysis concerns a low-load operating point at which the production calibration executes two injection pulses only, the second pilot injection and the main injection, and the modification applied in this study consisted in shifting the start of injection of this sequence; this case has not previously been described for fuels based on vegetable oils. Third, the work documents the coupling of the injection timing maps in the production control unit, which prevents the main injection from being shifted independently of the second pilot injection, and examines the consequences of shifting the entire sequence. Fourth, the results indicate the setting at which the combustion course of the blend cannot be distinguished from that of diesel fuel, which constitutes a directly applicable calibration guideline rather than a general trend.
The aim of this study is to determine the effect of a coupled change in the injection timings of the second pilot injection (P2) and the main injection (G) on the course of the injection and combustion process of the OR90Hex10 blend at a vehicle speed of 50 km/h. The scope of the research included an assessment of high-frequency parameters. It was hypothesized that a coupled shift in the SOI of injections P2 and G primarily affects the characteristic points of the combustion process. The analysis of fuel consumption and of the emissions of exhaust components measured downstream of the exhaust aftertreatment system is beyond the scope of this study and will be the subject of separate research.
2. Materials and Methods
2.1. Research Object and Test Stand
The research object was a 1.3 Multijet compression-ignition engine with a common-rail injection system, installed in a Fiat Qubo passenger car with a five-speed manual gearbox. The vehicle met the Euro 5 exhaust emission standard and was equipped with an EGR system and a DPF. The engine was equipped with a technically sound Bosch fuel system, which was confirmed before the tests began. The vehicle’s factory fuel supply system was supplemented with a separate fuel circuit comprising an additional fuel tank and fuel pump, enabling efficient switching between test fuels. The basic technical data of the engine are summarized in Table 1.
Table 1.
Technical data of the 1.3 Multijet engine of the Fiat Qubo test vehicle.
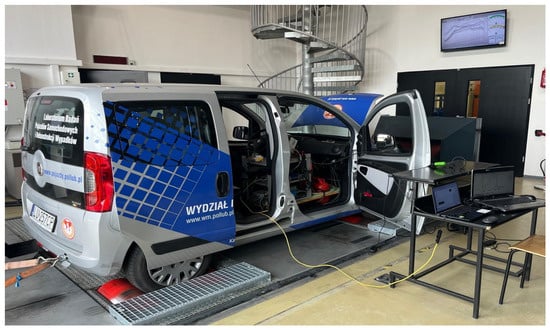
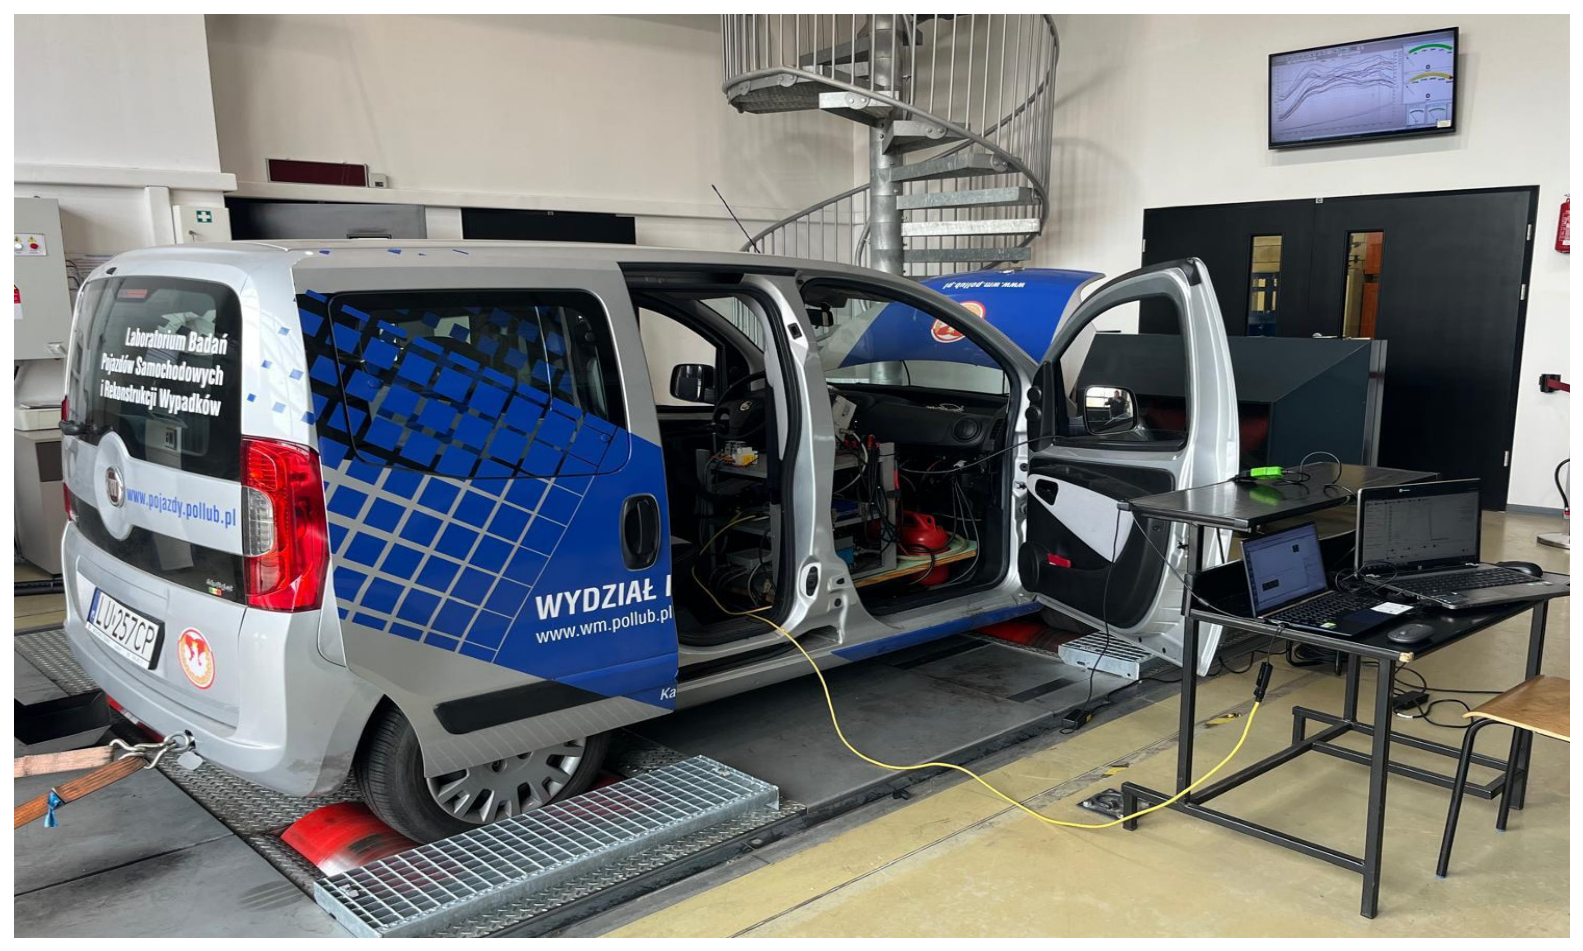
The vehicle was tested on a DF4FS-HLS chassis dynamometer (Dimsport S.r.l., Serralunga di Crea, Italy) controlled by Dyno Race software (version 3.1.2.14, Dimsport S.r.l., Serralunga di Crea, Italy) (Figure 1). The dynamometer operated in road-load simulation mode, in which the roller load reproduced the vehicle’s road resistance. This made it possible to maintain a repeatable engine operating point corresponding to driving at a constant speed. The manufacturer specifies the dynamometer’s power and torque measurement accuracy as ±2%. The test stand was supplemented with an additional fuel supply system: a separate fuel tank, pump and filter, as well as a PMZP-1A flowmeter (Rotametr, Gliwice, Poland) with a MultiCon CMC-99 recorder (SIMEX Sp. z o.o., Gdańsk, Poland). This system enabled rapid switching of the tested fuel without interfering with the vehicle’s factory fuel supply system. The current operating parameters of the engine control unit, such as fuel dose, rail pressure, and accelerator pedal position, were recorded via the OBD diagnostic connector using the Multiecuscan interface (software version 5.3). The detailed design of the test stand was described in [41].
Figure 1.
View of the test vehicle Fiat Qubo 1.3 Multijet.
The vehicle was equipped with an AVL IndiMicro 602 engine indication system with a built-in signal amplifier, supporting four analogue input channels and two digital inputs, which enabled high-frequency parameters to be recorded in real time. The following signals were recorded using the AVL IndiMicro system [42]:
- In-cylinder pressure trace: recorded using an AVL GH13P piezoelectric sensor mounted in the glow plug bore of the first cylinder, the signal of which was processed in the amplifier (AVL measurement module). The specification of this sensor is given in Appendix A.
- Crankshaft position signal: information on the crankshaft position was obtained from an inductive sensor interacting with a flywheel fitted with a ring gear, via an AVL Universal Pulse Conditioner 389Z01 analog-to-digital converter. The AVL 389/303 Inductive Encoder configuration with a 60-2 trigger wheel was used, for which an angular resolution of 0.1 °CA was obtained owing to internal signal interpolation. The measurement signals were acquired synchronously with the crankshaft angle, rather than at a constant time frequency, in accordance with the architecture of the AVL IndiMicro system;
- Injection parameters: these were analyzed on the basis of the analogue control signal of the solenoid injector, after its conversion into a digital signal. The actual injector opening moment recorded in this way differs from the value programmed in the ECU map; this difference results from the electromagnetic and hydraulic delays in injector operation. For this reason, the measured value (e.g., the angle αSOI), rather than the setting programmed in the ECU, was used consistently throughout the remainder of this study.
2.2. Fuels
Diesel fuel (Df) compliant with the EN 590 standard, containing up to 7% (v/v) FAME, was used as the reference fuel [43]. The test fuel was a blend of 90% (v/v) rapeseed oil and 10% (v/v) n-hexane, hereinafter referred to as OR90Hex10. The base of the blend was a commercially available refined rapeseed oil “Kujawski” (Oil Processing Plant “Kruszwica” S.A., Kruszwica, Poland). Its properties are determined by unsaturated fatty acids, mainly oleic, linoleic, and linolenic acids, which together account for more than 90% of its composition [16,44]. n-Hexane (C6H14), supplied by Avantor Performance Materials Poland S.A. (Gliwice, Poland), was used as the solvent. The 10% n-hexane content was adopted based on previous studies conducted on the same vehicle. Adding 5% did not eliminate the difficulty of restarting the engine after it had warmed up to operating temperature, whereas adding 10% permanently eliminated this problem. Of the blends containing 10% and 15% n-hexane, the one with the lower volatile content yielded the most favorable engine performance indicators and was therefore selected [10,36,45]. n-Hexane mixes well with rapeseed oil. The blends remained homogeneous, did not become cloudy, and did not separate down to an ambient temperature of −20 °C [30,45]. The properties of the tested fuels are summarized in Table 2. The addition of n-hexane clearly brings the viscosity and surface tension of rapeseed oil closer to the values for Df. Nevertheless, the kinematic viscosity of OR90Hex10 remains approximately seven times higher than that of Df, and the density of the blend is approximately 7% higher [10,46]. Both parameters affect fuel flow in the injection system, spray break-up, and droplet evaporation. At the same time, the cetane number of the blend is similar to that of rapeseed oil and is therefore clearly lower than that of Df [30]. Both differences justify checking whether the nominal injection timing settings selected for Df are appropriate for OR90Hex10. The addition of n-hexane also lowers the cold filter plugging point (CFPP) from 12 °C for neat rapeseed oil to −3 °C for the blend [30,45]. This is not significant for the combustion process itself, but it determines the range of ambient temperatures over which the blend can be used without preheating.
Table 2.
Selected physicochemical properties of the tested fuels and blend components [43,45]. 1 Values calculated from the mass fractions of the components of the blend (92.6% rapeseed oil, 7.4% n-hexane) and from their elemental composition; the lower heating value of n-hexane was determined from its standard enthalpy of combustion. The values for Df are typical values for a fuel complying with EN 590. 2 n-Hexane boiling point according to the supplier’s specification.
2.3. Injection Control Modification: Coupled Correction of Injections (P2 + G)
The maps controlling the injection process were identified using WinOLS 4.51. Reading, modification, and writing of the ECU memory were performed using a FLEX device (Magic Motorsport). The preparatory work was carried out on a second ECU powered by a Fronius Acctiva Professional Flash 70A stabilized power supply [36,41]. The SOI timings for the individual injection phases are stored in the maps as functions of the injected fuel quantity [mm3/cycle] and crankshaft speed [rpm].
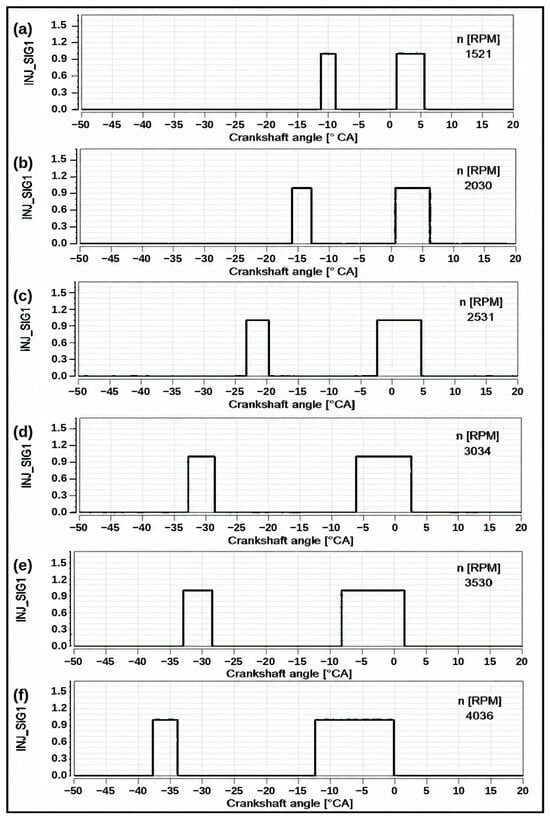
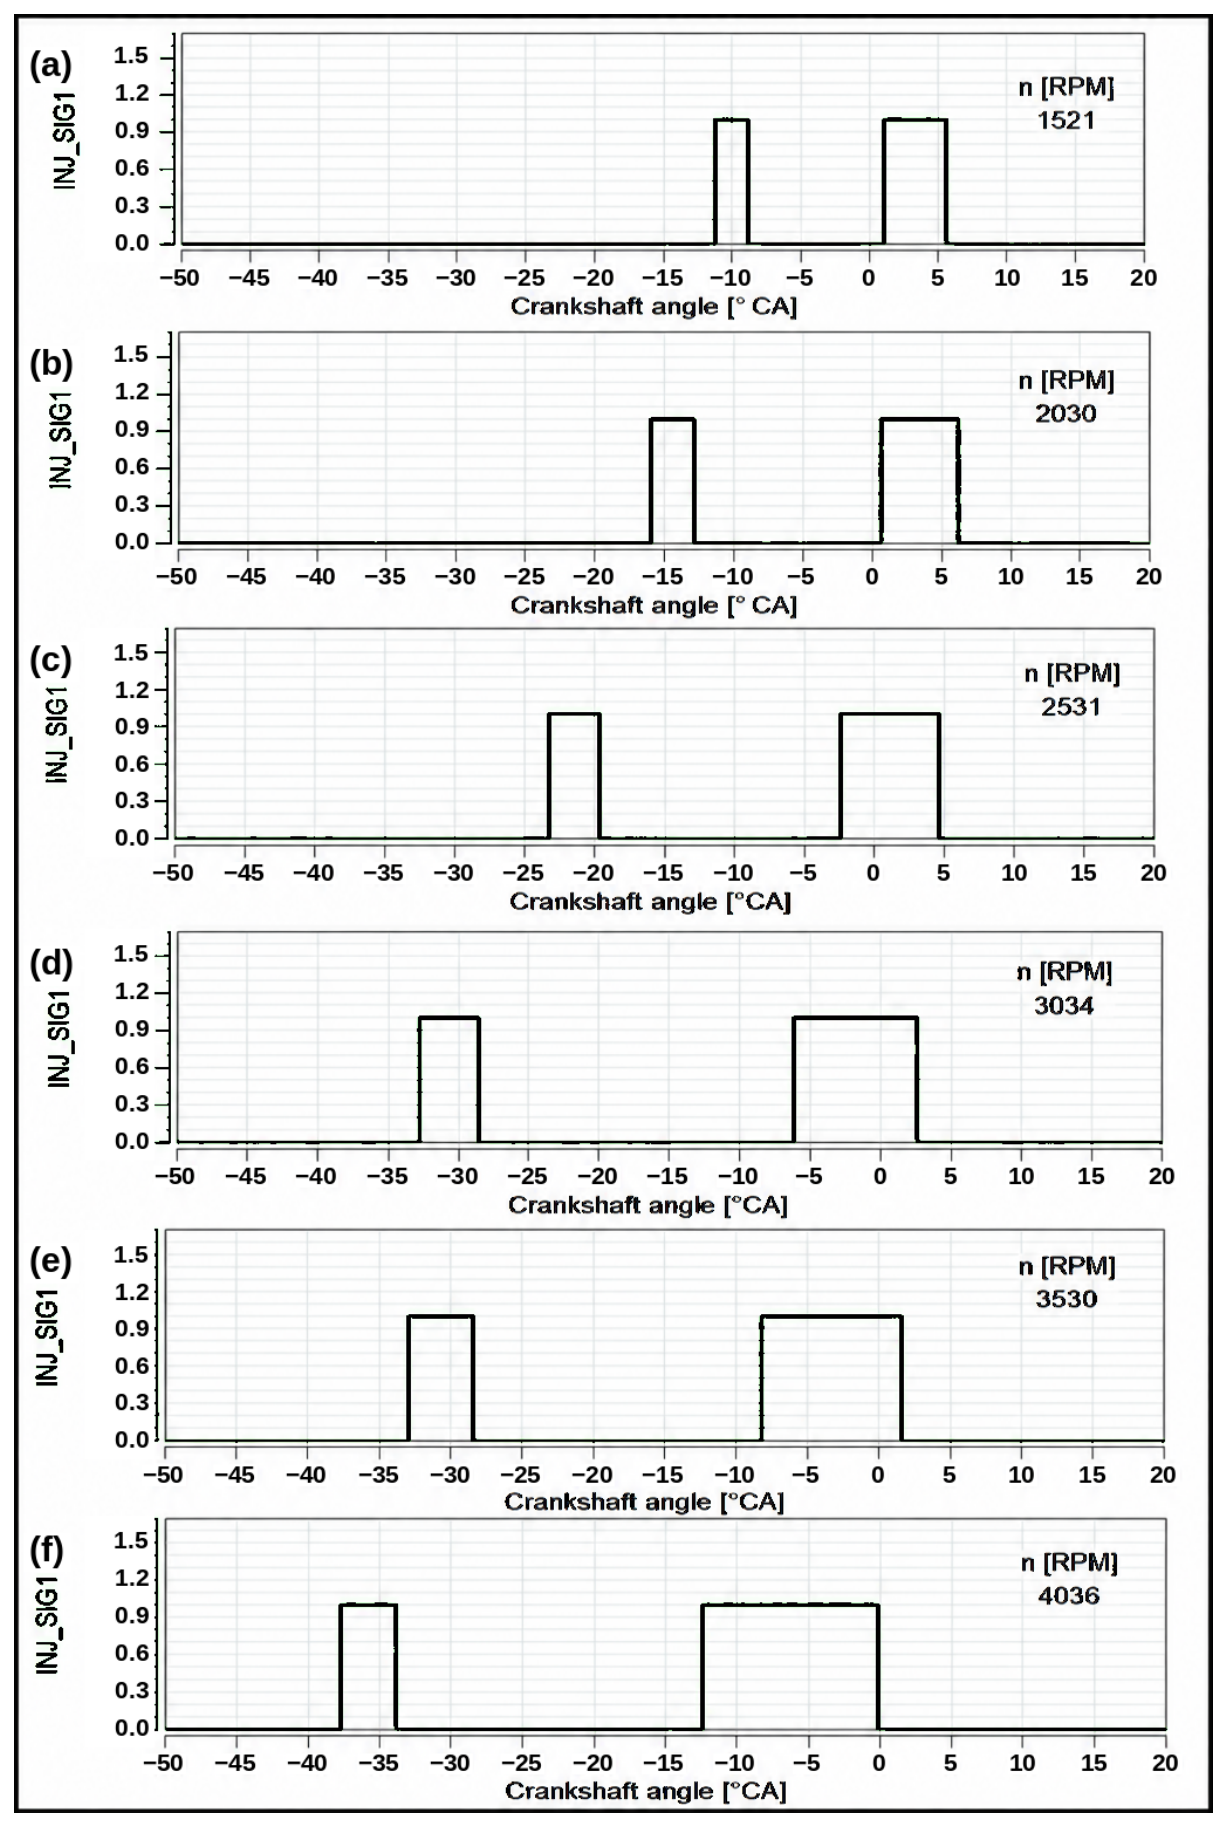
Since the first pilot injection does not occur under driving conditions without additional load, the SOI map for P2 was modified (Figure 2).
Figure 2.
Injector control signal of cylinder 1 (INJ_SIG1) as a function of crankshaft angle with the nominal ECU software and Df fuelling, at six engine speeds: (a) 1521 rpm, (b) 2030 rpm, (c) 2531 rpm, (d) 3034 rpm, (e) 3530 rpm and (f) 4036 rpm. The engine load resulted solely from the road resistance reproduced on the chassis dynamometer.
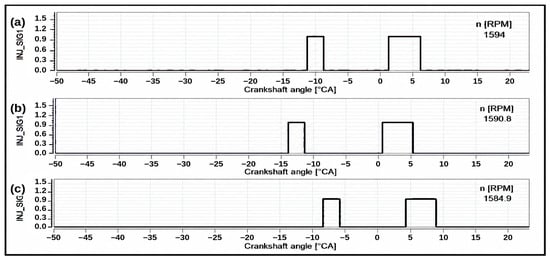
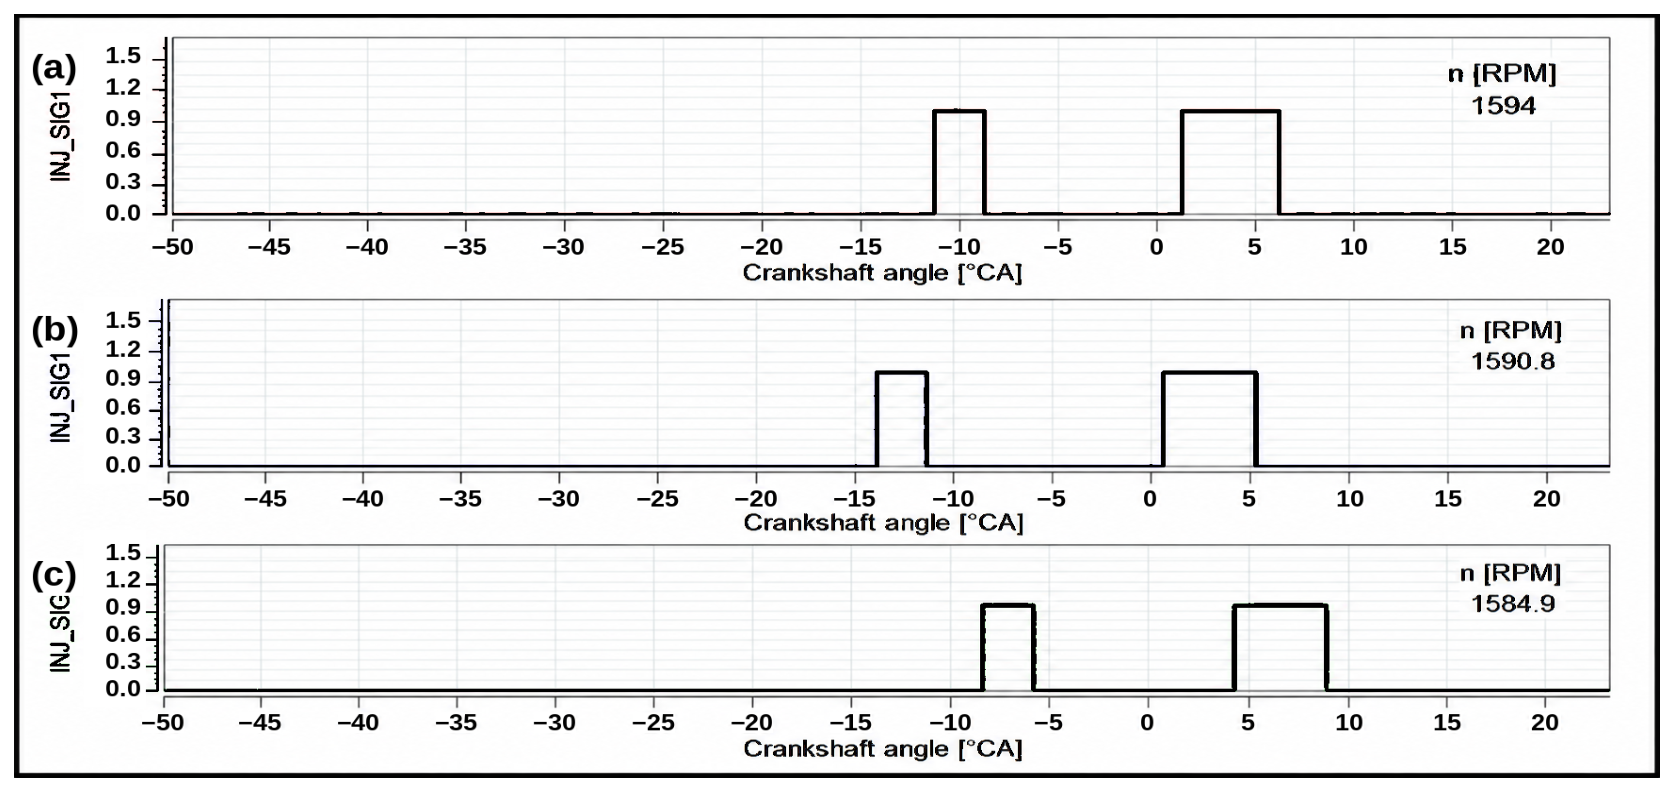
Tests showed that correcting this map shifted both injections P2 and G. Consequently, a change in the SOI map of P2 resulted in a coordinated phase shift in the entire injection sequence (P2 + G), while the durations of both pulses and the angular interval between them were preserved (Figure 3).
Figure 3.
Injector control signal of cylinder 1 (INJ_SIG1) recorded with Df fuelling during driving at 50 km/h (road-load resistance): (a) nominal software 8F3.QA32n (ORI), 1594 rpm; (b) P2 + G timing correction of −3 °CA, 1591 rpm; (c) P2 + G timing correction of +3 °CA, 1585 rpm.
The result of this verification, carried out with Df for corrections of ±3 °CA, is described in Section 2.4 and shown in Figure 3. The ECU, therefore, did not allow the main injection timing to be changed independently. The investigated modification consisted of a simultaneous shift in injections P2 and G by the same crank angle. This limitation was taken into account when interpreting the results. The verification was performed with Df for ±3 °CA corrections. The actual shift in the injection pulses for all variants fuelled with OR90Hex10 was determined from the measured SOI angle αpw. The angles determined in this way referred to the electrical control signal. They were shifted relative to the moment of actual nozzle opening due to the injector’s electromagnetic and hydraulic delays.
2.4. Test Procedure
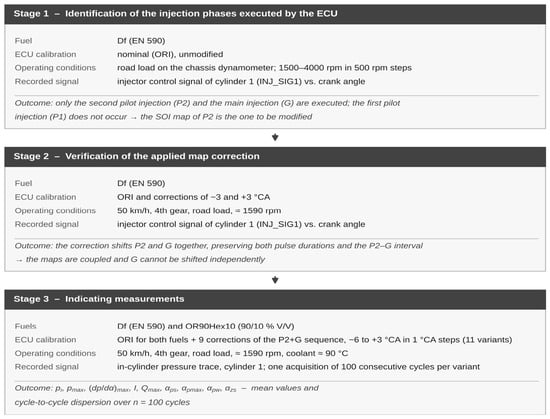
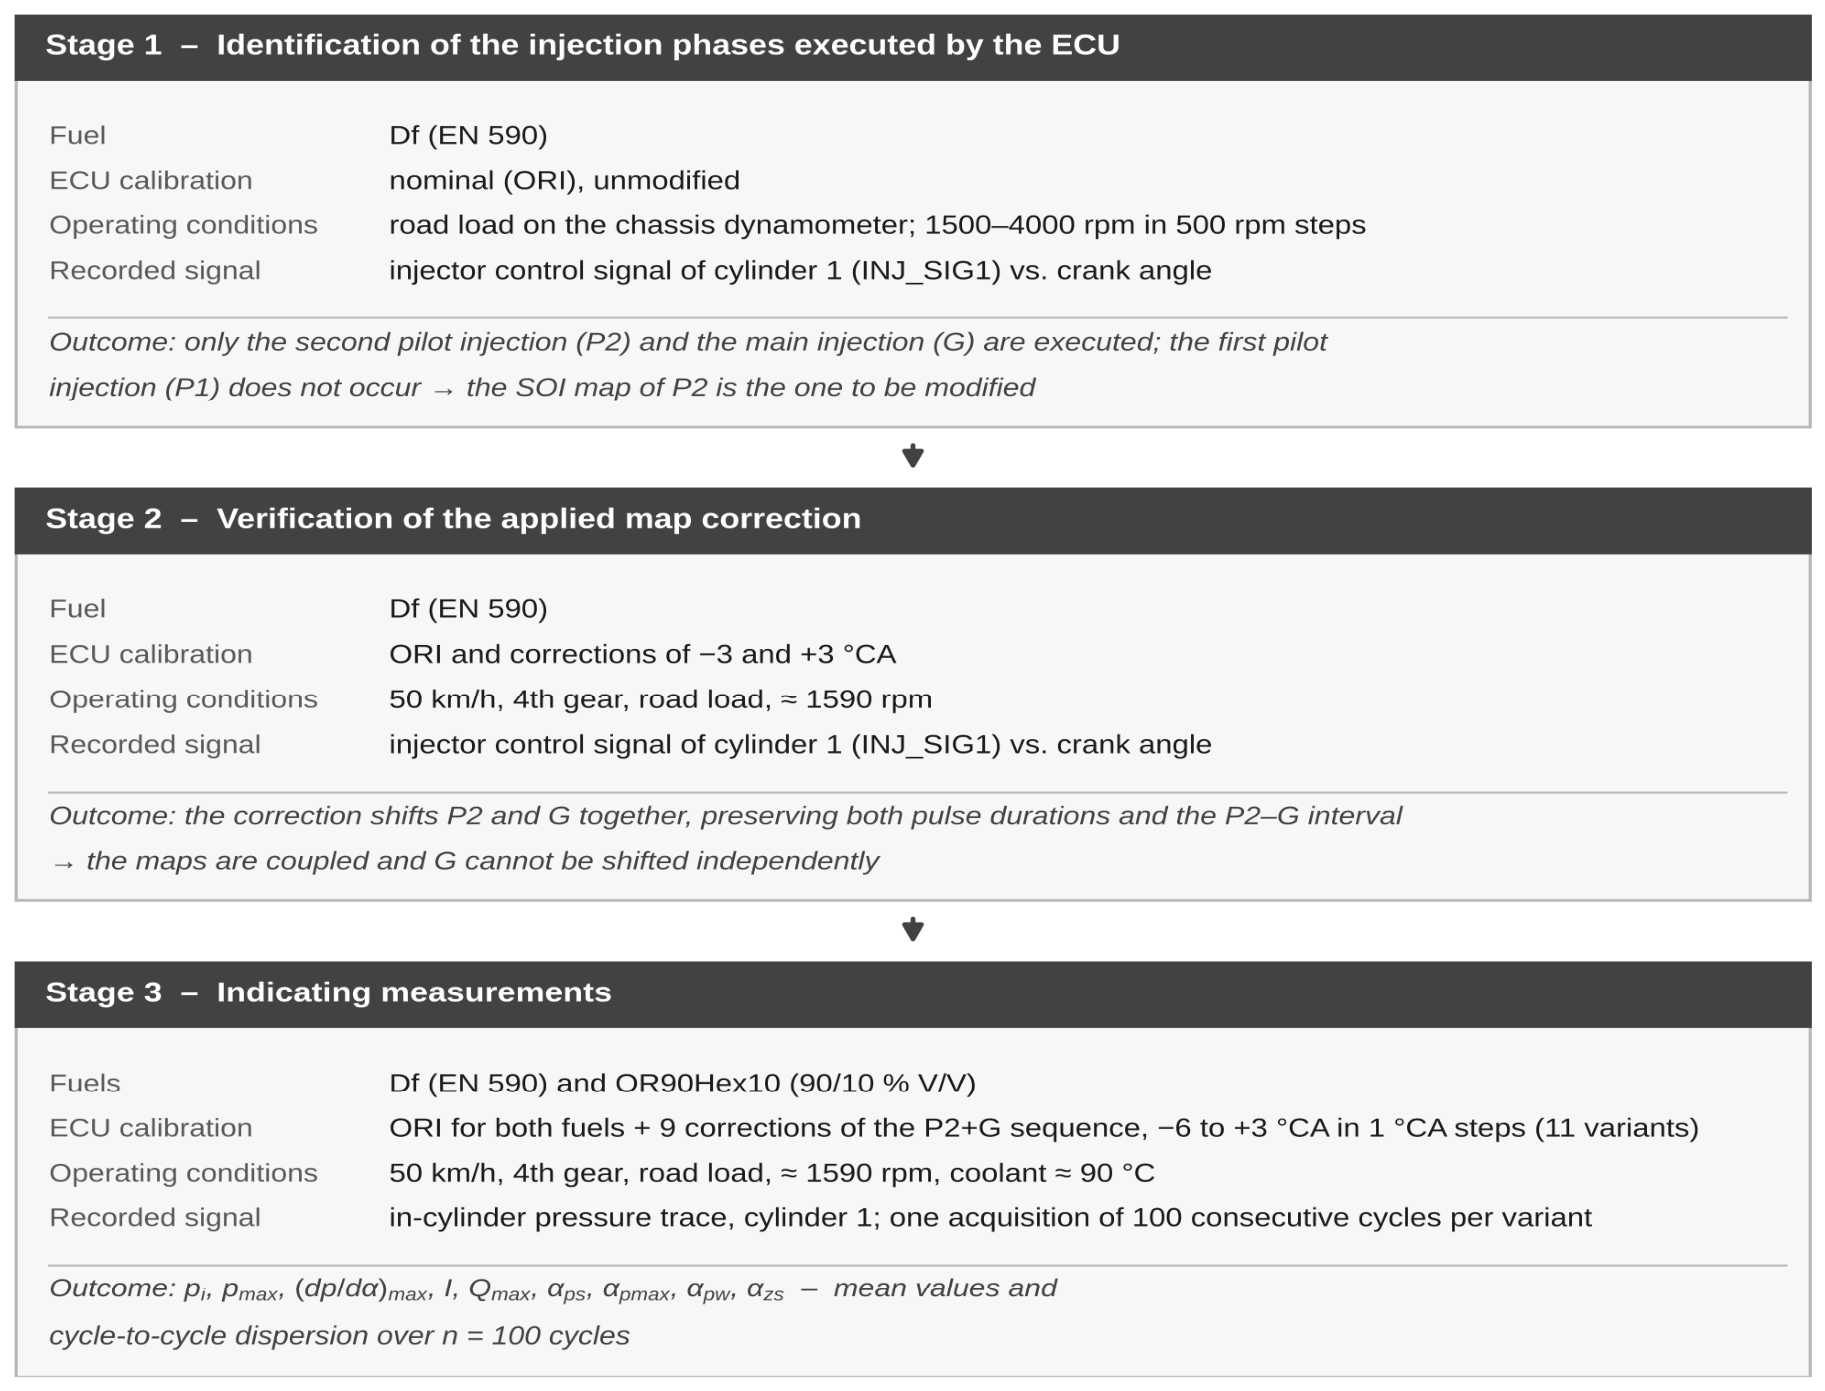
The tests (Figure 4) were carried out in three stages.
Figure 4.
Flowchart of the test program: fuel, ECU calibration, operating conditions, and recorded signal for each stage.
In the first stage of the tests, it was determined which injection phases the ECU executed under conditions corresponding to the subsequent indicated measurements. The measurements were performed with Df fuelling and the nominal ECU software 8F3.QA32n (ORI). The dynamometer was set to road-load simulation mode, in which the engine was loaded solely by the road resistance. The engine speed was varied from approximately 1500 to 4000 rpm in 500 rpm steps, and at each point, the control signal of the cylinder 1 injector was recorded as a function of crankshaft angle. Over the entire investigated range, the ECU executed two pulses: the second pilot injection (P2) and the main injection (G). The first pilot injection (P1) did not occur at any of the investigated points. In previous studies, P1 appeared only after an additional braking torque of 40–60 N·m was applied [36]. As the engine speed increased, the ECU shifted both phases towards earlier angles. The SOI of P2 varied from approximately −11 °CA at 1521 rpm to approximately −38 °CA at 4036 rpm, and the SOI of G varied from approximately +1 °CA to approximately −12 °CA. At the same time, the angular width of the G pulse increased from approximately 4.5 °CA to approximately 12 °CA. In the upper engine speed range, the main injection G ended before TDC. The result of this stage determined which map to modify. When driving without an additional load, the combustion process could be shaped only by varying the injection timing of P2 and G.
In the second stage of the tests, it was verified whether the ECU actually executed the correction of the pilot injection (P2) map. The measurements were performed with Df fueling at a vehicle speed of 50 km/h for the nominal ECU settings and for injector control corrections of −3 and +3 °CA (Figure 3). At the nominal setting, the pilot injection P2 was executed in the range from approximately −11.5 to −9 °CA, and the main injection G from approximately +2 to +6.5 °CA. After a correction of −3 °CA, the injection pulses shifted to ranges from approximately −14 to −12 °CA (P2) and from approximately −1.5 to +3 °CA (G), respectively. After a correction of +3 °CA, they ranged from approximately −8.5 to −6 °CA (P2) and from approximately +4.5 to +9 °CA (G). In all variants, the interval between the end of the pilot injection P2 and the start of the main injection G was approximately 11 °CA. The engine speed remained constant (1585–1594 rpm). This confirmed the coupled nature of the map and a shift in the injection pulses consistent with the applied correction.
In the third stage of the tests, the actual engine-indicating measurements were carried out. Driving at a constant speed of 50 km/h, with the load resulting solely from road resistance, was selected as the engine operating point. This is the speed limit in built-up areas in most developed countries. Driving in this speed range also constitutes an important part of the WLTP type-approval procedure [40]. The Low and Medium phases of the class 3b WLTC cycle, which represent urban and suburban traffic, have maximum speeds of 56.5 and 76.6 km/h, respectively, last a total of 1022 s (approximately 57% of the cycle time), and cover approximately 34% of the cycle distance. The vehicle was driven in fourth gear at an engine speed of approximately 1590 rpm. The measurements were started after the thermal conditions had stabilized, at a coolant temperature of approximately 90 °C. The program comprised 11 variants. The two reference variants were Df and OR90Hex10 with the nominal ECU software (Df ORI, OR90Hex10 ORI). In the remaining nine variants, the engine was fueled with OR90Hex10, and the SOI of the pilot and main injections (P2 + G) was changed relative to the nominal settings of the control software from −6 °CA (advance) to +3 °CA (retard) in 1 °CA steps. After each fuel change or ECU software update, the engine was run until the operating conditions stabilized. Subsequently, 100 consecutive engine cycles were recorded. The traces were then processed as described in Section 2.5.
The engine operating point was defined by the vehicle’s operating conditions: a constant road speed of 50 km/h, fourth gear, and the road-load curve reproduced by the dynamometer, which were identical across all variants examined. Under these conditions, the crankshaft speed remained within the range 1585–1594 rpm; that is, it varied by less than 0.6%, and the external load of the powertrain, resulting from the road resistance at this speed, did not change. The quantity of fuel injected was not imposed by the test program; it resulted from the operation of the production control unit, which maintained the demanded vehicle speed in a closed loop. The torque at the wheels was not recorded simultaneously with the indicating measurements because the dynamometer operated in road-load simulation mode rather than torque measurement mode.
The variants were recorded in the following order: Df with the nominal calibration, OR90Hex10 with the nominal calibration, then the OR90Hex10 variants with advanced injection, from −1 to −6 °CA, and finally the variants with retarded injection, from +1 to +3 °CA. Each variant was recorded once, as a single acquisition of 100 consecutive engine cycles, taken after the engine’s thermal state had stabilized; the reference variants were not repeated at the end of the program.
2.5. Data Processing
The recorded traces were processed in AVL IndiCom software V2.7 using the control algorithms implemented therein. The polytropic exponent and other calculation parameters were adopted in accordance with the manufacturer’s documentation and the configuration of the measurement project. Crankshaft angles are given relative to the top dead center of the piston (TDC) in the compression stroke (α = 0 °CA). Negative values denote positions before TDC, and positive values denote positions after TDC. The indicated mean effective pressure (pi) was determined as the cycle work divided by the cylinder displacement volume (Equation (A1)). The maximum combustion pressure (pmax) and the angle of its occurrence (αpmax) were determined from the pressure trace as a function of crankshaft angle (Equations (A2) and (A3)). The heat release rate (Qj) was calculated from the first law of thermodynamics using a simplified single-zone model, neglecting wall heat transfer and blow-by losses (Equation (A4)).
The maximum value of the dQ/dα trace in the cycle was denoted (Qmax). The amount of heat released in the cycle, calculated by integrating dQ/dα over the cycle, was denoted by I and is referred to as the integrated heat release. Both this quantity and the maximum heat release rate, like the indicated mean effective pressure, were normalized to the cylinder displacement volume and are therefore given in kJ/m3 and kJ/(m3·°CA). In the AVL IndiCom software, the corresponding channel is designated “burned fuel dose”; this designation is derived from the software’s nomenclature and does not denote the quantity of fuel injected into the cylinder, which was not measured in this study.
The SOC angle (αps) was determined using the method employed in AVL IndiCom for compression-ignition engines. It is the angle at which the dQ/dα trace, after the initial negative deflection caused by the evaporation of the injected fuel, first returns to zero, counting backward from the maximum of this trace. The SOI angle (αpw) was determined from the electrical control signal of the injector as the start of the pilot injection P2 pulse. The ignition delay angle (αzs) was calculated as the difference between these two angles (Equation (A5)).
With the adopted sign convention, (αzs) takes negative values, and its absolute value corresponds to the length of the period between the SOI and the SOC, expressed in °CA. Since (αpw) refers to the control signal, the determined delay also includes the electromagnetic and hydraulic delay of the injector.
Each parameter was determined for 100 consecutive engine cycles. The mean value was adopted as the result, and the cycle-to-cycle dispersion was described by the standard deviation Std and the coefficient of variation (Equation (A6)).
CoV was not given for the SOC angle (αps) and the ignition delay (αzs). In some variants, the mean value of the SOC angle (αps) was close to zero or changed sign, and the delay was calculated from the angle value, so the coefficient of variation would not be meaningful. For these parameters, Std was used as the measure of dispersion. No dispersion statistics were given for the heat release rate (Qmax) because the statistics of the dQ/dα channel in AVL IndiCom covered all samples of the cycle, not only the peak value.
For each parameter and each variant, the 95% confidence interval for the mean was determined as ± 1.96·Std/√n, with n = 100 cycles, and is given in Table 3; in Figure 5 and Figure 6, it is shown as error bars. The half-width of this interval was 0.002–0.008 MPa for the indicated mean effective pressure, 0.008–0.116 MPa for the maximum combustion pressure, 0.007–0.014 MPa/°CA for the maximum rate of pressure rise, and 0.03–0.61 °CA for the characteristic angles. The significance of the differences between the variants was assessed using Welch’s t-test for two means with unequal variances, at the 0.05 significance level (Table 4). Confidence intervals and significance tests were not determined for the integrated heat release and the maximum heat release rate because the statistics for these channels in AVL IndiCom cover all samples of the cycle, nor for the ignition delay, which was calculated from mean values according to Equation (A5).
Table 3.
Descriptive statistics of the engine indicating parameters (mean value, standard deviation Std, coefficient of variation CoV and half-width of the 95% confidence interval of the mean) determined from 100 consecutive engine cycles for each fuelling and control variant at a speed of 50 km/h. The calculations were performed in AVL IndiCom software.
Figure 5.
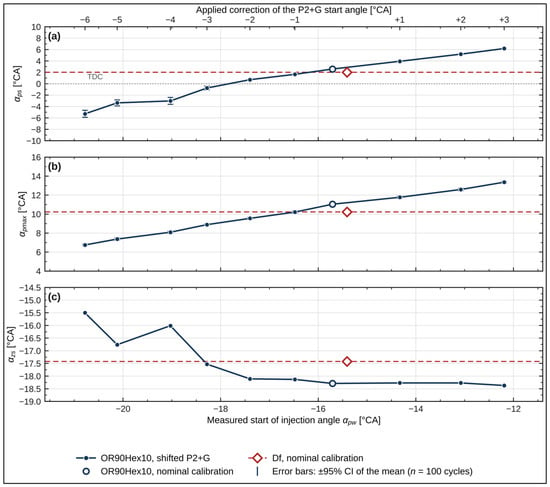
Characteristic angles of the combustion process as functions of the measured start of injection angle αpw: (a) start of combustion angle αps; (b) angle of maximum combustion pressure αpmax; (c) ignition delay angle αzs. Upper axis—the applied correction of the start angle of the P2 + G sequence. Driving on the chassis dynamometer at 50 km/h; mean values of 100 engine cycles; error bars—half-width of the 95% confidence interval of the mean (Table 3). No dispersion was determined for αzs, which is a derived quantity, so panel (c) contains no error bars.
Figure 6.
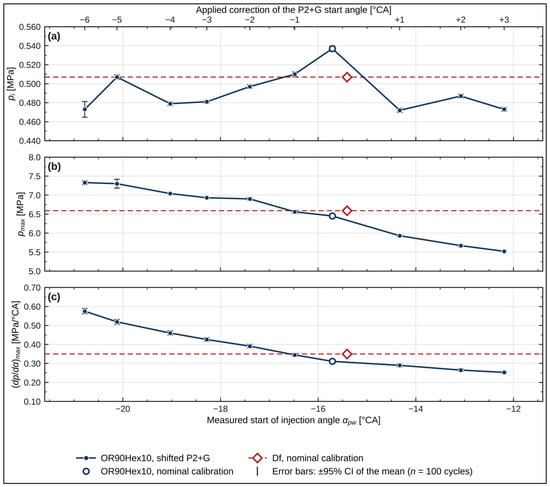
Pressure parameters as functions of the measured start-of-injection angle αpw: (a) indicated mean effective pressure pi; (b) maximum combustion pressure pmax; (c) maximum rate of pressure rise (dp/dα)max. Upper axis, test conditions, mean values and error bars as in Figure 5.
Table 4.
Differences between selected test variants and their statistical significance (Welch’s t-test for two means with unequal variances, n = 100 cycles per variant, 0.05 significance level).
Each variant was recorded in a single acquisition of 100 consecutive engine cycles after the engine’s thermal conditions had stabilized, and all variants were measured in a single test session. The dispersion measures and the confidence intervals given in this study therefore describe the cycle-to-cycle variability within a single acquisition and do not include the between-run repeatability of the test. Because the variants were recorded in a single sequence and the reference variants were not repeated, a slow drift of the operating conditions during the session cannot be formally separated from the effect of the applied correction. Two observations limit the practical significance of this. First, the measured start-of-injection angle reproduced the applied correction over the whole sequence, with a deviation of 0.23–0.93 °CA and the lowest cycle-to-cycle dispersion among all parameters, indicating stable operation of the injection system throughout the program. Second, the variant with a correction of −1 °CA, recorded after both reference variants, reproduced the Df values, with differences that are not statistically significant. Differences in the order of the confidence interval should accordingly be treated as indicative rather than as established.
Mean values are reported with a precision consistent with the measured dispersion: characteristic angles to one decimal place, the integrated heat release and the maximum heat release rate as integers, and the indicated mean effective pressure to three decimal places, because its standard deviation (0.008–0.014 MPa) and the half-width of the confidence interval of its mean (0.002–0.003 MPa) fall within the third decimal place.
The uncertainty of the pressure measurement resulted primarily from the non-linearity of the GH13P sensor (≤±0.3% of full scale) and from the thermal shock error. According to the manufacturer of the AVL system, this error corresponded to no more than ±1.5% for the indicated mean effective pressure (pi) and ±1% for the maximum combustion pressure (pmax) [42]. These values were smaller than the cycle-to-cycle dispersion of the parameters summarized in Table 3.
3. Results and Discussion
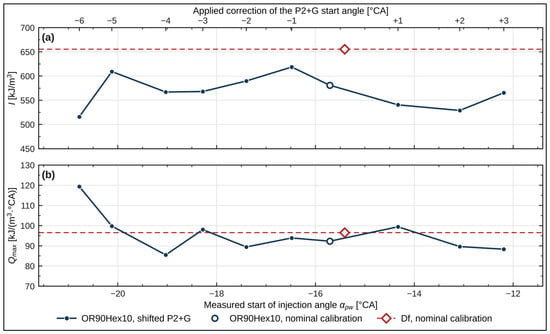
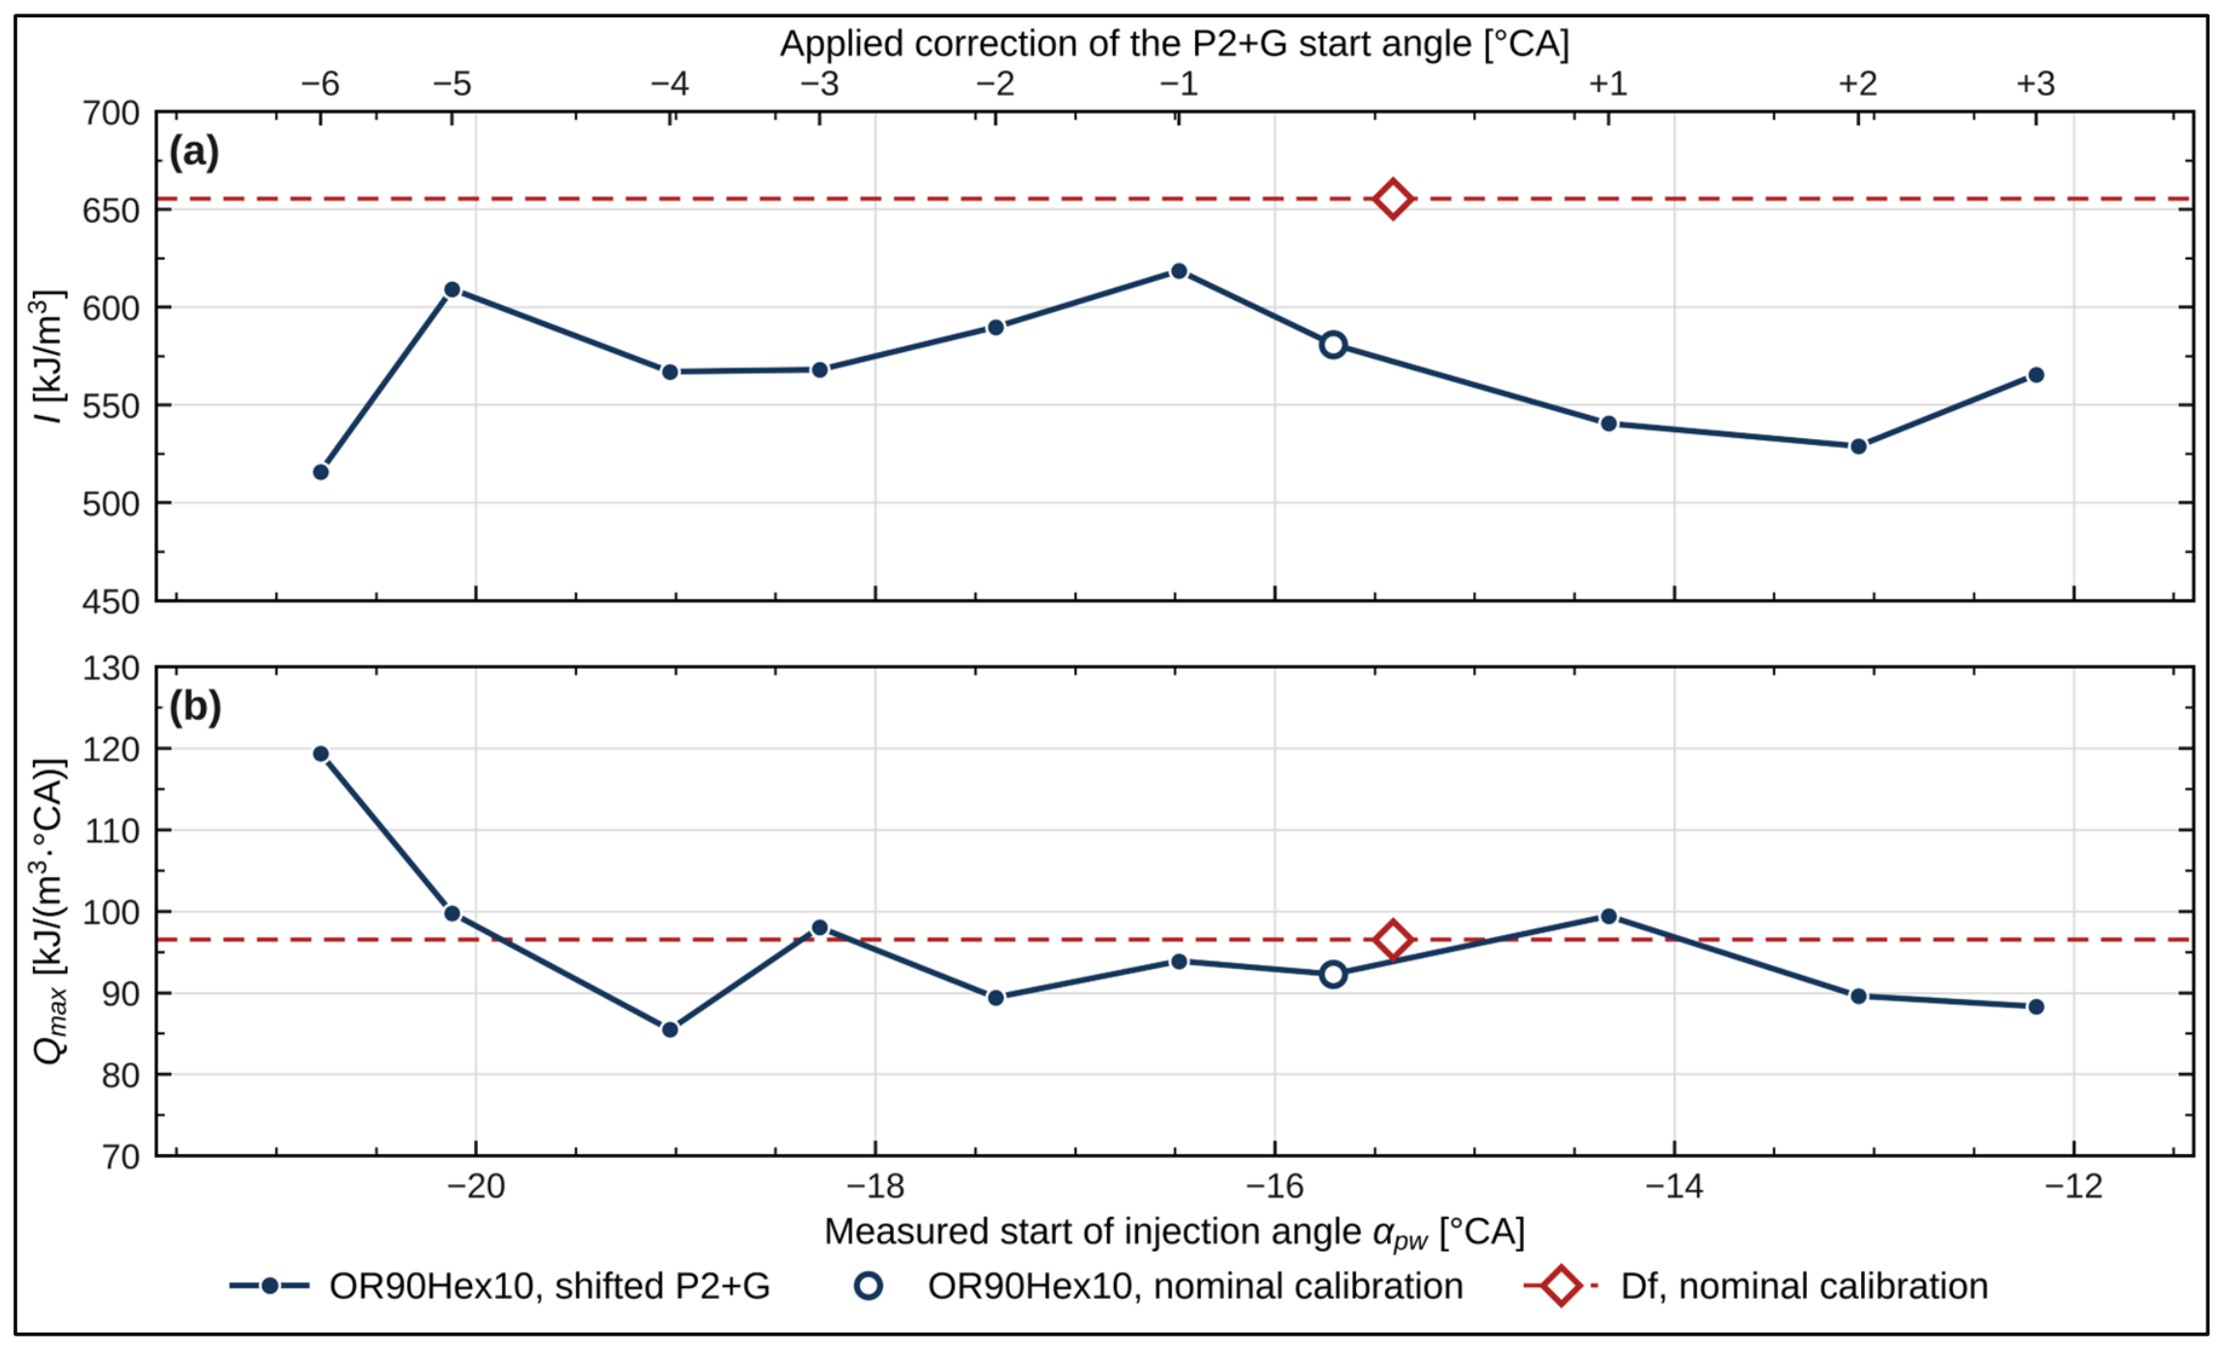
At the operating point analysed, the control unit executed two injection phases—the second pilot injection (P2) and the main injection (G)—and the independent variable was the common start angle of this sequence. The correction applied to the map was realised by the injection system over the whole range: a setting range of 9 °CA corresponds to a measured αpw interval of 8.6 °CA, the deviation of the realised shift from the applied one remaining within 0.23–0.93 °CA. In Figure 5, Figure 6 and Figure 7, all the parameters are referred to the measured αpw, and the upper axis of each figure gives the corresponding setting of the correction. The nominal calibration of the blend is marked by an open symbol, the reference fuel Df—plotted at its own measured αpw—by a diamond and a dashed line, and the error bars denote the half-width of the 95% confidence interval of the mean (Table 3). The increments quoted below, referred to as a shift in the injection by 1 °CA, were obtained as the slopes of straight lines fitted by least squares to the ten blend variants; the coefficient of determination R2 is given in parentheses.
Figure 7.
Heat release parameters as functions of the measured start of injection angle αpw: (a) integrated heat release I; (b) maximum heat release rate Qmax. Upper axis and test conditions as in Figure 5 and Figure 6. No error bars are given: the dispersion reported for I in Table 3 covers all the samples of the cycle rather than the cycle-to-cycle dispersion of the final value, and for the Qmax channel the statistics were not available.
Figure 5 presents the phasing of the combustion process. The dependence of the start of combustion angle on the start of injection angle (Figure 5a) is monotonic: a shift in the injection by 1 °CA corresponds to a shift in the start of combustion by 1.30 °CA (R2 = 0.977), and the start of combustion crosses TDC in the central part of the range. The angle of maximum pressure (Figure 5b) moves in the same direction but more slowly, by 0.76 °CA per 1 °CA of injection shift (R2 = 0.996). The difference between these two values means that the shift in the sequence is not transferred to the process at a 1:1 scale: advancing the injection advances the start of combustion more than it displaces the position of the pressure maximum. The ignition delay angle (Figure 5c), being the difference in these two quantities, cannot be described by a single linear relationship (R2 = 0.69): over the retarded half of the range it remains constant to within 0.3 °CA and shortens only in the advanced part, in the same region in which αps crosses TDC. This corresponds to the thermodynamic conditions in the cylinder at the moment of injection: when the main dose is delivered in the vicinity of TDC, the charge pressure and temperature change only slightly, whereas advancing the sequence transfers the injection into a charge of lower density and lower temperature.
Figure 6 presents the pressure quantities. The maximum combustion pressure (Figure 6b) and the maximum rate of pressure rise (Figure 6c) vary monotonically: a shift in the injection by 1 °CA towards retard corresponds to a decrease in the maximum combustion pressure of 0.223 MPa (R2 = 0.977) and to a decrease in the maximum rate of pressure rise of 0.0366 MPa/°CA (R2 = 0.943). Both relationships follow directly from the shift in the start of combustion (Figure 5a): a smaller αps locates the heat release in the phase of decreasing cylinder volume. The variants with the smallest αps also exhibit the highest pmax and the highest (dp/dα)max, and the variant whose αpw is closest to that of Df reproduces both parameters of the reference fuel. The indicated mean effective pressure (Figure 6a) shows no dependence on αpw: a linear fit yields R2 = 0.003, and the values vary without a trend, with the maximum at the nominal calibration; every correction lowers pi by 5.0–12.1%, and the confidence intervals of the neighbouring variants do not include the maximum value. The discrepancy between the monotonic relationships of pmax and (dp/dα)max and the absence of any relationship for pi constitutes the principal result of this study: the start angle of the P2 + G sequence determines the level of the pressure loading, but it is not a parameter by which the indicated mean effective pressure can be controlled.
Figure 7 presents the heat release parameters. Neither the integrated heat release (Figure 7a) nor the maximum heat release rate (Figure 7b) shows a dependence on αpw; a linear fit yields R2 of 0.02 and 0.29, respectively. The deviations from the value recorded at the nominal calibration lie between −11% and +7% for I and between −7% and +29% for Qmax, the extreme positive deviation corresponding to the largest advance of the sequence. The integrated heat release of the blend is lower than that of Df in every variant, which corresponds to a 5.4% lower heating value per unit volume (Table 2) at an identical volumetric dose.
The decrease in pi at the largest advances requires a separate comment, because it coincides with the highest values of pmax and (dp/dα)max of the whole programme. Two factors act in the same direction. At these settings, αps < 0 (Figure 5a), so that part of the heat is released while the piston is still moving towards TDC; the work of the gas is then negative and reduces the value of the integral (A1). In addition, the pressure and temperature maxima occur close to TDC, where the ratio of the combustion chamber surface area to its volume is the largest and the heat flux density to the walls is the highest; the single-zone model used to determine dQ/dα (A4) neglects heat transfer to the walls, so that this loss is not accounted for in the balance. For this reason, I should be treated as a comparative quantity rather than as an absolute measure of the energy supplied with the fuel.
Table 3 summarises the dispersion of the parameters in the series of 100 cycles, together with the half-width of the 95% confidence interval of the mean. The smallest dispersion is exhibited by the start of injection angle, which confirms the stability of the injection system over the whole range of corrections; the largest, by the start of combustion angle. The increase in the dispersion of αps is not progressive with respect to the order of the measurements: over the retarded half of the range the standard deviation remains at a constant, low level, whereas in the region in which αps crosses TDC it rises abruptly, by more than a factor of four. A drift of the operating conditions during the session would produce a gradual increase rather than a step confined to a particular part of the range. The dispersion of the indicated mean effective pressure behaves analogously.
Table 4 relates the differences between selected variants to this dispersion. The changes produced by the extreme corrections are statistically significant at the 0.05 level for pmax and (dp/dα)max, whereas neighbouring variants in the advanced part of the range do not differ significantly in pi. From the point of view of calibration, the decisive comparison is that between the variant whose αpw is closest to that of Df and Df itself: the differences in pmax, (dp/dα)max and αpmax are not statistically significant, which means that at this setting the combustion course of the blend is indistinguishable from that of the reference fuel within the measurement dispersion.
The test was performed on the mean values and standard deviations of the 100-cycle series given in Table 3. n.s.—difference not statistically significant at the 0.05 level. The analysis concerns the cycle-to-cycle dispersion within a single acquisition and does not include the between-run repeatability of the test (Section 2.5).
The ignition delay angle requires a separate comment. At the nominal calibration, it exceeds the angular interval between the start of the second pilot injection and the start of the main injection, which is approximately 13.5 °CA at this operating point. The combustion recorded as the start of the process therefore began after the main dose had been injected, and the determined value is the sum of that interval and the ignition delay of the main dose. This interpretation is consistent with the trend seen in Figure 5c: when the sequence is retarded, the main injection remains in the vicinity of TDC, where the charge pressure and temperature change only slightly and the delay stays constant, whereas advancing the sequence shortens it. An unambiguous determination of whether autoignition is initiated by the pilot or by the main dose would require crank-angle-resolved heat release traces, which were not recorded in this measurement series.
The differences between the blend and diesel fuel at the nominal calibration follow from the two properties that motivated this study. The cetane number of the blend is 6.5 units lower, and its kinematic viscosity at 40 °C is about seven times higher than that of diesel fuel (Table 2). Both act in the same direction on the ignition delay: the lower cetane number lengthens its chemical part, and the higher viscosity, which coarsens atomisation, lengthens its physical part. The measurements show this directly: although at the nominal calibration the control unit started the injection of the blend 0.3 °CA earlier than that of diesel fuel, the start of combustion occurred 0.6 °CA later, and the ignition delay was 0.9 °CA longer. The later start of combustion shifts the process towards the expansion stroke—the pressure maximum occurs 0.8 °CA later—so that the heat is released into a larger and increasing cylinder volume; the maximum combustion pressure is therefore 2.1% lower, and the maximum rate of pressure rise is 11% lower than for diesel fuel. The deficit to be compensated is thus about 0.6 °CA of the start of combustion. With a transfer of 1.30 °CA of the start of combustion per 1 °CA of injection shift, an advance of approximately 0.5 °CA is sufficient to cover it; the smallest step available in the map is 1 °CA, which slightly overshoots the deficit but brings the maximum combustion pressure, the maximum rate of pressure rise and the angle of maximum pressure to values that do not differ significantly from those of diesel fuel (Table 4). A small advance of the sequence is therefore sufficient precisely because the delay caused by the fuel properties is itself small and because the process responds to the injection shift with a gain greater than unity.
The direction of the observed changes agrees with the results reported for other fuels of plant origin. Retarding the injection timing of a canola-oil methyl ester reduced the maximum pressure and the rate of pressure rise while lowering the engine efficiency [15], and adjustments of the injection system and of the engine timing were shown to shift the emission and combustion characteristics of four biodiesel fuels in the same manner [26]. The shift in the actual start of injection caused by the higher bulk modulus of fuels of plant origin, reported for biodiesel [27] and for rapeseed oil [15], is of the same order as the 0.3 °CA difference measured here between the blend and Df at the nominal setting. The present results extend these observations to a case in which the correction is applied to the production maps of a vehicle control unit and in which the pilot and the main injection cannot be shifted independently.
A comparison with the authors’ earlier measurements on the same vehicle requires care, because the quantities are defined differently. In [16], the start of injection is referred to the main injection and the start of combustion is defined at approximately 5% of the fuel mass burned, whereas in the present work the start of injection is referred to the beginning of the second pilot injection pulse and the start of combustion follows the criterion implemented in AVL IndiCom; the ignition delay angles reported in the two studies are therefore not directly comparable, and that work does not report start of injection angles that would allow them to be recalculated on a common definition. The quantity that is directly comparable is the maximum rate of pressure rise for Df at the same operating point, for which 0.308 MPa/°CA was reported there and 0.350 MPa/°CA was obtained here. Both values come from single acquisitions made in different measurement campaigns, with different fuel batches and thermal states of the engine, and neither study determined the between-run repeatability; the difference of 0.042 MPa/°CA is of the order of the variability that was not controlled in either case. The second earlier study [18] concerns a vehicle speed of 90 km/h and a correction of the pilot injection, for which the applied shift of −6 °CA was realised as approximately −4 °CA; at the operating point examined here, the applied correction is reproduced almost proportionally, which indicates that the degree to which a map correction is executed depends on the operating point and on the injection phase being modified.
The comparison of the variants was carried out at an identical operating point of the vehicle: the same road speed, the same gear ratio, and the same road-load curve of the dynamometer, with a variation in crankshaft speed of less than 0.6%. The differences in the indicated mean effective pressure recorded between the variants should therefore not be interpreted as a comparison of different operating points of the powertrain. The indicated mean effective pressure was determined for one of the four cylinders, whereas the torque delivered by the engine is the sum of the contributions of all the cylinders, reduced by the friction losses and the gas exchange work. The distribution of the load between the cylinders is governed by the balancing functions of the control unit, and the friction losses depend, among other things, on the maximum combustion pressure, which varied by 33% in the present study. A constant external load of the powertrain therefore does not imply an identical indicated mean effective pressure of the indicated cylinder. Part of the differences between the variants also lies within the limits of the cycle-to-cycle dispersion, as shown by the significance tests in Table 4, and the lowest value of pi, recorded at a correction of −6 °CA, has the separate cause discussed above.
From the perspective of calibrating the control unit for the OR90Hex10 blend, the results indicate three possible courses of action. Retaining the nominal setting is justified when the indicated mean effective pressure is the priority, since this variant yields its highest value while the maximum pressure and the rate of pressure rise remain below those recorded for Df. A small advance brings the combustion course close to that of the reference fuel, with differences that are not statistically significant. A moderate retardation limits the mechanical load and the harshness of combustion, at the cost of a lower indicated mean effective pressure. Advancing the sequence beyond the region in which the start of combustion crosses TDC should, by contrast, be regarded as unfavourable, because it increases both the rate of pressure rise and the cycle-to-cycle dispersion.
The results were obtained for a single engine operating point, corresponding to driving at a constant speed of 50 km/h under road-load conditions, for a single volumetric blend ratio and with indication of a single cylinder. The design of the ECU maps prevented an independent change in the main injection timing; therefore, the presented relationships concern the shift in the entire P2 + G sequence. Exhaust gas composition and fuel consumption were not measured in the study, and the recorded SOI angle refers to the control signal rather than to the actual nozzle opening. The conclusions should therefore be treated as preliminary and not generalizable to other operating points, blend ratios or pollutant emissions.
The fuel consumption and the engine torque were not recorded simultaneously with the indicating measurements, and therefore neither the brake mean effective pressure nor the indicated or overall efficiency of the engine could be determined for the individual variants. The quantity of fuel injected per cycle reported by the control unit was not used for this purpose, because it is a value modelled for the density and the bulk modulus of Df and would be systematically biased for the OR90Hex10 blend. Each variant was measured once, in a single test session and without repetition of the reference variants, so the between-run repeatability of the experiment was not determined.
Further research should include the recording of crank-angle-resolved heat release traces, which will make it possible to determine the cumulative heat release and the characteristic combustion angles CA10, CA50 and CA90, and hence the duration of combustion and its distribution relative to TDC, as well as to determine which dose initiates autoignition; the measurement of the exhaust gas composition, of the fuel consumption and of the engine torque; and the extension of the experiment to other driving speeds and engine loads.
4. Conclusions
At the operating point examined, a coupled change in the start times of the second pilot and main injections serves to phase the combustion process rather than improve its energy conversion. The applied correction is reproduced by the measured start of injection almost proportionally; the start of combustion shifts over a wider range and the angle of maximum pressure over a narrower one, while the ignition delay is insensitive to retardation of the sequence and shortens only at large advances.
Advancing the sequence moves combustion before top dead center and raises both the maximum combustion pressure and the maximum rate of pressure rise. It is accompanied by a marked increase in the cycle-to-cycle dispersion, which appears once the start of combustion crosses top dead center. From the point of view of the mechanical and dynamic loading of the combustion chamber, this direction is unfavorable.
Retarding the sequence acts in the opposite direction and is an effective means of limiting the rate of pressure rise and the maximum combustion pressure, at the cost of a lower indicated mean effective pressure of the indicated cylinder. The choice of setting is therefore a compromise and cannot consist of the maximum possible retardation of these injection phases.
A small advance in the sequence brings the combustion course of the blend close to that obtained with diesel fuel: at a correction of −1 °CA, the differences in the maximum combustion pressure, the rate of pressure rise, and the angle of maximum pressure are not statistically significant. This is the directly applicable calibration guideline following from the study.
The indicated mean effective pressure is reported here as a measured property of the indicated cylinder’s cycle. Because the injected fuel quantity, the fuel consumption, and the engine torque were not recorded, it is not interpreted as a measure of engine efficiency, and the conclusions are limited to the course of combustion at a single operating point and for a single blend ratio.
Author Contributions
Conceptualization, D.T., P.S., and J.M.; methodology, D.T. and P.S.; investigation, D.T. and P.S.; formal analysis, D.T., P.S., and J.M.; writing—original draft preparation, D.T. and P.S.; writing—review and editing, D.T., P.S., and J.M.; visualization, D.T.; supervision, J.M. All authors have read and agreed to the published version of the manuscript.
Funding
This research received no external funding.
Data Availability Statement
The data presented in this study are available on request from the corresponding author.
Acknowledgments
Declaration of Generative AI and AI-Assisted Technologies in the Writing Process: During the preparation of this manuscript, the authors used OpenAI (GPT-4o, OpenAI) solely for language editing. The authors reviewed and edited the resulting text and take full responsibility for the publication’s content.
Conflicts of Interest
The authors declare no conflicts of interest.
Abbreviations
The following abbreviations are used in this manuscript:
| CA10, CA50, CA90 | Crank angle at which 10%, 50% and 90% of the cumulative heat release is reached |
| CFPP | Cold filter plugging point |
| CI | Compression ignition |
| CoV | Coefficient of variation |
| Df | Diesel fuel |
| DPF | Diesel particulate filter |
| ECU | Engine control unit |
| EGR | Exhaust gas recirculation |
| FAME | Fatty acid methyl ester |
| G | Main injection |
| HVO | Hydrotreated vegetable oil |
| NEDC | New European Driving Cycle |
| OBD | On-board diagnostics |
| OR90Hex10 | Blend of 90% v/v rapeseed oil and 10% v/v n-hexane |
| ORI | Original (nominal) ECU calibration |
| P1, P2 | First and second pilot injection |
| RDE | Real driving emissions |
| SOC | Start of combustion |
| SOI | Start of injection |
| Std | Standard deviation |
| TDC | Top dead center |
| WLTC | Worldwide Harmonized Light Vehicles Test Cycle |
| WLTP | Worldwide Harmonized Light Vehicles Test Procedure |
| Symbols | |
| C | Unit conversion constant in Equation (A4) |
| I | Integrated heat release [kJ/m3] |
| j | Sample number |
| n | Number of engine cycles in a series (n = 100); in Equation (A4), the calculation step |
| p | Instantaneous in-cylinder pressure [MPa] |
| pi | Indicated mean effective pressure [MPa] |
| pmax | Maximum combustion pressure [MPa] |
| (dp/dα)max | Maximum rate of pressure rise [MPa/°CA] |
| dQ/dα | Heat release rate [kJ/(m3·°CA)] |
| Qmax | Maximum heat release rate [kJ/(m3·°CA)] |
| R2 | Coefficient of determination |
| V | Instantaneous cylinder volume [dm3] |
| Vs | Cylinder displacement volume [dm3] |
| Arithmetic mean | |
| α | Crank angle [°CA] |
| αpmax | Angle of maximum combustion pressure [°CA] |
| αps | Start of combustion angle [°CA] |
| αpw | Start of injection angle [°CA] |
| αzs | Ignition delay angle [°CA] |
| Δα | Sampling step [°CA] |
| κ | Polytropic exponent |
| °CA | Crank angle degree |
Appendix A
The relationships implemented in AVL IndiCom and used to process the recorded pressure traces, together with the specification of the pressure sensor, are collected below:
where p is the instantaneous in-cylinder pressure, V is the instantaneous cylinder volume, and Vs is the cylinder displacement volume:
pi = (1/Vs) ∮ p dV
pmax = max [p(α)], αpmax = arg max[p(α)]
The maximum rate of pressure rise (dp/dα)max was taken as the highest value of the difference quotient of pressure with respect to crankshaft angle within the cycle:
where j is the sample number and Δα is the sampling step:
where n is the calculation step (1 °CA), κ is the polytropic exponent (1.37 for compression and 1.30 for expansion) and C is the unit conversion constant:
(dp/dα)max = max[(pj+1 − pj−1) / (2Δα)]
dQj = C/(κ − 1) · [κ · pj · (Vj+n − Vj−n) + Vj · (pj+n − pj−n)]
αzs = αpw − αps
Specification of the AVL GH13P pressure sensor. According to the manufacturer’s data sheet (AVL List GmbH, Pressure Sensor for Combustion Analysis, Data Sheet GH13P, No. TIGG0931A.01), this sensor is characterized by a measuring range of 0–250 bar, a linearity of ≤±0.3% FSO (≤±0.75 bar over the full measuring range), a nominal sensitivity of 16 pC/bar, a permissible overload of 300 bar, a natural frequency of approximately 130 kHz, an operating temperature range from −40 to 400 °C, a cyclic temperature drift of ≤±0.5 bar and a thermal shock error of ≤±0.3 bar (which, according to the manufacturer’s data, corresponds to ≤±1.5% for the indicated mean effective pressure (IMEP) and ≤±1% for the maximum pressure).
References
- Almeida, R.; Serrano, L.; Silva, D.; Santos, H.; Pereira, J.; da Silva, M.G. Decarbonization of EU Road Freight Transport in the Short and Medium Term Through Renewable Liquid Fuels—A Review. Energies 2026, 19, 1382. [Google Scholar] [CrossRef] [Scilit]
- Agarwal, A.K.; Mounaïm-Rousselle, C.; Brequigny, P.; Dhar, A.; Hespel, C.; Patel, C.; Srivastava, D.K.; Duraisamy, G.; Le Moyne, L.; Sharma, N.; et al. Future of Internal Combustion Engines Using Sustainable, Scalable, and Storable E-Fuels and Biofuels for Decarbonizing Transport and Enabling Advanced Combustion Technologies. Prog. Energy Combust. Sci. 2025, 110, 101236. [Google Scholar] [CrossRef] [Scilit]
- Conway, G.; Joshi, A.; Leach, F.; García, A.; Senecal, P.K. A Review of Current and Future Powertrain Technologies and Trends in 2020. Transp. Eng. 2021, 5, 100080. [Google Scholar] [CrossRef] [Scilit]
- Pesonen, J.; Prinz, R.; Ovaskainen, H.; Kauranen, P.; Poikela, A.; Kärhä, K. Alternative Powertrains and Fuels in Heavy Non-Road Mobile Machinery and Their Future Expectations—A Review. Curr. For. Rep. 2025, 11, 10. [Google Scholar] [CrossRef] [Scilit]
- Urzędowska, W.; Stępień, Z. Prediction of Threats Caused by High FAME Diesel Fuel Blend Stability for Engine Injector Operation. Fuel Process. Technol. 2016, 142, 403–410. [Google Scholar] [CrossRef] [Scilit]
- Pullen, J.; Saeed, K. An Overview of Biodiesel Oxidation Stability. Renew. Sustain. Energy Rev. 2012, 16, 5924–5950. [Google Scholar] [CrossRef] [Scilit]
- Szeto, W.; Leung, D.Y.C. Is Hydrotreated Vegetable Oil a Superior Substitute for Fossil Diesel? A Comprehensive Review on Physicochemical Properties, Engine Performance and Emissions. Fuel 2022, 327, 125065. [Google Scholar] [CrossRef] [Scilit]
- Kuszewski, H.; Jaworski, A.; Szpica, D. Comparative Study of the Lubricity of Hydrotreated Vegetable Oil, Diesel, and Their Blends Using Four-Ball Testing: Focus on Scuffing Load. Energies 2025, 18, 3141. [Google Scholar] [CrossRef] [Scilit]
- Nieto Garzón, N.A.; Oliveira, A.A.M.; Bazzo, E. An Ignition Delay Correlation for Compression Ignition Engines Fueled with Straight Soybean Oil and Diesel Oil Blends. Fuel 2019, 257, 116050. [Google Scholar] [CrossRef] [Scilit]
- Longwic, R.; Sander, P.; Zdziennicka, A.; Szymczyk, K.; Jańczuk, B. Combustion Process of Canola Oil and N-Hexane Mixtures in Dynamic Diesel Engine Operating Conditions. Appl. Sci. 2020, 10, 80. [Google Scholar] [CrossRef] [Scilit]
- Nieto Garzón, N.A.; Oliveira, A.A.M.; Bazzo, E. Heat Release Rates of Straight Soybean and Diesel Oil Blends in a Compression Ignition Engine. Appl. Sci. 2024, 14, 9215. [Google Scholar] [CrossRef] [Scilit]
- Aradi, A.A.; Ryan, T.W. Cetane Effect on Diesel Ignition Delay Times Measured in a Constant Volume Combustion Apparatus. In Proceedings of the 1995 SAE International Fall Fuels and Lubricants Meeting and Exhibition, Toronto, ON, Canada, 16 October 1995. [Google Scholar] [CrossRef] [Scilit] [PubMed]
- Shepel, O.; Matijošius, J.; Rimkus, A.; Orynycz, O.; Tucki, K.; Świć, A. Combustion, Ecological, and Energetic Indicators for Mixtures of Hydrotreated Vegetable Oil (HVO) with Duck Fat Applied as Fuel in a Compression Ignition Engine. Energies 2022, 15, 7892. [Google Scholar] [CrossRef] [Scilit]
- Hashimoto, M.; Dan, T.; Asano, I.; Arakawa, T. Combustion of the Rape-Seed Oil in a Diesel Engine. In Proceedings of the SAE 2002 World Congress & Exhibition, Detroit, MI, USA, 4 March 2002. [Google Scholar]
- Öztürk, E.; Can, Ö.; Usta, N.; Yücesu, H.S. Effects of Retarded Fuel Injection Timing on Combustion and Emissions of a Diesel Engine Fueled with Canola Biodiesel. Eng. Sci. Technol. Int. J. 2020, 23, 1466–1475. [Google Scholar] [CrossRef] [Scilit]
- Zdziennicka, A.; Szymczyk, K.; Jańczuk, B.; Longwic, R.; Sander, P. Surface, Volumetric, and Wetting Properties of Oleic, Linoleic, and Linolenic Acids with Regards to Application of Canola Oil in Diesel Engines. Appl. Sci. 2019, 9, 3445. [Google Scholar] [CrossRef] [Scilit]
- Tat, M.E.; Van Gerpen, J.H.; Soylu, S.; Canakci, M.; Monyem, A.; Wormley, S. The Speed of Sound and Isentropic Bulk Modulus of Biodiesel at 21 °C from Atmospheric Pressure to 35 MPa. JAOCS J. Am. Oil Chem. Soc. 2000, 77, 285–289. [Google Scholar] [CrossRef] [Scilit]
- Nikolić, B.D.; Kegl, B.; Marković, S.D.; Mitrović, M.S. Determining the Speed of Sound, Density, and Bulk Modulus of Rapeseed Oil, Biodiesel, and Diesel Fuel. Therm. Sci. 2013, 16, 505–514. [Google Scholar] [CrossRef] [Scilit]
- Caresana, F.; Bietresato, M.; Renzi, M. Injection and Combustion Analysis of Pure Rapeseed Oil Methyl Ester (Rme) in a Pump-Line-Nozzle Fuel Injection System. Energies 2021, 14, 7535. [Google Scholar] [CrossRef] [Scilit]
- Vargün, M.; Yılmaz, I.T.; Özsezen, A.N.; Sayın, C. A Study on Combustion Parameters and Exhaust Characteristics in a Diesel Engine Using Alternative Fuels at Different SOI and GPP. Processes 2025, 13, 3024. [Google Scholar] [CrossRef] [Scilit]
- Sander, P.; Longwic, R.; Tarkowski, S. Analysis of the Influence of the N-Hexane Content in the Mixture with Rapeseed Oil on the Auto-Ignition Delay Angle of the Fuel. Combust. Engines 2026, 205, 56–63. [Google Scholar] [CrossRef] [Scilit]
- Longwic, R.; Sander, P.; Lotko, W.; Gorski, K.; Janczuk, B.; Zdziennicka, A.; Szymczyk, K. Self-Ignition of Rapeseed and n-Hexane Mixtures in Diesel Engine. Przem. Chem. 2020, 99, 206–210. [Google Scholar] [CrossRef] [Scilit]
- Longwic, R.; Kuszneruk, M.; Tatarynow, D. Selected Parameters of the Combustion Process in a Compression-Ignition Engine at Different Angles of the Beginning of Injection of Mixtures of Rapeseed Oil with n-Hexane. Combust. Engines 2025, 206, 3–8. [Google Scholar] [CrossRef] [Scilit]
- Serrano, L.; Santana, B.; Pires, N.; Correia, C. Performance, Emissions, and Efficiency of Biodiesel versus Hydrotreated Vegetable Oils (HVO), Considering Different Driving Cycles Sensitivity Analysis (NEDC and WLTP). Fuels 2021, 2, 448–470. [Google Scholar] [CrossRef] [Scilit]
- Suarez-Bertoa, R.; Kousoulidou, M.; Clairotte, M.; Giechaskiel, B.; Nuottimäki, J.; Sarjovaara, T.; Lonza, L. Impact of HVO Blends on Modern Diesel Passenger Cars Emissions during Real World Operation. Fuel 2019, 235, 1427–1435. [Google Scholar] [CrossRef] [Scilit]
- Tipanluisa, L.; Prati, M.V.; Costagliola, M.A. Impact of Diesel/Renewable Fuels Blend on Gaseous and Particle Emissions of a Light-Duty Vehicle under Real Driving Emissions. Renew. Energy 2024, 230, 120819. [Google Scholar] [CrossRef] [Scilit]
- Jaworski, A.; Kuszewski, H.; Szpica, D.; Woś, P.; Balawender, K.; Ustrzycki, A.; Krzemiński, A.; Jakubowski, M.; Mieczkowski, G.; Borawski, A.; et al. Comparative Study on the Effects of Diesel Fuel, Hydrotreated Vegetable Oil, and Its Blends with Pyrolytic Oils on Pollutant Emissions and Fuel Consumption of a Diesel Engine Under WLTC Dynamic Test Conditions. Energies 2025, 18, 5038. [Google Scholar] [CrossRef] [Scilit]
- Ferrari, A.; Vassallo, A. The Impact of the Common Rail Fuel Injection System on Performance and Emissions of Modern and Future Compression Ignition Engines. Energies 2025, 18, 5259. [Google Scholar] [CrossRef] [Scilit]
- Zamboni, G. Influence of Fuel Injection, Turbocharging and EGR Systems Control on Combustion Parameters in an Automotive Diesel Engine. Appl. Sci. 2019, 9, 484. [Google Scholar] [CrossRef] [Scilit]
- Jaworski, A.; Kuszewski, H.; Longwic, R.; Sander, P. Assessment of Self-Ignition Properties of Canola Oil–n-Hexane Blends in a Constant Volume Combustion Chamber and Compression Ignition Engine. Appl. Sci. 2023, 13, 10558. [Google Scholar] [CrossRef] [Scilit]
- Depcik, C.; Jachuck, J.; Jantz, D.; Kiani, F.; Mangus, M.; Mattson, J.; Peltier, E.; Stagg-Williams, S.M. Influence of Fuel Injection System and Engine-Timing Adjustments on Regulated Emissions from Four Biodiesel Fuels. Transp. Res. Rec. J. Transp. Res. Board 2015, 2503, 20–28. [Google Scholar] [CrossRef] [Scilit]
- Caresana, F. Impact of Biodiesel Bulk Modulus on Injection Pressure and Injection Timing. the Effect of Residual Pressure. Fuel 2011, 90, 477–485. [Google Scholar] [CrossRef] [Scilit]
- Galindo, J.; Climent, H.; Pla, B.; Patil, C. EGR Transient Operations in Highly Dynamic Driving Cycles. Int. J. Automot. Technol. 2020, 21, 865–879. [Google Scholar] [CrossRef] [Scilit]
- Ko, J.; Myung, C.L.; Park, S. Impacts of Ambient Temperature, DPF Regeneration, and Traffic Congestion on NOx Emissions from a Euro 6-Compliant Diesel Vehicle Equipped with an LNT under Real-World Driving Conditions. Atmos. Environ. 2019, 200, 1–14. [Google Scholar] [CrossRef] [Scilit]
- Chen, L.; Wang, Z.; Liu, S.; Qu, L. Using a Chassis Dynamometer to Determine the Influencing Factors for the Emissions of Euro VI Vehicles. Transp. Res. Part D Transp. Environ. 2018, 65, 564–573. [Google Scholar] [CrossRef] [Scilit]
- Tatarynow, D. Analysis of the Potential for Modifying Selected Combustion Parameters of Rapeseed Oil–n-Hexane Blends in a Diesel Engine by Varying the Angle of the First Pilot Injection. Adv. Sci. Technol. Res. J. 2026. Epub ahead of printing. [Google Scholar]
- Badami, M.; Mallamo, F.; Millo, F.; Rossi, E.E. Influence of Multiple Injection Strategies on Emissions, Combustion Noise and BSFC of a Di Common Rail Diesel Engine. In Proceedings of the SAE 2002 World Congress & Exhibition, Detroit, MI, USA, 4 March 2002. [Google Scholar]
- Park, C.; Kook, S.; Bae, C. Effects of Multiple Injections in a HSDI Diesel Engine Equipped with Common Rail Injection System. In Proceedings of the SAE 2004 World Congress & Exhibition, Detroit, MI, USA, 8 March 2004. [Google Scholar]
- Du, J.; Chen, X.; Liu, L.; Liu, D.; Ma, X. Mechanism of Combustion Noise Influenced by Pilot Injection in PPCI Diesel Engines. Appl. Sci. 2019, 9, 1875. [Google Scholar] [CrossRef] [Scilit]
- United Nations Economic Commission for Europe (UNECE). Global Technical Regulation No. 15 (GTR No. 15): Worldwide Harmonized Light Vehicles Test Procedures (WLTP); United Nations Economic Commission for Europe: Geneva, Switzerland, 1998. [Google Scholar]
- Tatarynow, D.; Longwic, R.; Sander, P.; Zieliński, Ł.; Trojgo, M.; Lotko, W.; Lonkwic, P. Test Stand for a Motor Vehicle Powered by Different Fuels. Appl. Sci. 2022, 12, 10683. [Google Scholar] [CrossRef] [Scilit]
- AVL List GmbH. Pressure Sensor for Combustion Analysis—Data Sheet GH13P; Document No. TIGG0931A.01; AVL List GmbH: Graz, Austria, 2013. [Google Scholar]
- PN-EN 590:2013; Automotive Fuels—Diesel—Requirements and Test Methods. Polish Committee for Standardization: Warsaw, Poland, 2013.
- Liu, H.; Przybylski, R.; Dawson, K.; Eskin, N.A.M.; Biliaderis, C.G. Comparison of the Composition and Properties of Canola and Sunflower Oil Sediments with Canola Seed Hull Lipids. JAOCS J. Am. Oil Chem. Soc. 1996, 73, 493–498. [Google Scholar] [CrossRef] [Scilit]
- Sander, P. The Use of a Mixture of Hexane and Canola Oil to Fuel a Diesel Engine. Ph.D. Thesis, Lublin University of Technology, Lublin, Poland, 2022. [Google Scholar]
- Longwic, R.; Sander, P.; Jańczuk, B.; Zdziennicka, A.; Szymczyk, K. Modification of Canola Oil Physicochemical Properties by Hexane and Ethanol with Regards of Its Application in Diesel Engine. Energies 2021, 14, 4469. [Google Scholar] [CrossRef] [Scilit]

Disclaimer/Publisher’s Note: The statements, opinions and data contained in all publications are solely those of the individual author(s) and contributor(s) and not of MDPI and/or the editor(s). MDPI and/or the editor(s) disclaim responsibility for any injury to people or property resulting from any ideas, methods, instructions or products referred to in the content. |
© 2026 by the authors. Licensee MDPI, Basel, Switzerland. This article is an open access article distributed under the terms and conditions of the Creative Commons Attribution (CC BY) license.