


Abstract
Substation pillar-type switchgear structures are important electrical equipment in the power transmission and transformation system. These structures are characterized by a large top mass, low overall stiffness, and low natural vibration frequency, and are prone to fatigue damage under long-term wind loads. At present, studies on wind-induced vibration fatigue of substation disconnect switch structures are relatively limited. In this paper, a numerical model of the substation disconnect switch structure is established on the basis of static tests, and wind loads are determined according to wind tunnel test results. The Weibull distribution model and the mixed distribution model (Weibull distribution + GPD distribution) are adopted to characterize the wind-speed probability distributions in large-scale steady strong-wind regions and typhoon-prone regions, respectively. Fatigue damage calculation and life prediction are carried out for the fatigue-critical positions of the disconnect switch structure. The results show that the windward and leeward M16 bolts at the flange joint suffer fatigue failure within the 50-year design service life. In large-scale steady strong-wind regions, the predicted fatigue lives of the critical M16-① and M16-⑤ bolts are 8.28 years and 8.48 years, respectively; in typhoon-prone regions, their predicted fatigue lives reduce to 0.87 years and 3.01 years, respectively. The research findings can provide a reference for the anti-fatigue design of flange joints for substation disconnect switch structures.
1. Introduction
Since the founding of the People’s Republic of China, more than 500 typhoon landfall events have been recorded in China. These typhoons have a wide range of influences, stretching from Liaoning Yingkou in the north to Hainan Sanya in the south. For the substation disconnect switch structures located along the regular typhoon paths, they are not only subjected to large-scale steady strong winds during operation but also to the extreme wind forces brought by typhoons. Data [1,2] shows that from 2004 to 2007, typhoons such as “Rananim”, “Matsa”, “Saomai”, and “Wipha” successively caused damage and failures to high-voltage electrical equipment in coastal areas, seriously disrupting the normal operation of the power grid.
The substation disconnect switch structure is mainly composed of a bottom steel support, pillar insulators, and a top disconnect switch contact. It is a key component of the substation and is indispensable in power generation, transmission, and distribution systems. Paris [2] conducted multiple cyclic axial tensile tests on the core rods of long-rod composite insulators for power transmission and transformation lines and obtained the time-life curve of the composite insulator core rods by fitting the test data. Wankowicz [3,4] selected the composite insulators in 110–400 kV substations in Poland for fatigue tests, obtained the S-N curves of these insulators, and revealed the fatigue development trend of the insulators from a micro-mechanism perspective. Carpenter [5] studied the influence of the nitric acid environment and cyclic loads on the corrosion cracking of the core rods of composite high-voltage insulators. The results showed that the insulators in the acidic environment experienced a brittle fracture, and cracks formed in the direction perpendicular to the internal or external fibers of the end fittings.
Mingzhen Gao et al. [6] conducted a large number of vibration fatigue tests on disc-shaped suspension porcelain insulators and rod-shaped suspension composite insulators. The results showed that after 30 million vibrations, the strength of the composite insulators decreased by 14%, while that of the porcelain insulators decreased by 15%. Wang Jingchao [7] conducted vibration fatigue tests on composite insulators with 20–40 million cycles. The results showed that fatigue fractures occurred at the anchoring positions of the insulator core rods and the connecting fittings, and the strength of the core rods decreased. Cao Meigen et al. [8] conducted vibration fatigue tests on high-voltage pillar porcelain insulators and found that under the action of cyclic loads, no fatigue damage was observed on the appearance of the insulators, but the fatigue damage of the insulators was manifested as a decrease in flange stiffness.
Liu Chao et al. [9] conducted 1000 bending fatigue tests on hollow pillar composite insulators. The results showed that the fatigue damage did not affect the sealing performance of the insulators, and there was no obvious damage to the insulator core rods and flange areas. Wei Xiaoxing et al. [10] conducted 1000 cyclic loadings on 500 kV substation hollow composite insulators. The results showed that the insulators after cyclic loading were more likely to be pulled out and fail compared with those without cumulative fatigue damage, and the stress at the dangerous section of the insulator core rod decreased slightly.
It was previously mentioned that foreign scholars have conducted fatigue tests on the insulators of substation disconnect switch structures. Domestic scholars have only described the test results, and the reasons for the number of cyclic loading times in the fatigue tests have not been given. In contrast, foreign scholars have further provided the fatigue life curves of the insulators and expounded on the fatigue damage mechanism.
Jin Xin [11] designed a fatigue test method for composite pillar insulators that can apply multiple loads (such as horizontal forces, bending moments, and torques). However, the reliability of this method still needs to be further verified through experiments. Xiao Qi et al. [12] established a 1/4 model of small-diameter composite insulators for 500 kV power transmission and transformation lines, described the probability distribution of vibration frequencies using the Weibull distribution function, and calculated the fatigue life of the insulators by combining the Miner fatigue damage accumulation theory.
The bolt connection between the insulator and the flange plate is also a key factor affecting the fatigue performance of the substation disconnect switch structure. If the bolts at this part experience fatigue fracture, it may cause the insulators to loosen or even fall during operation and then lead to the collapse of the entire structure. Some scholars have studied the grounding lead bolts of substation current transformers [13] or the flange bolts of lightning rod structures [14,15]. However, there is little research on the bolt connected parts of disconnect switch structures.
In summary, most existing fatigue studies on substation disconnect-switch equipment focus on the composite insulator core rod. Relevant laboratory fatigue tests commonly adopt pre-set symmetric cyclic loading, whose load conditions differ from the random fluctuating wind loads encountered in practical substation sites. From the perspective of wind-speed probability statistics, a single Weibull distribution is frequently adopted for wind-induced fatigue evaluation of power equipment, which cannot accurately capture the tail characteristics of extreme wind speeds under typhoon conditions. In terms of research objects, the most published literature emphasize the fatigue damage of insulator core rods. Nevertheless, engineering accidents indicate that high-strength flange bolts act as the critical weak components of disconnect-switch structures, and wind-induced-fatigue analyses targeting these bolted connections remain limited. Few existing studies have integrated the complete analysis framework consisting of probabilistic wind-speed modelling for both steady strong-wind and typhoon-prone scenarios, dynamic finite-element analysis of the full disconnect-switch structure with hybrid solid-beam elements, random wind-induced fatigue-load-spectrum construction via the rain-flow counting method, as well as damage calculation and life prediction for high-strength flange bolts. Comparative evaluations on wind-induced fatigue of flange bolts for disconnect switches under large-scale steady strong-wind and typhoon-prone wind-climate conditions are still lacking. It should be noted that the disconnect switch structure investigated in this study is located at an onshore substation. Therefore, the environmental loads primarily consist of wind loads (including large-scale steady strong winds and typhoons). Wave loads, which are critical for offshore substation platforms, are not applicable to this onshore engineering scenario and are consequently excluded from the current fatigue analysis.
In this paper, taking the disconnect switch structure of a UHV substation in the eastern Inner Mongolia region of China as the research object, a numerical model of the substation disconnect switch structure is established. The Weibull distribution model and the mixed distribution model (Weibull distribution and GPD distribution) are used to describe the probability distributions of wind speeds in large–scale steady strong wind regions and typhoon regions, respectively. According to the rain–flow counting method, the stress time–history of the fatigue–dangerous points of the substation disconnect switch structure obtained from numerical simulations is transformed into a fatigue load spectrum. The damage calculations and life predictions of the fatigue dangerous points of the structure are carried out by combining the Miner linear cumulative damage theory and the S–N curve.
2. Numerical Model of Substation Disconnect Switch Structure
2.1. Flange Node Model of Pillar Insulator
2.1.1. Establishment of the Flange Node Model
Figure 1 shows the overall assembly of the flange connection node model. The FRP core rod, flange plate, and bolts adopt the bilinear kinematic hardening constitutive model, and the channel steel support adopts the linear elastic constitutive model. The mechanical parameters of the materials are shown in Table 1 . There are multiple contacts in this model, mainly including the contact between the bolt and the screw hole wall, the contact between the nut surface and the channel steel support, and the contact between the bolt and the steel bottom plate. The contact relationships are all set as mutual contact. To prevent the contact surfaces from penetrating each other during the loading process, the normal direction of the contact surface is set as “hard contact”, and the tangential direction is set as the “penalty function” with a friction coefficient of 0.3.
Figure 1.
Integral assembly of flange connection node.
Table 1.
Mechanical parameters of materials for disconnecting switchgear.
2.1.2. Numerical Simulation Results
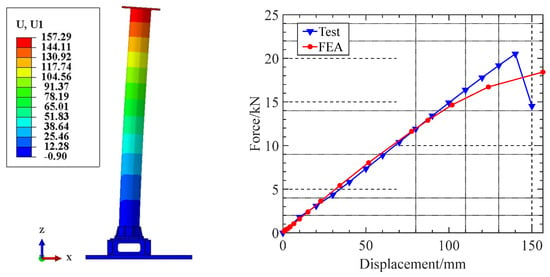
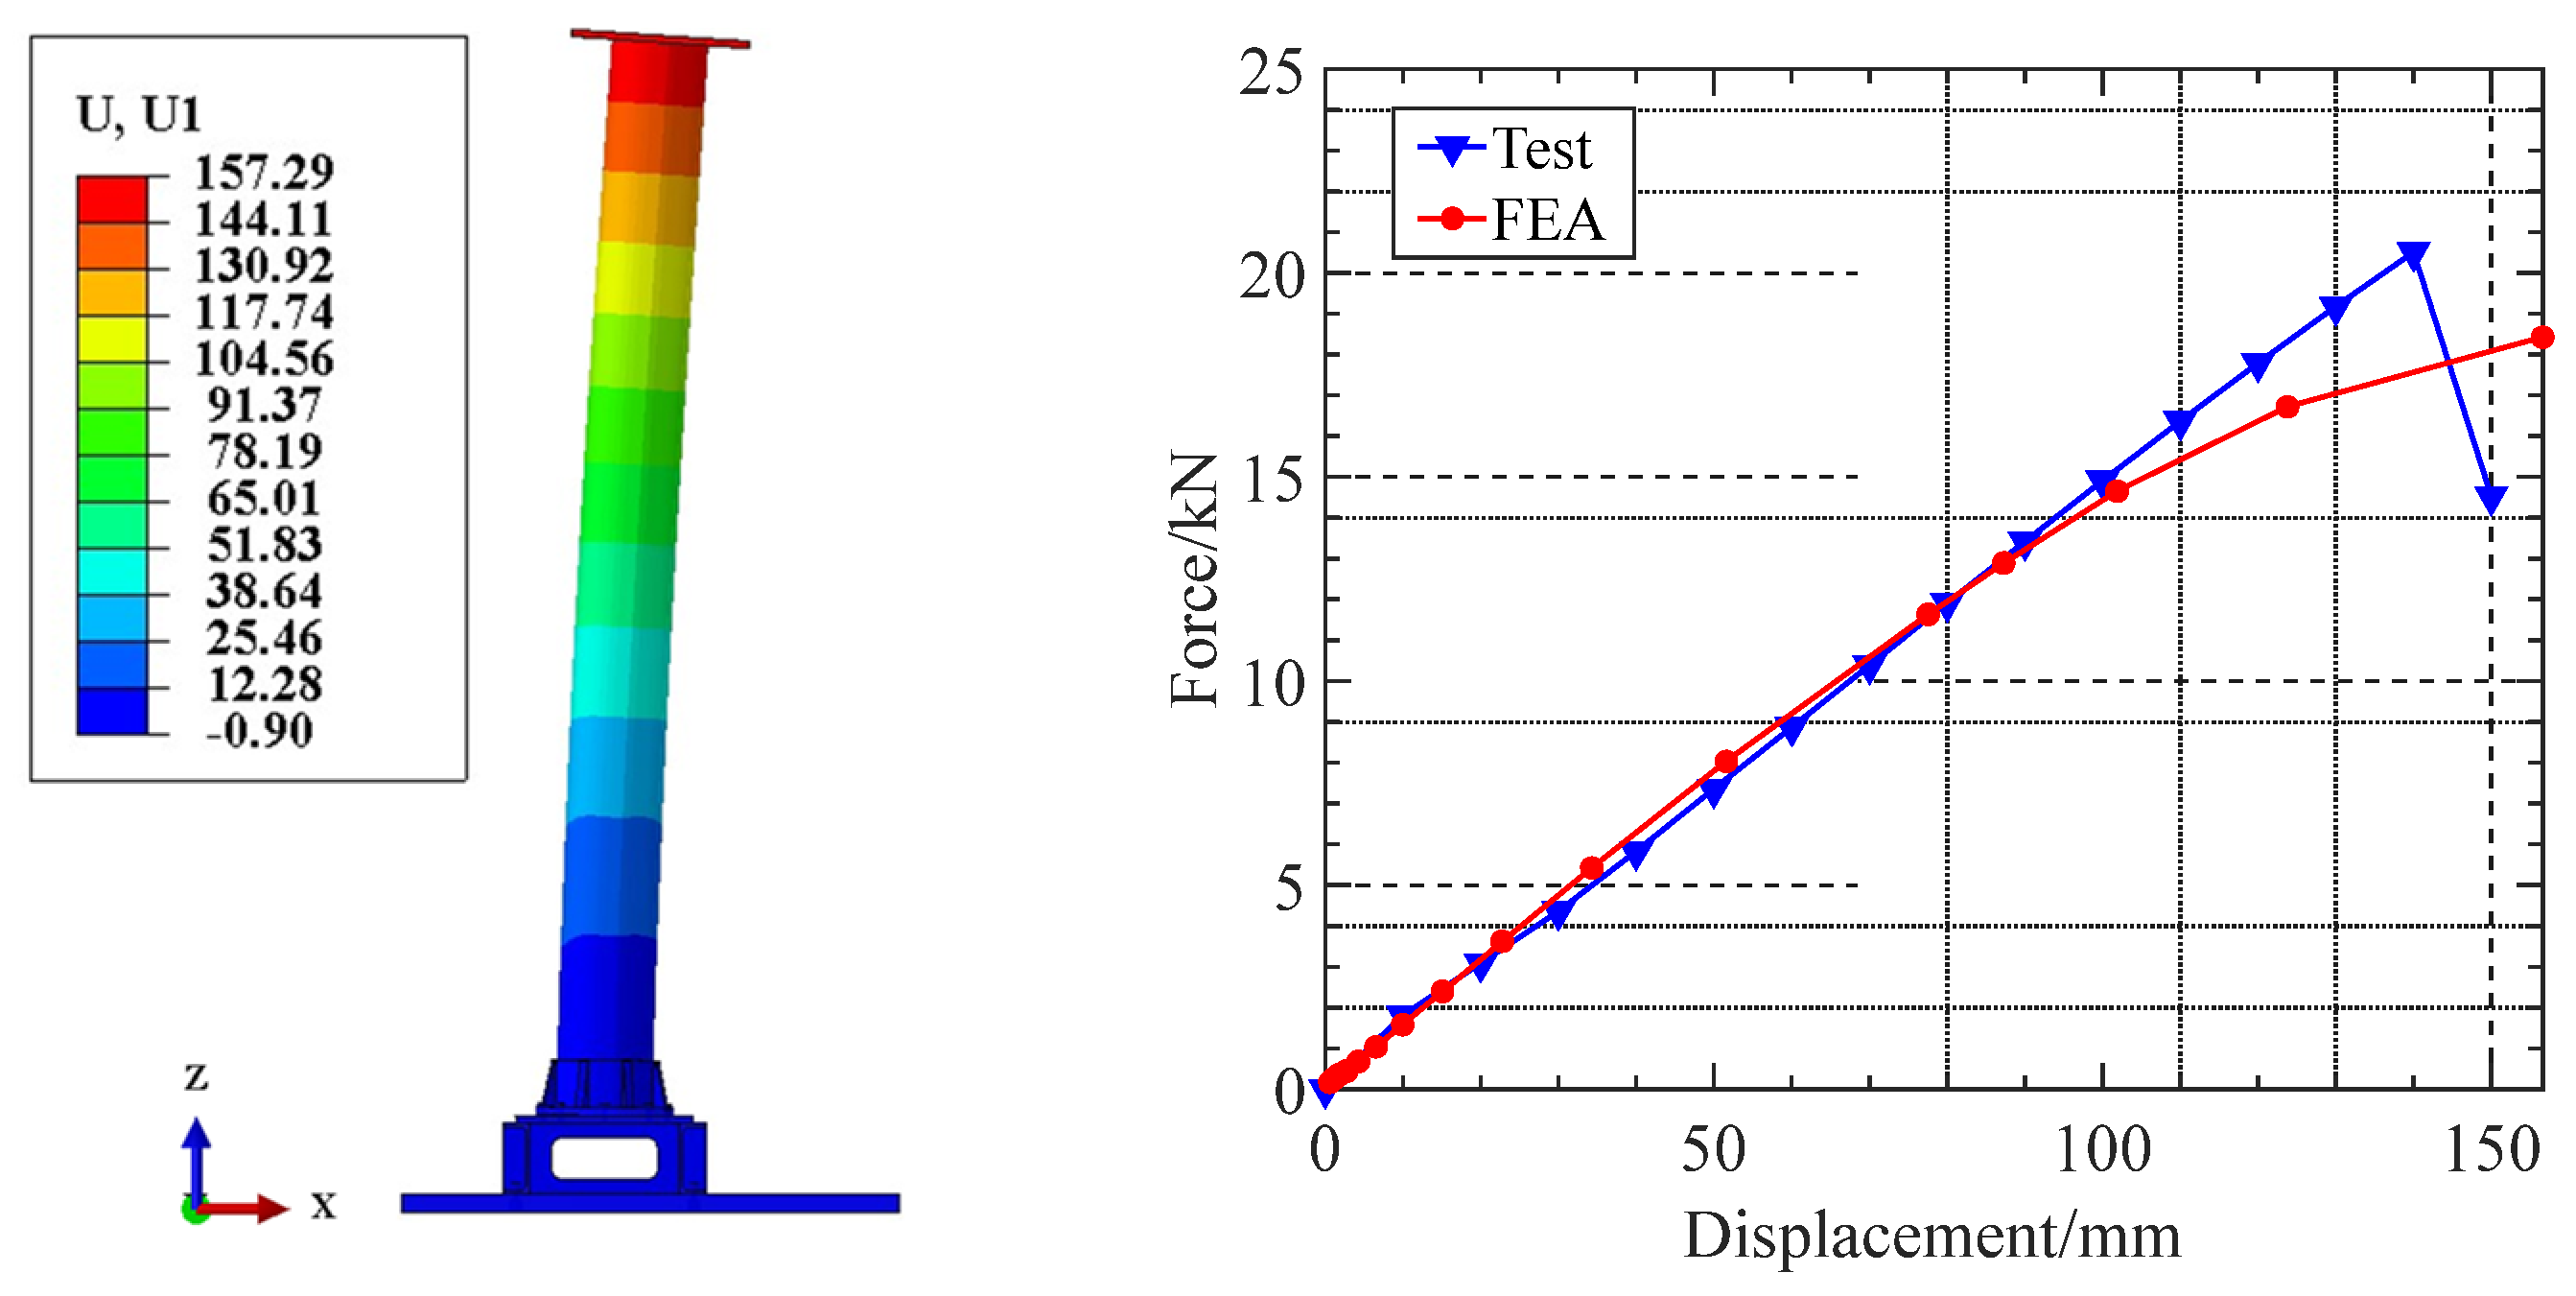
According to the horizontal static test results of the composite pillar insulator flange connection node, when the actuator horizontally pushes out 141.60 mm, the composite pillar insulator flange connection node fails, and the ultimate bearing capacity is 20.94 kN. A horizontal displacement of 150.00 mm is applied to the top of the model, and the simulation analysis results are compared with the test results. As shown in Figure 2, the force-displacement curve obtained from the numerical simulation is very close to the test force-displacement curve, and the maximum error in the elastic section does not exceed 10%, indicating that the established model is accurate and reliable.
Figure 2.
Comparison of test and simulated force-displacement curves.
2.2. Overall Model of Disconnect Switch Structure
2.2.1. Establishment of the Overall Structure Model
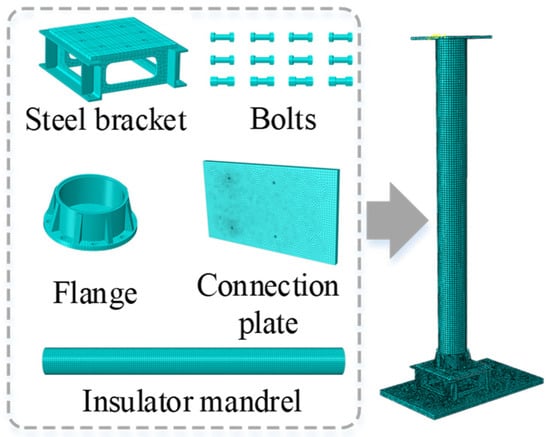
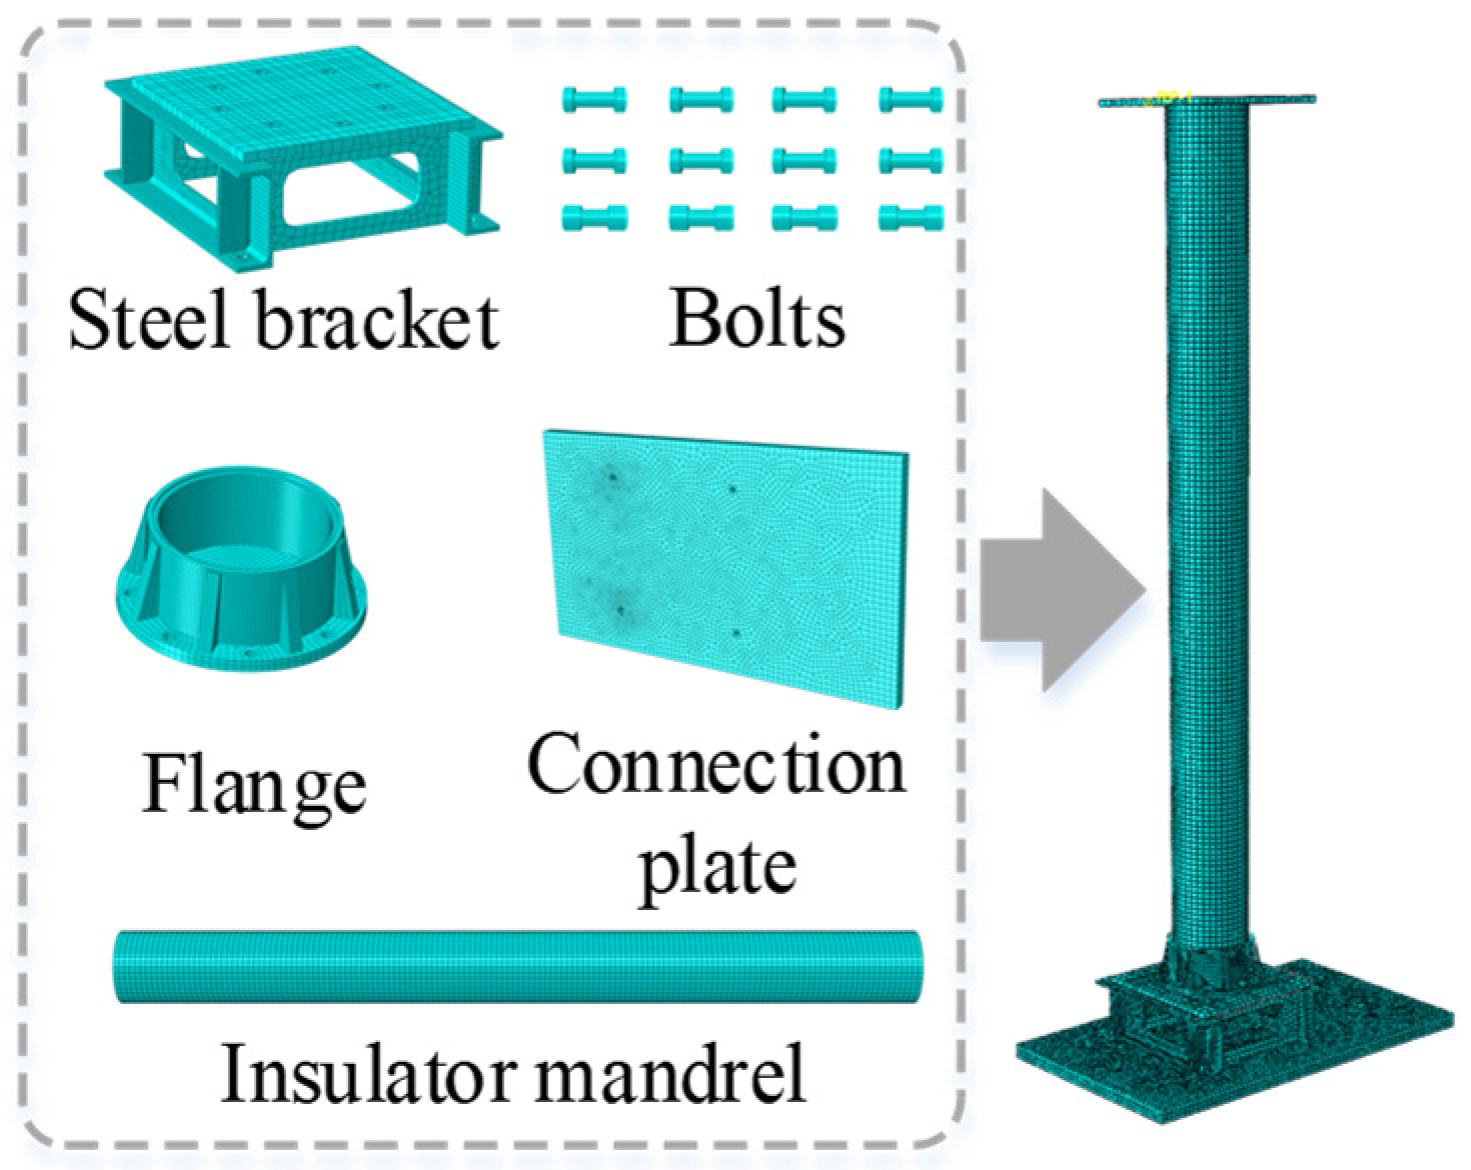
This model is established and analyzed using ABAQUS 2021 software. The aforementioned node model of the disconnector switch structure is assembled into an overall structural model. On the premise of guaranteeing model accuracy, non-primary analysis regions of the model are appropriately simplified to improve computational efficiency. The modeling considerations for the overall model of the substation disconnector switch structure in this paper are as follows: First, the lower steel column of the structure is assumed to be fixed to the ground, and the concrete foundation is not modeled. Second, existing studies indicate that the flange joint is the weak part of the structure. Accordingly, hexahedral linear incompatible elements (C3D8I elements) are adopted to construct a single flange joint for numerical simulation analysis, while beam elements (B31 elements) are used for structural components other than the flange joint.
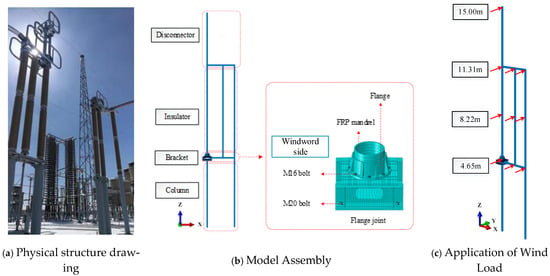
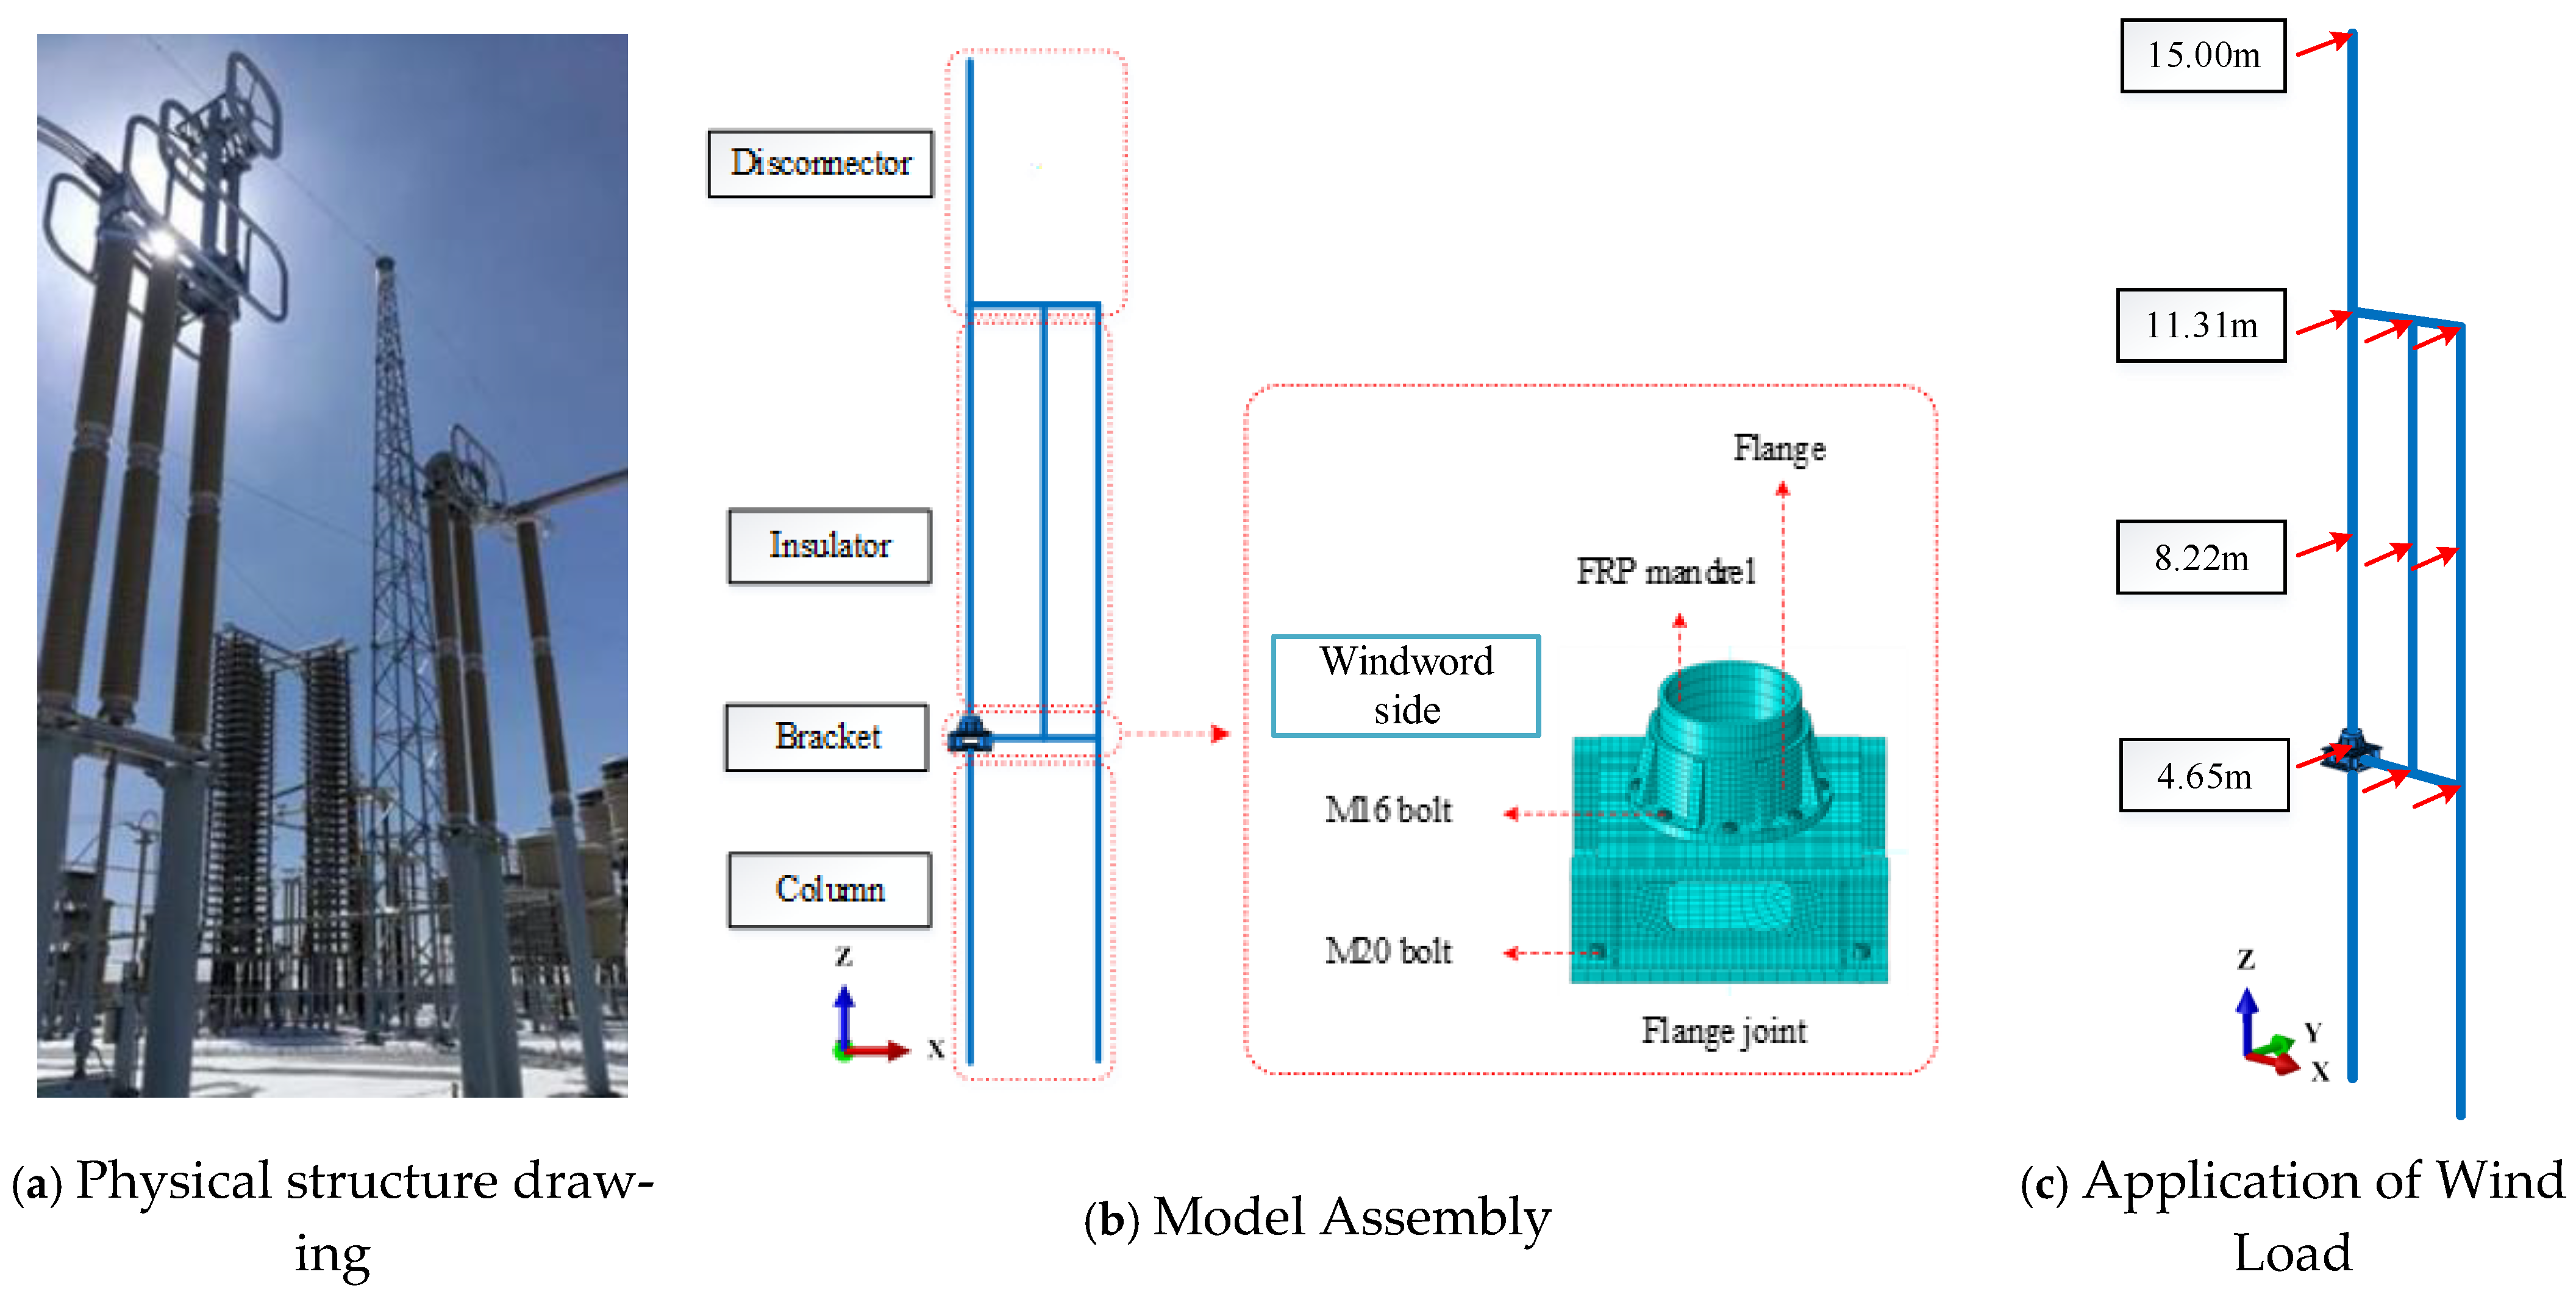
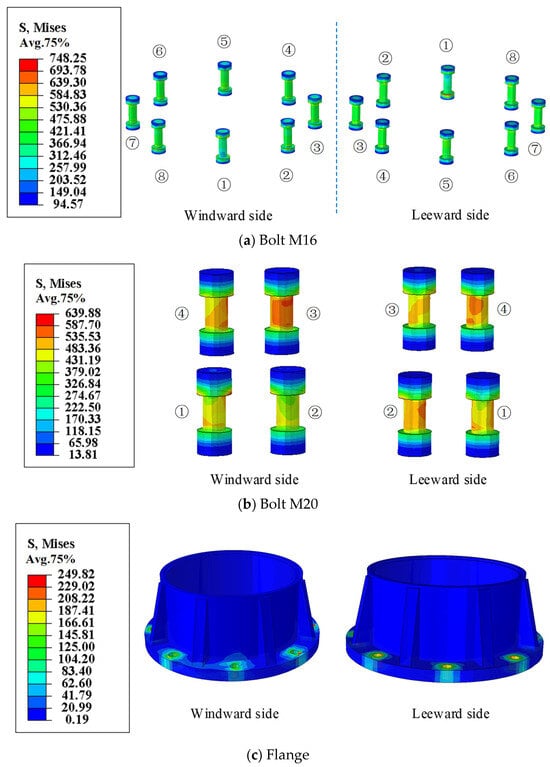
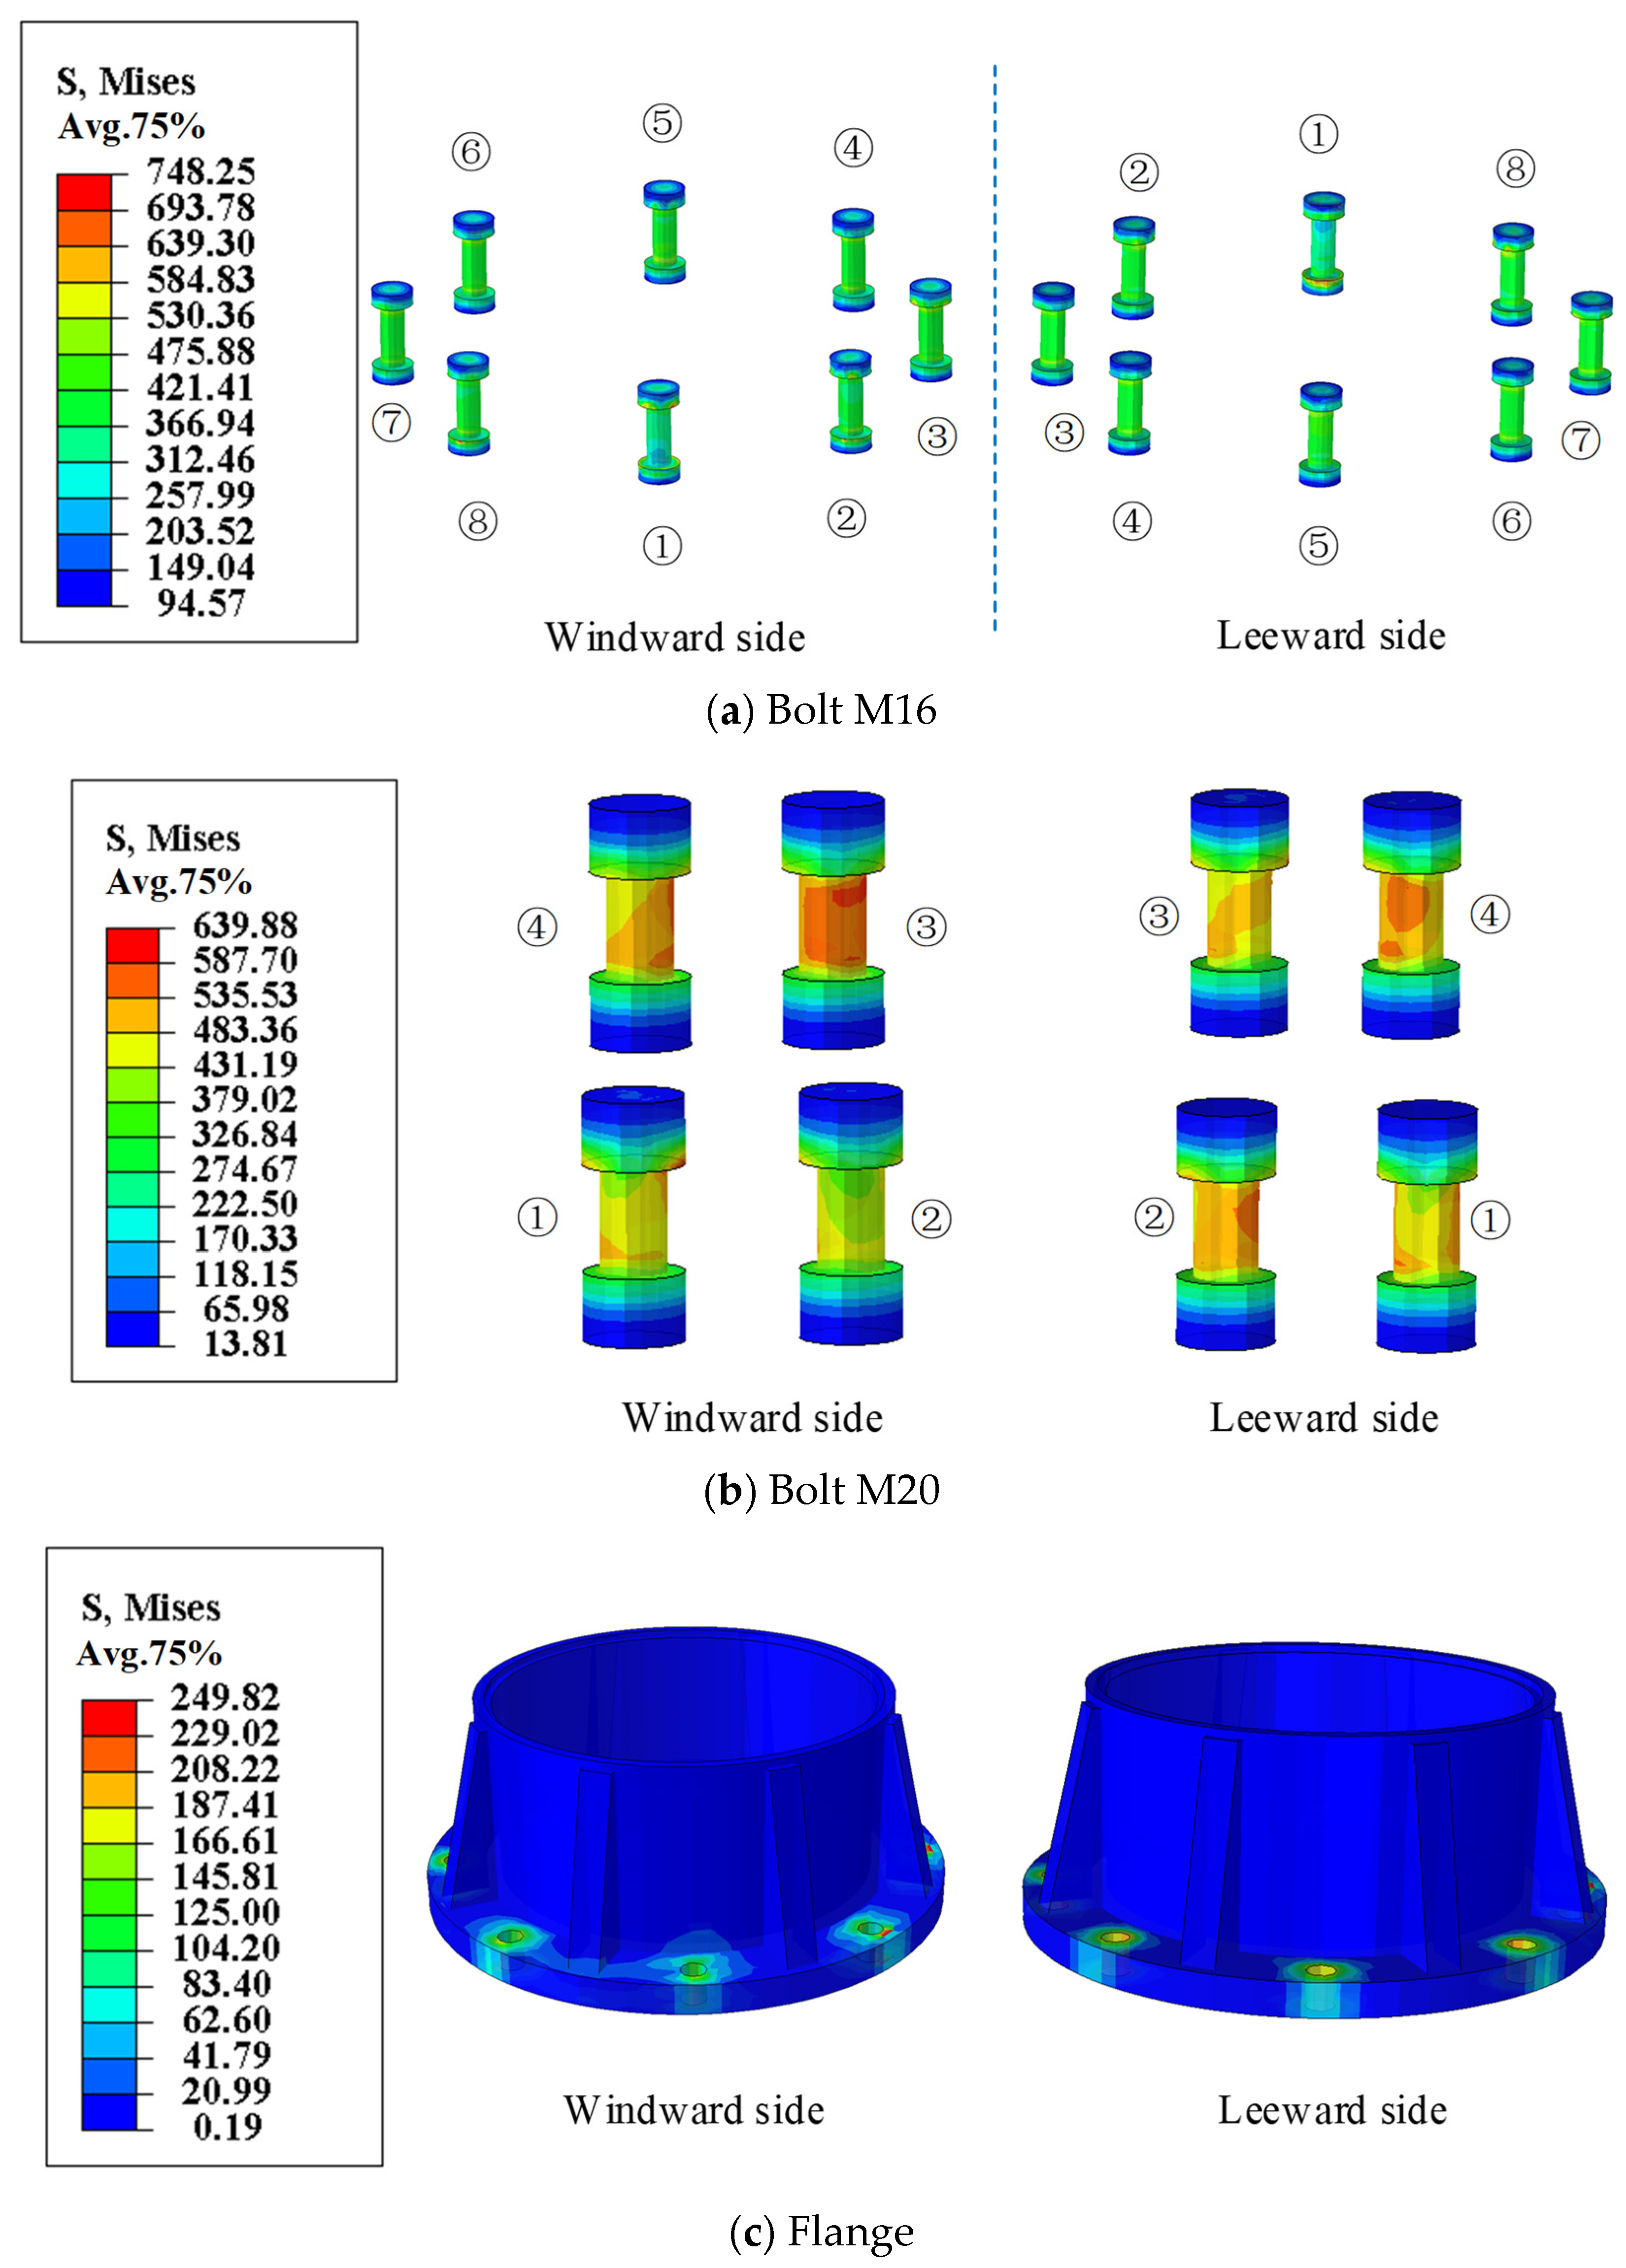
A total of 12 Grade-8.8 bolts are arranged at the flange joint of the disconnect-switch structure, including eight M16 bolts and four M20 bolts. The specific positions of M16 and M20 bolts are marked in detail in Figure 3b, and the wind-ward direction is also labelled for clear presentation of subsequent research conclusions. For M16 bolts, Bolt No.① is located at the centre of the wind-ward side, followed by Bolts No.②–⑧ in the counter-clockwise direction. For M20 bolts, Bolt No.① is placed at the centre of the wind-ward side, followed by Bolts No.②–④ in the counter-clockwise direction. The bolt pre-tensioning procedure and contact definitions for the flange joint are consistent with those of the flange-joint model in the previous chapter. In addition, the solid-element domain and beam-element domain are connected by coupling constraints.
Figure 3.
Finite element modeling of substation disconnect switch structure.
The mechanical parameters of the materials of the components of the substation disconnect switch structure, such as bolts, flange plates (aluminum alloy material), adhesives [16], and composite insulator core rods (glass fiber epoxy resin material, hereinafter referred to as FRP core rods), are shown in Table 1. The model is shown in Figure 3.
For static analysis, damping is not considered in the calculation. The total time duration is set to 1, and the minimum time increment is 0.01. Within each increment, Abaqus iteratively updates displacements and recalculates residuals via the Newton-Raphson algorithm. After a predefined maximum number of iterations (set to 5), the increment is regarded as converged once both the force residual and displacement correction meet the prescribed tolerance criteria. The subspace iteration method is employed for modal analysis, and Rayleigh damping is assumed for time-history dynamic analysis.
The first- and second-order natural frequencies of the structure are used in this paper to calculate the undetermined coefficients αM and βM of the Rayleigh damping. The formulas for these coefficients are given in Equations (1) and (2). In the equations, ξ denotes the structural damping ratio, which is taken as 5%; ω1 and ω2 are the first two natural frequencies of the structure. The calculated values of αM and βM are 0.341 and 0.007, respectively.
Preload should be applied to the Grade 8.8 high-strength bolts at the flange joint. According to relevant codes and standards, the preload of the M16 bolt is 101 kN. Multiple contact pairs are defined in the model, mainly including the contact between the bolt shank and bolt hole wall, nut surface and channel steel support, as well as bolt and steel base plate. All contact interactions are defined as surface-to-surface contact. To prevent penetration of contact surfaces under loading, the normal behavior is set as hard contact, and the tangential behavior adopts the penalty method with a friction coefficient of 0.3. Hard contact prohibits mutual penetration between contact surfaces. The two surfaces remain in compression when contact pressure >0; separation is permitted once the contact pressure ≤0. After separation, the normal contact constraint becomes inactive, and contact will be re-established when the surfaces approach again. The Lagrange multiplier method is adopted for hard contact to constrain normal displacements, which can accurately simulate bolt hole bearing and contact separation behavior without excessive penetration induced by penalty stiffness. This method is suitable for local high-stress regions such as bolt-hole bearing areas. The penalty friction formulation is used for tangential behavior. Minor elastic slip occurs before the contact shear force reaches the critical friction force. Finite-slip formulation is enabled in the model to realistically capture the slip and relative displacement between nuts/bolt heads and plates, as well as between bolt shanks and hole walls. This formulation can capture the cyclic behavior of repeated contact, separation and slip of interfaces under wind loads.
2.2.2. Modal Analysis Results
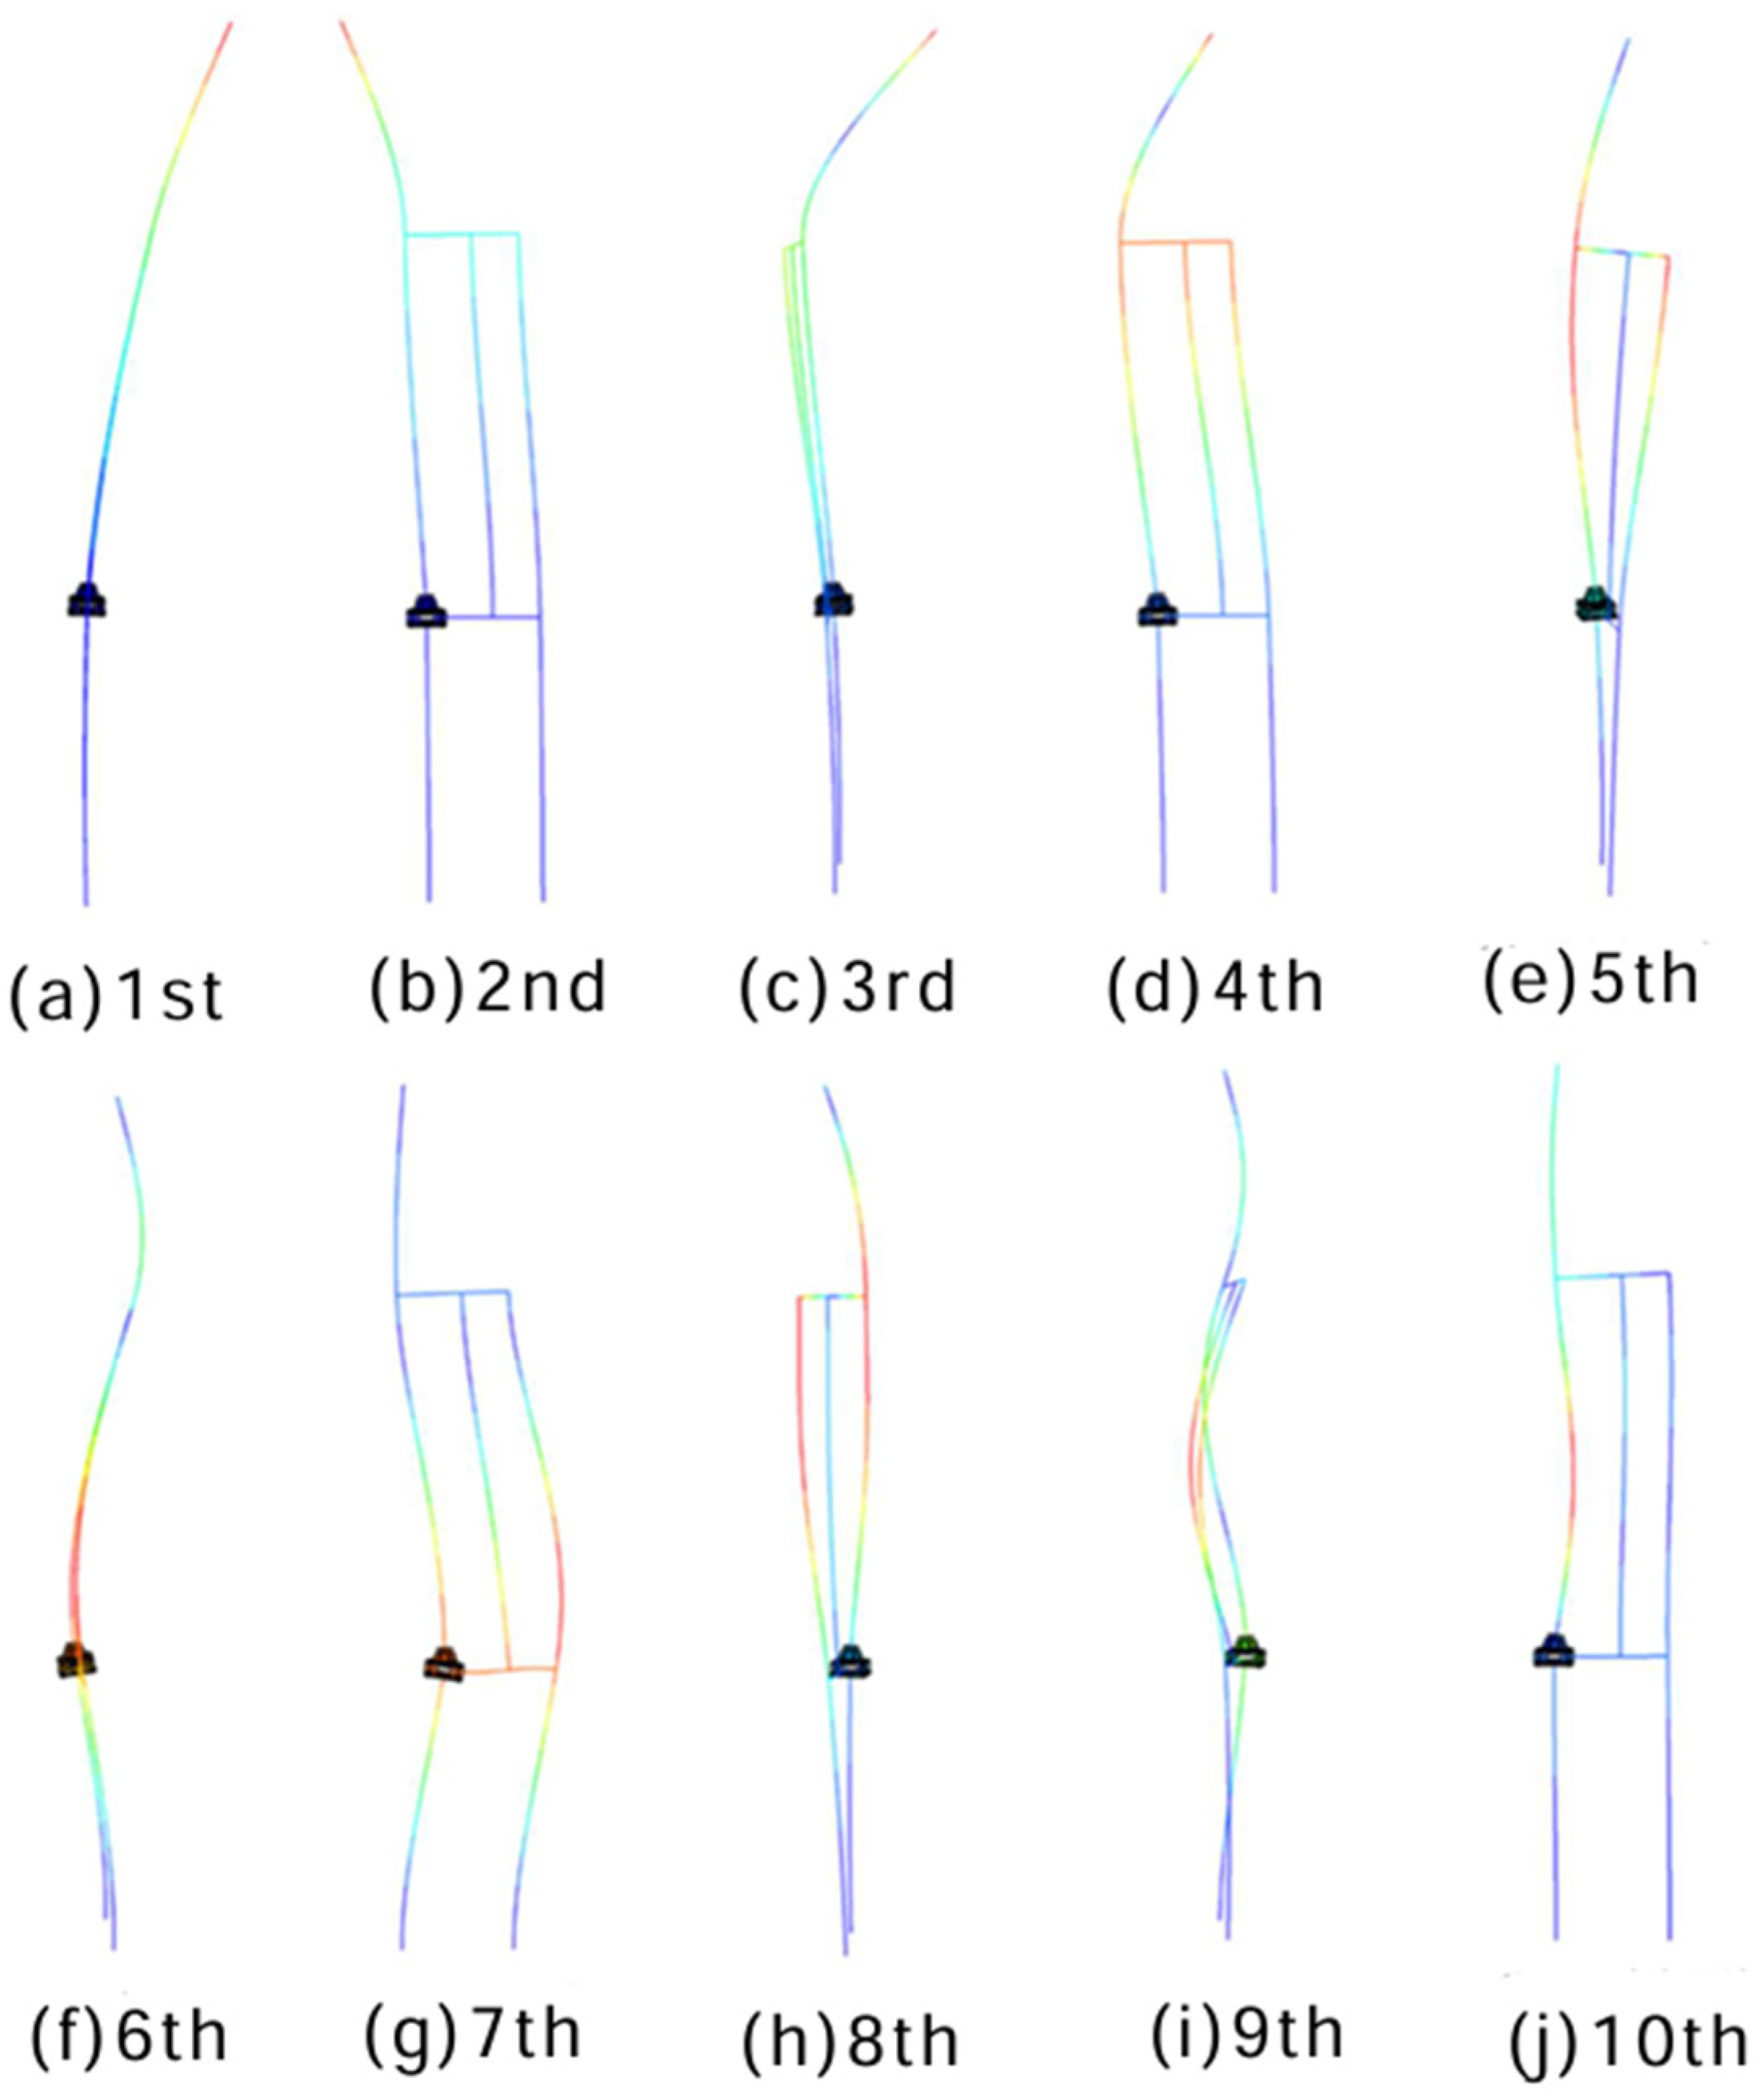
In this paper, the subspace iteration method [17,18] is used to perform modal analysis on the switch model. The damping of high-order modes is large, and the attenuation speed is fast, which has little effect on the response of the substation disconnect switch structure. Low-order modes have a higher energy concentration and response sensitivity, which can better reflect the inherent vibration characteristics and dynamic response characteristics of the structure. The first-order frequency of the structure obtained from the modal analysis is 0.82 Hz. Figure 4 shows the first 10-order modal shapes of the structure. The 1st, 3rd, 6th, and 9th order vibration modes are the first-order, second-order, third-order, and fourth-order translational motions of the entire structure along the y-axis, respectively. The 2nd, 4th, 7th, and 10th order vibration modes are the first-order, second-order, third-order, and fourth-order translational motions of the entire structure along the x-axis, respectively. The 5th and 8th order vibration modes are the first-order and second-order torsional motions of the entire structure around the z-axis, respectively. As shown in Figure 5, the measured first-order frequency of the disconnect switch structure is 0.75 Hz. The error between the first-order frequency of the model and the measured frequency of the structure is 9.33%, indicating that the established overall model of the disconnect switch structure is accurate and reliable.
Figure 4.
Disconnect switch structure measured first order frequency.
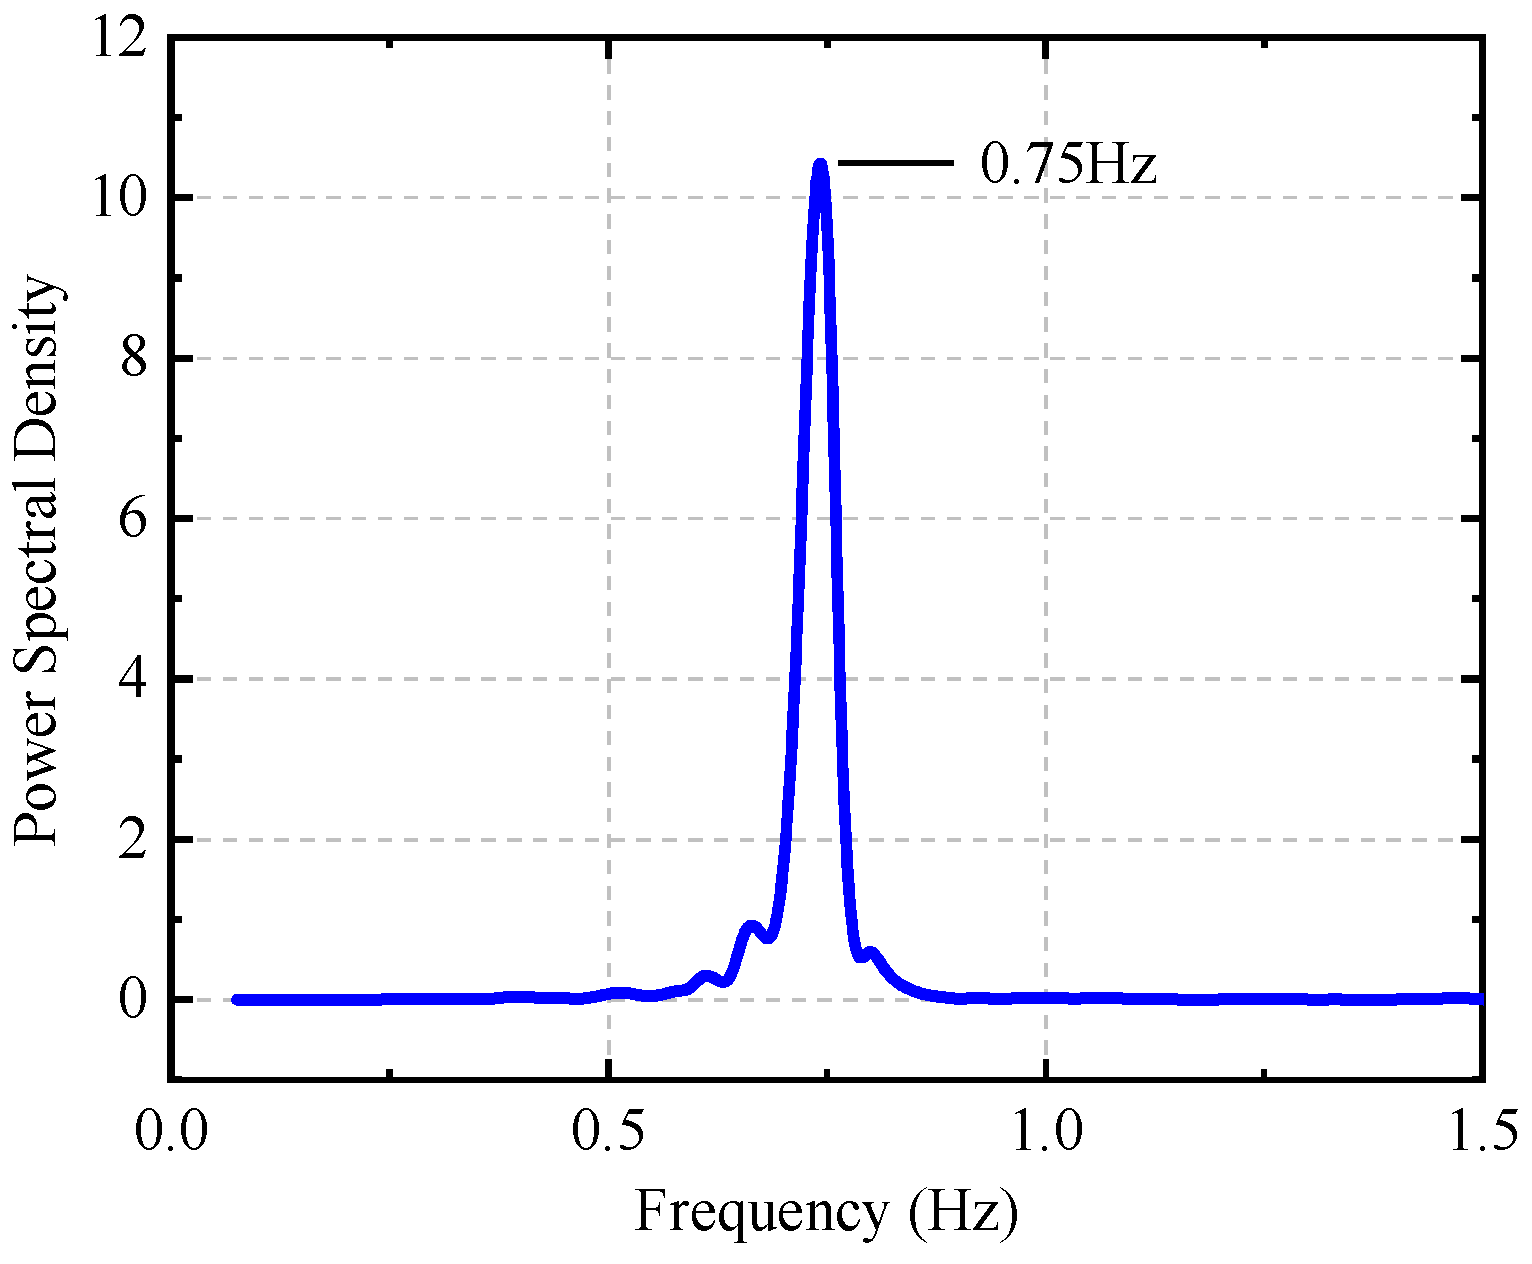
Figure 5.
Substation disconnect switch structure vibration mode.
It should be acknowledged that due to operational safety constraints at the live high-voltage substation and the lack of prototype dynamic loading equipment, obtaining measured dynamic responses (e.g., displacement, acceleration, or strain) under real wind loads is highly challenging. Consequently, the model validation relies on an indirect approach: the horizontal static test calibrates the local mechanical properties, while the field modal test verifies the global stiffness and mass distribution. Given that the critical fatigue-prone bolts are modeled with solid elements and calibrated pretension/contact conditions, the current approach ensures reliable dynamic stress estimation within the existing experimental constraints. Future work will include prototype dynamic testing when conditions permit.
2.2.3. Wind Load Application Method
Referring to the two-parameter model [19,20] of the horizontal wind load of the substation disconnect switch structure constructed by relevant scholars, the calculation formulas are shown in Equations (3) and (5). The average wind speed at a height of 10 m of the disconnect switch structure is taken as 3–33 m/s (with a wind speed increment of 3 m/s) to generate the wind load time-history at different heights of the structure. The application direction of the wind load is the y-axis direction (the most unfavorable wind direction) of the disconnect switch structure, and the specific application position of the wind load is shown in Figure 3b. The total time of each section of the wind load time-history is 600 s, and the time interval is 0.1 s.
In Equations (6) and (7), Fx(zi,t), Fx(zi,t) are the wind load time histories in the and directions at the height of the structure, respectively, Fx1, Fx2, Fy1, Fy2 are undetermined coefficients, which can be obtained by combining Equations (6)–(9). are the projected areas of the layer of the structure on the and axes respectively. is the average wind speed of the layer of the structure, which is calculated by Equation (5). v0 is the average wind speed at the reference height, and β is the ground roughness coefficient. ρ is the air density, taken as 1.225 kg/m3, z0 is the total height of the structure, zi and is the height of the layer of the structure.
In Equations (6)–(9), Fx(t), Fy(t), My(t), Mx(t) are the base shear force time-history and base bending moment time-history measured in the wind tunnel test.
2.2.4. Determination of Fatigue-Dangerous Points
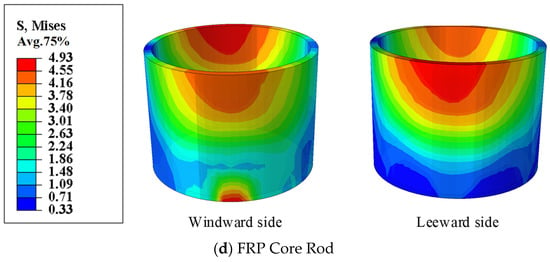
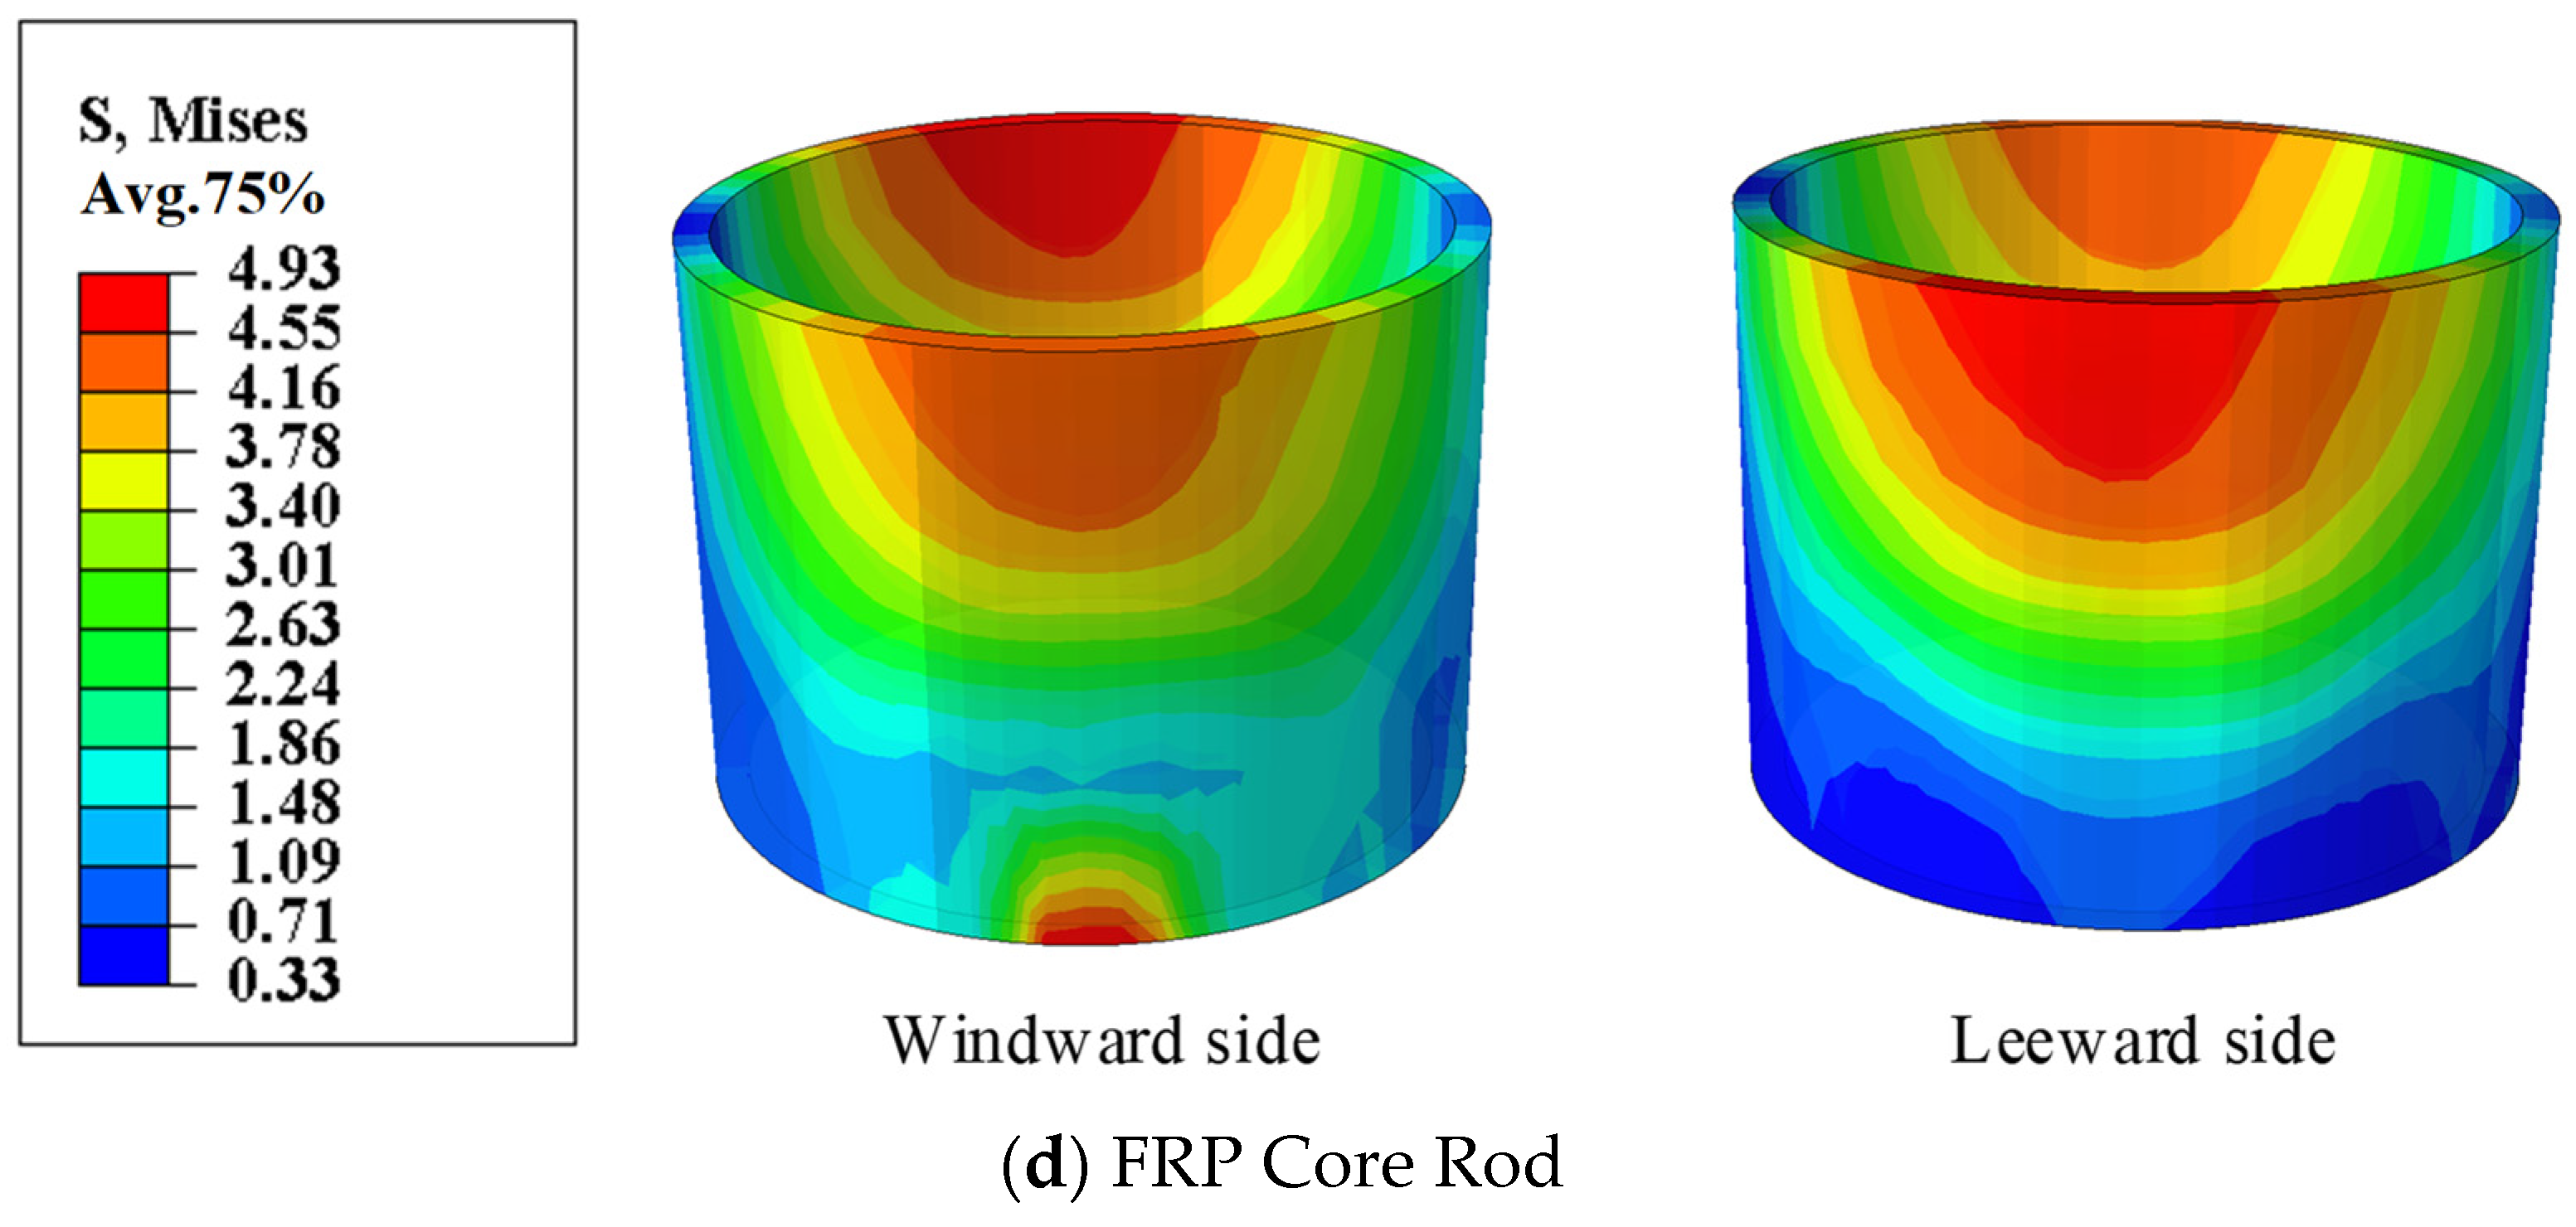
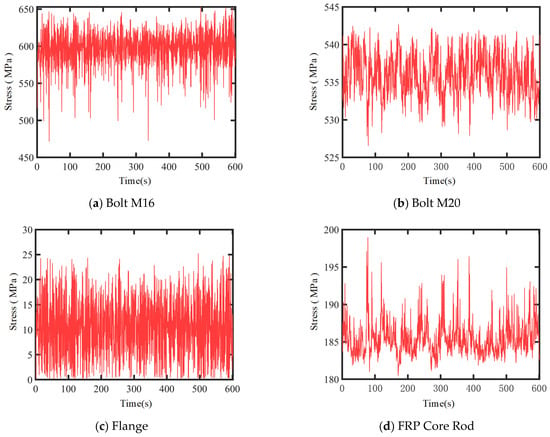
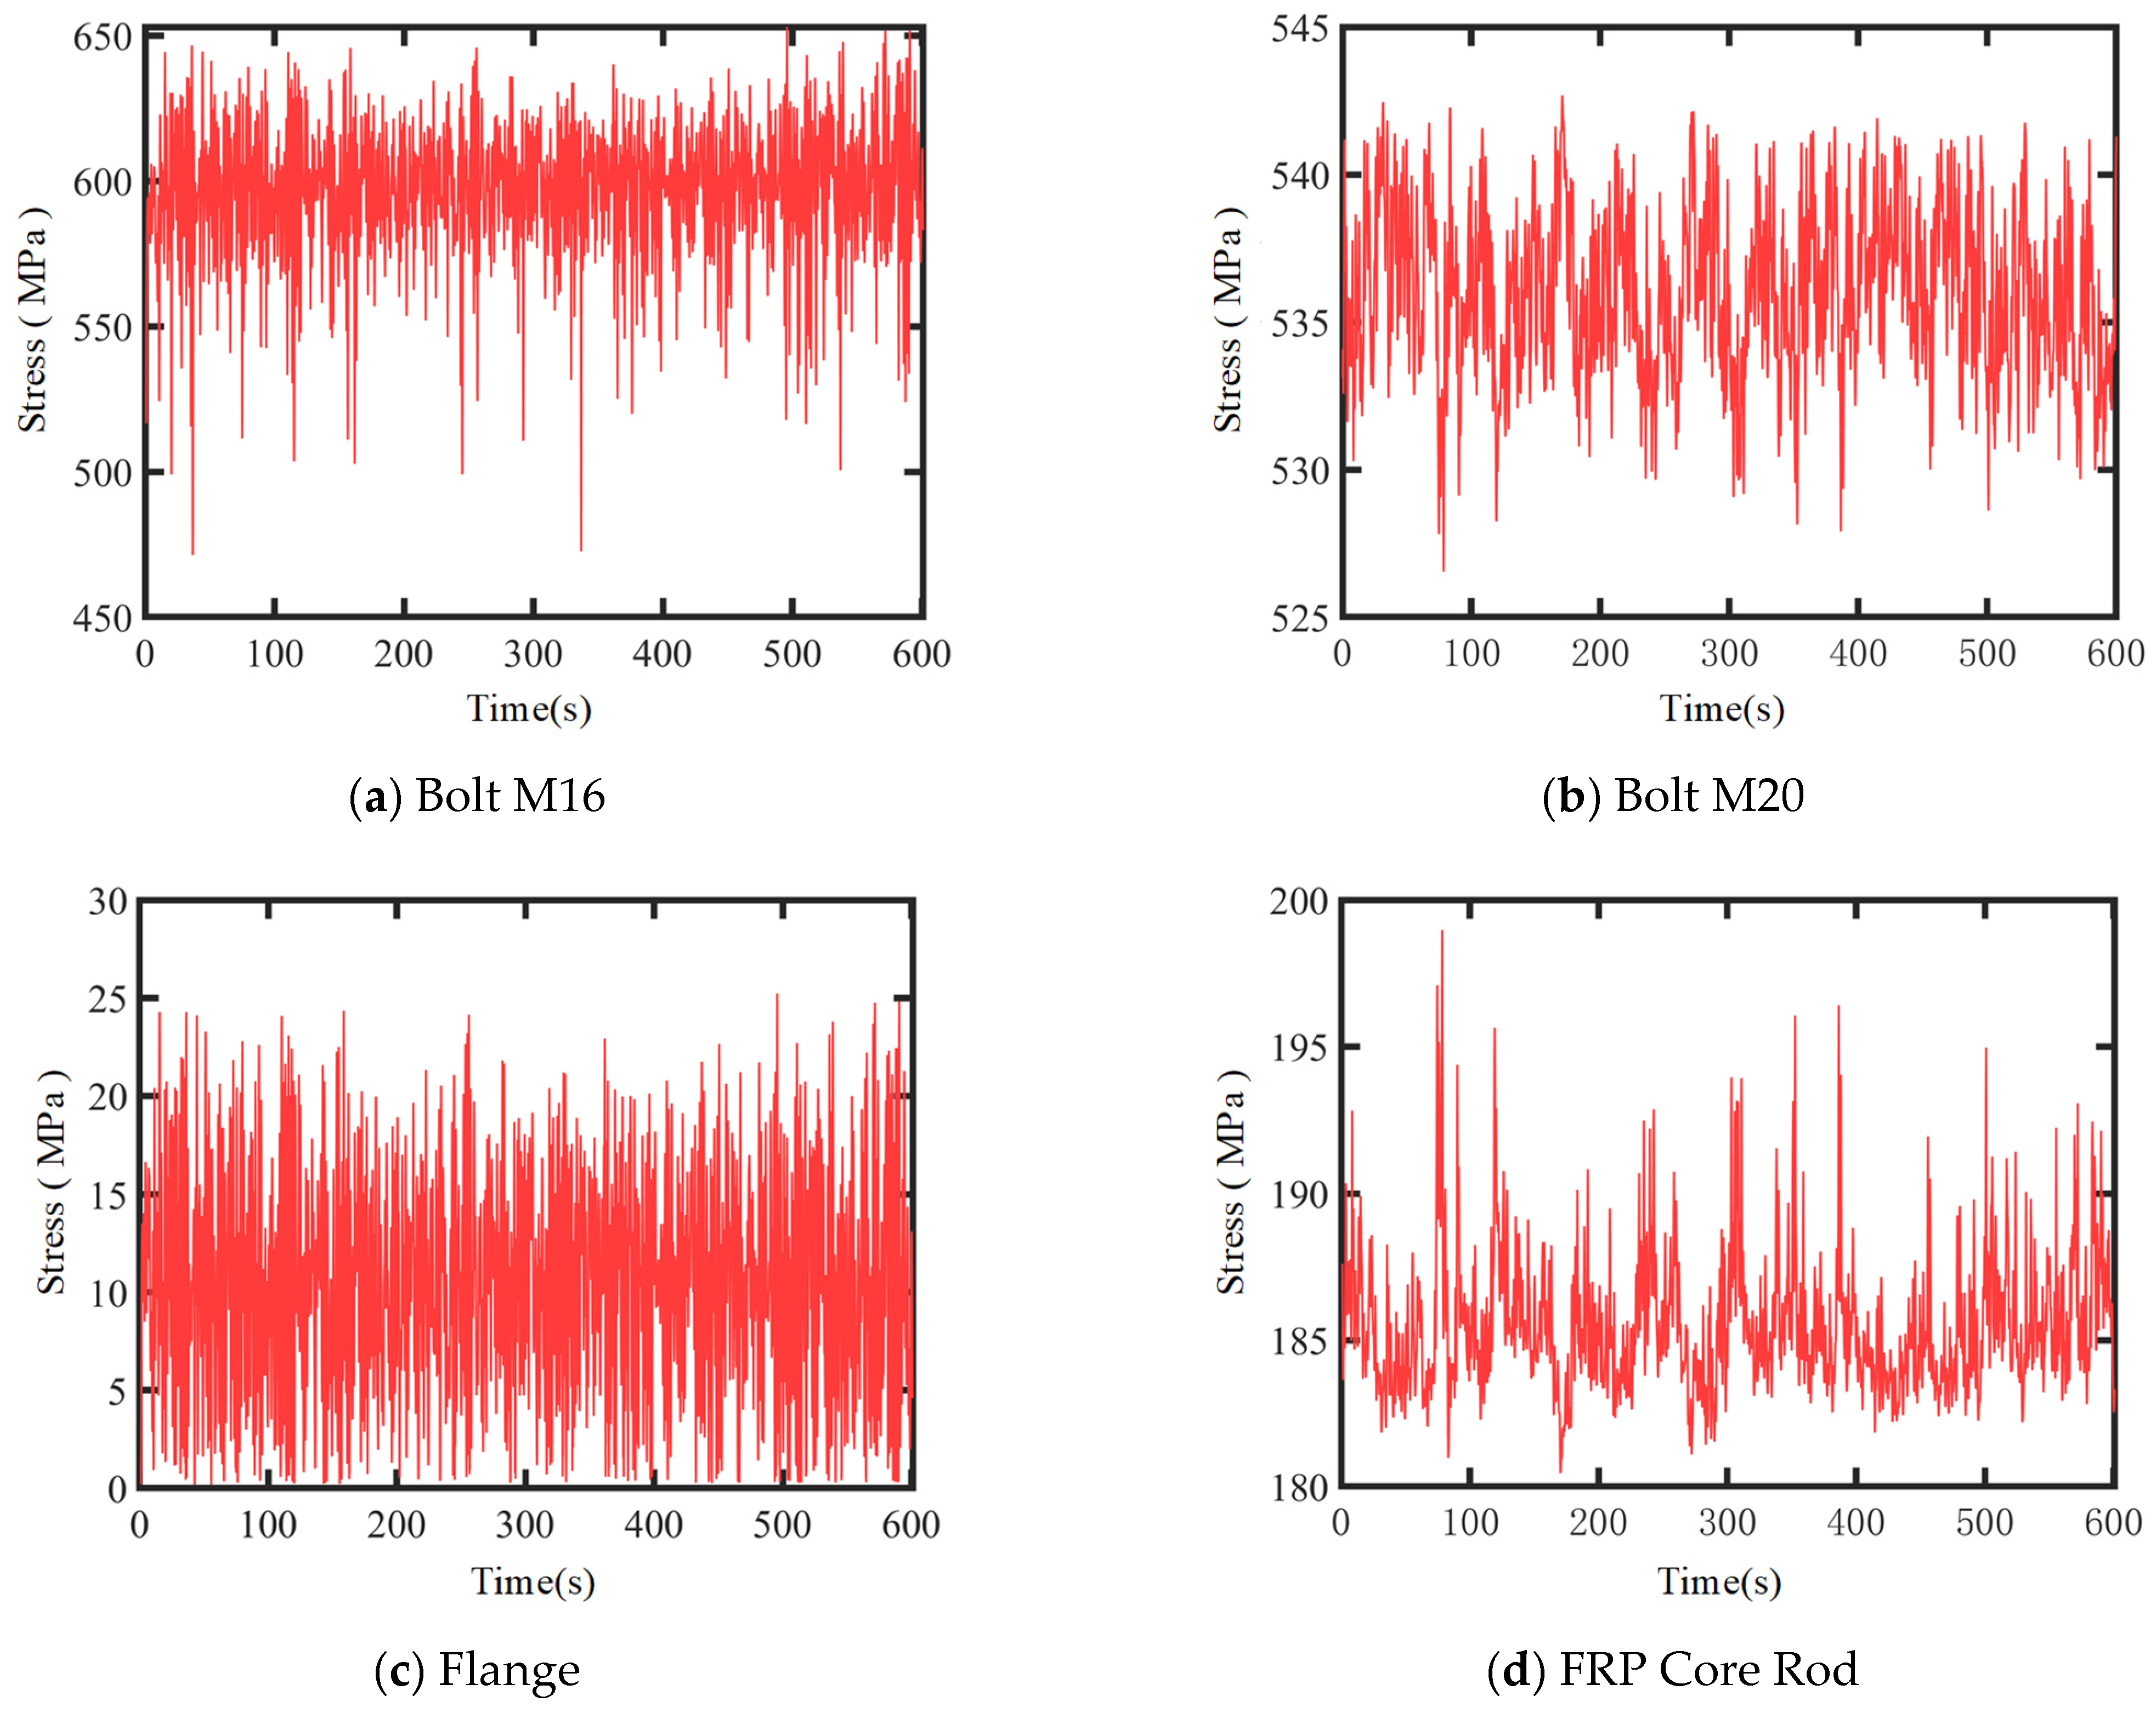
The implicit dynamic analysis method is used to conduct numerical simulation analysis on the substation disconnect switch structure. To determine the fatigue-dangerous points of the disconnect switch structure, the stress response of the structure when the average wind speed at a height of 10 m of the disconnect switch structure is 33 m/s is analyzed. First, the stress value distribution of the flange node of the disconnect switch structure is understood through the stress nephogram. Figure 6 shows the stress distributions of the M16 bolt, M20 bolt, flange, and FRP core rod at a certain moment when the average wind speed is 33 m/s. Second, the stress peak information is obtained according to the stress time-history curve of the structure.
Figure 6.
Schematic stress distribution at flange node.
Figure 7 illustrates the stress time histories of the windward surfaces of M16 bolt ①, M20 bolt ①, the flange plate windward surface, and the dangerous point on the windward surface of the FRP core rod at the flange node of the disconnect switch structure under an average wind speed of 33 m/s.
Figure 7.
The stress time history of the windward surface of each component of the flange node (33 m/s).
Based on the stress calculation results of each component of the disconnect switch structure, the following information is obtained: (1) The mean stress of the bolts is above 450 MPa, with the stress peak of M16 bolt ① being the largest at 790.12 MPa, which is lower than its yield strength (821.31 MPa). (2) The stress peak of the FRP core rod is 21.97 MPa, far lower than its yield strength (350 MPa). (3) The stress peak of the flange is 218.35 MPa, lower than its yield strength (285 MPa).
Overall, when the average wind speed at a 10 m height of the substation disconnect switch structure is ≤33 m/s, the overall structural stress remains in an elastic state.
2.2.5. Theory for Assessment of Wind-Induced Fatigue Damage
High-cycle fatigue failure may occur in the substation disconnect switch structure under long-term wind loads. The S–N curve can be adopted to characterize the fatigue life of this structure. The S–N curve describes the relationship between fatigue life and the number of cycles for a material subjected to different stress levels. Since the fatigue life of the structure has a large order of magnitude, the S–N curve is generally plotted on a logarithmic coordinate system for clearer and more intuitive data presentation. The S–N curve expression for each component is given in Equation (10). In this equation, the S–N curve corresponds to the FRP core rod when a = 4.73 and b = −0.09; the flange when a = 6.68 and b = −0.13; and the bolt when a = 7.17 and b = −0.23.
The fatigue cumulative damage theory describes the time-dependent damage accumulation process of structures under stress. Under constant-amplitude stress, if the fatigue damage induced by each cycle is D = 1/N, the damage value after n stress cycles is expressed as: D = n/N. In this study, Miner’s linear cumulative damage theory is adopted. This theory assumes that fatigue damage is generated in each stress cycle during fatigue loading. The fatigue damage caused by different stress magnitudes is independent and insensitive to the sequence of stress levels, and fatigue damage can be linearly superposed. Fatigue failure occurs when the accumulated damage reaches the predefined critical value.
After processing by the rainflow counting method, the stress time history of the disconnect switch structure is converted into multiple sets of fatigue loads with different mean stresses. The magnitude of the mean stress affects the fatigue life of the material. In addition, the S–N curve is obtained from fatigue tests under zero mean stress (stress ratio R = −1). Therefore, the equal-life curve is required to convert the fatigue life corresponding to different stress amplitudes and mean stresses. In this work, the Goodman linear model is adopted for mean stress correction, as shown in Equation (11). In the equation, S−1 denotes the fatigue limit of the material at a stress ratio R = −1; Sa is the stress amplitude of the material; Su is the ultimate tensile strength of the material; and Sm represents the mean stress of the material.
3. Fatigue Damage Analysis and Life Prediction for Structures in Large-Scale Steady Strong Wind Regions
3.1. Probabilistic Statistics of Extreme Wind Speeds
The Weibull distribution model is selected to fit the parent wind speed of the area where the substation disconnect switch structure is located. Its probability density function is:
where v is the average wind speed, k is the shape parameter, and c is the scale parameter. These two parameters can be estimated by fitting the measured wind speed data.
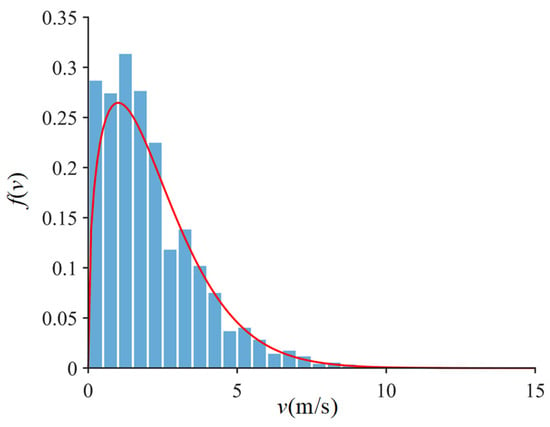
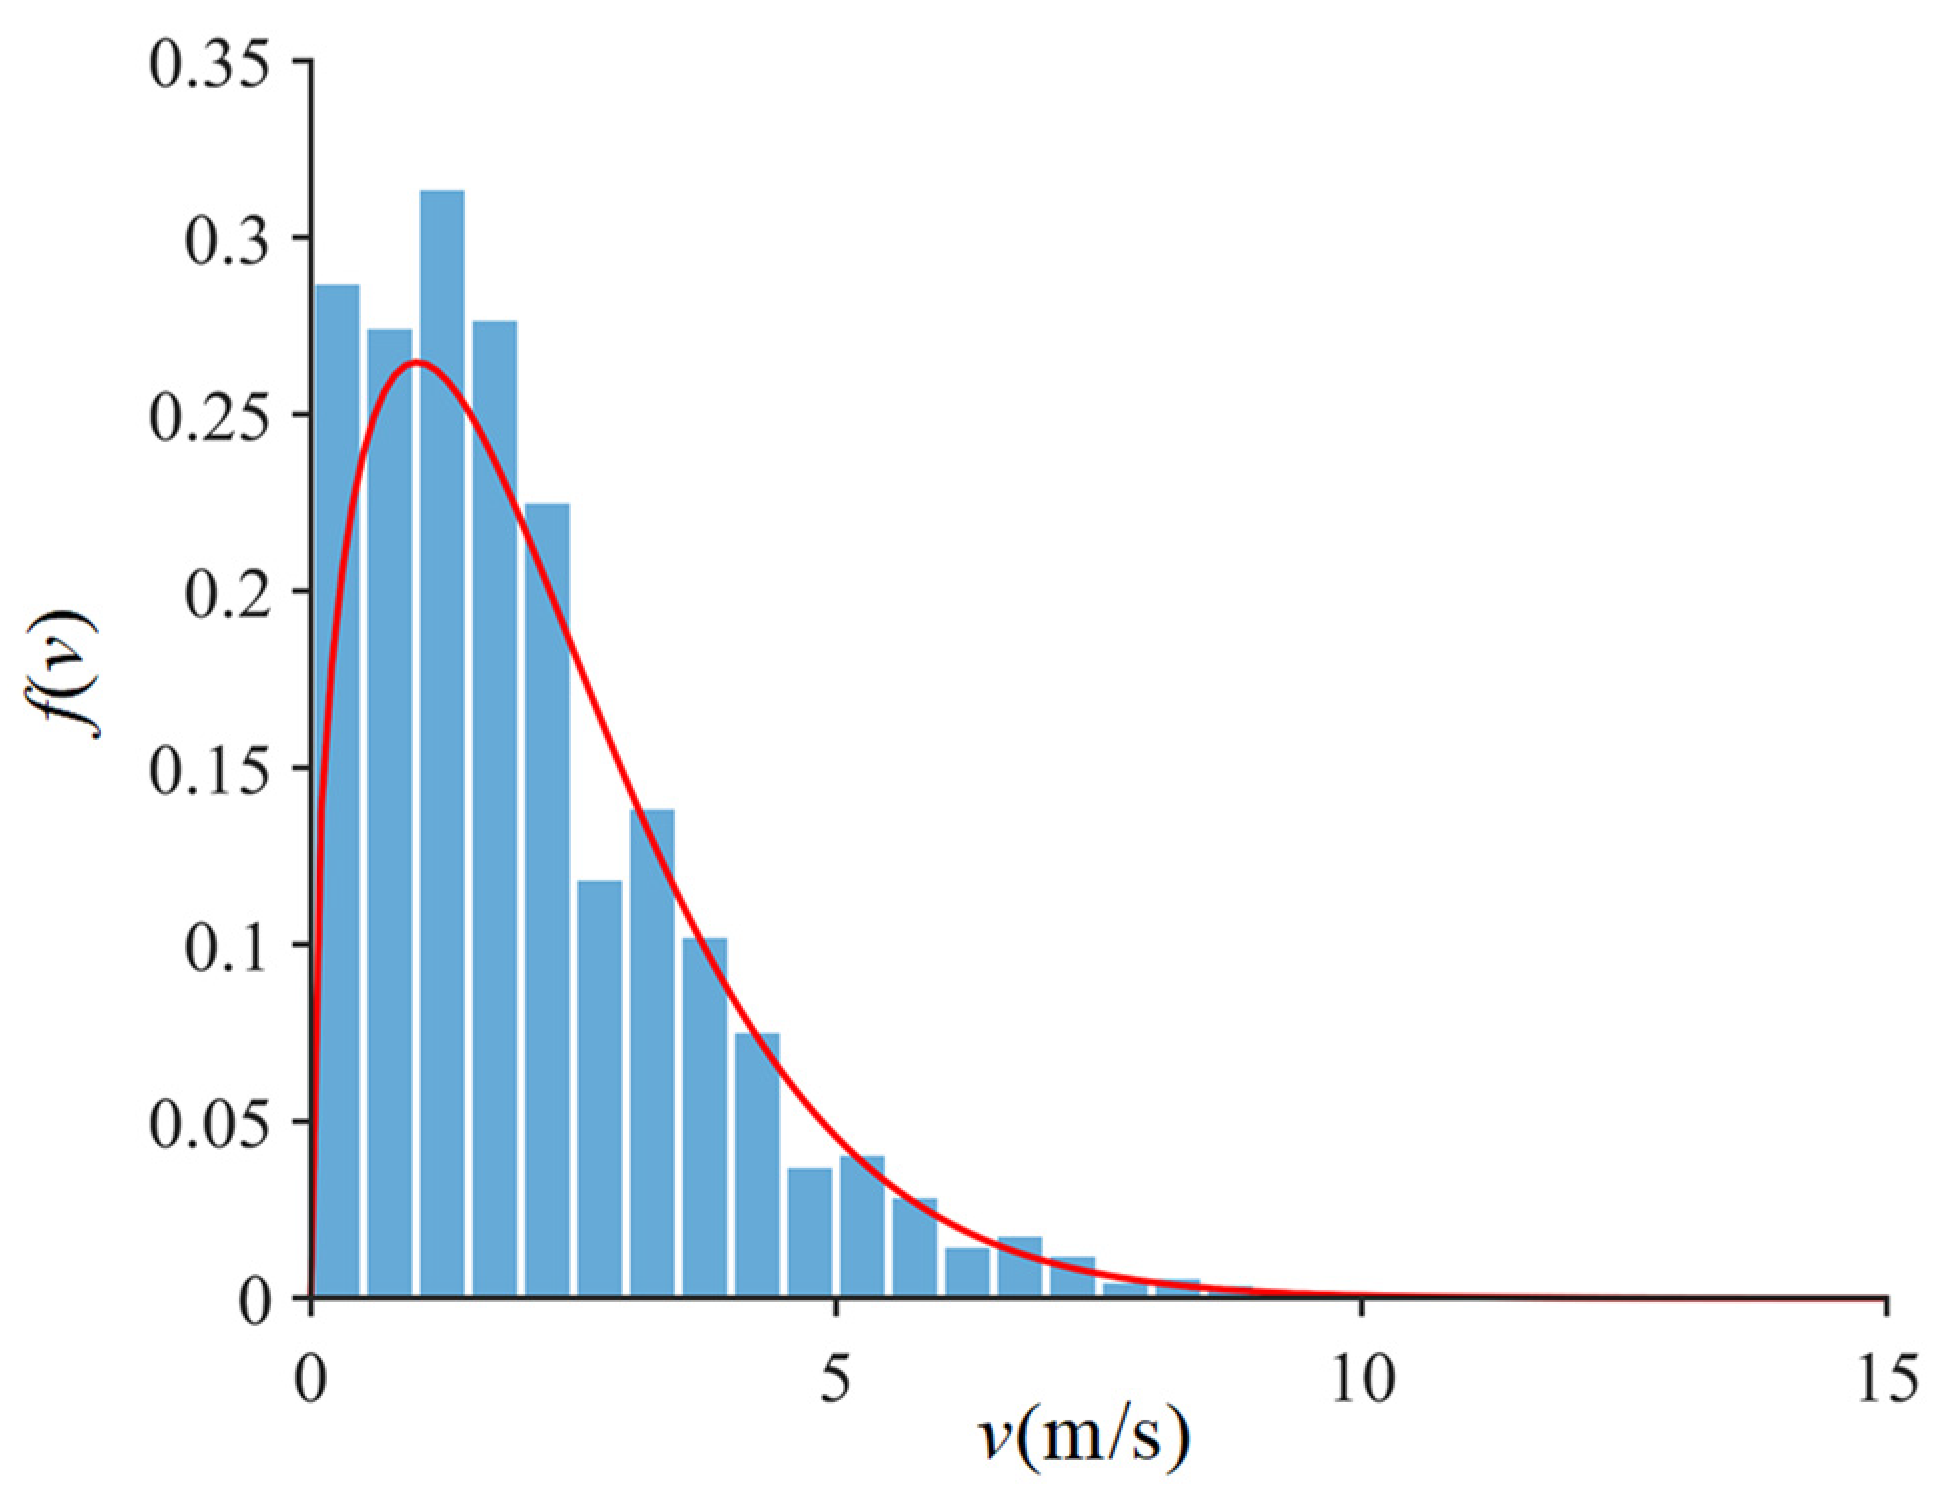
Using the meteorological monitoring data of a substation in Inner Mongolia Autonomous Region from 2018 to 2022 as samples, 80,000 sets of valid data are obtained after removing abnormal data. Figure 8 shows the wind speed frequency distribution derived from the measured substation wind speed data and the fitted Weibull function curve. The least-square method is used to estimate the parameters of the Weibull distribution model, resulting in \( c = 2.56\) and \( k = 1.40\) . From the wind probability distribution diagram, it can be seen that the wind speed at a 10 m height is concentrated between 2 m/s and 15 m/s. According to the Code for Loads on Building Structures (GB50009-2012), the design wind speed at a 10 m height in the local area with a 50-year return period is 29.92 m/s.
Figure 8.
Histogram of wind speed frequency distribution.
The above wind speed distribution curve is discretized into 10 wind speed values, with each 3 m/s interval forming a wind speed probability interval (the 1 m/s–3 m/s interval is taken as the average wind speed of 3 m/s, and so on up to 30 m/s). The probabilities of each wind speed discrete interval are shown in Table 2. The rationality of the 3 m/s interval is justified by the probability distribution. For the high-wind tail (v > 24 m/s), despite larger stress amplitudes, the occurrence probability is below 10−8, making its damage contribution negligible. For the dominant range (3–15 m/s), the stress variation within 3 m/s is limited. Thus, this discretization provides sufficient accuracy.
Table 2.
Wind speed dispersion.
3.2. Life Load Spectrum of Fatigue-Dangerous Points
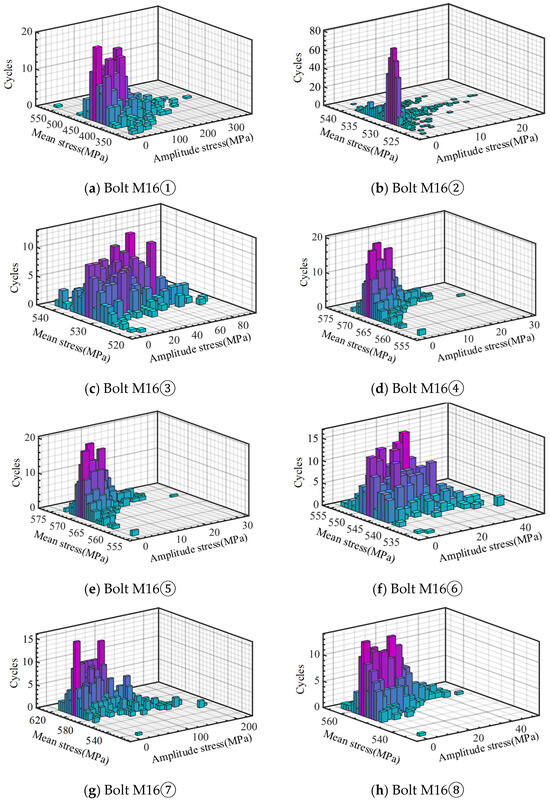
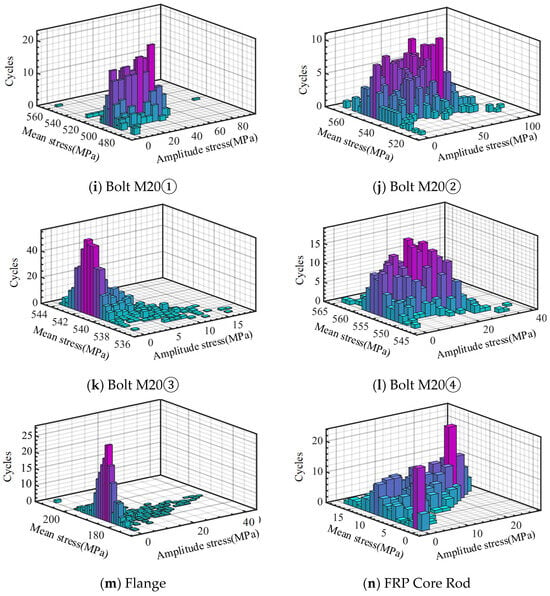
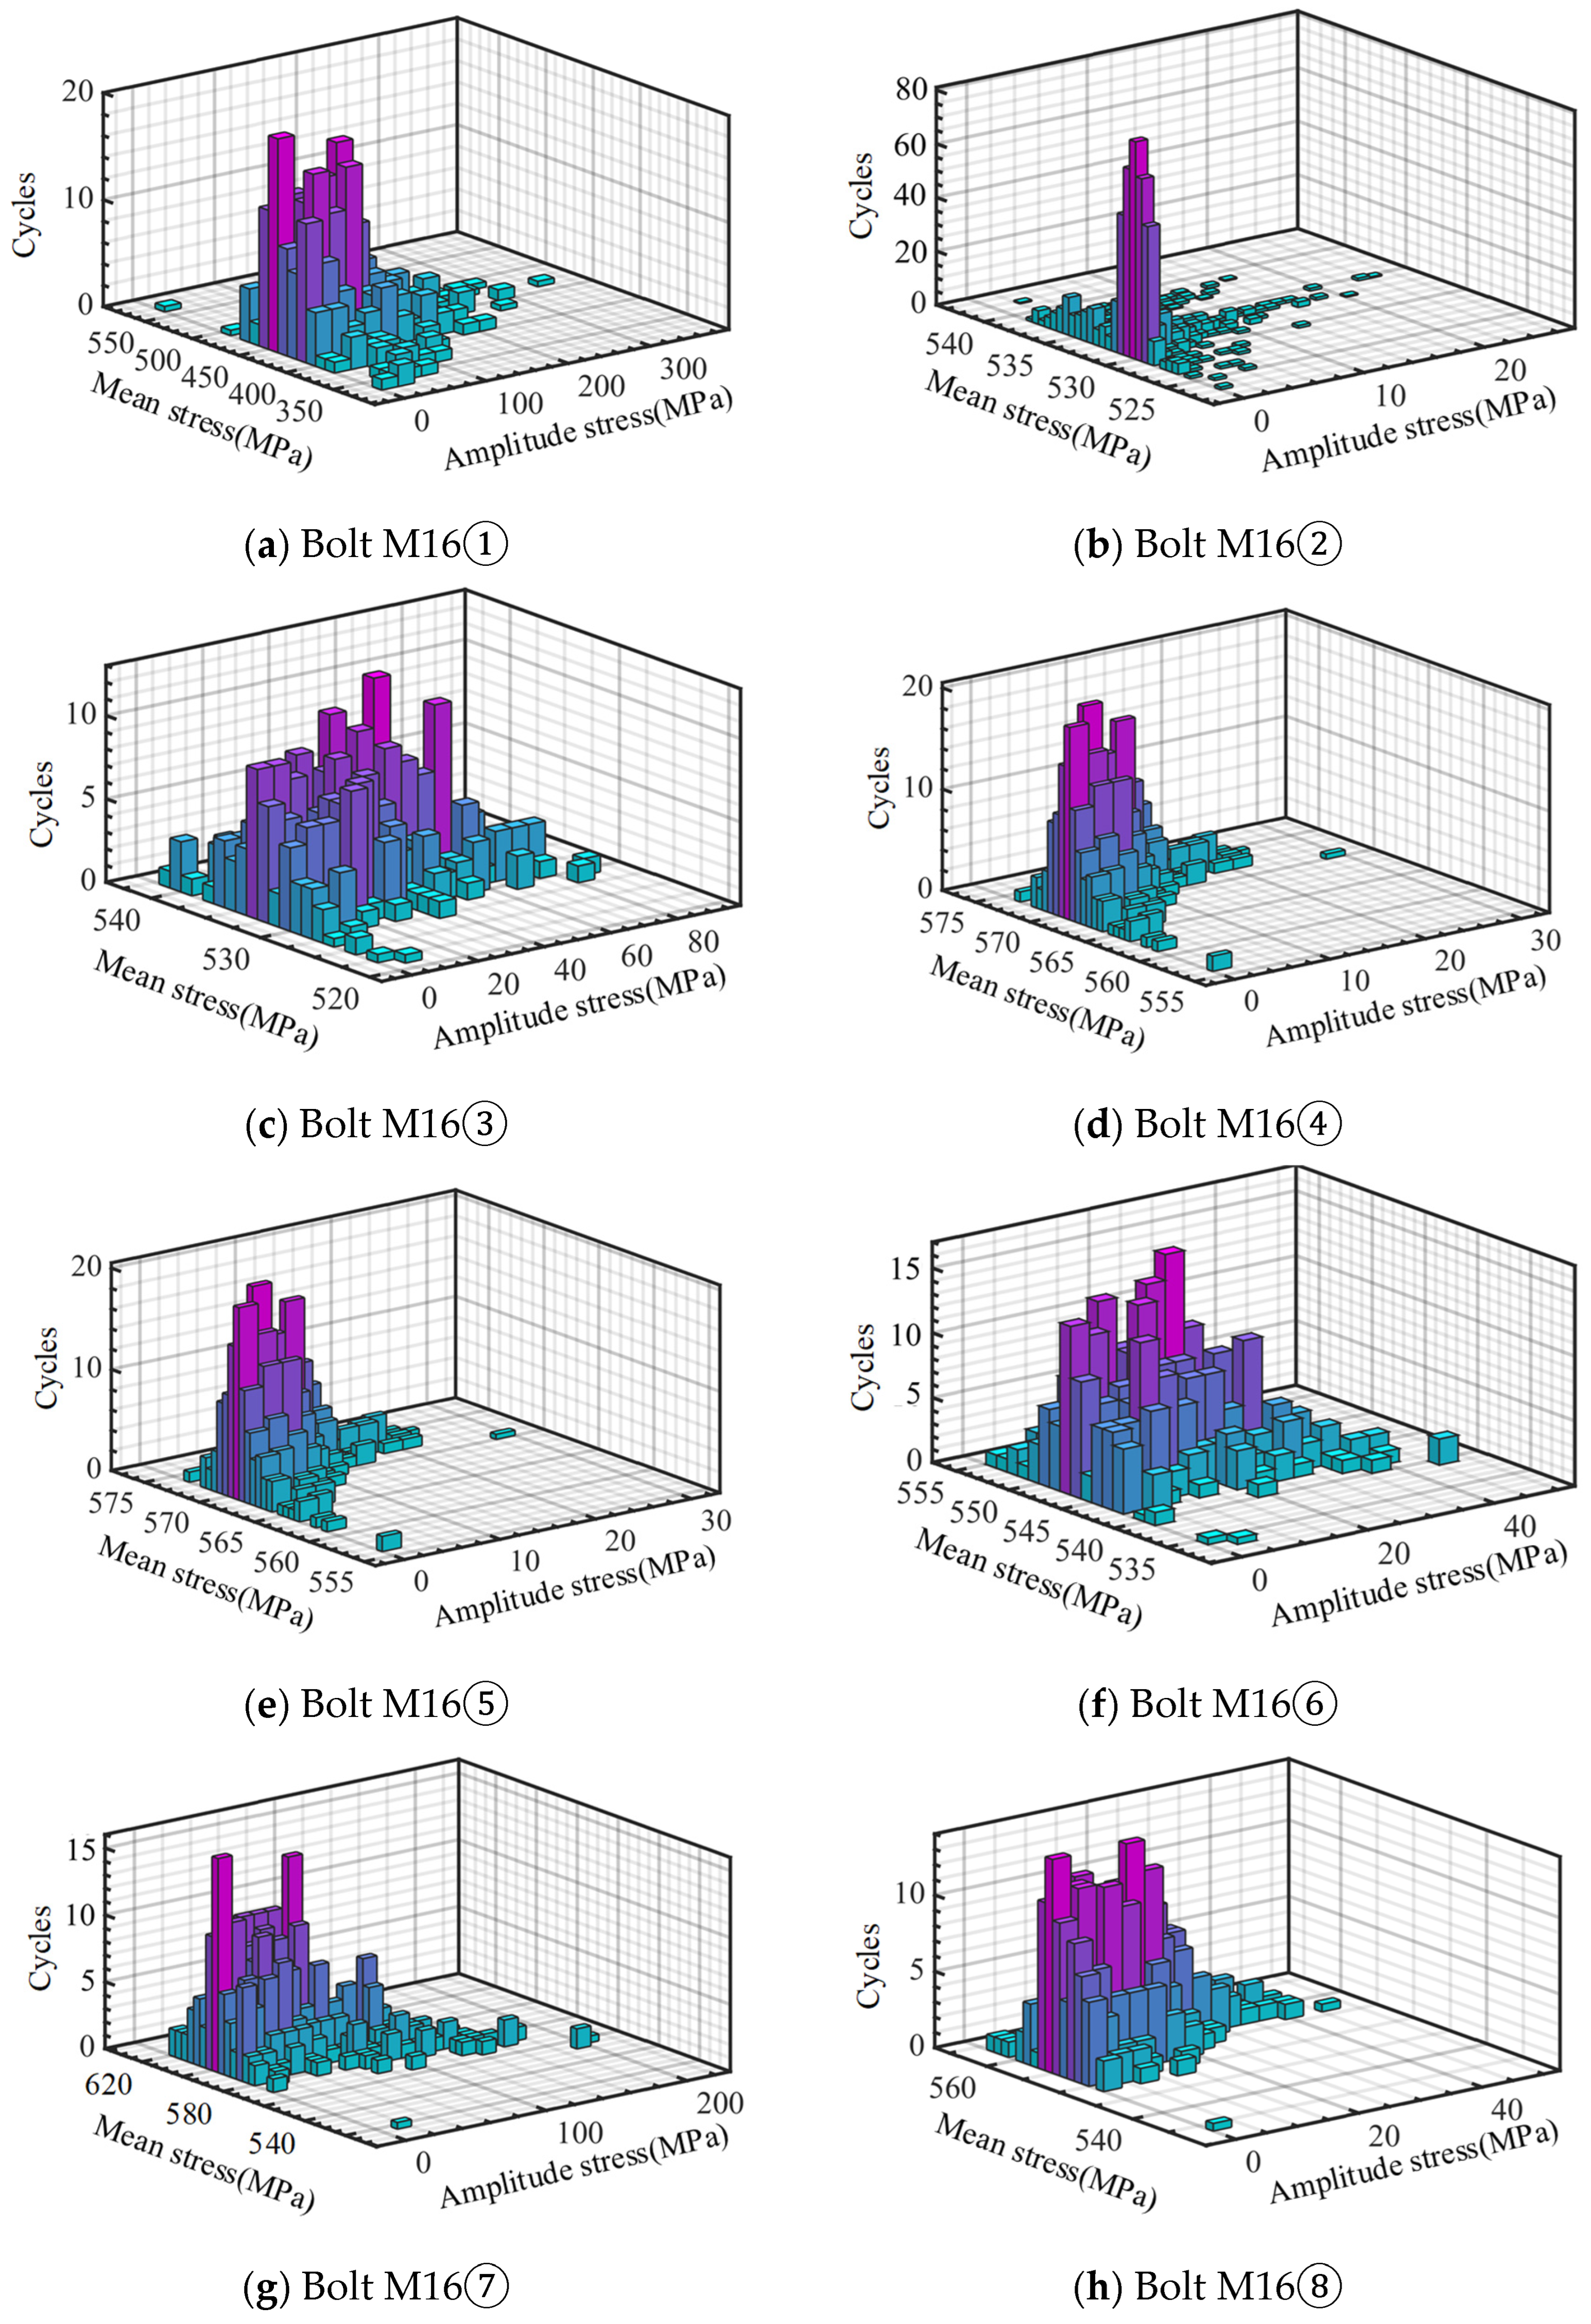
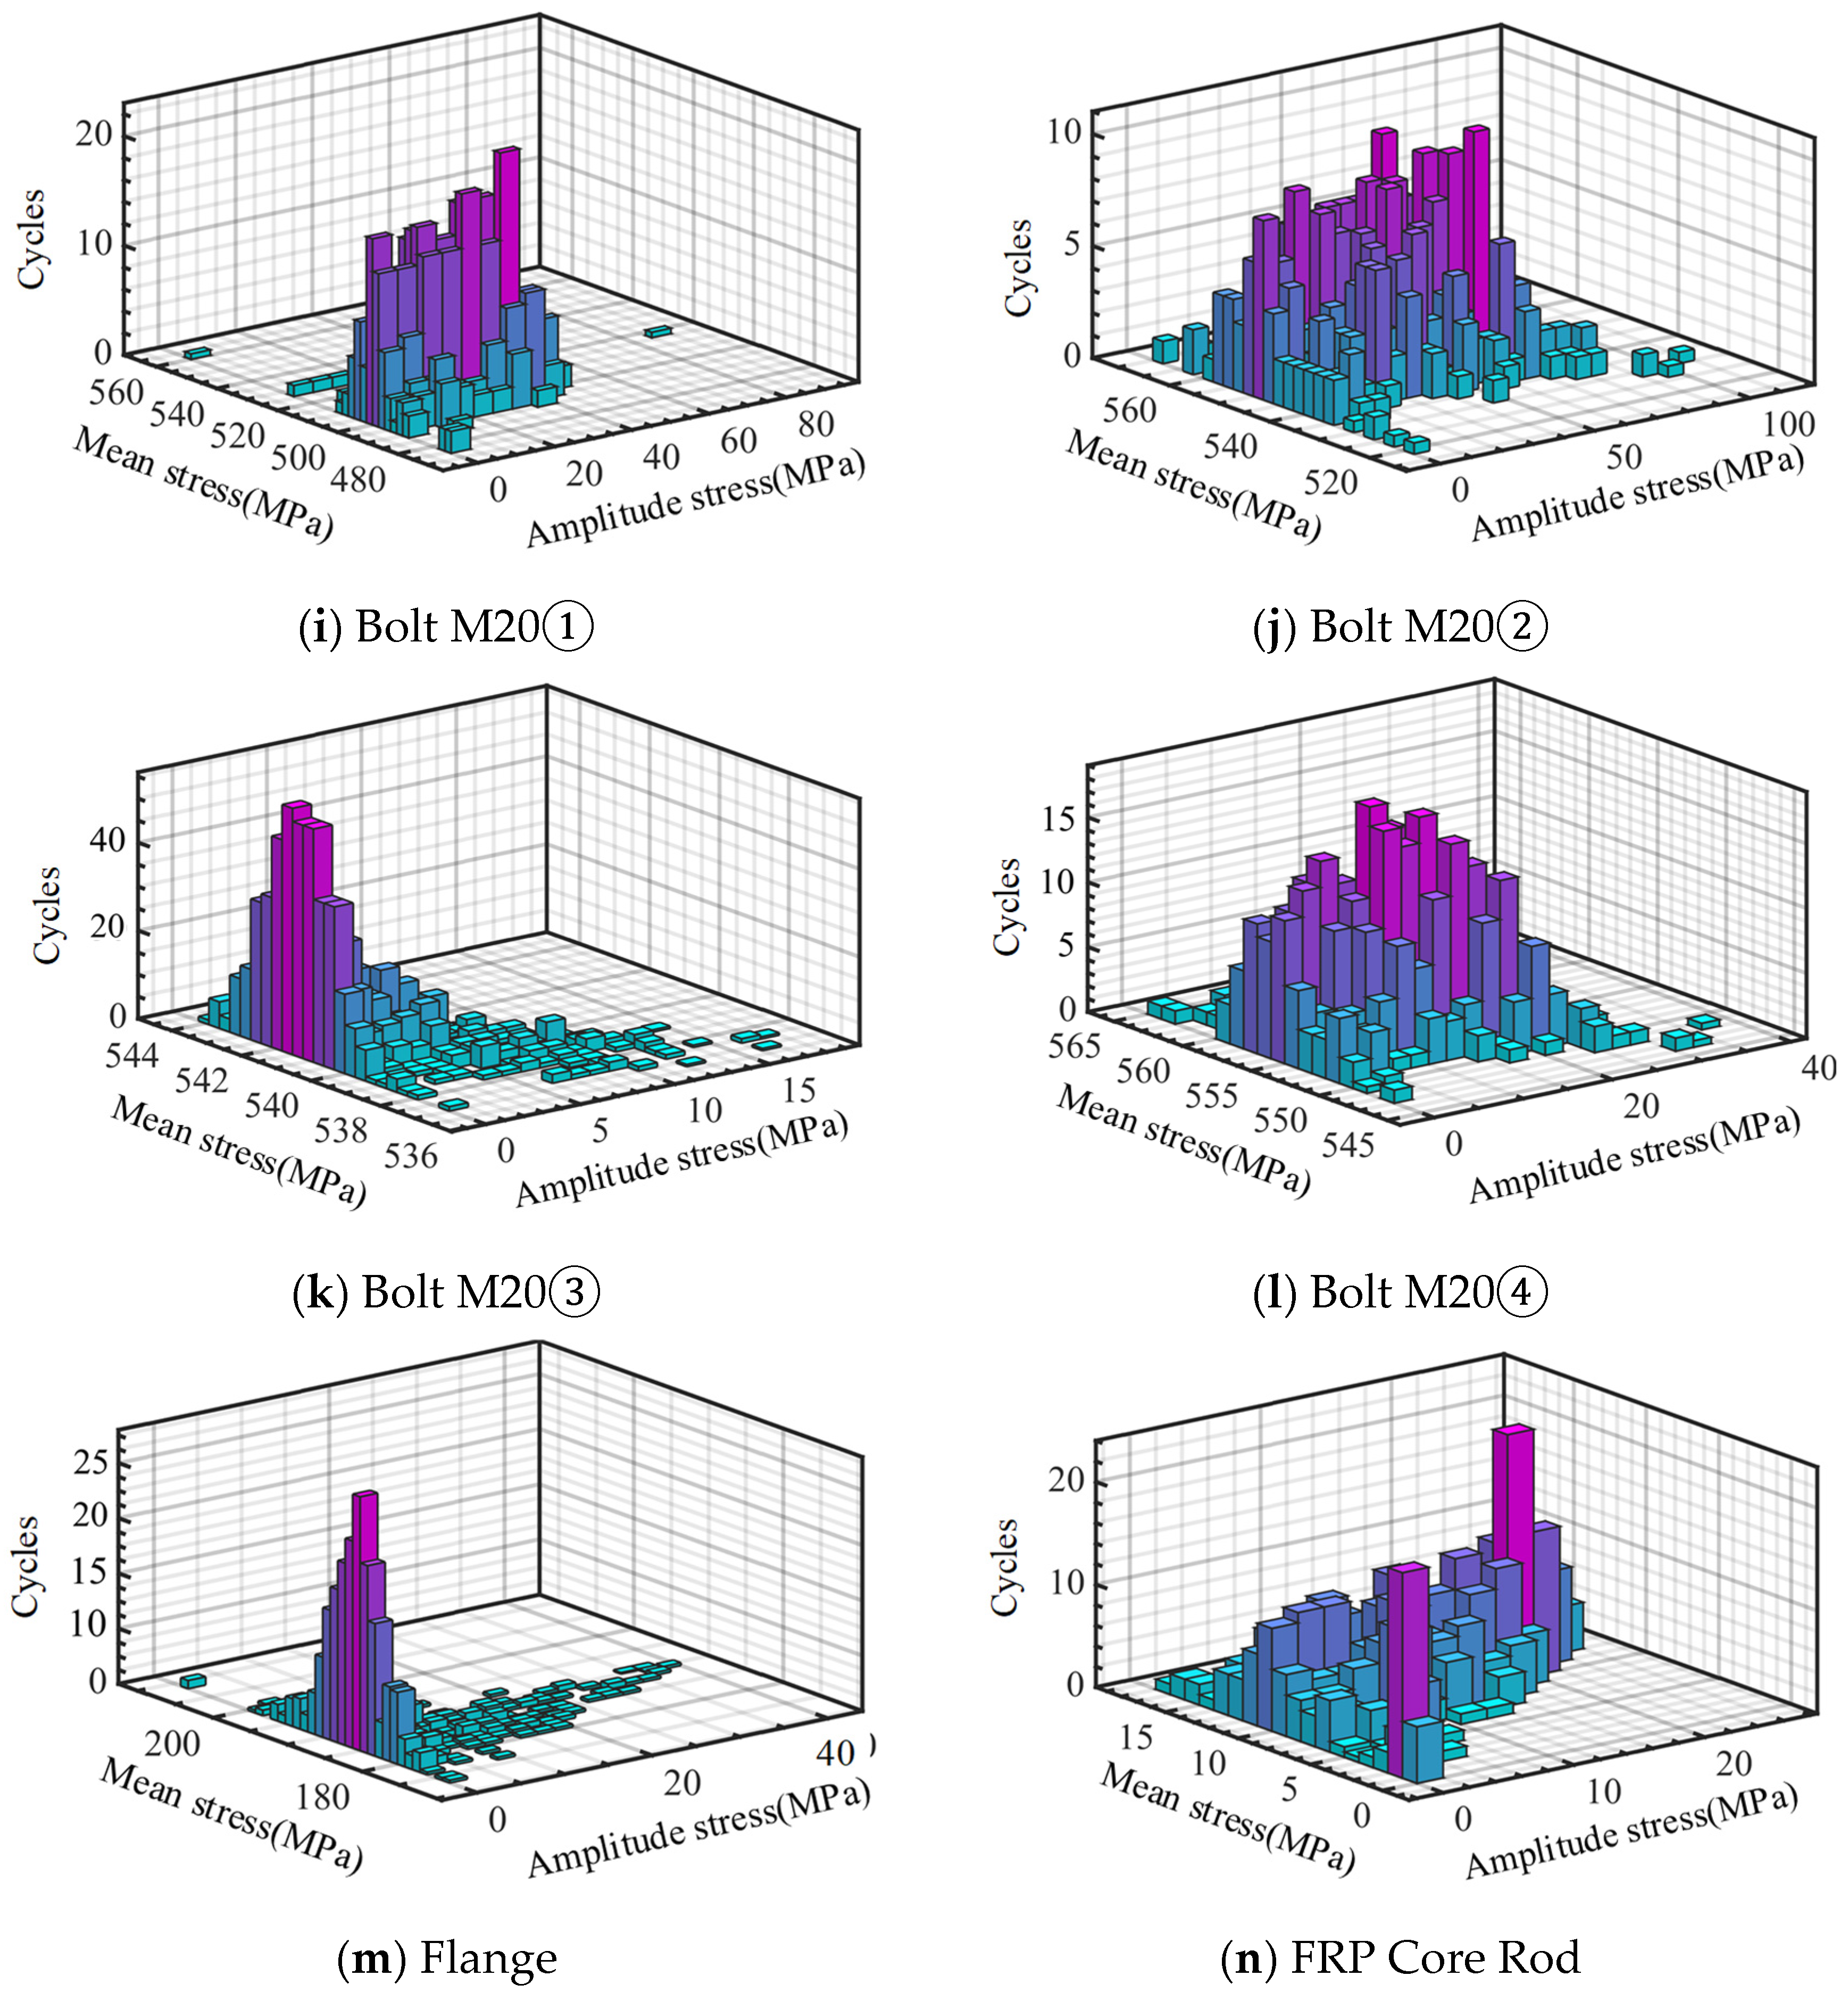
There are 10 working conditions for the wind-induced fatigue analysis of structures in large-scale steady strong wind regions, corresponding to average wind speeds of 3 m/s to 30 m/s (increments of 3 m/s). The stress time-history of the disconnect switch structure obtained from implicit dynamic analysis is processed using the rain-flow counting method to obtain the fatigue load spectrum. As shown in Figure 9, due to space limitations, only the load spectrum of the fatigue-dangerous points under the action of an average wind speed of 30 m/s for 10 min is displayed here.
Figure 9.
Fatigue dangerous point load spectrum.
3.3. Fatigue Analysis Results
The Goodman mean stress correction is performed on the fatigue-dangerous point load spectrum of the substation disconnect switch structure. The fatigue damage values and fatigue lives of the structure are calculated based on the S-N curve and the Miner linear cumulative damage theory. The action time of the 10-min large-scale steady strong wind is allocated according to the wind speed probabilities of the 10 working conditions (3 m/s to 30 m/s, with a wind speed increment of 3 m/s), and the fatigue damage values of the easily fatigue-damaged parts of the structure under each working condition are calculated. The structural fatigue damage values and fatigue lives caused by pulsating wind loads within the 50-year design service life are shown in Table 3. The analysis results are as follows:
Table 3.
Structural fatigue damage under fluctuating wind load in steady strong wind regions.
- (1)
- The substation disconnect switch structure in a large-scale steady strong wind environment may experience fatigue failure within the 50-year design service life. Specifically, fatigue failure first occurs in M16 bolt ①, with a fatigue damage value of 6.04 and a predicted life of 8.28 years. Fatigue failure then occurs in M16 bolt ⑤, with a fatigue damage value of 5.90 and a predicted life of 8.48 years. Except for M16 bolts ① and ⑤, the total damage D of other parts within the design service life is much less than 1, and their predicted fatigue lives are all longer than the 50-year design service life.
- (2)
- The fatigue failure of M16 bolts ① and ⑤ at the flange node of the substation disconnect switch structure does not directly lead to the collapse of the entire structure. However, the reduction in flange node stiffness after bolt fatigue failure will cause the structure to undergo greater deformation under wind loads, especially the displacement response at the top of the structure will be more significant. This will affect the closing process of the disconnect switch and may even cause power outages.
4. Fatigue Damage Analysis and Life Prediction for Structures in Typhoon Regions
4.1. Probabilistic Statistics of Extreme Wind Speeds
Studies have shown that the Weibull distribution has limitations in representing the characteristics of strong wind regions. Therefore, if the Weibull distribution is used in the application of the crossing rate method, the accuracy of the wind speed probability distribution model may be affected. To more accurately capture and simulate the wind speed distribution in typhoon environments, especially in strong wind speed regions, a mixed distribution [21,22] is used to construct the extreme wind speed probability distribution model for typhoon regions in this paper.
In this mixed distribution model, the Weibull distribution is used to describe the distribution below a specified wind speed threshold, while the Generalized Pareto Distribution (GPD) is used for the distribution exceeding this threshold. The extreme value theory provides an asymptotic argument for the GPD distribution, proving its applicability in describing the excess distribution beyond a specified high threshold. In addition, many parts of the literature [22,23,24] have applied the GPD distribution to the modeling of non-directional wind speeds and confirmed its effectiveness in the statistical modeling of extreme wind speeds.
Based on the probability distribution of key parameters of measured typhoon data in the Shenzhen area, this paper uses the Monte-Carlo method to extract virtual typhoon parameters [25,26], combines the Yan Meng (YM) wind field model to obtain typhoon data in the Shenzhen area, and applies piecewise Weibull distribution and GPD distribution for statistics to clarify the probability distribution characteristics of typhoon wind climates. According to the design code for building structure loads, the design wind speed at a 10 m height of the substation disconnect switch structure with a 50-year return period is 30.6 m/s, and the maximum simulated typhoon wind speed in this paper is 30.4 m/s.
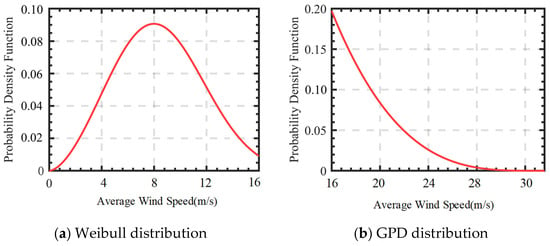
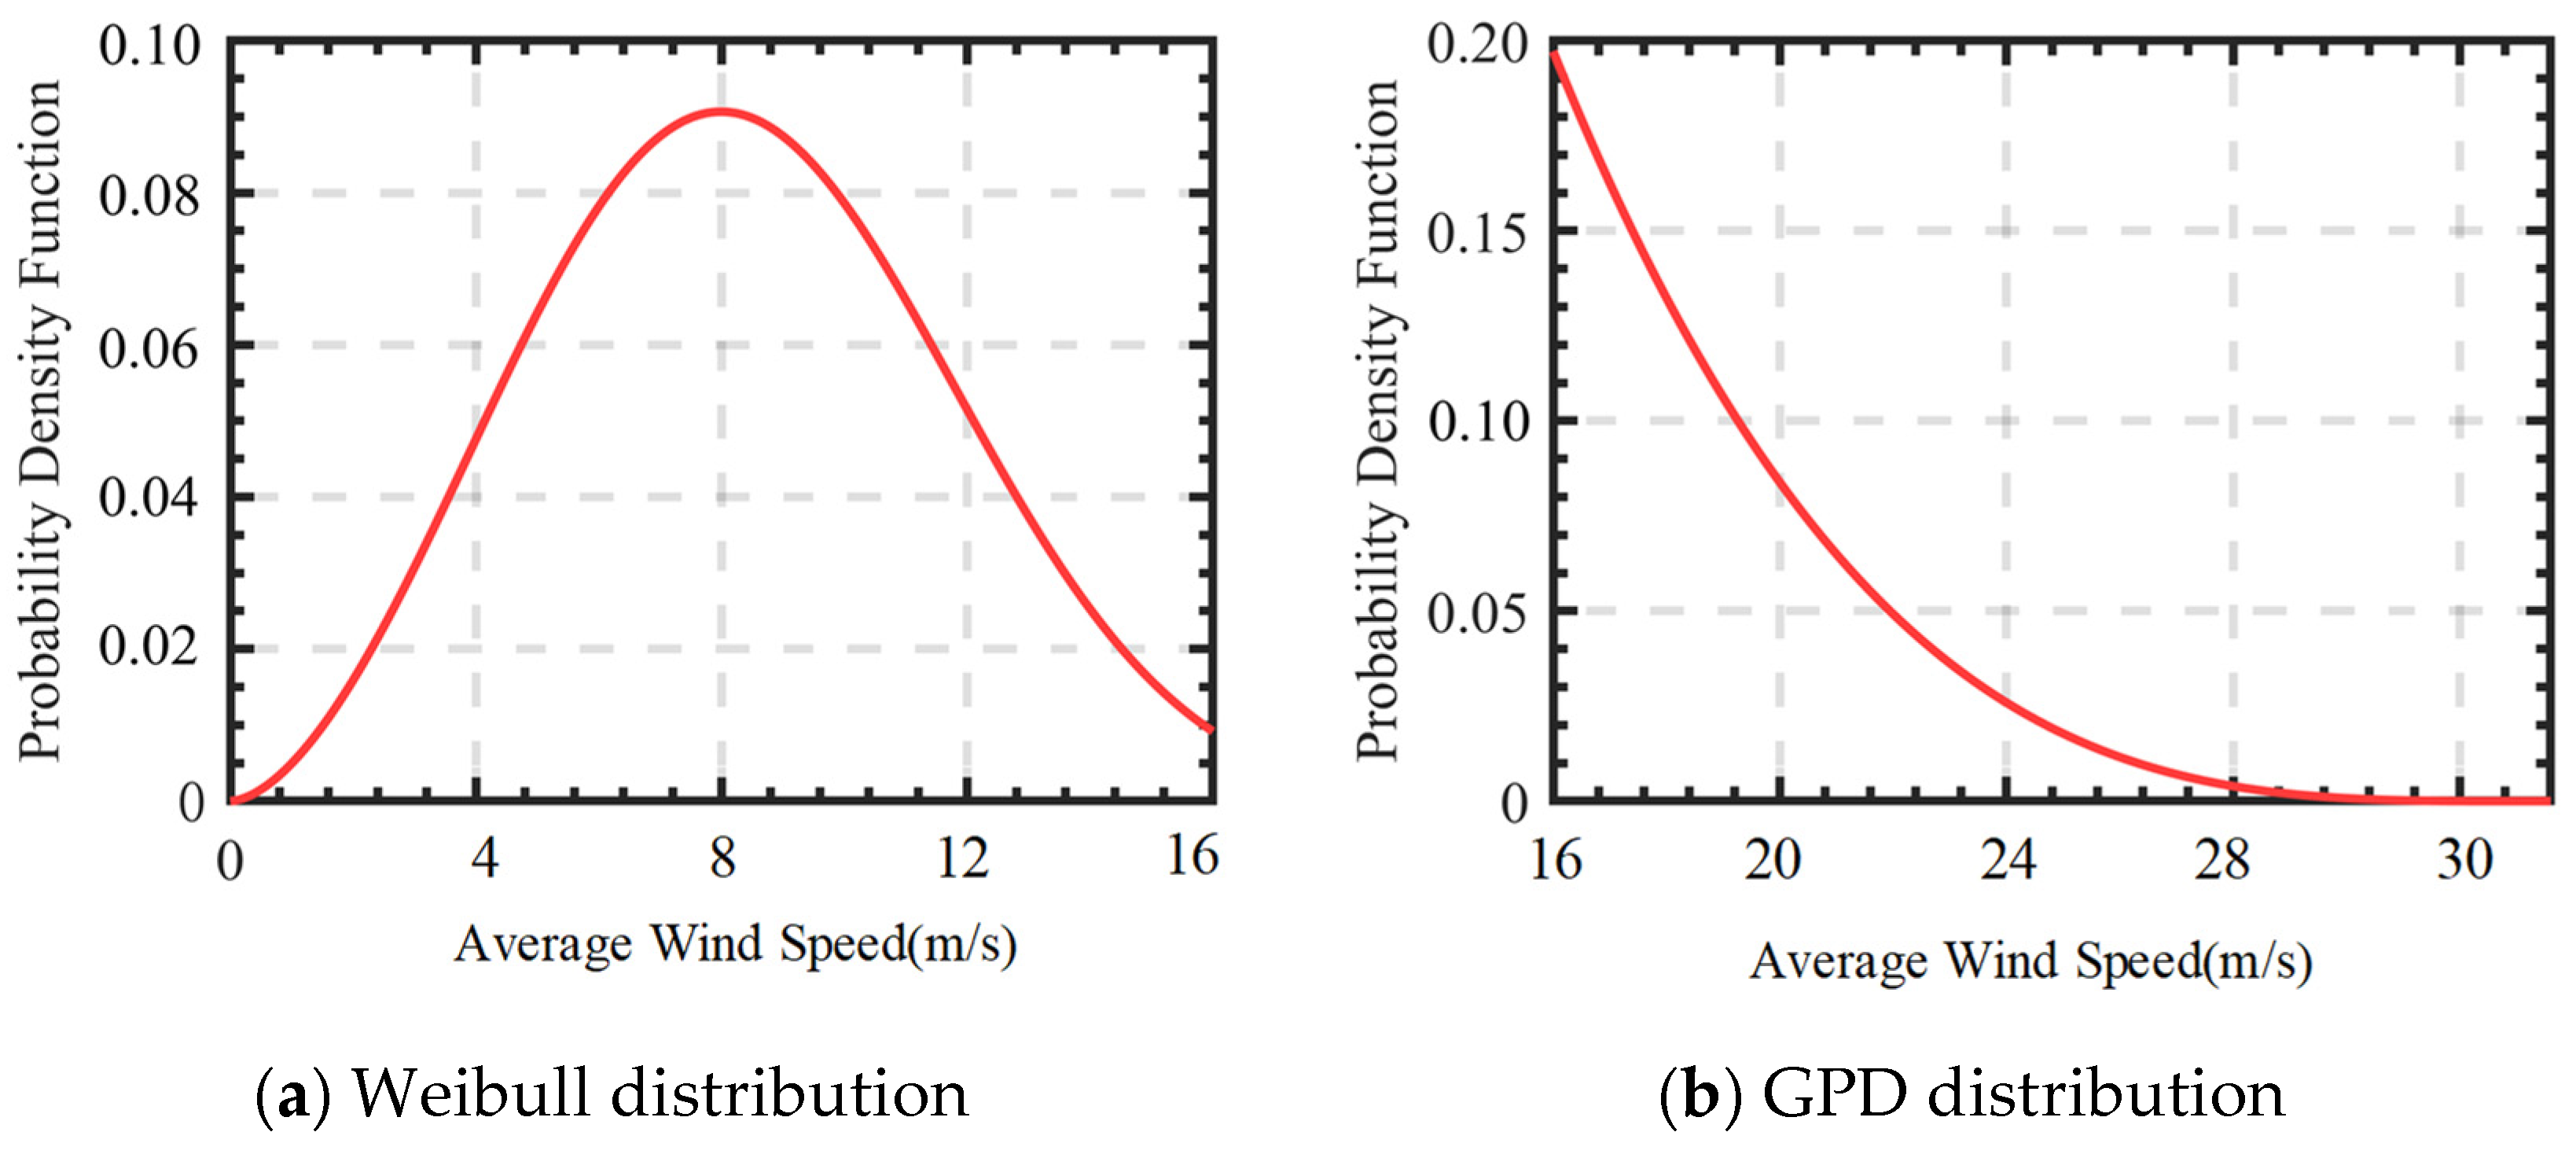
Through analysis, it is found that when the piecewise wind speed is 16 m/s, the mixed distribution model fits the measured data better. Specifically, the Weibull distribution model is used for average wind speeds of 0–16 m/s, and the least-square method is used to estimate the parameters of the Weibull distribution model. The GPD distribution model is used for average wind speeds of 16 m/s–30.4 m/s. The cumulative distribution function (CDF) of the GPD distribution model is shown in Equation (13), and the probability density function (PDF) is shown in Equation (14). The parameter values of the typhoon wind speed mixed distribution model are shown in Table 4. Figure 10 shows the probability density function diagram of the mixed distribution model.
Table 4.
Probability distribution of typhoon wind speed with return period of 50 years.
Figure 10.
Mixed probability distribution diagram of wind speed.
The wind speed mixed probability distribution curve is divided into 10 discrete wind speed values. Specifically, for wind speeds following the Weibull distribution, within the range of 0 to 12 m/s, a wind speed probability interval is set every 3 m/s. For wind speeds exceeding 12 m/s and not exceeding 16 m/s, they are regarded as a single wind speed interval. For wind speeds following the GPD distribution, within the range of 16 m/s to 28 m/s, a wind speed probability interval is set every 3 m/s. For wind speeds exceeding 28 m/s and not exceeding 30.4 m/s, they are regarded as a single wind speed interval. The probability of each discrete wind speed interval is shown in Table 5.
Table 5.
Wind speed dispersion.
Regarding the typhoon influence duration within the design service life of the disconnect switch structure, this paper uses the logarithm of 10,000 typhoon occurrence times as sample data (sample unit: hours) and fits the log-normal distribution of the average typhoon duration, as shown in Equation (16).
In the formula, μ and σ are the parameters of the log-normal distribution, where μ = 3.09, σ = 0.49. The mean value of this distribution model is:
The average typhoon influence duration Tm = 24.78, with the unit of hours, can be calculated from Equation (17). Given that the average number of typhoon landings per year is 2.27 times, the influence duration [symbol] of typhoons within the structural design service life (50 years) (with the unit of 10 min) is shown in Equation (18).
4.2. Life Load Spectrum of Fatigue-Dangerous Points
To deeply study the influence of typhoons on the fatigue damage of substation disconnect switch structures, the average wind speed at a 10 m height of the structure has been discretized into 10 working conditions, ranging from 3 m/s to 30 m/s, with each wind speed increment being 3 m/s. The method for determining the fatigue load spectrum under typhoon conditions is consistent with that under large-scale steady strong wind conditions, and details are not repeated here.
4.3. Fatigue Analysis Results
The Goodman mean stress correction is performed on the fatigue-dangerous point load spectrum of the substation disconnect switch structure. The fatigue damage values and fatigue lives of the structure are calculated based on the S-N curve and the Miner linear cumulative damage theory. This paper conservatively assumes that typhoons blowing from all directions act on the most unfavorable direction of the disconnect switch structure, and then conducts fatigue damage analysis.
The substation disconnect switch structure in typhoon regions is not only affected by typhoons but also by long-term large-scale steady strong winds. To clarify, the wind speed distributions of the two regions are not assumed to be identical. The steady strong wind in Inner Mongolia is modeled by a Weibull distribution, while the typhoon in Shenzhen is modeled by a mixed Weibull-GPD distribution. To conservatively estimate the background steady-wind damage during non-typhoon periods in Shenzhen, the steady wind distribution of Inner Mongolia is utilized. The remaining time after subtracting the typhoon influence duration from the total design service life of the structure is multiplied by the fatigue damage of the structure under the action of large-scale steady strong winds to obtain the structural damage caused by large-scale steady strong winds. Finally, the total damage of the substation disconnect switch structure in typhoon regions within the design service life can be obtained, as shown in the following:
To cover the damage caused by all possible wind speeds in the typhoon mixed distribution model, the 10-min typhoon action time is allocated according to the wind speed probabilities of the aforementioned 11 discrete wind speed intervals, and the fatigue damage values of the easily fatigue-damaged parts of the structure under different wind speed working conditions within the design service life are calculated. Then, the total damage of the structure under typhoon action can be calculated according to the total typhoon influence duration within the structural design service life calculated by Equation (18). In addition, based on the calculated average typhoon influence duration, the maximum number of typhoon attacks that each component of the flange node can withstand before fatigue failure can be calculated, as shown in Table 6. The analysis results are as follows:
Table 6.
Structural fatigue damage under fluctuating wind load.
- (1)
- From the fatigue damage caused by typhoons to the structure every 10 min, it can be seen that M16 bolt ① shows the largest fatigue damage value regardless of the wind speed, while the fatigue damage value of the flange part is the smallest. As the wind speed increases, the fatigue damage of each structural component fluctuates accordingly. This phenomenon occurs because the probability of each specific wind speed interval is different, and the duration of wind speed acting on each structural component also varies, leading to different fatigue damages for each component.
- (2)
- The substation disconnect switch structure in typhoon regions may experience fatigue failure within the 50-year design service life, and fatigue failure first occurs in the M16 bolts at the flange node of the disconnect switch structure, followed by M16 bolts. The fatigue damage values within the design service life are 57.52 and 16.63, respectively, and the expected fatigue lives are 0.87 years and 3.01 years, respectively. The fatigue damage values of the remaining components are all less than 1, and they will not experience fatigue failure within the structural design service life. According to the average influence duration of a single typhoon, in terms of the number of typhoon attacks, the disconnect switch structure flange node M16 bolts ① and ⑤ can withstand 2.21 times and 10.56 times of typhoon influences before fatigue failure, respectively.
- (3)
- In the substation disconnect switch structure, the continuous fatigue failure of M16 bolts ① and ⑤ at the flange node will significantly reduce the overall stability and bearing capacity of the structure, and may even lead to the collapse of the entire structure.
5. Conclusions
This paper uses the Weibull distribution model and the mixed distribution model (Weibull distribution + GPD distribution) to describe the wind speed distributions in large-scale steady strong wind regions and typhoon regions, respectively, and calculates the damage and predicts the fatigue life of the fatigue-dangerous points of the substation disconnect switch structures in these two types of regions. The main conclusions are as follows:
- (1)
- The substation disconnect switch structure in large-scale steady strong wind regions will experience fatigue failure within the 50-year design service life. The fatigue failure mainly occurs in M16 bolt ① and M16 bolt ⑤. The fatigue damage value of M16 bolt ① is 6.04, and the predicted fatigue life is 8.28 years. The fatigue damage value of M16 bolt ⑤ is 5.90, and the predicted fatigue life is 8.48 years.
- (2)
- The substation disconnect switch structure in typhoon regions will experience fatigue failure within the 50-year design service life. Compared with large-scale steady strong wind regions, the fatigue damage accumulation of the disconnect switch structure in typhoon regions is faster, and fatigue failure is more likely to occur. The fatigue failure mainly occurs in M16 bolt ① and M16 bolt ⑤. The fatigue damage value of M16 bolt ① is 57.52, and the predicted fatigue life is 0.87 years. The fatigue damage value of M16 bolt ⑤ is 16.63, and the predicted fatigue life is 3.01 years.
- (3)
- Regardless of whether it is in a large-scale steady strong wind region or a typhoon region, it is predicted that the FRP core rod and the flange will not experience fatigue failure within the design service life, and their fatigue damage values are both less than 1. This indicates that these components have sufficient safety margins considered in the design and manufacturing processes.
- (4)
- The continuous fatigue failure of flange bolts will seriously affect the overall safety of the substation disconnect switch structure. Therefore, the design of the flange nodes of substation disconnect switch structures in large-scale steady strong wind regions and typhoon-prone regions requires key attention.
Author Contributions
Conceptualization, X.Z. and S.N.; Methodology, X.Z., S.N., Q.L. and Q.Y.; Software, P.L. and Q.L.; Validation, P.L.; Investigation, Q.X., S.N. and B.L.; Resources, Q.X. and M.L.; Data curation, P.L., Q.X., Z.W. and B.L.; Writing–original draft, M.L.; Writing–review & editing, X.Z. and M.L.; Visualization, M.L.; Supervision, Z.W.; Funding acquisition, M.L. and Q.Y. All authors have read and agreed to the published version of the manuscript.
Funding
The New Chongqing Young Innovative Talent Project of Chongqing Municipal Science and Technology Bureau: No. CSTB2025YITP-OCRCX0088; the Science Fund for Creative Research Groups of the National Natural Science Foundation of China: No. 52221002; the Research on Wind-Resistant Design Technology for Key Equipment and Circuits of Ultra-High Voltage Converter Stations: No. 5230HQ26001M-128-ZN.
Data Availability Statement
The original contributions presented in the study are included in the article. Further inquiries can be directed to the corresponding author.
Conflicts of Interest
Author Peng Li, Qianbo Xiao were employed by State Grid Chongqing Electric Power Research Institute. The remaining authors declare that the research was conducted in the absence of any commercial or financial relationships that could be construed as a potential conflict of interest.
References
- Liu, W.; Pang, X.; Wang, Z.; Sun, S.; Yi, S. Analysis and Solution of Fracture of Post Porcelain Insulator of 550 kV Scissor-type Disconnector. Guangdong Electr. Power 2020, 33, 114–121. [Google Scholar]
- Chen, L.; Shuai, Y.; Hu, J.; Liu, C.; Ouyang, K.; Xie, Y. Fracture Analysis of High Voltage Post Porcelain Insulators. High Volt. Appar. 2015, 51, 69–73. [Google Scholar]
- Paris, L.; Pargamin, L.; Dumorora, D.; Parraud, R. Rating of Composite Suspension Insulators Related to the Long-Term Mechanical Strength of Rods. IEEE Trans. Power Deliv. 1994, 9, 2055–2063. [Google Scholar] [CrossRef] [Scilit]
- Wańkowicz, J.G.; Bielecki, J. Models of the Long-Term Mechanical Strength of Long Rod Composite Insulators. IEEE Trans. Dielectr. Electr. Insul. 2010, 17, 360–367. [Google Scholar] [CrossRef] [Scilit]
- Wańkowicz, J.G.; Bielecki, J. Life Estimation for Long Rod Composite Insulators Subjected to Accelerating Ageing by Combined Static and Cyclic Loading. IEEE Trans. Dielectr. Electr. Insul. 2011, 18, 106–113. [Google Scholar] [CrossRef] [Scilit]
- Carpenter, S.; Kumosa, M. An Investigation of Brittle Fracture of Composite Insulator Rods in an Acid Environment with Either Static or Cyclic Loading. J. Mater. Sci. 2000, 35, 4465–4476. [Google Scholar] [CrossRef] [Scilit]
- Gao, M.; Zhang, R.; Zhang, Z. Test Study of Mechanical Vibration Characteristics of EHV Transmission Line Insulators String. High Volt. Eng. 2009, 35, 2591–2596. [Google Scholar]
- Wang, J. Test and Study on Fatigue of Compound Insulators. Electr. Power Constr. 2001, 22, 31–33. [Google Scholar]
- Cao, M.; Gao, Z.; Zhang, J.; Chen, W.; Cao, W. Vibration Fatigue Test and Damage Identification of High-voltage Porcelain Insulator. High Volt. Appar. 2017, 53, 7–11+18. [Google Scholar]
- Wei, X.; Li, X.; Chu, J.; Wei, J.; Lu, W. Failure Characteristics of Hollow Composite Insulator Under Fatigue Load. Insul. Surge Arresters 2021, 217–225. [Google Scholar] [CrossRef]
- Jin, X.; Chen, Y.; Lu, Y.; Li, Z. Design of Mechanical Fatigue Test Methods for Composite Post Insulators Under Multiple Loads. North China Electr. Power Technol. 2011, 12–14. [Google Scholar]
- Xiao, Q.; Cai, J.; Zhou, L.; Yang, C. Fatigue Analysis of Composite Insulators Under Breeze Vibration. Water Resour. Power 2011, 29, 155–157+177. [Google Scholar]
- Feng, H.; Gao, R.; Shen, Y.; Tian, Z.; Ye, J. Fracture Analysis of Grounding Lead Bolts of Current Transformers in a Substation. Hubei Electr. Power 2021, 45, 34–39. [Google Scholar] [CrossRef]
- Dong, X.; Huang, Y.; Guan, P.; Zhang, J. Wind Vibration Fatigue Performance Analysis of High-Strength Bolts in Flange Plates of Substation Lightning Arresters. J. Water Resour. Archit. Eng. 2019, 17, 99–103. [Google Scholar] [CrossRef]
- Zhang, R. Study on Damage Modes and Seismic Performance of Composite Insulator Flange Joints. Master’s Thesis, North China University of Technology, Beijing, China, 2021. [Google Scholar] [CrossRef]
- Xing, L.; Zhou, Q.; Shang, Y.; Li, Q.; Zou, D.; Zhou, S.; Xie, Z. Key Technology Research on Post Composite Insulators for 750 kV Disconnectors. Shaanxi Electr. Power 2014, 42, 44–47. [Google Scholar]
- Liang, J.; Zhao, D. A Summary of Modal Analysis Methods. Mod. Manuf. Eng. 2006, 139–141. [Google Scholar]
- Gong, Y.; Zhou, C.P.; Yuan, M. Comparison of Fast Subspace Iteration Method, Iterative Ritz Vector Method and Iterative Lanczos Method. J. Vib. Eng. 2005, 18, 227–232. [Google Scholar]
- Liu, S. Research on Wind Load Characteristics and Wind-Induced Vibration Response of Post-Type Switch Structures in Substations. Master‘s Thesis, Chongqing University, Chongqing, China, 2023. [Google Scholar] [CrossRef]
- Hui, Y. Wind Tunnel Test and Wind-Induced Vibration Response Research on Complex Tall Structures. Ph.D. Thesis, Tongji University, Shanghai, China, 2007. [Google Scholar]
- Zhang, X.X.; Zhong, C.X. Refined Process Upcrossing Rate Approach for Estimating Probabilistic Wind Load Effects with Consideration of Directionality. J. Struct. Eng. 2016, 143, 04016148. [Google Scholar] [CrossRef] [Scilit]
- Gong, K.; Ding, J.; Chen, X. Estimation of Long-Term Extreme Response of Operational and Parked Wind Turbines: Validation and Some New Insights. Eng. Struct. 2014, 81, 135–147. [Google Scholar] [CrossRef] [Scilit]
- Youngman, B.D. Generalized Additive Models for Exceedances of High Thresholds with an Application to Return Level Estimation for U.S. Wind Gusts. J. Am. Stat. Assoc. 2019, 114, 1865–1879. [Google Scholar] [CrossRef] [Scilit]
- Davison, A.C.; Smith, R.L. Models for Exceedances Over High Thresholds. J. R. Stat. Soc. Ser. B-Methodol. 1990, 52, 393–442. [Google Scholar] [CrossRef] [Scilit]
- Guo, Y. Simulation and Risk Analysis of Typhoons and Their Storm Surges in Southeastern Coastal Areas of China. Ph.D. Thesis, University of Chinese Academy of Sciences, Beijing, China, 2020. [Google Scholar] [CrossRef]
- Xie, R. Numerical Simulation and Risk Analysis of Typhoons Based on CE Wind Field and Yan Meng Wind Field. Master’s Thesis, Harbin Institute of Technology, Harbin, China, 2008. [Google Scholar] [CrossRef]

Disclaimer/Publisher’s Note: The statements, opinions and data contained in all publications are solely those of the individual author(s) and contributor(s) and not of MDPI and/or the editor(s). MDPI and/or the editor(s) disclaim responsibility for any injury to people or property resulting from any ideas, methods, instructions or products referred to in the content. |
© 2026 by the authors. Licensee MDPI, Basel, Switzerland. This article is an open access article distributed under the terms and conditions of the Creative Commons Attribution (CC BY) license.