


Abstract
Energy supply shocks are often expected to accelerate the shift toward solar and wind power, yet this expectation has rarely been tested with a common quasi-experimental design across different crisis types and development contexts. This study examines four supply-crisis episodes in Germany, Jordan, and Brazil over 1990–2024 using interrupted time series (ITS), difference-in-differences (DiD) event studies, and the synthetic control method (SCM), with autocorrelation-consistent confidence intervals and placebo-based inference. Germany’s post-2009 renewable slope rose by 1.19 pp/yr (95% CI 0.87–1.51), unchanged when the financial-crisis trough is excluded. Jordan’s post-2011 renewable-share increment rose by 1.90 pp/yr, led by photovoltaics, while its carbon-intensity increment fell by 13.92 gCO2/kWh/yr. Brazil’s clean-diversification slope doubled after the 2021 drought, from 1.62 to 3.39 pp/yr, although distributed photovoltaics expanding under a concurrent regulatory change supplied most of the added capacity. Germany’s 2022 carbon-intensity rise is the only effect on which all three designs agree in sign, but each estimate is individually imprecise, and SCM is infeasible for Brazil’s carbon intensity with regional donors. Supply crises are followed by faster renewable deployment in all three systems, but the strength of identification differs markedly across episodes.
1. Introduction
Energy supply crises have long been regarded as potential catalysts for accelerating structural transitions toward cleaner electricity systems and, in particular, toward solar and wind generation [1,2,3,4]. Steffen and Patt [1] used a Swiss population survey to show broad, cross-partisan support for clean-energy policies after the Russian invasion of Ukraine; Kuzemko et al. [3] traced how European policy responses to the same war reshaped the direction of sustainable transformation; and Pavlenko and Cherp [4] asked whether the REPowerEU response turned this political momentum into faster decarbonisation. The underlying logic is intuitive, since supply disruptions that raise the cost and reduce the reliability of incumbent fossil fuels simultaneously weaken carbon lock-in and strengthen the political-economy case for renewable investment [5,6,7]. Unruh [5] described how the co-evolution of technologies and institutions locks electricity systems into fossil fuels, Meckling et al. [6] explained how policy sequencing can build the coalitions that loosen this lock-in, and Hille [7] tested whether geopolitical risk in fossil-fuel-source countries has accelerated renewable deployment in Europe. Whether this logic translates into measurable, causally identifiable acceleration of solar and wind deployment across structurally different countries, crisis types, and development contexts remains, however, an empirically contested question [7,8,9]. Cherp et al. [8], for instance, showed that national wind and solar growth follows S-shaped trajectories whose pace differs widely between countries, which makes a common benchmark for acceleration difficult to define. Most existing studies focus on single-country episodes in OECD contexts, and they are generally unable to address whether crisis acceleration effects generalise to climate-induced supply shocks, to import-dependent developing economies, or to hydro-dominant electricity systems [10,11,12]. However, recent evidence from non-OECD island contexts shows that catastrophic, climate-induced natural disasters, such as Hurricanes María and Fiona in Puerto Rico, can act as powerful structural catalysts, dramatically accelerating S-curve adoption of residential rooftop solar and battery storage as households seek energy independence and localized grid resilience [13].
This study addresses that gap through a systematic three-country comparative analysis of crisis-driven renewable acceleration. Germany, Jordan, and Brazil are selected to represent three analytically distinct energy-system archetypes. Germany is a large industrial economy that has undertaken one of the most ambitious renewable transitions of any major OECD state, driven in part by a sequence of geopolitical gas-supply shocks stretching from the 2006 Russia–Ukraine gas dispute through the 2022 full-scale invasion of Ukraine, and its solar and wind capacity has expanded across successive revisions of the Renewable Energy Sources Act [2,7,14]. Jordan is a small, heavily import-dependent developing economy whose electricity sector was, until recently, almost entirely dependent on imported fossil fuels, making it acutely exposed to regional geopolitical disruption; its post-2011 transition to wind and, above all, solar photovoltaics represents one of the fastest renewable-deployment trajectories in the Middle East and North Africa (MENA) region [9,15,16]. To manage the resulting grid congestion under such rapid solar penetration, regulatory frameworks are increasingly shifting toward behind-the-meter, zero feed-in (strict non-export) configurations, which are highly cost-effective for continuous-load industrial facilities [17]. Brazil represents a third archetype, namely a large hydro-dominant emerging economy, in which the central energy-security challenge is not fossil-fuel import dependence but climate-induced supply concentration risk, since with hydropower supplying a majority of generation across much of the sample period, the system is structurally vulnerable to droughts that simultaneously drive up carbon emissions through emergency thermal dispatch and accelerate non-hydro renewable investment [12,18,19].
It is worth mentioning that these three cases together constitute a diverse natural laboratory: they span geopolitical gas disruptions, an import-supply disruption, and a climate-induced hydropower shortfall, and they cover a European high-income economy, a Middle Eastern lower-middle-income economy, and a Latin American upper-middle-income economy. This diversity is precisely what is required to test whether crisis-driven acceleration of solar and wind deployment is a general phenomenon rather than a context-specific artefact of the European experience. In brief, Germany is a high-income, gas-importing industrial system exposed to geopolitical pipeline shocks (2009 and 2022); Jordan is an import-dependent, oil-and-gas-fired system hit by the 2011 collapse of Egyptian gas supply; and Brazil is a hydro-dominant system exposed to the 2021 drought.
This study contributes to the existing literature as it applies a unified quasi-experimental framework, combining interrupted time series (ITS), difference-in-differences (DiD), and the synthetic control method (SCM), across all three countries and crisis types simultaneously, with variable renewable deployment as the outcome of interest and carbon intensity treated as the mechanism linking supply shocks to renewable acceleration. In addition, it introduces a structural decomposition of Brazil’s diversification into a clean-diversification index (solar + wind + bioenergy share, capturing genuine clean transition) and a fossil-diversification index (fossil share, capturing drought-induced thermal regression), resolving an ambiguity that has conflated these two distinct mechanisms. Furthermore, it addresses the near-unit-root behaviour of Jordan’s annual electricity-mix series through first-difference ITS estimation. Lastly, it tests Germany’s 2009 episode against the Global Financial Crisis confound. The analysis also documents that SCM is infeasible for Brazil’s carbon intensity when the donor pool is restricted to regional comparators, a design constraint relevant to comparative research on Brazil, Norway, Paraguay, and other hydro-heavy systems. This is complemented by emerging work on public and institutional smart microgrids, which demonstrates that combining zero feed-in solar arrays with optimized battery energy storage systems (BESSs) can provide up to 46% energy autonomy while substantially reducing greenhouse gas emissions [20]. Inference combines HAC-based confidence intervals for the ITS estimates with placebo-based tests for the comparative designs. The analysis complements earlier comparative evidence on how geopolitical gas disruptions shaped energy-security convergence in Germany and Jordan [21], and panel evidence on Jordan’s renewable response relative to Middle Eastern and Mediterranean comparators [22], by extending the comparison to a climate-induced crisis and to a common set of identification checks.
This paper proceeds as follows. Section 2 develops the mathematical model. Section 3 describes the data and the construction of the two Brazilian indices. Section 4 presents the ITS, DiD, and SCM results and the cross-method convergence assessment. Section 5 discusses the policy mechanisms, implications, and limitations, and Section 6 concludes.
2. A Model of Crisis–Transition Dynamics
2.1. The Standard Interrupted Time Series Specification
Let denote a renewable-deployment or carbon-intensity outcome at time t. In the absence of any crisis, the outcome follows a trend-stationary process, , where is an intercept, is the pre-crisis trend, and is a mean-zero disturbance. Following a crisis at time , the outcome evolves according to Equation (1) under a standard segmented regression framework [23]:
where is the crisis indicator, is the level shift, and is the change in the post-crisis slope. This segmented approach allows the pre-intervention trend to establish a counterfactual baseline, isolating the post-crisis level shift and slope changes as distinct causal components of the treatment effect [24,25]. The treatment effect at horizon is so captures the immediate discontinuity and captures whether the crisis bent the longer-run trajectory upward (for renewable share) or downward (for carbon intensity).
2.2. First-Difference Estimation for Near-Unit-Root Series
When the outcome series is highly persistent, the levels specification in Equation (1) produces severely autocorrelated residuals and unreliable inference [26]. In time-series policy designs, highly persistent variables and unit-root processes violate standard independence assumptions and require alternative estimation procedures, such as first-differencing, to ensure valid inference [27]. In that case, the model is estimated in first differences, as in Equation (2):
ΔYt = α + ψDt + νt
Here, ψ recovers the change in the average year-on-year increment of the outcome after the crisis, which is the quantity of primary interest for a persistent series, and this specification removes most of the persistence that contaminates the levels residuals, although it does not remove residual autocorrelation entirely, so inference relies on autocorrelation-consistent standard errors. This is the approach adopted for Jordan, whose annual electricity-mix series behave as near-random walks over the short 2000–2022 window.
2.3. Difference-in-Differences and Synthetic Control
The ITS design identifies within-unit changes but cannot rule out contemporaneous shocks common to all countries [28]. Two complementary designs address this limitation by introducing external comparison groups to control for potential history bias [28,29,30]. The two-way fixed-effects DiD event study compares the treated country with a donor pool of untreated comparators sharing region and structure, absorbing unit and time fixed effects and estimating event-time coefficients relative to the year before the crisis [29,30]. The synthetic control method constructs a weighted combination of donor countries that best reproduces the treated country’s pre-crisis trajectory, then reads the post-crisis treatment effect as the gap between the treated unit and its synthetic counterpart [31]. Convergence of the three designs on the same sign and approximate magnitude is treated as evidence that the estimated effect is genuine rather than an artefact of any single design [30,31].
2.4. Identifying Assumptions and Statistical Inference
The three designs rest on different assumptions, and the value of combining them lies in this difference. The ITS design assumes that, without the crisis, the pre-crisis trend would have continued and that no other discontinuity coincides with the crisis year; it cannot separate the crisis from a policy change introduced in the same year [23,25]. The DiD event study assumes parallel trends, namely that the treated country and the donor mean would have moved in parallel without the crisis, together with no anticipation and no spillover of the treatment onto the donors [29,30]; pre-crisis event-time coefficients close to zero are the observable implication of this assumption. SCM assumes that the treated unit’s pre-crisis path can be reproduced by a convex combination of donors, which requires the treated series to lie within the range spanned by the donor pool (the convex-hull condition), and that the donors are unaffected by the crisis [31].
Uncertainty is quantified in a way suited to each design. ITS parameters are reported with 95% confidence intervals based on Newey–West heteroskedasticity- and autocorrelation-consistent (HAC) standard errors (Bartlett kernel, two lags, small-sample correction, t-distribution), and the counterfactual trajectory implied by the pre-crisis trend is shown with its 95% confidence band. Because each DiD and SCM exercise involves a single treated country, conventional cluster-robust standard errors are not valid, and inference for both designs is based on in-space placebo (permutation) tests, in which each donor is in turn assigned the treatment and the treated country’s statistic is ranked within the resulting placebo distribution [31]. For DiD, the statistic is the absolute average post-crisis event-time gap, and for SCM, it is the ratio of post- to pre-crisis root-mean-square prediction error (RMSPE). The permutation p-value is the treated country’s rank divided by the number of units, so its smallest attainable value is bounded by the size of the donor pool.
3. Data, Variable Construction, and Measurement
3.1. Primary Data Sources
The analysis draws on harmonised annual electricity-mix data for all three countries from Our World in Data and Ember, supplemented by Brazilian national energy-balance statistics and World Bank real-GDP series. Table 1 summarises the sources. Annual electricity-mix shares, renewable share, and carbon intensity for Germany and Jordan are taken directly from the Our World in Data/Ember series; Brazilian socioeconomic and energy-balance quantities are taken from the national energy balance; and real GDP used as a control for Germany’s 2009 episode is taken from the World Bank World Development Indicators. The DiD and SCM exercises for Germany use the harmonised Ember carbon-intensity series for Germany and all donors, so that the treated and donor units are measured identically.
Table 1.
Primary data sources by country and variable.
3.2. Carbon Intensity and Measurement Uncertainty
The carbon-intensity values for Germany and Jordan are taken directly from the harmonised Our World in Data/Ember series, which provides consistently estimated intensities that are comparable across countries. Brazil’s carbon intensity is computed from the fuel-mix shares using lifecycle emission factors of 820 gCO2/kWh for coal, 490 gCO2/kWh for gas, 650 gCO2/kWh for oil, 24 gCO2/kWh for hydro, 11 gCO2/kWh for wind, 48 gCO2/kWh for solar, 230 gCO2/kWh for bioenergy, and 12 gCO2/kWh for nuclear [32]. The same factors are applied to the Latin American donor countries, so that Brazil’s intensity and that of its comparators are computed on an identical basis. Three methodological limitations should be noted. Firstly, static emission factors do not capture the efficiency penalty when ageing oil and diesel peaking plants run at variable heat rates during drought-induced emergency dispatch, so the computed intensity understates actual emissions in drought years and biases the level shift downward. Secondly, the bioenergy factor is a lifecycle average, whereas actual stack emissions from sugarcane-bagasse co-firing vary with the harvest cycle. Thirdly, lifecycle factors for photovoltaics that omit non-CO2 greenhouse gases understate emissions in wafer and module production by roughly 20–28% [33], and a production-based intensity attributes the embodied emissions of imported modules to the exporting country rather than to Brazil; because the solar factor is small relative to the fossil factors, neither effect is material for the estimated breaks, but both qualify the reading of a falling intensity as full decarbonisation. These effects are expected to have a greater influence on the estimated level shift than on the slope-change parameter and should be considered when interpreting the Brazilian results.
3.3. The Two Brazilian Diversification Indices
A recurrent difficulty in the Brazilian case is that a single diversification index conflates two opposite phenomena: the clean build-out of solar, wind, and modern bioenergy, and the drought-driven return to thermal generation. To separate them, two indices are constructed from the fuel-mix shares. The clean-diversification index is the sum of solar, wind, and bioenergy shares, capturing genuine clean transition away from hydro concentration. The fossil-diversification index is the sum of coal, gas, and oil shares, capturing the emergency thermal dispatch that accompanies hydropower shortfalls. The former rises steadily and accelerates after 2021, whereas the latter spikes transiently during drought years and then subsides. Table 2 reports descriptive statistics for the key variables.
Table 2.
Descriptive statistics for key variables, Germany 2000–2024; Jordan 2000–2022; Brazil 1990–2024. Brazil’s CO2 intensity is computed with the emission factors listed in Section 3.2.
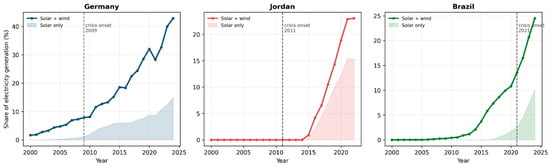
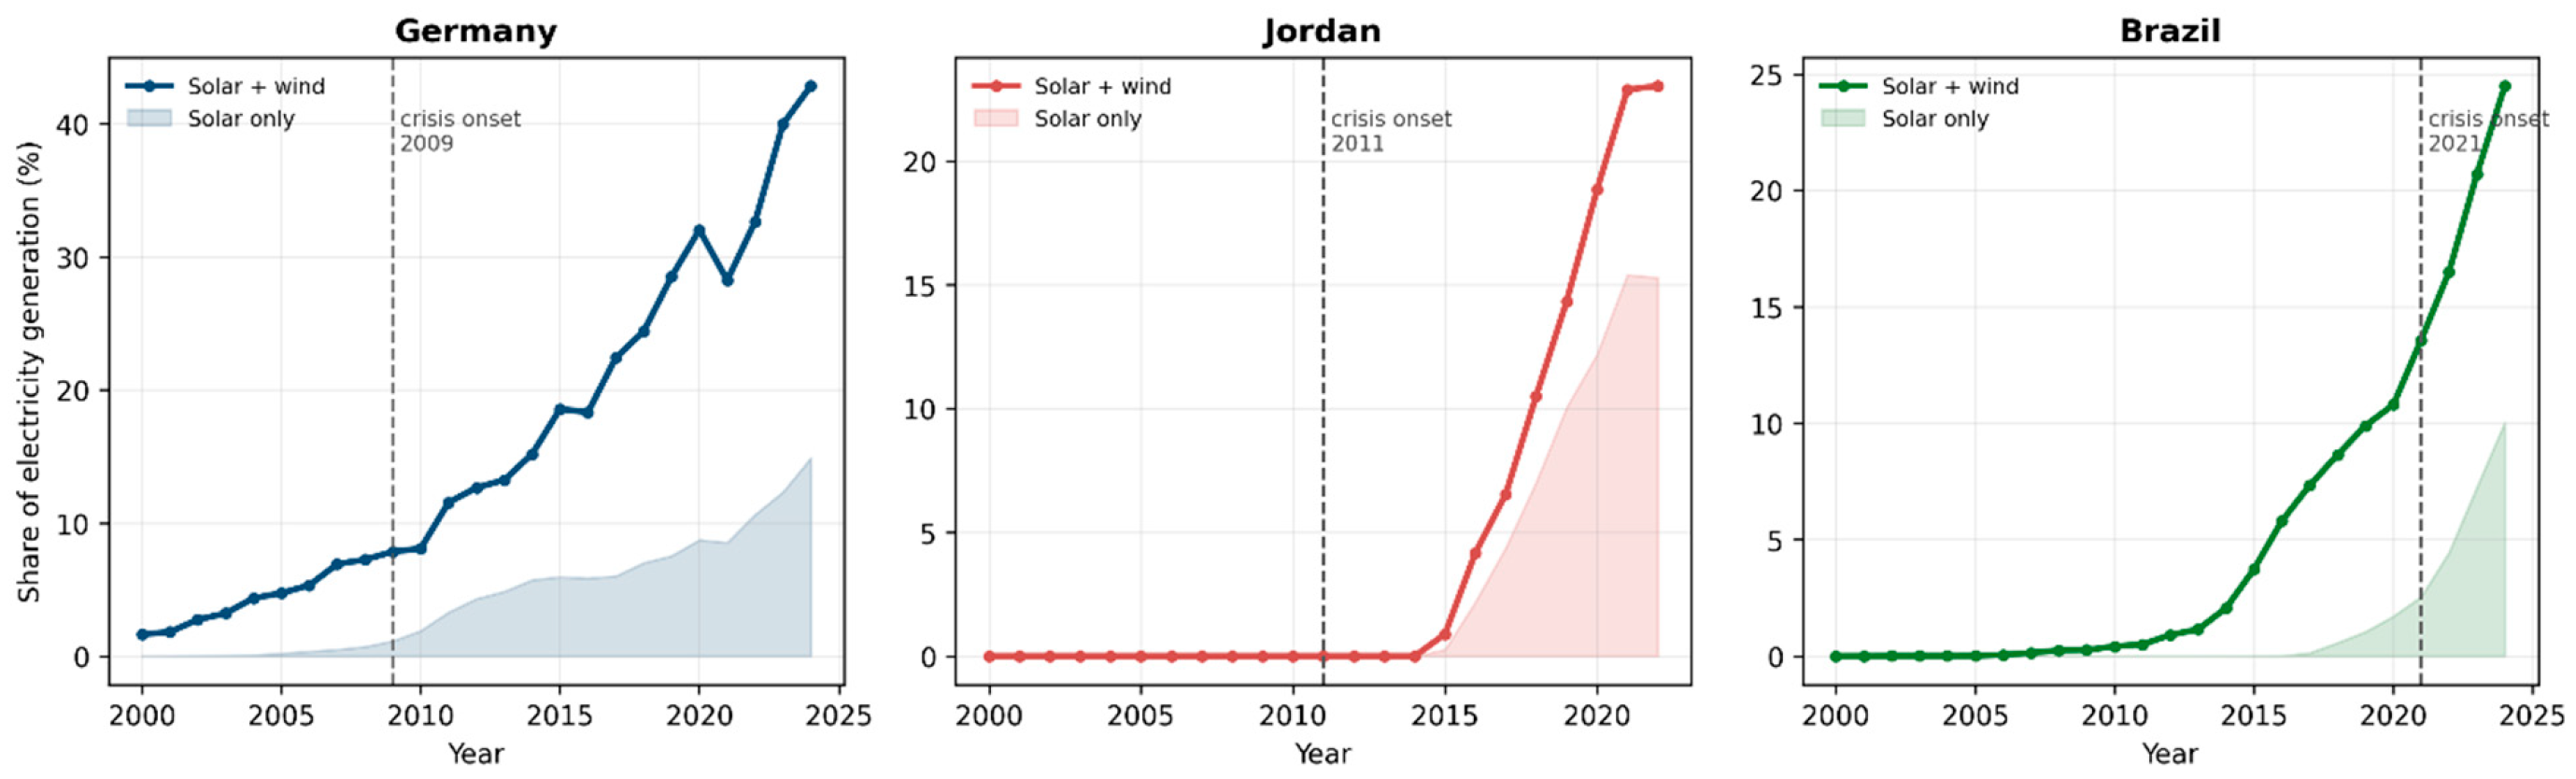
Figure 1 places the three cases side by side, plotting the combined solar-and-wind share around each country’s crisis onset. In each panel, the deployment trajectory bends upward after the crisis year, and in every case, the solar component (shaded) accounts for a substantial and growing part of the total.
Figure 1.
Variable renewable (solar + wind) deployment around supply-crisis onsets for Germany (2009), Jordan (2011), and Brazil (2021).
4. Results
4.1. Interrupted Time Series: Specification Choices and Diagnostics
The specification for each country is chosen to match the statistical properties of its series. For Germany, augmented Dickey–Fuller tests on the raw series do not reject a unit root, which is expected for series that contain the trend break the ITS is designed to capture, because unit-root tests lose power in the presence of structural breaks. The residuals of the segmented levels models are, however, stationary (ADF p = 0.009 for the 2009 renewable-share model and p = 0.013 for the 2022 carbon-intensity model; Ljung–Box p = 0.95 and 0.21). The Durbin–Watson statistic of the 2009 model is 1.74, while the short 2010–2024 carbon-intensity model shows some positive residual autocorrelation (Durbin–Watson 0.94) that the HAC standard errors are designed to accommodate. On this basis, the level ITS in Equation (1) is appropriate; Newey–West heteroskedasticity- and autocorrelation-consistent standard errors with a small-sample correction are used throughout. For Germany’s 2009 episode specifically, two models are estimated: a baseline levels ITS, and a robustness specification that excludes the 2009–2010 Global Financial Crisis trough, so that the estimated renewable acceleration is not attributed to a mechanical rebound from recession-driven demand destruction. For Jordan, the annual series behave as near-random walks over the short window, the KPSS test rejects stationarity for both carbon intensity (p = 0.014) and renewable share (p = 0.015), the augmented Dickey–Fuller test fails to reject the unit-root null for carbon intensity (p = 0.91) although it rejects it for renewable share (p = 0.008), and the levels ITS produces severely autocorrelated residuals (Durbin–Watson 0.49 and 0.67; Ljung–Box p < 0.01); the first-difference ITS in Equation (2) is, therefore, applied. For Brazil, the clean-diversification index is modelled in levels with the full level-shift-plus-slope-change form, since the pre-crisis trend and the post-crisis slope change are both estimated with very high precision.
4.2. Interrupted Time Series: Germany
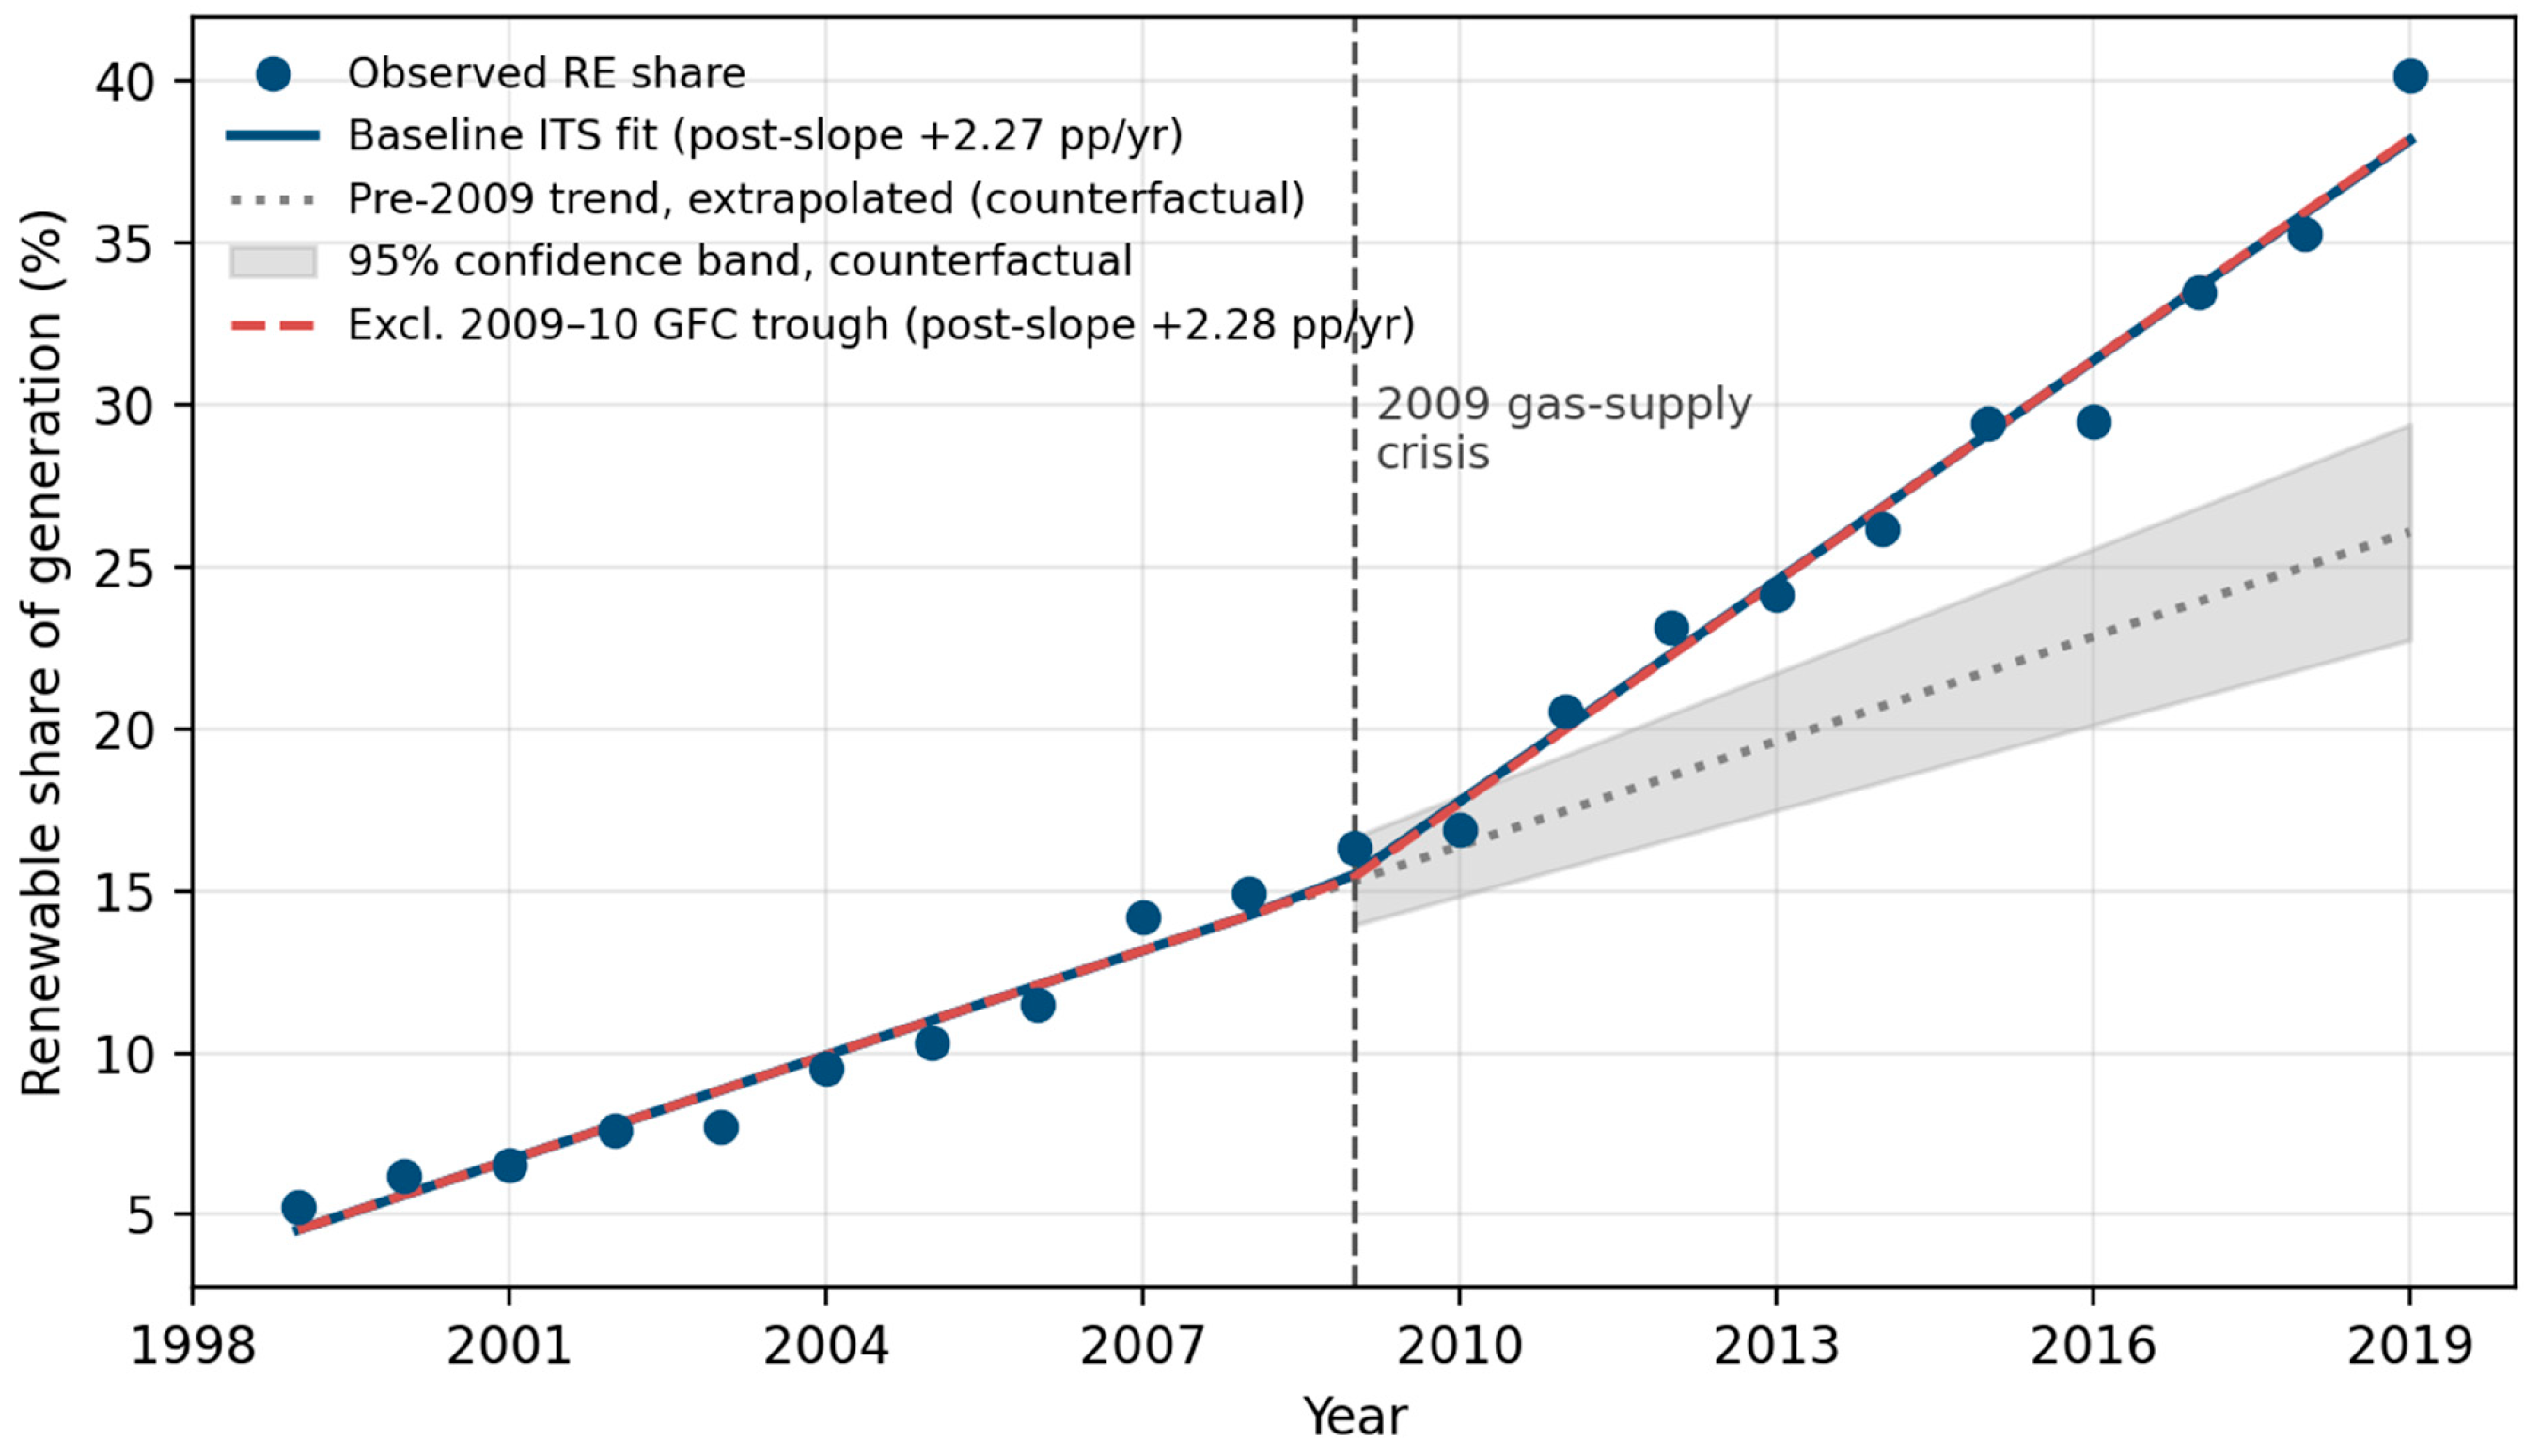
Germany’s 2022 crisis produces the largest short-run carbon-intensity response. Against a steep pre-crisis decarbonisation trend of about −19 gCO2/kWh/yr, the crisis produces a positive level shift of about +49 gCO2/kWh (95% CI −7.2 to +104.4; p = 0.08), reflecting the short-run return to coal as gas supply was curtailed, followed by resumed decline as solar and wind expanded. The shift is economically large, about 12% of Germany’s 2021 intensity, but it is imprecisely estimated because only three post-crisis observations are available; for the same reason, the accompanying slope change is not interpreted. The observed 2022 intensity (433 gCO2/kWh) lay at the upper edge of the 95% confidence band of the counterfactual (327–434 gCO2/kWh). Germany’s 2009 episode yields the clearest renewable-deployment result. In the baseline levels model over 1999–2019, the post-crisis slope change is +1.19 pp/yr (t = 7.82, p < 0.001; 95% CI 0.87–1.51), lifting the renewable trajectory from roughly +1.08 pp/yr before the crisis to about +2.27 pp/yr afterward. In cumulative terms, the observed renewable share reached 40.2% in 2019, against 26.1% on the extrapolated pre-crisis trend (95% confidence band 22.8–29.4%), a difference of about 14 percentage points after one decade. Crucially, this acceleration is not an artefact of the financial-crisis rebound: excluding the 2009–2010 trough leaves the slope change essentially unchanged at +1.20 pp/yr (t = 6.08, p < 0.001; 95% CI 0.78–1.63). Table 3 reports the German results.
Table 3.
Germany ITS results. Units are gCO2/kWh (and per year) for carbon intensity and percentage points (and per year) for renewable share. * p < 0.001. 95% confidence intervals in brackets are based on Newey–West standard errors (two lags, small-sample correction). The 2022 slope change rests on three post-crisis observations and is not interpreted.
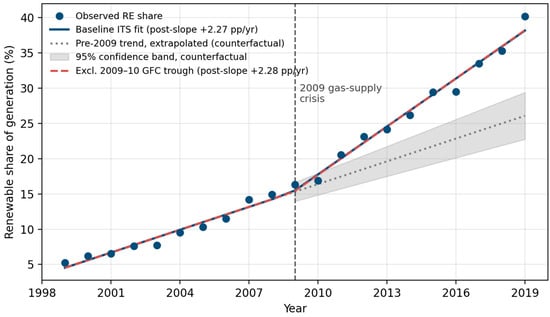
Figure 2 shows the German 2009 renewable-share result and its robustness check, comparing the baseline interrupted-trend fit with the specification that excludes the financial-crisis trough. The two fits are almost indistinguishable in slope, which indicates that the post-2009 acceleration is not a recession rebound. The shaded band is the 95% confidence interval of the counterfactual trajectory, and the observed share leaves it from 2011 onward. Whether the acceleration reflects the supply crisis or the renewable-support reform that entered into force in the same year cannot be separated by this design (Section 5.2).
Figure 2.
Germany renewable share, 1999–2019, with the fitted interrupted time-series model at the 2009 supply-crisis onset. The dotted line is the extrapolated pre-crisis trend with its 95% confidence band (shaded); the dashed line is the robustness fit excluding 2009–2010.
4.3. Interrupted Time Series: Jordan
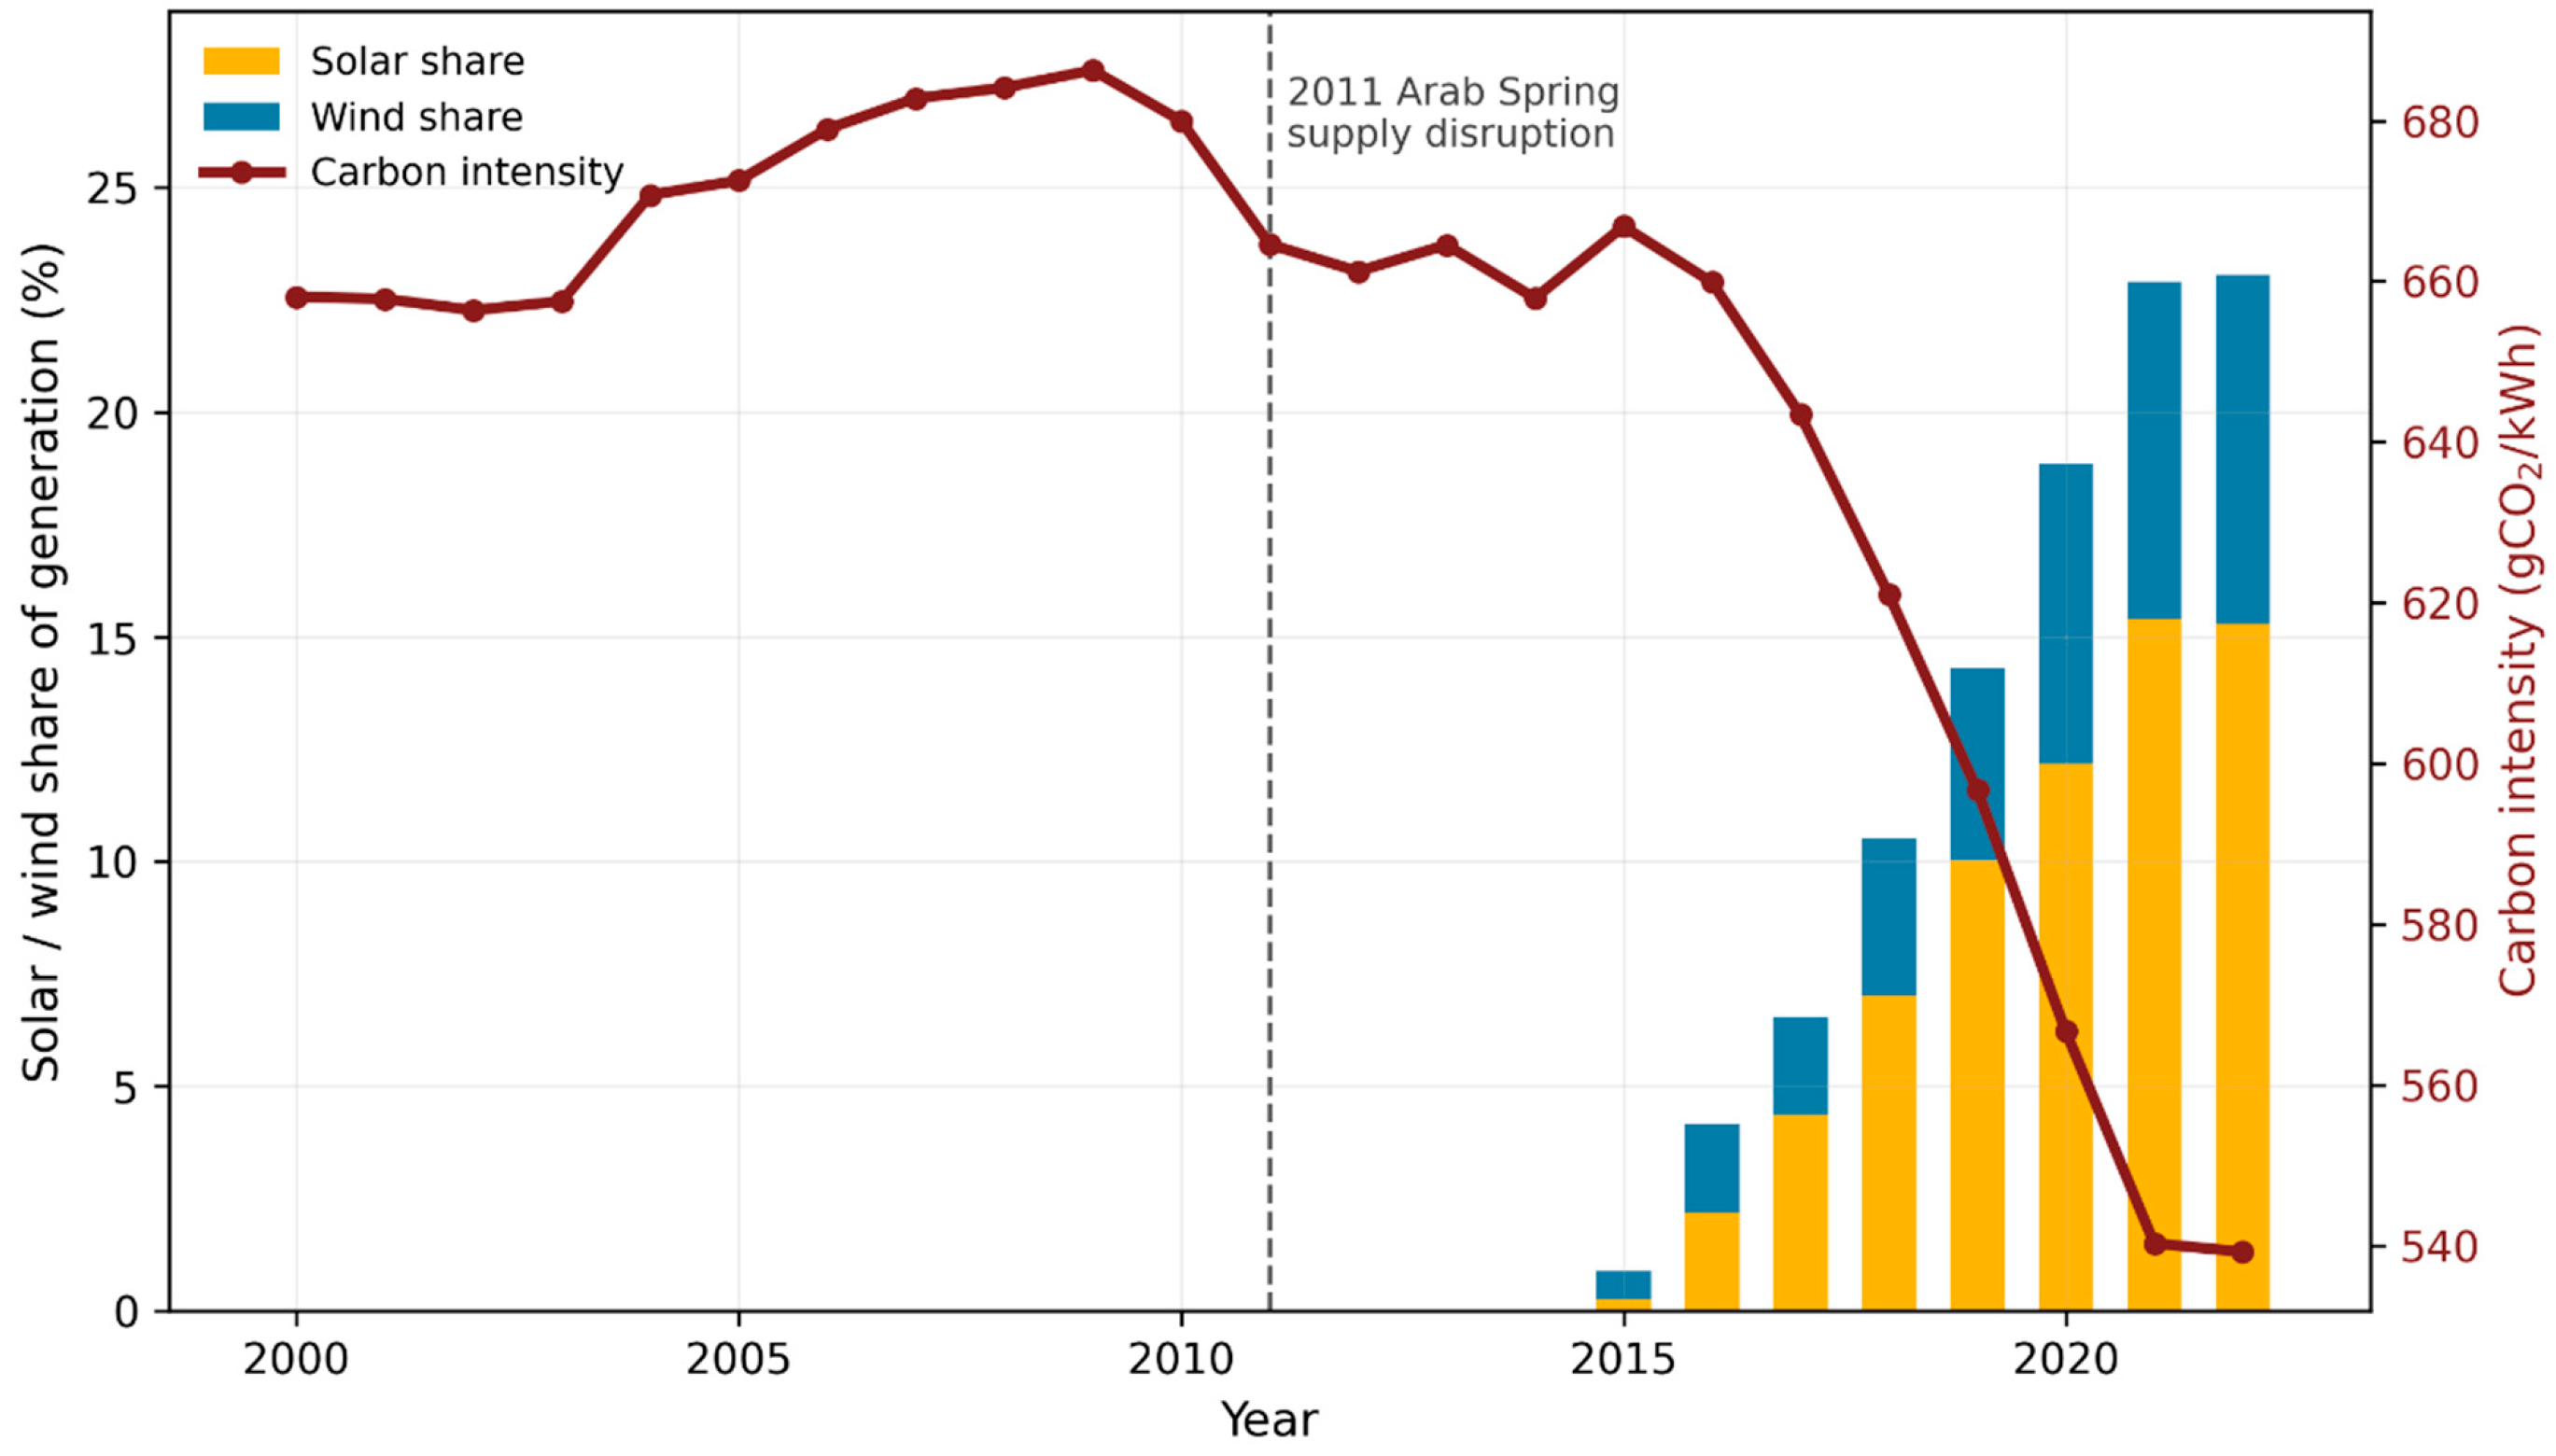
Jordan’s first-difference ITS recovers a clear post-2011 break in both directions of interest. The carbon-intensity increment shifts by −13.92 gCO2/kWh/yr (HAC SE 5.21, t = −2.67, p = 0.015; 95% CI −24.79 to −3.05), meaning that after 2011, the carbon intensity fell markedly faster than before, and the renewable-share increment shifts by +1.90 pp/yr (HAC SE 0.79, t = 2.40, p = 0.026; 95% CI 0.25 to 3.54), meaning that renewable share rose markedly faster after 2011. The first-difference specification removes most of the persistence left in the levels residuals, although some autocorrelation remains (Durbin–Watson 1.02 and 0.72), which is why inference is based on HAC standard errors. In cumulative terms, the twelve post-2011 annual increments imply a carbon intensity about 167 gCO2/kWh lower and a renewable share about 22.7 percentage points higher by 2022 than a continuation of the pre-crisis pace would have produced. It is worth mentioning that this expansion is overwhelmingly a solar story: Jordan’s solar share rose from zero through 2014 to 15.3% by 2022, with wind adding a further 7.8%, together accounting for essentially the entire post-2011 renewable increase. Table 4 reports the Jordanian results.
Table 4.
Jordan first-difference ITS results for the 2011 supply-crisis episode. HAC standard errors (two lags, small-sample correction). The Prais–Winsten rows report the post-crisis slope change of the segmented levels model.
As a sensitivity check on the treatment of persistence, the segmented model was also estimated in levels by Prais–Winsten (AR(1)) feasible generalised least squares. The estimated autoregressive coefficient is close to unity (ρ = 0.93 for both outcomes), which confirms the near-unit-root behaviour that motivates differencing. The slope changes keep the signs of the first-difference estimates (−4.27 gCO2/kWh/yr for carbon intensity and +0.88 pp/yr for renewable share) but are imprecise (95% CIs −22.61 to 14.08 and −1.62 to 3.38), because with ρ near one, the transformed levels retain little independent variation from which to separate the post-crisis slope from the persistence of the series. Both approaches, therefore, address persistence while preserving the intervention estimand, and they agree in direction, but only the first-difference specification delivers precise estimates. It is worth mentioning that a panel difference-in-differences analysis of the same episode, which compared Jordan with Middle Eastern and Mediterranean comparators, found a delayed divergence in renewable share, reaching approximately 16 percentage points by 2022 [22]; this provides external comparative support for the direction of the Jordanian result.
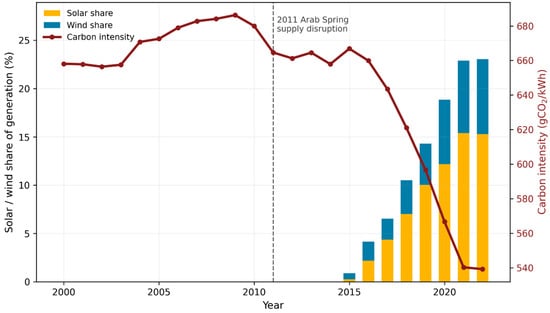
Figure 3 summarises the Jordanian case, showing the post-2011 rise of solar and wind alongside the sustained fall in carbon intensity, the two outcomes that the first-difference ITS identifies as jointly shifting after the crisis. Solar and wind output is zero until 2014 and then rises to 15.3% and 7.8% of generation by 2022, while carbon intensity, after peaking at 686 gCO2/kWh in 2009, falls to 539 gCO2/kWh. The four-year delay between the crisis and the first renewable output reflects the time needed to legislate, procure, and build the first projects (Section 5.2).
Figure 3.
Jordan carbon intensity (right axis) and solar and wind shares of generation (left axis), 2000–2022.
4.4. Interrupted Time Series: Brazil
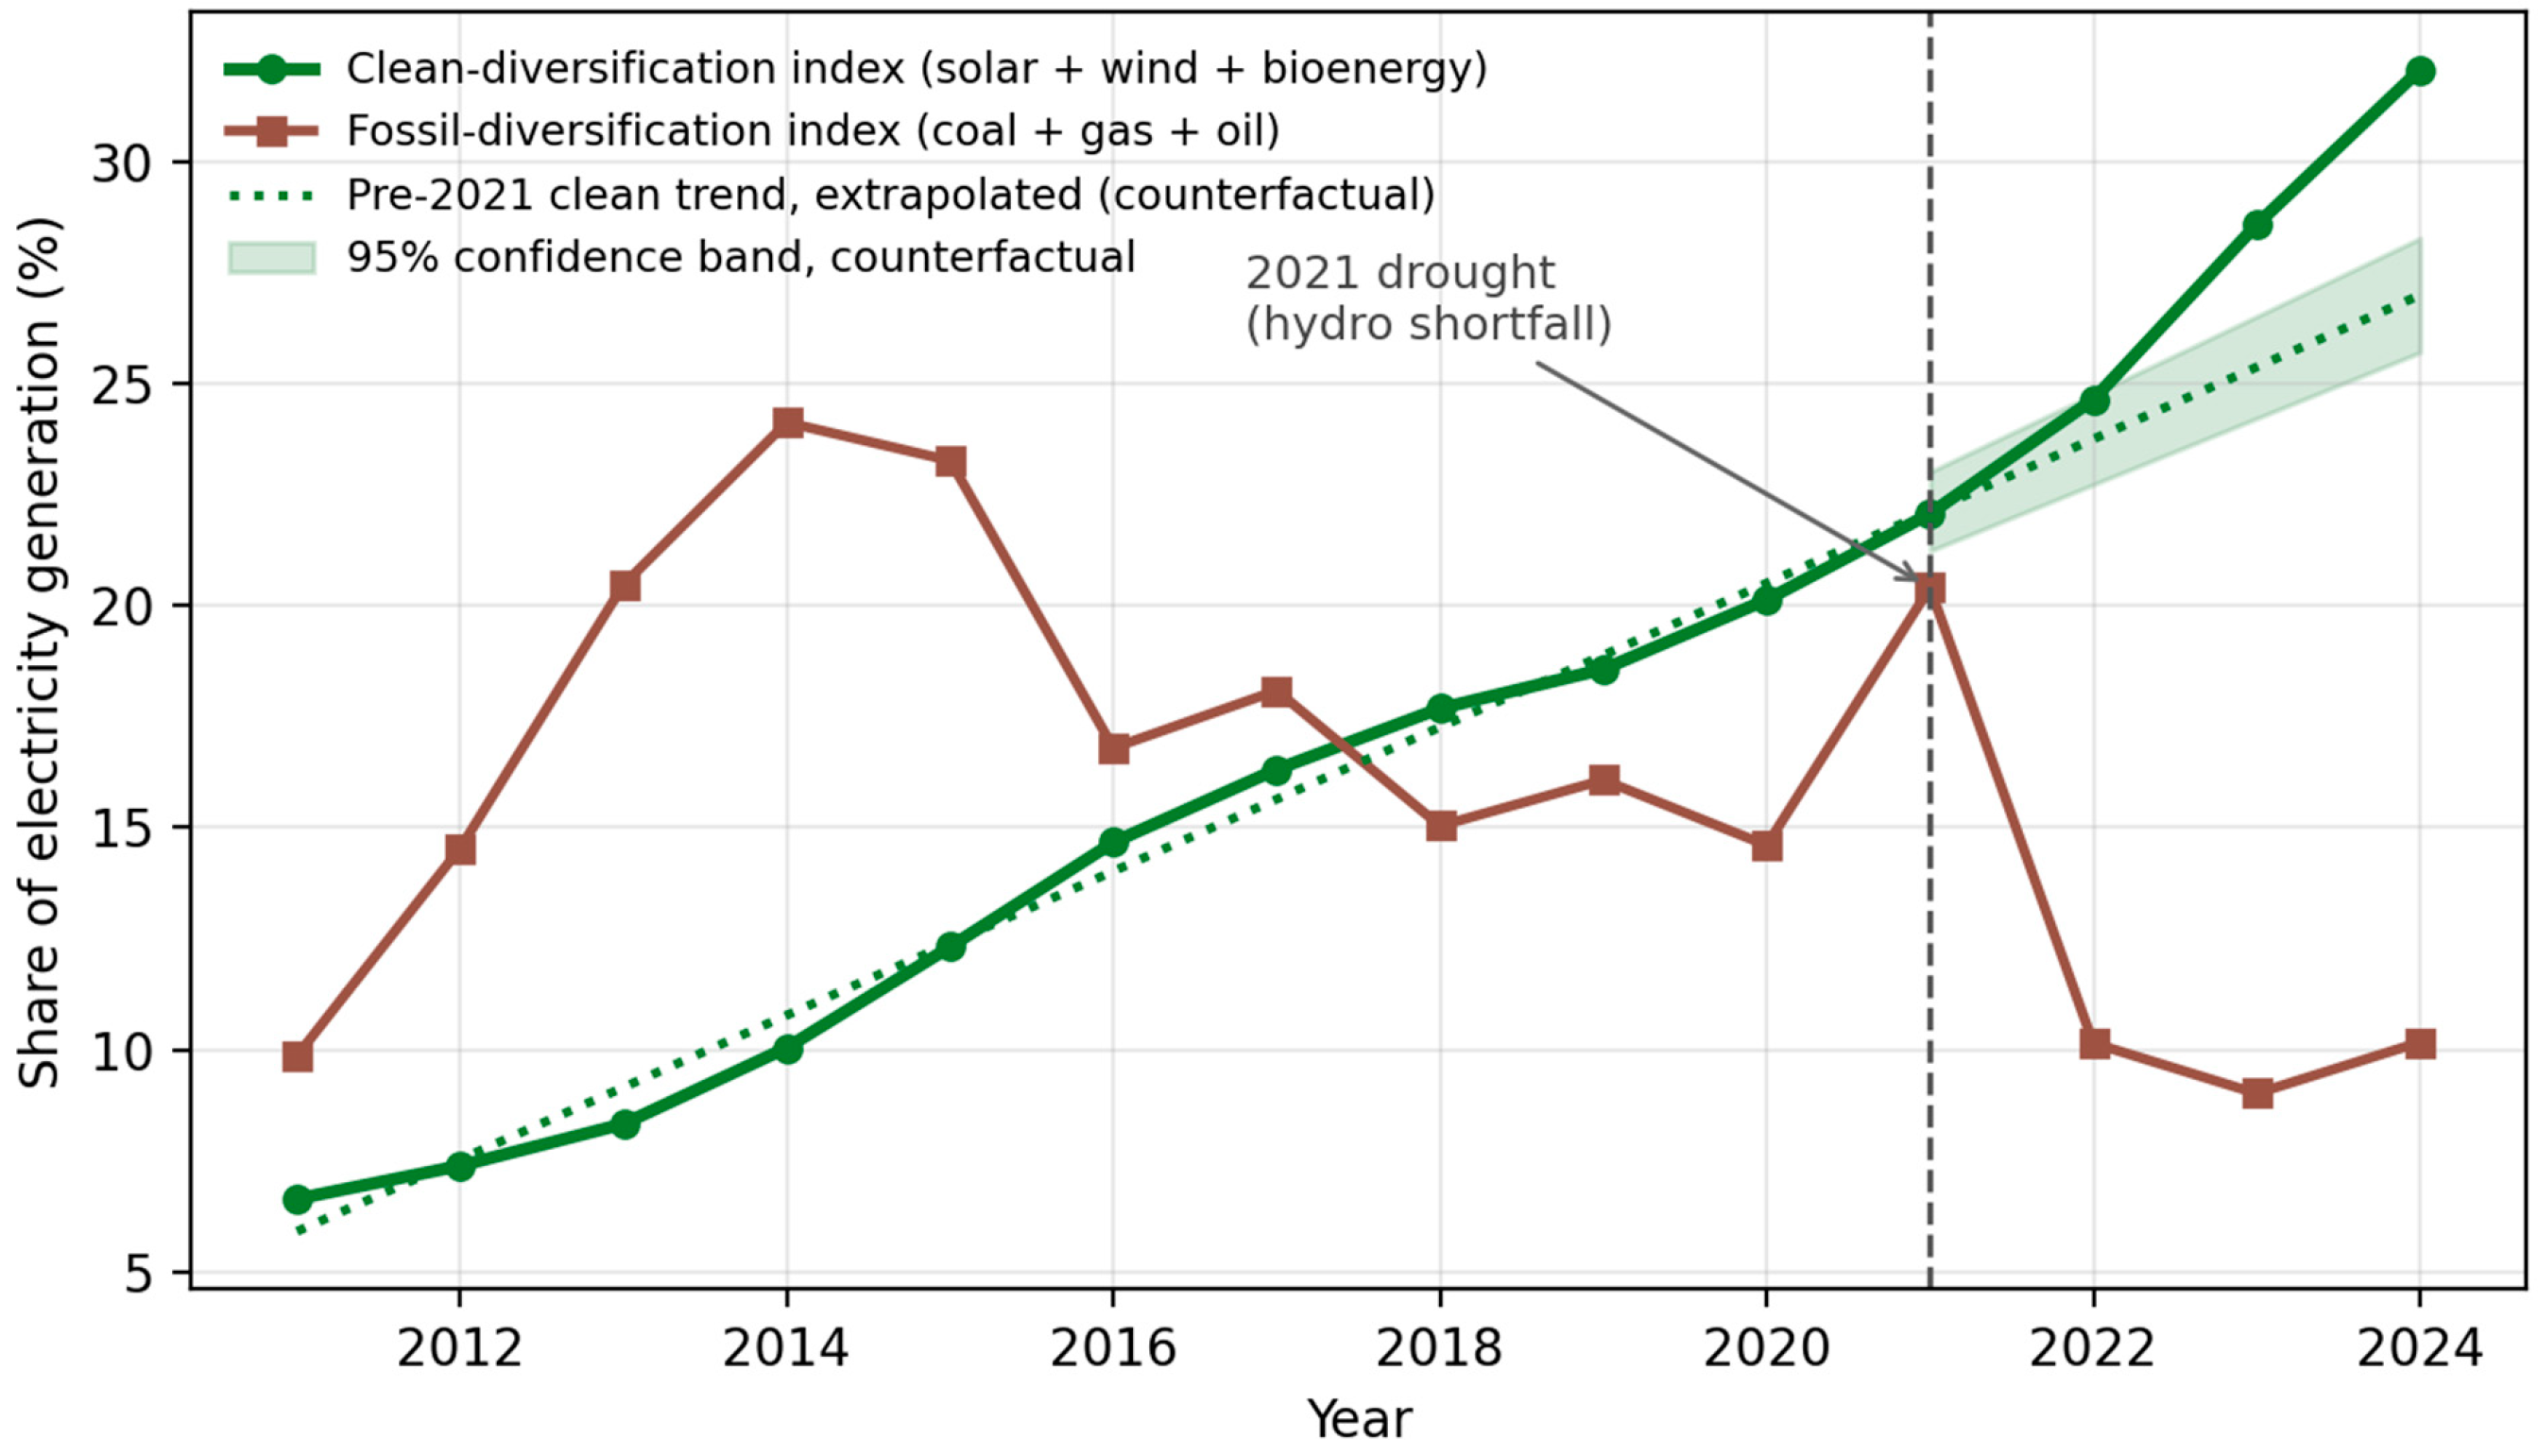
Brazil’s clean-diversification index shows no significant permanent level shift at the 2021 drought ( = −0.38, not significant), which is expected because a drought does not instantaneously add clean capacity. The slope, however, changes sharply: against a pre-2021 trend of +1.62 pp/yr, the post-2021 slope change is +1.77 pp/yr (t = 15.53; 95% CI 1.52 to 2.03), roughly doubling the trajectory to +3.39 pp/yr. By 2024, the index stood at 32.1%, against 27.0% on the extrapolated pre-crisis trend (95% confidence band 25.7–28.3%), a gap of about 5 percentage points in four years. This is the signature of a crisis that accelerates rather than displaces clean deployment. By contrast, the fossil-diversification index spikes transiently, from 14.6% in 2020 to 20.4% in 2021, before subsiding to about 10% by 2022, confirming that the short-run response was emergency thermal dispatch rather than any structural regression. Table 5 reports the Brazilian results.
Table 5.
Brazil ITS results for the 2021 drought episode. * p < 0.001; ns = not significant. 95% confidence intervals from Newey–West standard errors in brackets.
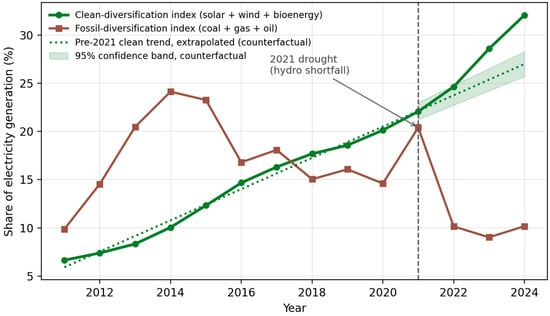
Figure 4 makes the Brazilian mechanism visible. The clean-diversification index rises steadily before 2021 and then diverges upward from its pre-crisis trend, while the fossil-diversification index shows a single sharp drought-year spike that quickly reverses. The shaded band is the 95% confidence interval of the extrapolated pre-crisis trend; the observed index leaves it from 2023, which is consistent with a slope change that builds over several years rather than a one-off jump.
Figure 4.
Brazil clean-diversification index (solar + wind + bioenergy) versus fossil-diversification index (coal + gas + oil), 2011–2024. The shaded band is the 95% confidence interval of the counterfactual trajectory.
A decomposition of the clean diversification gain qualifies its interpretation. Between 2020 and 2024, the solar share rose from 1.7% to 10.0% and the wind share from 9.1% to 14.5%, while the bioenergy share fell from 9.3% to 7.6%, so the post-crisis acceleration is a solar-and-wind phenomenon. Installed-capacity data from the national energy balance show that, of the 52.9 GW of solar and wind capacity added between 2020 and 2024, 31.3 GW (59%) was distributed micro- and mini-generation photovoltaics, 9.3 GW (18%) was utility-scale photovoltaics, and 12.4 GW (23%) was wind. Distributed generation expanded under a net-metering regime that was revised by new legislation in 2022 [34] (Section 5.2), so the post-2021 slope change cannot be attributed exclusively to the drought shock.
4.5. Difference-in-Differences Results
The DiD event studies test whether the ITS effects survive comparison with untreated controls that experienced the same global conditions. For Germany’s 2022 carbon-intensity episode, the donor pool comprises the 18 European Union member states with complete Ember series for 2000–2024 (Austria, Belgium, Bulgaria, Croatia, Cyprus, Czechia, Denmark, Estonia, France, Ireland, Italy, Luxembourg, Malta, Portugal, Romania, Slovenia, Spain, and Sweden), which share the European market and the 2022 price shock and, therefore, allow Germany’s specific exposure to be separated from the common European shock. The event study returns a positive gap of +15.5 gCO2/kWh in 2022 relative to 2021, consistent in sign with the ITS level shift and with the coal rebound that followed the curtailment of gas supply; the gap narrows to +10.8 in 2023 and +2.7 gCO2/kWh in 2024. The estimate is, however, not distinguishable from the placebo distribution: Germany’s 2022 gap ranks 10th of 19 units in absolute size (permutation p = 0.53), and its average post-crisis gap ranks 14th (p = 0.74). The pre-crisis event-time coefficients also fluctuate widely, between −34.5 and +38.1 gCO2/kWh over 2016–2020, so the parallel-trends assumption receives only weak support.
For Brazil, the parallel-trends assumption is threatened because the treated country and the Latin American donors (Argentina, Chile, Colombia, Mexico, and Peru, the five largest Latin American electricity systems other than Brazil and Venezuela, together with Uruguay as the region’s most advanced case of wind integration) follow different clean-diversification trajectories. The event study is, therefore, estimated on detrended series, removing each country’s own pre-2021 linear trend before comparing deviations, and the gap is normalised to zero in the year before the crisis. The detrended event study returns an average post-2021 treatment effect of about +4.7 pp over 2021–2024, with the gap widening to roughly +8 pp by 2024, which is consistent with an acceleration of Brazil’s clean diversification relative to its regional peers after the drought. Two diagnostics temper this reading. Firstly, the pre-crisis detrended gaps are not centred on zero but lie between +1.4 and +3.1 pp over 2011–2019 relative to the 2020 reference year, so the 2021–2022 gaps are of the same order as pre-crisis fluctuations, and only the 2023–2024 gaps clearly exceed them. Secondly, the estimate is sensitive to donor composition and is not distinguishable from the placebo distribution: Brazil’s average post-crisis gap ranks 4th of 7 units (p = 0.57), and excluding Uruguay, whose clean share rose steeply until 2018 and then levelled off at around half of generation, reduces the average gap from +4.7 to +0.4 pp, whereas excluding any other donor leaves it between +5.0 and +6.7 pp. Table 6 reports the event-time coefficients for both countries.
Table 6.
Difference-in-differences event-time gaps, normalised to the year before each crisis; k = 0 denotes 2021 for Brazil and 2022 for Germany. Placebo inference on the average post-crisis gap: Brazil ranks 4th of 7 units (p = 0.57); Germany ranks 14th of 19 units (p = 0.74).
4.6. Synthetic Control Results
The synthetic control method provides a third, design-based check. For Germany’s 2022 carbon-intensity episode, the synthetic Germany is formed from the same 18 donors and assigns positive weight to Estonia (0.42), Ireland (0.21), Malta (0.20), Sweden (0.10), Bulgaria (0.05), and Luxembourg (0.01). It reproduces Germany’s 2000–2021 intensity with a pre-crisis RMSPE of 11.8 gCO2/kWh (2.3% of the pre-crisis mean) and shows positive gaps of +12.9, +25.7, and +25.1 gCO2/kWh in 2022–2024. The post/pre RMSPE ratio of 1.87 ranks 5th of 19 in the placebo distribution (p = 0.26), so the gap agrees in sign with the ITS and DiD estimates without being distinguishable from placebo gaps. For Brazil’s clean-diversification index, a synthetic Brazil built from Latin American donors achieves a good pre-period fit (pre-crisis root-mean-square prediction error of about 4.7% of the pre-period mean); the synthetic unit is dominated by Chile (0.84), with Peru (0.13) and Uruguay (0.04). The post-2021 gap in levels is negative (−3.4 to −5.8 pp), because Chile’s own solar expansion after 2021 outpaced Brazil’s; once each unit’s pre-crisis trend is removed, the gap is close to zero in 2021–2023 and turns positive (+2.2 pp) only in 2024. Neither version is distinguishable from the placebo distribution (p = 0.43 and p = 1.00). The level SCM, therefore, does not corroborate a Brazil-specific acceleration relative to the regional frontier, and the comparative evidence for this outcome rests on the detrended event study.
A distinct and substantive finding concerns Brazil’s carbon intensity. Because Brazil’s hydro-dominated intensity lies far below that of every available Latin American comparator, no convex combination of donors can reproduce its pre-crisis path: the best attainable synthetic Brazil (Colombia 0.68, Uruguay 0.32) leaves a pre-crisis RMSPE of 50.3 gCO2/kWh, 44% of Brazil’s own 2000–2020 mean, and Brazil falls below the minimum of the entire donor pool in 9 of the 21 pre-crisis years. This is a convex-hull violation rather than a tuning problem, and it means that with a regional donor pool, synthetic control cannot credibly estimate the carbon-intensity effect for Brazil. The constraint is a property of the donor pool rather than of hydro systems as such: when the pool is extended to include the hydro-dominant systems of Paraguay and Venezuela, Brazil no longer falls below the donor minimum in any pre-crisis year and the pre-crisis RMSPE falls to 16.1 gCO2/kWh. This is reported as a feasibility diagnostic only, because the suitability of these two systems as untreated comparators, in particular Venezuela with its prolonged electricity-sector crisis, has not been assessed here. The carbon-intensity results for Brazil are, therefore, based on ITS alone and are treated as method-limited, whereas the clean-diversification results, which do satisfy the convex-hull requirement, are assessed together with the event-study evidence in Section 4.7. Table 7 summarizes the synthetic-control donor pools, weights, pre-crisis fit diagnostics, and placebo-based inference for the evaluated outcomes.
Table 7.
Synthetic control donor pools, weights, pre-crisis fit, and in-space placebo inference. BG Bulgaria, CL Chile, CO Colombia, EE Estonia, IE Ireland, LU Luxembourg, MT Malta, PE Peru, PY Paraguay, SE Sweden, UY Uruguay, VE Venezuela. The placebo rank orders the treated unit’s post/pre-crisis RMSPE ratio among all units; p is the rank divided by the number of units.
4.7. Cross-Method Convergence Assessment
To synthesise the evidence, each outcome is classified by the degree of convergence across the three designs. Three categories are used. An outcome is termed cross-method convergent when ITS, DiD, and SCM are all feasible and their point estimates share the same sign; the label describes directional agreement across designs with different identifying assumptions and does not imply that each estimate is individually significant. An outcome is termed partially corroborated when the ITS estimate is statistically precise (its 95% confidence interval excludes zero), at least one further design or pre-specified robustness specification agrees in sign, and no feasible design yields a statistically distinguishable effect of the opposite sign. An outcome is termed method-limited when no corroborating check is available or when the identification requirements of the comparative designs, such as the convex-hull condition, cannot be met. This classification provides a transparent framework for interpreting the consistency of results across methods. Table 8 applies these criteria.
Table 8.
Cross-method convergence assessment. A check mark indicates that the design’s point estimate agrees in sign with the ITS estimate and ✗ that it has the opposite sign; the value in parentheses is the design’s own p-value (HAC for ITS, placebo permutation for DiD and SCM); “ext.” denotes external difference-in-differences evidence for the same episode [22]; “infeasible” denotes the convex-hull violation for Brazil’s carbon intensity.
Germany’s 2022 carbon-intensity response is classified as cross-method convergent because all three designs agree in direction, although the individual estimates remain imprecise. The renewable-deployment findings are classified as partially corroborated because their ITS estimates are precise but independent comparative evidence is more limited.
5. Discussion
5.1. Qualified Support of Crisis-Driven Renewable Acceleration
Taken collectively, the findings provide qualified empirical support for the proposition that supply crises accelerate solar and wind deployment. The qualification matters: only one outcome (Germany’s 2022 carbon spike) is cross-method convergent, four are partially corroborated, and one is method-limited. This distribution reflects, at least in part, the difficulty of clean causal identification in macro-level energy series with short annual samples and many concurrent policy changes. In compact European urban centres, this macro-level expansion is further constrained by complex building morphology and mutual shading, which limits rooftop availability and requires advanced clustering and submodule integrated converter (subMIC) technologies to maximize solar yield [35,36]. It should be emphasised that partially corroborated findings are not null results: they are precise within-country estimates supported by at least one further check, and they fall short of cross-method convergence because a comparative design is unavailable, imprecise, or sensitive to donor composition [23,25,27].
That Germany’s post-2009 renewable slope change survives the exclusion of the financial-crisis trough is particularly informative, because the recession itself could have mechanically raised the renewable share by suppressing fossil-fired demand. The persistence of the acceleration once that trough is removed indicates that the acceleration was not a by-product of demand-side dynamics. It does not, however, separate the gas disruption from the renewable-support reform that entered into force in the same year (Section 5.2). This is consistent with the policy-feedback literature, which holds that supply crises create political openings for tightening transition policy even during recessions [1,3,37].
5.2. Policy Mechanisms Linking Supply Crises to Deployment
The link between crisis and deployment runs through policy and market channels that differ across the three cases, and identifying them clarifies what the estimated breaks can and cannot be attributed to. In Germany, the post-2009 acceleration coincides with the revised Renewable Energy Sources Act (EEG 2009), which was adopted in 2008 and entered into force on 1 January 2009, that is, before the January 2009 interruption of Russian gas transit through Ukraine. The photovoltaic expansion of 2010–2012 was driven largely by feed-in tariffs under this framework combined with rapidly falling module prices, and the subsequent revisions of 2012 and 2014 cut remuneration and introduced auctions [14]. The 2009 episode, therefore, coincides with, rather than causes, the policy change that sustained deployment, and the estimated slope change should be read as the joint effect of the supply shock and a pre-committed policy regime. The 2022 crisis produced a more direct legislative response, as the 2022 amendments to the EEG raised the target for renewable electricity to 80% of consumption by 2030 and expanded tender volumes within the frame set by REPowerEU [3,4]. The annual data capture the short-run coal response to this crisis but, with three post-crisis observations, not yet its deployment effect.
In Jordan, the channel was a deliberate legislative and procurement response. The Renewable Energy and Energy Efficiency Law No. 13 of 2012 opened the sector to independent producers through direct-proposal rounds and allowed net metering and wheeling for distributed systems, and it was adopted in the aftermath of the repeated interruptions of Egyptian gas supply [9,16]. The first utility-scale wind and solar plants contracted under this framework entered operation from 2015, which explains why the renewable response in Figure 3 appears about four years after the crisis rather than immediately [16,22]. The same framework also exposed the limits of crisis-driven expansion, since grid-integration constraints and long-term gas-import commitments led the government to slow new large-scale approvals from 2019 [16].
In Brazil, the immediate response to the 2021 drought was oriented to security of supply and relied on emergency thermal dispatch, which raised the fossil share of generation to about one-fifth [34]. The clean build-out that followed was carried by two pre-existing channels: long-term auctions and free-market contracting for utility-scale wind and solar [19,38], and distributed photovoltaics under net metering. The latter was reshaped by the 2022 legal framework for distributed micro- and mini-generation (Law 14.300/2022), which kept the existing compensation rules for systems requesting grid access within twelve months of its publication and phased in network charges for later entrants [34]. The implementation of this framework and its transition period constitute a contemporaneous policy development that may have contributed to the observed post-2021 solar acceleration, and distributed photovoltaics account for 59% of the solar and wind capacity added between 2020 and 2024 (Section 4.4). The ITS slope change should, therefore, not be interpreted as attributable exclusively to the drought shock. It is worth mentioning that the tariff increases that accompanied drought-induced thermal dispatch in 2021 raised the value of self-generation for consumers, so the crisis and the regulatory transition are unlikely to be fully independent channels.
5.3. The Brazilian Case: Two Mechanisms on Two Timescales
Brazil’s results reveal two structurally distinct mechanisms that a single diversification index would have conflated. The short-run mechanism is drought-induced fossil regression, captured by the transient fossil-diversification spike and its rapid reversal; this is not transition acceleration but its temporary opposite, and it raises carbon intensity through emergency oil and gas dispatch [34,39]. The medium-run mechanism is post-crisis clean-diversification acceleration, captured by the doubling of the clean-index slope and supported, though not independently confirmed, by the widening detrended gap. Together, these constitute a hydro-crisis signature: a short, sharp fossil spike followed by an accelerated and sustained solar-and-wind expansion as the crisis makes the case for diversification away from hydro concentration practically and politically compelling [18,19,38]. How much of this medium-run effect can be attributed to the drought itself remains uncertain, because the distributed-generation transition overlapped with it (Section 5.2). This is analogous to the geopolitical-crisis signature seen in Germany and Jordan, in which a carbon-intensity shock is followed by renewable acceleration, but the trigger differs: here, it is supply-reliability risk rather than price or import-security shocks that motivates the clean build-out.
5.4. The Hydro Paradox and the Limits of Synthetic Control
The infeasibility of synthetic control for Brazil’s carbon intensity with a regional donor pool is more than a technical limitation, since it reflects the structure of electricity systems in the region. Hydro-dominant economies occupy a distinct region of the technology-mix space: their carbon intensity is governed not by the fossil-versus-clean dichotomy that structures most comparative energy research but by the interaction of the hydro fraction with precipitation variability [18,40]. Comparative studies that apply synthetic control to the carbon intensity of Brazil, Paraguay, Norway, Zambia, or other hydro-heavy systems are, therefore, likely to face the same convex-hull problem unless the donor pool includes countries with comparable hydro shares and drought exposure [31,41,42]. This should be treated as a design constraint rather than a modelling failure. The extended-pool diagnostic in Section 4.6 shows that adding Paraguay and Venezuela restores convex-hull coverage for Brazil. Expanding the donor pool to hydro-dominant systems with comparable generation structures and drought exposure could, therefore, improve convex-hull coverage and potentially make SCM feasible; whether it would do so credibly depends on whether such donors are themselves free of supply shocks, which is an empirical question rather than an assumption of the present study.
5.5. Limitations
Several limitations require explicit statement. Firstly, Brazil’s carbon-intensity computation using static emission factors introduces measurement error that understates emissions in drought years, biasing the level shift downward. Secondly, Jordan’s first-difference specification identifies a shift in the average annual increment rather than separately estimating an instantaneous level discontinuity; consequently, the immediate 2011 response cannot be disentangled from the subsequent post-crisis trajectory. Thirdly, the Brazilian 2021 clean-slope estimate relies on only four post-crisis annual observations, so although the slope change is estimated with high precision, a single anomalous future observation could materially alter it. Fourthly, the German 2009 control specification addresses but does not eliminate the recession confound, because a GDP index does not fully capture electricity-demand dynamics driven by industrial-mix, temperature, and trade exposure. Fifthly, the analysis does not examine the distributional consequences of crisis-driven transitions, namely who bears the costs of disruption and who captures the benefits of subsequent renewable acceleration, which are important questions for political feasibility and social sustainability that lie beyond the present quantitative scope [3,43,44,45]. Sixthly, the comparative designs involve a single treated country and small donor pools, so the placebo-based p-values are coarse (the smallest attainable value is 1/19 for Germany and 1/7 for Brazil), and none of the DiD or SCM estimates is individually distinguishable from its placebo distribution. Lastly, policy changes that coincide with the crises, namely the EEG 2009 amendment in Germany and the 2022 distributed-generation framework in Brazil, cannot be separated from them by the designs used here.
5.6. Implications of the Limitations for Interpretation
Each of the limitations above can be examined in terms of the direction in which it is expected to move the estimates. Firstly, replacing static emission factors with dispatch-specific factors that capture the heat-rate penalty of ageing oil and diesel plants would raise Brazil’s computed intensity in drought years; the resulting measurement error is expected to affect the estimated level response more strongly than the slope estimate, so the 2021 carbon-intensity spike would, if anything, become larger, while the clean-diversification results, which do not depend on emission factors, would be unaffected. Secondly, a longer annual window for Jordan would not change the fact that the first-difference specification identifies a shift in the average annual increment, but monthly or plant-level data would allow the immediate 2011 response to be separated from the subsequent trajectory. Thirdly, additional post-crisis years for Brazil, together with separate outcome series for distributed and utility-scale photovoltaics, would show how much of the post-2021 slope change survives the end of the distributed-generation transition period; this is the finding most exposed to revision, and its classification could move downward if the acceleration proves to be concentrated in the 2022–2023 rush to connect distributed systems. Fourthly, a richer control for German electricity demand would sharpen the 2009 estimate, but the exclusion of the 2009–2010 trough already leaves the slope change unchanged at +1.20 pp/yr, so the classification is unlikely to change on this account; separating the supply shock from the EEG 2009 amendment would, however, require variation in exposure to the gas disruption that annual national data cannot provide.
These considerations bear directly on the policy-feedback interpretation. The policy-feedback literature holds that crises open windows in which new policies can be adopted and that such policies persist when they create constituencies with a stake in their continuation [6,37]. The evidence here is consistent with this reading in a qualified form: in each case, the sustained part of the acceleration is associated with an institutional channel that created such a constituency, namely the EEG and its beneficiaries in Germany, independent power producers under Law No. 13 of 2012 in Jordan, and distributed-generation prosumers in Brazil. These limitations primarily affect the attribution of the observed acceleration between the crisis and the associated policy response, particularly in Germany and Brazil. For the convex-hull problem, expanding the donor pool to hydro-dominant systems with comparable generation structures and drought exposure could improve convex-hull coverage and potentially make SCM feasible; whether it would do so is an empirical question rather than an assumption of the present study. If it did, Brazil’s carbon-intensity finding could move from method-limited to partially corroborated, while the conclusion that a regional donor pool cannot serve this purpose would remain.
6. Conclusions
This study asked whether energy supply crises are followed by a measurable acceleration of solar and wind deployment in structurally different electricity systems, and how firmly such an acceleration can be identified. Four episodes in Germany, Jordan, and Brazil were examined with interrupted time series, difference-in-differences, and synthetic control designs, and every estimate was reported with its confidence interval or placebo-based p-value.
Firstly, the renewable-deployment responses are large and precisely estimated within each country. Germany’s renewable share grew 1.19 pp/yr faster after 2009 (95% CI 0.87–1.51), an estimate unchanged when the financial-crisis trough is excluded, and stood about 14 percentage points above its pre-crisis trajectory by 2019. Jordan’s renewable-share increment rose by 1.90 pp/yr after 2011 and its carbon-intensity increment fell by 13.92 gCO2/kWh/yr, almost entirely through photovoltaics and wind. Brazil’s clean-diversification slope doubled after the 2021 drought, leaving the index about 5 percentage points above its pre-crisis trajectory by 2024. Secondly, the comparative designs corroborate these responses only in part. Germany’s 2022 carbon-intensity rise is the only effect on which ITS, DiD, and SCM agree in sign, yet each estimate is individually imprecise; Brazil’s detrended event study points in the same direction as its ITS but depends on a single donor, and its level synthetic control does not reproduce the effect. Thirdly, synthetic control cannot estimate Brazil’s carbon-intensity effect with regional donors because Brazil lies outside the convex hull of its neighbours, and adding hydro-dominant donors restores coverage, which makes this a constraint of donor-pool design rather than of hydro systems as such.
Based on the above, it could be concluded that, across the three cases, supply disruptions are followed by renewable-deployment changes consistent with the crisis acceleration hypothesis, but the strength of identification differs substantially across episodes. The German 2022 carbon-intensity response shows the broadest cross-method agreement, whereas the renewable-deployment findings are better interpreted as partially corroborated evidence than as universal causal effects. The comparative results, therefore, identify a recurring pattern across contrasting electricity systems that remains conditional on country-specific policy responses, contemporaneous shocks, and the availability of suitable counterfactuals. In each case, the sustained part of the acceleration ran through an institutional channel (a feed-in regime in Germany, a legal opening to independent producers in Jordan, and net metering in Brazil), which suggests that a crisis accelerates deployment when such a channel already exists or can be created quickly.
Several policy implications follow. For import-dependent economies such as Jordan, a procurement framework for independent producers should be in place before a supply shock occurs and should be planned together with grid and storage capacity, since Jordan’s response took about four years to appear and was later slowed by integration constraints. For hydro-dependent systems such as Brazil, the drought case shows that distributed generation can scale quickly when tariffs rise, but that the regulatory terms of net metering decide how much of this response persists. For industrial gas importers such as Germany, the 2022 episode shows that short-run coal substitution raises emissions even as it secures supply, which argues for pairing emergency measures with a pre-committed deployment path. This could be applicable to other import-dependent economies in the MENA region and to hydro-dependent systems facing increasing climate volatility. Future work using monthly or plant-level data, and donor pools selected for comparable generation structures, could sharpen the attribution between the crises and the policy responses that followed them.
Author Contributions
Conceptualization, A.A.; methodology, A.A. and C.d.O.R.; software, A.A. and M.Z.A.; validation, A.A. and C.d.O.R.; formal analysis, A.A. and M.Z.A.; investigation, A.A.; resources, A.A., M.Z.A. and C.d.O.R.; data curation, A.A.; original draft preparation, A.A.; review and editing, M.Z.A. and C.d.O.R.; visualization, A.A. and M.Z.A.; supervision, A.A. and C.d.O.R. All authors have read and agreed to the published version of the manuscript.
Funding
This work was supported by the Deanship of Scientific Research at the German Jordanian University through the Summer Research Fund (Grant No. 161/9/2025). The article processing charge (APC) for the publication of this article was funded by the Deanship of Scientific Research at the German Jordanian University.
Data Availability Statement
The electricity-mix, renewable-share, and carbon-intensity data are publicly available from Our World in Data and Ember (ourworldindata.org; ember-energy.org). Brazilian energy-balance data are available from the Empresa de Pesquisa Energética Balanço Energético Nacional (epe.gov.br). Real-GDP series are available from the World Bank World Development Indicators (data.worldbank.org). All quantitative results can be reproduced from these public sources using the procedures described in Section 2, Section 3 and Section 4. The analysis code is available from the corresponding author upon reasonable request.
Acknowledgments
The authors used claude.ai to assist with language refinement, text consistency, or paragraph structure. The authors reviewed and verified all AI-generated content and accept full responsibility for the accuracy, originality, and academic integrity of this work.
Conflicts of Interest
The authors declare no conflicts of interest.
References
- Steffen, B.; Patt, A. A Historical Turning Point? Early Evidence on How the Russia-Ukraine War Changes Public Support for Clean Energy Policies. Energy Res. Soc. Sci. 2022, 91, 102758. [Google Scholar] [CrossRef] [Scilit]
- Luschini, A.C.; Rego, E.E.; Montebello, N. How Did the Russia–Ukraine War Impact Energy Imports and Electricity Generation? A Comparative Analysis between Germany and the United Kingdom. Electr. J. 2024, 37, 107396. [Google Scholar] [CrossRef] [Scilit]
- Kuzemko, C.; Blondeel, M.; Dupont, C.; Brisbois, M.C. Russia’s War on Ukraine, European Energy Policy Responses & Implications for Sustainable Transformations. Energy Res. Soc. Sci. 2022, 93, 102842. [Google Scholar] [CrossRef] [Scilit]
- Pavlenko, A.; Cherp, A. Do Energy Security Crises Accelerate Decarbonisation? The Case of REPowerEU. Energies 2026, 19, 200. [Google Scholar] [CrossRef] [Scilit]
- Unruh, G.C. Understanding Carbon Lock-In. Energy Policy 2000, 28, 817–830. [Google Scholar] [CrossRef] [Scilit]
- Meckling, J.; Kelsey, N.; Biber, E.; Zysman, J. Winning Coalitions for Climate Policy. Science 2015, 349, 1170–1171. [Google Scholar] [CrossRef] [Scilit] [PubMed]
- Hille, E. Europe’s Energy Crisis: Are Geopolitical Risks in Source Countries of Fossil Fuels Accelerating the Transition to Renewable Energy? Energy Econ. 2023, 127, 107061. [Google Scholar] [CrossRef] [Scilit]
- Cherp, A.; Vinichenko, V.; Tosun, J.; Gordon, J.A.; Jewell, J. National Growth Dynamics of Wind and Solar Power Compared to the Growth Required for Global Climate Targets. Nat. Energy 2021, 6, 742–754. [Google Scholar] [CrossRef] [Scilit]
- Alshwawra, A.; Almuhtady, A.; Sakhrieh, A. Electricity System Security in Jordan: A Response for Arab Uprising. Heliyon 2023, 9, e15961. [Google Scholar] [CrossRef] [Scilit] [PubMed]
- Markard, J.; Raven, R.; Truffer, B. Sustainability Transitions: An Emerging Field of Research and Its Prospects. Res. Policy 2012, 41, 955–967. [Google Scholar] [CrossRef] [Scilit]
- Alshwawra, A.; Almuhtady, A. Impact of Regional Conflicts on Energy Security in Jordan. Int. J. Energy Econ. Policy 2020, 10, 45–50. [Google Scholar] [CrossRef] [Scilit]
- Schmidt, J.; Cancella, R.; Pereira, A.O. An Optimal Mix of Solar PV, Wind and Hydro Power for a Low-Carbon Electricity Supply in Brazil. Renew. Energy 2016, 85, 137–147. [Google Scholar] [CrossRef] [Scilit]
- Pacheco-Cano, W.A.; Peña-Becerra, C.A.; Castro-Sitiriche, M. Boricua Energy Justice Visualization. Energies 2025, 18, 72. [Google Scholar] [CrossRef] [Scilit]
- Morris, C.; Jungjohann, A. Energy Democracy: Germany’s Energiewende to Renewables; Palgrave Macmillan: Cham, Switzerland, 2016. [Google Scholar]
- Alshwawra, A.; Almuhtady, A. Impact of Turmoil and Gas Resources in the Eastern Mediterranean on Jordanian Energy Security and Foreign Policy. Insight Turk. 2020, 22, 237–255. [Google Scholar] [CrossRef] [Scilit]
- Schuetze, B.; Hussein, H. The Geopolitical Economy of an Undermined Energy Transition: The Case of Jordan. Energy Policy 2023, 180, 113655. [Google Scholar] [CrossRef] [Scilit]
- Rugthaicharoencheep, N.; Ruangsap, N.; Nedphokaew, S. Shortening the Payback Period of Greenhouse Gas Reduction Benefits from Photovoltaic Rooftop Systems. Energies 2024, 17, 6159. [Google Scholar] [CrossRef] [Scilit]
- Cuartas, L.A.; Cunha, A.P.M.d.A.; Alves, J.A.; Parra, L.M.P.; Deusdará-Leal, K.; Costa, L.C.O.; Molina, R.D.; Amore, D.; Broedel, E.; Seluchi, M.E.; et al. Recent Hydrological Droughts in Brazil and Their Impact on Hydropower Generation. Water 2022, 14, 601. [Google Scholar] [CrossRef] [Scilit]
- Tolmasquim, M.T.; de Barros Correia, T.; Addas Porto, N.; Kruger, W. Electricity Market Design and Renewable Energy Auctions: The Case of Brazil. Energy Policy 2021, 158, 112558. [Google Scholar] [CrossRef] [Scilit]
- Madouros, P.; Katsigiannis, Y.; Pompodakis, E.; Karapidakis, E.; Stavrakakis, G. Study of a University Campus Smart Microgrid That Contains Photovoltaics and Battery Storage with Zero Feed-In Operation. Solar 2026, 6, 8. [Google Scholar] [CrossRef] [Scilit]
- Alshwawra, A.; Almuhtady, A.; Otte, R.; Ribeiro, C.d.O.; Rego, E.E. Geopolitical Gas Disruptions and Sustainable Energy-Security Convergence: Comparative Evidence from Germany and Jordan. Sustainability 2026, 18, 8617. [Google Scholar] [CrossRef] [Scilit]
- Bwaliez, O.M.; Alshwawra, A.; Ayash, M.Z.; Ribeiro, C.d.O.; Nascimento, C.A.O. Crisis-Induced Renewable Energy Transition in the MENA Region: Panel Difference-in-Differences Evidence from Jordan’s 2011 Gas Supply Collapse. Sustainability 2026, 18, 9270. [Google Scholar] [CrossRef] [Scilit]
- Bernal, J.L.; Cummins, S.; Gasparrini, A. Interrupted Time Series Regression for the Evaluation of Public Health Interventions: A Tutorial. Int. J. Epidemiol. 2017, 46, 348–355. [Google Scholar] [CrossRef] [Scilit] [PubMed]
- Shadish, W.R.; Cook, T.D.; Campbell, D.T. Experimental and Quasi-Experimental Designs for Generalized Causal Inference; Houghton Mifflin Company: Boston, MA, USA; New York, NY, USA, 2002. [Google Scholar]
- Kontopantelis, E.; Doran, T.; Springate, D.A.; Buchan, I.; Reeves, D. Regression Based Quasi-Experimental Approach When Randomisation Is Not an Option: Interrupted Time Series Analysis. BMJ 2015, 350, h2750. [Google Scholar] [CrossRef] [Scilit] [PubMed]
- Engle, R.F.; Granger, C.W.J. Co-Integration and Error Correction: Representation, Estimation, and Testing. Econometrica 1987, 55, 251–276. [Google Scholar] [CrossRef] [Scilit] [PubMed]
- Hausman, C.; Rapson, D.S. Regression Discontinuity in Time: Considerations for Empirical Applications. Annu. Rev. Resour. Econ. 2018, 10, 533–552. [Google Scholar] [CrossRef] [Scilit]
- Bernal, J.L.; Cummins, S.; Gasparrini, A. The Use of Controls in Interrupted Time Series Studies of Public Health Interventions. Int. J. Epidemiol. 2018, 47, 2082–2093. [Google Scholar] [CrossRef] [Scilit] [PubMed]
- Goodman-Bacon, A. Difference-in-Differences with Variation in Treatment Timing. J. Econom. 2021, 225, 254–277. [Google Scholar] [CrossRef] [Scilit]
- Callaway, B.; Sant’Anna, P.H.C. Difference-in-Differences with Multiple Time Periods. J. Econom. 2021, 225, 200–230. [Google Scholar] [CrossRef] [Scilit]
- Abadie, A.; Diamond, A.; Hainmueller, J. Synthetic Control Methods for Comparative Case Studies: Estimating the Effect of California’s Tobacco Control Program. J. Am. Stat. Assoc. 2010, 105, 493–505. [Google Scholar] [CrossRef] [Scilit]
- Schlömer, S.; Bruckner, T.; Fulton, L.; Hertwich, E.; McKinnon, A.; Perczyk, D.; Roy, J.; Schaeffer, R.; Sims, R.; Smith, P.; et al. Technology-Specific Cost and Performance Parameters. In Climate Change 2014: Mitigation of Climate Change; Cambridge University Press: Cambridge, UK, 2015; pp. 1329–1356. [Google Scholar]
- Zheng, S.; Ye, Z.; Lu, K.; He, T.; Liu, Y.; Zhang, L.; Hao, Y. Accounting for Non-CO2 Greenhouse Gases in Global PV Trade: Implications for Climate Responsibility and Policy. Sustain. Prod. Consum. 2026, 62, 55–69. [Google Scholar] [CrossRef] [Scilit]
- IRENA. The Energy Transition in Brazil; International Renewable Energy Agency: Abu Dhabi, United Arab Emirates, 2025. [Google Scholar]
- Gilabert-Torres, C.; Hontoria-García, L.; Fernández-Carrasco, J.I.; Mellit, A.; Rus-Casas, C. Integration of PV Systems in Urban Environments: Complementary Metrics to Analyze Their Performance. Energies 2025, 18, 4411. [Google Scholar] [CrossRef] [Scilit]
- Kampitsis, G.; Batzelis, E.; van Erp, R.; Matioli, E. Parallel Pv Configuration with Magnetic-Free Switched Capacitor Module-Level Converters for Partial Shading Conditions. Energies 2021, 14, 456. [Google Scholar] [CrossRef] [Scilit]
- Kingdon, J.W. Agendas, Alternatives, and Public Policies, 2nd ed.; Pearson Education Limited: Harlow, Essex, England, 2014. [Google Scholar]
- Fraundorfer, M.; Rabitz, F. The Brazilian Renewable Energy Policy Framework: Instrument Design and Coherence. Clim. Policy 2020, 20, 652–660. [Google Scholar] [CrossRef] [Scilit]
- International Energy Agency. World Energy Outlook 2022; International Energy Agency: Paris, France, 2022. [Google Scholar]
- Zhou, Z.; Botterud, A.; Levin, T. Price Formation in Zero-Carbon Electricity Markets—Fundamentals, Challenges, and Research Needs. Renew. Sustain. Energy Rev. 2025, 211, 115250. [Google Scholar] [CrossRef] [Scilit]
- Leroutier, M. Carbon Pricing and Power Sector Decarbonization: Evidence from the UK. J. Environ. Econ. Manag. 2022, 111, 102580. [Google Scholar] [CrossRef] [Scilit]
- Cunningham, S. Causal Inference; Yale University Press: New Haven, CT, USA, 2021. [Google Scholar]
- Carley, S.; Konisky, D.M. The Justice and Equity Implications of the Clean Energy Transition. Nat. Energy 2020, 5, 569–577. [Google Scholar] [CrossRef] [Scilit]
- Sovacool, B.K.; Turnheim, B.; Hook, A.; Brock, A.; Martiskainen, M. Dispossessed by Decarbonisation: Reducing Vulnerability, Injustice, and Inequality in the Lived Experience of Low-Carbon Pathways. World Dev. 2021, 137, 105116. [Google Scholar] [CrossRef] [Scilit]
- Cludius, J.; Hermann, H.; Matthes, F.C.; Graichen, V. The Merit Order Effect of Wind and Photovoltaic Electricity Generation in Germany 2008-2016 Estimation and Distributional Implications. Energy Econ. 2014, 44, 302–313. [Google Scholar] [CrossRef] [Scilit]

Disclaimer/Publisher’s Note: The statements, opinions and data contained in all publications are solely those of the individual author(s) and contributor(s) and not of MDPI and/or the editor(s). MDPI and/or the editor(s) disclaim responsibility for any injury to people or property resulting from any ideas, methods, instructions or products referred to in the content. |
© 2026 by the authors. Licensee MDPI, Basel, Switzerland. This article is an open access article distributed under the terms and conditions of the Creative Commons Attribution (CC BY) license.