


Abstract
This study investigates the short- and long-run relationships between renewable energy generation, electricity demand, and wholesale electricity prices in Poland. Despite the rapid expansion of renewable energy in Central and Eastern Europe, country-specific evidence on how wind and photovoltaic generation are associated with electricity prices across different time horizons remains limited. Using monthly time-series data from the Polish electricity market, the study employs an Autoregressive Distributed Lag (ARDL) bounds testing approach combined with an Error Correction Model (ECM) to examine short-run dynamics and long-run equilibrium relationships. The results provide evidence of a long-run cointegrating relationship among the variables (Bounds Test F-statistic = 626.54). In the short run, wind generation is negatively and statistically significantly associated with wholesale electricity prices (p < 0.001), a finding that is consistent with the merit-order effect, while electricity demand is positively associated with prices (p = 0.011). Photovoltaic generation does not exhibit a statistically significant short-run relationship with prices. In the long run, the estimated relationships differ from the short-run dynamics, while the statistically significant error-correction coefficient (ADJ = −0.0701, p = 0.033) indicates that approximately 7.01% of the previous period’s disequilibrium is corrected each month. Overall, the findings indicate that the relationships between renewable generation, electricity demand, and wholesale electricity prices vary across time horizons, highlighting the importance of distinguishing short-run price dynamics from long-run equilibrium relationships in the Polish electricity market.
1. Introduction
Fluctuations in electricity prices and the associated uncertainty faced by individual market participants represent not only a microeconomic issue but also a significant challenge for entire economies. The consumption of fossil fuel resources currently remains very high compared to renewable energy sources (RESs). Furthermore, rising demand exerts strong pressure on depleting fossil fuel reserves. Therefore, to meet the growing energy demand and mitigate the adverse effects of fossil fuel consumption, economies are transitioning toward energy generation from renewable sources, such as solar and wind energy [1]. Empirical research on non-renewable and renewable energy consumption indicates that non-renewable energy negatively impacts the environment, whereas renewable energy does not increase environmental pressure while exerting a positive effect on economic growth [2]. Nevertheless, fossil fuels continue to be the dominant energy source, outpacing renewables despite the rapid growth of the latter [3]. Wind turbines and commercial solar farms represent two primary sources of renewable energy [4]. Studies examining the impact of wind and solar energy have been conducted across various economic dimensions while also focusing on the favorable conditions required to foster investor confidence and social acceptance of wind and solar electricity generation [5].
An additional asset of RESs lies in their relatively low sensitivity to crude oil price fluctuations. This phenomenon is primarily attributable to the increasing economic efficiency and competitiveness of renewable technologies—which progressively decouple the cost of power generation from fossil fuel prices—as well as the growing significance of environmental benefits derived from mitigating greenhouse gas emissions and other negative externalities [6]. Moreover, the structural cohesion of energy systems and the availability of a broad RES portfolio, supported by robust regulatory frameworks, can play a pivotal role in curbing adverse climate impacts and the greenhouse effect [7]. Additionally, RESs can deliver electricity to off-grid populations in rural or geographically isolated areas, thereby enhancing energy security in specific regions [8,9].
However, the large-scale deployment of wind and photovoltaic power is constrained by uncertainty arising from their intermittency and reliance on seasonal weather conditions. Owing to this volatility, conventional generation is still required to mitigate power supply fluctuations [10]. Due to the high susceptibility of RESs to weather dynamics, power generation exhibits variable patterns across daily and seasonal cycles. This induces shifts in electricity demand, thereby necessitating greater flexibility within the power system [11]. Consequently, adopting hybrid solutions is often essential in this context [12,13]. Such approaches enable the deployment of renewable technologies—particularly solar power—in arid, off-grid regions [14].
The Polish economy plays a strategically important role in regional energy security and industrial supply chains. Historically, the country’s economy has been heavily dependent on fossil fuels, with coal accounting for the vast majority of primary energy consumption. As a result, Poland remains a leading greenhouse gas emitter in the EU, facing significant regulatory and economic pressures under the EU Emissions Trading System and the European Green Deal. However, it is important to note that Poland has embarked on an energy transition, characterized by the rapid development of variable renewable energy sources, particularly solar photovoltaics and wind power. Analyzing how the accelerated expansion of renewable capacity affects wholesale electricity prices in a coal-dominated, carbon-intensive market provides key policy and market lessons for other transition economies. The Polish wholesale electricity market operates within a rapidly evolving power system characterized by substantial capacity transformations and dynamic demand fundamentals. Gross national electricity consumption reached 175.2 TWh, reflecting sustained baseline demand across the economy. On the supply side, the generation mix has undergone a structural shift: while coal units still account for 52.2% of total generation, renewable energy sources have expanded to generate 31.4% of electricity and represent 51.3% (39.1 GW) of total achievable system capacity. This transformation is primarily driven by solar photovoltaics, which recorded an unprecedented 52.0% year-on-year growth rate. This acceleration of variable solar production led to an amplification of the merit-order effect and a reduction in system flexibility, directly contributing to an estimated reduction in annual renewable energy production of 1.4 TWh. Market equilibrium is further shaped by cross-border trade, with net electricity imports standing at 0.95 TWh, and internal system losses, where power plant self-consumption (7.7%) and grid transmission losses (5.0%) absorb 12.4% of total generated power. These demand dynamics and solar PV integration, and structural supply-side shifts establish the requisite empirical setting for econometric modeling of wholesale price formation in the domestic electricity sector [15]. Recent research emphasizes that the Polish power system is struggling with an adjustment problem between demand and supply, resulting from the historical dominance of inflexible coal assets and serious physical limitations of the grid, including aging infrastructure and limited energy storage capacity. Furthermore, there is high market concentration and the dominance of state-controlled entities, which limits competition, leads to arbitrary investment decisions, lowers residual demand indices (RSIs), and leads to rising margins, as measured by the high Lerner Index for coal-fired units. As a consequence, the influx of variable renewable energy sources increasingly interferes with the traditional generation system, causing bottlenecks and constraints during peak production hours [16,17]. This has necessitated forecasting changes in energy demand and prices over the long term [18]. However, although existing research primarily focuses on the qualitative, institutional, or regulatory aspects of this structural transformation, there remains a clear empirical gap regarding quantitative modeling of the dynamic interaction of these system rigidities and increases in renewable generation in shaping wholesale electricity prices.
In the context of the Polish electricity market, a notable research gap persists regarding a comprehensive empirical analysis of the impact of wind and solar power generation on electricity prices, accounting for both short-run dynamics and long-run equilibrium relationships. Extant literature focusing on Poland has largely concentrated on cross-country comparative studies across European economies or panel data models in which Poland was analyzed merely as one of several sample economies. For instance, empirical evidence [19] indicates that the relationship between hourly RES generation and electricity prices is negative in both Germany and Poland. Specifically, their findings revealed that in years characterized by a high RES share, the correlation coefficients between wind generation and electricity prices reached −0.57 and −0.47, respectively.
Thus, a key gap remains the insufficient identification of the dynamic relationship among RES generation, electricity demand, and wholesale prices in the Polish market—specifically with regard to distinguishing short-run effects from the long-run equilibrium relationship, as well as determining the price adjustment mechanism following exogenous shocks. Previous studies of this type have failed to explicitly capture short- and long-run relationships or direction of causality. This paper fills this empirical gap. The authors isolate the post-shock error correction mechanism and examine price responsiveness to variations in renewable power output.
The following research hypotheses were formulated:
H1.
The relationship between renewable energy production (wind and solar) and electricity demand and wholesale electricity prices differs in the short and long term.
H2.
The relationship between wind energy production and wholesale electricity prices is different from the relationship between photovoltaic energy production and wholesale electricity prices.
To empirically evaluate these hypotheses, we specify an Autoregressive Distributed Lag (ARDL) model alongside its Error Correction (ECM) representation. This approach effectively disentangles short-term price reactions to shifts in demand and renewable generation from the long-term process of structural equilibrium recovery following external shocks.
2. The Impact of Renewable Energy on Electricity Prices
In the macroeconomic literature, renewable energy is typically examined alongside a broad array of socio-economic and structural variables, including industrialization and electrification levels [20], gross domestic product (GDP), CO2 emissions [21], technological innovations [22], natural resource abundance, globalization [23], non-renewable energy consumption, livestock production [24], education, and female employment rates [25], with studies frequently considering reciprocal, unidirectional, or bidirectional causality [26]. A detailed synthesis of the core variables, econometric specifications, and empirical results from key studies is summarized in Appendix A.
Price dynamics analysis constitutes a fundamental component in evaluating power system efficiency. Wind and solar power are classified as variable renewable energy (VRE) sources, given that their generation profiles are intrinsically bound to ambient resource availability. This supply variability directly affects social welfare through its transmission into wholesale power prices. Owing to the non-storable nature of electrical energy at scale, price formation is critically governed by real-time supply–demand fundamentals. Consequently, spot market clearing prices fluctuate continuously, and treating electricity as a homogeneous commodity holds strictly at a specific point in time and node location [27]. As noted in [28], wholesale price, system demand, and renewable energy generation represent three closely interconnected structural pillars of the market, exhibiting complex dynamic interactions across intraday and multi-year horizons.
The supply side of the power market is increasingly shaped by the expansion of wind and solar capacity—technologies characterized by zero or near-zero marginal operational costs. In accordance with the merit order effect, lower-marginal-cost RES units displace more expensive conventional dispatchable generators from the merit order stack, exerting downward pressure on market clearing prices [29]. Concurrently, the rising penetration of intermittent renewables poses structural challenges, necessitating spatial diversification of generation assets to mitigate severe price cannibalization [30], as well as minimizing day-ahead and intraday forecasting errors in short-term markets [31]. Furthermore, institutional and regulatory framework conditions exert a substantial influence; empirical evidence [32] demonstrates that carbon emission allowance price volatility is driven by power sector fundamentals (crude oil prices, coal prices, and RES deployment) combined with climate policy uncertainty. While the merit order effect is widely documented in the empirical literature, its magnitude exhibits substantial heterogeneity across geographical regions and empirical methodologies [33].
The existing empirical literature demonstrates that the magnitude and direction of the RES impact on power prices are non-uniform, depending on market-specific structural attributes and applied econometric methodologies. Empirical findings for Germany indicate that price dynamics are predominantly driven by price persistence, expected load, and day-ahead wind generation forecasts, with short-term fuel price shocks exhibiting a secondary impact [34]. Conversely, evidence from the Netherlands shows only a marginal effect of wind power on clearing prices and an unstable relationship regarding solar generation [35]. Market analyses for Japan confirm a non-linear demand response to price spikes alongside a statistically significant solar merit order effect, whereas wind power yields no discernable impact [36]. As evidenced by Colombia, renewable integration reduces power sector emissions and wholesale electricity tariffs while enhancing security of supply [37]. In contrast, aggregated cross-country analyses for 27 EU member states indicate a marginal or negligible impact of wind and solar output on end-user tariffs [38], which in certain regional markets is driven by the displacement of renewables as fossil fuel availability increases [39]. Thus, the strength of the merit order effect is endogenous to the stage of RES market integration.
Market dependencies also propagate to interrelated commodity markets and asset valuations. Utilizing a Nonlinear ARDL (NARDL) approach, empirical research demonstrates structural asymmetries and significant transmission of RES generation shocks into green equity valuations [40], with inter-market links between the RES sector and commodity markets being strongly conditioned by systemic exogenous shocks such as the COVID-19 pandemic [41]. In addition, long-term power infrastructure capital expenditures are modulated by global commodity super-cycles [42]. Another critical phenomenon is the cannibalization effect: rapid capacity expansion of VRE can paradoxically erode the economic return and investment viability of subsequent renewable projects [43,44]. Comprehensive evidence across 30 European power markets reveals cross-border cannibalization effects driven by regional capacity imbalances and interconnector bottlenecks [45].
The divergence and contradictory conclusions observed in the literature stem largely from the fact that most empirical designs rely on static dependence measures (e.g., simple correlations), high-frequency daily/hourly data models, or aggregated panel data frameworks. Existing studies rarely disentangle short-run market shocks from long-run equilibrium adjustment mechanisms within a unified structural model for a single bidding zone. To address this limitation, this study employs an Autoregressive Distributed Lag (ARDL) model combined with an Error Correction Model (ECM) specification. This framework enables the separation of the long-run equilibrium adjustment mechanism following exogenous shocks from short-run price responses to fluctuations in renewable generation and system demand.
3. Materials and Methods
The empirical study focuses on four variables reflecting selected aspects of the Polish electricity market: wholesale energy prices, wind and solar energy production (supply side), and total system load (demand side). This approach allows for the analysis of short-term dynamics and long-term equilibrium relationships between energy prices, renewable energy production, and energy demand. The model does not account for other determinants of wholesale energy prices, such as fossil fuel prices, CO2 emission allowance prices, cross-border energy flows, and the generation structure of conventional energy. As a result, the estimated relationships may partially reflect the influence of omitted market factors, limiting the possibility of causal interpretation.
All time-series data utilized in this study were retrieved from the Ember database (Ember Monthly Electricity Data—https://ember-energy.org/data/) (accessed on 25 August 2026), which aggregates and verifies official statistics provided by European transmission system operators (TSOs). The empirical analysis relies on monthly time-series data for Poland, spanning the period from January 2015 to December 2025. A complete description of the variables is presented in Table 1.
Table 1.
Description of variables.
All analyzed variables were subjected to the Inverse Hyperbolic Sine (IHS) transformation. This transformation consists of adding a positive, observation-specific value to the variable prior to applying the logarithmic function [46]. The rationale for employing this approach stems from the presence of seasonal zero values in certain series. In such instances, calculating the standard natural logarithm to enable elasticity interpretations is impossible. The IHS transformation approximates the natural logarithm for sufficiently large positive values while remaining defined at zero. It is therefore useful when the data contain zero-valued observations for which a standard logarithmic transformation cannot be applied. However, the logarithmic approximation becomes less accurate for small values and observations equal to zero. The renewable generation variables (Solar and Wind) were multiplied by 100 before applying the IHS transformation. This rescaling changes the numerical scale of the transformed variables and does not, in general, affect only the intercept of the estimated regression. As discussed by Bellemare and Wichman [47], the interpretation of IHS-transformed regression coefficients depends on the scale of the variables and on the range of observed values. Although the average values of the scaled series may indicate that the logarithmic approximation is reasonable for typical observations, they do not establish that the approximation is equally accurate throughout the sample. Accordingly, the coefficients in the IHS–IHS specification are interpreted as approximate elasticities where the large-value approximation is applicable, rather than as exact standard percentage elasticities for all observations.
Additionally, the variables representing renewable energy generation (Solar and Wind) were rescaled by multiplying them by 100 prior to applying the IHS transformation. This scaling procedure was implemented to ensure numerical stability in the ARDL estimation algorithm. As noted by [48], the application of the IHS function—much like natural logarithmic or categorical transformations—represents a robust alternative to standard data transformation techniques commonly used in empirical research. The IHS function is expressed as follows:
where x denotes the original variable, and ihs(x) represents its transformed counterpart. The inverse hyperbolic sine transformation closely approximates the log–log specification. Unlike the logarithmic transformation, the inverse hyperbolic sine (IHS) transformation does not yield coefficients that can be interpreted as exact elasticities across the entire range of observations. An interpretation in terms of elasticities is only approximate, and it becomes more accurate as the transformed variables take on sufficiently large positive values. Scaling the variables prior to applying the IHS transformation can affect the interpretation of the estimated coefficients; its effects are therefore not limited to changes in the intercept term. Although the mean values of the scaled series, for renewable energy production, might suggest that a logarithmic approximation is appropriate for typical observations, this does not imply that it holds true for every individual observation. Consequently, the estimated coefficients should be interpreted as approximate elasticities only where the large-value approximation is sufficiently accurate. To examine the relationship among electricity prices, RES generation, and system demand, this study employs the Autoregressive Distributed Lag (ARDL) modeling framework pioneeringly developed by Pesaran. A distinct advantage of the ARDL framework is its flexibility regarding the order of integration of the underlying time series, as it remains valid whether variables are purely I(0), purely I(1), or mutually cointegrated. However, the ARDL limit testing approach requires that none of the variables be integrated to degree two, I(2).
Modeling within the ARDL approach allows for the consideration of dynamic relationships by incorporating time-varying (lagged) values of variables and allows for the use of different lag structures for individual regressors. However, the selection of an appropriate lag structure alone does not eliminate potential endogeneity or the occurrence of feedback loops between variables. Although wind and solar energy production depends on weather conditions, the observed monthly production may also be influenced by installed capacity, technical availability, grid constraints, generation curtailment, and other power system conditions. Similarly, the assumed relationship between electricity demand and prices does not exclude the occurrence of potential feedback loops. These considerations warrant a cautious interpretation of the estimated coefficients and are considered limitations of the single-equation model. It should be noted, however, that this model demonstrates excellent properties in small samples and simultaneously assesses both short- and long-term dynamic interactions [49]. The ARDL approach incorporates an error correction mechanism that clarifies how short-run dynamics adjust toward long-run equilibrium states [50]. Additional advantages offered by the ARDL model include its suitability for limited sample sizes and the flexibility to assign differential lag structures to individual regressors [51]. The Bounds Testing procedure is used to assess whether a statistically significant long-run relationship exists among the variables. When cointegration is supported, the error-correction representation allows the adjustment toward the estimated long-run equilibrium to be examined alongside short-run dynamics. Claims regarding directional Granger causality, however, require appropriate additional testing and cannot be established solely by the Bounds Test or the statistical significance of the error-correction term. In this study, the lag structure was selected using the Bayesian information criterion (BIC), assuming a maximum lag length of 12 months. This approach allowed the model selection procedure to incorporate dynamic dependencies spanning a one-year horizon [52]. However, it should be noted that the maximum lag length itself does not provide a direct control mechanism for seasonality. The extent to which the chosen model specification incorporates seasonal patterns depends on the actual lag structure and any seasonal control variables. Therefore, the interpretation of the results takes into account the possibility that some seasonal effects were not sufficiently captured. To verify the existence of a long-run equilibrium relationship, the Bounds Test for cointegration was conducted. Upon confirming cointegration, the ARDL model is reparameterized into its Error Correction Model (ARDL-ECM) representation:
where:
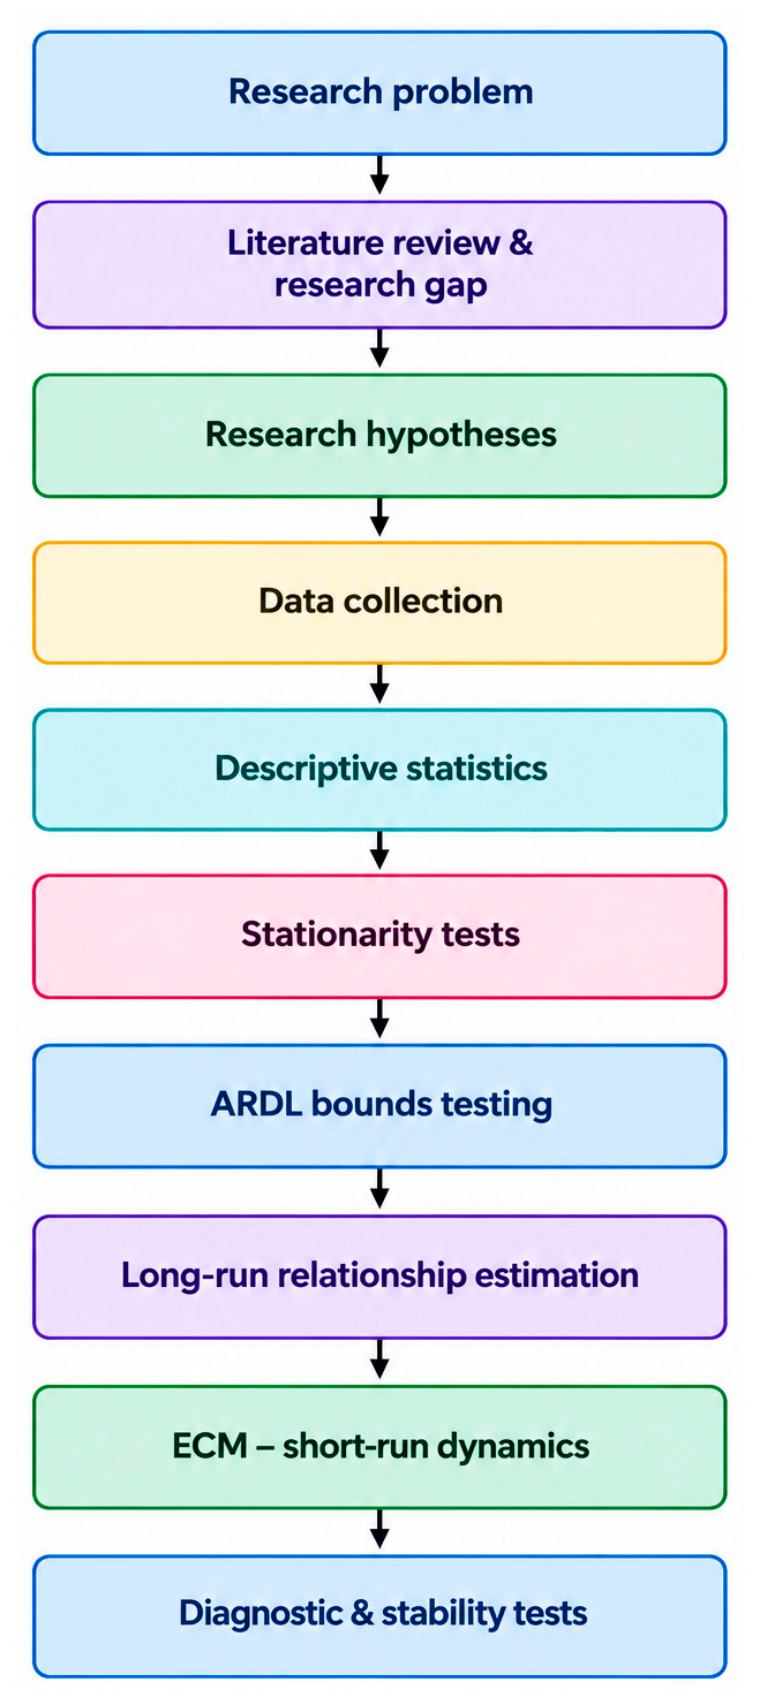
α0—constant term; p, q1, q2, q3—optimal lag orders selected for each variable; γi, β1,j, β2,k, β3,m—short-run dynamic parameters; ECTt−1—lagged Error Correction Term derived from the long-run cointegrating vector; Ø—speed-of-adjustment parameter, measuring how quickly electricity price reverts to its long-run equilibrium following a short-run market shock; and et—white noise error term. The research procedure is presented graphically in Appendix B.
4. Results and Discussion
A widely adopted procedure for evaluating unit root properties is the Augmented Dickey–Fuller (ADF) test, which was applied, inter alia, in [53] alongside the Kwiatkowski–Phillips–Schmidt–Shin (KPSS) test, as well as the Phillips–Perron (PP) test.
The tests indicate that Solar and Price are non-stationary in levels but become stationary after first differencing, whereas Wind and Demand are stationary in levels (Table 2). Importantly, none of the variables is integrated of order two, I(2), satisfying the integration-order requirement for the ARDL approach (Table 3).
Table 2.
Unit root test results.
Table 3.
ARDL (1, 0, 1, 1) model estimation results for Poland.
The overall goodness-of-fit of the model is highly satisfactory. The coefficient of determination R2 of approximately 0.96 indicates that roughly 96% of the variance in wholesale electricity prices is explained by the explanatory variables specified in the model, including weather-dependent renewable power generation, electricity demand, and lagged price terms. The remaining portion of the variance is attributable to omitted exogenous factors and the stochastic error term. The empirical results clearly indicate that the current price level directly depends on its lagged values and is statistically significant. This highlights a prominent intertemporal transmission mechanism in electricity prices, confirming high persistence and memory within the price series. Regarding solar photovoltaic generation, only the concurrent term proved to be statistically significant, being positively associated with the wholesale electricity price in the estimated short-run specification. This result indicates a positive conditional statistical association between solar generation and the wholesale electricity price in the short-run specification. However, the estimated coefficient should not be interpreted as an independent or causal effect of photovoltaic generation on wholesale electricity prices. The positive sign should be interpreted with particular caution because solar generation is simultaneously related to a number of other market conditions that may affect electricity prices, including electricity demand, fossil-fuel prices, CO2 allowance prices, regulatory conditions, and the overall generation mix. Some of these factors are not explicitly included in the present model, partly because sufficiently consistent monthly data were not available for the entire study period. Consequently, the estimated Solar coefficient may partly reflect the combined influence of solar generation and other market determinants that are not separately identified in the model.
The positive coefficient also does not provide, by itself, direct evidence of the solar value cannibalization mechanism. The cannibalization effect generally refers to a decline in the market value or capture price of solar generation as photovoltaic penetration increases, particularly when solar production is concentrated in the same hours. Such a mechanism does not necessarily imply a positive relationship between aggregate solar generation and the average wholesale electricity price. Therefore, the present result should not be interpreted as evidence that increasing solar generation directly raises wholesale electricity prices through cannibalization. Although value cannibalization is a recognized phenomenon in electricity markets with increasing shares of variable renewable generation, the present monthly ARDL–ECM model does not directly measure solar capture prices or identify the cannibalization mechanism. Therefore, this mechanism may provide broader market context but cannot be used to explain the positive estimated long-run Solar coefficient as an established causal relationship. Furthermore, attention should be drawn to the high and statistically significant coefficient on the lagged price term. By contrast, wind power generation exhibits a fundamentally different dynamic. For the concurrent period, the estimated coefficient is negative: strong wind output in the current period depresses market clearing prices, which is fully consistent with the merit order effect. However, the one-period lagged coefficient is positive and likewise statistically significant, representing a post-shock correction mechanism. In light of these findings, part of the initial merit order effect is progressively offset in the subsequent period, illustrating the dynamic nature of wind power transmission into wholesale prices. In line with theoretical expectations, concurrent system demand emerged as the most influential variable. Current electricity demand exerts the strongest positive impact on current price levels, whereas lagged demand displays a negative impact. An expansion in energy demand drives prices upward primarily in the period of the initial shock, whereas in the subsequent period, a portion of this increase is reversed as the supply side and broader market conditions adjust. An essential underlying dimension of this adjustment process is the aforementioned price inertia. This interpretation is particularly crucial when considering the co-occurring negative impact of concurrent wind generation, as it demonstrates that system demand and renewable output influence prices via opposing structural mechanisms linked to the formation of residual load. To evaluate the robustness of the model against serial correlation, the Breusch–Godfrey LM test was performed, the results of which are presented in Table 4.
Table 4.
Breusch–Godfrey LM test for autocorrelation.
For the Breusch–Godfrey test, the null hypothesis (H0) states that there is no serial correlation in the residuals. Since all calculated p-values exceed the 0.05 threshold (p > 0.05), we fail to reject the null hypothesis. Thus, the test results provide no statistically significant evidence of residual serial correlation at the tested lag orders.
Furthermore, the Ramsey RESET test was conducted to verify the appropriate functional form of the model, yielding F(3, 110) = 1.76 (p = 0.1599), which confirms that the model is correctly specified. To test for potential heteroskedasticity, the Breusch–Pagan/Cook–Weisberg test was applied. The resulting test statistic of chi2 (1) = 0.25 (p = 0.6186) indicates that we fail to reject the null hypothesis of constant variance. Additionally, to verify the absence of dynamic volatility clustering, Engle’s ARCH-LM test for autoregressive conditional heteroskedasticity was applied to the model residuals. The test yielded a p-value of 0.1088 (chi2 = 2.572), failing to reject the null hypothesis of no ARCH effects at the 5% significance level. This confirms that the error variance remains dynamically stable over time.
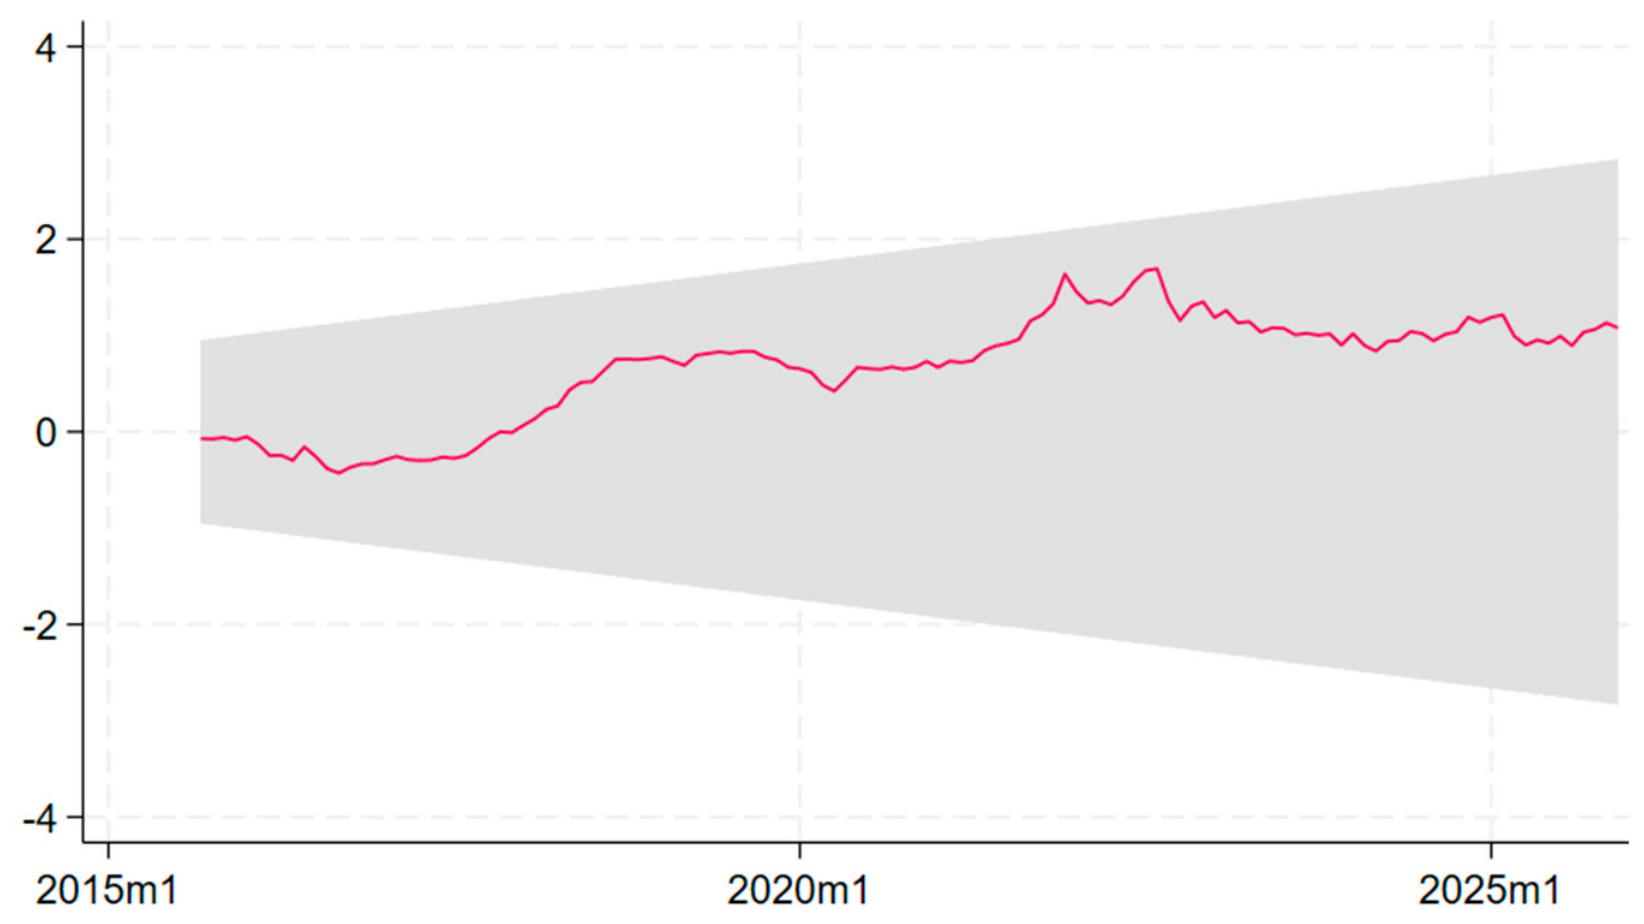
To ensure that the estimated relationships were not confounded by structural breaks during the analyzed period of 2015–2025, parameter stability was assessed using the recursive CUSUM (Cumulative Sum) test. The null hypothesis (H0) assumes parameter stability throughout the sample period, while the alternative hypothesis (H1) assumes structural failure or parameter instability. The calculated test statistic (0.7360) is below the 5% critical value (0.9479), falling within the 95% confidence interval. Therefore, the null hypothesis (H0) cannot be rejected, indicating no statistically significant evidence of parameter instability over the period under study (CUSUM test; Figure 1).
Figure 1.
Recursive CUSUM plot of variable Price. The x-axis represents the time horizon (monthly sequence from 2015 to 2025), while the y-axis shows the cumulative sum of recursive residuals.
Consequently, assessing the existence of a stable long-run equilibrium relationship becomes appropriate. To this end, an ARDL model reparameterized in Error Correction (EC) form was estimated. The results are structured into three primary components: the adjustment dynamics (ADJ), the long-run equilibrium relationships (LR), and the short-run dynamics (SR) (Table 5).
Table 5.
ARDL Error Correction Model estimation results.
The ADJ coefficient is negative and statistically significant (ADJ = −0.0701; p = 0.033), indicating an adjustment to the estimated long-run equilibrium relationship. Its value suggests that in each subsequent month, approximately 7.0% of the disequilibrium from the previous period is corrected (under the assumptions of the adopted model). This result confirms the existence of an adjustment mechanism to the long-run equilibrium relationship, but does not in itself determine the direction of the causal impact of individual explanatory variables on electricity prices. The LR (long-run) section indicates the impact of the explanatory variables on prices in the long horizon—that is, after all short-run shocks have dissipated. The estimated long-run coefficient for Solar is positive and statistically significant. Under the large-value approximation of the IHS transformation, it may be interpreted as an approximate positive long-run association between solar generation and wholesale electricity prices. However, this relationship should not be interpreted as evidence that solar photovoltaic deployment causes higher electricity prices, particularly given the potential influence of omitted market factors and the limitations of the monthly data. For wind power, a negative impact on the price level was recorded, implying that a 1% increase in wind generation reduces prices by roughly 0.9%; however, this coefficient lacks statistical significance. An interesting divergence emerges between the short-run impact of wind generation and the long-run relationship for solar power. While concurrent increases in wind generation exert downward pressure on prices, consistent with the merit order effect, the positive long-run coefficient for solar PV should not be interpreted as a contradictory causal effect. Instead, it reflects interdependencies among variables within the long-run equilibrium framework. The positive long-run Solar coefficient may reflect the combined influence of solar generation and other factors that are not separately identified in the model. Potential explanations include seasonal patterns, changes in installed generation capacity, demand fluctuations, and other market developments. However, the present specification does not allow the individual contribution of these factors to be identified. Similarly to the previous model specification, system demand proved to be the most responsive variable, having the largest estimated long-run coefficient among the explanatory variables, although it likewise lacked statistical significance over the analyzed sample period. The final SR (short-run) section illustrates how monthly changes in the variables affect prices on a month-to-month basis. Wind generation exhibits a highly significant, negative short-run impact: if monthly wind output increases by 1%, electricity prices immediately fall by an average of approximately 0.15% within the same month. This captures the pure short-run merit order effect, whereby zero-marginal-cost wind generation displaces more expensive thermal power plants. System demand also plays a crucial role in the short run: a 1-percentage-point monthly increase in electricity demand positively impacts prices by roughly 0.56%. The obtained results allow us to distinguish short-term dynamics from the adjustment process to the estimated long-run equilibrium relationship. In the short term, changes in wind energy production are negatively correlated with electricity prices (coefficient = −0.1537; p < 0.001), while changes in electricity demand show a positive correlation with prices (coefficient = 0.5671; p = 0.011). In the estimated error-corrected model specification, there was no significant short-run coefficient for solar energy. These results indicate the existence of statistically significant short-run relationships between wind energy and demand, but they do not, by themselves, confirm the existence of directed causality. The negative and statistically significant correction coefficient (ADJ = −0.0701; p = 0.033) indicates an ongoing adjustment process to the estimated long-term equilibrium relationship, with each subsequent month correcting approximately 7% of the imbalance from the previous period. However, the significance of the correction coefficient alone does not determine the direction of the long-term causal relationship between individual explanatory variables and price. To formally confirm the presence of cointegration, the bounds testing procedure developed by Pesaran, Shin, and Smith was implemented (Table 6).
Table 6.
Pesaran, Shin, and Smith cointegration bounds test.
Since the computed test statistic substantially exceeds the upper critical bound I(1) at the 1% significance level, the null hypothesis of no cointegration is rejected. This confirms the existence of a statistically significant long-run equilibrium relationship among wholesale electricity prices, solar and wind power generation, and system load within the ARDL-ECM framework.
5. Conclusions
An empirical econometric analysis using the ARDL-ECM model made it possible to examine short- and long-term relationships regarding wind and photovoltaic (PV) energy generation in Poland.
1. The results indicate that the estimated relationships between renewable electricity generation, energy demand, and wholesale energy prices differ depending on whether short-term dynamics or the long-term equilibrium relationship is analyzed. In the short term, wind power generation shows a negative correlation with wholesale prices, whereas energy demand is positively correlated with them. In the long term, the coefficient for photovoltaic generation is positive and statistically significant, while the coefficients for wind generation and energy demand prove to be statistically insignificant. These findings align with the distinction between short- and long-term relationships proposed in H1. However, differences in statistical significance across time horizons do not in themselves demonstrate that the actual magnitude of the impact of these factors differs significantly.
2. The estimated relationships also differ between wind and photovoltaic (PV) energy generation. Wind power generation exhibits a statistically significant negative short-term relationship with wholesale electricity prices, whereas for photovoltaics, the long-term coefficient is positive and statistically significant. The negative short-term relationship for wind power is consistent with the merit-order effect, widely discussed in the electricity market literature. However, the positive long-term coefficient for photovoltaics should be interpreted as a conditional relationship within the estimated model, rather than as evidence that an increase in solar power generation causes an increase in wholesale electricity prices. These results are consistent with H2, in that the estimated relationships differ for the two technologies.
3. The results indicate substantial persistence in wholesale electricity prices, as reflected by the statistically significant coefficient on the lagged price variable (0.9253, p < 0.001). The short-run estimates show a negative association between current wind generation and electricity prices, whereas changes in electricity demand are positively associated with price changes. These findings are consistent with the expected merit-order mechanism for wind generation and the upward price pressure associated with higher demand. However, the estimated relationships should be interpreted as conditional statistical associations rather than definitive structural causal effects.
4. The Bounds Test provides evidence of a long-run relationship among wholesale electricity prices, wind generation, photovoltaic generation, and electricity demand within the estimated ARDL framework. The negative and statistically significant error-correction coefficient (ADJ = −0.0701, p = 0.033) indicates adjustment toward the estimated long-run equilibrium relationship. The positive long-run coefficient for solar generation is statistically significant, but it should not be interpreted as evidence that increasing photovoltaic generation causes wholesale electricity prices to rise. The estimated long-run coefficients for wind generation and electricity demand are not statistically significant at the 5% level.
5. The existence of a long-run equilibrium relationship and a statistically significant error correction coefficient indicates that deviations from the estimated equilibrium are gradually corrected. At the same time, the distinct patterns observed for wind and photovoltaic generation suggest that the relationship between renewable generation and wholesale electricity prices should not be treated as uniform across all technologies.
The findings should be interpreted in light of the study’s limitations. The use of monthly observations may obscure intraday price dynamics, while the omission of certain market fundamentals and the potential for endogeneity, feedback relationships, and incompletely captured seasonal patterns limit causal interpretation. Future research using higher-frequency data and a broader set of market variables could provide a more detailed assessment of the mechanisms underlying wholesale electricity price formation.
The identified limitations point to several avenues for future research. Future studies could utilize higher-frequency data—such as hourly or sub-hourly observations—to more precisely examine the timing and magnitude of price responses to changes in wind and photovoltaic power generation. Furthermore, future research could expand the empirical framework by incorporating additional market fundamentals, including coal and natural gas prices, CO2 emission allowance prices, cross-border electricity flows, conventional generation, and significant regulatory or design-related variables.
Author Contributions
Conceptualization, Ł.A. and P.K.; methodology, Ł.A. and P.K.; software, Ł.A. and P.K.; validation, Ł.A. and P.K.; formal analysis, Ł.A. and P.K.; investigation, Ł.A. and P.K.; resources, Ł.A. and P.K.; data curation, Ł.A. and P.K.; writing—original draft preparation, Ł.A. and P.K.; writing—review and editing, Ł.A. and P.K.; visualization, Ł.A. and P.K.; supervision, Ł.A. and P.K.; project administration, Ł.A. and P.K.; funding acquisition, Ł.A. and P.K. All authors have read and agreed to the published version of the manuscript.
Funding
This research received no external funding.
Data Availability Statement
All time-series data utilized in this study were retrieved from the Ember database (Ember Monthly Electricity Data—https://ember-energy.org/data/) (accessed on 25 August 2026), which aggregates and verifies official statistics provided by European transmission system operators (TSOs).
Conflicts of Interest
The authors declare no conflicts of interest.
Appendix A
Table A1.
Renewable energy sources in macroeconomic research—a literature review.
Appendix B
Figure A1.
Methodological flowchart.
References
- Kumar, D.; Verma, Y.P.; Khanna, R.; Gupta, P. Impact of market prices on energy scheduling of microgrid operating with renewable energy sources and storage. Mater. Today Proc. 2020, 28, 1649–1655. [Google Scholar] [CrossRef] [Scilit]
- AlNemer, H.A.; Hkiri, B.; Tissaoui, K. Dynamic impact of renewable and non-renewable energy consumption on CO2 emission and economic growth in Saudi Arabia: Fresh evidence from wavelet coherence analysis. Renew. Energy 2023, 209, 340–356. [Google Scholar] [CrossRef] [Scilit]
- Esposito, L.; Romagnoli, G. Overview of policy and market dynamics for the deployment of renewable energy sources in Italy: Current status and future prospects. Heliyon 2023, 9, e17406. [Google Scholar] [CrossRef] [Scilit] [PubMed]
- Dröes, M.I.; Koster, H.R.A. Wind turbines, solar farms, and house prices. Energy Policy 2021, 155, 112327. [Google Scholar] [CrossRef] [Scilit]
- Sovacool, B.K.; Ratan, P.L. Conceptualizing the acceptance of wind and solar electricity. Renew. Sustain. Energy Rev. 2012, 16, 5268–5279. [Google Scholar] [CrossRef] [Scilit]
- Kyritsis, E.; Serletis, A. Oil Prices and the Renewable Energy Sector. Energy J. 2019, 40, 337–364. [Google Scholar] [CrossRef] [Scilit]
- Barbosa, L.S.N.S.; Bogdanov, D.; Vainikka, P.; Breyer, C. Hydro, wind and solar power as a base for a 100% renewable energy supply for South and Central America. PLoS ONE 2017, 12, e0173820. [Google Scholar] [CrossRef] [Scilit] [PubMed]
- Khezri, M.; Karimi, M.S.; Mamkhezri, J.; Ghazal, R.; Blank, L. Assessing the Impact of Selected Determinants on Renewable Energy Sources in the Electricity Mix: The Case of ASEAN Countries. Energies 2022, 15, 4604. [Google Scholar] [CrossRef] [Scilit]
- Said, R.; Bhatti, M.I.; Hunjra, A.I. Toward Understanding Renewable Energy and Sustainable Development in Developing and Developed Economies: A Review. Energies 2022, 15, 5349. [Google Scholar] [CrossRef] [Scilit]
- Ríos-Ocampo, J.P.; Arango-Aramburo, S.; Larsen, E.R. Renewable energy penetration and energy security in electricity markets. Int. J. Energy Res. 2021, 45, 17767–17783. [Google Scholar] [CrossRef] [Scilit]
- Guerra, O.J.; Zhang, J.; Eichman, J.; Denholm, P.; Kurtz, J.; Hodge, B.M. The value of seasonal energy storage technologies for the integration of wind and solar power. Energy Environ. Sci. 2020, 13, 1909–1922. [Google Scholar] [CrossRef] [Scilit]
- Al Badwawi, R.; Abusara, M.; Mallick, T. A Review of Hybrid Solar PV and Wind Energy System. Smart Sci. 2015, 3, 127–138. [Google Scholar] [CrossRef] [Scilit]
- Kułyk, P.; Augustowski, Ł. Economic Profitability of a Hybrid Approach to Powering Residual Households from Natural Sources in Two Wind Zones of the Lubuskie Voivodeship in Poland. Energies 2021, 14, 6869. [Google Scholar] [CrossRef] [Scilit]
- Sayed, E.T.; Olabi, A.G.; Alami, A.H.; Radwan, A.; Mdallal, A.; Rezk, A.; Abdelkareem, M.A. Renewable Energy and Energy Storage Systems. Energies 2023, 16, 1415. [Google Scholar] [CrossRef] [Scilit]
- Kwidziński, K. The Energy Transition in Poland. Yearbook 2026; Forum Energii: Warsaw, Poland, 2026. [Google Scholar]
- Marciniuk-Kluska, A.; Kluska, M. Transformation of the Energy Market in Poland in the Context of the European Union over the Last 20 Years. Energies 2025, 18, 3410. [Google Scholar] [CrossRef] [Scilit]
- Kaszyński, P.; Komorowska, A.; Kamiński, J. Revisiting Market Power in the Polish Power System. Energies 2023, 16, 4856. [Google Scholar] [CrossRef] [Scilit]
- Rosicki, R. Poland’s Electricity Market. Forecasts of Demand for Electricity and of Electricity Prices. Srod. Stud. Polit. 2018, 1, 142–165. [Google Scholar] [CrossRef] [Scilit]
- Pavlík, M.; Kurimský, F.; Ševc, K. Renewable Energy and Price Stability: An Analysis of Volatility and Market Shifts in the European Electricity Sector (2015–2025). Appl. Sci. 2025, 15, 6397. [Google Scholar] [CrossRef] [Scilit]
- Voumik, L.C.; Sultana, T. Impact of urbanization, industrialization, electrification and renewable energy on the environment in BRICS: Fresh evidence from novel CS-ARDL model. Heliyon 2022, 8, e11457. [Google Scholar] [CrossRef] [Scilit] [PubMed]
- Leitão, N.C.; Balsalobre-Lorente, D.; Cantos-Cantos, J.M. The Impact of Renewable Energy and Economic Complexity on Carbon Emissions in BRICS Countries under the EKC Scheme. Energies 2021, 14, 4908. [Google Scholar] [CrossRef] [Scilit]
- Khattak, S.I.; Ahmad, M.; Khan, Z.U.; Khan, A. Exploring the impact of innovation, renewable energy consumption, and income on CO2 emissions: New evidence from the BRICS economies. Environ. Sci. Pollut. Res. 2020, 27, 13866–13881. [Google Scholar] [CrossRef] [Scilit] [PubMed]
- Aziz, N.; Sharif, A.; Raza, A.; Jermsittiparsert, K. The role of natural resources, globalization, and renewable energy in testing the EKC hypothesis in MINT countries: New evidence from Method of Moments Quantile Regression approach. Environ. Sci. Pollut. Res. 2021, 28, 13454–13468. [Google Scholar] [CrossRef] [Scilit] [PubMed]
- Elshimy, M.; El-Aasar, K.M. Carbon footprint, renewable energy, non-renewable energy, and livestock: Testing the environmental Kuznets curve hypothesis for the Arab world. Environ. Dev. Sustain. 2020, 22, 6985–7012. [Google Scholar] [CrossRef] [Scilit]
- Mehmood, U. Investigating the linkages of female employer, education expenditures, renewable energy, and CO2 emissions: Application of CS-ARDL. Environ. Sci. Pollut. Res. 2022, 29, 61277–61282. [Google Scholar] [CrossRef] [Scilit] [PubMed]
- Alam, S.M.T. Renewable Energy (Solar and Wind) Generation and its Effect on some Variables for Selected EU Countries with Panel VAR Model. Int. J. Energy Econ. Policy 2022, 12, 303–310. [Google Scholar] [CrossRef] [Scilit]
- Hirth, L. The Optimal Share of Variable Renewables: How the Variability of Wind and Solar Power affects their Welfare-optimal Deployment. Energy J. 2015, 36, 149–184. [Google Scholar] [CrossRef] [Scilit]
- Durante, F.; Gianfreda, A.; Ravazzolo, F.; Rossini, L. A multivariate dependence analysis for electricity prices, demand and renewable energy sources. Inf. Sci. 2022, 590, 74–89. [Google Scholar] [CrossRef] [Scilit]
- Coester, A.; Hofkes, M.W.; Papyrakis, E. Economics of renewable energy expansion and security of supply: A dynamic simulation of the German electricity market. Appl. Energy 2018, 231, 1268–1284. [Google Scholar] [CrossRef] [Scilit]
- Pérez Odeh, R.; Watts, D. Impacts of wind and solar spatial diversification on its market value: A case study of the Chilean electricity market. Renew. Sustain. Energy Rev. 2019, 111, 442–461. [Google Scholar] [CrossRef] [Scilit]
- Kulakov, S.; Ziel, F. The Impact of Renewable Energy Forecasts on Intraday Electricity Prices. Econ. Energy Environ. Policy 2021, 10, 79–104. [Google Scholar] [CrossRef] [Scilit]
- Wang, X.; Lu, F.; Safi, A.; Li, X. Unraveling the dynamics of carbon price volatility: A comprehensive analysis of impacts from climate policy, fossil fuel and renewable energy shocks. Energy Strategy Rev. 2025, 62, 101966. [Google Scholar] [CrossRef] [Scilit]
- Würzburg, K.; Labandeira, X.; Linares, P. Renewable generation and electricity prices: Taking stock and new evidence for Germany and Austria. Energy Econ. 2013, 40, S159–S171. [Google Scholar] [CrossRef] [Scilit]
- Do, L.P.C.; Lyócsa, Š.; Molnár, P. Impact of wind and solar production on electricity prices. J. Oper. Res. Soc. 2019, 70, 1752–1768. [Google Scholar] [CrossRef] [Scilit]
- Mulder, M.; Scholtens, B. The impact of renewable energy on electricity prices in the Netherlands. Renew. Energy 2013, 57, 94–100. [Google Scholar] [CrossRef] [Scilit]
- Shimomura, M.; Keeley, A.R.; Matsumoto, K.; Tanaka, K.; Managi, S. Beyond the merit order effect: Impact of the rapid expansion of renewable energy on electricity market price. Renew. Sustain. Energy Rev. 2024, 189, 114037. [Google Scholar] [CrossRef] [Scilit]
- Zapata, S.; Castaneda, M.; Jimenez, M.; Aristizabal, A.J.; Franco, C.J.; Dyner, I. Long-term effects of 100% renewable generation on the Colombian power market. Sustain. Energy Technol. Assess. 2018, 30, 183–191. [Google Scholar] [CrossRef] [Scilit]
- Sisodia, G.S.; Soares, I.; Ferreira, P.; Banerji, S.; Van den Poel, D.; Kumar, M. Does the use of Solar and Wind Energy Increase Retail Prices in Europe? Evidence from EU-27. Energy Procedia 2015, 79, 506–512. [Google Scholar] [CrossRef] [Scilit][Green Version]
- Eder, L.V.; Provornaya, I.V.; Filimonova, I.V.; Kozhevin, V.D.; Komarova, A.V. World energy market in the conditions of low oil prices, the role of renewable energy sources. Energy Procedia 2018, 153, 112–117. [Google Scholar] [CrossRef] [Scilit]
- Avazkhodjaev, S.S.; Yakob, N.A.B.; Lau, W.Y. Asymmetric Effect of Renewable Energy Generation and Clean Energy on Green Economy Stock Price: A Nonlinear ARDL Approach. Int. J. Energy Econ. Policy 2022, 12, 407–415. [Google Scholar] [CrossRef] [Scilit]
- Chen, Y.; Qi, H. Dynamic interplay between Chinese energy, renewable energy stocks, and commodity markets: Time-frequency causality study. Renew. Energy 2024, 228, 120578. [Google Scholar] [CrossRef] [Scilit]
- Buchholz, P.; Brandenburg, T. Demand, Supply, and Price Trends for Mineral Raw Materials Relevant to the Renewable Energy Transition: Wind Energy, Solar Photovoltaic Energy, and Energy Storage. Chem. Ing. Tech. 2018, 90, 141–153. [Google Scholar] [CrossRef] [Scilit]
- Hirth, L. The market value of variable renewables: The effect of solar and wind power variability on their relative price. Energy Econ. 2013, 38, 218–236. [Google Scholar] [CrossRef] [Scilit]
- Reichenberg, L.; Ekholm, T.; Boomsma, T. Revenue and risk of variable renewable electricity investment: The cannibalization effect under high market penetration. Energy 2023, 284, 128419. [Google Scholar] [CrossRef] [Scilit]
- Stiewe, C.; Xu, A.L.; Eicke, A.; Hirth, L. Cross-border cannibalization: Spillover effects of wind and solar energy on interconnected European electricity markets. Energy Econ. 2025, 143, 108251. [Google Scholar] [CrossRef] [Scilit]
- Burbidge, J.B.; Magee, L.; Robb, A.L. Alternative transformations to handle zero and negative values. J. Am. Stat. Assoc. 1988, 83, 123–127. [Google Scholar] [CrossRef]
- Bellemare, M.F.; Wichman, C.J. Elasticities and the Inverse Hyperbolic Sine Transformation. Oxf. Bull. Econ. Stat. 2020, 82, 50–61. [Google Scholar] [CrossRef] [Scilit]
- Friedline, T.; Masa, R.D.; Chowa, G.A.N. Transforming wealth: Using the inverse hyperbolic sine (IHS) and splines to predict youth’s math achievement. Soc. Sci. Res. 2015, 49, 205–221. [Google Scholar] [CrossRef] [Scilit] [PubMed]
- Brini, R.; Amara, M.; Jemmali, H. Renewable energy consumption, International trade, oil price and economic growth inter-linkages: The case of Tunisia. Renew. Sustain. Energy Rev. 2017, 76, 620–627. [Google Scholar] [CrossRef] [Scilit]
- Zimon, G.; Pattak, D.C.; Voumik, L.C.; Akter, S.; Kaya, F.; Walasek, R.; Kochański, K. The Impact of Fossil Fuels, Renewable Energy, and Nuclear Energy on South Korea’s Environment Based on the STIRPAT Model: ARDL, FMOLS, and CCR Approaches. Energies 2023, 16, 6198. [Google Scholar] [CrossRef] [Scilit]
- Nor, B.A.; Mohamud, I.H. Assessing the influence of foreign direct investment on renewable energy consumption in Somalia: An ARDL model analysis. Int. J. Sustain. Energy 2024, 43, 2422899. [Google Scholar] [CrossRef] [Scilit]
- Voumik, L.C.; Akter, S.; Ridwan, M.; Sultana, T. Exploring the factors behind renewable energy consumption in Indonesia: Analyzing the impact of corruption and innovation using ARDL model. Int. J. Energy Econ. Policy 2023, 13, 115–125. [Google Scholar] [CrossRef] [Scilit]
- Bölük, G.; Mert, M. The renewable energy, growth and environmental Kuznets curve in Turkey: An ARDL approach. Renew. Sustain. Energy Rev. 2015, 52, 587–595. [Google Scholar] [CrossRef] [Scilit]
- Silva, S.; Soares, I.; Pinho, C. The Impact of Renewable Energy Sources on Economic Growth and CO2 Emissions—A SVAR approach. Eur. Res. Stud. J. 2012, 15, 133–144. [Google Scholar] [CrossRef] [Scilit]
- Tiwari, A.K. A structural VAR analysis of renewable energy consumption, real GDP and CO2 emissions: Evidence from India. Econ. Bull. 2011, 31, 1793–1806. [Google Scholar]
- Uddin, M.J. Investigating the impulse responses of renewable energy in the context of China: A Bayesian VAR Approach. Renew. Energy 2023, 219, 119485. [Google Scholar] [CrossRef] [Scilit]
- Zhou, D.; Siddik, A.B.; Guo, L.; Li, H. Dynamic relationship among climate policy uncertainty, oil price and renewable energy consumption—Findings from TVP-SV-VAR approach. Renew. Energy 2023, 204, 202–213. [Google Scholar] [CrossRef] [Scilit]
- Razmi, S.F.; Moghadam, M.H.; Behname, M. Time-varying effects of monetary policy on Iranian renewable energy generation. Renew. Energy 2021, 177, 1161–1169. [Google Scholar] [CrossRef] [Scilit]
- Alsaedi, Y.; Tularam, G.A.; Wong, V. Assessing the Effects of Solar and Wind Prices on the Australia Electricity Spot and Options Markets using a Vector Autoregression Analysis. Int. J. Energy Econ. Policy 2020, 10, 120–133. [Google Scholar] [CrossRef] [Scilit]
- Shah, I.H.; Hiles, C.; Morley, B. How do oil prices, macroeconomic factors and policies affect the market for renewable energy? Appl. Energy 2018, 215, 87–97. [Google Scholar] [CrossRef] [Scilit]

Disclaimer/Publisher’s Note: The statements, opinions and data contained in all publications are solely those of the individual author(s) and contributor(s) and not of MDPI and/or the editor(s). MDPI and/or the editor(s) disclaim responsibility for any injury to people or property resulting from any ideas, methods, instructions or products referred to in the content. |
© 2026 by the authors. Licensee MDPI, Basel, Switzerland. This article is an open access article distributed under the terms and conditions of the Creative Commons Attribution (CC BY) license.