


Abstract
Pore-size-gradient carbonized fiber membranes were prepared by sequential electrospinning and carbonization, and Ag nanoparticles were incorporated to reduce the electrical resistivity. Residual-pressure decay after pump shutdown was used to compare transient liquid water responses, complementing SEM characterization, four-probe measurements, and passive direct methanol fuel cell (DMFC) tests. For 80 μm membranes, the positive-gradient configuration, with small pores facing the inlet and large pores facing the outlet, generally promoted pressure release in bilayer and trilayer designs; this advantage weakened or reversed in four- and five-layer designs. The positive-gradient bilayer with a nominal G = 0.063 exhibited a residual pressure of 28.50 kPa and an average decay rate of 0.3583 kPa·min−1 over 60 min. The lowest resistivity among the tested Ag loadings was approximately 0.018 Ω·m at 4 wt.%. A separately selected 150 μm trilayer Ag-modified membrane achieved a DMFC peak power density of 1.10 ± 0.0366 mW·cm−2 at 3 mol·L−1 methanol, 43% and 12% higher than the nongradient and unmodified gradient controls, respectively. These comparisons support a combined modification effect under the tested conditions, while pore-scale mechanisms and the interactions between modifications remain unverified.
1. Introduction
Gas diffusion layers (GDLs) are key functional components of fuel cells, providing pathways for reactant and product transport, as well as conducting electrons, and supporting the catalyst layer. Their pore structures therefore directly affect the mass transport and electrochemical stability. In the cathodes of proton exchange membrane fuel cells (PEMFCs) and direct methanol fuel cells (DMFCs), GDLs must provide continuous pathways for oxygen delivery and product water removal, whereas the anode GDL in a DMFC primarily facilitates the methanol solution supply and CO2 removal.
Commercial GDLs generally consist of a macroporous carbon-paper substrate and a microporous layer that improves the interfacial contact and pore-size matching between the catalyst and diffusion layers [1,2]. Large pores facilitate gas transport and liquid water removal but have relatively low capillary entry pressures, which may allow liquid water to occupy gas transport pathways. Small pores enhance capillary regulation and interfacial water retention, but excessively small pores increase transport resistance [2,3]. Conventional GDLs therefore have difficulty simultaneously satisfying the requirements for interfacial water regulation, oxygen transport, and liquid water removal.
A through-plane pore size gradient can regulate liquid migration by exploiting differences in capillary pressure and flow resistance between regions with different pore sizes. Ko et al. [4] found that a pore size gradient reduced liquid water accumulation under high-humidity conditions, although an excessively large gradient aggravated membrane dehydration at low humidity. Balakrishnan et al. [5] fabricated an electrospun GDL with the pore size increasing from the catalyst layer side to the flow field side, in which the small-pore region maintained interfacial hydration while the large-pore region facilitated liquid water removal. Liquid transport in GDLs is commonly evaluated using the breakthrough pressure, water loading, and water saturation. Ren et al. [6,7] reported that a trilayer electrospun GDL with an intermediate gradient combined a high breakthrough pressure with a low water loading of 17.5 g·m−2 and increased the maximum power density by approximately 14% without cathode humidification. Experimental and numerical studies have further demonstrated that pore size gradients, fiber diameter gradients, and interlayer transitions affect gas–liquid transport, liquid migration, and water retention [8,9].
In addition to pore size gradients, gradients in PTFE content, porosity distributions, hierarchical microporous layers, and compression states influence liquid water invasion, breakthrough behavior, and internal saturation [10,11,12,13]. Electrospinning offers considerable flexibility for constructing gradient porous structures because the fiber diameter, pore size, and layer thickness can be controlled by adjusting the solution concentration and layer deposition time [14]. Three-dimensional imaging and numerical simulations have also shown that pore connectivity, tortuosity, structural anisotropy, capillary pressure gradients, and local cracks or channels govern the direction and path dependence of liquid migration [15,16,17,18].
In addition to mass transport capability, a GDL requires a continuous electron-conducting network. Shu et al. [19] constructed hierarchical pores and a gradient of conductive components, increasing the maximum power density of a DMFC by approximately 20–35% relative to that obtained with commercial diffusion layers. For DMFC anodes, hydrophilic channels and homogeneous microporous layers can promote methanol supply and CO2 removal [20,21]. At the cathode, polypyrrole nanowires, nitrogen-doped two-dimensional graphene, and CNF–TiO2 composite microporous layers have been used to improve oxygen transport, water management, or power output [22,23]. The design of a DMFC cathode GDL must therefore balance the pore structure, wettability, and electronic conductivity.
Ag has a high intrinsic electrical conductivity and can form additional conductive pathways within fibrous networks. Ag nanocomponents have been incorporated into carbon-fiber systems and electrospun composite networks to reduce electrical resistance and improve conductivity [24,25,26,27,28]. In PAN-derived carbonized fibers, Ag nanoparticles and carbonization conditions can further affect macroscopic conductivity by modifying interfiber electrical contacts and the carbon microstructure [29,30]. Excessive Ag loading, however, may cause particle agglomeration and reduce the uniformity of the conductive network. An appropriate Ag content must therefore be identified through combined microstructural and resistivity analyses.
Previous studies of gradient GDLs have mainly focused on breakthrough pressure before the formation of a through-plane liquid pathway and on water loading or saturation under specified conditions. By contrast, the dynamic release of residual pressure after pump shutdown once a continuous liquid pathway has formed remains insufficiently understood. In particular, the effects of the gradient magnitude, gradient direction, layer number, and membrane thickness on this process have not been systematically examined. Moreover, few studies have combined a through-plane pore size gradient with Ag-based conductivity modification in PAN-derived carbonized fiber membranes for DMFC cathode applications. Accordingly, carbonized fiber membranes with different gradient magnitudes, directions, and numbers of layers were fabricated by sequential electrospinning and carbonization. Their structures and liquid transport behaviors were evaluated using morphological characterization and pressure decay tests after pump shutdown, and Ag nanoparticles were incorporated to enhance the electronic conduction. Finally, the membranes were used as cathode GDLs in DMFC membrane electrode assemblies, and the combined effects of the pore size gradient and Ag modification were evaluated using polarization and power density measurements.
Breakthrough-pressure measurements characterize the pressure at which liquid water first traverses a membrane and emerges at its outlet, whereas water saturation measurements quantify liquid occupancy within the pore space and its distribution. A complementary perspective is provided by the transient pressure response after imposed liquid input ceases. In this study, residual-pressure decay after pump shutdown is used to characterize liquid transport in pore-size-gradient carbonized fiber membranes. With the total thickness controlled at 80 μm and comparable initial pressures, the effects of gradient magnitude, gradient direction, and layer number on pressure release behavior are systematically examined. The main contribution is the comparison of structure-dependent pressure evolution after liquid supply is terminated, providing complementary experimental evidence for understanding the relationship between membrane structure and liquid transport behavior.
2. Materials and Methods
2.1. Preparation and Heat Treatment of Pore-Size-Gradient Fiber Membranes
Spinning solutions were prepared using polyacrylonitrile (PAN; molecular weight approximately 150,000; Shanghai Macklin Biochemical Technology Co., Ltd., Shanghai, China) as the precursor and N,N-dimethylformamide (DMF; Shanghai Macklin Biochemical Technology Co., Ltd., Shanghai, China) as the solvent. PAN (1.1 g) was added to DMF (8.9 g), and the mixture was stirred at room temperature for 24 h using a magnetic stirrer (SN-MS-1; Tianjin Qun’an Instrument Co., Ltd., Tianjin, China) until completely dissolved. The solution was then allowed to stand for deaeration, yielding an 11 wt.% PAN/DMF solution. Solutions of other concentrations were prepared in the same manner. For a total solution mass of 10 g, the PAN contents of the 12, 13, 14, 15, and 16 wt.% solutions were 1.2, 1.3, 1.4, 1.5, and 1.6 g, respectively, with DMF accounting for the remainder.
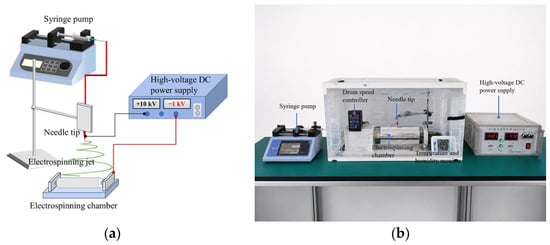
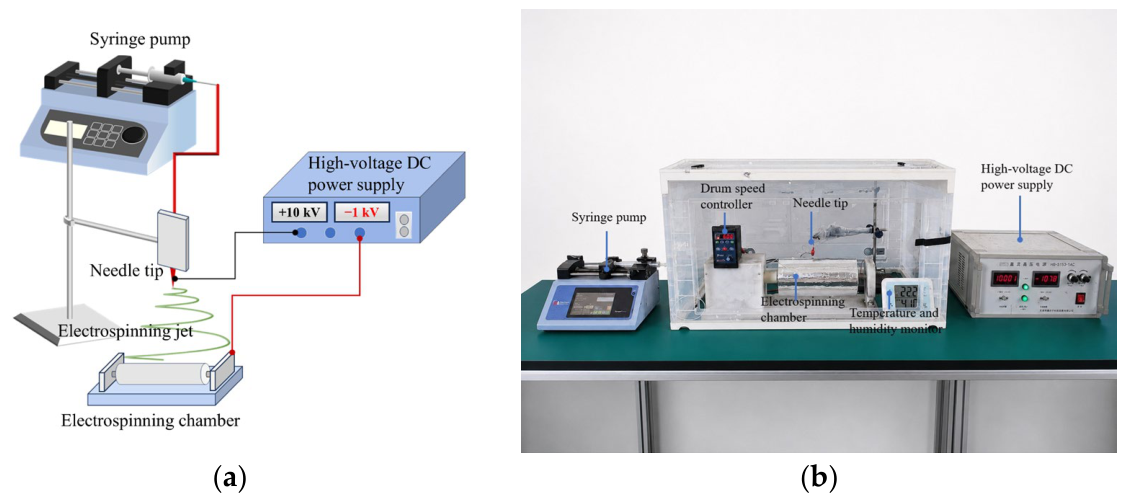
Pore-size-gradient PAN precursor fiber membranes were fabricated by sequential electrospinning. The PAN/DMF spinning solution was delivered through a 19 G needle at 500 μL·h−1. The needle-to-drum distance was 15 cm; the positive and negative voltages were +10 and −1 kV, respectively; and the drum speed was 600 rpm. During electrospinning, the ambient temperature and relative humidity were maintained at 25–30 °C and 30–40%, respectively. The electrospinning apparatus is shown in Figure 1.
Figure 1.
Electrospinning apparatus: (a) schematic diagram and (b) photograph of the experimental setup.
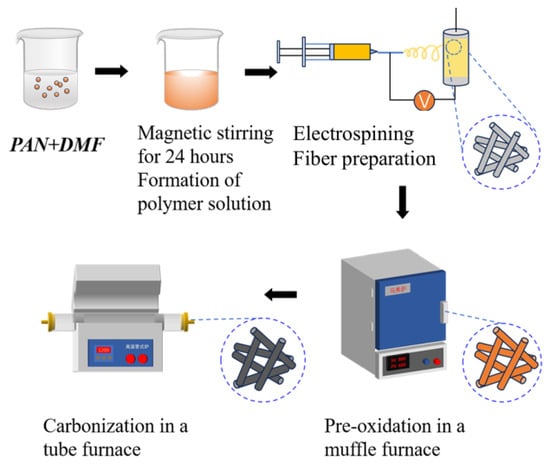
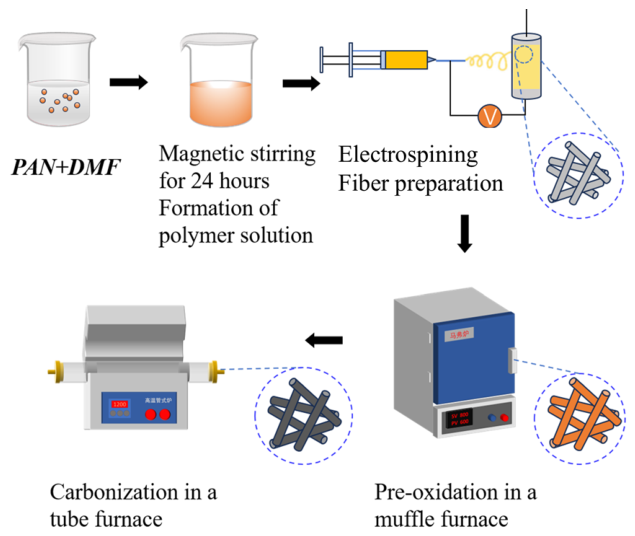
The electrospun PAN precursor fiber membranes were cut into 20 mm × 20 mm specimens. The as-spun membranes were first pre-oxidized in a box-type muffle furnace at 260 °C for 2 h. After pre-oxidation, they were transferred to a tube furnace and carbonized at 800 °C for 1 h under nitrogen. Carbonized fiber membranes with good structural stability and a certain degree of electrical conductivity were thereby obtained. The heat treatment process is shown in Figure 2.
Figure 2.
Pre-oxidation and carbonization of the as-spun fiber membranes.
2.2. Morphological and Pore Structure Characterizations of Carbonized Fiber Membranes
The surface and cross-sectional morphologies of the carbonized fiber membranes were examined by scanning electron microscopy (SEM). For each PAN concentration, three representative SEM images from different fields of view were calibrated against their scale bars and analyzed using ImageJ (version 1.54f). Thirty pores and thirty fibers were measured in each image, yielding 90 pore diameter measurements and 90 fiber diameter measurements per concentration. The apparent surface pore diameter was defined as the equivalent circular diameter calculated from the projected area of each visible irregular interfiber opening. Results were expressed as the mean ± standard deviation (SD), with SD describing the variation between the measured pores or fibers. Linear regression was performed using the mean apparent surface pore diameter at each PAN concentration, and the fitted equation and coefficient of determination (R2) were reported. These SEM-derived pore diameters characterize visible two-dimensional openings and do not directly quantify the internal pore-throat distributions or bulk porosity.
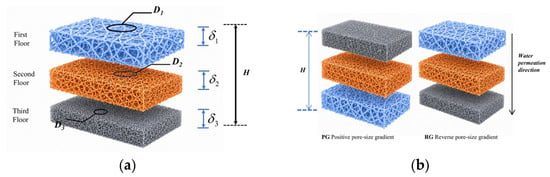
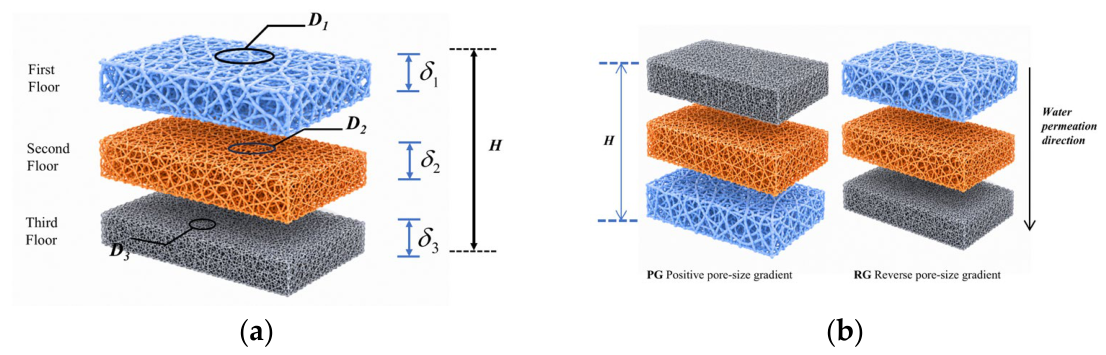
The segmental pore size gradient characterizes the magnitude of the pore size change between two adjacent layers relative to the distance between their centerlines. For the trilayer membrane illustrated in Figure 3a, layers 1, 2, and 3 are numbered sequentially along the membrane thickness. The representative mean pore diameter and carbonized thickness of layer (i) are denoted by Di and , respectively. The distance between the centerlines of two adjacent layers is half the sum of their thicknesses.
Figure 3.
Schematic illustration of a trilayer pore-size-gradient membrane: (a) structural parameters used to define the pore size gradient; (b) positive (PG) and reverse (RG) gradient configurations relative to the water permeation direction.
Accordingly, the gradient magnitude between the first and second layers, G1, is defined as
The gradient magnitude between the second and third layers, G2, is defined as
The total carbonized membrane thickness (H) is
Here, , , and are the measured carbonized thicknesses of the respective layers. The representative mean pore diameters, D1, D2, and D3, were assigned using SEM-derived mean apparent surface pore diameters of single-layer reference membranes prepared at the corresponding PAN concentrations under the same electrospinning and heat treatment conditions. These assigned values should not be interpreted as direct pore size measurements within each layer of the assembled trilayer membrane.
Pore diameters and layer thicknesses are expressed in the same length unit; therefore, G1 and G2 are dimensionless, although their denominators explicitly represent spatial distances. The same adjacent-layer definition applies to the bilayer and other multilayer membranes.
The gradient magnitude and testing orientation are distinguished. For the illustrated trilayer configuration with D1 < D2 < D3, the positive-gradient configuration (PG) places the small-pore side toward the water inlet and the large-pore side toward the outlet. The reverse-gradient configuration (RG) uses the opposite orientation, as shown in Figure 3b. Reversing the membrane changes its orientation relative to the liquid flow but does not change the gradient magnitudes.
2.3. Liquid Water Pressure-Response Tests and Data Analysis
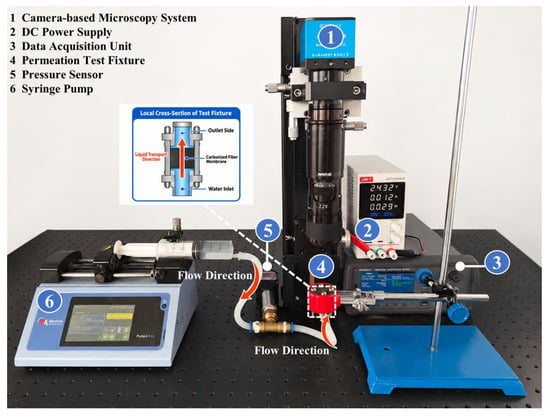
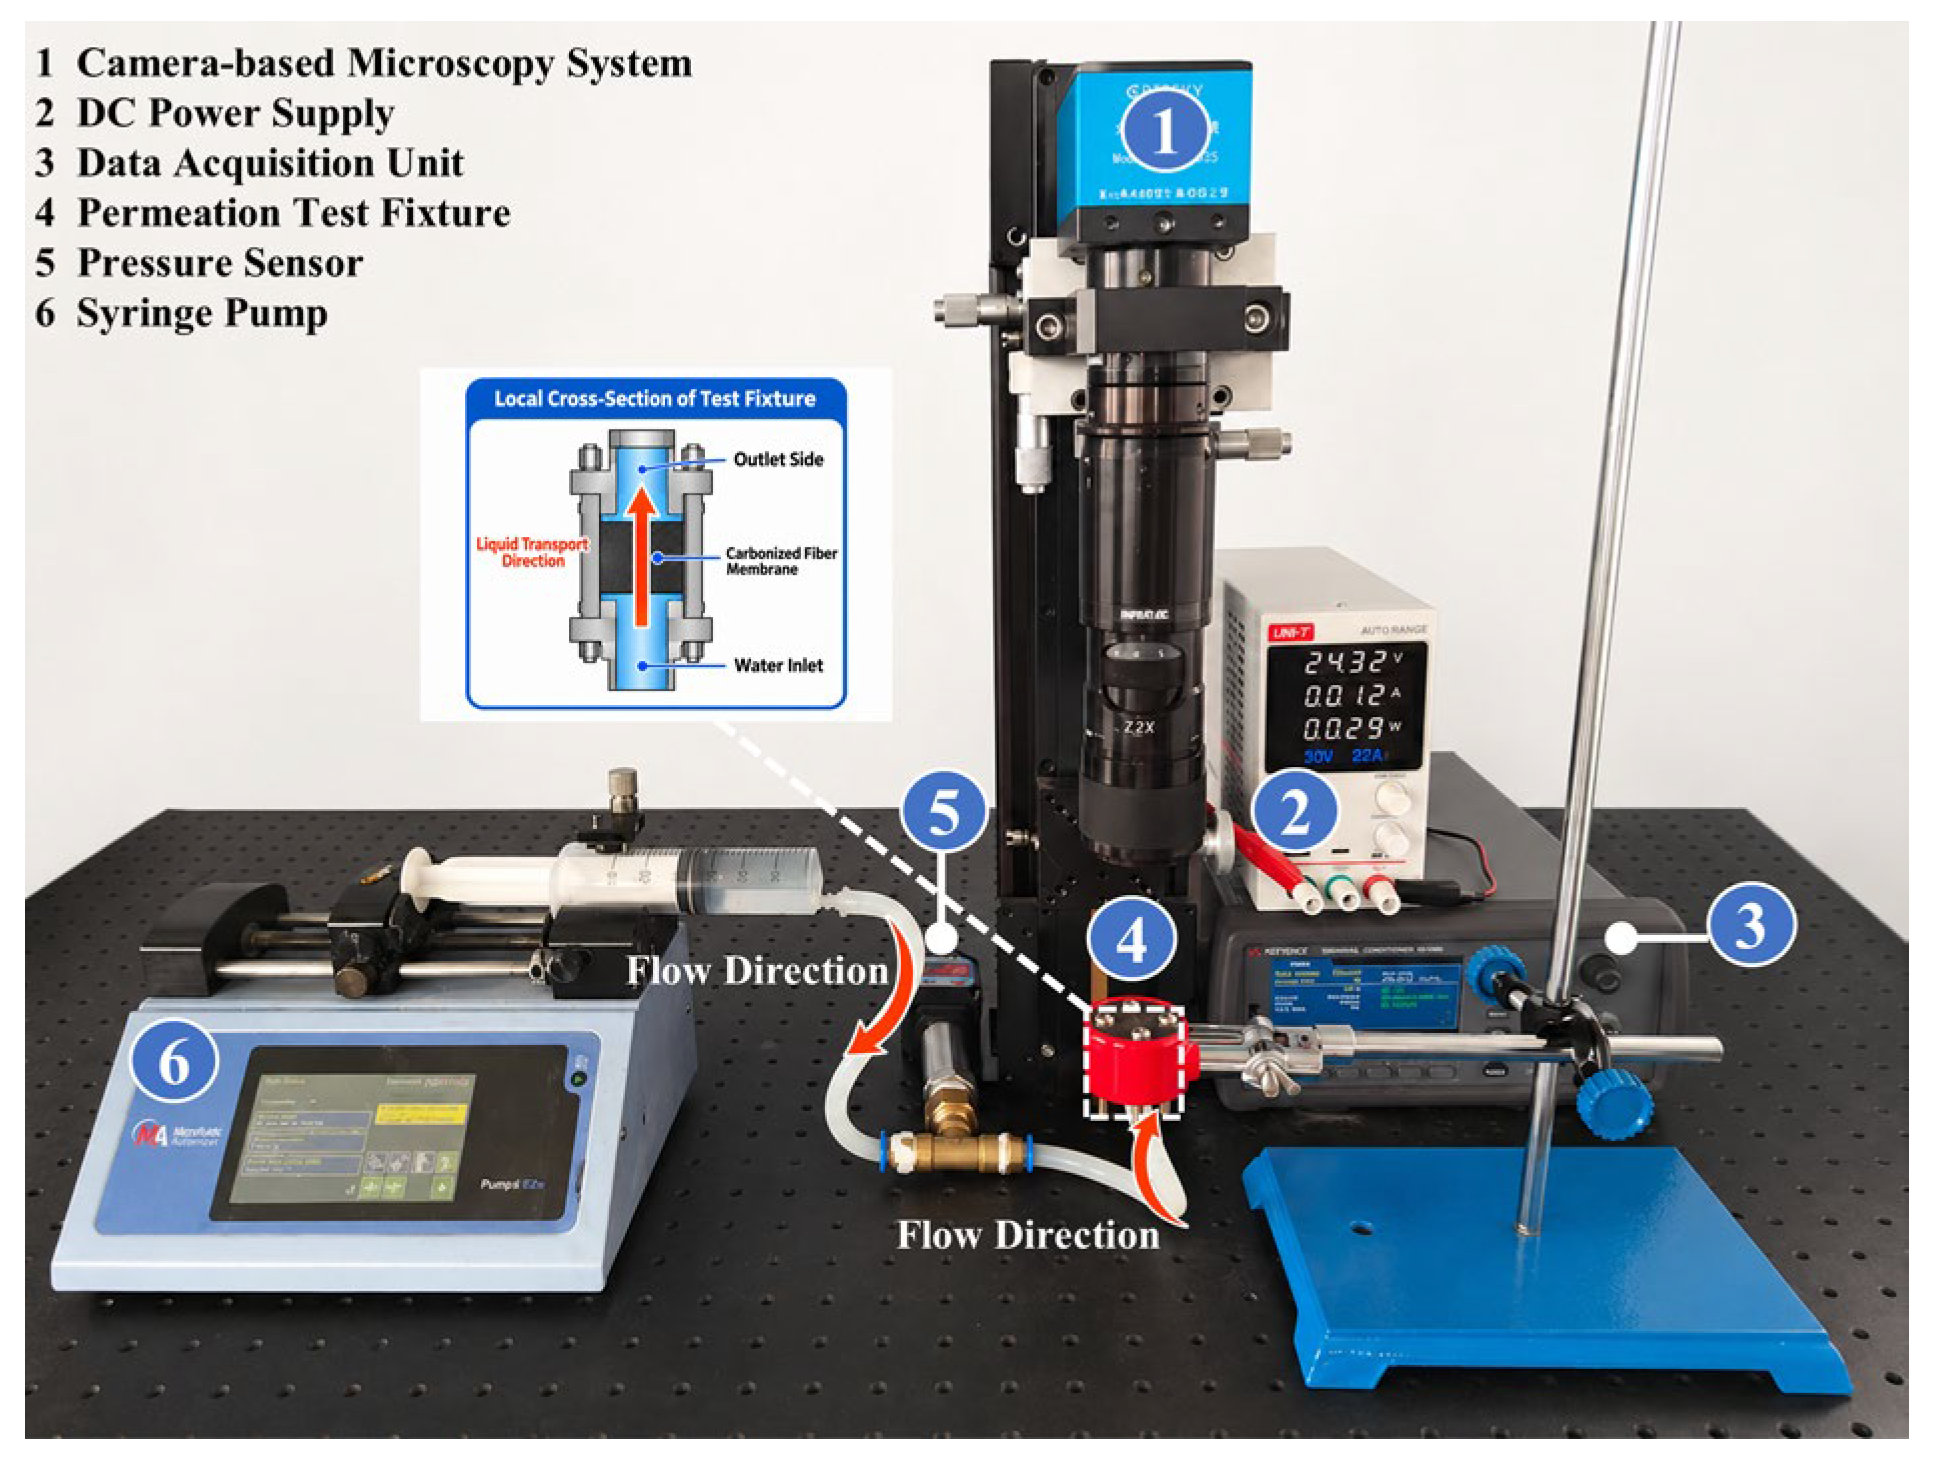
A test system comprising a syringe pump, pressure sensor, specimen holder, microscopic observation system, and a data-acquisition unit was used to compare the transient liquid water pressure response of the membranes (Figure 4). The measurement records the pressure response of the membrane–apparatus system under a defined injection and shutdown protocol.
Figure 4.
Liquid water permeation test apparatus.
A 10 mm × 10 mm specimen was aligned with the through-hole in the holder, and deionized water was injected at a constant flow rate of 30 μL·min−1. The effective permeation area was defined by a circular aperture with a diameter of 2 mm, corresponding to an area of approximately 3.14 mm2. Water injection was stopped when the inlet pressure reached approximately 50 kPa, after which the pressure decay was recorded continuously for 60 min. The pressurization and post-shutdown stages were used to characterize the liquid permeation response and residual pressure release, respectively. Three independent specimens were tested for each pore structure and transport direction. The pressure at t min after pump shutdown was recorded, and the average pressure-decay rate was calculated as follows:
where (kPa) is the pressure at min after pump shutdown, (kPa) is the initial pressure at the onset of decay, (min) is the elapsed time, and (kPa·min−1) is the average pressure-decay rate. The term (kPa) represents the pressure drop during the first min.
The pressure retention ratio was calculated as follows:
where (kPa) is the initial pressure immediately after pump shutdown, (kPa) is the pressure at min after pump shutdown, and (%) is the pressure retention ratio at time .
The measured initial pressure of each test was used to calculate its pressure decay rate and retention ratio. The results were averaged across the three independent specimens (n = 3), with the standard deviation (SD) used to summarize the between-specimen variation where shown. The residual pressure, decay rate, and retention ratio are mathematically related descriptors of the same pressure record. PG–RG comparisons are descriptive; statistical significance is not inferred from differences in mean values or from the presence of error bars.
2.4. Preparation and Testing of Ag-Doped Carbonized Fiber Membranes
The Ag loading was calculated as the mass of added Ag nanoparticles relative to the mass of PAN and expressed as a percentage. Ag nanoparticles were uniformly dispersed in ethanol and added to the PAN spinning solution. After stirring and deaeration, Ag-doped carbonized fiber membranes were prepared by electrospinning, pre-oxidation, and carbonization; the pre-oxidation and carbonization temperatures were the same as those used for the pore-size-gradient membranes. The fiber morphology and Ag elemental distribution were characterized by SEM and EDS elemental mapping. The sample resistivity was measured using an SX1944 four-probe tester to evaluate the effect of Ag content on the electrical conductivity of the carbonized fiber membranes. Three independent batches were prepared for each Ag content. The resistivity was measured at multiple prescribed locations on each specimen, and the mean of these measurements was treated as the independent result for that Ag-doped carbonized fiber membrane.
3. Results and Discussion
3.1. SEM Analysis of Fiber Membranes Prepared at Individual PAN Concentrations
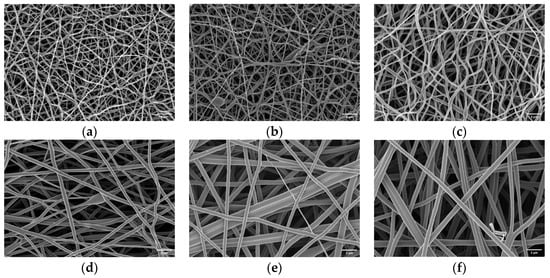
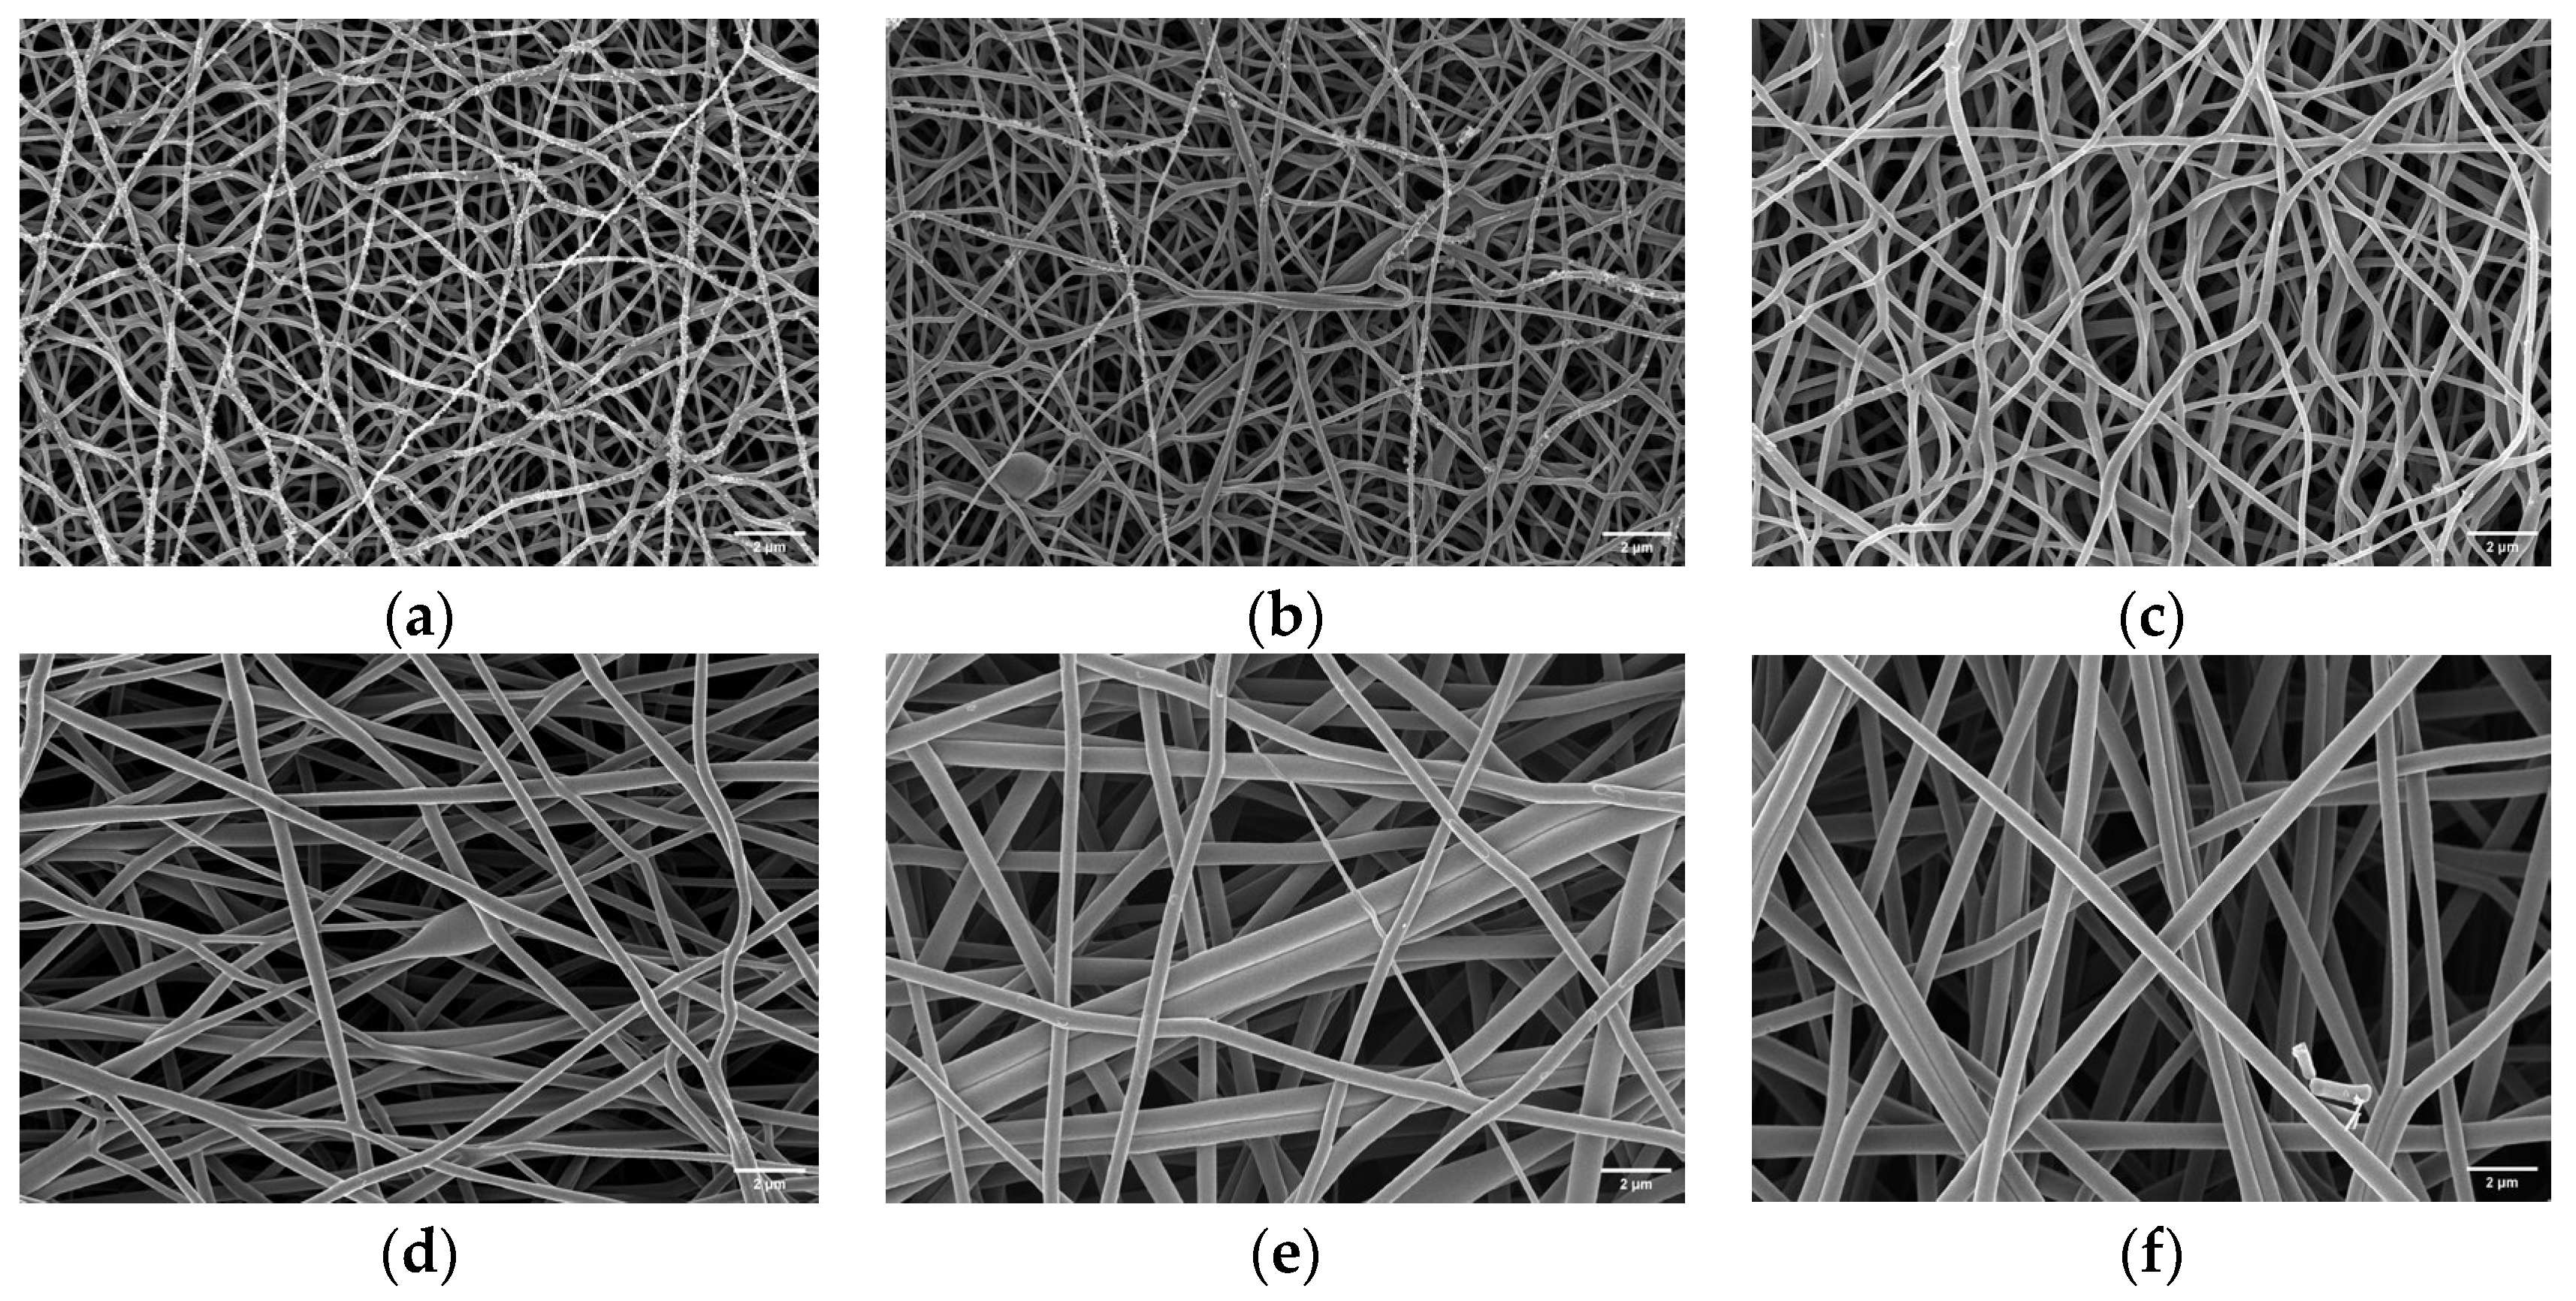
The spinning-solution concentration is a primary factor governing the pore size and fiber diameter of carbonized fiber membranes. PAN solutions with concentrations of 11, 12, 13, 14, 15, and 16 wt.% were used to prepare precursor fiber membranes, which were then converted into the corresponding carbonized fiber membranes under identical pre-oxidation and carbonization conditions. The surface morphologies of the samples prepared at different PAN concentrations were subsequently characterized by SEM, as shown in Figure 5.
Figure 5.
SEM images of carbonized fiber membranes prepared from PAN solutions at different concentrations: (a) 11 wt.%; (b) 12 wt.%; (c) 13 wt.%; (d) 14 wt.%; (e) 15 wt.%; (f) 16 wt.%.
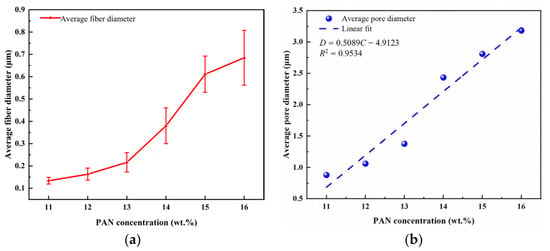
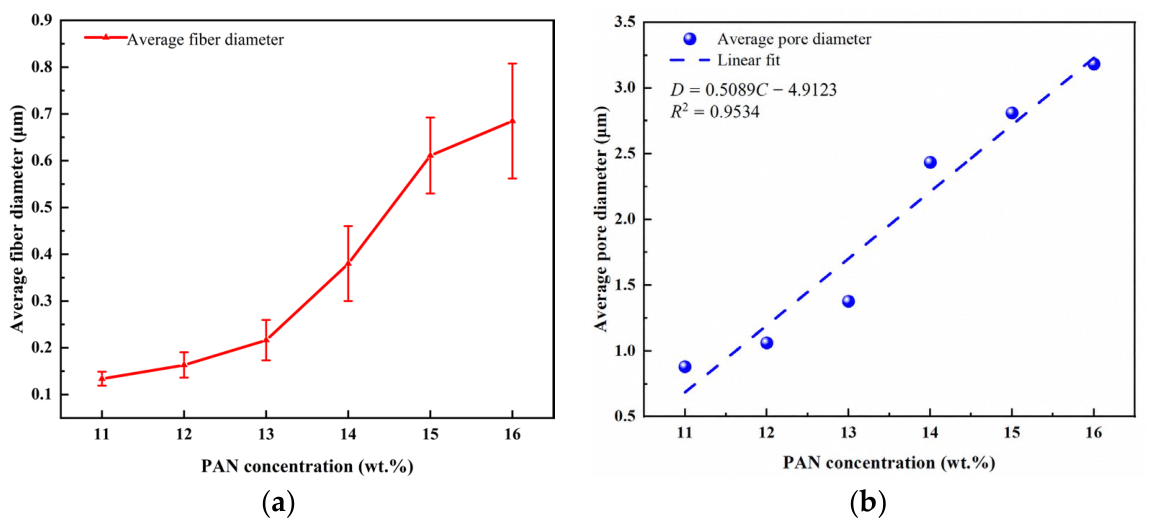
SEM images of the carbonized fiber membranes prepared at different PAN concentrations were analyzed to determine their mean surface fiber diameters and pore sizes. Linear fitting was also performed for the surface pore size as a function of the PAN concentration. The resulting mean fiber diameters and mean membrane pore sizes are shown in Figure 6.
Figure 6.
Effect of PAN concentration on the structural parameters of carbonized fiber membranes: (a) average fiber diameter; (b) average surface pore diameter and its linear fit.
As shown in Figure 6, both the mean fiber diameter and mean pore size of the carbonized fiber membranes increased with the PAN solution concentration. A higher PAN concentration increases the viscosity of the spinning solution and the degree of molecular chain entanglement, thereby weakening the stretching and thinning of the jet by the electric field and producing fibers with larger diameters. The increase in fiber diameter further alters the packing structure of the fiber network and enlarges the interfiber pores; consequently, the mean pore size also increases with PAN concentration.
The mean surface pore diameter increased with PAN concentration over the investigated range of 11–16 wt.%. Linear regression of the mean pore diameters at the six concentration levels yielded D = 0.50893C − 4.91227, with a coefficient of determination of R2 = 0.95338, where D is the mean surface pore diameter in μm and C is the numerical value of the PAN concentration expressed in wt.%. This fit describes an approximately linear trend within the investigated concentration range.
The pore sizes reported in this study represent the characteristic dimensions of visible interfiber pore openings in SEM images and are used to compare surface pore scales between the fabrication conditions. These measurements do not directly characterize the bulk volumetric porosity, internal pore-throat distribution, or three-dimensional pore connectivity. Bulk porosity, steady-state gas permeability, and bulk pore-size distributions obtained by mercury intrusion or gas adsorption were not measured.
3.2. Fabrication Scheme for Pore-Size-Gradient Fiber Membranes
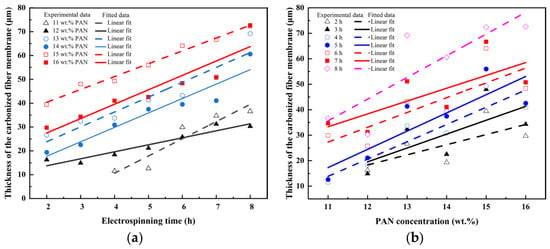
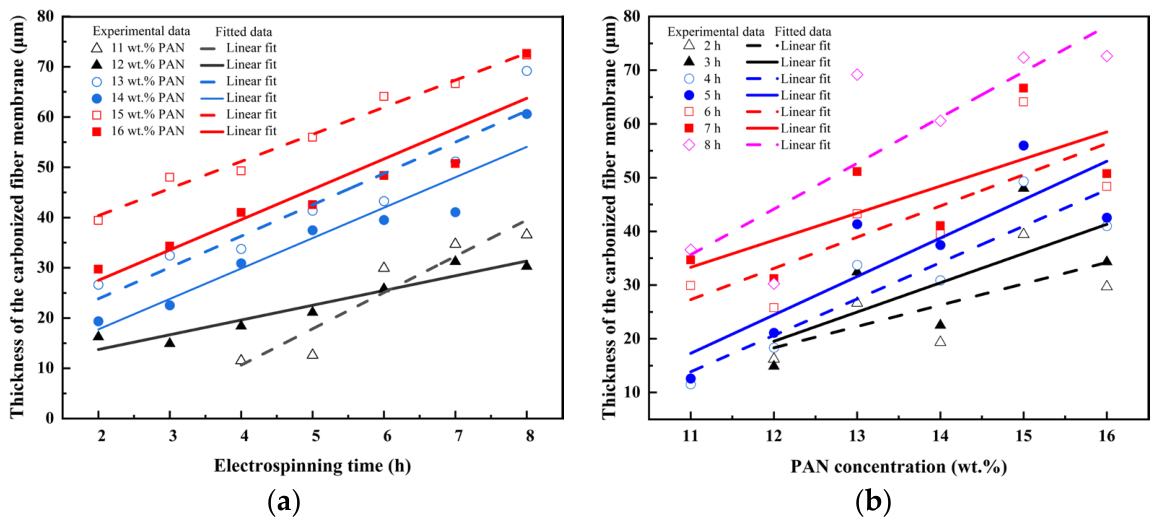
The total carbonized thickness of the membranes used for pressure response comparisons was controlled at 80 μm. Deposition times were selected from the experimentally calibrated relationship between the electrospinning time, PAN concentration, and carbonized membrane thickness (Figure 7). The time required to form a layer depends on the PAN concentration, so the layer thickness cannot be obtained simply by dividing the total thickness in proportion to the deposition time. Accordingly, the carbonized thickness of each layer was estimated using the concentration-specific calibration relationship and its actual deposition time. These estimates specify the thickness distribution within the multilayer membranes and provide the center-to-center distances between adjacent layers required for the pore-size-gradient calculations.
Figure 7.
Effects of electrospinning time and PAN concentration on the thickness of carbonized fiber membranes: (a) membrane thickness as a function of electrospinning time at different PAN concentrations; (b) membrane thickness as a function of PAN concentration at different electrospinning times.
The detailed fabrication parameters for the bilayer pore-size-gradient carbonized fiber membranes are listed in Table 1. Trilayer, four-layer, and five-layer gradient structures were subsequently constructed. The PAN concentration of each intermediate layer was determined from the fitted relationship between mean pore size and PAN concentration. The thickness and electrospinning time of each layer were designed to maintain the same total thickness and equal segmental gradients; that is, an n-layer structure satisfied G1 = G2 = … = Gn−1, thereby producing a continuous pore-size transition. The detailed fabrication parameters for the trilayer, four-layer, and five-layer membranes are listed in Table 2 and Table 3.
Table 1.
Fabrication parameters for bilayer pore-size-gradient carbonized fiber membranes.
Table 2.
Fabrication parameters for trilayer pore-size-gradient carbonized fiber membranes.
Table 3.
Fabrication parameters for four-layer and five-layer pore-size-gradient carbonized fiber membranes.
The individual layer thicknesses listed in the tables refer to the thicknesses after carbonization and follow the order of the PAN solution concentrations. The pore size gradient remains defined as the difference between the characteristic mean pore diameters of adjacent layers divided by the distance between their centerlines. This distance is calculated from the carbonized thicknesses of the two adjacent layers. The characteristic mean pore diameters are assigned using SEM measurements of single-layer membranes prepared at the corresponding PAN concentrations. Accordingly, the tabulated G values are structural parameters calculated from the pore size calibration and layer thickness information, rather than direct measurements of a continuous internal pore-size profile.
Their interpretation is therefore subject to the representativeness of the single-layer pore size measurements and the accuracy of the layer thickness estimates. Although these parameters support comparisons between the designed membrane configurations, they do not independently verify the local pore-size distribution or the structural transitions across the internal layer interfaces.
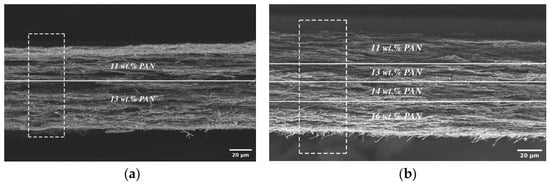
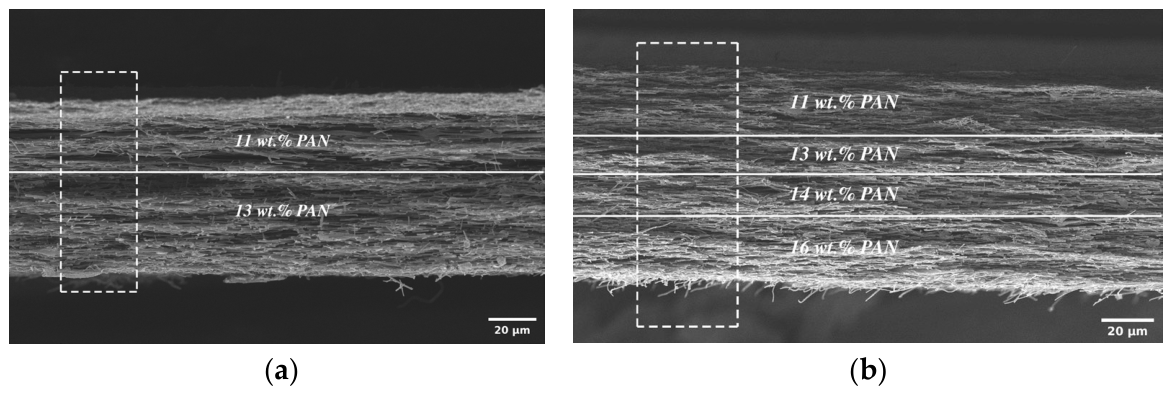
As shown in Figure 8, both the bilayer and four-layer carbonized fiber membranes exhibited fiber networks that were continuously stacked through the thickness. No obvious large-scale cracks or delamination were observed between layers electrospun from solutions of different concentrations, indicating that sequential electrospinning and subsequent heat treatment did not compromise the overall continuity of the membranes. As the number of layers increased, more interlayer transition regions formed within the membrane, providing the structural basis for a stepwise through-plane variation in pore size.
Figure 8.
Cross-sectional SEM images of pore-size-gradient carbonized fiber membranes: (a) bilayer membrane prepared from 11 and 13 wt.% PAN solutions; (b) four-layer membrane prepared from 11, 13, 14, and 16 wt.% PAN solutions. Solid white lines indicate the approximate interfaces between adjacent layers, and dashed rectangles highlight representative cross-sectional regions.
3.3. Effects of the Pore Size Gradient on Liquid Transport
Under the same apparatus conditions and comparable initial pressures, a lower residual pressure and a higher average decay rate indicate faster pressure release in the test system. This response provides a complementary basis for comparing the prepared structures after liquid supply ceases. It does not directly measure the residual water content, pore space saturation, or gas permeability.
3.3.1. Effects of Pore Size Gradients in Bilayer and Trilayer Fiber Membranes on Liquid Transport
To clarify how the pore-size-gradient structure regulates liquid transport, membranes with different gradient magnitudes were tested in both the positive and reverse directions while the membrane thickness, test area, liquid-injection flow rate, and initial pressure at pump shutdown were kept essentially constant.
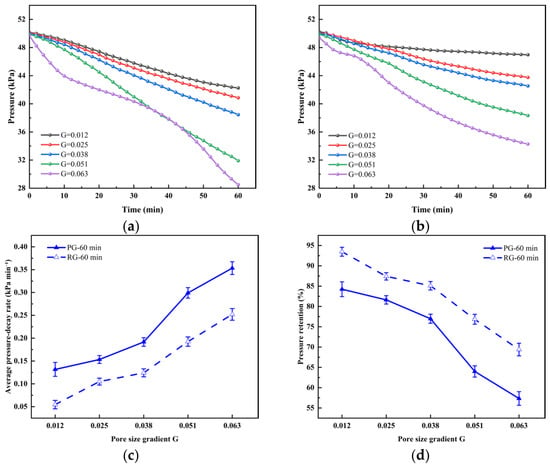
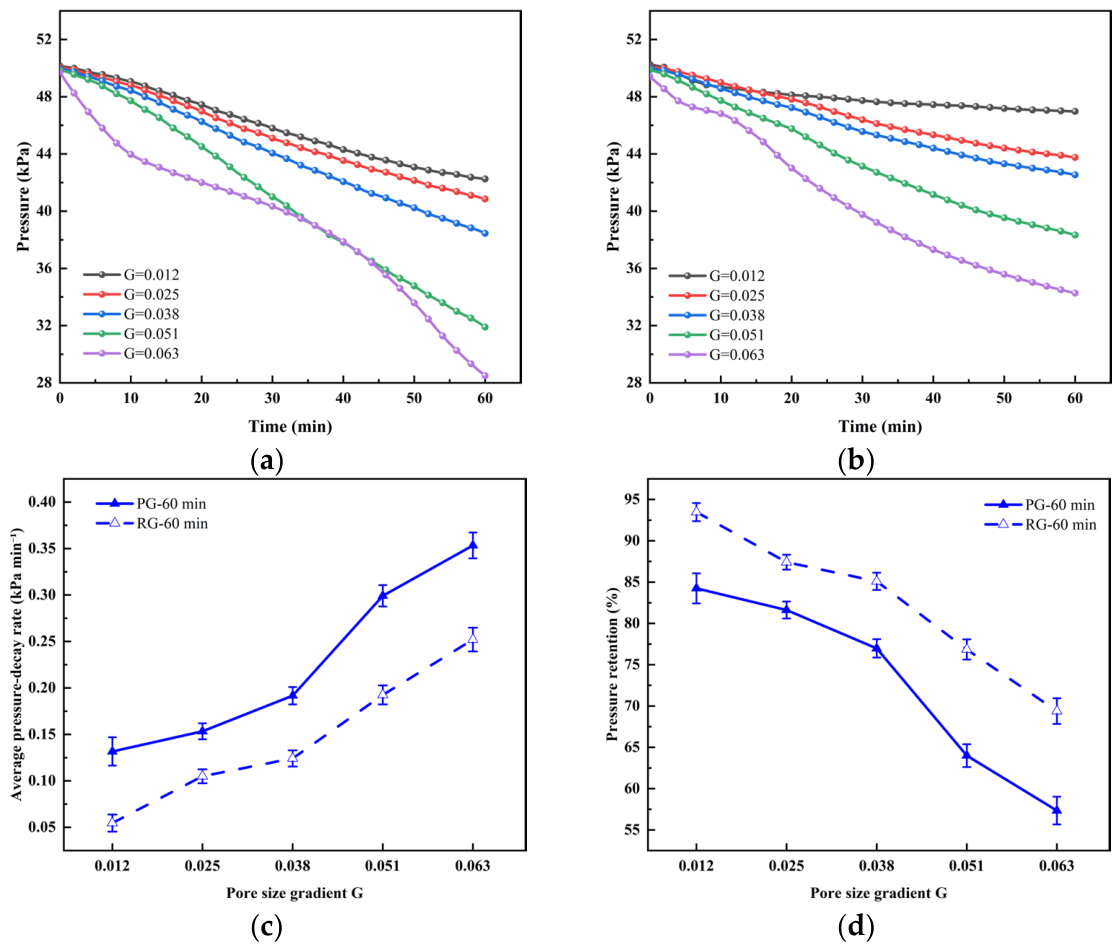
For the bilayer membranes (Figure 9), increasing the nominal G from 0.012 to 0.063 decreased the residual pressure at 60 min from 42.25 to 28.5 kPa in PG and from 46.9 to 34.27 kPa in RG. The corresponding average decay rates increased from approximately 0.13 to 0.35 kPa·min−1 in PG and from 0.05 to 0.25 kPa·min−1 in RG. Retention ratios decreased from 84.24% to 57.34% and from 93.47% to 69.3%, respectively. At each tested nominal gradient, the PG mean residual pressure was lower than the RG value. The PG bilayer with G = 0.063 gave the lowest residual pressure and the highest average decay rate among the investigated pressure response specimens.
Figure 9.
Pressure decay behavior of bilayer pore-size-gradient carbonized fiber membranes after pump shutdown: (a) positive-gradient direction; (b) reverse-gradient direction; (c) average pressure-decay rate at 60 min; (d) pressure retention ratio at 60 min.
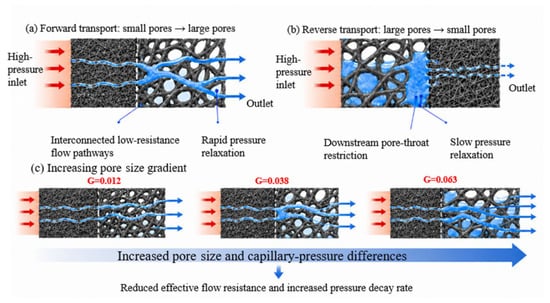
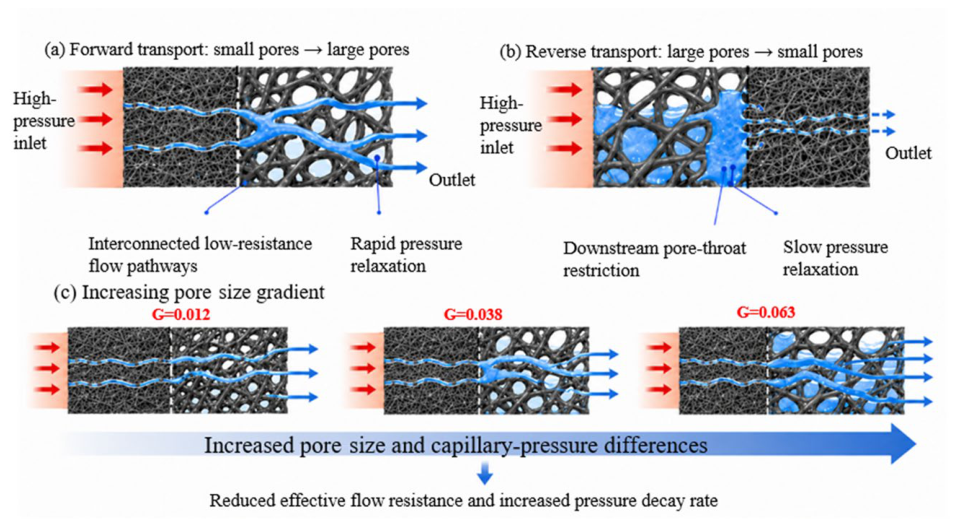
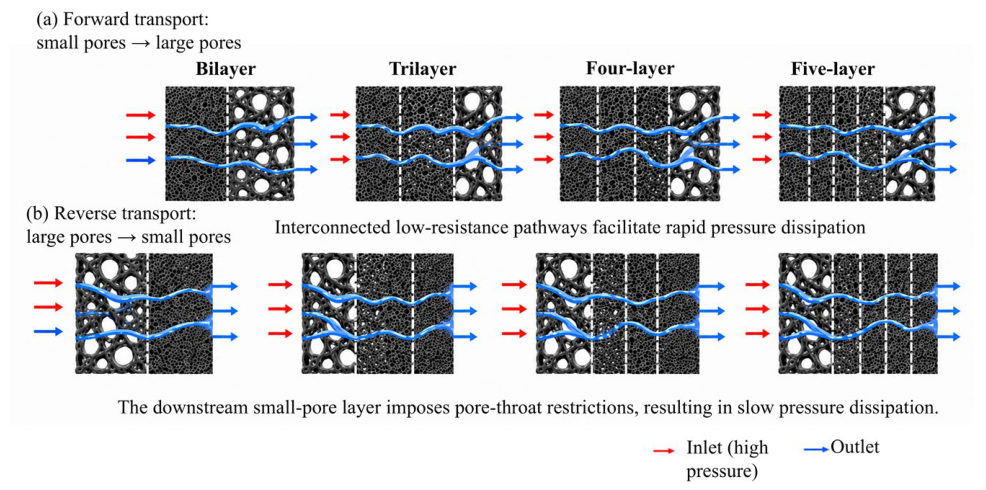
The orientation-dependent trends may reflect differences in liquid redistribution, outlet interfacial constraints, and the flow paths established during injection (Figure 10). A large-pore downstream region may facilitate pressure release, whereas a small-pore outlet may constrain liquid movement under the particular interfacial state reached before shutdown. This is a possible explanation, not a direct measurement of downstream resistance. Contact angle, local capillary pressure, internal saturation, and three-dimensional pore connectivity were not measured; the present data therefore cannot establish a layer-resolved capillary pressure distribution or identify capillarity as the dominant cause of the PG–RG difference.
Figure 10.
Conceptual illustration of possible orientation-dependent liquid pathways in bilayer membranes. The schematic presents a proposed interpretation rather than a measured pore-scale mechanism.
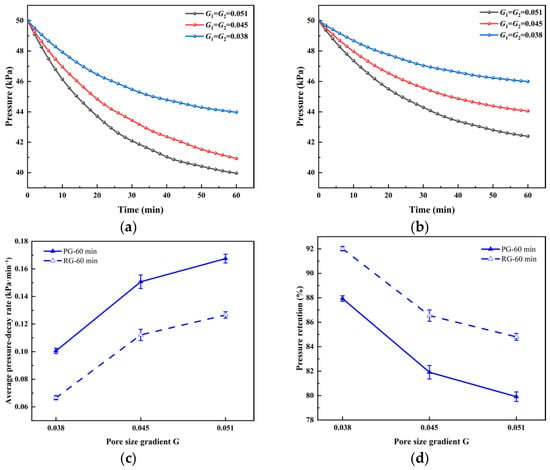
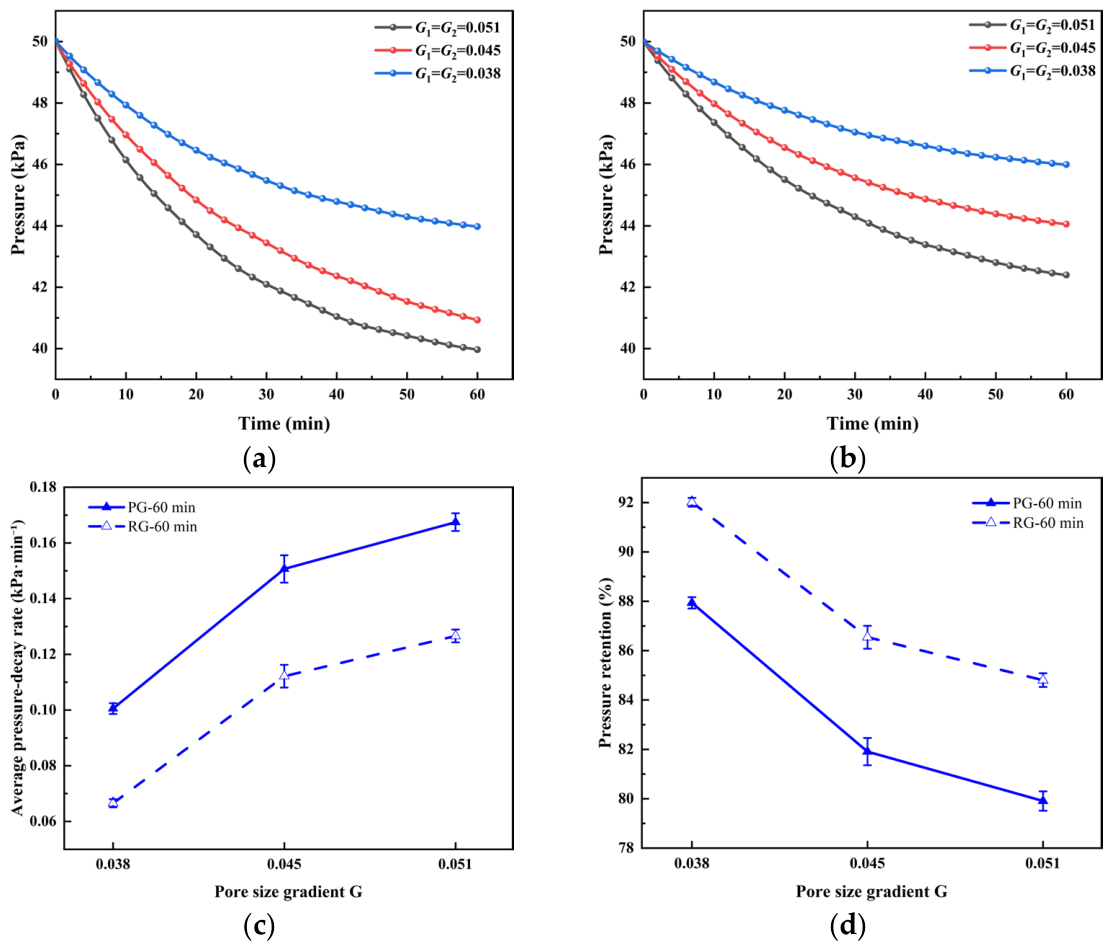
The trilayer pressure curves in Figure 11 exhibit a relatively rapid initial decrease followed by slower decay. As the common nominal segmental G increased from 0.038 to 0.051, the residual pressure at 60 min decreased from approximately 44.0 to 39.96 kPa in PG and from 46.0 to 42.39 kPa in RG. The corresponding average decay rates increased from approximately 0.100 to 0.168 kPa·min−1 and from 0.067 to 0.127 kPa·min−1, respectively. The mean PG results again indicate faster pressure release than the RG results over this range. These comparisons describe the measured trends and do not establish statistical significance.
Figure 11.
Pressure decay behavior of pore-size-gradient carbonized fiber membranes after pump shutdown: (a) positive-gradient direction; (b) reverse-gradient direction; (c) average pressure-decay rate at 60 min; (d) pressure retention ratio at 60 min.
The slowing of pressure decay is consistent with a declining pressure driving force and evolving liquid pathways, but the pressure record alone cannot distinguish these contributions. The trilayer results show that the intended stepwise pore size arrangement affects the measured transient response; they do not independently confirm progressive widening of internal pore throats, increased pore connectivity, or removal of a specified amount of water.
3.3.2. Effects of Multilayer Pore-Size-Gradient Fiber Membranes on Liquid Transport
Four-layer and five-layer designs were compared with the bilayer and trilayer membranes under the same total thickness target of 80 μm and the same injection and shutdown protocol. The designs use different PAN concentration sequences and deposition times (Table 1, Table 2 and Table 3). This comparison therefore evaluates the prepared layered structures; it does not isolate the layer number from all other aspects of the pore size and thickness distributions.
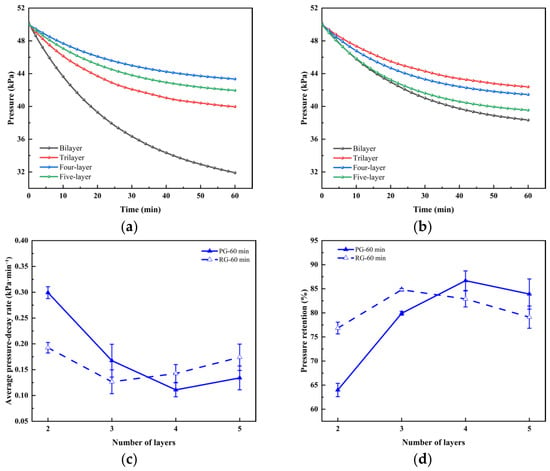
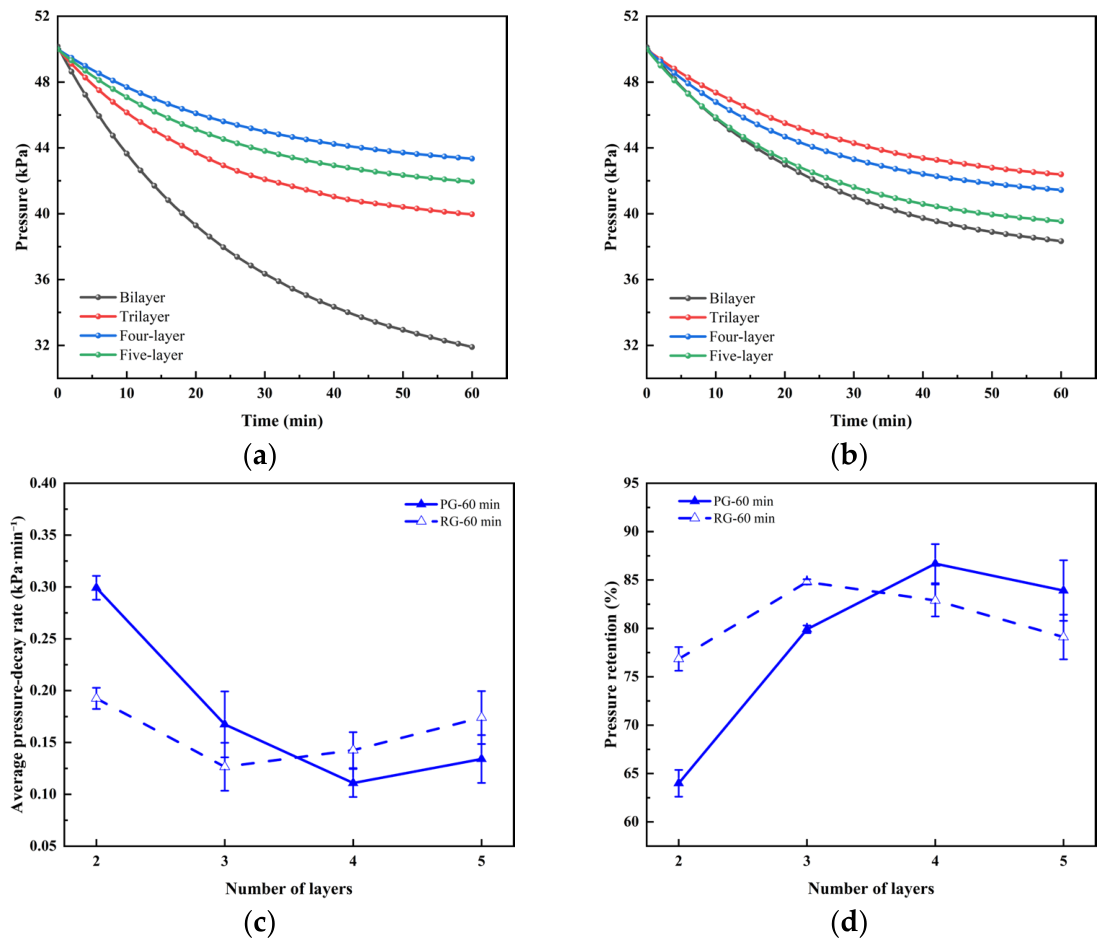
Figure 12 shows that increasing the number of layers did not continuously accelerate the pressure release. The bilayer design released the pressure most rapidly among the structures compared. In PG, the four-layer membrane showed stronger retention than the trilayer and five-layer membranes. The bilayer and trilayer designs retained a PG pressure-release advantage, whereas the four- and five-layer designs showed smaller differences and an opposite ordering of their mean PG and RG responses. These trends are specific to the prepared structures and should not be interpreted as a universal reversal caused solely by layer number.
Figure 12.
Effect of layer number on the pressure decay behavior of pore-size-gradient carbonized fiber membranes after pump shutdown: (a) pressure decay curves in the positive-gradient direction; (b) pressure decay curves in the reverse-gradient direction; (c) average pressure-decay rate at 60 min; (d) pressure retention ratio at 60 min.
Increasing layer number at a fixed total thickness reduces the average layer thickness and introduces more deposition interfaces. Differences in fiber packing or pore connections near these interfaces may create additional local transport constraints or retention sites (Figure 13), which could offset the pressure release benefit associated with the external pore-size ordering. Such effects provide a possible explanation for the stronger PG retention of the four-layer design, but neither interlayer hydraulic resistance nor local capillary-pressure distributions were determined.
Figure 13.
Schematic of the pressure decay mechanism in multilayer pore-size-gradient membranes.
The weakened or reversed PG–RG ordering may also depend on the liquid distribution established during injection. The same upstream pressure at shutdown does not ensure the same internal saturation or connected pathways in the two orientations. Differences in the filling history and outlet interfacial conditions may therefore become more influential as the structure contains more transition regions. Because pore connectivity and internal liquid distributions were not measured, the dominant cause of the observed ordering remains unresolved; the mean differences alone do not demonstrate a reproducible mechanistic reversal.
The bilayer membrane with G = 0.063 performed the best in the standalone pressure response test. DMFC output, however, also depends on oxygen supply, electronic conduction, membrane–catalyst interfacial contact, and the cell assembly. Faster pressure release under the water injection protocol is therefore insufficient to identify the best cathode GDL or to rank cell performance across all gradient structures.
3.4. Ag Nanoparticle Distribution and Conductivity Enhancement
3.4.1. Surface and Cross-Sectional Characterization of Ag-Doped Fiber Membranes
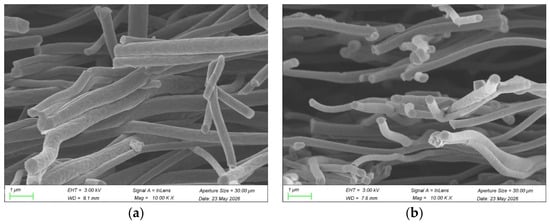
To investigate the effect of Ag incorporation on the microstructure of the carbonized fiber membranes, the fiber morphology, pore structure, and particle dispersion of undoped and Ag-doped specimens were compared by SEM.
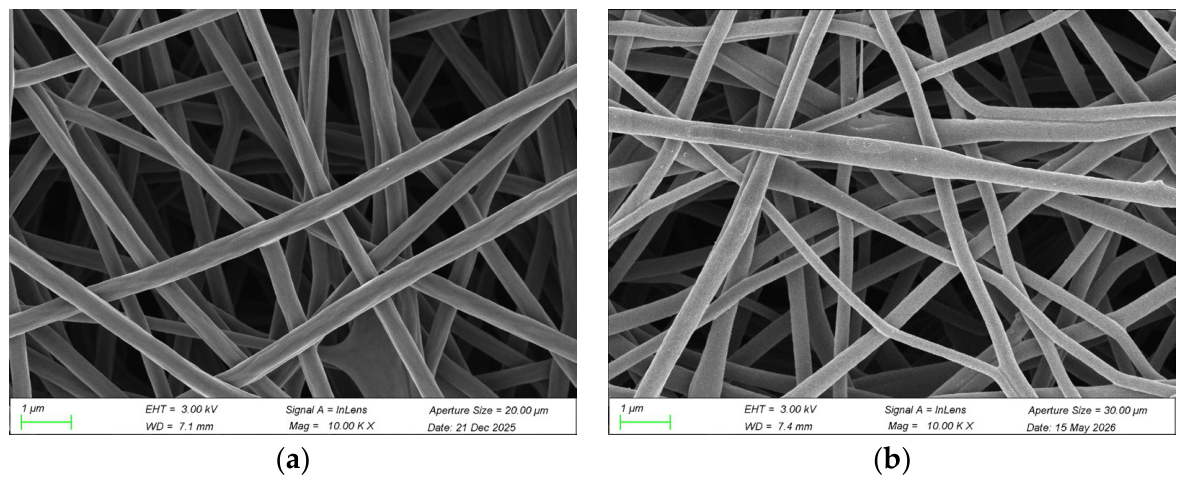
As shown in Figure 14 and Figure 15, both the undoped and Ag-doped carbonized fiber membranes exhibited continuous, randomly interwoven fiber networks with abundant interconnected pores and no obvious bead defects or large-scale structural collapse. Compared with the undoped specimen, the Ag-doped fibers had slightly rougher surfaces, while the overall fiber framework and porous structure remained intact. Cross-sectional SEM images showed relatively open interlayer pores in both membranes, and no obvious large Ag agglomerates or severe pore blockage was observed in the Ag-doped specimen.
Figure 14.
Surface SEM images of carbonized fiber membranes: (a) without Ag nanoparticles; (b) with Ag nanoparticles.
Figure 15.
Cross-sectional SEM images of carbonized fiber membranes: (a) without Ag nanoparticles; (b) with Ag nanoparticles.
3.4.2. Effect of Ag Loading on the Electrical Resistivity of Fiber Membranes
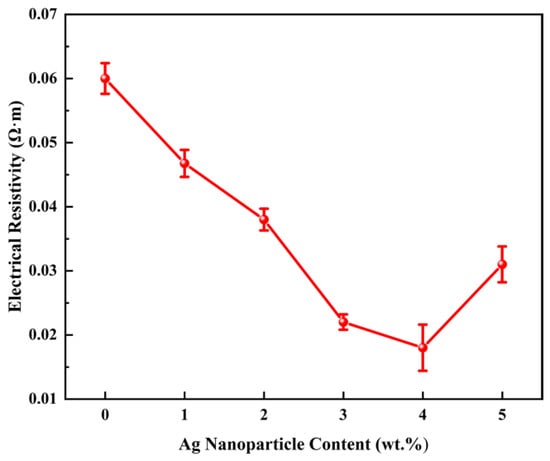
To quantitatively evaluate the effect of Ag loading on the electrical conductivity of the carbonized fiber membranes, the resistivities of specimens with different Ag contents were measured by the four-probe method and analyzed as a function of Ag loading.
As shown in Figure 16, the resistivity of the carbonized fiber membrane decreased from approximately 0.060 to 0.018 Ω·m as the Ag loading increased from 0 to 4 wt.%, representing a reduction of 70%. At 5 wt.% Ag, the resistivity increased to 0.031 Ω·m, likely due to particle agglomeration and disruption of conductive pathways. Thus, 4 wt.% Ag provided the lowest resistivity within the investigated range.
Figure 16.
Electrical resistivity of carbonized fiber membranes containing different Ag nanoparticle loadings.
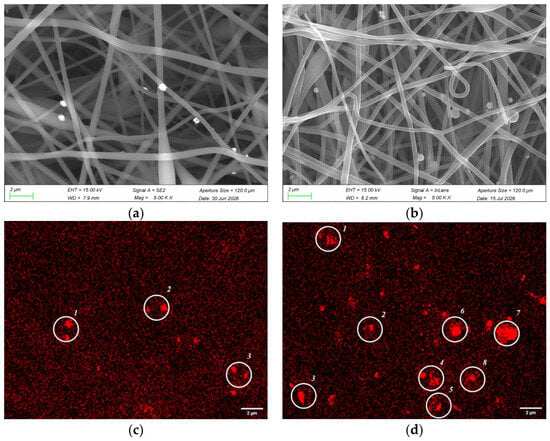
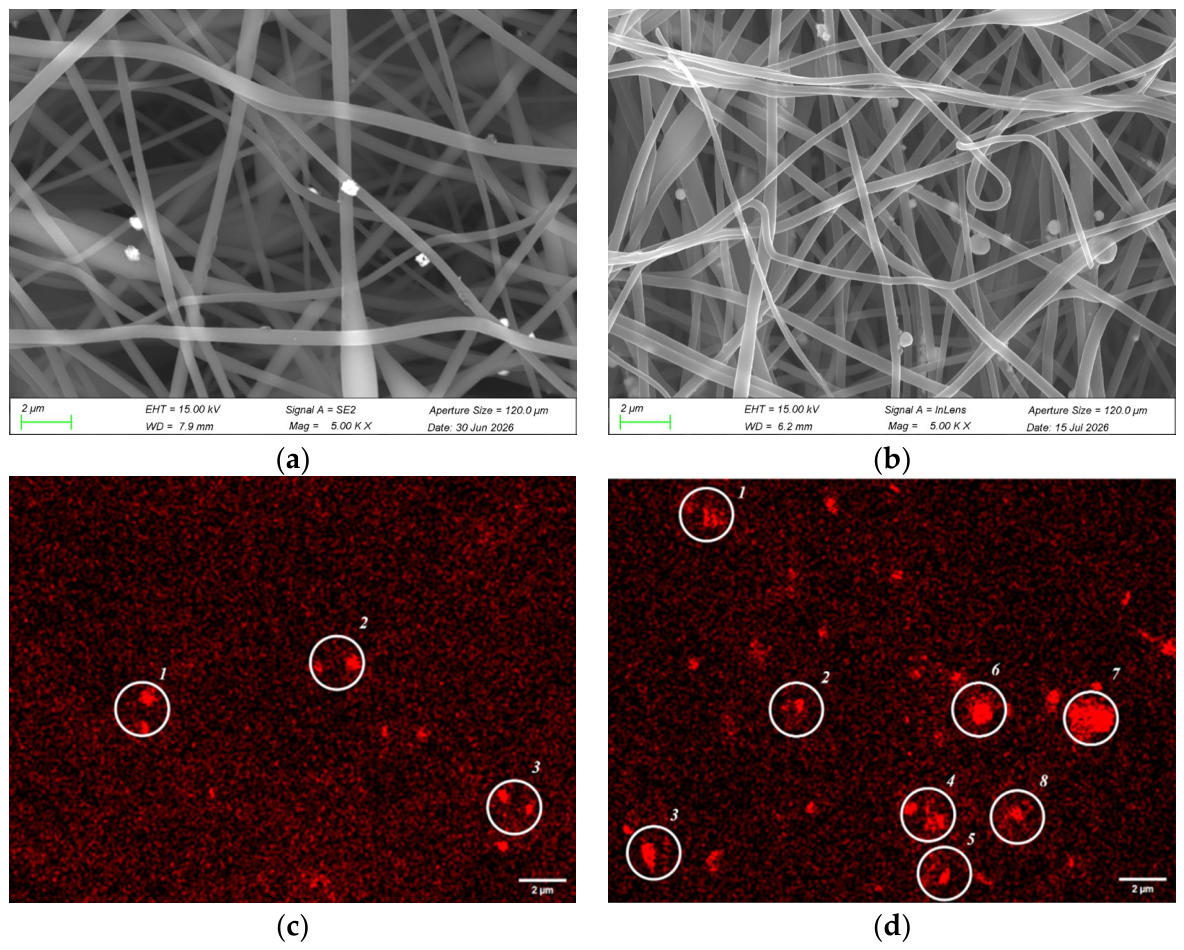
The SEM and EDS images in Figure 17 show interwoven fiber networks in both the 4 and 5 wt.% specimens. Localized Ag-enriched regions and differences in fiber bending, adhesion, and particle deposition are visible in the examined 5 wt.% field. These features suggest spatial nonuniformity of the Ag distribution, but EDS enrichment alone does not quantify particle agglomeration or establish a difference in agglomerate size between the loadings.
Figure 17.
SEM images and Ag elemental maps of carbonized fiber membranes containing different Ag contents: (a,c) 4 wt.% Ag and (b,d) 5 wt.% Ag. (a,b) SEM images; (c,d) EDS elemental maps of Ag. The numbered regions indicate areas of local Ag nanoparticle agglomeration.
Changes in Ag dispersion and fiber contacts may contribute to the increase in re-sistivity at 5 wt.%. However, particle size distributions, agglomerate area fractions, and field-to-field EDS statistics were not obtained. The relationship between these morphological observations and electrical resistivity is therefore interpreted qualitatively, and a causal role of agglomeration has not been demonstrated.
3.5. Validation with DMFC Membrane Electrode Assemblies
3.5.1. Fabrication of DMFC Membrane Electrode Assemblies
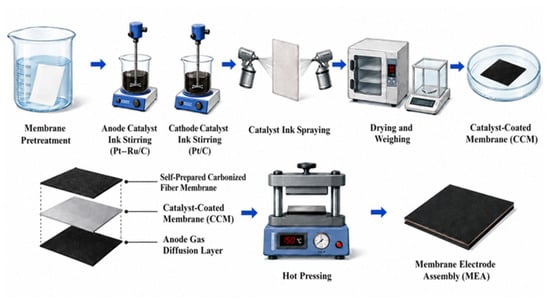
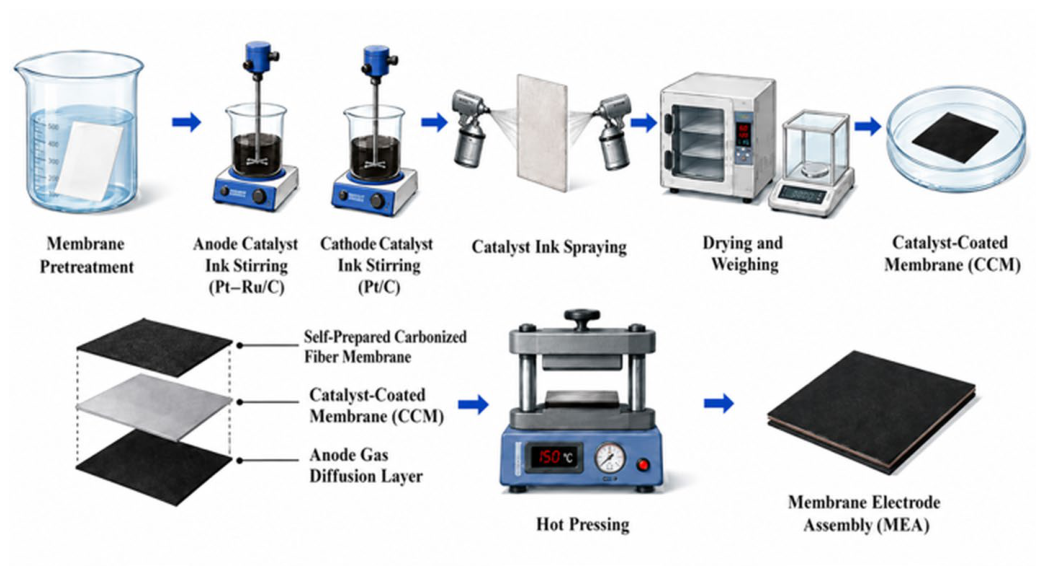
DMFC membrane electrode assemblies with an active area of 4 cm2 were fabricated by the catalyst-coated membrane (CCM) method, as illustrated in Figure 18. After sequential pretreatment with H2O2 solution, dilute H2SO4 solution, and deionized water, Pt–Ru/C and Pt/C catalysts were sprayed onto the anode and cathode sides of the proton exchange membrane, respectively. The spray gun was maintained at a distance of 10 cm from the membrane surface, and catalyst loading was controlled through repeated spraying, drying at 50 °C, and weighing. The mass increment per cycle was approximately 0.2 mg until the catalyst loading on both the anode and cathode sides reached 6 mg·cm−2.
Figure 18.
Fabrication process for the DMFC membrane electrode assemblies.
The self-fabricated pore-size-gradient carbonized fiber membrane and commercial carbon paper were used as the cathode and anode diffusion layers, respectively. The self-fabricated cathode membranes are listed in Table 4. The diffusion layers were cut to dimensions matching the active area and assembled in the prescribed gradient direction in the following order: cathode diffusion layer, cathode catalyst layer, proton exchange membrane, anode catalyst layer, and anode diffusion layer. The assembly was then hot-pressed at 150 °C and 1 MPa for 5 min to obtain the DMFC membrane electrode assembly. Three independent membrane electrode assemblies were prepared for each cathode diffusion layer structure.
Table 4.
Fabrication parameters for the self-fabricated cathode diffusion layers used in the membrane electrode assemblies.
The trilayer design was selected for the cell study for practical handling, cutting, and MEA-assembly considerations, including preservation of the specimen integrity and contact with the catalyst layer. The 150 μm cell specimens constitute a separate validation set from the 80 μm pressure response specimens. The selection does not imply that the trilayer design releases pressure faster than the bilayer membrane with G = 0.063 or that the cell specimens reproduce the same pressure decay conditions.
Because the bilayer membrane with G = 0.063 was not tested in a DMFC under identical conditions, the cell results support comparisons only between M0, MG, and MG-Ag. They do not establish a performance ranking across layer numbers, thicknesses, or gradient magnitudes, and the trilayer configuration is not identified as an optimal DMFC GDL.
3.5.2. Electrochemical Testing of the DMFC Membrane Electrode Assemblies
To ensure comparability between the membrane electrode assemblies, all groups used the same active area (4 cm2), catalyst types and loadings, hot-pressing conditions, and activation procedure; only the cathode diffusion layer differed. Passive DMFC tests were conducted at room temperature and atmospheric pressure with natural oxygen supply to the cathode. The methanol solution volume, stabilization time, electronic-load scanning program, and data acquisition interval were held constant.
Three MEAs were independently prepared for each cathode configuration, and each MEA was tested three times under the same conditions. Repeated tests on the same MEA were treated as technical replicates and averaged before between-MEA comparisons; the independent sample size was n = 3 per group. For peak-power comparisons, the three individual peak values from each MEA were averaged to obtain one MEA-level result. The group mean and SD were defined across the three independent MEAs. Statistical significance is not established by a percentage increase in the reported mean or by error bars alone.
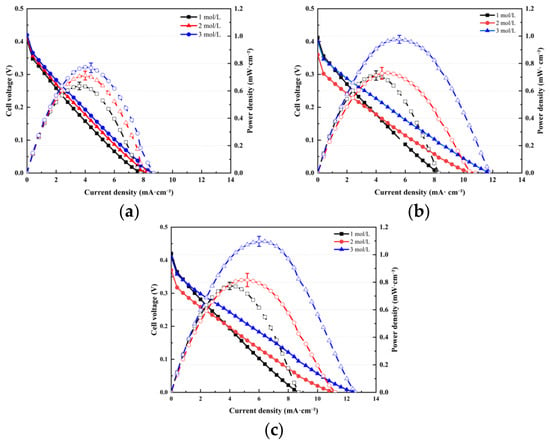
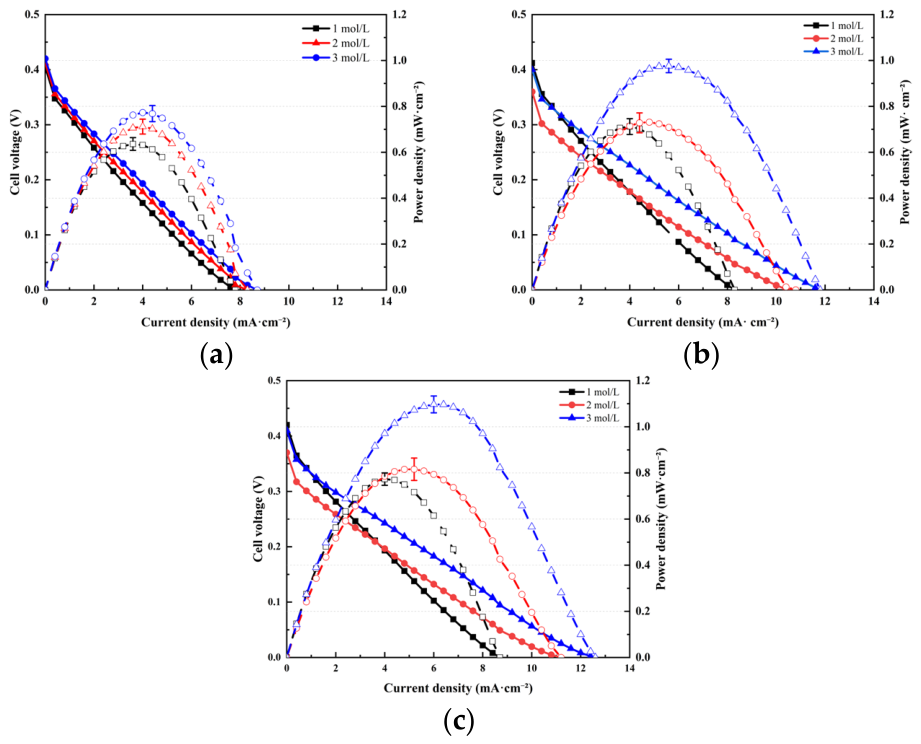
Figure 19 shows increasing peak power density and accessible current density over the tested methanol concentration range of 1–3 mol·L−1. MG maintained higher voltages than M0 over part of the medium- and high-current-density range, while MG-Ag achieved the highest peak power density. At 3 mol·L−1, MG-Ag reached 1.10 ± 0.0366 mW·cm−2, about 43% and 12% higher than M0 and MG, respectively.
Figure 19.
Polarization and power density curves of DMFC membrane electrode assemblies at methanol concentrations of 1, 2, and 3 mol·L−1: (a) M0, (b) MG, and (c) MG-Ag.
The observed performance improvements are discussed as a combined effect of gradient design and Ag incorporation. Without an Ag-modified nongradient control, their interaction cannot be quantified, and synergistic enhancement is not established. The improvement over MG reflects a difference between mean values, with statistical significance remaining undetermined without a formal comparison of peak powers from independent MEAs. Four-probe measurements confirmed reduced membrane resistivity at an appropriate Ag loading. However, without EIS or cell-level resistance measurements, the reduced ohmic losses and contact resistance remain unverified, and the contributions of conduction and mass transport to cell output cannot be separated.
The absolute peak power density of 1.10 mW·cm−2 remains relatively low under passive operation at room temperature with an ambient-air oxygen supply. Reaction kinetics and oxygen transport may constrain the output, but their contributions were not independently quantified; therefore, the low output cannot be attributed solely to the diffusion layer. The results provide an experimental basis for combining pore structure regulation and conductivity enhancement within the tested configuration, while further cell-level characterization and MEA optimization are needed to improve the absolute performance.
4. Conclusions
Sequential electrospinning and carbonization enabled the preparation of layered carbonized fiber membranes with concentration-dependent pore size design, and Ag incorporation reduced their measured electrical resistivity. Residual-pressure decay after pump shutdown provided a complementary comparison of transient liquid-water pressure responses. The main findings are as follows:
- (1)
- Increasing PAN concentration increased the measured mean fiber diameter and apparent surface pore diameter. The concentration–pore size calibration provided the basis for nominal gradient design, while cross-sectional SEM supported continuity of the representative layered membranes. Quantitative layer-resolved pore size profiles were not directly verified.
- (2)
- For the 80 μm specimens, the nominal gradient magnitude and orientation affected the pressure release after pump shutdown. The PG bilayer with G = 0.063 exhibited a residual pressure of 28.50 kPa, a retention ratio of 57.34%, and an average decay rate of 0.3583 kPa·min−1 over 60 min, giving the fastest pressure release among the investigated specimens. PG generally favored release in the bilayer and trilayer designs, whereas its advantage weakened or reversed in the four- and five-layer designs.
- (3)
- The pressure release did not improve monotonically with the layer number. Additional interfaces, filling-history effects, and local transport constraints offer possible explanations for the multilayer trends, but the capillary pressure distributions, interlayer hydraulic resistance, and three-dimensional connectivity were not measured. The pressure records establish a structure-dependent response rather than a verified pore-scale mechanism.
- (4)
- The lowest resistivity in the tested Ag-loading range was approximately 0.018 Ω·m at 4 wt.% Ag. In the separate 150 μm trilayer DMFC validation set, MG-Ag achieved a peak power density of 1.10 ± 0.0366 mW·cm−2 at 3 mol·L−1 methanol, 43% and 12% higher than M0 and MG, respectively. These comparisons indicate a combined modification effect under the tested conditions; they do not establish statistical significance, a synergistic interaction, or a quantified reduction in cell ohmic losses.
The findings provide a laboratory-scale basis for examining pore-size-gradient design together with Ag-assisted electrical modification in DMFC cathode GDLs. Practical application remains limited by the low absolute cell output and incomplete characterization of bulk porosity, gas permeability, wettability, and internal transport pathways. Long-term DMFC stability and persistence of the conductivity improvement were not evaluated. Scale-up also requires verification of large-area layer thickness uniformity, reproducibility of the internal gradient, Ag dispersion, production consistency, and cost before device-level feasibility can be established.
Author Contributions
Conceptualization, Y.Y. and F.X.; methodology, Y.Y. and F.X.; software, Y.Y.; validation, Y.Y., X.J. and Y.L.; formal analysis, Y.Y.; investigation, Y.Y.; resources, F.X., X.J. and X.L.; data curation, Y.Y.; writing—original draft preparation, Y.Y.; writing—review and editing, F.X., X.J., Y.L. and X.L.; visualization, Y.Y.; supervision, F.X. and X.L.; project administration, F.X.; funding acquisition, F.X. All authors have read and agreed to the published version of the manuscript.
Funding
This research was supported by the Open Project of the Key Laboratory of Safety Detection and Evaluation Technology of New Energy Batteries with High Specific Energy, State Administration for Market Regulation (Grant No. XZJKF2025C01).
Data Availability Statement
The data presented in this study are available within the article. Additional data are available from the corresponding author upon reasonable request.
Acknowledgments
During the preparation of this manuscript, the authors used OpenAI to assist in preparing the graphical content of Figure 3, Figure 10 and Figure 18. The AI-assisted content was carefully reviewed and revised by the authors to ensure its scientific accuracy and consistency with the experimental procedures and interpretations presented in the manuscript. The authors take full responsibility for the accuracy, originality, and integrity of the final figures and all other content of this publication.
Conflicts of Interest
The authors declare no conflicts of interest. The funder had no role in the design of the study; in the collection, analysis, or interpretation of data; in the writing of the manuscript; or in the decision to publish the results.
Abbreviations
The following abbreviations are used in this manuscript:
| Ag NPs | Silver nanoparticles |
| CCM | Catalyst-coated membrane |
| DMF | N,N-Dimethylformamide |
| DMFC | Direct methanol fuel cell |
| GDL | Gas diffusion layer |
| MEA | Membrane electrode assembly |
| PAN | Polyacrylonitrile |
| PG | Positive-gradient direction |
| RG | Reverse-gradient direction |
| SEM | Scanning electron microscopy |
References
- Tseng, C.-J.; Lo, S.-K. Effects of microstructure characteristics of gas diffusion layer and microporous layer on the performance of PEMFC. Energy Convers. Manag. 2010, 51, 677–684. [Google Scholar] [CrossRef] [Scilit]
- Sarker, M.; Rahman, M.A.; Mojica, F.; Mehrazi, S.; Kort-Kamp, W.J.M.; Chuang, P.-Y.A. Experimental and computational study of the microporous layer and hydrophobic treatment in the gas diffusion layer of a proton exchange membrane fuel cell. J. Power Sources 2021, 509, 230350. [Google Scholar] [CrossRef] [Scilit]
- Park, J.; Oh, H.; Lee, Y.I.; Min, K.; Lee, E.; Jyoung, J.-Y. Effect of the pore size variation in the substrate of the gas diffusion layer on water management and fuel cell performance. Appl. Energy 2016, 171, 200–212. [Google Scholar] [CrossRef] [Scilit]
- Ko, D.; Doh, S.; Park, H.S.; Kim, M.H. The effect of through plane pore gradient GDL on the water distribution of PEMFC. Int. J. Hydrogen Energy 2018, 43, 2369–2380. [Google Scholar] [CrossRef] [Scilit]
- Balakrishnan, M.; Shrestha, P.; Ge, N.; Lee, C.; Fahy, K.F.; Zeis, R.; Schulz, V.P.; Hatton, B.D.; Bazylak, A. Designing Tailored Gas Diffusion Layers with Pore Size Gradients via Electrospinning for Polymer Electrolyte Membrane Fuel Cells. ACS Appl. Energy Mater. 2020, 3, 2695–2707. [Google Scholar] [CrossRef] [Scilit]
- Ren, G.; Qu, Z.; Wang, X.; Zhang, J. Liquid water transport and mechanical performance of electrospun gas diffusion layers. Int. J. Hydrogen Energy 2022, 19, 210–218. [Google Scholar] [CrossRef] [Scilit]
- Ren, G.; Qu, Z.; Wang, X.; Zhang, G. Enhancing the performance of proton exchange membrane fuel cell using nanostructure gas diffusion layers with gradient pore structures. Int. J. Hydrogen Energy 2024, 52, 1161–1172. [Google Scholar] [CrossRef] [Scilit]
- Li, L.; Wang, Y.; Lei, T.; Xie, Z.; Liang, Y. Structure and properties of carbon fiber paper with gradient porous structure. J. Porous Mater. 2024, 31, 887–895. [Google Scholar] [CrossRef] [Scilit]
- Liao, J.; Guo, X.; Zhang, Z.; Li, T.; Nie, X.; Jiang, Z.; Yang, M. Study of the effect of fiber diameter gradient distribution on water transport in the gas diffusion layer of proton exchange membrane fuel cells. Ionics 2025, 31, 2623–2635. [Google Scholar] [CrossRef] [Scilit]
- Lim, I.S.; Lee, Y.I.; Kang, B.; Park, J.Y.; Kim, M.S. Electrochemical performance and water management investigation of polymer electrolyte membrane fuel cell (PEMFC) using gas diffusion layer with polytetrafluoroethylene (PTFE) content gradients in through-plane direction. Electrochim. Acta 2022, 421, 140509. [Google Scholar] [CrossRef] [Scilit]
- Shangguan, X.; Li, Y.; Qin, Y.; Cao, S.; Zhang, J.; Yin, Y. Effect of the porosity distribution on the liquid water transport in the gas diffusion layer of PEMFC. Electrochim. Acta 2021, 371, 137814. [Google Scholar] [CrossRef] [Scilit]
- Zhao, C.; Zhang, H.; Huang, Z.; Zhao, M.; Chen, H.; Lin, G. Two-Stage Microporous Layers with Gradient Pore Size Structure for Improving the Performance of Proton Exchange Membrane Fuel Cells. Polymers 2023, 15, 2740. [Google Scholar] [CrossRef] [Scilit]
- Yan, S.; Yang, M.; Sun, C.; Xu, S. Liquid Water Characteristics in the Compressed Gradient Porosity Gas Diffusion Layer of Proton Exchange Membrane Fuel Cells Using the Lattice Boltzmann Method. Energies 2023, 16, 6010. [Google Scholar] [CrossRef] [Scilit]
- Ren, G.; Qu, Z.; Wang, X.; Zhang, G.; Wang, Y. Electrospun fabrication and experimental characterization of highly porous microporous layers for PEM fuel cells. Int. J. Hydrogen Energy 2024, 55, 455–463. [Google Scholar] [CrossRef] [Scilit]
- Roussillo-David de Beaufort, B.; Fouda-Onana, F.; Ducros, J.-B.; David, T.; Scheel, M.; Serre, G.; Pauchet, J.; Prat, M. Characterization of Electrospun and Commercial Gas Diffusion Layers for PEMFC Using High-Resolution 3D Imaging and Direct Simulations. ACS Appl. Energy Mater. 2024, 8, 151–169. [Google Scholar] [CrossRef] [Scilit]
- Sim, J.; Kang, M.; Min, K. Effects of basic gas diffusion layer components on PEMFC performance with capillary pressure gradient. Int. J. Hydrogen Energy 2021, 46, 27731–27748. [Google Scholar] [CrossRef] [Scilit]
- Li, B.; Cao, S.; Qin, Y.; Liu, X.; Xu, X.; Xin, Q. Liquid Water Transport and Distribution in the Gas Diffusion Layer of a Proton Exchange Membrane Fuel Cell Considering Interfacial Cracks. Energies 2024, 17, 5339. [Google Scholar] [CrossRef] [Scilit]
- Chen, Y.C.; Dorenkamp, T.; Csoklich, C.; Berger, A.; Marone, F.; Eller, J.; Schmidt, T.J.; Buchi, F.N. On the water transport mechanism through the microporous layers of operando polymer electrolyte fuel cells probed directly by X-ray tomographic microscopy. Energy Adv. 2023, 2, 1447–1463. [Google Scholar] [CrossRef] [Scilit]
- Shu, Q.-z.; Xia, Z.-x.; Wei, W.; Xu, X.-l.; Wang, S.-l.; Zhao, H.; Sun, G.-q. A novel gas diffusion layer and its application to direct methanol fuel cells. New Carbon Mater. 2021, 36, 409–419. [Google Scholar] [CrossRef] [Scilit]
- Alrashidi, A.; Liu, H.T. Laser-perforated anode gas diffusion layers for direct methanol fuel cells. Int. J. Hydrogen Energy 2021, 46, 17886–17896. [Google Scholar] [CrossRef] [Scilit]
- Zhang, Y.; Zhang, X.; Yuan, W.; Gao, S.; Hou, C.; Zhang, Y. High-Performance Flexible Direct Methanol Fuel Cell with Homogeneous Anode Gas Diffusion Layer. ACS Appl. Mater. Interfaces 2025, 17, 32432–32444. [Google Scholar] [CrossRef] [Scilit]
- Fu, X.; Ni, H.; Zhang, F.; Yang, Y.; Shao, X.; Huang, Z.; Zhang, R.; Liu, Q.; Hu, S. Polypyrrole nanowires as a cathode microporous layer for direct methanol fuel cell to enhance oxygen transport. Int. J. Energy Res. 2020, 45, 3375–3384. [Google Scholar] [CrossRef] [Scilit]
- Balakrishnan, P.; Guan, L.; Liu, H.; Leung, P.; Shah, A.; Xing, L.; Su, H.; Xu, Q. Tunable nitrogen crafted 2D-graphene nano-hybrid from industrial expansive and ecological approach as robust cathode microporous layer to improve performance of a direct methanol fuel cell. Sci. China Technol. Sci. 2023, 66, 2669–2680. [Google Scholar] [CrossRef] [Scilit]
- Wu, Y.; Wang, Z.; Xu, L.; Wang, H.; Peng, S.; Zheng, L.; Yang, Z.; Wu, L.; Miao, J.-T. Preparation of silver-plated carbon nanotubes/carbon fiber hybrid fibers by combining freeze-drying deposition with a sizing process to enhance the mechanical properties of carbon fiber composites. Compos. Part A Appl. Sci. Manuf. 2021, 146, 106421. [Google Scholar] [CrossRef] [Scilit]
- Gea, S.; Attaurrazaq, B.; Situmorang, S.A.; Piliang, A.F.R.; Hendrana, S.; Goutianos, S. Carbon-Nano Fibers Yield Improvement with Iodinated Electrospun PVA/Silver Nanoparticle as Precursor via One-Step Synthesis at Low Temperature. Polymers 2022, 14, 446. [Google Scholar] [CrossRef] [Scilit]
- Li, J.-W.; Huang, B.-S.; Chang, C.-H.; Chiu, C.-W. Advanced electrospun AgNPs/rGO/PEDOT:PSS/TPU nanofiber electrodes: Stretchable, self-healing, and perspiration-resistant wearable devices for enhanced ECG and EMG monitoring. Adv. Compos. Hybrid. Mater. 2023, 6, 1–15. [Google Scholar] [CrossRef] [Scilit]
- Karagiorgis, X.; Shakthivel, D.; Khandelwal, G.; Ginesi, R.; Skabara, P.J.; Dahiya, R. Highly Conductive PEDOT:PSS: Ag Nanowire-Based Nanofibers for Transparent Flexible Electronics. ACS Appl. Mater. Interfaces 2024, 16, 19551–19562. [Google Scholar] [CrossRef] [Scilit]
- Wu, S.; Zhang, L.; Qiu, X.; Guo, Y.; Dong, L.; Guo, M.; Zhao, J. Preparation and Characterization of Highly Conductive PVDF/PAN Conjugate Electrospun Fibrous Membranes with Embedded Silver Nanoparticles. Polymers 2024, 16, 3540. [Google Scholar] [CrossRef] [Scilit]
- Ali, W.; Shabani, V.; Linke, M.; Sayin, S.; Gebert, B.; Altinpinar, S.; Hildebrandt, M.; Gutmann, J.S.; Mayer-Gall, T. Electrical conductivity of silver nanoparticle doped carbon nanofibres measured by CS-AFM. RSC Adv. 2019, 9, 4553–4562. [Google Scholar] [CrossRef] [Scilit]
- Borowec, J.; Selmert, V.; Kretzschmar, A.; Fries, K.; Schierholz, R.; Kungl, H.; Eichel, R.A.; Tempel, H.; Hausen, F. Carbonization-Temperature-Dependent Electrical Properties of Carbon Nanofibers-From Nanoscale to Macroscale. Adv. Mater. 2023, 35, e2300936. [Google Scholar] [CrossRef] [Scilit]

Disclaimer/Publisher’s Note: The statements, opinions and data contained in all publications are solely those of the individual author(s) and contributor(s) and not of MDPI and/or the editor(s). MDPI and/or the editor(s) disclaim responsibility for any injury to people or property resulting from any ideas, methods, instructions or products referred to in the content. |
© 2026 by the authors. Licensee MDPI, Basel, Switzerland. This article is an open access article distributed under the terms and conditions of the Creative Commons Attribution (CC BY) license.