


Abstract
Air-foam flooding combines gas-assisted displacement, foam mobility control, and surfactant-induced interfacial tension reduction in ultra-low-permeability reservoirs. A three-dimensional mechanistic model informed by a field-scale reservoir model was used to compare six displacement cases, reservoir-property responses, and injection schedules. The final recovery factors for baseline waterflooding, gas-assisted flooding, surfactant-background flooding, foam mobility control, interfacial tension reduction, and integrated air-foam flooding were 38.14%, 40.50%, 40.81%, 42.03%, 41.44%, and 47.79%, respectively. Relative to the surfactant-background case, activating foam mobility control alone increased recovery by 1.22%, whereas activating interfacial tension reduction alone increased it by 0.63%. Activating both increased recovery by 6.98%, including a 5.13% non-additive term that suggests a potential interaction between foam plugging and surfactant-enhanced oil displacement under the modeled conditions. Within the tested ranges, the normalized sensitivity weights for permeability contrast, the vertical-to-horizontal permeability ratio, and average permeability were 41.13%, 34.79%, and 24.08%, respectively. Within the parameter ranges investigated in this model, the single-factor results indicated favorable recovery performance at permeability contrasts not exceeding 10, vertical-to-horizontal permeability ratios of at least 0.4, and average permeabilities of at least 4 mD. A gas-to-liquid ratio of 1:1 produced the highest final recovery among the ratios tested. With the same prescribed total injection volume, shortening the alternating injection interval from 24 to 3 months increased final recovery from 47.60% to 48.40%. Switching at water cuts no higher than 85% avoided the lower recovery associated with the latest switching case. These findings provide a quantitative basis for reservoir screening and injection scheme design of air-foam flooding.
1. Introduction
Ultra-low-permeability reservoirs are characterized by small pore throats, high flow resistance, and restricted pressure propagation. Prolonged water injection can establish stable preferential flow paths while leaving oil outside the dominant streamlines insufficiently contacted. After the reservoir enters the middle-to-high water-cut stage, increasing water injection alone may raise water production without proportionate oil recovery, making mobility control and remaining-oil mobilization central to further development [1]. Field applications in low-permeability reservoirs likewise show that foam treatment is most relevant where injection profiles are uneven and high-permeability intervals dominate fluid intake [2,3]. Gas injection can supplement reservoir energy and reach regions that are difficult for water to enter; however, its low viscosity promotes viscous fingering and channeling through preferential paths, so sweep remains strongly constrained by heterogeneity [4].
Air-foam flooding combines gas-phase displacement with foam mobility control. Foam lamellae reduce gas mobility, delay gas breakthrough, and modify the pressure distribution between layers. Sand-pack, coreflood, numerical, and microfluidic studies show that foam is preferentially generated or retained in high-flow-capacity paths, where it raises flow resistance without completely sealing the reservoir [5,6,7,8]. This selective response can redirect subsequent fluids and improve sweep in heterogeneous media; analogous nitrogen-foam experiments and simulations also demonstrate preferential-channel control and improved interlayer intake [9,10]. In oxygen-containing systems, oxygen consumption and possible oxygen breakthrough constrain field implementation. Oxygen-reduced gas lowers the oxygen concentration reaching producers and reduces uncertainty associated with oxidation reactions [11,12].
Foam generation, propagation, and rupture in porous media are jointly controlled by water saturation, oil saturation, surfactant concentration, pressure gradient, and gas–liquid contact history [13,14]. Laboratory visualization and reservoir simulation further show that the injected sequence affects foam propagation and the persistence of mobility control [15,16]. Numerical descriptions mainly include population-balance models that track lamella density and local-equilibrium models that apply empirical gas-mobility-reduction functions [17]. Population-balance models have a clearer mechanistic basis but require more parameters and computational effort, whereas local-equilibrium models represent dry-out, oil-induced destabilization, and shear response more compactly and are widely used in reservoir-scale simulation [18,19]. Coreflood-based calibration improves agreement with measured pressure and mobility responses, although parameter nonuniqueness requires consistent baselines and explicit sensitivity analysis [20,21].
Reservoir conditions and operating variables influence foam performance through different mechanisms. Permeability controls injectivity, limiting capillary pressure, and foam propagation [22], while oil type, oil saturation, and interfacial properties affect foam stability and the conversion of improved sweep into oil recovery [23,24,25]. These effects are especially important in ultra-low-permeability media, where pressure constraints can limit the distance reached by gas and surfactant.
Injection design introduces a second group of controls. Foam quality and gas–liquid ratio determine the balance between gas supply, liquid continuity, and lamella generation [24]. Simultaneous or alternating gas–liquid injection, treatment timing, and slug subdivision influence gas–liquid contact, gravity segregation, foam regeneration, and chemical utilization [26,27,28,29]. Numerical optimization studies have examined these variables individually or in combination [30], but few studies integrate mechanism decomposition, reservoir-property sensitivity, and injection-schedule optimization within one internally consistent model.
Accordingly, this study first uses a field-scale model based on the actual well pattern and production history to assess the agreement between simulated and observed cumulative production. Reservoir and fluid-property ranges from the field model then inform an idealized inverted nine-spot model, in which the well pattern and operating conditions can be controlled across comparisons. Six cases are used to quantify the conditional recovery increments associated with gas-assisted flooding, foam mobility control, and surfactant-induced interfacial tension reduction, together with the non-additive response when the latter two functions are activated jointly. One-factor-at-a-time simulations examine the effects of average horizontal permeability, permeability contrast, and the vertical-to-horizontal permeability ratio. The effects of conversion water cut, gas-to-liquid ratio, and alternating injection interval are then evaluated within the investigated operating ranges. Nitrogen represents the injected gas in the mechanistic model; oxygen-related low-temperature oxidation is outside its scope.
2. Numerical Experiments and Research Methods
2.1. Field Model and Historical Data
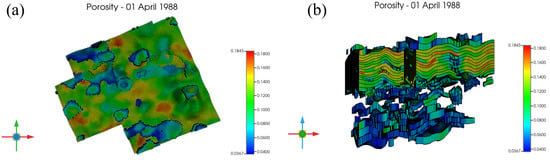
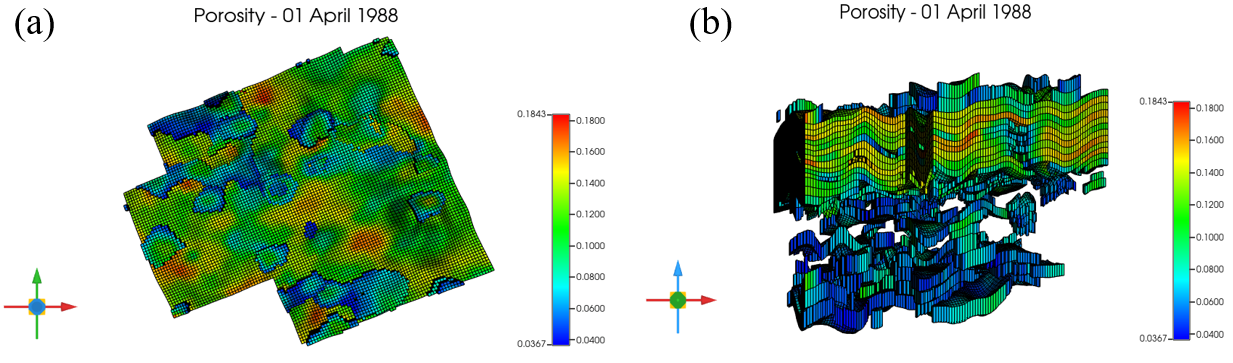
A field-scale numerical model was constructed for the Chang 6 reservoir in the Wangyao area of the Ansai Oilfield using actual well locations, completion records, and reservoir interpretations. The irregular field pattern comprises 17 injection wells and 61 production wells. The corner-point grid contains 226,800 cells, with a horizontal grid spacing of approximately 20 m. The 25 vertical layers resolve the oil-bearing intervals and interbeds. Cell thickness is less than 1 m within the oil-bearing intervals, and locally less than 0.5 m across the interbeds. Porosity and permeability distributions were interpolated from well data, and the oil–water relative permeability inputs were based on core measurements from the study area. Monthly completion, injection, production, pressure, and treatment records for the 78 wells formed the dynamic data set. As shown in Figure 1, the initial porosity of the field model ranges from approximately 0.037 to 0.184 and varies spatially in both the lateral and vertical directions.
Figure 1.
Initial porosity distribution of the field model: (a) top view; (b) three-dimensional view.
The simulation begins on 1 April 1988 and ends in December 2025. Well types, opening and shut-in dates, and injection and production schedules were assigned according to the historical records. Air-foam injection began in the field model in August 2007, and the same switching date was adopted in the baseline mechanistic model. The original reservoir pressure reported in the field data is 12.26 MPa. The numerical model uses an initial reference pressure of 9.13 MPa at a reference depth of −125 m and is run isothermally at 57.8 °C. The fluid model includes water, oil, dissolved gas, nitrogen, and components representing the chemical treatment. The bubble-point pressure is 6.2 MPa. Table 1 summarizes the principal fluid properties and the well-control limits used for the subsequent scheme calculations.
Table 1.
Principal fluid properties and well-control parameters.
Producers were subject to maximum liquid-rate and minimum bottom-hole-pressure constraints, whereas liquid and gas injectors were subject to maximum injection-rate and maximum bottom-hole-pressure constraints. The design gas-to-liquid ratio was defined using injection volumes at reservoir conditions. The field injection scheme uses a conversion factor of 105 m3 at standard conditions per 1 m3 of gas at reservoir conditions. Accordingly, a standard-condition gas injection rate of 1470 m3/day corresponds to 14 m3/day at reservoir conditions. Together with a liquid injection rate of 14 m3/day, this gives a design gas-to-liquid ratio of 1:1 at reservoir conditions.
2.2. Field-Model History Match and Relationship to the Mechanistic Model
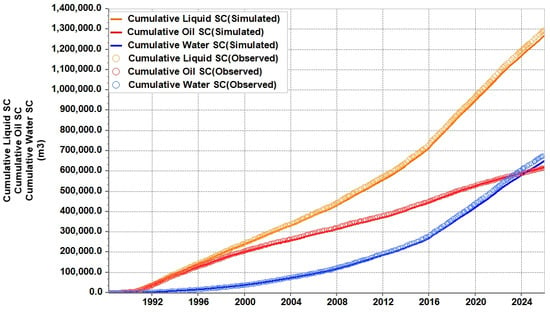
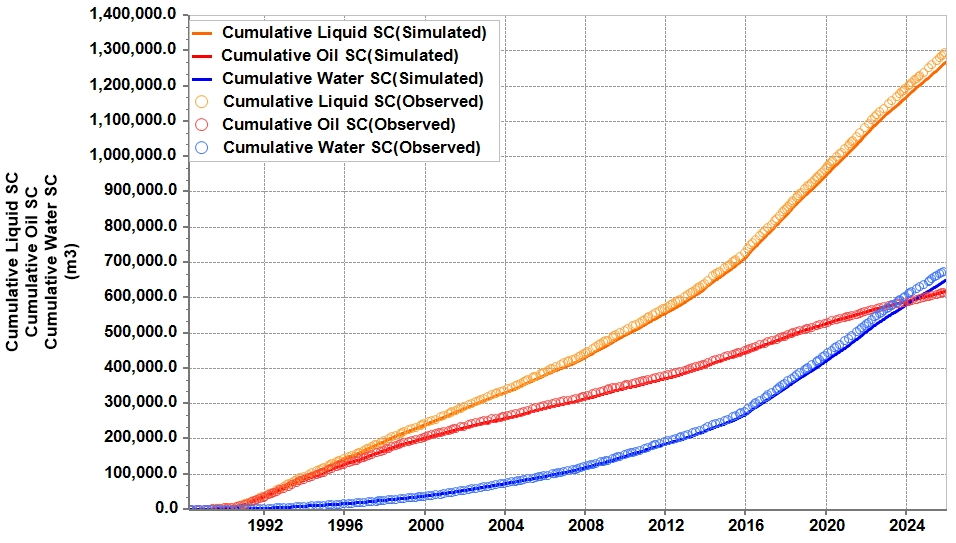
The field-model history match was evaluated using field-wide cumulative liquid, oil, and water production. The observed totals were 1,298,920 m3, 617,632 m3, and 681,288 m3, respectively; the corresponding simulated totals were 1,269,465 m3, 618,835 m3, and 650,630 m3. Calculated as the absolute difference between the simulated and observed values divided by the observed value, the relative errors were 2.27%, 0.19%, and 4.50%, respectively (Table 2).
Table 2.
Field-model history match for cumulative production.
Figure 2 compares the observed and simulated field-wide cumulative liquid, oil, and water production. The overall trends of the simulated results are close to those observed in the field.
Figure 2.
History-matching curves for field-wide cumulative liquid, oil, and water production.
The history match covers waterflooding and subsequent foam flooding. Agreement between simulated and observed cumulative liquid, oil, and water production indicates that the field model reproduces aggregate production behavior over the development history. This agreement provides integrated constraints on the combined representation of reservoir properties, multiphase-flow functions, interwell connectivity, historical well controls, and foam parameters. The resulting model settings provide the basis for constructing the mechanistic model and defining its reference operating conditions.
An idealized mechanistic model was subsequently constructed within the reservoir- and fluid-property ranges informed by the field model. The field model retains the actual well locations and development history to evaluate field-wide production behavior. The mechanistic model uses a consistent well pattern and operating schedule while varying individual reservoir or injection parameters to identify their effects on air-foam flooding. Because the field and mechanistic models differ in well pattern and simulation period, their final recovery factors are evaluated within their respective model settings.
2.3. Mechanistic Model of a Layered Low Permeability Reservoir
To investigate the effects of reservoir properties and injection schedules on air-foam flooding, an idealized mechanistic model was constructed using CMG STARS. The model was informed by the reservoir and fluid-property ranges of the field model, with the properties of Well W15-92 used to define the reference case. An inverted nine-spot pattern comprising a central injector and peripheral producers was adopted. The three-dimensional model grid and well configuration are shown in Figure 3. This regular pattern provides consistent injector–producer relationships across scenarios, allowing reservoir and operating parameters to be varied under controlled conditions. Comparisons among waterflooding, gas-assisted flooding, and air-foam flooding scenarios were then used to evaluate the conditional recovery increments associated with foam mobility control and surfactant-induced interfacial-tension reduction, as well as their interaction.
Figure 3.
Three-dimensional view of the model grid.
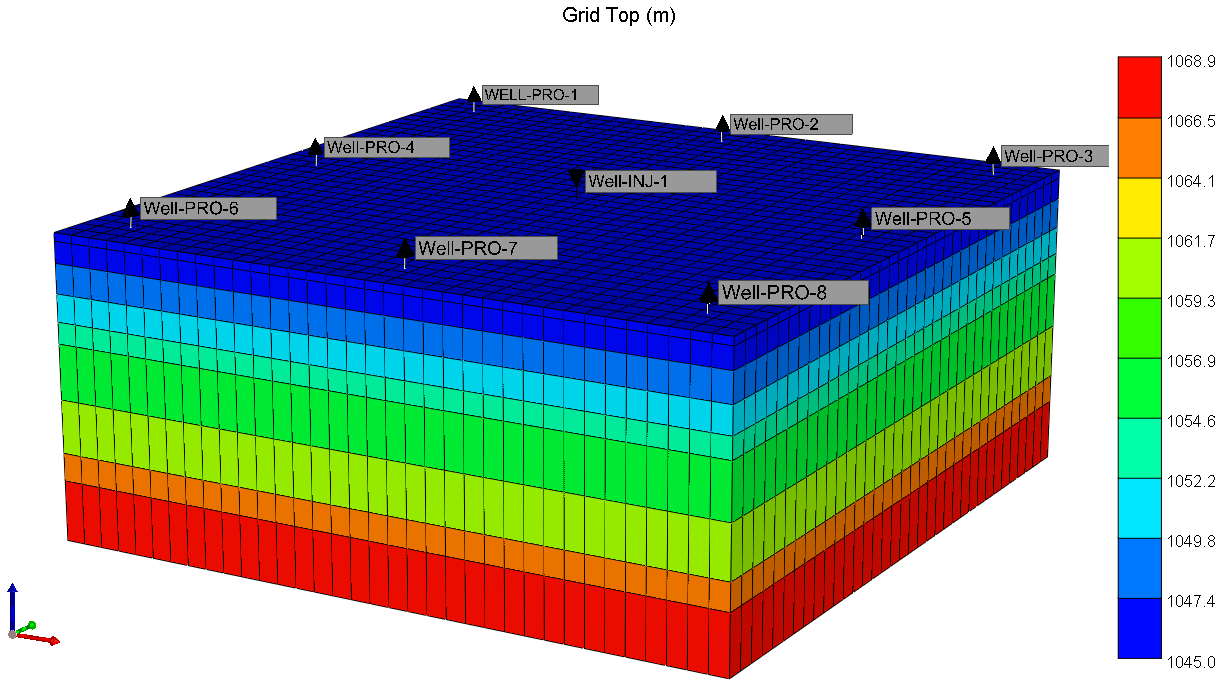
The model grid contains 35 × 35 × 9 cells, giving a total of 11,025 grid cells. The areal grid size is 10 m × 10 m, and the total model thickness is 29.8 m. The average porosity is 12.34%, and the average permeability is 1.36 mD, indicating an overall low-porosity and low-permeability reservoir. Reservoir heterogeneity of this type strongly affects the sweep of injected fluids, displacement efficiency, and remaining oil mobilization, making the model suitable for mechanistic investigation of air-foam flooding.
Different thickness, porosity, permeability, and oil saturation distributions were assigned vertically to represent the actual vertical heterogeneity of the reservoir. Effective thickness, porosity, permeability, and initial oil saturation in each layer were assigned according to the properties of the target well so that the model parameters remained consistent with reservoir understanding. Permeability, porosity, and oil saturation show clear interlayer contrasts. Low-permeability layers alternate with relatively high-permeability layers, representing the development challenge in which injected fluids preferentially enter higher-permeability layers while lower-permeability layers remain insufficiently swept.
The model development strategy consisted of baseline waterflooding followed by conversion to different enhanced oil recovery schemes. The mechanism-comparison cases used the same switching date as the field model and followed consistent injection and production constraints. A consistent well pattern and well control constraints were applied to minimize the influence of nontarget factors, so that differences in recovery among the cases primarily reflected the contribution of the displacement mechanisms.
The model has an areal size of 350 m × 350 m and a vertical effective thickness of 29.8 m. It is divided into 35 × 35 × 9 grid cells, giving 11,025 computational cells, with an areal grid size of 10 m × 10 m. Layer thickness, porosity, permeability, and initial oil saturation were assigned separately. Properties were uniform within each layer and varied vertically between layers to emphasize the effects of interlayer heterogeneity on gas–liquid flow partitioning and foam propagation. Model permeability ranges from 0.5052 to 2.8906 mD, with a thickness-weighted average of 1.3569 mD. Porosity ranges from 10.27% to 13.85%, with a thickness-weighted average of 12.34%. Initial oil saturation ranges from 52.24% to 64.73%, with a thickness-weighted average of 58.45%. Crude oil viscosity is 3.8914 mPa·s. The main model parameters are listed in Table 3. To represent the treatment schedule of the field model, the baseline mechanistic model adopted the same date for conversion from waterflooding to air-foam injection. All mechanistic comparisons used the same simulation end point. The mechanistic model uses the fluid properties and injection and production well-control parameters listed in Table 1. All mechanistic comparison cases use consistent baseline parameters and well-control constraints, except for the variables explicitly varied in the sensitivity analyses and injection optimization.
Table 3.
Reservoir properties.
2.4. Compositional Model for Air-Foam Flooding
2.4.1. Component System and Basic Assumptions
The model contains seven components: water, surfactant, mobile foam, dead oil, dissolved gas, nitrogen, and trapped liquid film. Oil, water, and gas are the main flowing phases. The surfactant is transported with the aqueous phase. Nitrogen represents the main gas component in oxygen-reduced air. Mobile foam and trapped liquid film describe foam transport and foam trapping in porous media, respectively. No pseudo-foam component is injected directly. Foam is generated through contact between surfactant solution and gas within the reservoir.
Based on the transport characteristics of air-foam in low-permeability porous media, the model adopts the following simplifications. Three-phase flow of oil, gas, and water follows the extended Darcy law. The reservoir rock matrix does not participate in component reactions. The surfactant is mainly present in the aqueous phase. The main effect of foam on flow is represented by reduced gas mobility and additional resistance imposed on the water and gas phases by trapped liquid films. The injected gas phase is represented by nitrogen as the dominant component, and low-temperature oxidation between a small amount of oxygen and crude oil is not modeled separately. The nitrogen approximation excludes oxygen consumption and reaction-related changes in gas composition, temperature, and fluid properties, which may affect gas mobility and foam stability. These effects are not quantified here, and the recovery responses and scenario comparisons are evaluated within the adopted nonreactive model assumptions. This treatment allows the model to focus on conformance control, plugging, and interfacial effects of air-foam, consistent with the mechanistic decomposition objective of this study.
The mass conservation equation for component i can be written as follows:
where φ is porosity; ρα, Sα and xiα are the density, saturation, and mole fraction of component i in phase α, respectively; ai is the amount adsorbed or retained on the rock surface; ρr is the rock density; uα is the phase velocity; qi is the well source and sink term; and ri is the component conversion term associated with foam generation, trapping, or decay.
The velocity of each phase is calculated using the extended Darcy law:
where K is the absolute permeability tensor; krα and μα are relative permeability and viscosity, respectively; pα is phase pressure; and g is gravitational acceleration.
2.4.2. Foam Mobility Control and Liquid Film Retention
The effect of foam on gas mobility is represented using the empirical foam model in STARS. In the presence of foam, the effective gas relative permeability is expressed as follows:
where and are the gas relative permeabilities with and without foam, respectively, and FM is the foam mobility correction factor, which can be written as follows:
where fmob is the maximum foam mobility reduction parameter, and fsurf, fcap, fdry, and foil describe the effects of surfactant concentration, capillary number, water saturation, and oil saturation on foam strength, respectively. When gas and sufficient surfactant solution coexist and local water saturation and oil saturation fall within the foam stability range, the foam mobility correction factor decreases, and gas mobility is suppressed.
In the foam-mobility-control and integrated air-foam models, the maximum mobility-reduction parameter was set to 400. The surfactant-response parameter, capillary-number-response parameter, and critical water saturation for dry-out were 8.456 × 10⁻⁵, 0.062, and 0.402, respectively, and the characteristic oil saturation was 0.50. The component-conversion framework and foam interpolation strategy were initialized with reference to the experimentally calibrated air-foam model of Li et al. [7] and the local-equilibrium calibration procedure of Ding et al. [20]. The foam parameter settings retained following field-model history matching over the waterflooding and foam-flooding stages were adopted in the mechanistic model. Table 4 lists the principal foam-model parameters used in this study and their baseline values for the sensitivity analysis in Section 3.2. The baseline foam-parameter settings were maintained across the comparisons, except for the modeled functions explicitly activated or deactivated in the mechanism-comparison design and the foam parameters individually perturbed in Section 3.2.
Table 4.
Main parameters of the air-foam model.
To describe foam trapping in pore throats and preferential flow channels, a trapped liquid film component was further included in the model. After surfactant, gas, and water form mobile foam, part of the liquid film is converted to a trapped state and imposes additional resistance on the water and gas phases. The corresponding effective mobility can be expressed as follows:
where Ctrap is the trapped liquid film content and B is the liquid film plugging multiplier. As the trapped liquid film index increases from 0.10 to 5.00, the plugging multiplier increases from 1.00 to 8.00, suppressing gas flow and subsequent water flow in foam-enriched regions.
Foam generation, liquid-film trapping, and liquid-film release or decay were represented by three component-conversion processes with frequency factors of 0.08, 0.12, and 8.0 × 10⁻⁴, respectively. The first two processes occur more rapidly than trapped-film decay, allowing the model to represent foam establishment, retention, and gradual weakening. This formulation is consistent with experimental observations that foam is repeatedly generated, ruptured, and regenerated during transport through heterogeneous porous media [8,10].
2.4.3. Interfacial Effects of Surfactant
In addition to reducing gas mobility, the surfactant alters capillary trapping by reducing oil–water interfacial tension. The integrated air-foam model represents this effect using a surfactant-concentration/interfacial-tension table together with relative-permeability interpolation. At zero SURF mole fraction, the oil–water interfacial tension is 30 mN/m and decreases with increasing SURF mole fraction to a prescribed minimum of 1.0 × 10⁻⁴ mN/m. This treatment separates low-interfacial-tension displacement from foam-induced gas-mobility reduction and is consistent with the combined mobility-control and displacement mechanism reported for low-interfacial-tension foam systems [25].
The specified relationship between the aqueous-phase SURF mole fraction and oil–water interfacial tension is presented in Table 5. Interfacial tension decreases from 30 mN/m at zero SURF mole fraction to a prescribed lower bound of 1 × 10⁻⁴ mN/m at a mole fraction of 0.015. This lower bound is a modeling assumption representing strong interfacial effects and is used to examine the influence of interfacial-tension reduction on displacement. Local interfacial tension is determined from the aqueous-phase SURF mole fraction, and the corresponding displacement response is represented through interpolation between predefined relative-permeability states.
Table 5.
Concentration–interfacial-tension relationship specified in the model.
Relative permeability under different interfacial tension states can be expressed as follows:
where and are the relative permeabilities under high and low interfacial tension conditions, respectively, and χ is the interpolation coefficient jointly determined by surfactant concentration and interfacial tension. Under low interfacial tension conditions, the endpoints of the oil–water relative permeability curves shift toward lower residual oil saturation, allowing part of the remaining oil trapped by capillary forces after waterflooding to regain mobility. The gas–liquid relative permeability relationship remains unchanged during interpolation, thereby separating the displacement enhancement effect of the surfactant from foam-induced gas mobility control.
2.4.4. Fluid Properties, Relative Permeability, and Capillary Pressure
Fluid behavior is represented using component-property inputs. The reference pressure and temperature for the fluid properties are 9.13 MPa and 57.8 °C, respectively. The reference densities of the water and dead-oil components are 978.089 and 693.440 kg/m3, and their compressibilities are 3.354 × 10⁻⁶ and 2.141 × 10⁻⁶ kPa−1, respectively. These reference inputs are specified separately from the pressure and reference depth used to initialize each model.
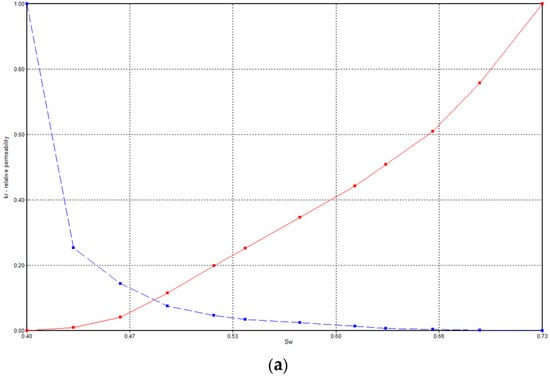
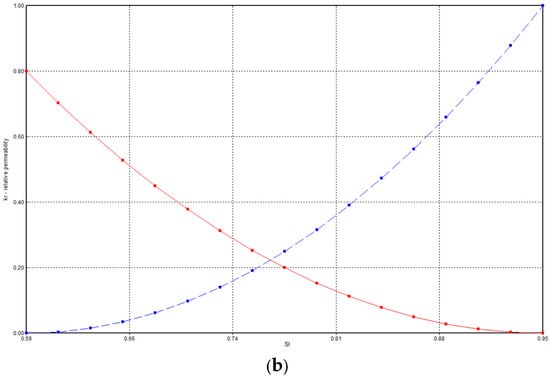
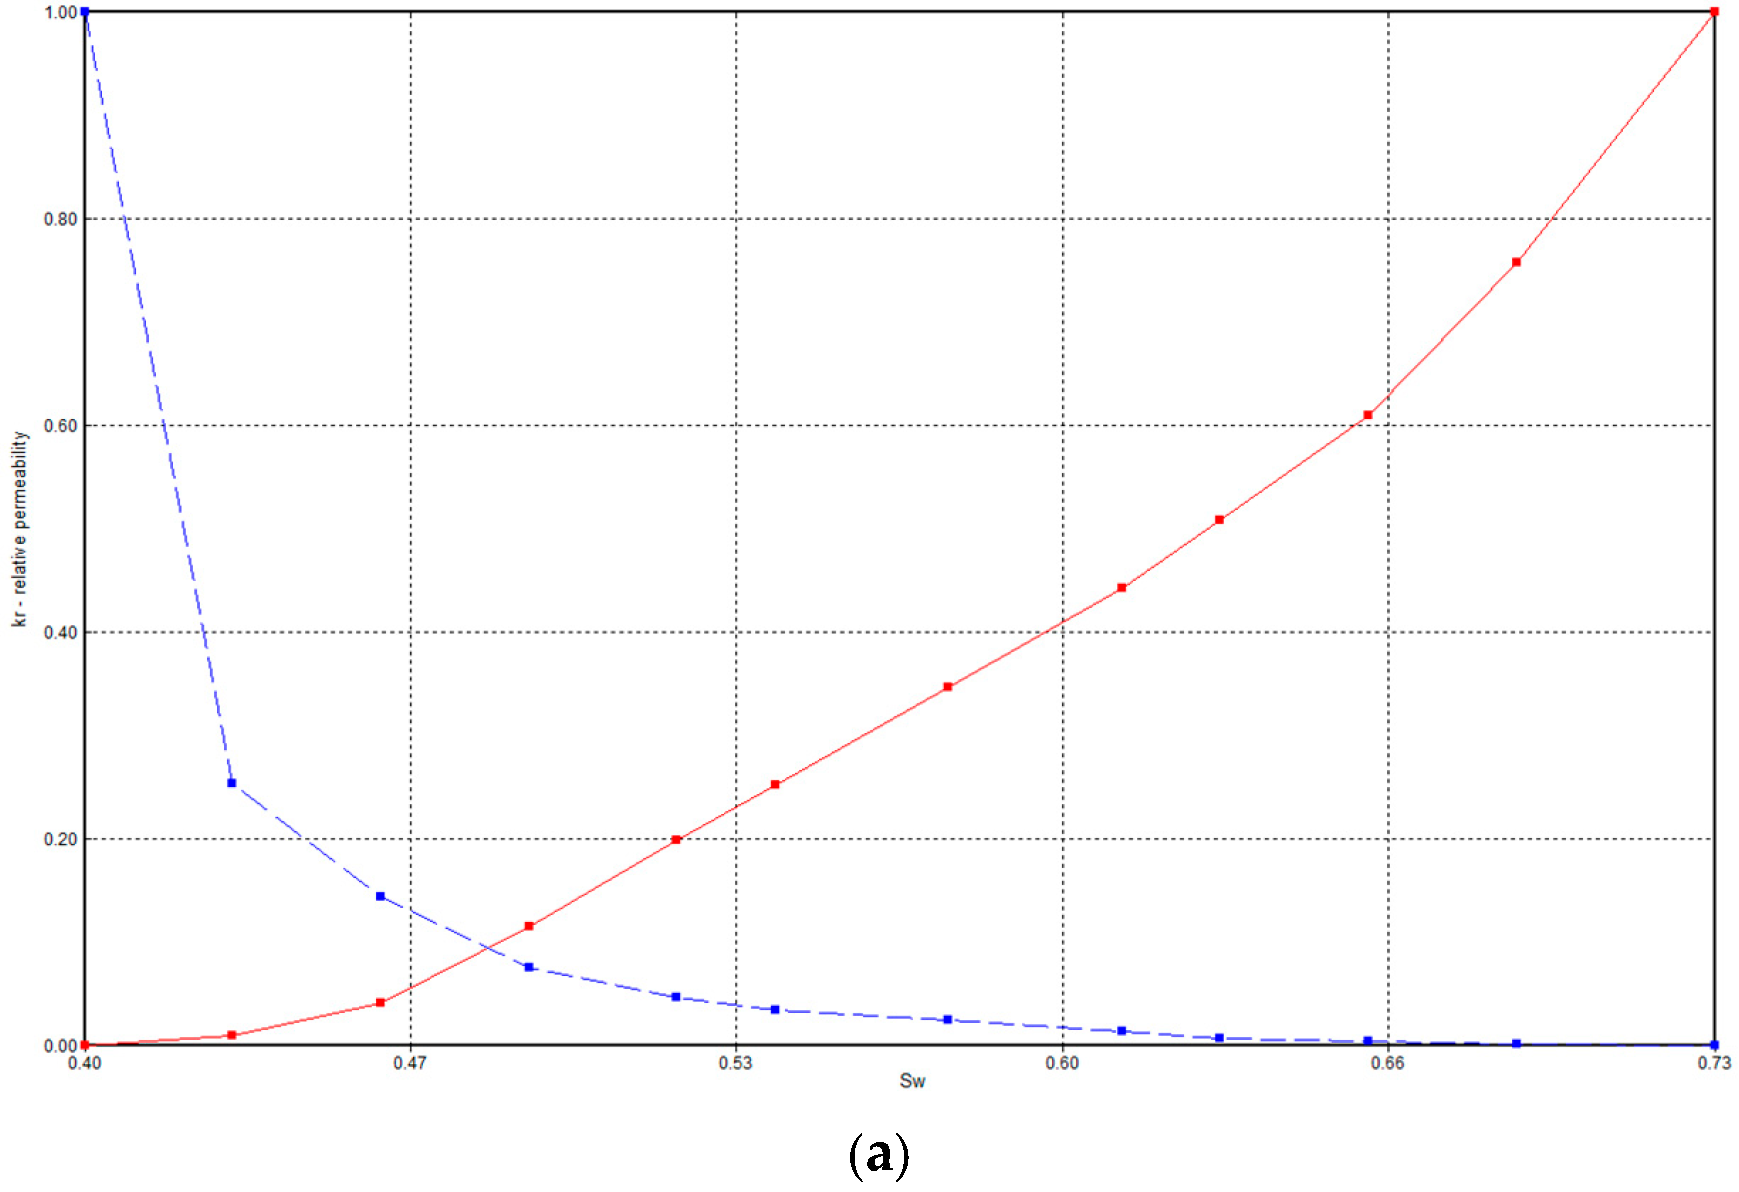
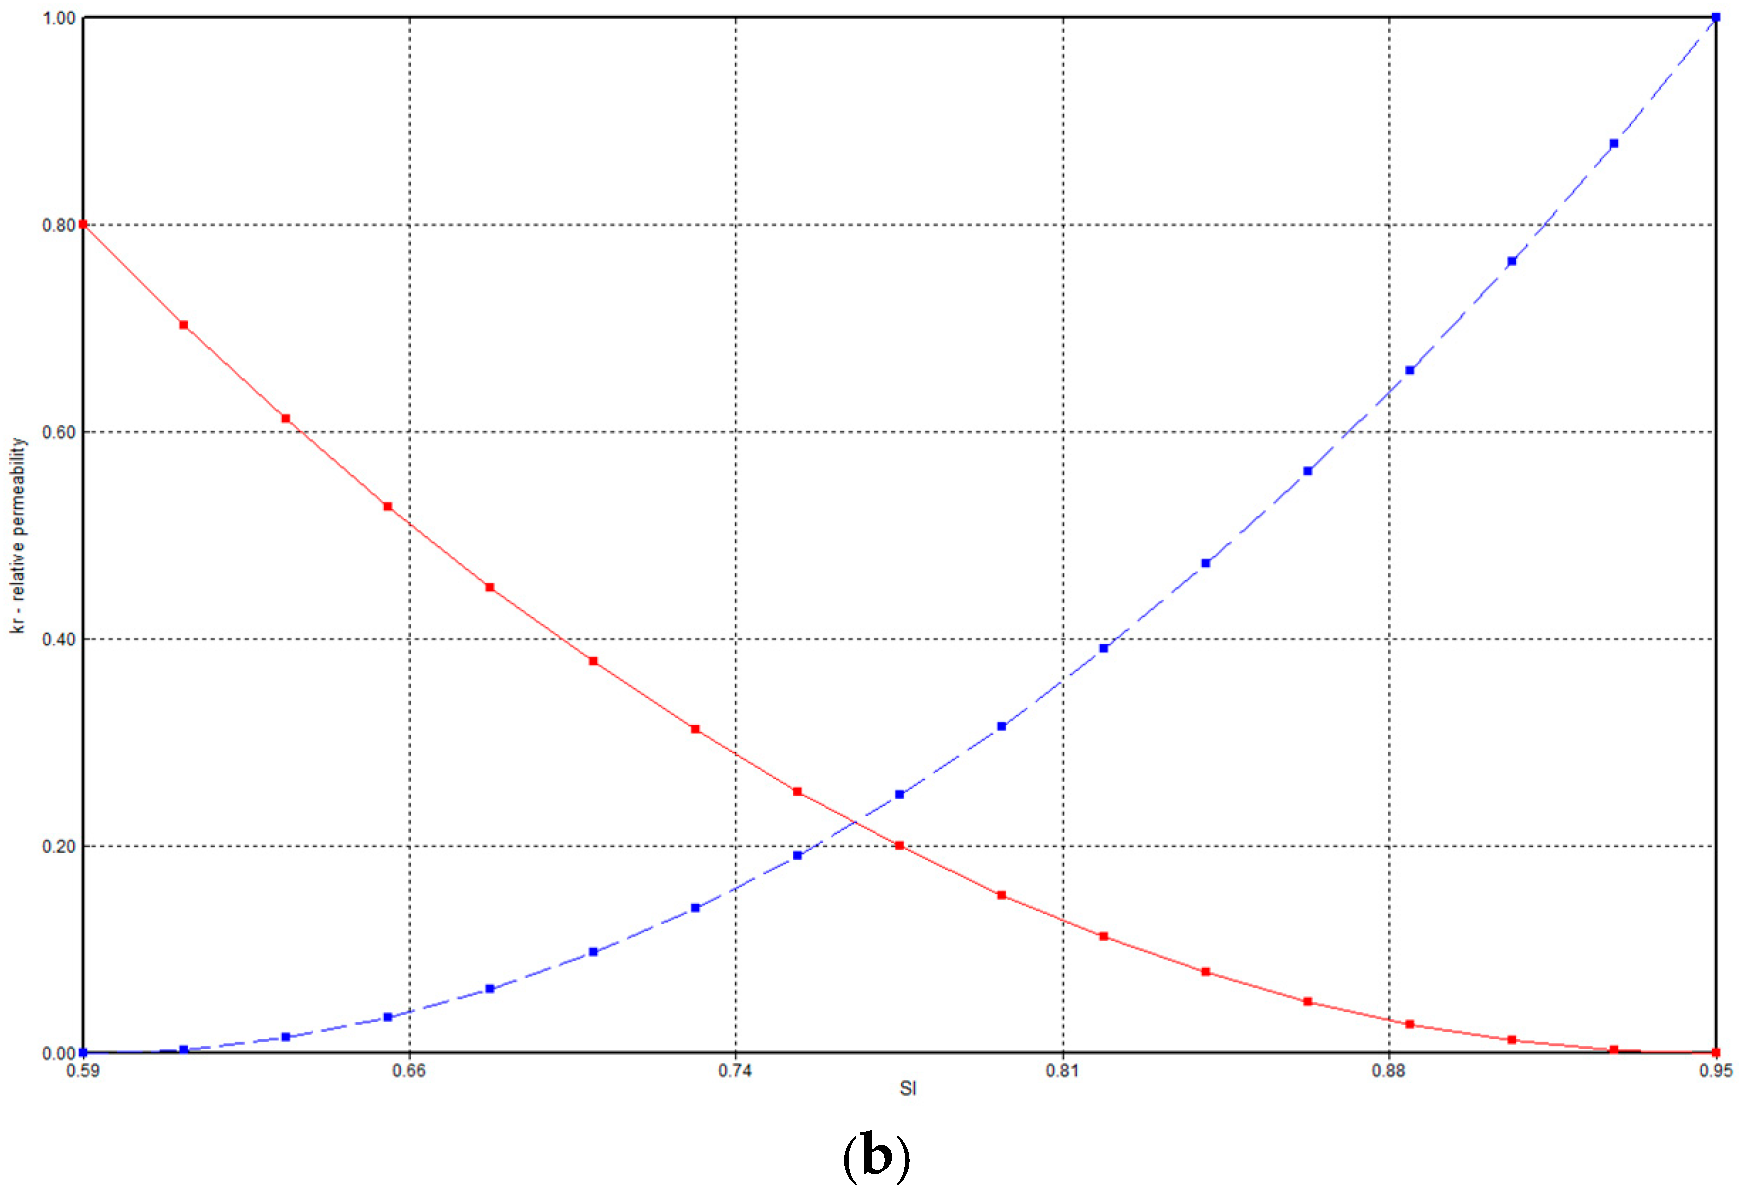
Representative baseline relative-permeability curves used in the mechanistic model are shown in Figure 4. The fixed-interfacial-tension control cases use the corresponding baseline relative-permeability relationships, whereas cases with variable interfacial tension interpolate between predefined relative-permeability states according to local interfacial tension.
Figure 4.
Representative baseline relative-permeability curves used in the mechanistic model: (a) oil–water; (b) oil–gas. (a) oil–water relative-permeability curves, with the red solid and blue dashed lines representing water relative permeability (krw) and oil relative permeability (kro), respectively. (b) oil–gas relative-permeability curves, with the red solid and blue dashed lines representing gas relative permeability (krg) and oil relative permeability (krog), respectively.
Oil–water and gas–liquid capillary pressures are set to zero in this model, and interphase capillary-pressure differences are not explicitly represented. Similar simplifications neglecting capillary effects have been adopted in simulations of gravity segregation with CO2 foam in heterogeneous reservoirs by Lyu et al. [31] and in a study of CO2 foam flow in low-permeability reservoirs by Su et al. [32]. The displacement response associated with surfactant-induced interfacial-tension reduction is represented through relative-permeability interpolation. This simplification excludes the effects of capillary pressure on phase distributions and interlayer exchange.
2.5. Progressive Decomposition of Recovery Contributions
Air-foam flooding involves gas-assisted displacement, foam mobility control, and surfactant-induced interfacial tension reduction. Comparing only the final recovery factors of baseline waterflooding and integrated air-foam flooding cannot distinguish the recovery responses associated with these processes. Therefore, six numerical cases were established using the same geological model, well pattern, initial conditions, operating timeline, and simulation end point. The injection systems and mechanism settings of the six cases are summarized in Table 6. In the four cases injecting surfactant solution and nitrogen, foam mobility control and interfacial tension change were activated separately or together, while the other model settings and prescribed operating conditions were kept the same.
Table 6.
Progressive mechanism-comparison design.
Baseline waterflooding provides the reference recovery factor. Gas-assisted flooding introduces nitrogen without surfactant. Surfactant-background flooding introduces surfactant solution and nitrogen while keeping foam mobility control inactive and interfacial tension fixed at 30 mN/m. This case serves as the common reference for evaluating the two modeled functions.
The difference (RFF − RFB) represents the recovery increment obtained by activating foam mobility control while interfacial tension remains fixed. The difference (RFI − RFB) represents the increment obtained by activating the interfacial tension change while foam mobility control remains inactive. The non-additive response when both functions are active is calculated as
where (RF) denotes the final recovery factor of the indicated case. The total increase relative to baseline waterflooding can then be expressed as
ΔRFinteraction = RFAF − RFF − RFI + RFB
RFAF − RFW = (RFG − RFW) + (RFB − RFG) + (RFF − RFB) + (RFI − RFB) + ΔRFinteraction
Each difference is defined by its comparison case. In particular, (RFB − RFG) includes the effect of changing to a surfactant-containing injection system and is treated as a background increment. The interaction term measures the non-additive response of the two activated functions in the numerical model; it is not assigned exclusively to foam mobility control or interfacial tension reduction.
2.6. Reservoir Parameter Sensitivity Design
Reservoir parameter sensitivity analysis was conducted using the integrated air-foam flooding model. A one-factor-at-a-time approach was adopted to examine average horizontal permeability, permeability contrast, and the vertical-to-horizontal permeability ratio. Each parameter was varied separately, while the remaining independent reservoir properties, fluid properties, foam parameters, well pattern, and injection and production conditions were held constant. The parameter levels are summarized in Table 7.
Table 7.
Parameter levels used in the reservoir sensitivity analysis.
Average permeability was varied to assess the influence of reservoir flow capacity on recovery. Permeability contrast, defined as the ratio of maximum to minimum permeability, was used to characterize permeability heterogeneity. The vertical-to-horizontal permeability ratio represented vertical flow capacity relative to horizontal flow capacity.
All cases followed the same waterflooding schedule before switching to air-foam flooding in August 2007 and were simulated to 2048. Recovery-factor curves were compared over the full development period. The recovery-factor gain during the air-foam flooding stage was defined as the difference between the recovery factor at the end of the simulation and that at switching. This measure was used to compare recovery during the air-foam flooding stage across reservoir conditions.
The relative influence of the three parameters was quantified using dimensionless sensitivity coefficients based on adjacent-interval midpoints. Local coefficients were averaged over the investigated intervals and normalized to obtain sensitivity weights. The quantitative sensitivity assessment covered average horizontal permeabilities of 1–10 mD, permeability contrasts of 2.5–15, and vertical-to-horizontal permeability ratios of 0.2–1.0.
2.7. Injection Parameter Optimization Design
Injection parameter optimization examined switching water cut, gas-to-liquid ratio, and slug switching interval. Each group followed a one-factor-at-a-time design, with reservoir properties, fluid properties, foam parameters, and well pattern unchanged. Injection and production settings other than those required to vary the target parameter were kept consistent across cases.
The timing of conversion was defined by field-average water cut. Waterflooding was converted to air-foam flooding at water cuts of 40%, 50%, 60%, 70%, 75%, 80%, 85%, or 90%, while the gas–liquid ratio and other foam parameters were held at their baseline values. This range was selected to compare early and delayed treatment after preferential water-flow paths had begun to develop, consistent with previous air-foam and foam-optimization studies [7,24].
Four gas-to-liquid ratios (1:1, 2:1, 3:1, and 4:1) were evaluated at the same prescribed total injection volume using a consistent volumetric reference basis. The injected liquid composition, surfactant concentration, reservoir properties, foam parameters, bottom-hole-pressure constraints, and simulation end time were maintained across cases. Gas and liquid proportions were adjusted within the prescribed total volume. Consequently, the injected solution volume and total surfactant delivery varied with the gas-to-liquid ratio. This comparison evaluates the combined injection configuration under a fixed total-volume constraint. Changing the ratio alters both gas supply and the liquid available to transport surfactant and stabilize lamellae; comparable sensitivity to foam quality has been reported in experimental and numerical studies [28].
Slug switching intervals of 24, 18, 12, 9, 6, and 3 months were examined over the air-foam flooding period. The switching interval was defined as the duration of each gas or surfactant–solution injection stage before changing to the other fluid. Cumulative gas and surfactant–solution injection volumes were kept equal across cases. Shorter intervals therefore increased the number of injection cycles and reduced individual slug volumes. Recovery-factor curves and ultimate recovery factors were compared to evaluate the effect of injection scheduling at constant cumulative injection. The comparison isolates the effect of cycle number and individual slug size at constant cumulative injection, an approach consistent with prior studies of alternating foam injection and slug design [27,28,29].
3. Results and Discussion
3.1. Analysis of Recovery Contributions
Figure 5 shows the recovery-factor curves for the six displacement schemes.The final recovery factors for baseline waterflooding, gas-assisted flooding, surfactant-background flooding, foam mobility control, interfacial tension reduction, and integrated air-foam flooding were 38.14%, 40.50%, 40.81%, 42.03%, 41.44%, and 47.79%, respectively. All recovery increments reported below are absolute differences between recovery factors, rather than relative percentage changes. Gas-assisted flooding increased recovery by 2.36% compared with baseline waterflooding. Surfactant-background flooding produced a further increase of 0.31% compared with gas-assisted flooding. Because foam mobility control was inactive and interfacial tension was fixed in the surfactant-background case, the latter difference was treated as a background increment.
Figure 5.
Recovery-factor curves for the six displacement schemes.
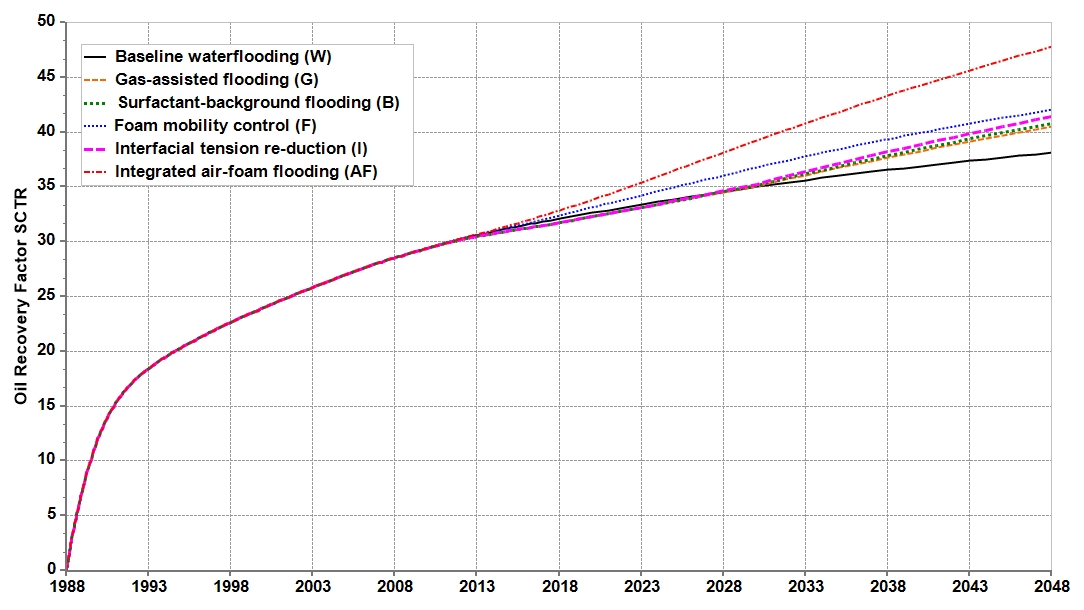
Using surfactant-background flooding as the common reference, activating foam mobility control at fixed interfacial tension increased recovery by 1.22%. Activating dynamic interfacial tension change while keeping foam mobility control inactive increased recovery by 0.63%. These are single-function increments under the specified comparison conditions.
Integrated air-foam flooding increased recovery by 6.98% relative to surfactant-background flooding. The non-additive interaction increment was calculated as follows:
ΔRFinteraction = 47.79% − 42.03% − 41.44% + 40.81% = 5.13%
The total increase of 9.65% from baseline waterflooding to integrated air-foam flooding can therefore be expressed as (2.36% + 0.31% + 1.22% + 0.63% + 5.13%). In this model, the combined response exceeded the sum of the two single-function increments. Final recovery factors alone, however, do not identify the physical process responsible for this non-additive difference.
The 1.53% difference between the foam-mobility-control and gas-assisted cases includes the 0.31% background increment and therefore cannot be attributed entirely to foam mobility control. The 5.76% difference between the integrated air-foam and foam-mobility-control cases represents the conditional increment associated with interfacial-tension reduction when foam mobility control is already active, rather than an independent contribution.
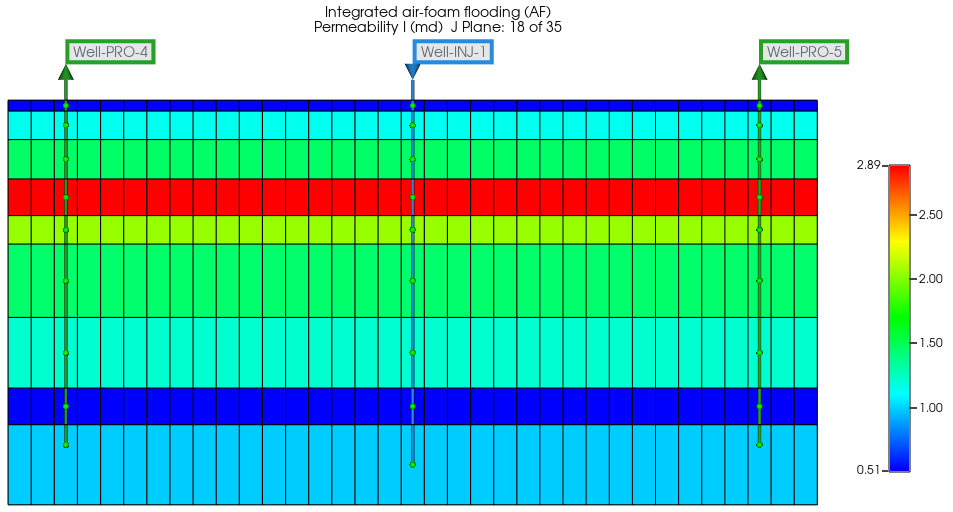
Permeability in the fourth model layer reaches 2.89 mD, which is distinctly higher than that in adjacent layers and forms a continuous interlayer preferential flow channel at a depth of approximately 1051 to 1054 m, as shown in Figure 6.
Figure 6.
Permeability distribution in the i = 18 cross-section.
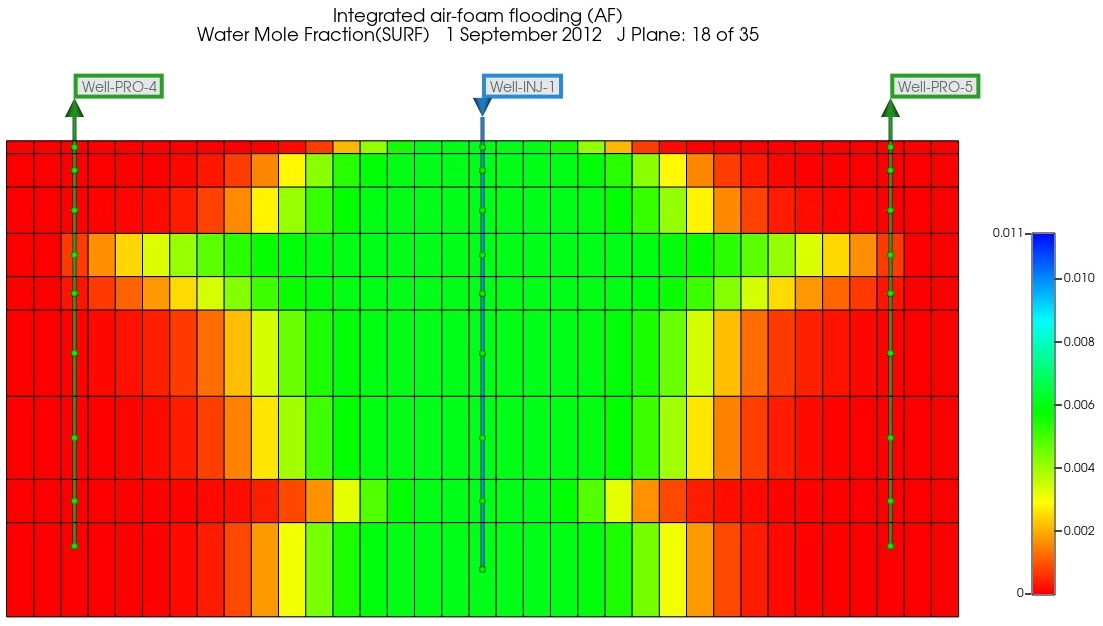
In September 2012, both surfactant and foam components expanded laterally from the injector, but the lateral migration distances differed clearly among layers, as shown in Figure 7 and Figure 8. The concentration front in the preferential flow layer extended farther toward the producers, whereas its distribution in low permeability layers remained relatively limited. The spatial distributions of surfactant and foam components were highly consistent, indicating that injected surfactant and gas preferentially entered layers with lower flow resistance and formed foam during joint gas–liquid migration. Preferential foam generation in the high-permeability layer allowed the foam to act directly on the original preferential channel, providing a spatial basis for reducing gas mobility and improving uneven interlayer intake.
Figure 7.
Foam-component water mole fraction in the i = 18 cross-section.
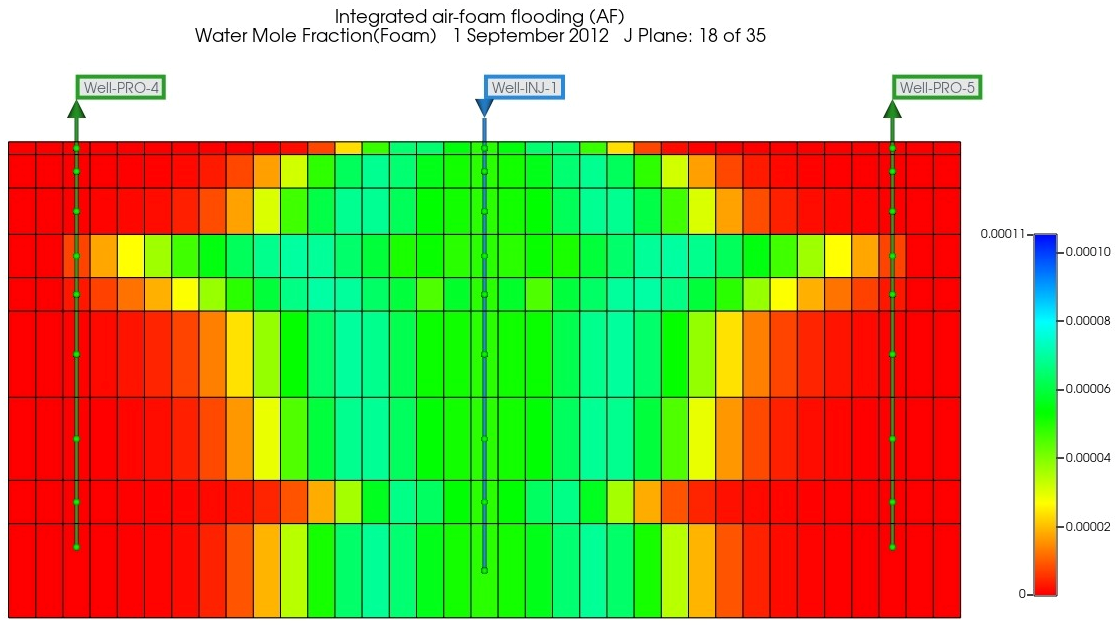
Figure 8.
Surfactant water mole fraction in the i = 18 cross-section.
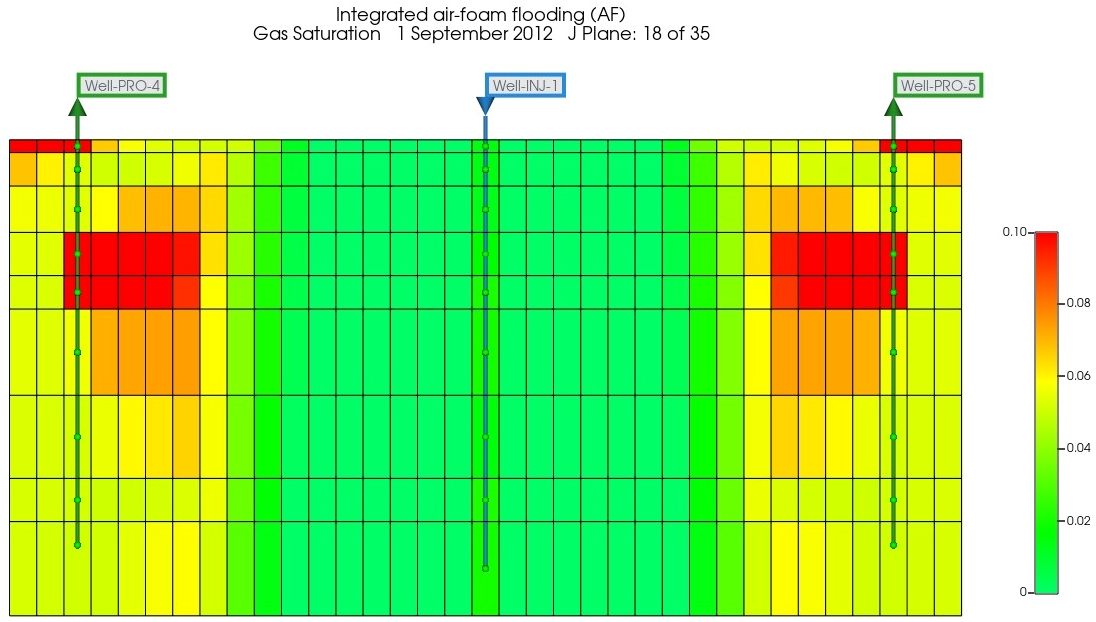
As shown in Figure 9, gas saturation showed clear vertical differences among layers. High gas saturation mainly occurred in the preferential flow layer between injectors and producers and formed local accumulations near the producers on both sides. This distribution indicates that gas migration remained controlled by the high-permeability layer and that the regions near the producers were the main locations of gas breakthrough and accumulation. The high gas saturation zone largely coincided with the preferential distribution of surfactant and foam components, indicating that foam was not generated uniformly throughout the reservoir but was concentrated in regions prone to gas channeling. The selective action of foam on gas-rich, high-permeability layers is favorable for weakening continuous gas channels. However, gas saturation represents the state of gas occurrence and cannot independently characterize gas mobility. Gas resistance factor or gas relative permeability profiles should therefore be considered to further evaluate plugging strength.
Figure 9.
Gas saturation in the i = 18 cross-section.
In September 2012, oil saturation gradually increased from the injector toward the producers on both sides and the model boundaries, as shown in Figure 10. A continuous low-oil-saturation zone formed around the injector, indicating relatively effective displacement by the gas–liquid system in this region. The low-oil-saturation region extended farther laterally within the preferential flow layer and followed the migration direction of the surfactant and foam components. This indicates that after foam first entered the original high-permeability channel, it still maintained oil displacement along the injector-producer direction. Oil saturation also decreased over a certain range in adjacent layers, showing that interlayer flow differences were partially adjusted.
Figure 10.
Oil saturation in the i = 18 cross-section.
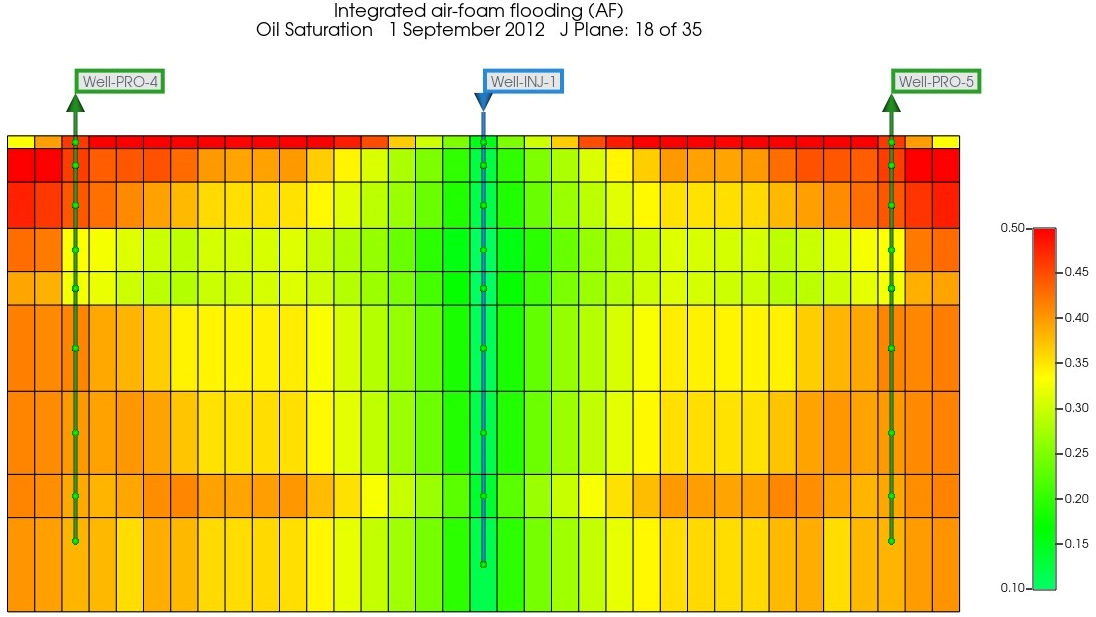
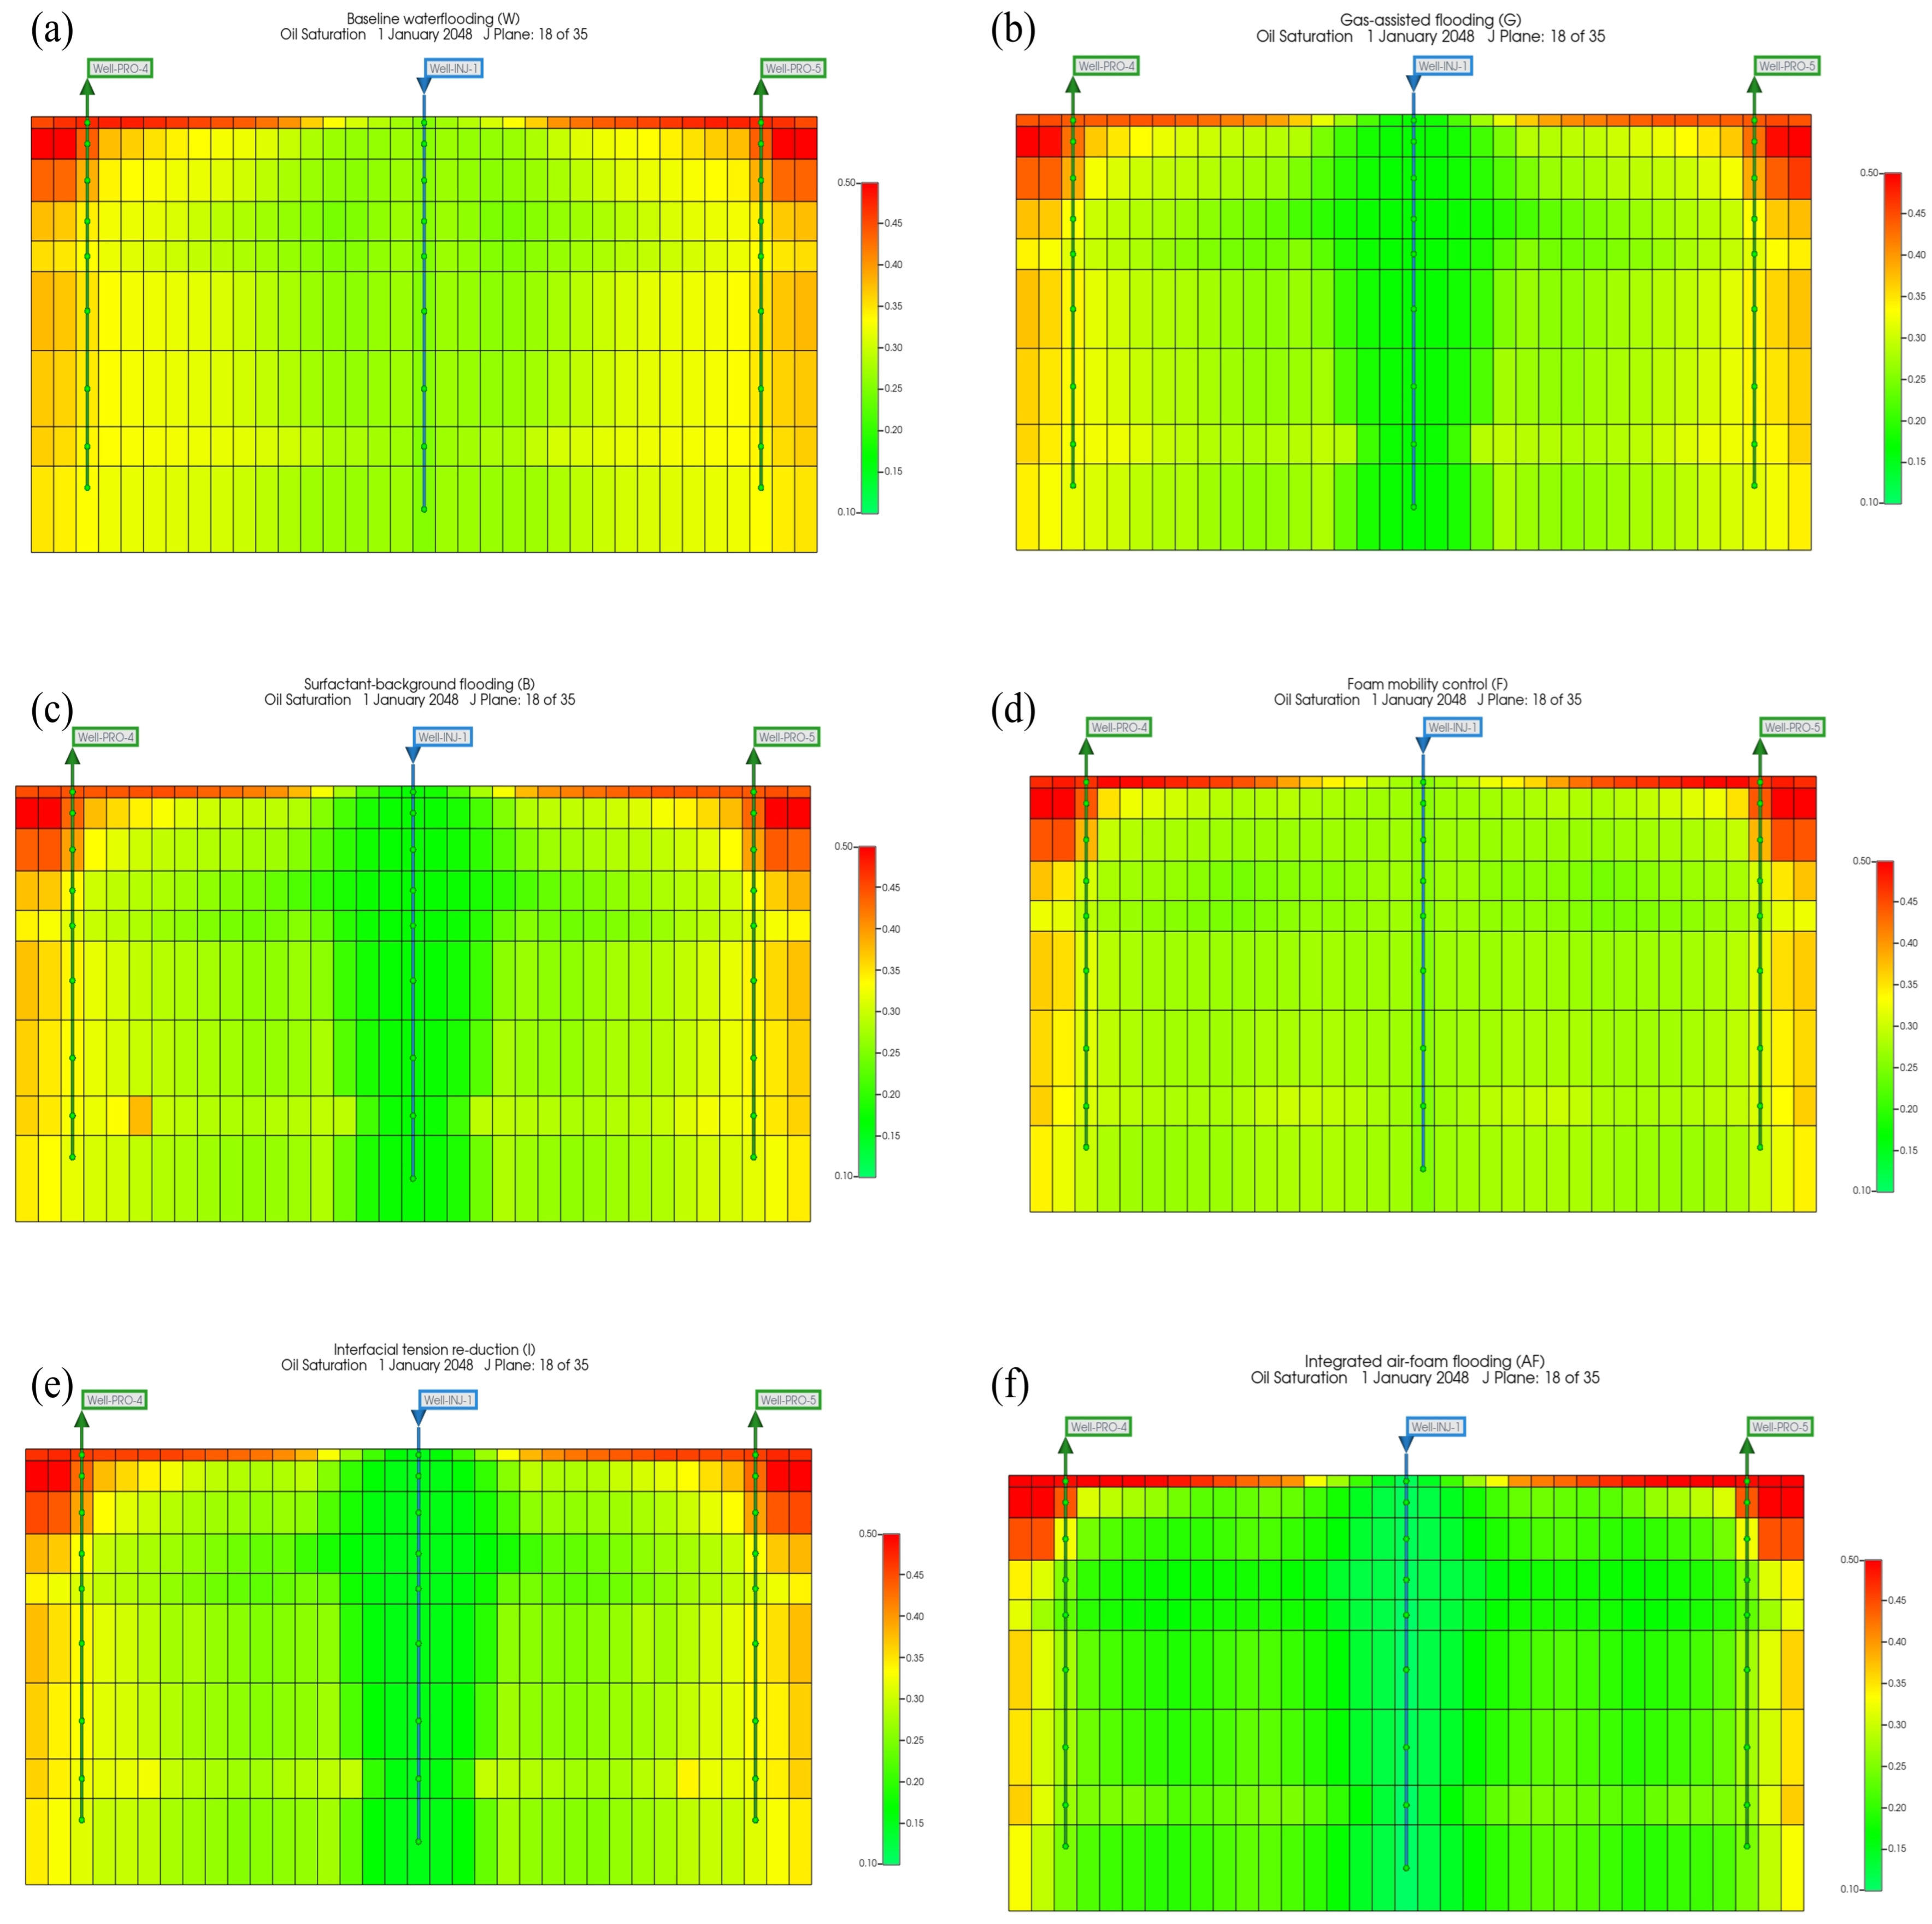
Figure 11 compares the oil saturation distributions under the six displacement schemes in January 2048. Compared with baseline waterflooding, gas-assisted flooding produced a more extensive low-oil-saturation region along the injector–producer direction, although the contrast between the high-permeability channel and adjacent layers remained apparent. The surfactant-background case showed only a small additional change relative to gas-assisted flooding. With interfacial tension fixed, activating foam mobility control made the low-oil-saturation region within the high-permeability channel more continuous and reduced oil saturation in parts of the adjacent layers. Activating interfacial tension reduction without foam mobility control also lowered oil saturation in portions of the contacted region, but the spatial change was limited. When both functions were active, integrated air-foam flooding produced the most extensive low-oil-saturation region across the high-permeability channel and adjacent layers.
Figure 11.
Oil saturation distributions under different displacement schemes in January 2048: (a) waterflooding; (b) gas-assisted flooding; (c) surfactant-background flooding; (d) foam mobility control; (e) interfacial tension reduction; and (f) integrated air-foam flooding.
3.2. Sensitivity of Recovery Predictions to Foam-Model Parameters
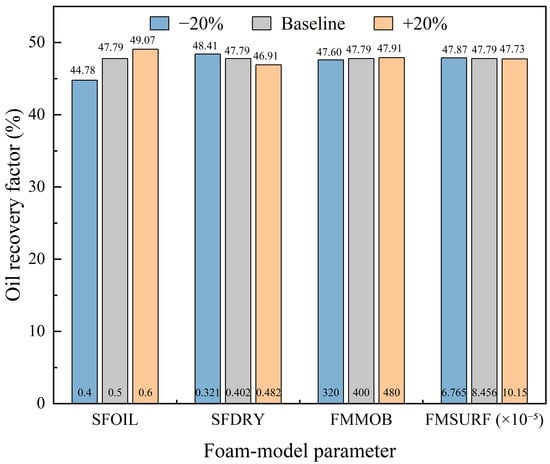
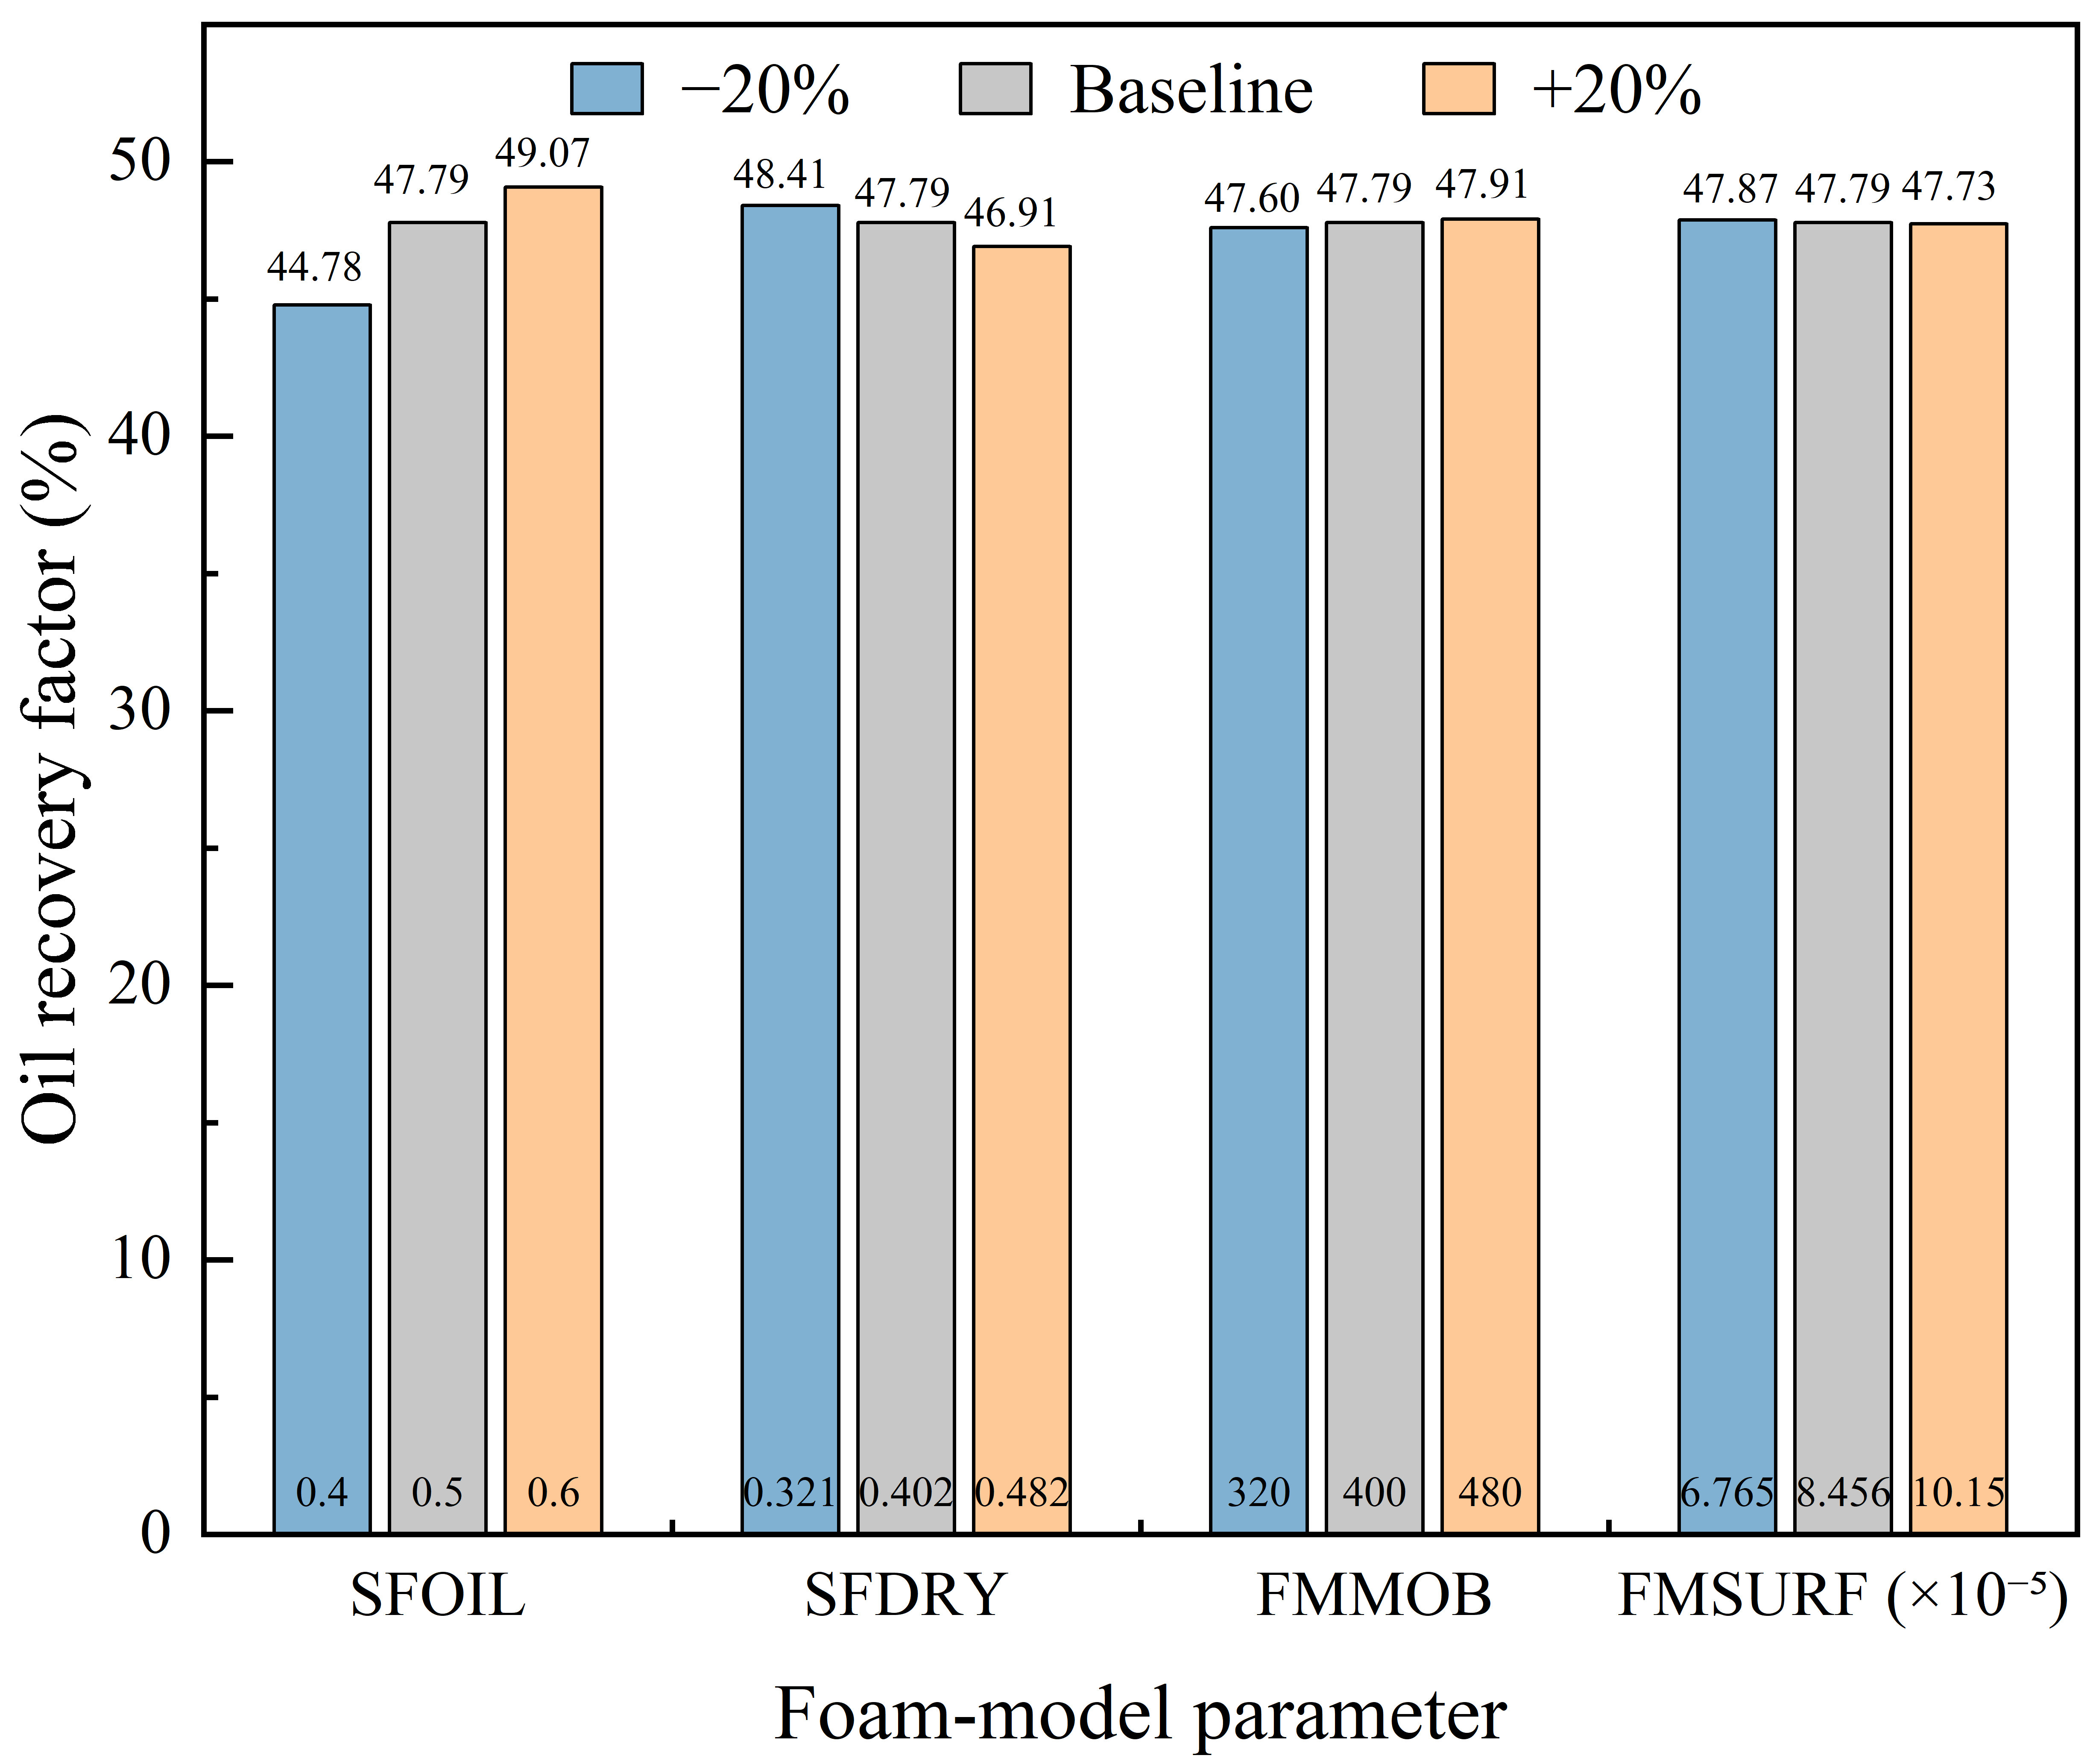
To assess the influence of foam-parameter settings on recovery predictions, a one-factor-at-a-time sensitivity analysis was conducted using the integrated air-foam flooding case. The maximum mobility reduction parameter (FMMOB), surfactant response parameter (FMSURF), critical water saturation for dry-out (SFDRY), and characteristic oil saturation (SFOIL) were each varied by ±20% from their baseline values. All other model inputs and well-control constraints were held constant, and recovery factors were compared in January 2048. As shown in Figure 12, SFOIL had the greatest influence: decreasing it from 0.50 to 0.40 reduced recovery from the baseline of 47.79% to 44.78%, whereas increasing it to 0.60 raised recovery to 49.07%. SFDRY had the second-largest influence, with a 20% decrease increasing recovery by 0.61 percentage points and a 20% increase reducing recovery by 0.88 percentage points. In comparison, the maximum absolute changes induced by perturbations in FMMOB and FMSURF were 0.19 and 0.08 percentage points, respectively. These results indicate that, within the present model and tested ranges, recovery predictions are more sensitive to the oil-response and dry-out parameter settings.
Figure 12.
Sensitivity of the oil recovery factor to key foam-model parameters.
Field production history matching provided constraints on the integrated production response, but recovery predictions remain subject to uncertainty in foam-model parameter values. To assess this influence, a one-factor-at-a-time sensitivity analysis was conducted for four key foam parameters, yielding recovery factors ranging from 44.78% to 49.07% across the tested scenarios. This range reflects prediction changes caused by individual perturbations of the selected parameters within the specified ranges and is not a statistical confidence interval. The effects of joint variations in foam-model parameters were not evaluated, and the sensitivity results apply to the present model and the specified reservoir conditions and parameter ranges.
3.3. Sensitivity Analysis of Reservoir Parameters
3.3.1. Average Permeability
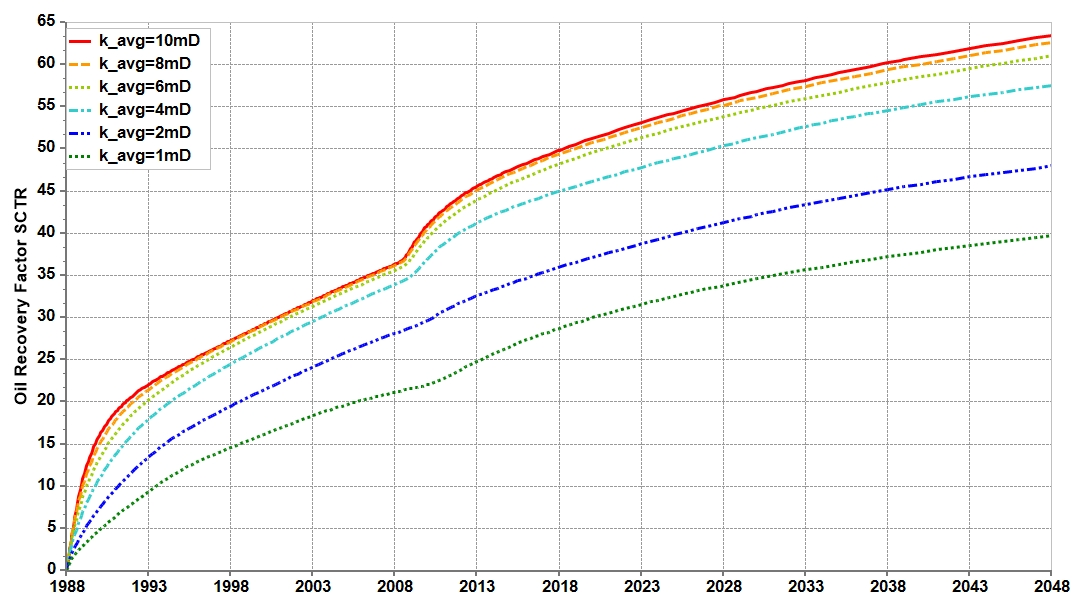
Figure 13 shows an upward shift in the recovery-factor curves as the average horizontal permeability increased from 1 to 10 mD. Differences established during waterflooding persisted after the transition to air-foam flooding. The cases with permeabilities of 1 and 2 mD exhibited substantially lower recovery factors than the higher-permeability cases. A marked improvement occurred between 2 and 4 mD, whereas the curves became progressively closer over the range of 6–10 mD.
Figure 13.
Recovery-factor sensitivity to average permeability.
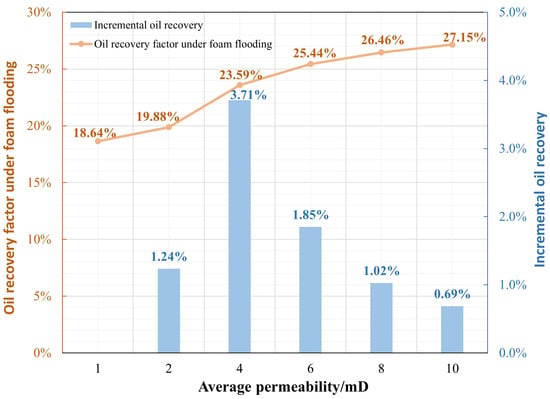
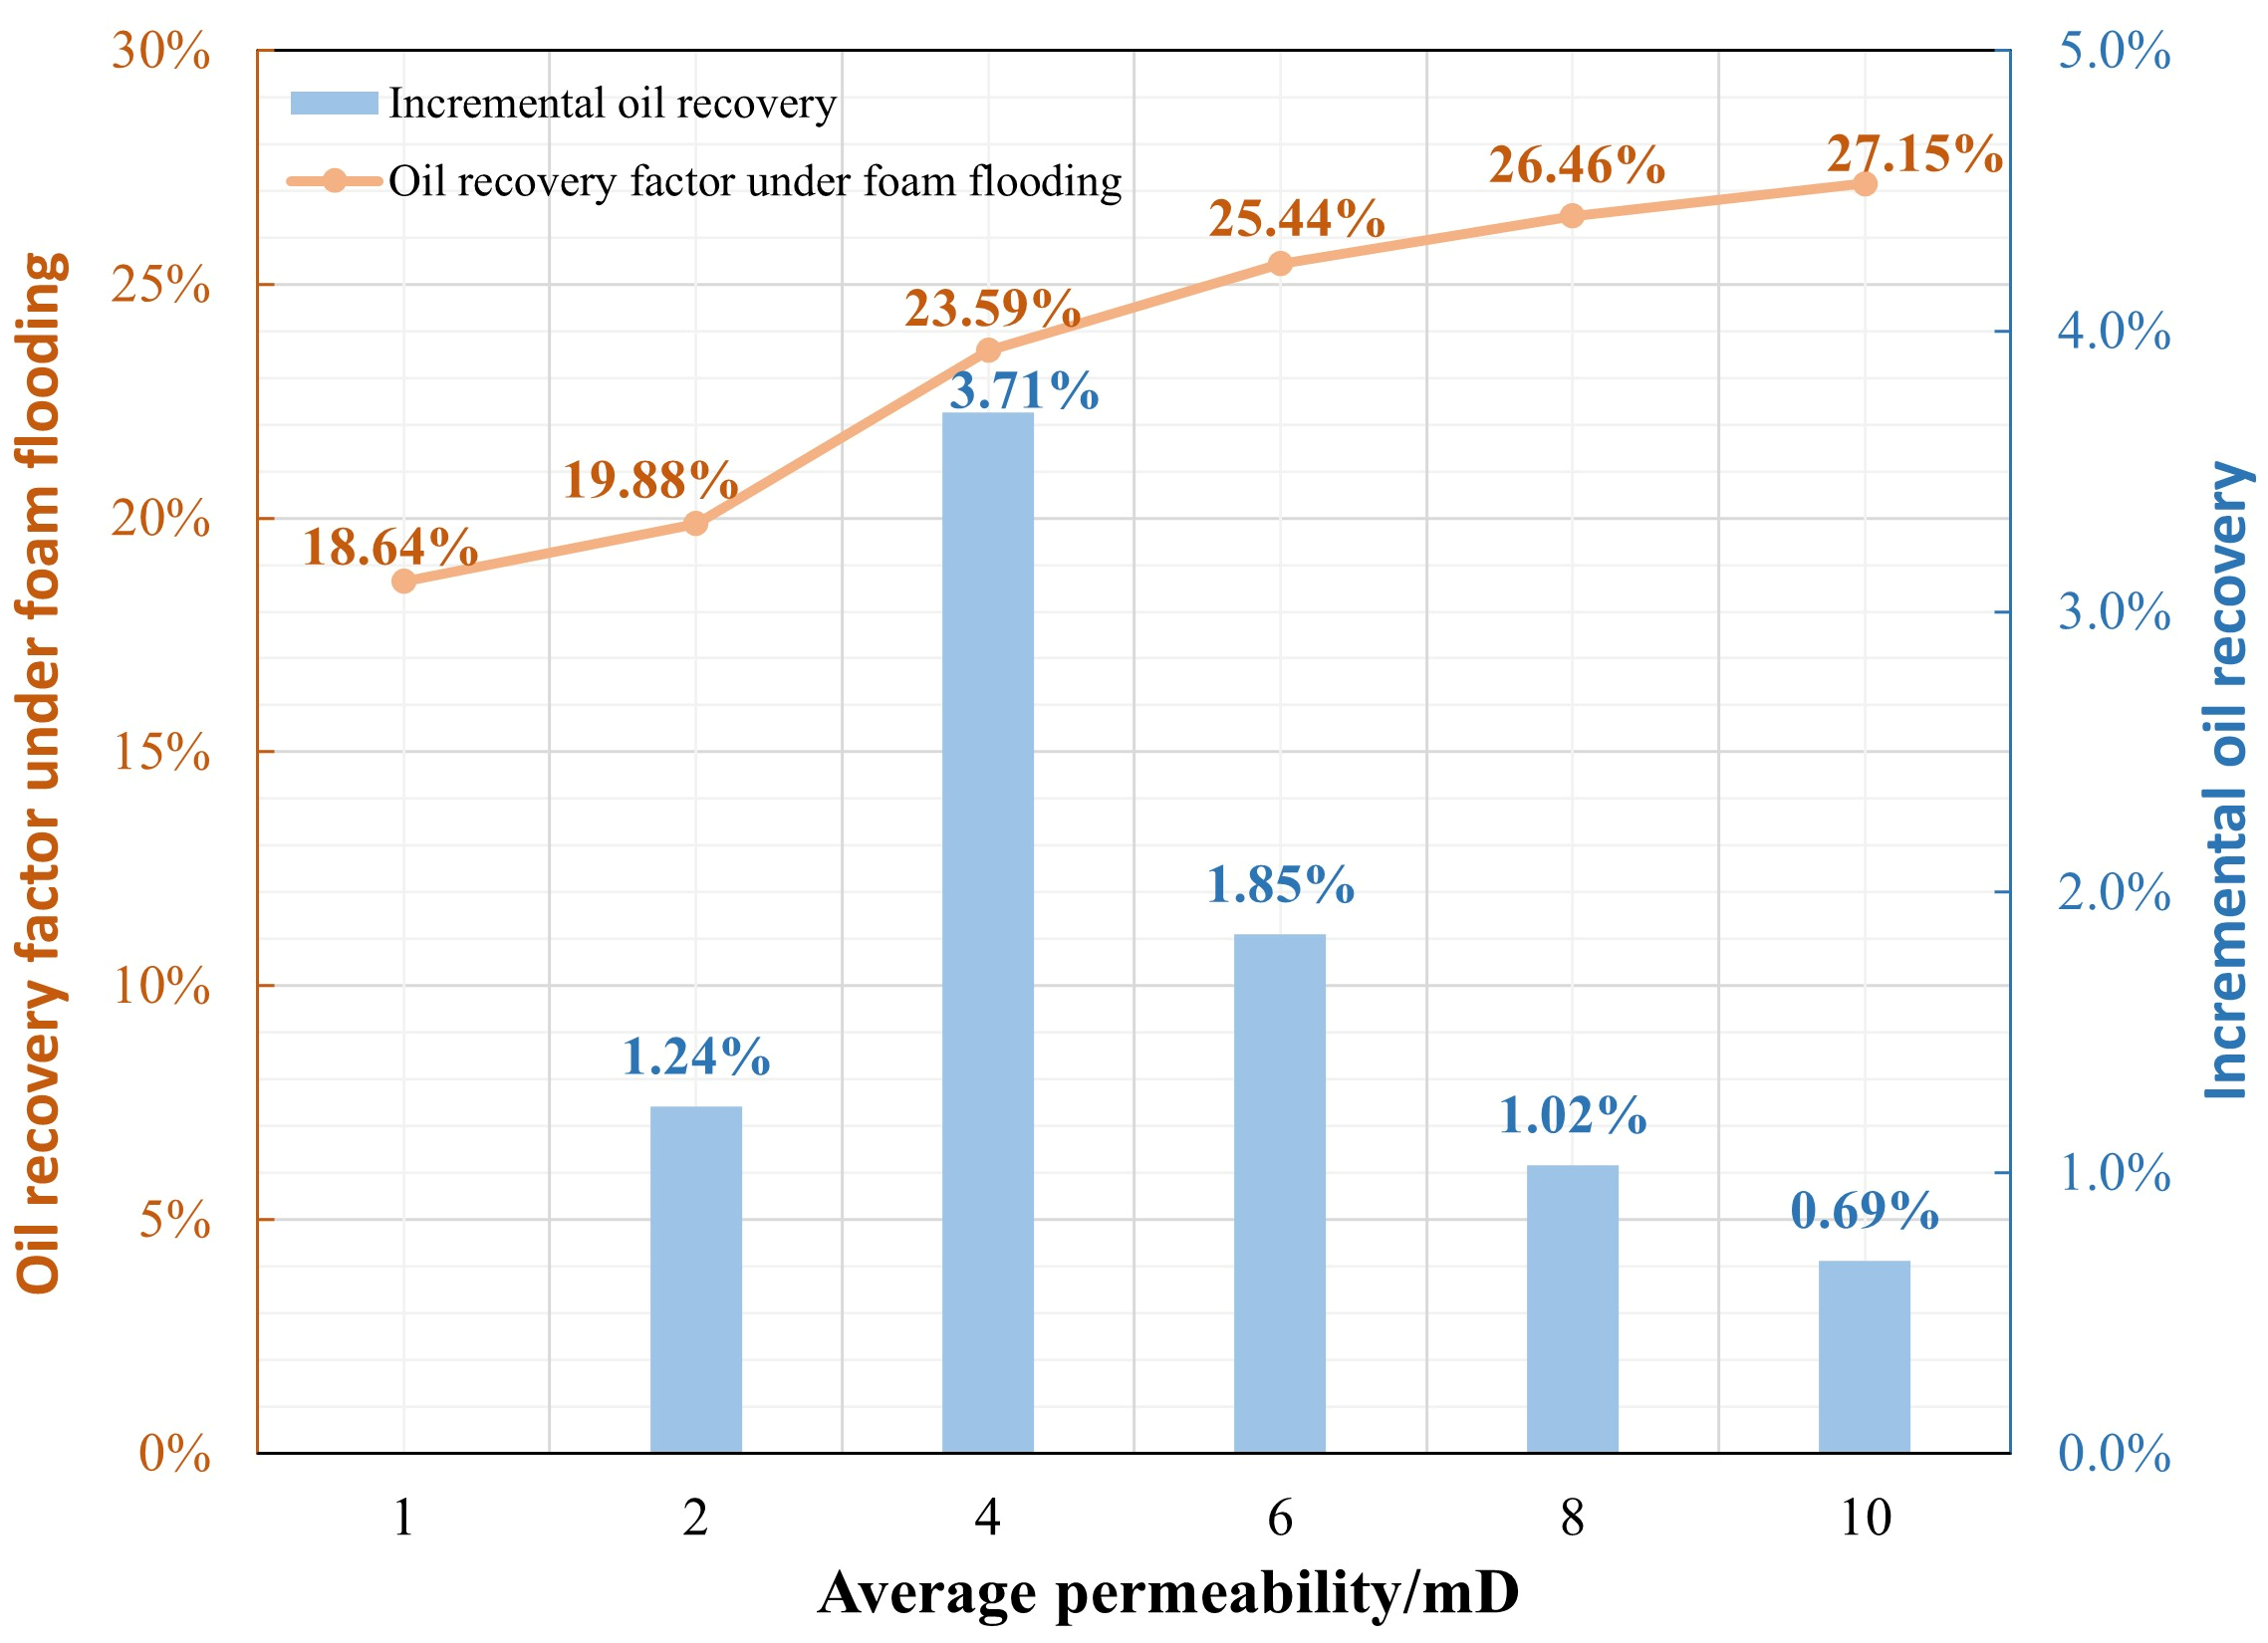
The recovery-factor gains during the air-foam flooding stage are compared in Figure 14. Defined as the increase from the transition to air-foam flooding to the end of the simulation, these gains were 18.64%, 19.88%, 23.59%, 25.44%, 26.46%, and 27.15% at average horizontal permeabilities of 1, 2, 4, 6, 8, and 10 mD, respectively. The increases between adjacent cases were 1.24%, 3.71%, 1.85%, 1.02%, and 0.69%. Accounting for the different permeability intervals yielded corresponding increases of approximately 1.24%/mD, 1.86%/mD, 0.93%/mD, 0.51%/mD, and 0.35%/mD. The response was strongest between 2 and 4 mD and weakened at higher permeabilities. This pattern is consistent with improved fluid transport as permeability increases, accompanied by diminishing marginal gains in recovery.
Figure 14.
Recovery-factor gain during air-foam flooding versus average permeability.
The reduction in marginal gains above 4 mD identifies this value as a practical reference for reservoir screening. Under the conditions examined, an average horizontal permeability of at least 4 mD is considered favorable for air-foam flooding.
3.3.2. Permeability Contrast
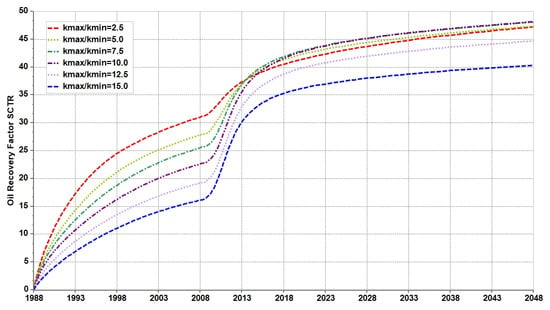
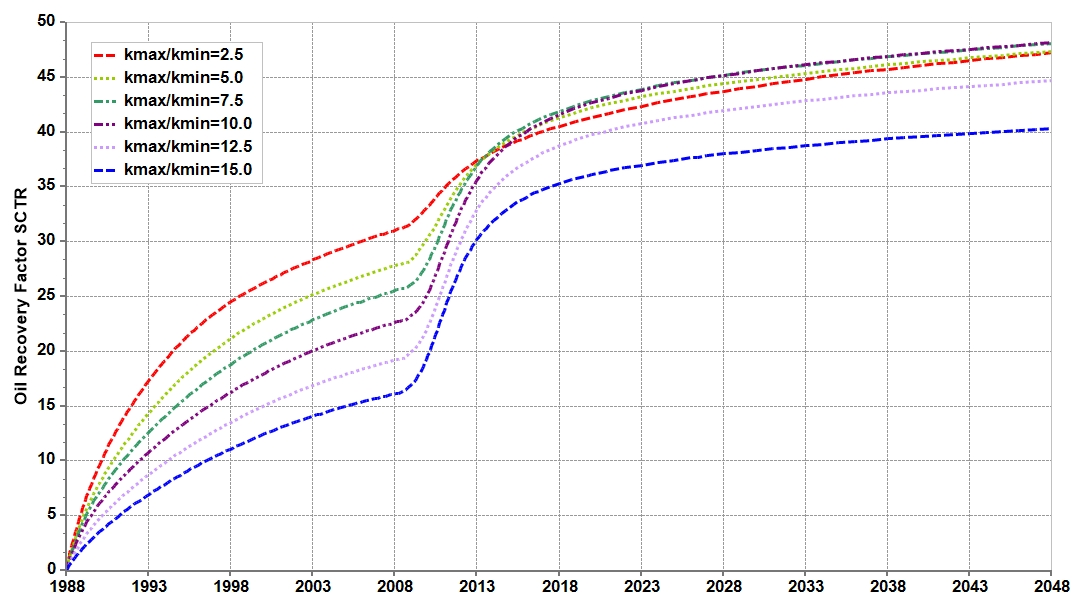
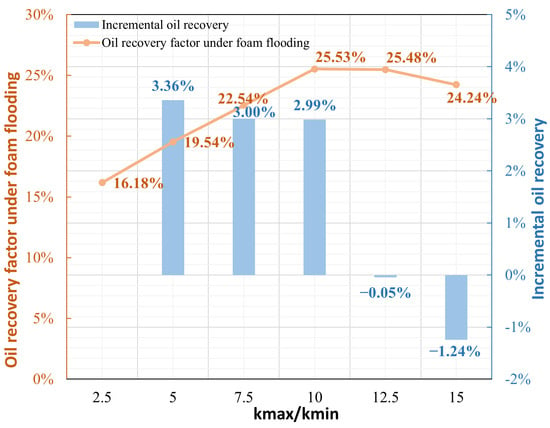
Increasing permeability contrast generally lowered the recovery factor during waterflooding, as illustrated in Figure 15. Here, permeability contrast is defined as the ratio of maximum to minimum permeability. After air-foam flooding began, recovery factors continued to rise in all cases, but the magnitude of the increase differed. Intermediate permeability contrasts produced larger gains, narrowing the differences established during waterflooding. The cases with contrasts of 12.5 and 15 nevertheless retained comparatively low recovery factors at the end of the simulation. Thus, the final recovery factor did not follow the same trend as the recovery-factor gain during the air-foam flooding stage.
Figure 15.
Recovery-factor sensitivity to permeability contrast.
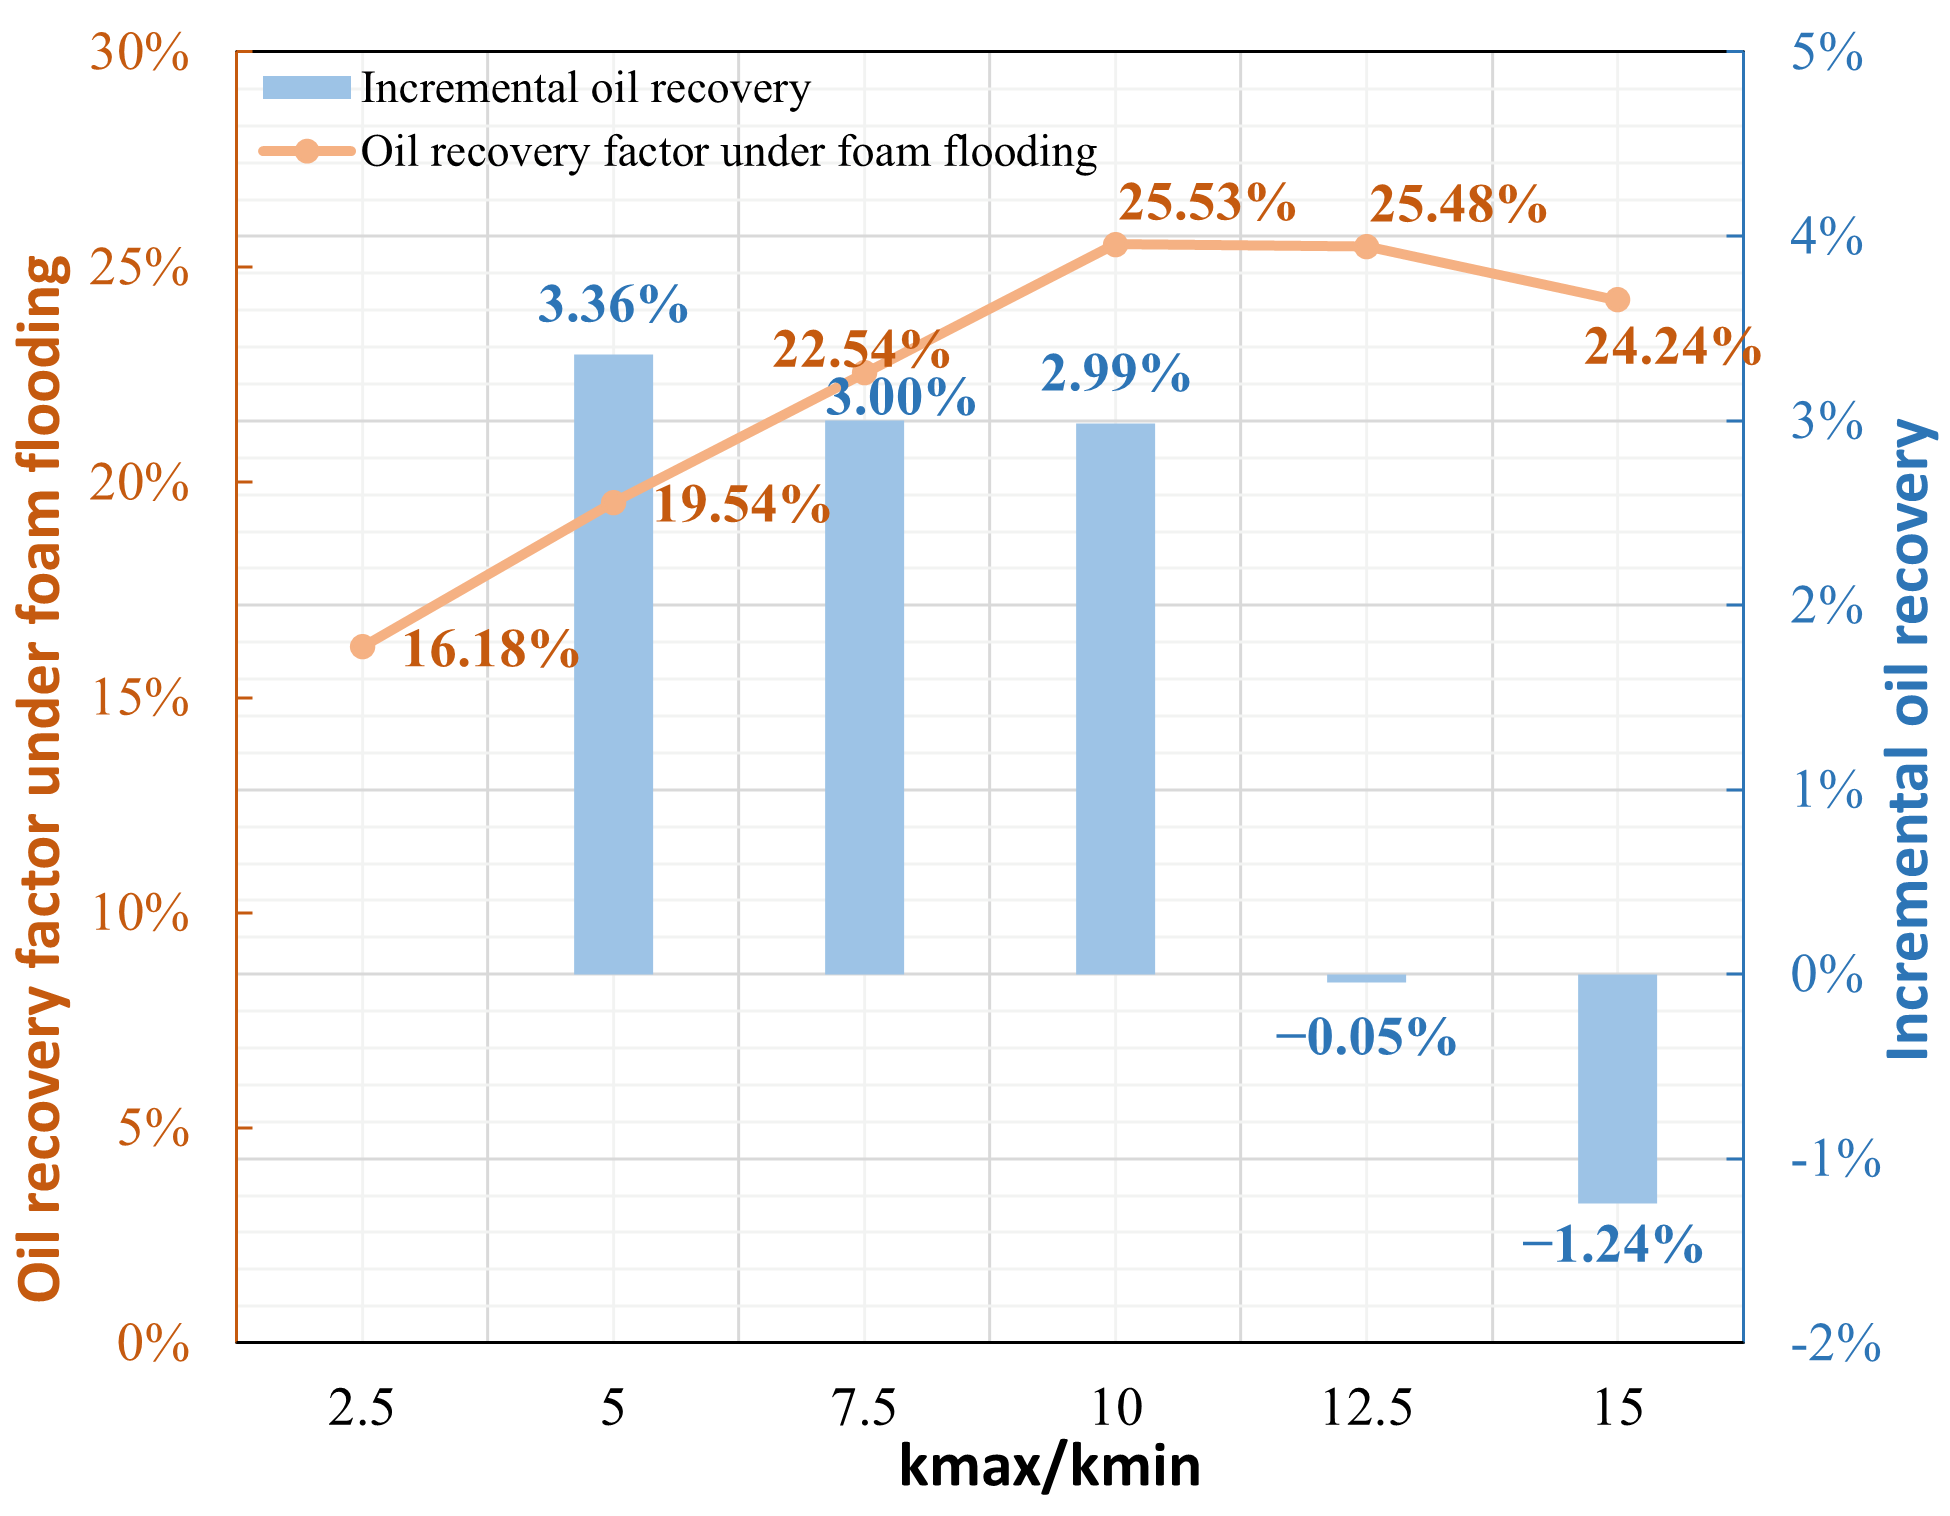
A nonmonotonic response is evident in Figure 16. At permeability contrasts of 2.5, 5, 7.5, and 10, the recovery-factor gains during the air-foam flooding stage reached 16.18%, 19.54%, 22.54%, and 25.53%, respectively. The corresponding increases between adjacent cases were 3.36%, 3.00%, and 2.99%. Raising the contrast to 12.5 and 15 reduced the gains to 25.48% and 24.24%. The change between 10 and 12.5 was small, followed by a more pronounced decline at 15. This behavior suggests that moderate permeability differences allow foam mobility control to improve fluid distribution, whereas stronger heterogeneity may restrict the sweep of low-permeability regions.
Figure 16.
Recovery-factor gain during air-foam flooding versus permeability contrast.
Among the cases evaluated, a permeability contrast of 10 yielded the largest recovery-factor gain during air-foam flooding, although the result at 12.5 was similar. Within the investigated range of this model, permeability contrasts not exceeding 10 are considered favorable for recovery during the air-foam flooding stage. This range provides a model-specific screening reference under the prescribed reservoir and operating conditions.
3.3.3. Vertical-to-Horizontal Permeability Ratio
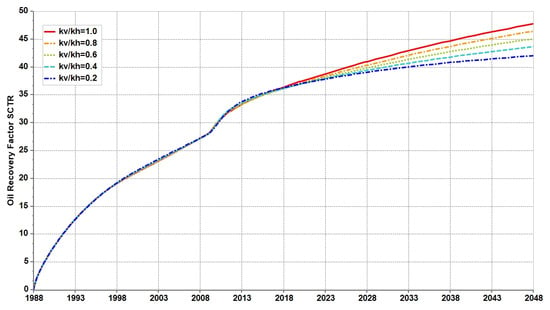
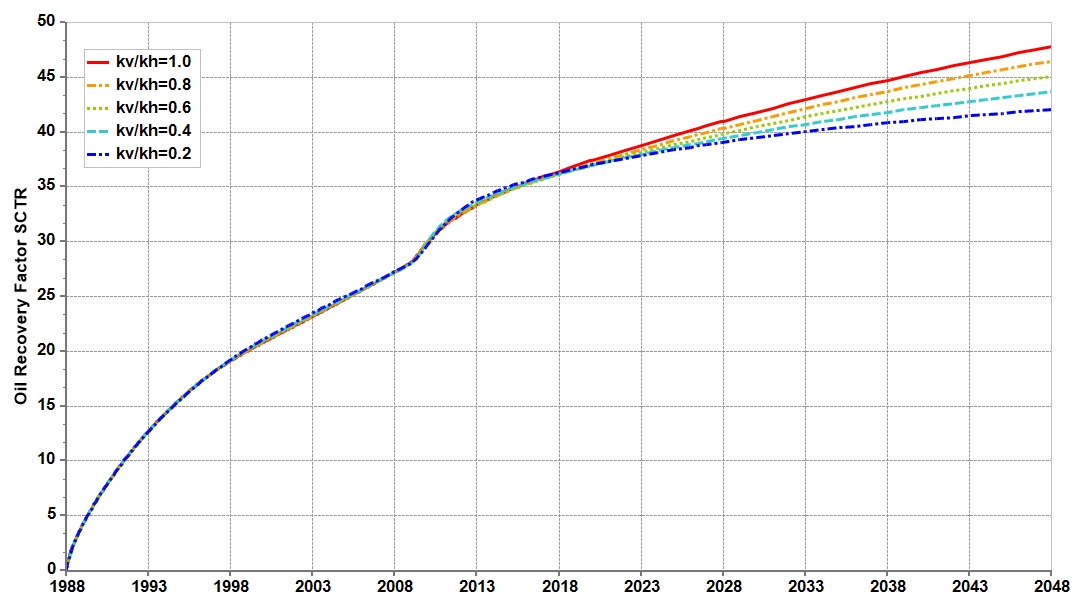
The recovery-factor curves in Figure 17 nearly overlapped during waterflooding across the investigated vertical-to-horizontal permeability ratios, kv/kh. Differences became apparent during the later air-foam flooding period, when the curves gradually separated, and higher kv/kh ratios generally produced higher recovery factors. The contrast between the two stages indicates that recovery was more sensitive to vertical permeability during air-foam flooding than during waterflooding.
Figure 17.
Recovery-factor sensitivity to kv/kh during 1988–2048.
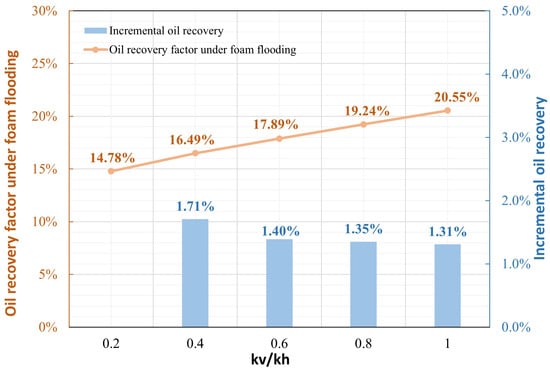
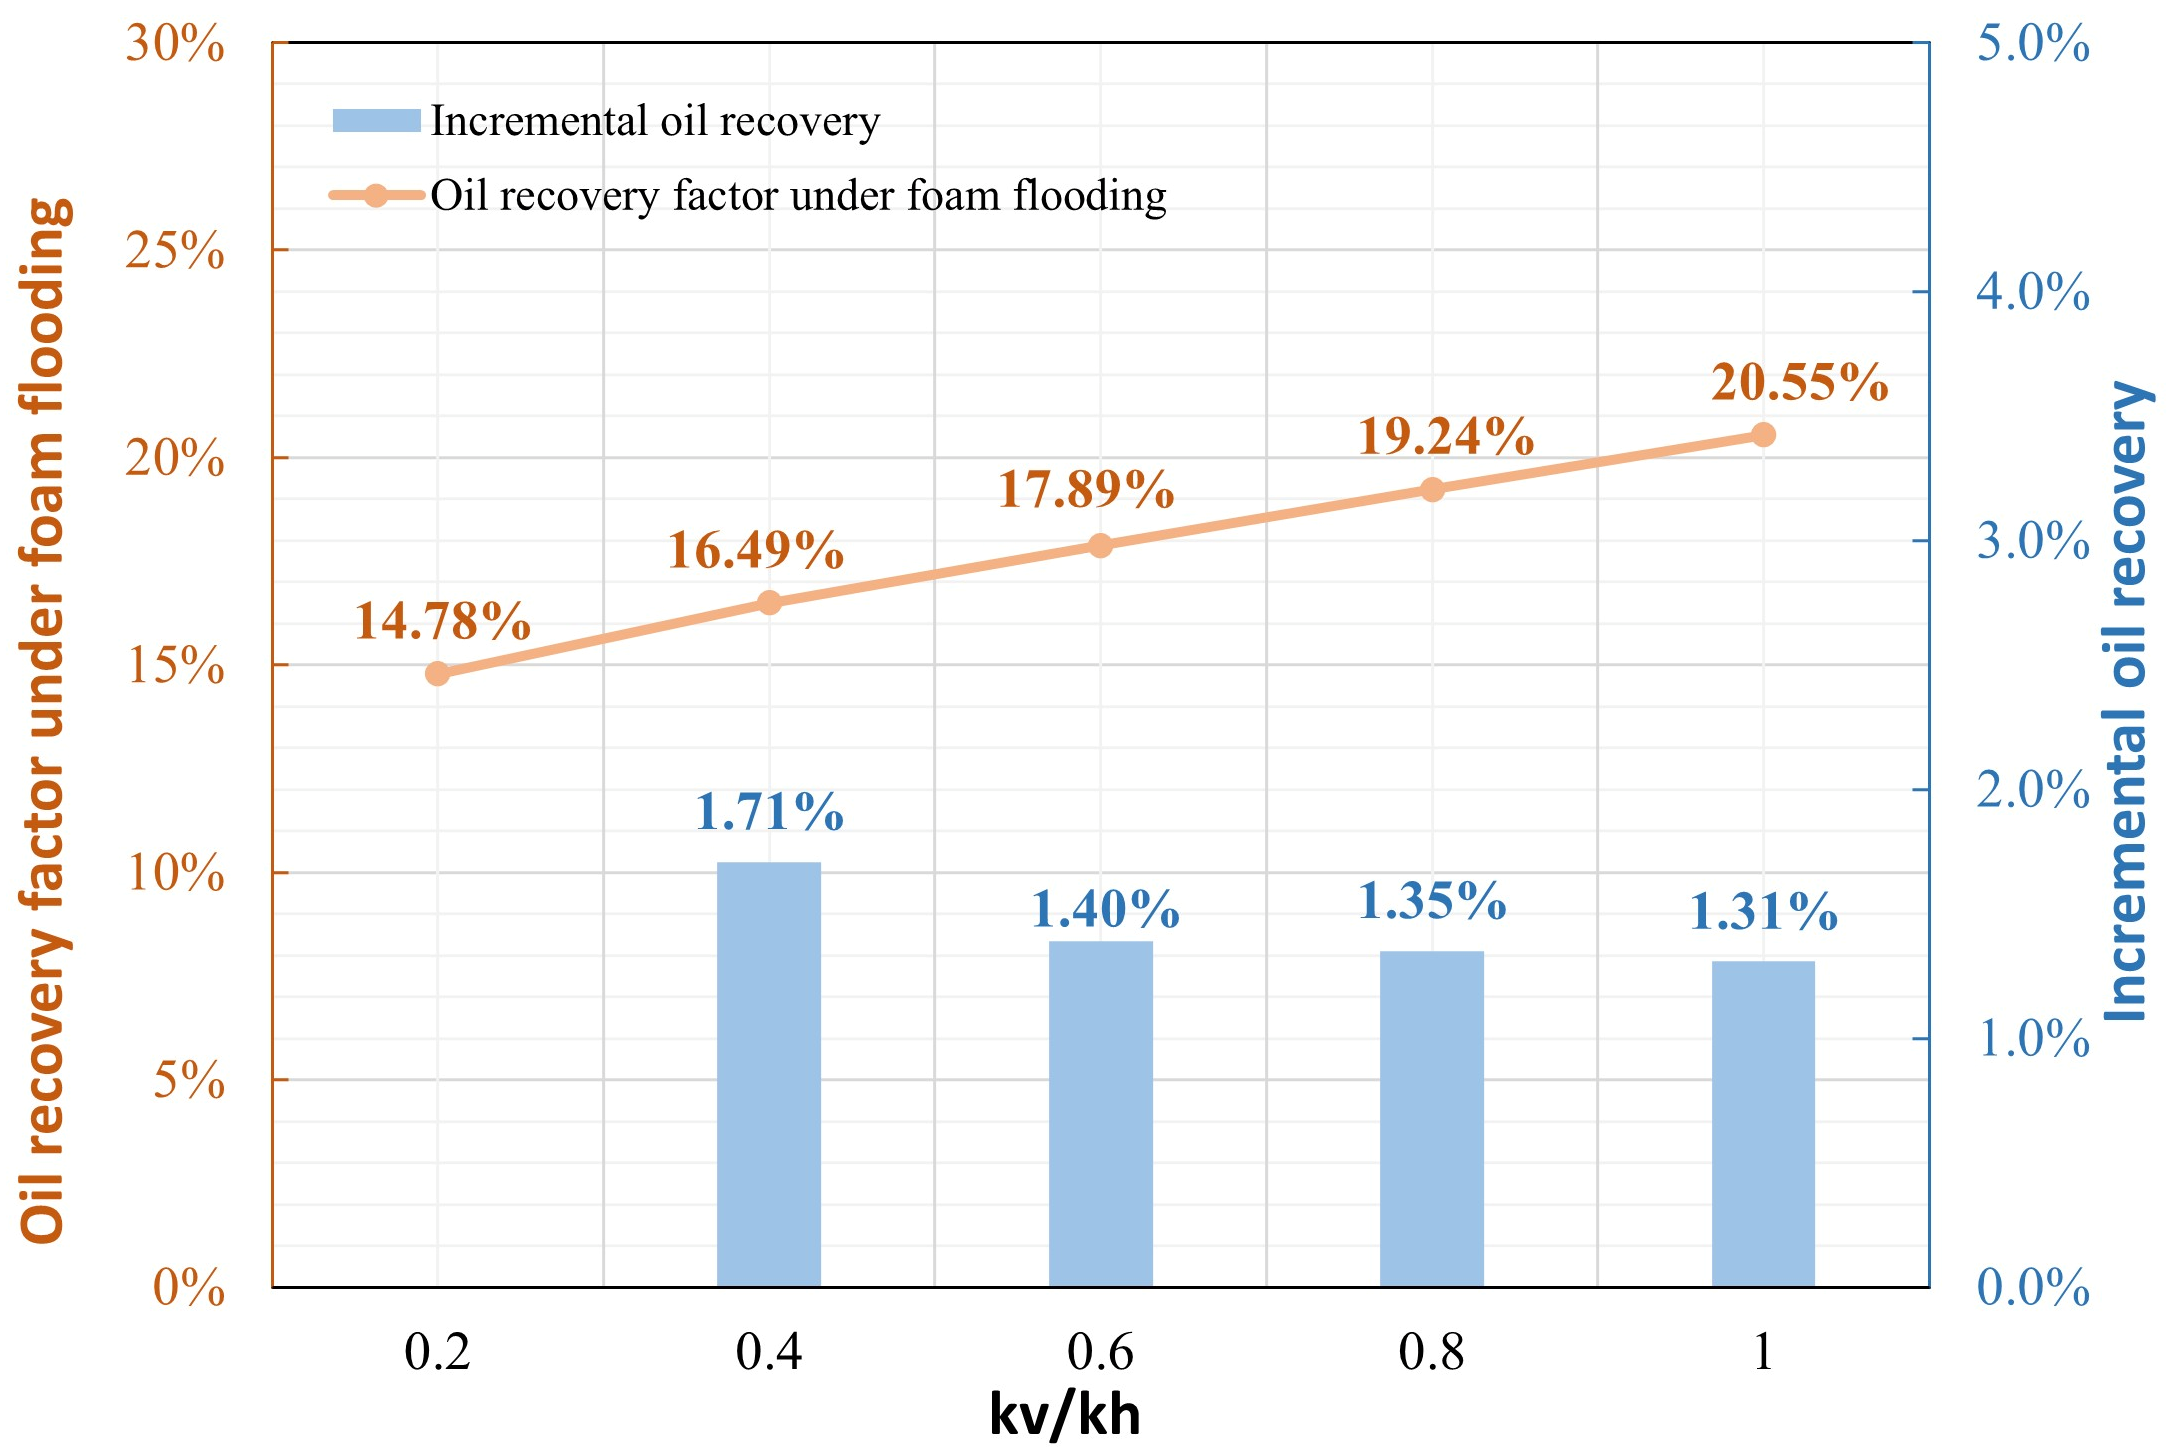
Quantitatively, Figure 18 shows recovery-factor gains of 14.78%, 16.49%, 17.89%, 19.24%, and 20.55% during the air-foam flooding stage at kv/kh ratios of 0.2, 0.4, 0.6, 0.8, and 1.0, respectively. The gain increased by 5.77% across the tested range. The largest increase between adjacent cases was 1.71%, obtained when kv/kh rose from 0.2 to 0.4; subsequent increases were 1.40%, 1.35%, and 1.31%. These progressively smaller gains are consistent with enhanced interlayer fluid exchange and improved vertical sweep at higher kv/kh, but with a diminishing additional contribution to recovery. No clear plateau was observed, as recovery continued to increase as kv/kh approached 1.0.
Figure 18.
Recovery-factor gain during air-foam flooding versus kv/kh.
The comparatively large improvement from 0.2 to 0.4 supports a vertical-to-horizontal permeability ratio of at least 0.4 as a favorable screening condition in this study. Higher ratios remained beneficial within the investigated range.
3.4. Sensitivity Analysis of Injection Parameters
3.4.1. Gas–Liquid Ratio
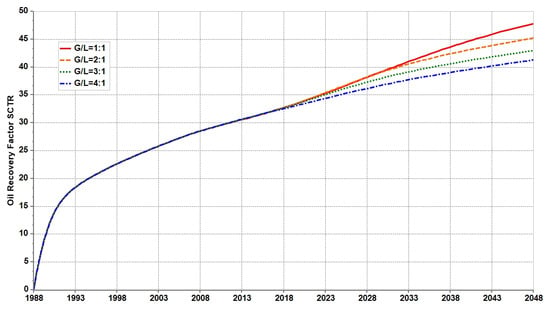
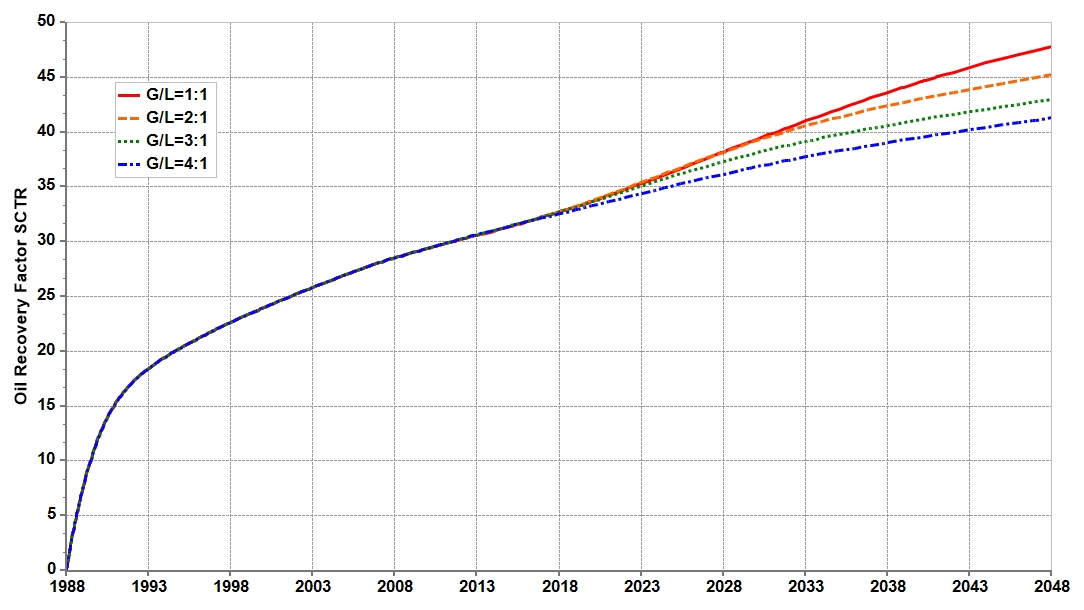
As shown in Figure 19, the recovery-factor curves obtained at different gas-to-liquid ratios remained nearly identical before the implementation of integrated air-foam flooding but gradually diverged after switching to air-foam injection, with the recovery factor decreasing consistently as the gas-to-liquid ratio increased. At gas-to-liquid ratios of 1:1, 2:1, 3:1, and 4:1, the ultimate recovery factors in 2048 were 47.79%, 45.23%, 42.99%, and 41.31%, respectively; compared with the ratio of 1:1, the latter three ratios reduced the recovery factor by 2.56%, 4.80%, and 6.48%, respectively. At the same prescribed total injection volume and liquid-phase surfactant concentration, increasing the gas proportion reduced both the injected solution volume and total surfactant delivery. The observed recovery trend therefore reflects the combined effects of gas–liquid allocation and chemical supply, rather than an isolated foam-quality effect. The ratio of 1:1 yielded the highest final recovery among the tested configurations under these normalization and operating conditions.
Figure 19.
Recovery-factor sensitivity to gas–liquid ratio.
3.4.2. Timing of Conversion to Foam Flooding
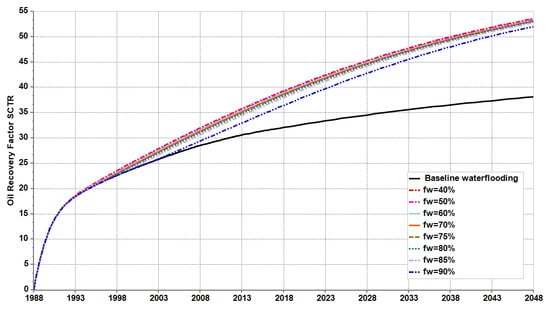
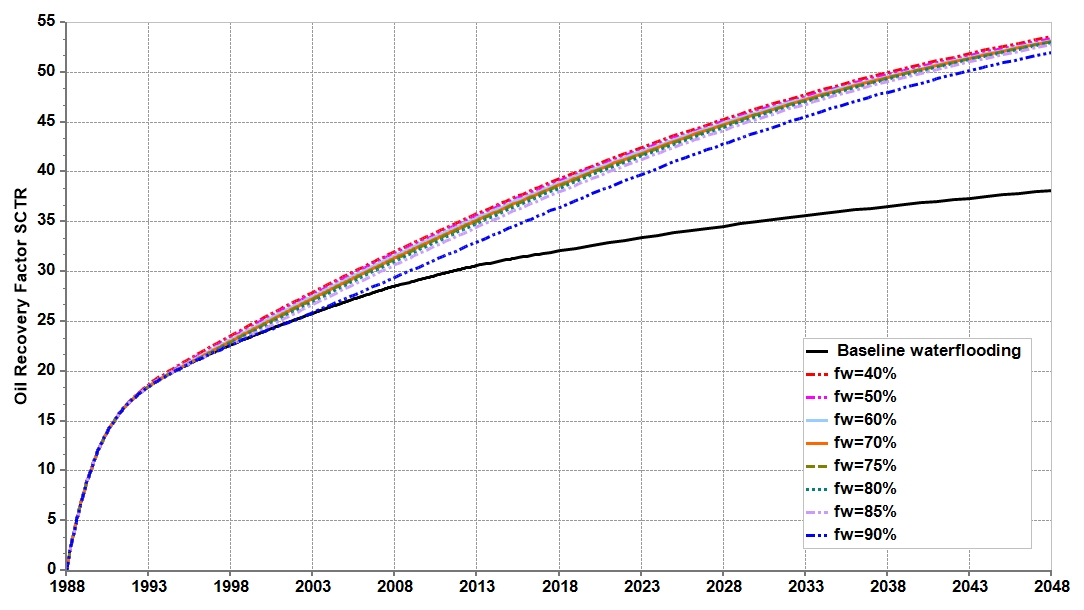
Figure 20 compares the recovery-factor curves for switching to integrated air-foam flooding at water cuts ranging from 40% to 90% with that for baseline waterflooding. Before switching, each case followed the same waterflooding curve. After switching, the recovery factors gradually exceeded those of baseline waterflooding. Earlier switching generally resulted in higher recovery factors at the common simulation end date, although the differences among the air-foam flooding cases were smaller than their improvements over baseline waterflooding.
Figure 20.
Effect of conversion water cut on recovery.
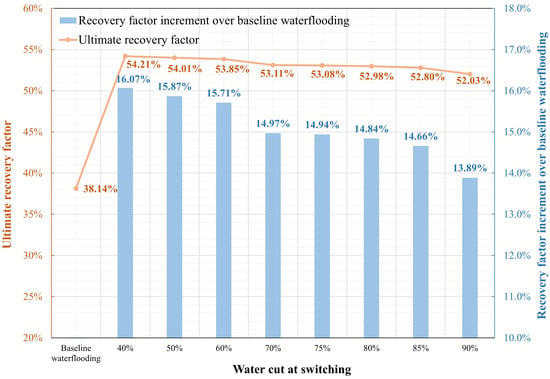
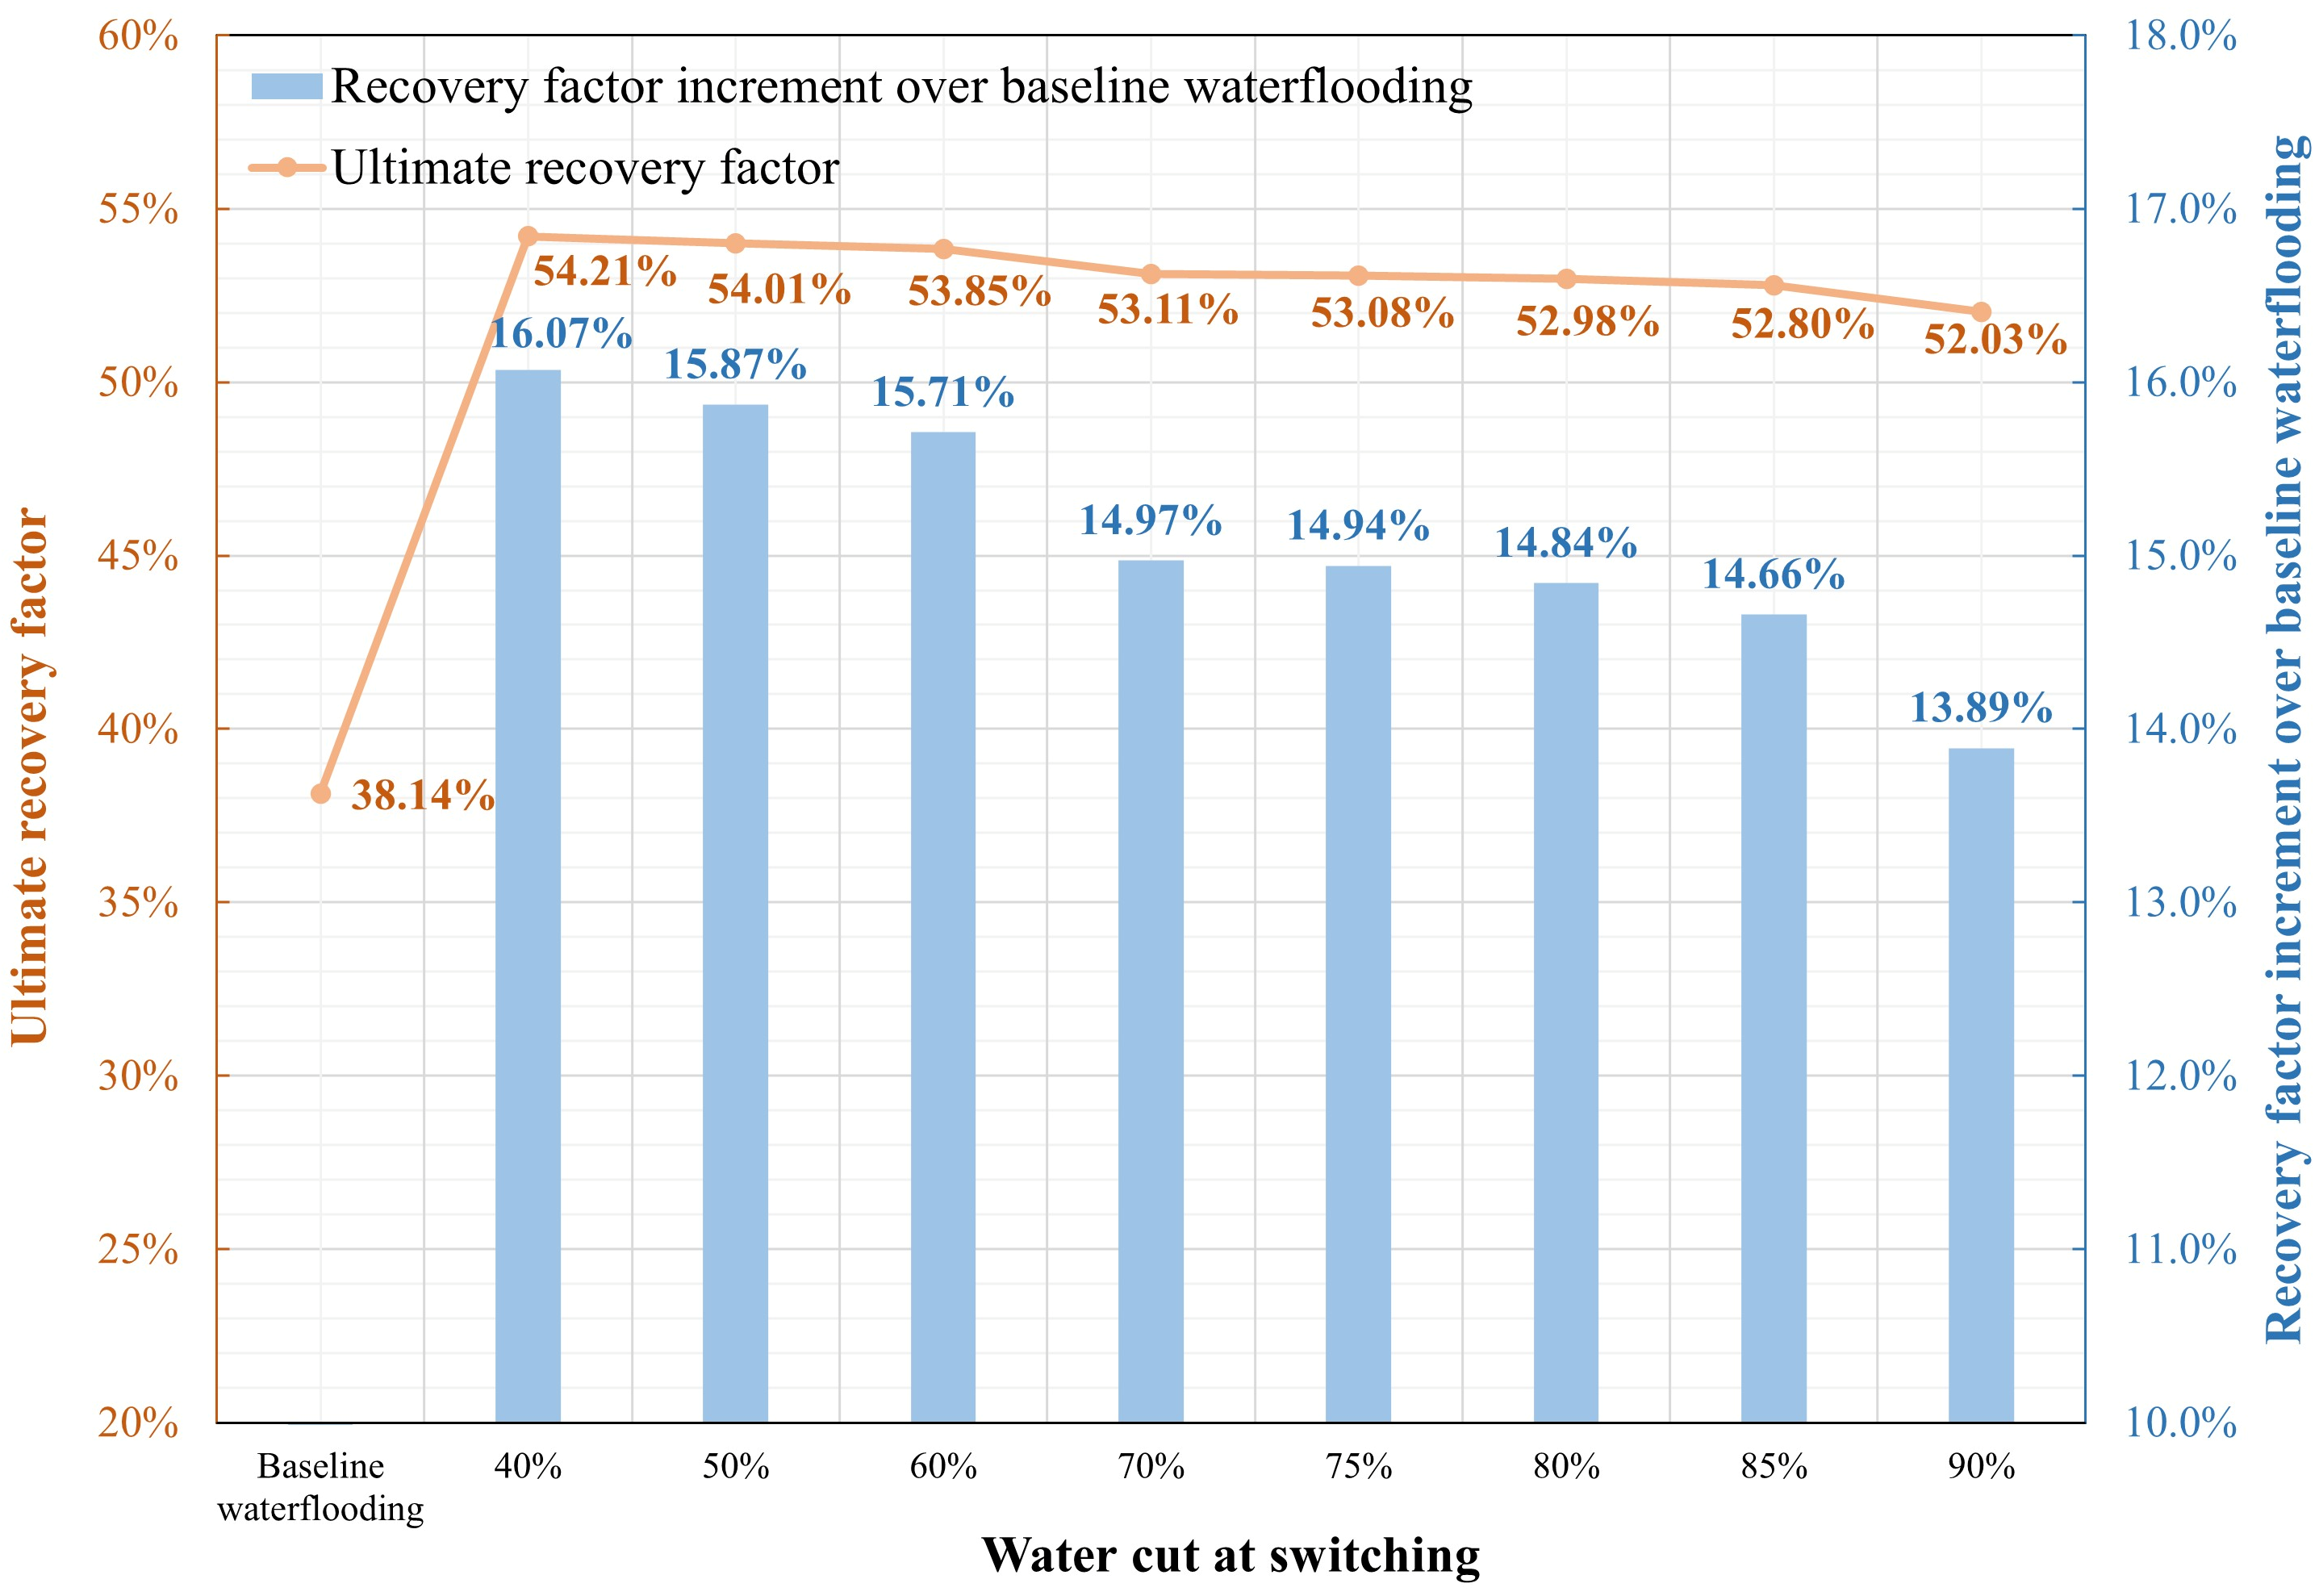
As shown in Figure 21, the ultimate recovery factor of baseline waterflooding was 38.14%. Switching at water cuts of 40%, 50%, 60%, 70%, 75%, 80%, 85%, and 90% yielded ultimate recovery factors of 54.21%, 54.01%, 53.85%, 53.11%, 53.08%, 52.98%, 52.80%, and 52.03%, respectively. The corresponding recovery-factor increments over baseline waterflooding were 16.07%, 15.87%, 15.71%, 14.97%, 14.94%, 14.84%, 14.66%, and 13.89%. Switching at water cuts no higher than 85% maintained an ultimate recovery factor of at least 52.80%, with an improvement of at least 14.66% over baseline waterflooding. Delaying the switch from 85% to 90% reduced the ultimate recovery factor by 0.77%.
Figure 21.
Effect of switching water cut on the ultimate recovery factor.
These results favor earlier switching within the investigated range. Under the conditions examined, the transition to integrated air-foam flooding is recommended before the water cut exceeds 85%, based on recovery performance at the common evaluation end date.
3.4.3. Slug Configuration
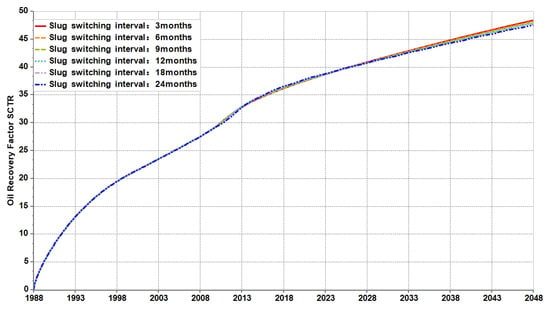
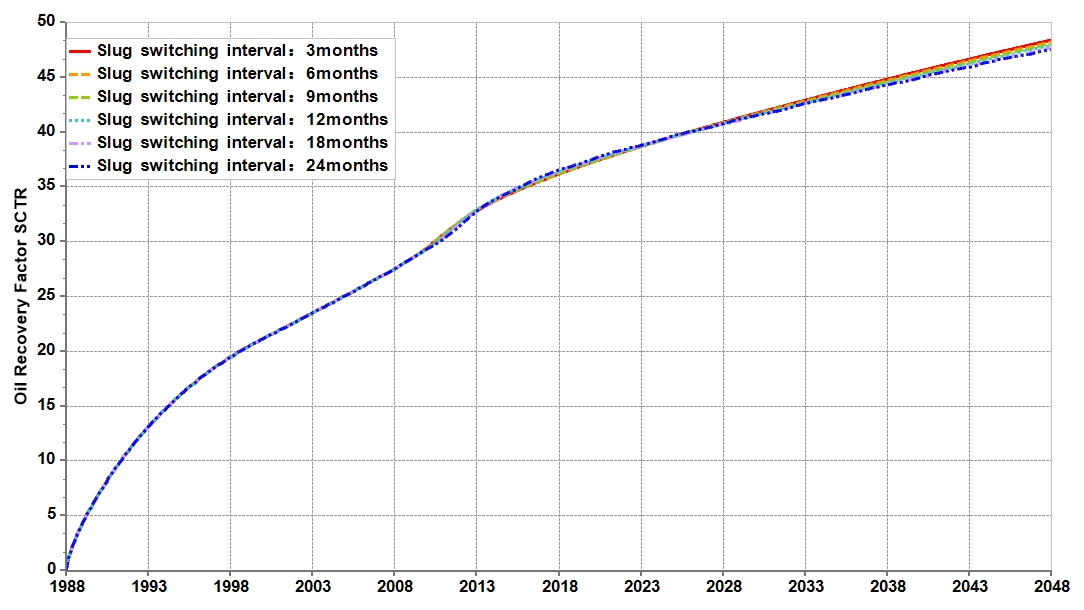
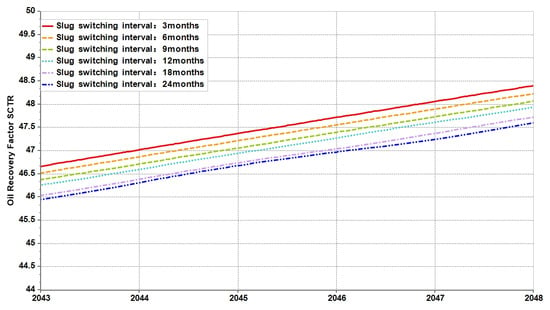
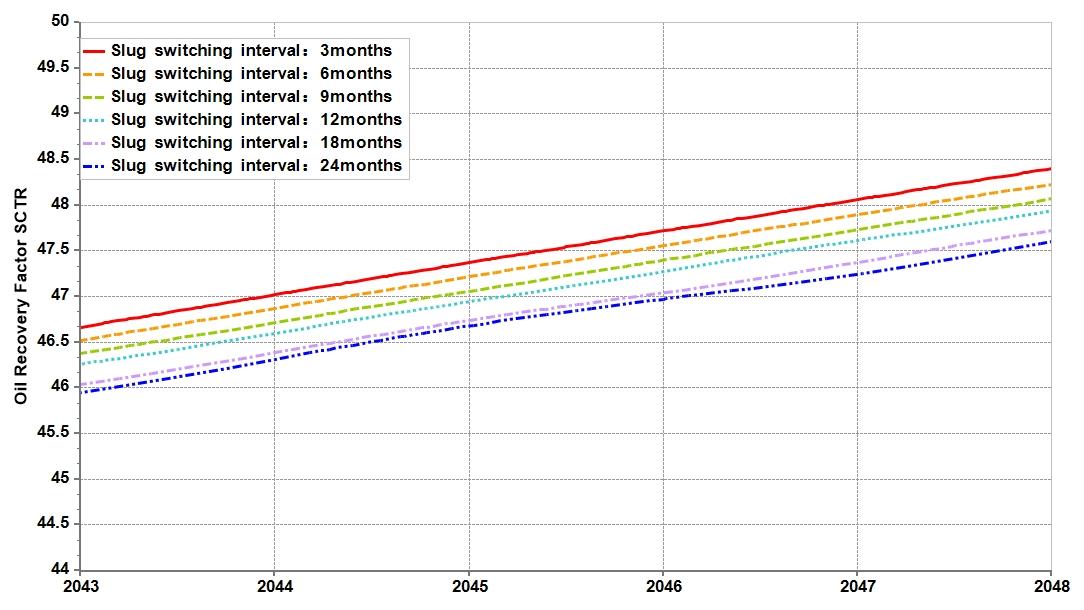
Figure 22 compares the recovery-factor curves at slug switching intervals of 24, 18, 12, 9, 6, and 3 months under the same total injection volume. All cases followed similar development trends, with recovery factors increasing throughout the simulation. The curves remained close over much of the development period, while shorter switching intervals generally yielded higher recovery factors at later times. The enlarged view for 2043–2048 in Figure 23 shows this separation more clearly: the 3-month case maintained the highest recovery factor, followed by progressively longer switching intervals. These results indicate that increasing the number of injection cycles and reducing the volume of individual slugs improved recovery, although the differences among cases were modest.
Figure 22.
Recovery-factor comparison of slug switching interval during 1988–2048.
Figure 23.
Recovery-factor comparison of slug switching interval during 2043–2048.
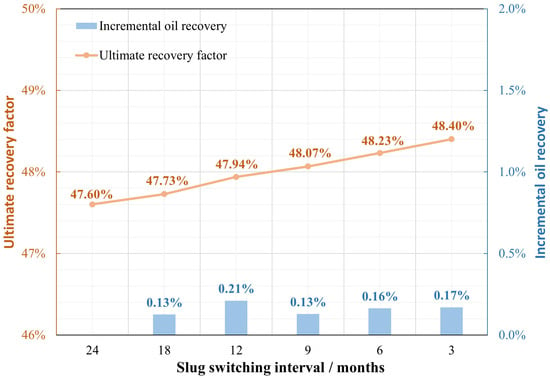
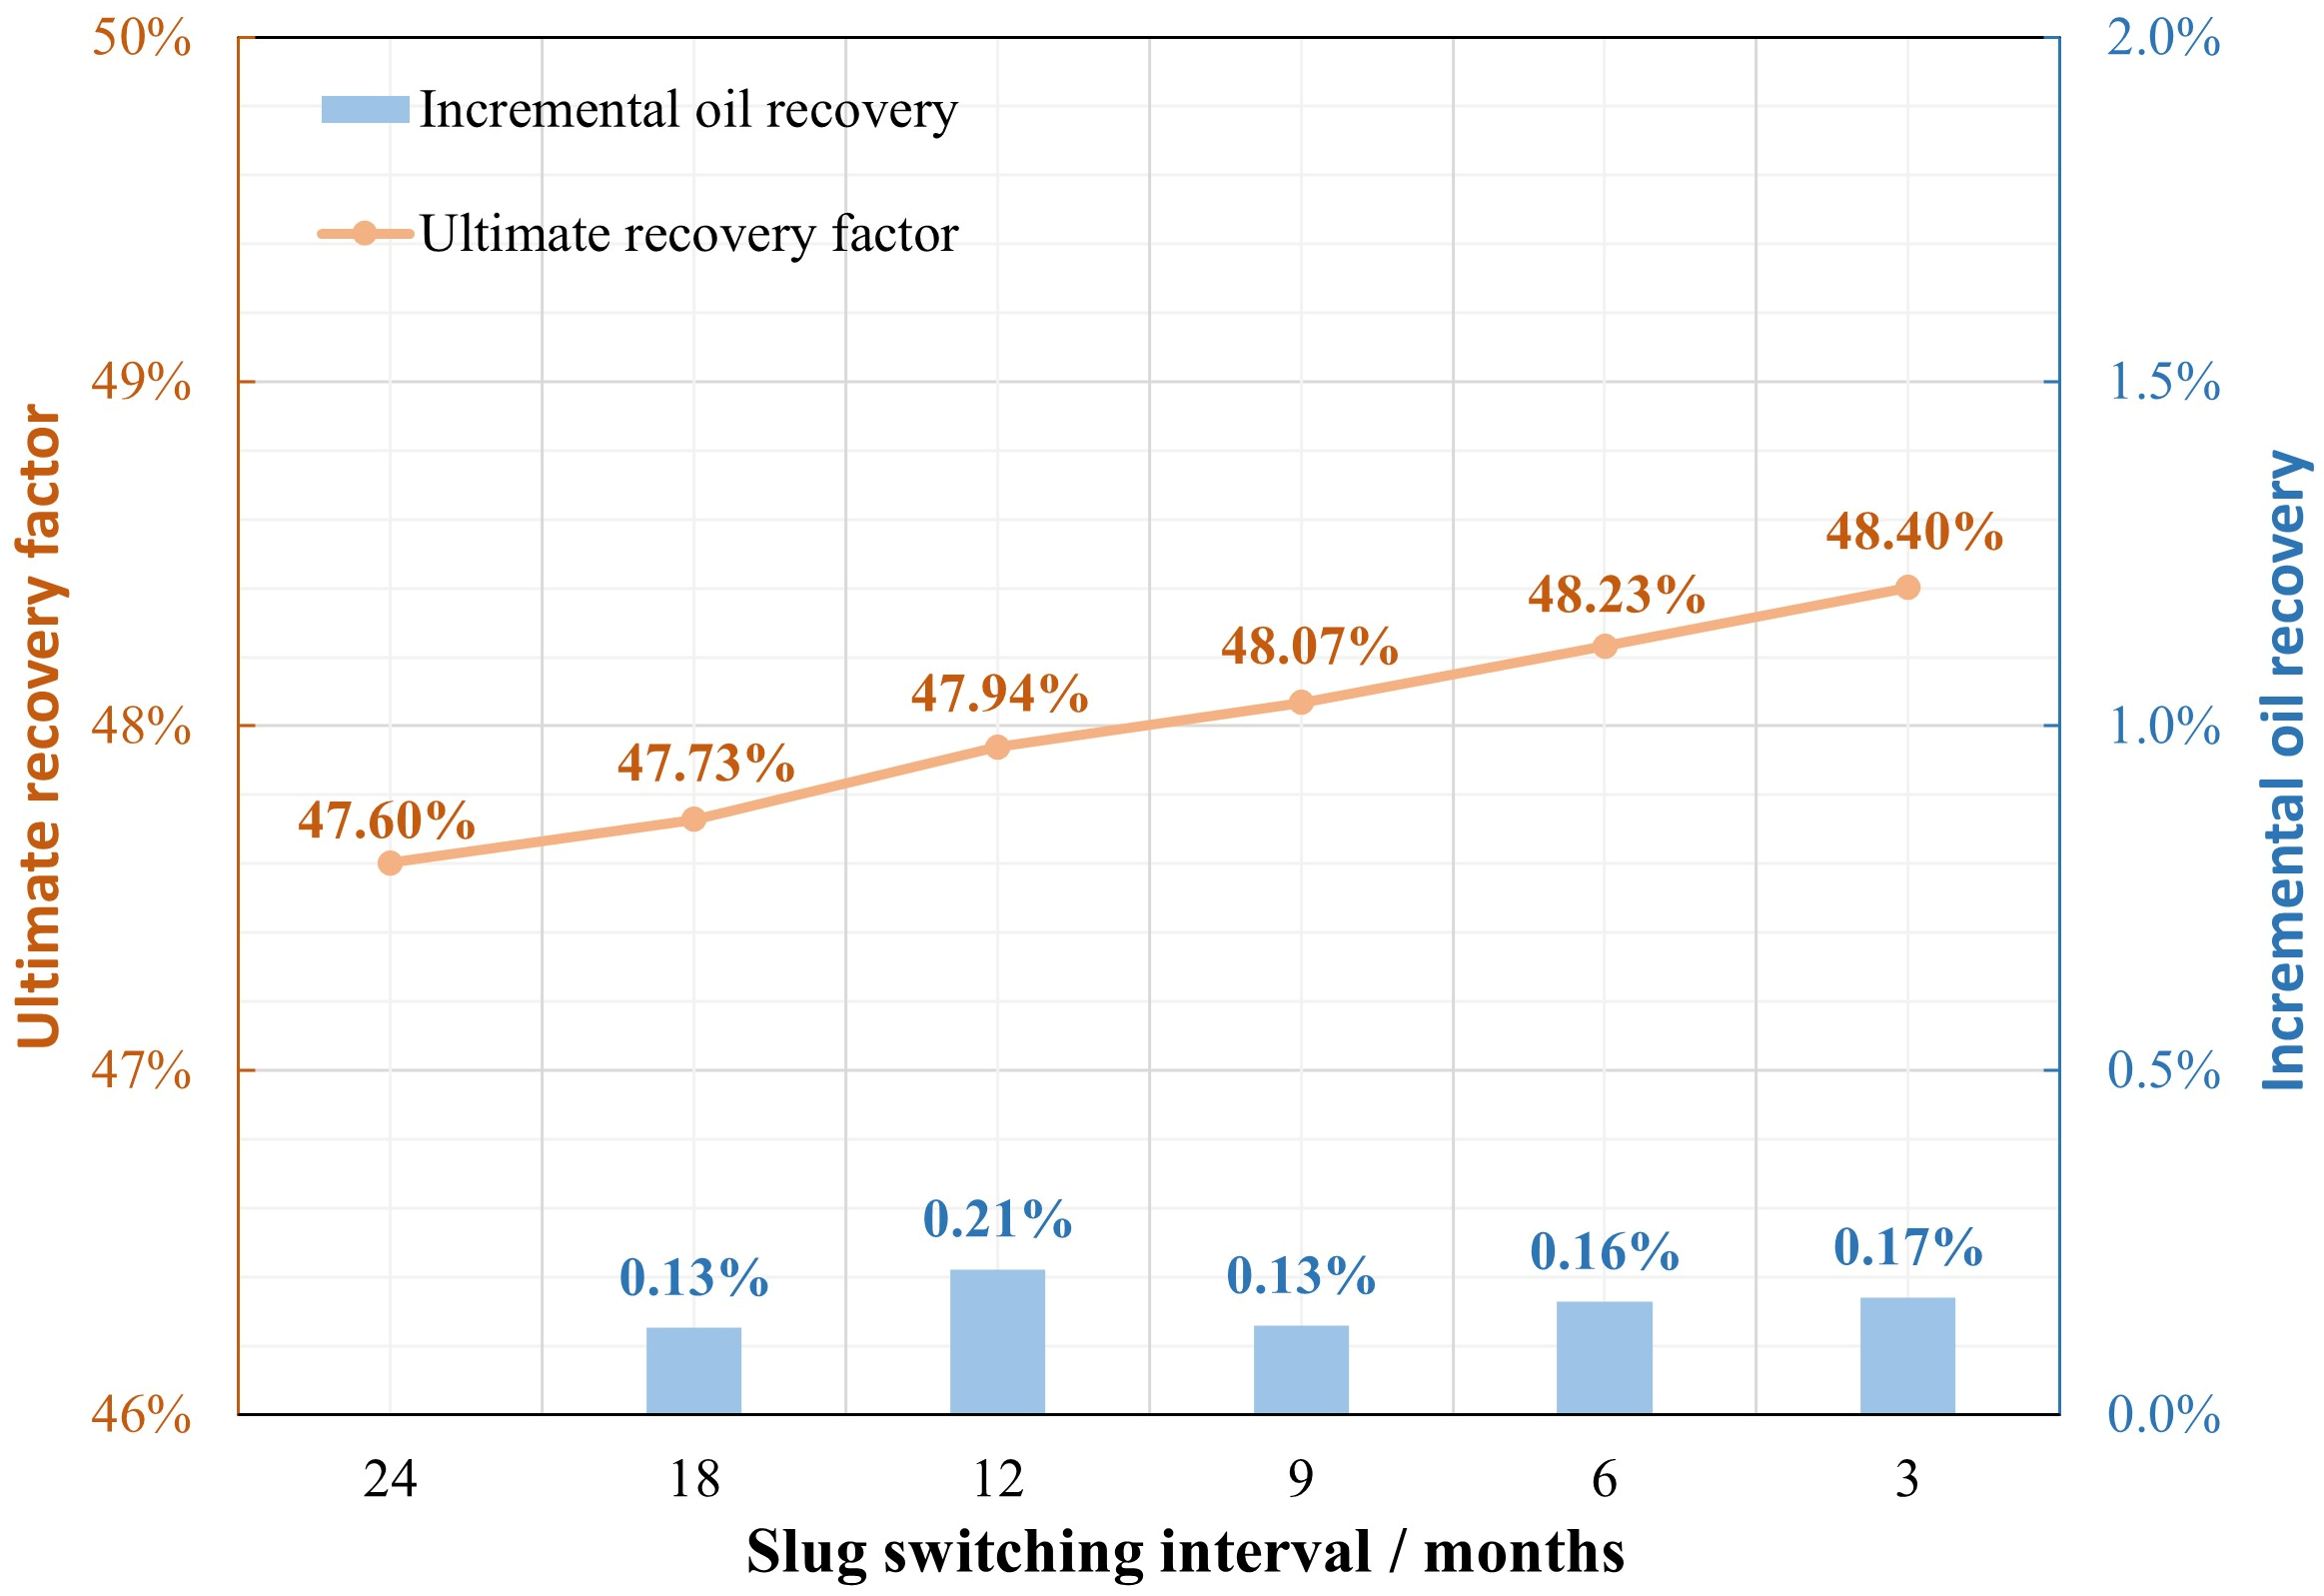
As shown in Figure 24, the ultimate recovery factors were 47.60%, 47.73%, 47.94%, 48.07%, 48.23%, and 48.40% for switching intervals of 24, 18, 12, 9, 6, and 3 months, respectively. Shortening the interval from 24 to 3 months increased the ultimate recovery factor by 0.80%. The increases between adjacent cases were 0.13%, 0.21%, 0.13%, 0.16%, and 0.17%, indicating small but consistent improvements as the interval shortened. More frequent alternation may promote gas–liquid contact and replenish the surfactant solution more regularly, helping sustain foam mobility control. However, the limited spread in ultimate recovery factors indicates that adjusting the slug switching interval provided a relatively small additional recovery benefit under the conditions examined.
Figure 24.
Recovery-factor comparison of slug switching interval.
The 3-month interval achieved the highest ultimate recovery factor within the tested range. For the same total injection volume, more frequent switching with smaller individual slugs is therefore favored, with the field switching interval selected according to injectivity and operating conditions.
3.5. Integrated Effects of Reservoir Parameters on Foam Flooding Recovery
To avoid dependence on a single reference value and allow comparisons among parameters with different units, a dimensionless sensitivity coefficient based on adjacent-interval midpoints was used. For each pair of adjacent parameter levels, the relative change in the recovery-factor gain was divided by the relative change in the parameter, with both changes referenced to their respective interval means:
where xi,j and xi,j+1 are adjacent levels of parameter i, and Ri,j and Ri,j+1 are the corresponding recovery-factor gains during the air-foam flooding stage. The latter represent the increase in recovery factor from the transition to air-foam flooding to the end of the simulation. The local dimensionless sensitivity coefficient, Si,j, measures the magnitude of the relative recovery response to a unit relative change in the parameter. A larger value indicates greater sensitivity within that interval. The absolute value allows both increasing and decreasing responses to contribute to the sensitivity assessment.
The overall sensitivity coefficient for each parameter was calculated as the arithmetic mean of its local coefficients:
where ni is the number of parameter levels and ni − 1 is the number of adjacent intervals. This approach incorporates responses across the tested range rather than relying solely on a single reference case or the two endpoints. The overall coefficients were then normalized to obtain the sensitivity weights:
where m is the number of parameters evaluated, and the weights sum to 100%. These weights indicate the relative sensitivity of recovery to the selected parameters within their investigated ranges; they do not represent independent contributions to oil recovery.
Average horizontal permeability provides an example of the calculation. At permeabilities of 1, 2, 4, 6, 8, and 10 mD, the recovery-factor gains during the air-foam flooding stage were 18.64%, 19.88%, 23.59%, 25.44%, 26.46%, and 27.15%, respectively. For the interval from 4 to 6 mD, the local coefficient was calculated as:
The coefficients for the remaining intervals of 1–2, 2–4, 6–8, and 8–10 mD were 0.0966, 0.2560, 0.1376, and 0.1158, respectively. The overall sensitivity coefficient was therefore:
The local sensitivity was highest between 2 and 4 mD and declined over the subsequent intervals. The same procedure was applied to permeability contrast and the vertical-to-horizontal permeability ratio. Their overall coefficients and normalized weights are summarized in Table 8.
Table 8.
Reservoir-parameter responses and normalized local sensitivity indices.
Permeability contrast had the highest sensitivity weight, followed by the vertical-to-horizontal permeability ratio and average horizontal permeability. This ranking identifies permeability contrast as the most influential of the three parameters under the adopted sensitivity measure and tested ranges. Because the coefficients describe response magnitudes, the associated recovery trends must also be considered when defining favorable reservoir conditions.
For permeability contrast, the recovery-factor gain increased from 16.18% at 2.5 to 25.53% at 10, remained similar at 12.5 (25.48%), and declined to 24.24% at 15. The relatively high sensitivity weight therefore reflects a nonmonotonic response across the tested range. Within the investigated range of this model, permeability contrasts not exceeding 10 are considered favorable for recovery during air-foam flooding, with 10 used as a screening reference for the specified conditions.
The vertical-to-horizontal permeability ratio showed a consistently positive relationship with recovery. Increasing the ratio from 0.2 to 1.0 raised the recovery-factor gain from 14.78% to 20.55%. Although the absolute increases between adjacent cases gradually declined, the local dimensionless sensitivity coefficients increased from 0.1641 to 0.2963. This difference arises because equal absolute increases in the ratio correspond to progressively smaller relative changes at higher values. Within the present model and tested range, a vertical-to-horizontal permeability ratio of at least 0.4 is considered a favorable screening condition, with recovery-factor gains continuing to increase at higher ratios.
Average horizontal permeability had the lowest normalized weight, although increasing it from 1 to 10 mD raised the recovery-factor gain from 18.64% to 27.15%. Its local sensitivity peaked between 2 and 4 mD and then decreased, consistent with the diminishing marginal gains at higher permeabilities. An average horizontal permeability of at least 4 mD is consequently considered favorable under the conditions examined. Together, these criteria provide guidance for reservoir screening based on the individual parameter responses; their combined effect was not evaluated in this single-factor analysis.
4. Conclusions
(1) The final recovery factors of baseline waterflooding and integrated air-foam flooding were 38.14% and 47.79%, respectively, an absolute difference of 9.65%. Using surfactant-background flooding as a common reference, activating foam mobility control alone increased recovery by 1.22%, while activating interfacial tension reduction alone increased it by 0.63%. Joint activation gave an increment of 6.98%, including a 5.13% non-additive interaction term. The non-additive increment suggests a potential synergistic effect between foam plugging and surfactant-enhanced oil displacement under the modeled conditions.
(2) Within the investigated ranges, permeability contrast had the highest normalized sensitivity weight (41.13%), followed by the vertical-to-horizontal permeability ratio (34.79%) and average permeability (24.08%). The single-factor results indicated favorable recovery performance at permeability contrasts not exceeding 10, vertical-to-horizontal permeability ratios of at least 0.4, and average permeabilities of at least 4 mD within the research scope of this model. These values serve as screening references under the modeled reservoir and operating conditions.
(3) At the same prescribed total injection volume and liquid-phase surfactant concentration, a gas-to-liquid ratio of 1:1 yielded the highest final recovery among the tested configurations. At the stated equal total injection volume, shorter alternating injection intervals improved recovery; reducing the interval from 24 to 3 months increased final recovery from 47.60% to 48.40%. Switching before the water cut exceeded 85% avoided the lower final recovery associated with the latest switching case. The parameter ranges and operating preferences reported here were obtained from the specified mechanistic model and single-factor comparisons and require evaluation under the geological and operating conditions of a target reservoir.
Author Contributions
Conceptualization, J.Z., Y.Y., J.W. and Q.Z.; methodology, J.Z. and Y.Y.; software, J.Z.; validation, Y.Z. and C.Z.; formal analysis, J.Z., Y.Y. and S.Z.; investigation, W.D., Y.T. and K.Y.; resources, J.W. and Q.Z.; data curation, Y.Z., S.Z. and S.H.; writing—original draft preparation, J.Z. and Y.Y.; writing—review and editing, Y.Z., C.Z., S.Z., J.W. and Q.Z.; visualization, J.Z., Y.Y. and Y.Z.; supervision, J.W. and Q.Z.; project administration, Q.Z.; funding acquisition, J.W. All authors have read and agreed to the published version of the manuscript.
Funding
This research was funded by the National Major Science and Technology Project of New Oil and Gas Exploration and Development “Enhanced Oil Recovery Technologies and Integrated Demonstration for Tight Sandstone Oil Reservoirs” (Project No. 2025ZD1405406).
Informed Consent Statement
Informed consent was obtained from all subjects involved in the study.
Data Availability Statement
The datasets used and analyzed during the current study are available from the first and corresponding authors upon reasonable request.
Conflicts of Interest
Authors Jin Zhou, Yongqiang Zhang, Chuanbao Zhang, Shan Zeng, Wenbiao Duan, Yalan Tang and Jinghua Wang were employed by the company Changqing Oilfield Company. The remaining authors declare that the research was conducted in the absence of any commercial or financial relationships that could be construed as a potential conflict of interest.
References
- Lake, L.W.; Johns, R.T.; Rossen, W.R.; Pope, G.A. Fundamentals of Enhanced Oil Recovery; Society of Petroleum Engineers: Richardson, TX, USA, 2014. [Google Scholar]
- Zhou, X.; Huang, J.; Qian, Y.; Luo, W.; Qi, L.; Wang, J.; Jiang, Z.; Kang, H. Pilot test for nitrogen foam flooding in low-permeability reservoir. Energy Eng. 2023, 120, 763–774. [Google Scholar] [CrossRef] [Scilit]
- Guo, H.; Wang, J.; Xu, C.; Bai, H.; Li, X.; Yan, B.; Qi, X. Research and application of nitrogen-foam chemical flooding for enhanced oil recovery in a low-permeability oilfield. Contemp. Chem. Ind. 2025, 54, 1037–1041. [Google Scholar] [CrossRef]
- Liu, P.; Zhang, X.; Wu, Y.; Li, X. Enhanced oil recovery by air-foam flooding system in tight oil reservoirs: Study on the profile-controlling mechanisms. J. Pet. Sci. Eng. 2017, 150, 208–216. [Google Scholar] [CrossRef] [Scilit]
- Yuan, Y.; Yan, W.; Qi, Z.; Luo, T.; Fan, W. Study on property evaluation and numerical simulation of air-foam flooding in low permeability reservoir. Energy Sources Part A Recovery Util. Environ. Eff. 2023, 45, 6472–6486. [Google Scholar] [CrossRef] [Scilit]
- Hua, S.; Liu, Y.; Di, Q.; Chen, Y.; Ye, F. Experimental study of air foam flow in sand-pack core for enhanced oil recovery. J. Pet. Sci. Eng. 2015, 135, 141–145. [Google Scholar] [CrossRef] [Scilit]
- Li, Z.; Yan, W.; Zhou, J.; Yuan, Y.; Zeng, S.; Fan, W. Numerical simulation of air–foam flooding in Wuliwan District 1 of Jing’an Oilfield. J. Pet. Explor. Prod. Technol. 2019, 9, 1531–1538. [Google Scholar] [CrossRef] [Scilit]
- Li, D.; Xin, G.; Ren, S. Dynamic behaviors and mechanisms of air-foam flooding at high pressure and reservoir temperature via microfluidic experiments. ACS Omega 2022, 7, 36503–36509. [Google Scholar] [CrossRef] [Scilit] [PubMed]
- Yuan, Z.; Liu, P.; Gao, Y.; Wang, C. Experimental study on blocking mechanism of nitrogen foam for enhancing oil recovery in heavy-oil reservoirs. Energy Sources Part A Recovery Util. Environ. Eff. 2018, 40, 1947–1955. [Google Scholar] [CrossRef] [Scilit]
- Hao, H.; Li, J.; Deng, S.; Xian, B.; Tang, Z.; Yang, S.; Hou, J. N2 foam flooding combined with gel plugging for enhanced oil recovery in high-temperature reservoirs: Laboratory experiments and numerical simulations. ACS Omega 2023, 8, 23913–23924. [Google Scholar] [CrossRef] [Scilit] [PubMed]
- Wu, F.; Liu, J.; Wei, X.; Pu, C. A study on oxygen consumption mechanism of air-foam flooding in low-temperature oil reservoir. J. Pet. Sci. Eng. 2018, 161, 368–380. [Google Scholar] [CrossRef] [Scilit]
- Jia, H.; Yin, S.P.; Ma, X.P. Enhanced oil recovery mechanism of low-oxygen air injection in high-water-cut reservoir. J. Pet. Explor. Prod. Technol. 2018, 8, 917–923. [Google Scholar] [CrossRef] [Scilit]
- Boeije, C.S.; Rossen, W.R. SAG foam flooding in carbonate rocks. J. Pet. Sci. Eng. 2018, 171, 843–853. [Google Scholar] [CrossRef] [Scilit]
- Farajzadeh, R.; Andrianov, A.; Krastev, R.; Hirasaki, G.J.; Rossen, W.R. Foam-oil interaction in porous media: Implications for foam-assisted enhanced oil recovery. Adv. Colloid Interface Sci. 2012, 183–184, 1–13. [Google Scholar] [CrossRef] [Scilit] [PubMed]
- Khan, J.A.; Kim, J.; Irawan, S.; Permatasar, K.A.; Verdin, P.G.; Cai, B.; Yekeen, N. Application of foam-assisted water-alternating-gas flooding and quantification of resistivity and water saturation by experiment and simulation to determine foam propagation in sandstone. Heliyon 2024, 10, e25435. [Google Scholar] [CrossRef] [Scilit] [PubMed]
- Yan, Y.; Zhang, J.; Yang, W.; Wei, W. Simulation research on EOR technology and mechanism of sandstone reservoir injected with foam. Chem. Technol. Fuels Oils 2023, 59, 765–772. [Google Scholar] [CrossRef] [Scilit]
- Ma, K.; Ren, G.; Mateen, K.; Morel, D.; Cordelier, P. Modeling techniques for foam flow in porous media. SPE J. 2015, 20, 453–470. [Google Scholar] [CrossRef] [Scilit]
- Rossen, W.R.; Zeilinger, S.C.; Shi, J.X.; Lim, M.T. Simplified mechanistic simulation of foam processes in porous media. SPE J. 1999, 4, 279–287. [Google Scholar] [CrossRef] [Scilit]
- Chen, Q.; Gerritsen, M.G.; Kovscek, A.R. Modeling foam displacement with the local-equilibrium approximation: Theory and experimental verification. SPE J. 2010, 15, 171–183. [Google Scholar] [CrossRef] [Scilit]
- Ding, L.; Cui, L.; Jouenne, S.; Gharbi, O.; Pal, M.; Bertin, H.; Rahman, M.A.; Romero, C.; Guérillot, D. Estimation of local-equilibrium-model parameters for simulation of the laboratory foam-enhanced-oil-recovery process using a commercial reservoir simulator. ACS Omega 2020, 5, 23437–23449. [Google Scholar] [CrossRef] [Scilit] [PubMed]
- Ma, K.; Farajzadeh, R.; Lopez-Salinas, J.L.; Miller, C.A.; Biswal, S.L.; Hirasaki, G.J. Non-uniqueness, numerical artifacts, and parameter sensitivity in simulating steady-state and transient foam flow through porous media. Transp. Porous Media 2014, 102, 325–348. [Google Scholar] [CrossRef] [Scilit]
- Farajzadeh, R.; Lotfollahi, M.; Eftekhari, A.A.; Rossen, W.R.; Hirasaki, G.J. Effect of permeability on implicit-texture foam model parameters and the limiting capillary pressure. Energy Fuels 2015, 29, 3011–3018. [Google Scholar] [CrossRef] [Scilit]
- Tang, J.; Vincent-Bonnieu, S.; Rossen, W.R. CT coreflood study of foam flow for enhanced oil recovery: The effect of oil type and saturation. Energy 2019, 188, 116022. [Google Scholar] [CrossRef] [Scilit]
- Wen, Y.; Lai, N.; Du, Z.; Xu, F.; Zhang, X.; Han, L.; Yuan, L. Application of orthogonal experiment method in foam flooding system composition and injection parameter optimization. J. Pet. Sci. Eng. 2021, 204, 108663. [Google Scholar] [CrossRef] [Scilit]
- Zhang, S.; Jiang, G.-C.; Wang, L.; Guo, H.-T.; Tang, X.-G.; Bai, D.-G. Foam flooding with ultra-low interfacial tension to enhance heavy-oil recovery. J. Dispers. Sci. Technol. 2014, 35, 403–410. [Google Scholar] [CrossRef] [Scilit]
- Rossen, W.R.; van Duijn, C.J.; Nguyen, Q.P.; Shen, C.; Vikingstad, A.K. Injection strategies to overcome gravity segregation in simultaneous gas and water injection into homogeneous reservoirs. SPE J. 2010, 15, 76–90. [Google Scholar] [CrossRef] [Scilit]
- Spirov, P.; Rudyk, S. Testing of Snorre Field foam assisted water alternating gas (FAWAG) performance in new foam screening model. Oil Gas Sci. Technol.–Rev. Energ. Nouv. 2015, 70, 1025–1033. [Google Scholar] [CrossRef] [Scilit][Green Version]
- Zhang, Y.; Nie, J.; Gong, H.; Li, G.; Zhang, Q. Numerical simulation of nitrogen foam composite flooding in water flooding reservoir. In International Conference on Computational Modeling, Simulation, and Data Analysis (CMSDA 2021); SPIE: Bellingham, WA, USA, 2022; Volume 12160. [Google Scholar] [CrossRef] [Scilit]
- Tripathi, R.; Kulkarni, S.D. Effect of different foam injection parameters on overall CO2 storage potential using APG and CTAB surfactant formulation. Int. J. Greenh. Gas Control 2025, 146, 104448. [Google Scholar] [CrossRef] [Scilit]
- Hu, Y. Numerical Simulation and Multi-Parameter Optimization of Nitrogen-Foam Flooding. Master’s Thesis, China University of Geosciences (Beijing), Beijing, China, 2024. [Google Scholar]
- Lyu, X.; Voskov, D.; Rossen, W.R. Gravity segregation with CO2 foam in heterogeneous reservoirs. In Proceedings of the IOR 2021—21st European Symposium on Improved Oil Recovery, Online, 19–22 April 2021; pp. 1–16. [Google Scholar] [CrossRef] [Scilit]
- Su, Y.; Jiang, M.; Meng, F.; Zhan, S.; Sheng, G.; Chen, Y. Flow modelling of CO2 foam flooding in low permeability reservoirs based on fractional flow function. J. Shenzhen Univ. Sci. Eng. 2018, 35, 187–196. (In Chinese) [Google Scholar] [CrossRef] [Scilit]

Disclaimer/Publisher’s Note: The statements, opinions and data contained in all publications are solely those of the individual author(s) and contributor(s) and not of MDPI and/or the editor(s). MDPI and/or the editor(s) disclaim responsibility for any injury to people or property resulting from any ideas, methods, instructions or products referred to in the content. |
© 2026 by the authors. Licensee MDPI, Basel, Switzerland. This article is an open access article distributed under the terms and conditions of the Creative Commons Attribution (CC BY) license.