


Abstract
The Republic of the Congo is facing significant challenges in terms of access to electricity, particularly in the extensive rural and remote areas. A reliable assessment of solar resources and photovoltaic (PV) potential is needed to support the development of decentralized sustainable energy solutions. This study evaluates the potential for photovoltaic electricity production in Brazzaville based on in situ radiation measurements. The potential was extended across the country using satellite data from SolarGIS through calibration, although this requires further validation of satellite data in certain transition zones, ranging from the southern savannas to the dense equatorial forests in the north of the country. Measurements taken over a year at the Cité Scientifique de Brazzaville using LP02 and CS300 pyranometers were compared to SolarGIS estimates using statistical performance indicators. There is better agreement between these sensors, with R2 = 0.80 and an RMSE = 0.47 kWh/m2/day. However, we observed between the SolarGIS data and the LP02 measurements an R2 = 0.91 and an RMSE = 0.17 kWh/m2/day (3.8%), whereas with the CS300 we obtained R2 = 0.77 and RMSE = 0.59 kWh/m2/day (14%), which shows a better performance of LP02 compared with CS300. In terms of photovoltaic energy production, the average photovoltaic solar yield was estimated at 3.9 kWh/kWp/day for the LP02 and 3.5 kWh/kWp/day for the CS300, with an annual yield of approximately 1424 kWh/kWp for the LP02, corresponding to estimated discrepancies in photovoltaic production of 0.14 kWh/kWp/day. Based on this, we estimated that a 50 kWp photovoltaic solar system would produce approximately an annual power of 71,200 kWh, which would supply 285 households for a village. These results confirm both the significant potential of solar photovoltaics for decentralized rural electrification and the usefulness of calibrated SolarGIS data for assessing solar resources in areas with limited site-level data. These efforts align well with the planning and investment needs deployed by the Republic of Congo to ensure sustainable electrification of rural areas (PND 2022–2026; National Energy Pact (NEP) and Mission 300).
1. Introduction
The global energy system is currently undergoing a profound transformation aimed at achieving more sustainable energy systems. The energy transition increasingly involves a gradual shift away from non-renewable sources toward renewable and environmentally friendly generation, with considerable economic and social implications [1]. The development of renewable energy sources is not only regarded as being an important pathway to achieving Sustainable Development Goal 7 ‘access to affordable, reliable, sustainable and modern energy for all’, but also as a means for reducing greenhouse gas emissions and decreasing dependence on fossil fuels, particularly in the context of international climate commitments [2]. Achieving an effective and inclusive energy transition requires realistic decarbonization strategies that account for differences among countries in terms of technological capabilities, economic conditions, and development priorities [3]. Moreover, especially for communities that lack access to electricity, the transition toward low-carbon energy systems can also contribute to broader sustainable development objectives, including environmental protection, economic development, and social well-being [4].
In the context of the rapidly increasing energy demand in Africa, there is a pressing need to meet both future energy needs and to generate electricity sustainably [5,6,7]. Current energy research in Africa converges on a common concern: the imbalance between energy supply and demand in Africa [6], a gap that is projected to widen significantly in the near future [8]. For instance, a study conducted in Ghana examined the role of renewable energy in diversifying the national energy mix to meet rising demand, largely driven by sustained economic growth. Additionally, energy imports continue to negatively impact national economies even though previous research [9] has demonstrated a unidirectional causality between economic growth and energy consumption. Taken together, these environmental, social, and economic drivers highlight the need for alternative energy sources that are both sustainable and economically viable.
In the Republic of the Congo, improving access to reliable and affordable electricity remains an important challenge for financially achievable sustainable development. Although electricity access has increased over time, significant disparities persist between urban and rural areas, with an electricity access rate of approximately 67% for the urban population compared with only 12.4% for the rural population. This persistent urban–rural gap highlights the need to expand electricity infrastructure while developing decentralized energy solutions for communities that remain inadequately served by the national electricity grid. Recent initiatives aimed at improving electricity access and strengthening the electricity sector further demonstrate the importance attached at the national level to energy access and energy infrastructure development [10]. This substantial energy availability positions solar power as a viable option for decentralized generation in remote rural communities and for reducing dependence on fossil fuels in the Republic of the Congo.
Electricity generation in the Republic of the Congo is mainly from natural gas power plants (~500 MW) and, to a lesser extent, from hydroelectricity (~250 MW). However, this capacity is insufficient to meet the country’s growing energy needs and requires transmission infrastructure to reach all potential users. Consequently, the government of the Republic of the Congo is considering, as part of a national project, making production investments for an installed capacity of at least 2953 MW using renewable energy sources (hydroelectricity, solar, biomass, etc.). Within this plan, photovoltaic solar power plants will produce 89.5 MW by 2030, thereby requiring an accurate evaluation of the solar potential of the Republic of the Congo [11].
The ambition to develop the renewable energy sector dates back to 2010, followed in 2017 by a second national policy letter that reformed the public electricity sector. Finally, the latest, adopted in 2025, paves the way for planning access to modern, clean, and affordable energy in the isolated rural areas of Congo. This policy supports the National Development Plan (NDP) 2022–2026, which was approved by Law n°3-2022 of 14 January 2022. This document explicitly integrates rural electrification as a lever for agricultural, social, and territorial development, particularly through its sub-programs on “energy and agricultural hydraulics” for the electrification and irrigation of production basins [12].
Indeed, the National Energy Pact (NEP) and the Mission 300 initiative serve as benchmarks and evidence that rural electrification through solar solutions and investments in off-grid systems in the Republic of Congo will be national objectives to be achieved by 2030. Congo aims to increase the electricity access rate, currently at 32%, to 81%, with 90% in urban areas and 50% in rural areas, focusing on localities with more than 1000 inhabitants. This will require approximately 79,000 additional rural connections, or 16,000 connections per year. Regarding the specific role of solar energy, the NEP is unequivocal: access to electricity in rural areas will be achieved through autonomous solar systems (90%) and through mini-grids (10%). This provision grants photovoltaic solar technology the status of a privileged and almost exclusive technology for the electrification of isolated rural areas in the Republic of the Congo. Furthermore, the Government is committed to maintaining its share of renewable energies at 33% through investments in hydropower and autonomous solar systems, and to strengthening and modernizing the electricity transport and distribution infrastructure. In terms of financing, the public sector is expected to invest $3276 million by 2030 in off-grid solar systems, mini-grids, and clean cooking, with an effort shared equally. The total financing amounts to $11.543 billion, with 71.6% from private sources and 28.4% from public sources [13].
Despite this considerable potential and strong policy commitment, reliable ground-based measurements of solar radiation remain scarce in the Republic of the Congo. The limited availability of long-term, high-quality in situ observations constitutes an important constraint for better characterizing the solar resource and supporting the planning and development of photovoltaic projects. In regions where ground measurements are sparse, satellite-derived databases such as SolarGIS provide valuable information on the spatial and temporal distribution of solar radiation and can therefore support preliminary solar-resource assessment. However, the accuracy of satellite-derived estimates may vary according to geographical location, atmospheric conditions, temporal resolution, and the characteristics of the underlying models. Consequently, systematic validation against ground-based observations is necessary before such datasets are used for detailed energy planning and PV system design.
Numerous studies have undertaken such validation efforts. For example, in [14], the authors conducted a calibration study comparing satellite estimates with pyranometer data at two sites in Puerto Rico, reporting strong agreement (R2 = 0.83–0.88). Similarly, in [15], the authors evaluated eight satellite-based solar radiation products across Central Africa, finding a general overestimation by satellite data but also showing that satellite estimates outperformed reanalysis products such as ERA-5 for both interannual and sub-daily timescales. Further, comparisons between CLARA-A1 and CLARA-A2 satellites revealed average absolute deviations of 8 W/m2 [16], while in [17], the authors validated MERRA-2 satellite products using data from 37 ground stations, with deviations of around 5 W/m2 under clear-sky conditions. These studies primarily assessed daily and monthly solar radiation performance at regional and national levels.
Amine Ouhechou et al. estimated for the first time the spatial and temporal patterns of incoming solar radiation in Central Africa, comparing eight gridded products (namely CERES-EBAF, CERES-SYN1deg, TPDC, CMSAF SARAH-2, CMSAF CLARA-A2, CAMS-JADE satellite products), as well as ERA5 reanalysis and WorldClim 2 interpolated measurements) and station-based estimates (FAOCLIM 2) or measurements. There is no BSRN (Baseline Surface Radiation Network) station in Central Africa. The only indirect estimates or direct measurements derived from in situ measurements available for the region are the ones provided in the FAOCLIM 2 database and those collected from a few ecological observatories [15]. Comparatively, in other regions, previous studies have shown that the validation of satellite data for global horizontal irradiance (GHI) strongly depends on the climatic context, the temporal scale, and the availability of local measurements [18,19,20,21,22,23,24,25].
To address this gap, as part of the ACERA (Africa Clean Energy Research Alliance) project, we deployed these two types of pyranometers—LP02 (ISO secondary-class thermopile pyranometer) and CS300 (silicon-based pyranometer)—at the Scientific City of Brazzaville for the acquisition of high-quality in situ GHI measurement data. While several studies have validated SolarGIS and other satellite-derived irradiance products in different regions worldwide, few studies exist for Central Africa [26], and to our knowledge, none rely on continuous, high-quality ground measurements at both high temporal resolution and monthly scales.
The originality of this study lies in three main aspects: (i) the first long-term, continuous in situ GHI dataset in the Republic of the Congo, a region critically lacking ground-based solar observations; (ii) an in-depth analysis of sensor-dependent uncertainties in a tropical climate; (iii) the quantification of the impact of irradiance deviations on photovoltaic energy production, which provides operational insights for PV planning and mini-grid deployment. These contributions, together with a multi-temporal validation framework (15 min and monthly scales), represent a methodological and applied advancement over previous validation studies.
The present study uses ground-based measurements obtained with LP02 and CS300 pyranometers at the Institut National en Sciences Exactes et Naturelles (IRSEN) site in Brazzaville department and compares them with SolarGIS data corresponding to the same observation period. The analysis focuses on the characterization of global horizontal irradiance, the assessment of agreement between in situ and SolarGIS datasets using statistical performance indicators, and the estimation of the potential photovoltaic energy production.
The results are therefore intended to contribute to the transformation of national energy and rural-electrification objectives into a technical decision-support framework consistent with Sustainable Development Goal 7 (SDG 7) and the country’s commitments to the energy transition. More specifically, the study is expected to provide localized knowledge of the solar resource, improve the reliability of global solar radiation estimates, support the sizing of photovoltaic systems, and contribute to estimating the number of potential users that could be supplied by PV-based electricity systems.
The main objective of this study is to validate solar data obtained from remote sensing for the development of photovoltaic power generation systems in the Republic of the Congo, particularly in rural areas located far from the nearest connection points to the main electricity grid. Consequently, remote sensing enables the estimation of solar potential in areas where on-site measurements are impractical, particularly in remote rural regions. In locations where ground-based data are available for validation, these comparisons could also help quantify the margin of error between satellite-derived estimates and in situ measurements. By exploiting these errors, it is possible to assess the potential photovoltaic power in these regions and the number of users.
2. Materials and Methods
2.1. Measurement Site
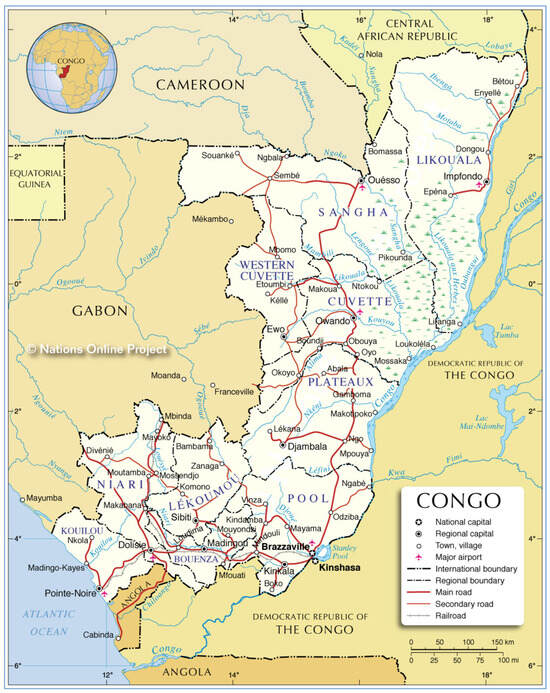
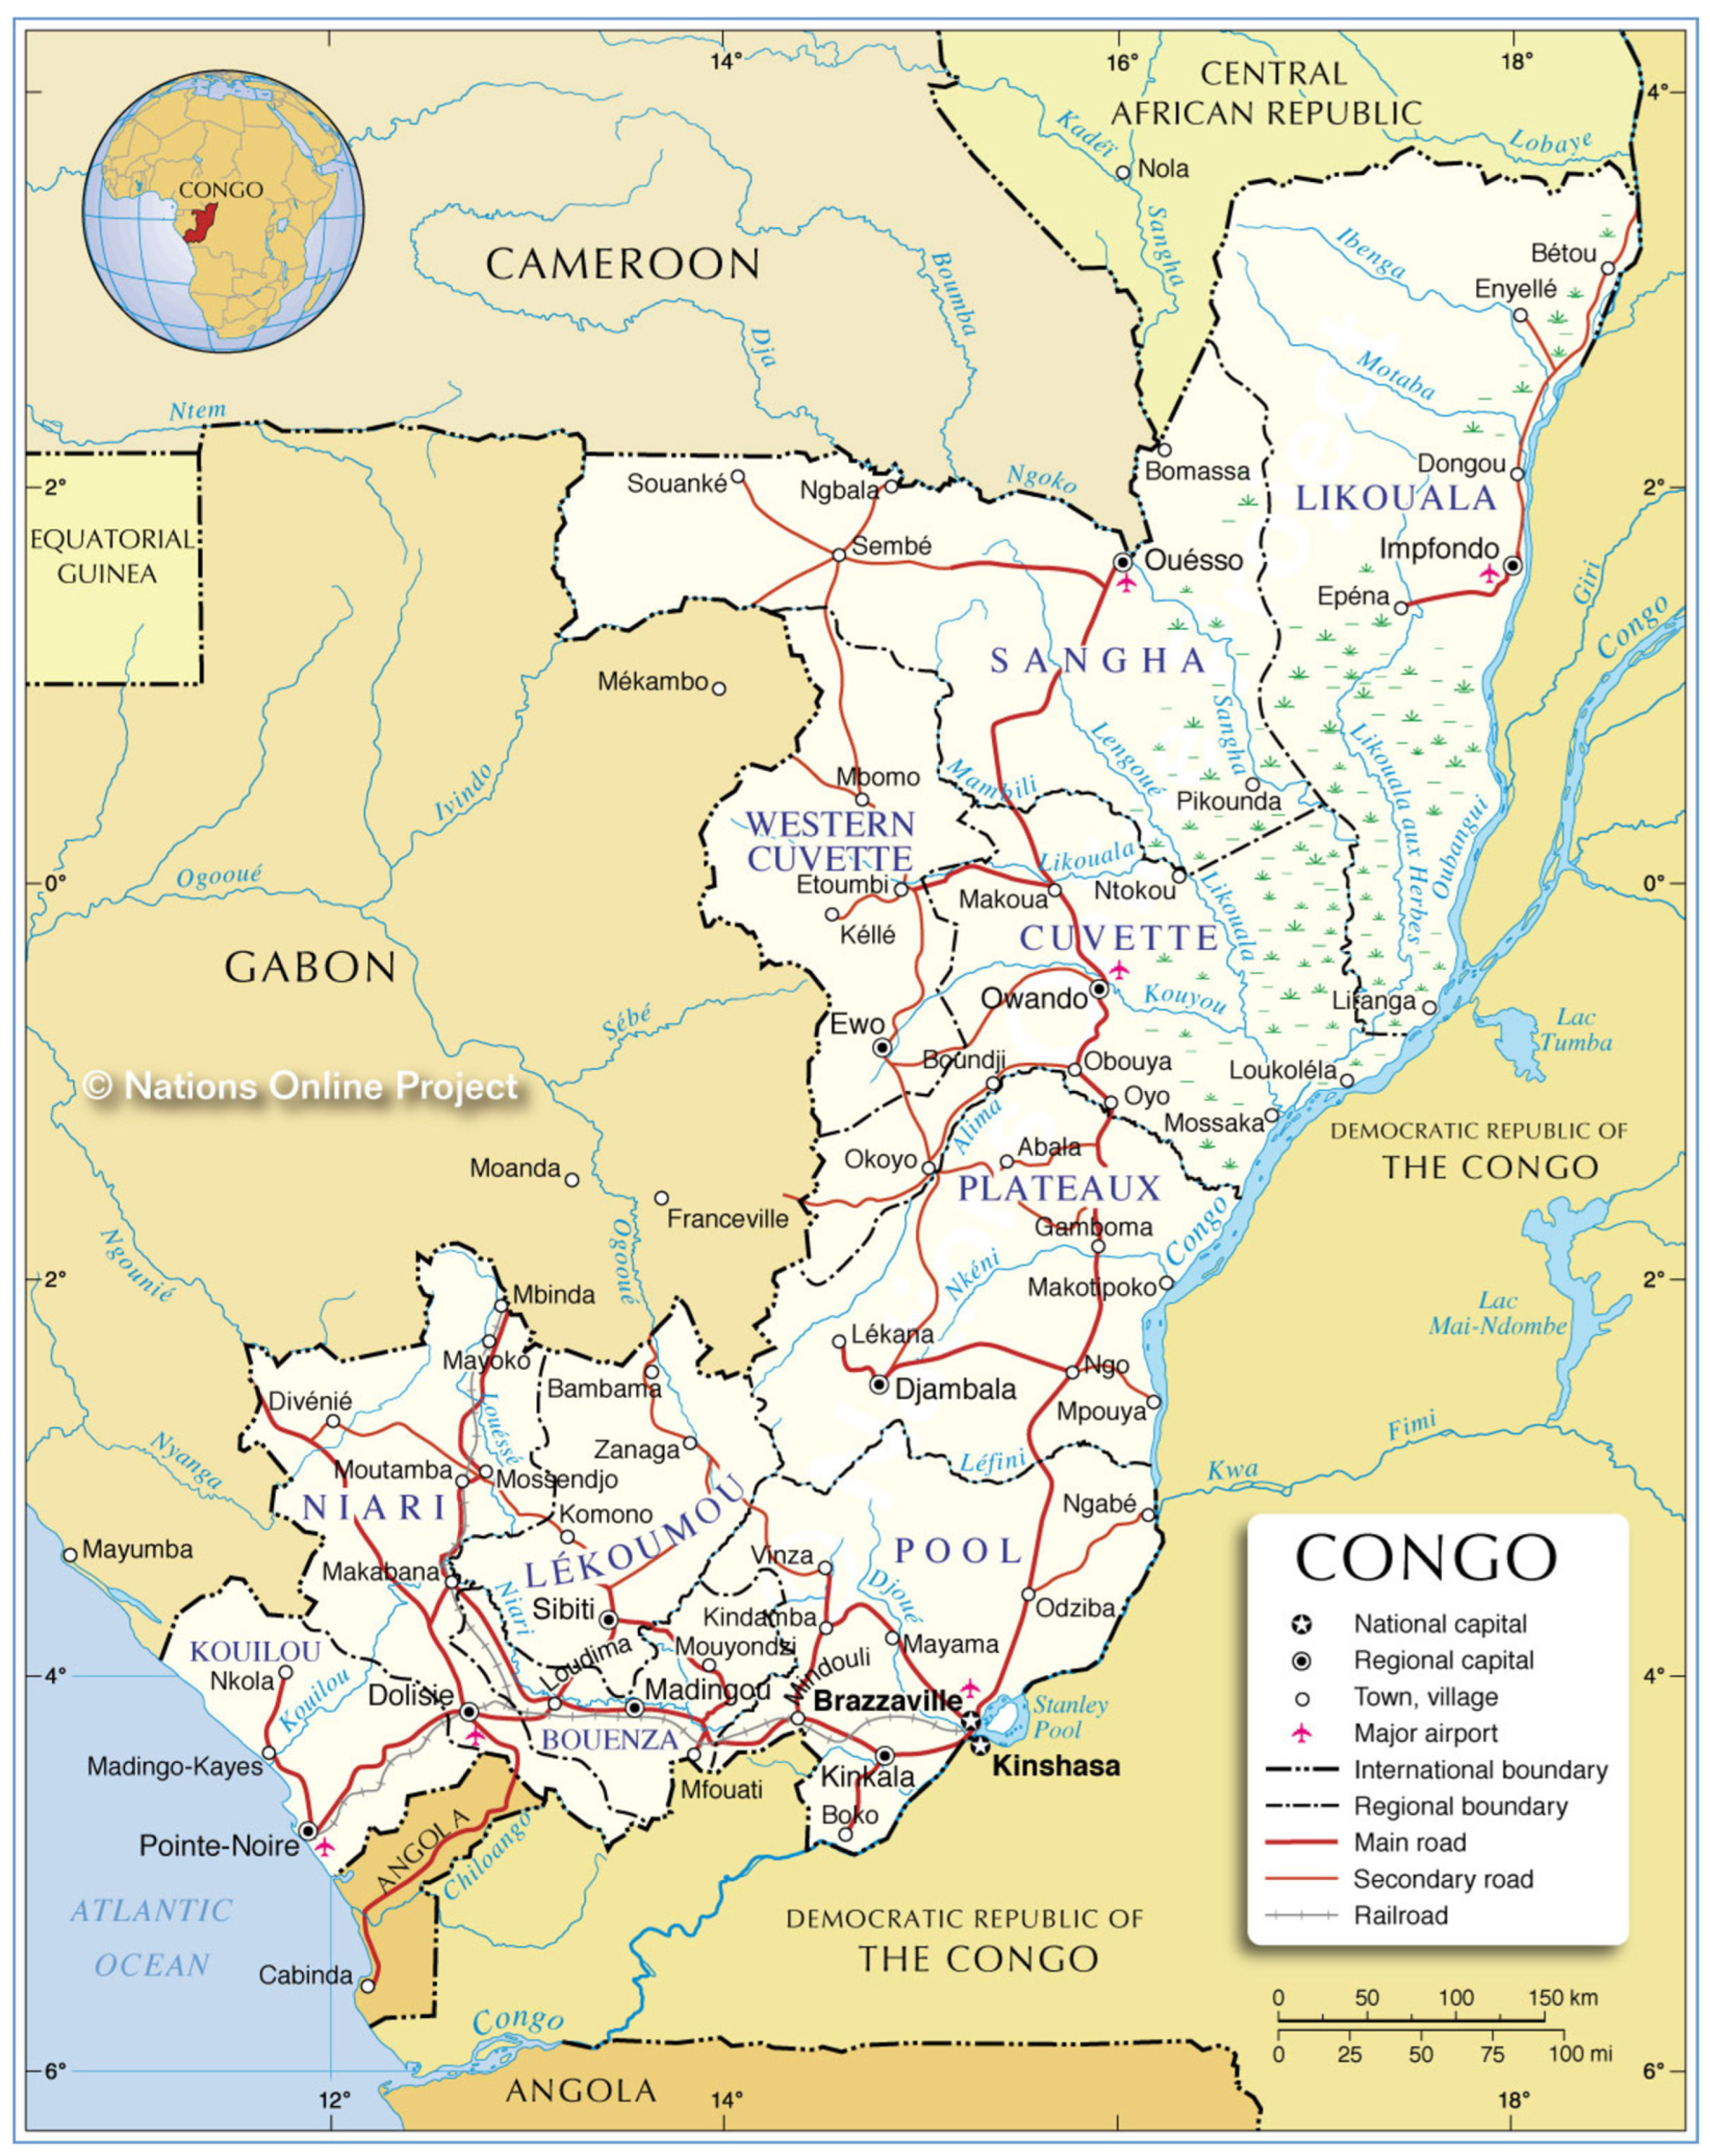
The study area is located in the Republic of the Congo, a Central African country, bordered by the Central African Republic and Cameroon to the north, Angola to the south, the Democratic Republic of Congo to the east, and Gabon to the west, and crossed by the geographic equator (Figure 1). Its surface area is 342,000 km2 [27].
Figure 1.
Administrative map of the Republic of the Congo. Source: https://www.nationsonline.org/oneworld/map/congo-administrative-map.htm (accessed on 24 February 2025).
Savannah (35–40%) and forest (60–65%) are the main vegetation formations [28]. Congolese forests comprise 12.4% of the forests of the Congo Basin and are divided into three large groups: Mayombe (3%), Chaillu (11%), and the massif of North Congo with Upper Sangha (31%) and Lower Sangha (20%) [29,30,31].
From a climatic point of view, the Republic of the Congo experiences a rainy season in the north that lasts eight to nine months (from March to November) under an equatorial climate, while in the south, it lasts between five and six months (from March to May and September to November) under a tropical and humid climate [32].
Our study site is located in the Brazzaville Department, which is characterized by a tropical climate with two rainy seasons. The first occurs in the months of February–March–April–May and the second in October–November–December. These seasons alternate with two dry seasons: the first in January–February and the second in the months of June–July–August–September [33].
The average daily minimum temperature is around 22 °C, and the average daily maximum temperature varies around 30 °C. The temperature varies from one area to another due to changes in altitude, but it is relatively constant in this department throughout the year, at around 25 °C. Average annual rainfall in this department ranges from 1500 mm to 1800 mm, with high interannual variation [34].
The geographical location of the site and the meteorological conditions give it sufficient solar irradiance intensity for the development of solar energy systems [35]. However, this intensity varies depending on location, meaning its geographical coordinates (latitude and longitude), its atmospheric properties, its azimuth, and its angle of inclination in relation to the receiving surface [36].
2.2. Radiometric Stations
The solar radiation and air temperature monitoring station was installed on the rooftop of the “Institut National de Recherche en Sciences Exactes et Naturelles (IRSEN)” building, located within the Scientific City of Brazzaville. This site is near the Equator at 4.274° S and 15.238° E, at an elevation of 312 m above mean sea level. Brazzaville, through its university and research infrastructures, offers an excellent site for calibrating the SolarGIS data from satellites, though it is important to note that Brazzaville is not representative of the country’s solar potential, or even that of Central Africa.
Our protocol involves conducting in situ (or local) measurements to validate the solar radiation measurements from satellites, which have broad spatial and regional coverage. This allows us to extrapolate the validity of the satellite data to the solar potential of the entire country or to that of a region. If we had chosen another locality with electricity, calibration would still have been possible because the satellite provides observations at the geographical site level. The station’s location has an unobstructed view of the natural horizon from the southeast to the northwest, ensuring optimal exposure for solar radiation measurements. All sensors were mounted on a horizontal surface, in accordance with standard observational protocols.
2.3. Description of the Material
We used two pyranometers to gather data. The first is an LP02 pyranometer. This heat flux sensor was used for measuring GHI measurements (W/m2).
The specifications of these devices are shown in Table 1, where the spectral range of the LP02 sensor is larger than that of the CS300, and it is able to measure irradiance between 0 and 2000 W/m2, while the range of the CS300 is only 0 to 1750 W/m2.
Table 1.
Specifications of sensors.
LP02’s specific sensitivity is around 17.96 µV/(W/m2), and it is used as a reference pyranometer. The signal is amplified with a total measured gain of 102.2, corresponding to a response of 1.835512 V/kW/m2. The CS300 pyranometer was calibrated by comparison with the LP02 pyranometer. The temperature range of the LP02 pyranometer is between −10 and 40 °C (±3%). The second is the CS300 pyranometer, which includes a silicon photovoltaic detector mounted in a cosine-corrected head. It was used for GHI measurements (W/m2) and has an operating temperature range of −40 °C to +70 °C.
The calibration of the Hukseflux pyranometer (model LP02; Delft, The Netherlands) and the Apogee instruments (model CS300; Logan, UT, USA) was done by the manufacturer and carried out according to the international World Meteorological Organization (WMO) standards ISO 9060 [37] (WMO, Guide to Meteorological Instruments and Methods of Observation, fifth edition, Geneva and ISO 9060, 2008). Their long-term stability is guaranteed by four absolute pyrheliometers of different designs maintained by the World Radiation Center in Davos.
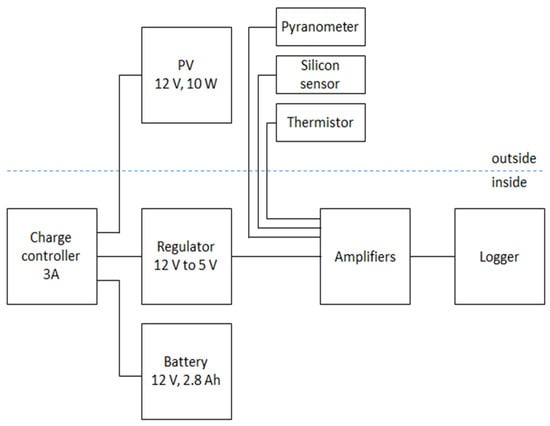
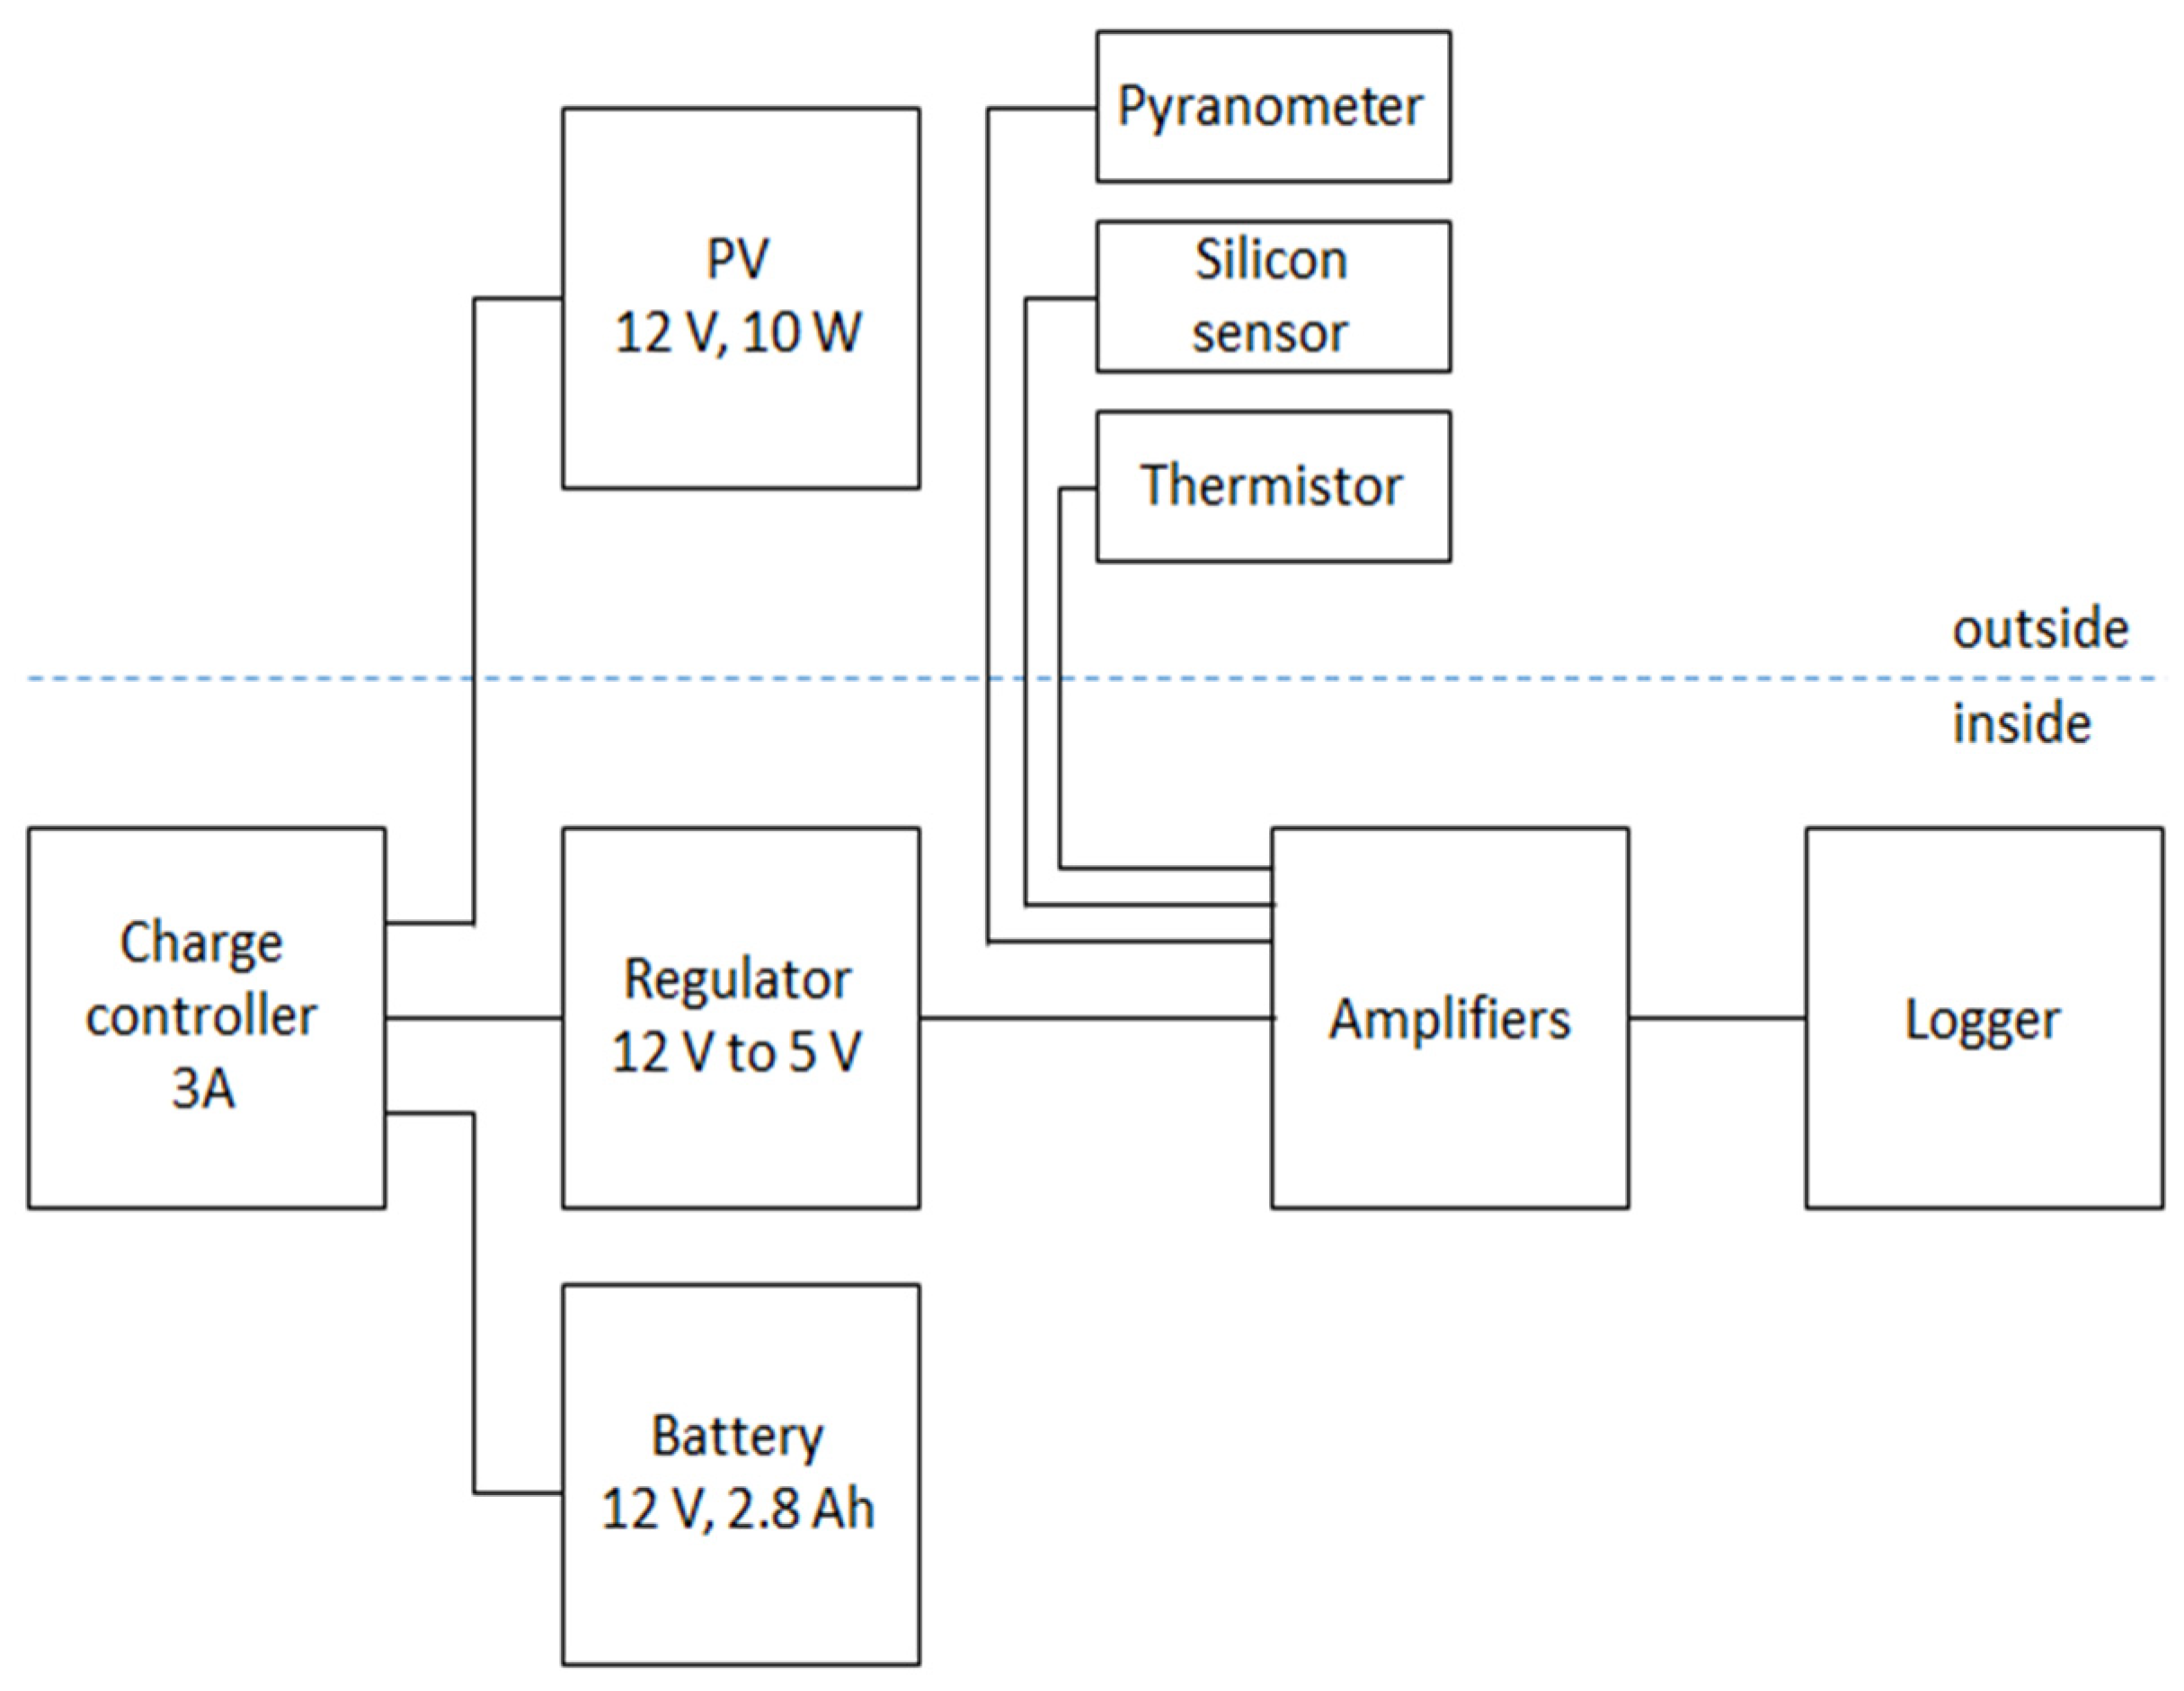
The two pyranometers were installed side by side on a flat surface for measuring GHI and were connected to a thermistor for air temperature measurements. The entire solar radiation and temperature measurement system was powered by a photovoltaic system that included a battery (12 V, 2.8 Ah), a solar panel (12 V, 10 W), a charge regulator (12 V to 5 V), and a 3 A charge controller, as shown in Figure 2.
Figure 2.
Block diagram of the devices. PV is a photovoltaic panel.
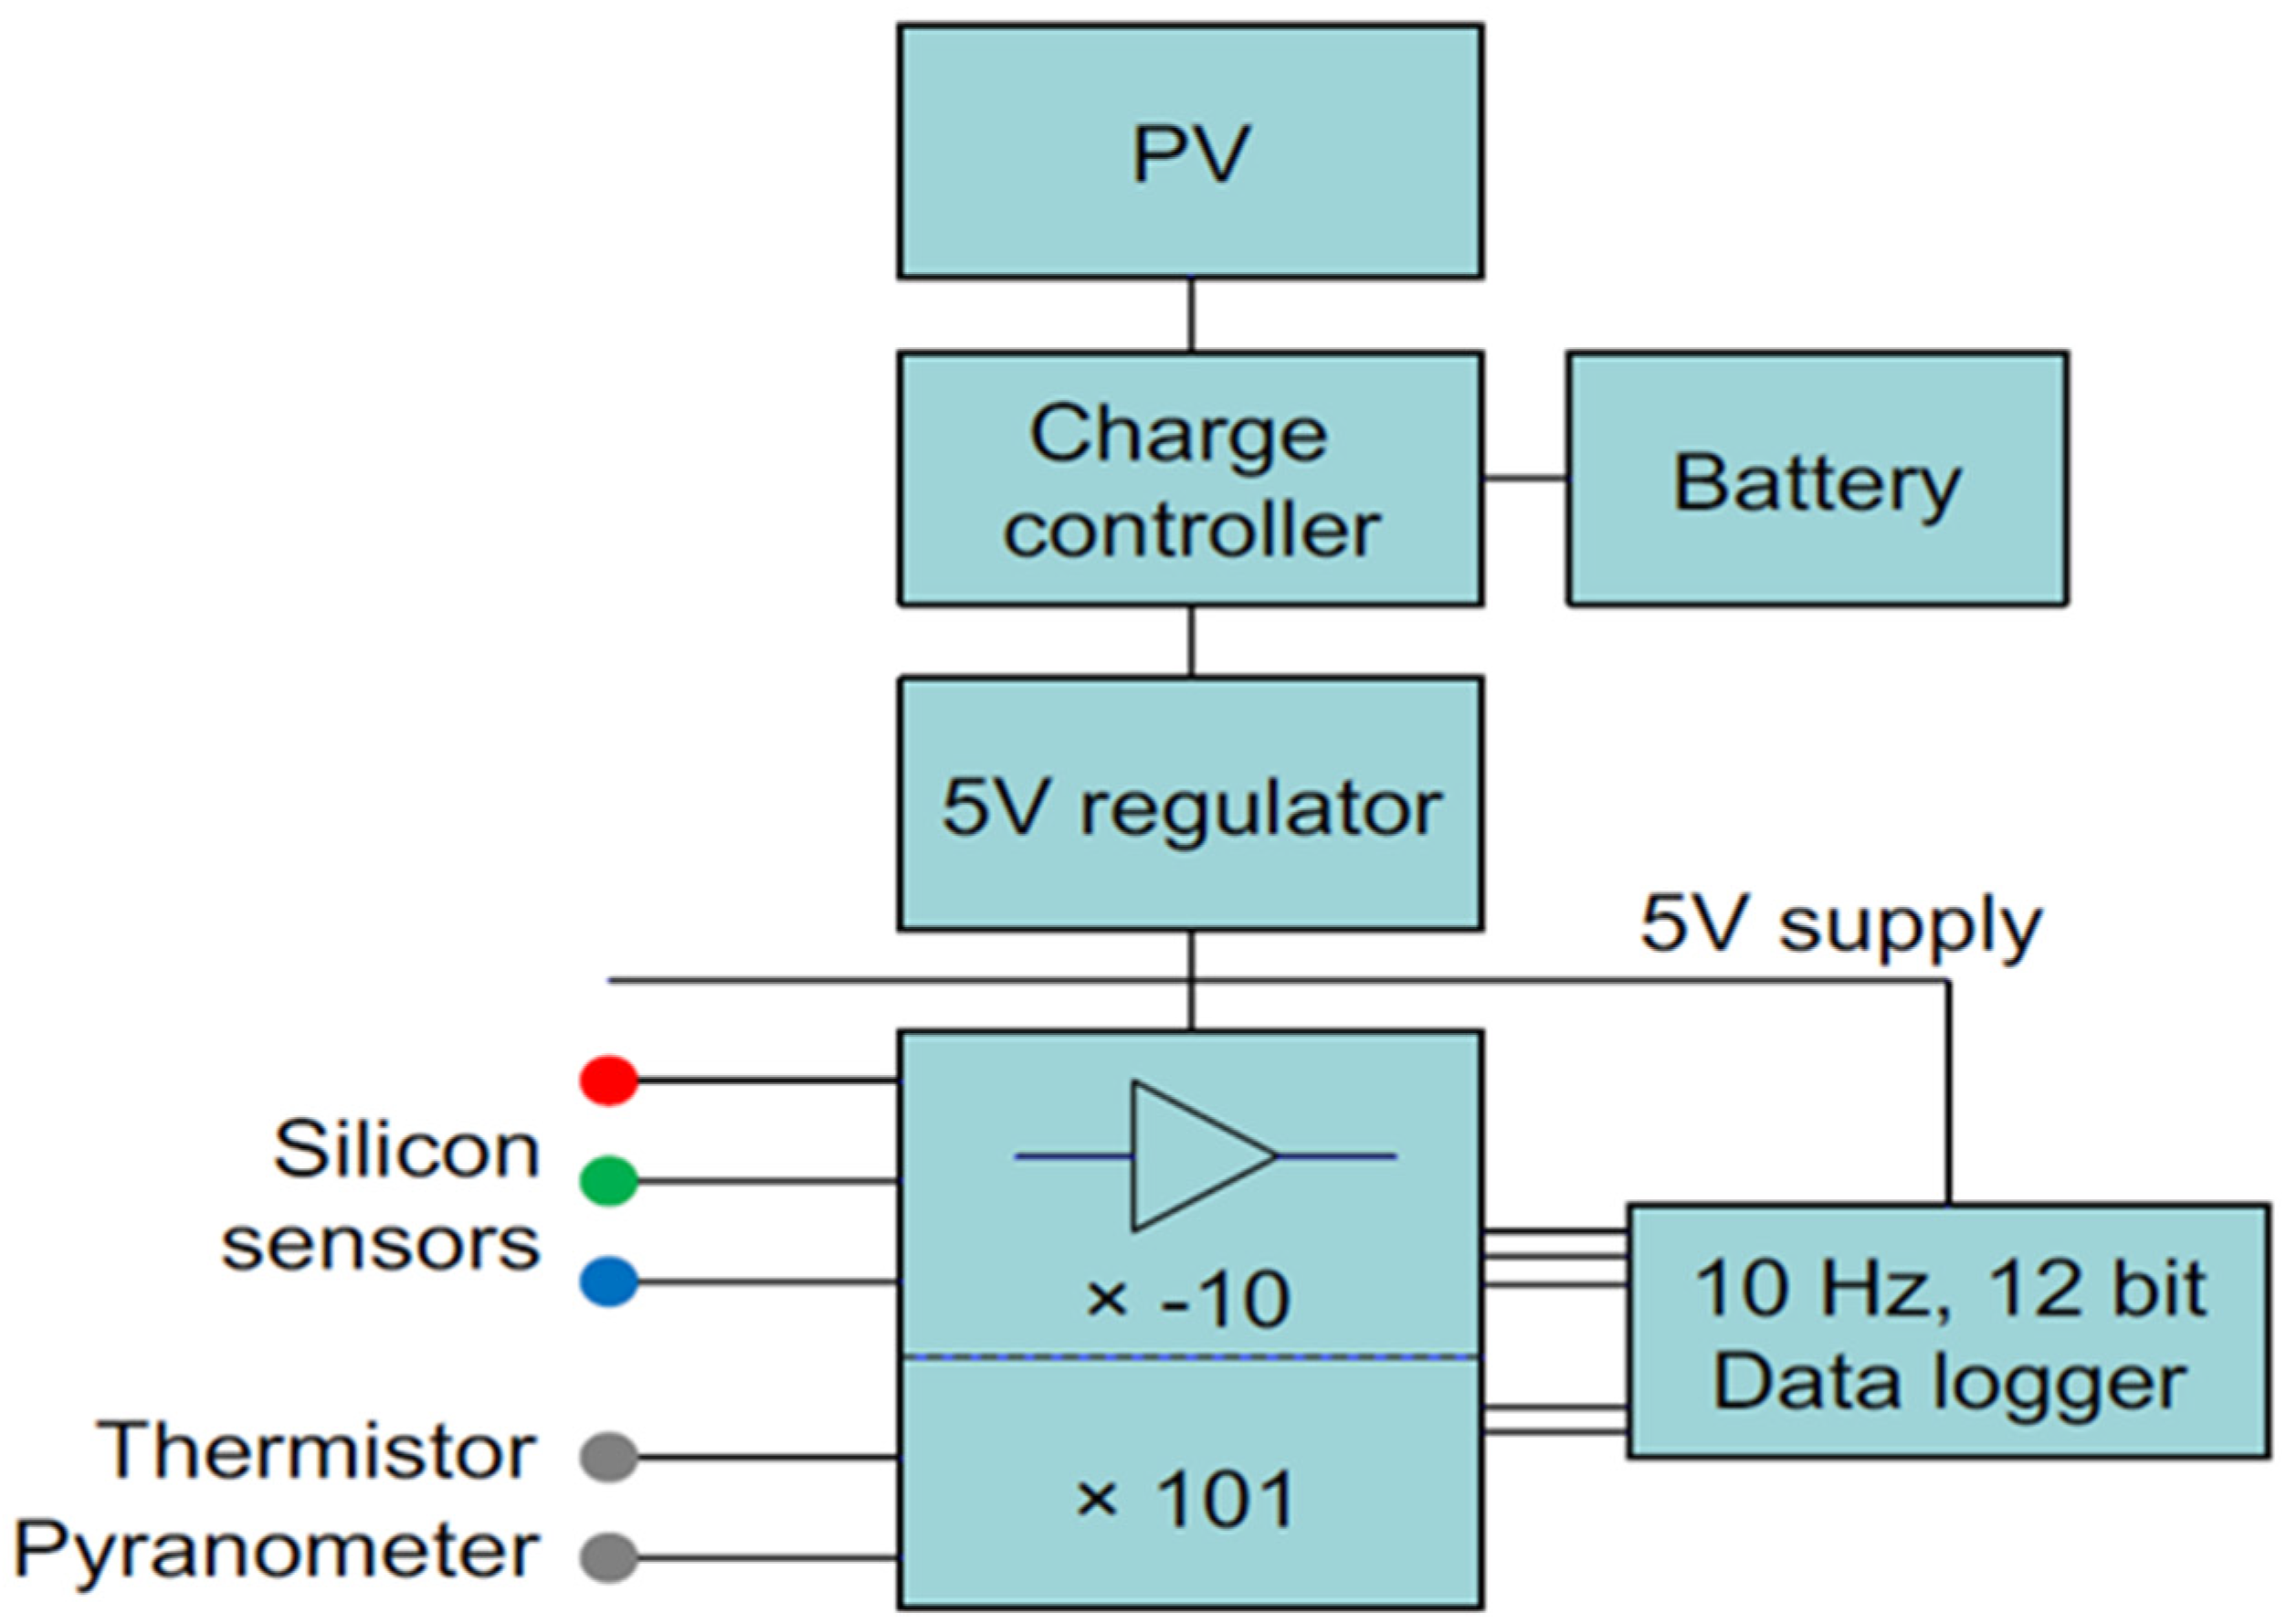
The details of the GHI monitoring station are shown in Figure 3, in which the characteristics of the amplifier and the data logger are presented. The three sensors were connected to a magnitude-10 data amplifier, and their signals were filtered and then sent to a Logmatic V2 data logger with a frequency of 10 Hz and a capacity of 12 bits. The signals detected by the LP02 pyranometer and the thermistor were amplified by a factor K = 101, while the signals detected by the CS300 silicon pyranometer were amplified by a factor of K= −10.
Figure 3.
Circuit for the monitoring station with sampling characteristics. Colors of cables of sensors depend of manufacturers to define the voltage excitation (often in red) and voltage sense (green) if specified. Source: Kampala Project (CREEC), University of Leeds.
The data logger measures the signals in voltage form and stores them on a memory card. Once the data were recorded, they were entered into a MATLAB code to represent the GHI data in Watts per square meter (W/m2) in graphical form.
The two pyranometers continuously recorded in situ measurements throughout the one-year monitoring period. The data retrieval from the data logger was performed at 10-day intervals, considering the high acquisition frequency of 10 Hz of the data logger coupled with the sensors. During these collections, the data stored on the memory card was transferred for processing. Thus, the 10-day interval corresponds to the data retrieval frequency, not the measurement frequency. The measurement system operated continuously, although some data gaps occurred during certain nighttime periods, mainly due to battery capacity. These nighttime interruptions did not affect the daytime GHI values. At the level of the annual time series, there were no missing data. On the other hand, in the monthly time series, we recorded a 1.4% rate of missing data due to technical issues with the electrical system. This means that the outage could last for one or 1.5 days. Thus, the daily data were canceled. The replacement of the data was done using linear interpolation.
The collected data were processed using MATLAB and Origin2018 software for plotting curves and performing statistical calculations on a daily scale. The averages over the one-month and one-year periods were then determined. The comparison of SolarGIS data measured in UTC + 0 time and that of the pyranometers in UTC + 1 time (Brazzaville) was carried out consistently. To resolve this discrepancy in the daily time series, they were realigned according to the sunrise and sunset times. As a result, the local time for data recording has been realigned to that of SolarGIS data recording, which is UTC + 0. Moreover, the SolarGIS data from 2022 has a temporal resolution of 15 min. To compare them with our continuous measurements from the pyranometers, we had to average them over each 15 min interval.
To conduct our monthly analysis, the in situ measurements from the pyranometers and those from processed SolarGIS were determined over the same period in 2022. Next, knowing that SolarGIS could provide us with data over two decades (1994–2015), that is, a long-term climatological average (a normal), we wanted to compare it with the data obtained from pyranometers.
On a diurnal scale, the averages were determined by calculating the area under the curve using the trapezoidal method with the Origin2018 software:
where h = b − a represents the time interval between sunrise and sunset.
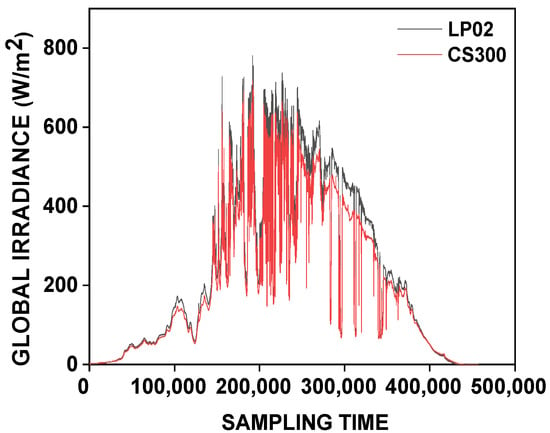
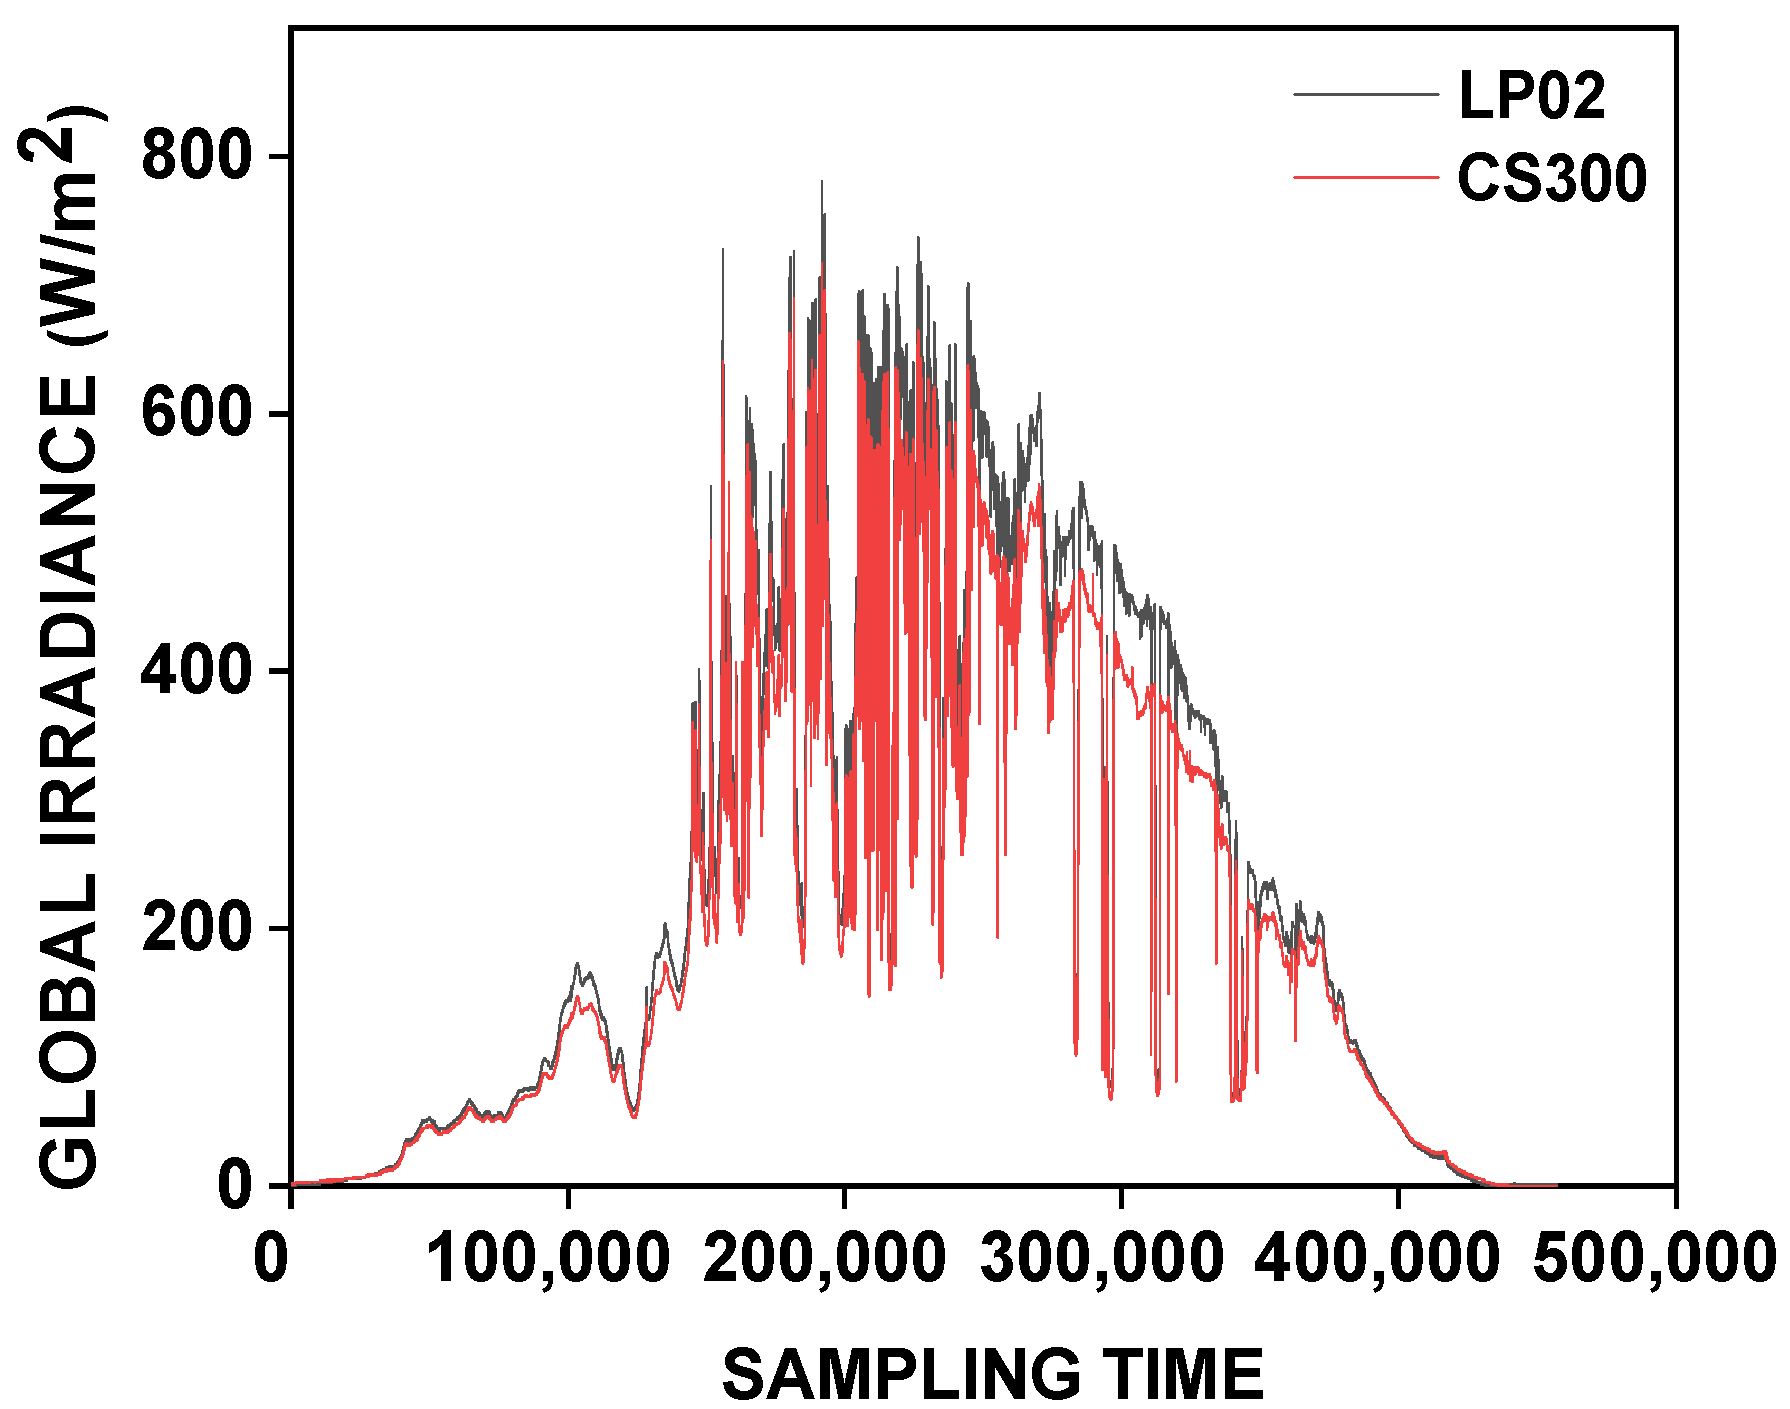
The GHI data in this study cover the period from 1 January to 31 December 2022. The mean values of GHI measurements derived from the two pyranometers (LP02 and CS300) constituted our surface database at diurnal, monthly, and annual scales. Quality control of the LP02 and CS300 sensors was performed to check the quality of the calibration during different levels of cloud cover by superimposing their curves at a diurnal scale (Figure 4). At the monthly time scale, we plotted the linear regression line to assess the correlation between the measurements of the two sensors. This check was necessary to determine the quality of the manufacturer’s calibration and its consistency during the measurement period.
Figure 4.
Illustration of the quality of the measurements of GHI measurements by the LP02 (black curve) and CS300 (red curve) sensors as a function of sampling time.
The interest at the country level is to determine the national solar potential. Measurements at a few locations are not representative of an entire territory. That is why we have examined the possibility of using satellite measurements validated with in situ measurements, such as those in our database.
To do this, we used data calculated from satellite observations from Meteosat MSG (Meteosat Second Generation, ((c) 2024 EUMETSAT, European Organization for the Exploitation of Meteorological Satellites), satellites managed by the NOAA and NASA agencies. These data, on diurnal and monthly time scales, have been made available to us through solar resources maps and GIS data (SolarGIS). The 15 min instantaneous GHI (W/m2) data from SolarGIS were compared with data measured on the ground by the LP02 and CS300 sensors at the same resolution to evaluate the consistency and performance of high-temporal-resolution data. We chose days with different cloud cover to determine the gaps between the satellite-estimated data and those measured by the LP02 and CS300 sensors on the ground. For the monthly analysis, the in situ measurements were first aggregated to the daily scale, then to the monthly scale, to calculate statistical indicators by comparing them to the monthly mean data provided by SolarGIS.
Equations (2)–(6) for the coefficient of determination (R2), mean bias error (MBE), root mean square error (RMSE), and mean absolute error (MAE) have been used in this study for the calibration and validation of surface data in order to understand their qualities and characteristics.
This evaluation methodology was used in the works carried out by [22,36,38].
where is the estimated GHI in month i, and is the measured GHI. (n) is the number of measurements.
The method used to evaluate solar radiation in this study can be transferred, but not the actual measured values because solar radiation depends on clouds, terrain, and aerosols. The satellite data are also affected by these factors, but there is a scale factor. This is why satellite measurements need to be validated on the ground. Once validated, we can then use the satellite measurements without having to take measurements at every point within the territory. Hence, there is interest in integrated satellite measurements for placing solar generation infrastructure in suitable locations.
3. Results
3.1. Quality Control of Measurements
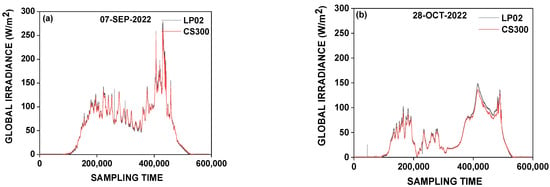
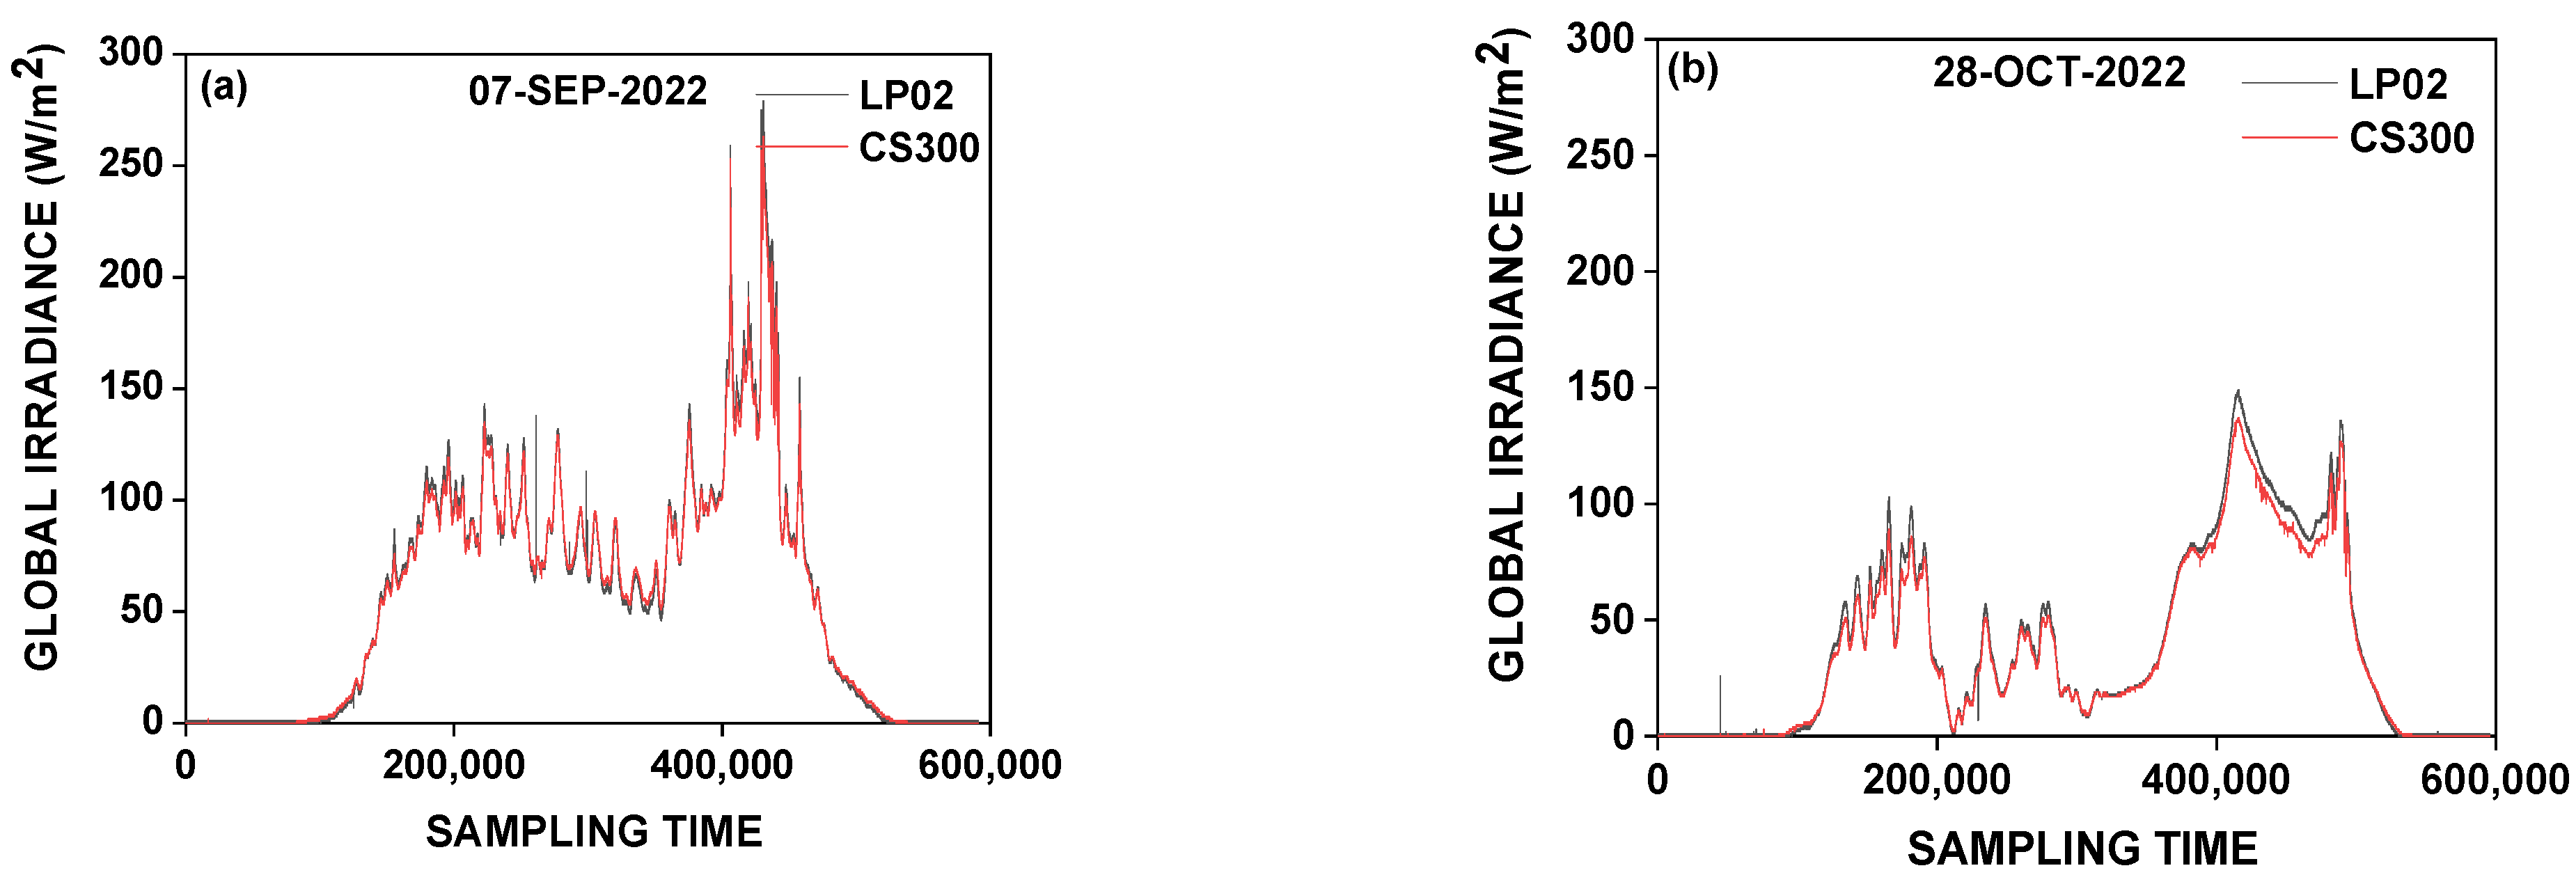
Figure 5 shows the measurements of the GHI observed by the two sensors to verify the regularity of the calibration (sensitivity of the instruments) using the case of a very cloudy sky on 7 September 2022 and 28 October 2022. The overlay of the GHI recordings from the two sensors displays almost identical energy levels for the same number of samples.
Figure 5.
GHI measured by LP02 (black curve) and CS300 (red curve) sensors under cases of heavy cloud cover for 7 September 2022 (a) and 28 October 2022 (b) during the rainy season, as a function of sampling time.
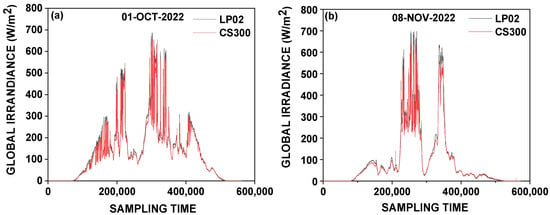
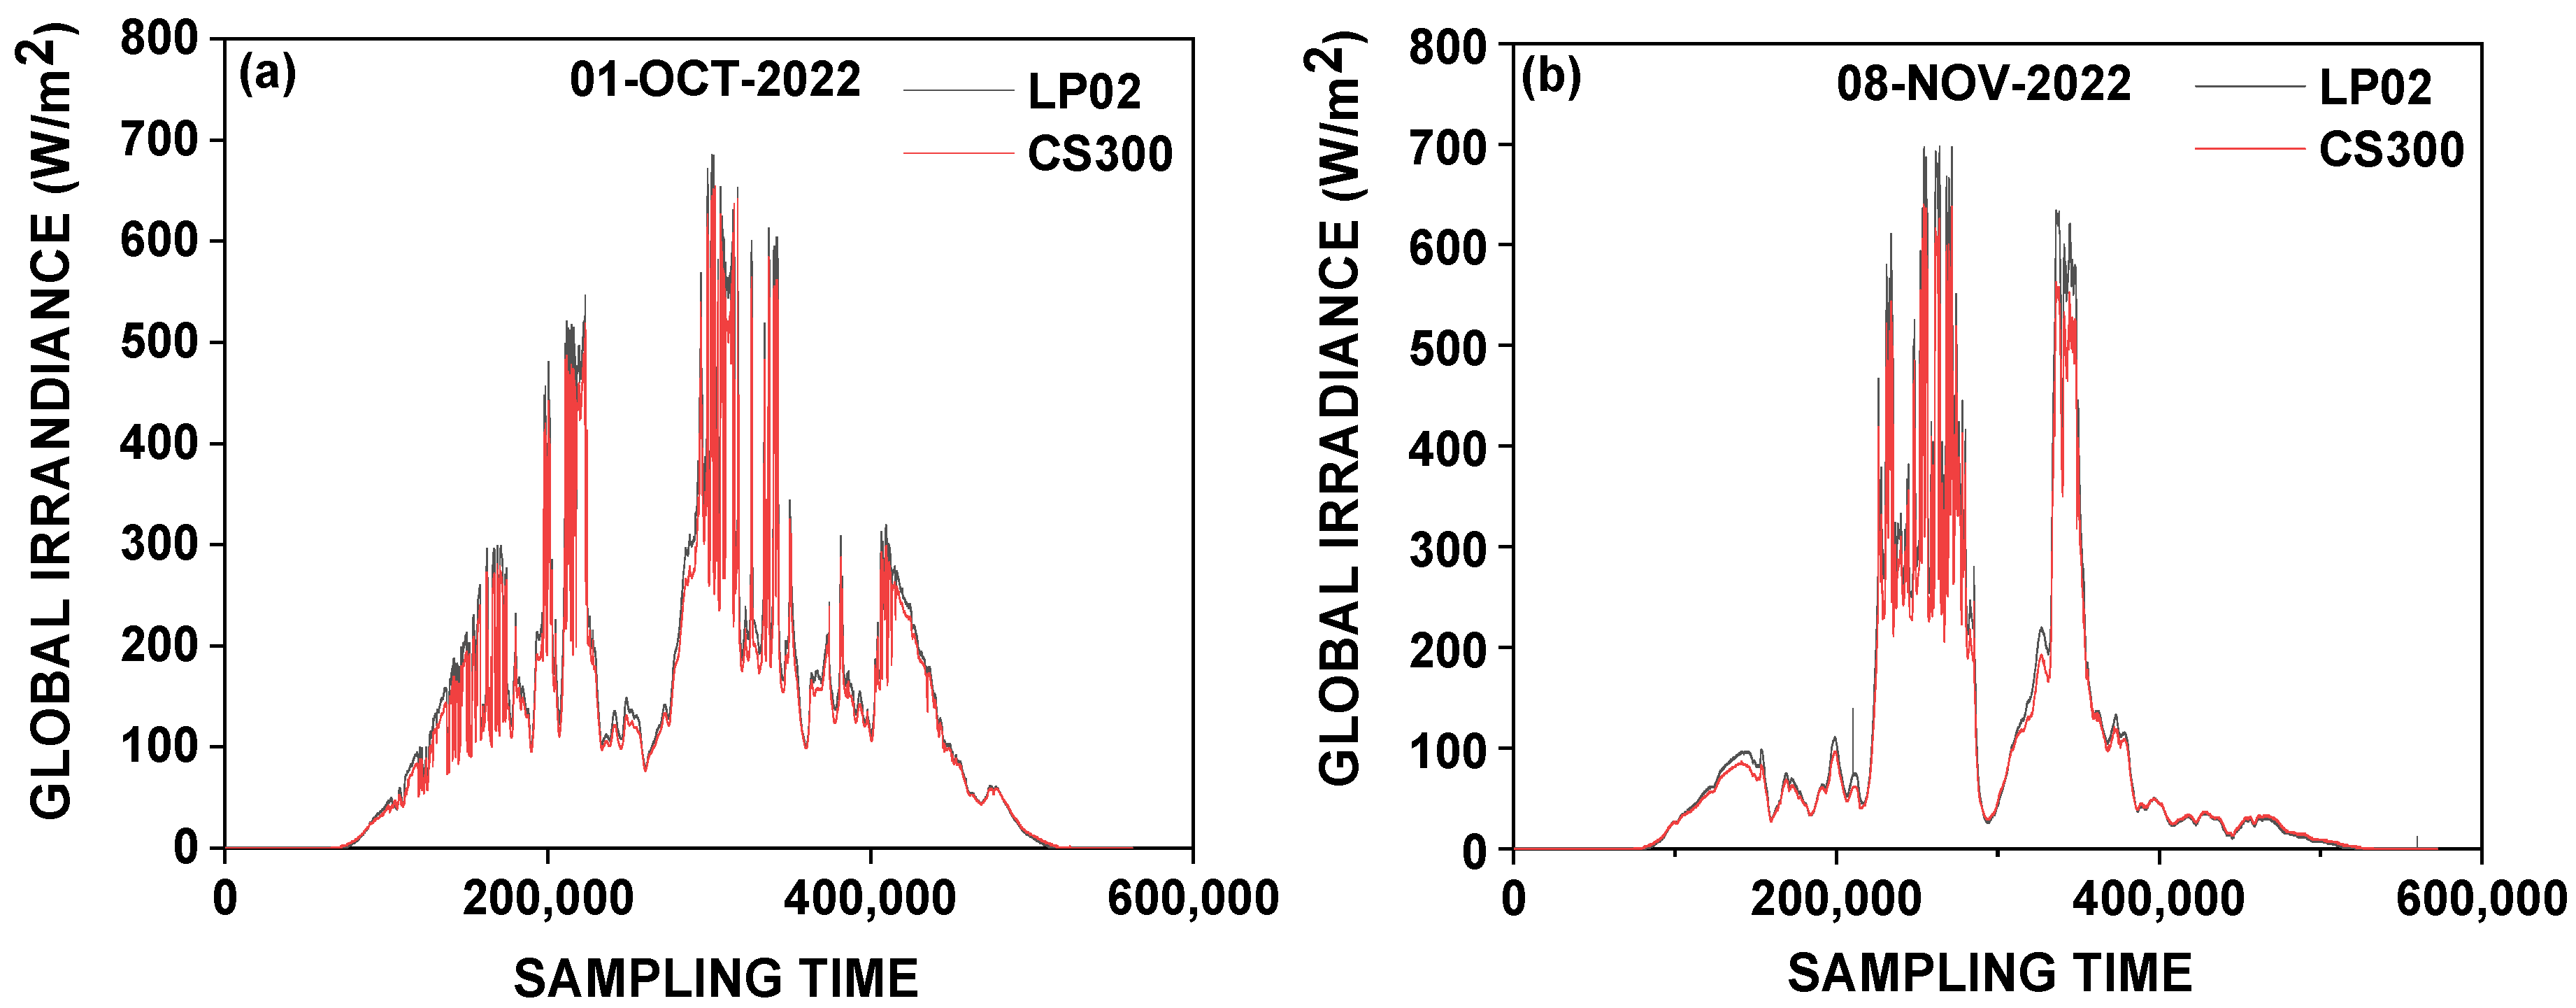
However, under a partially overcast sky as illustrated in Figure 6, differences are observed around midday (solar noon). The LP02 sensor recorded slightly higher GHI values than the CS300 sensor for the same number of samples, as on 1 October 2022 (Figure 6a) and 8 November 2022 (Figure 6b).
Figure 6.
GHI measured by LP02 (black curve) and CS300 (red curve) sensors under partly cloudy sky conditions for 1 October 2022 (a) and 8 November 2022 (b) during the rainy season as a function of sampling time.
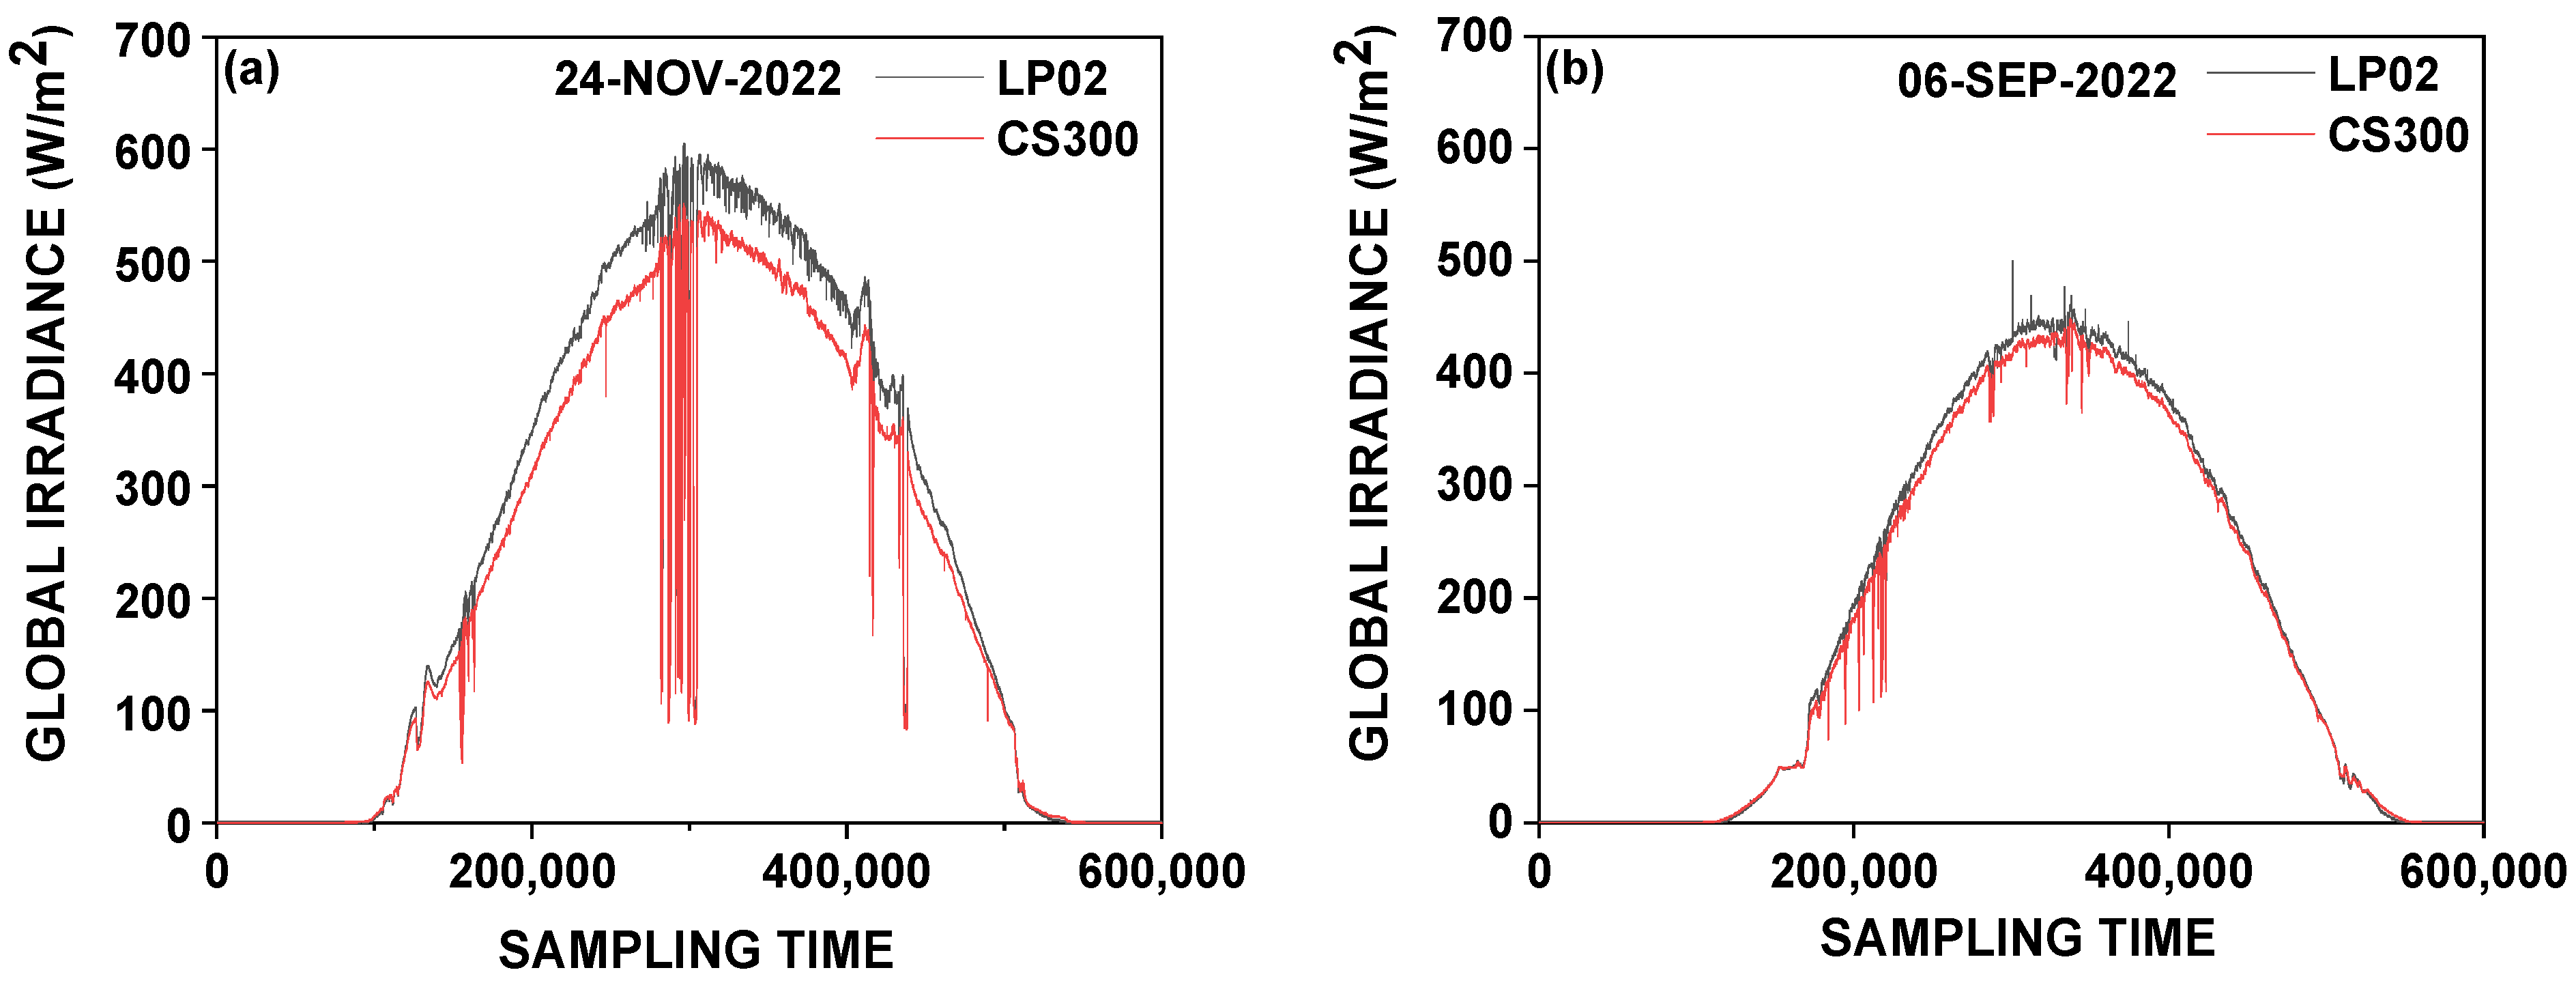
Figure 7 shows that the gaps between the two sensors increased with GHI at solar noon during clear-sky days on 24 November 2022 and 6 September 2022.
Figure 7.
GHI measured by LP02 (black curve) and CS300 (red curve) sensors under clear-sky cases on a day in November (a) and September (b) during the rainy season as a function of sampling time.
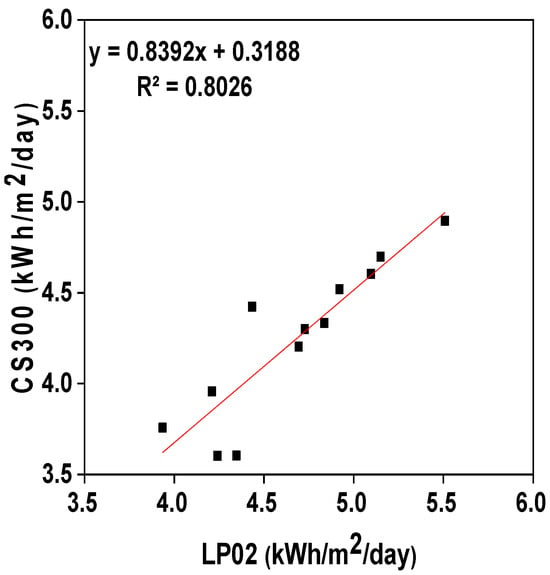
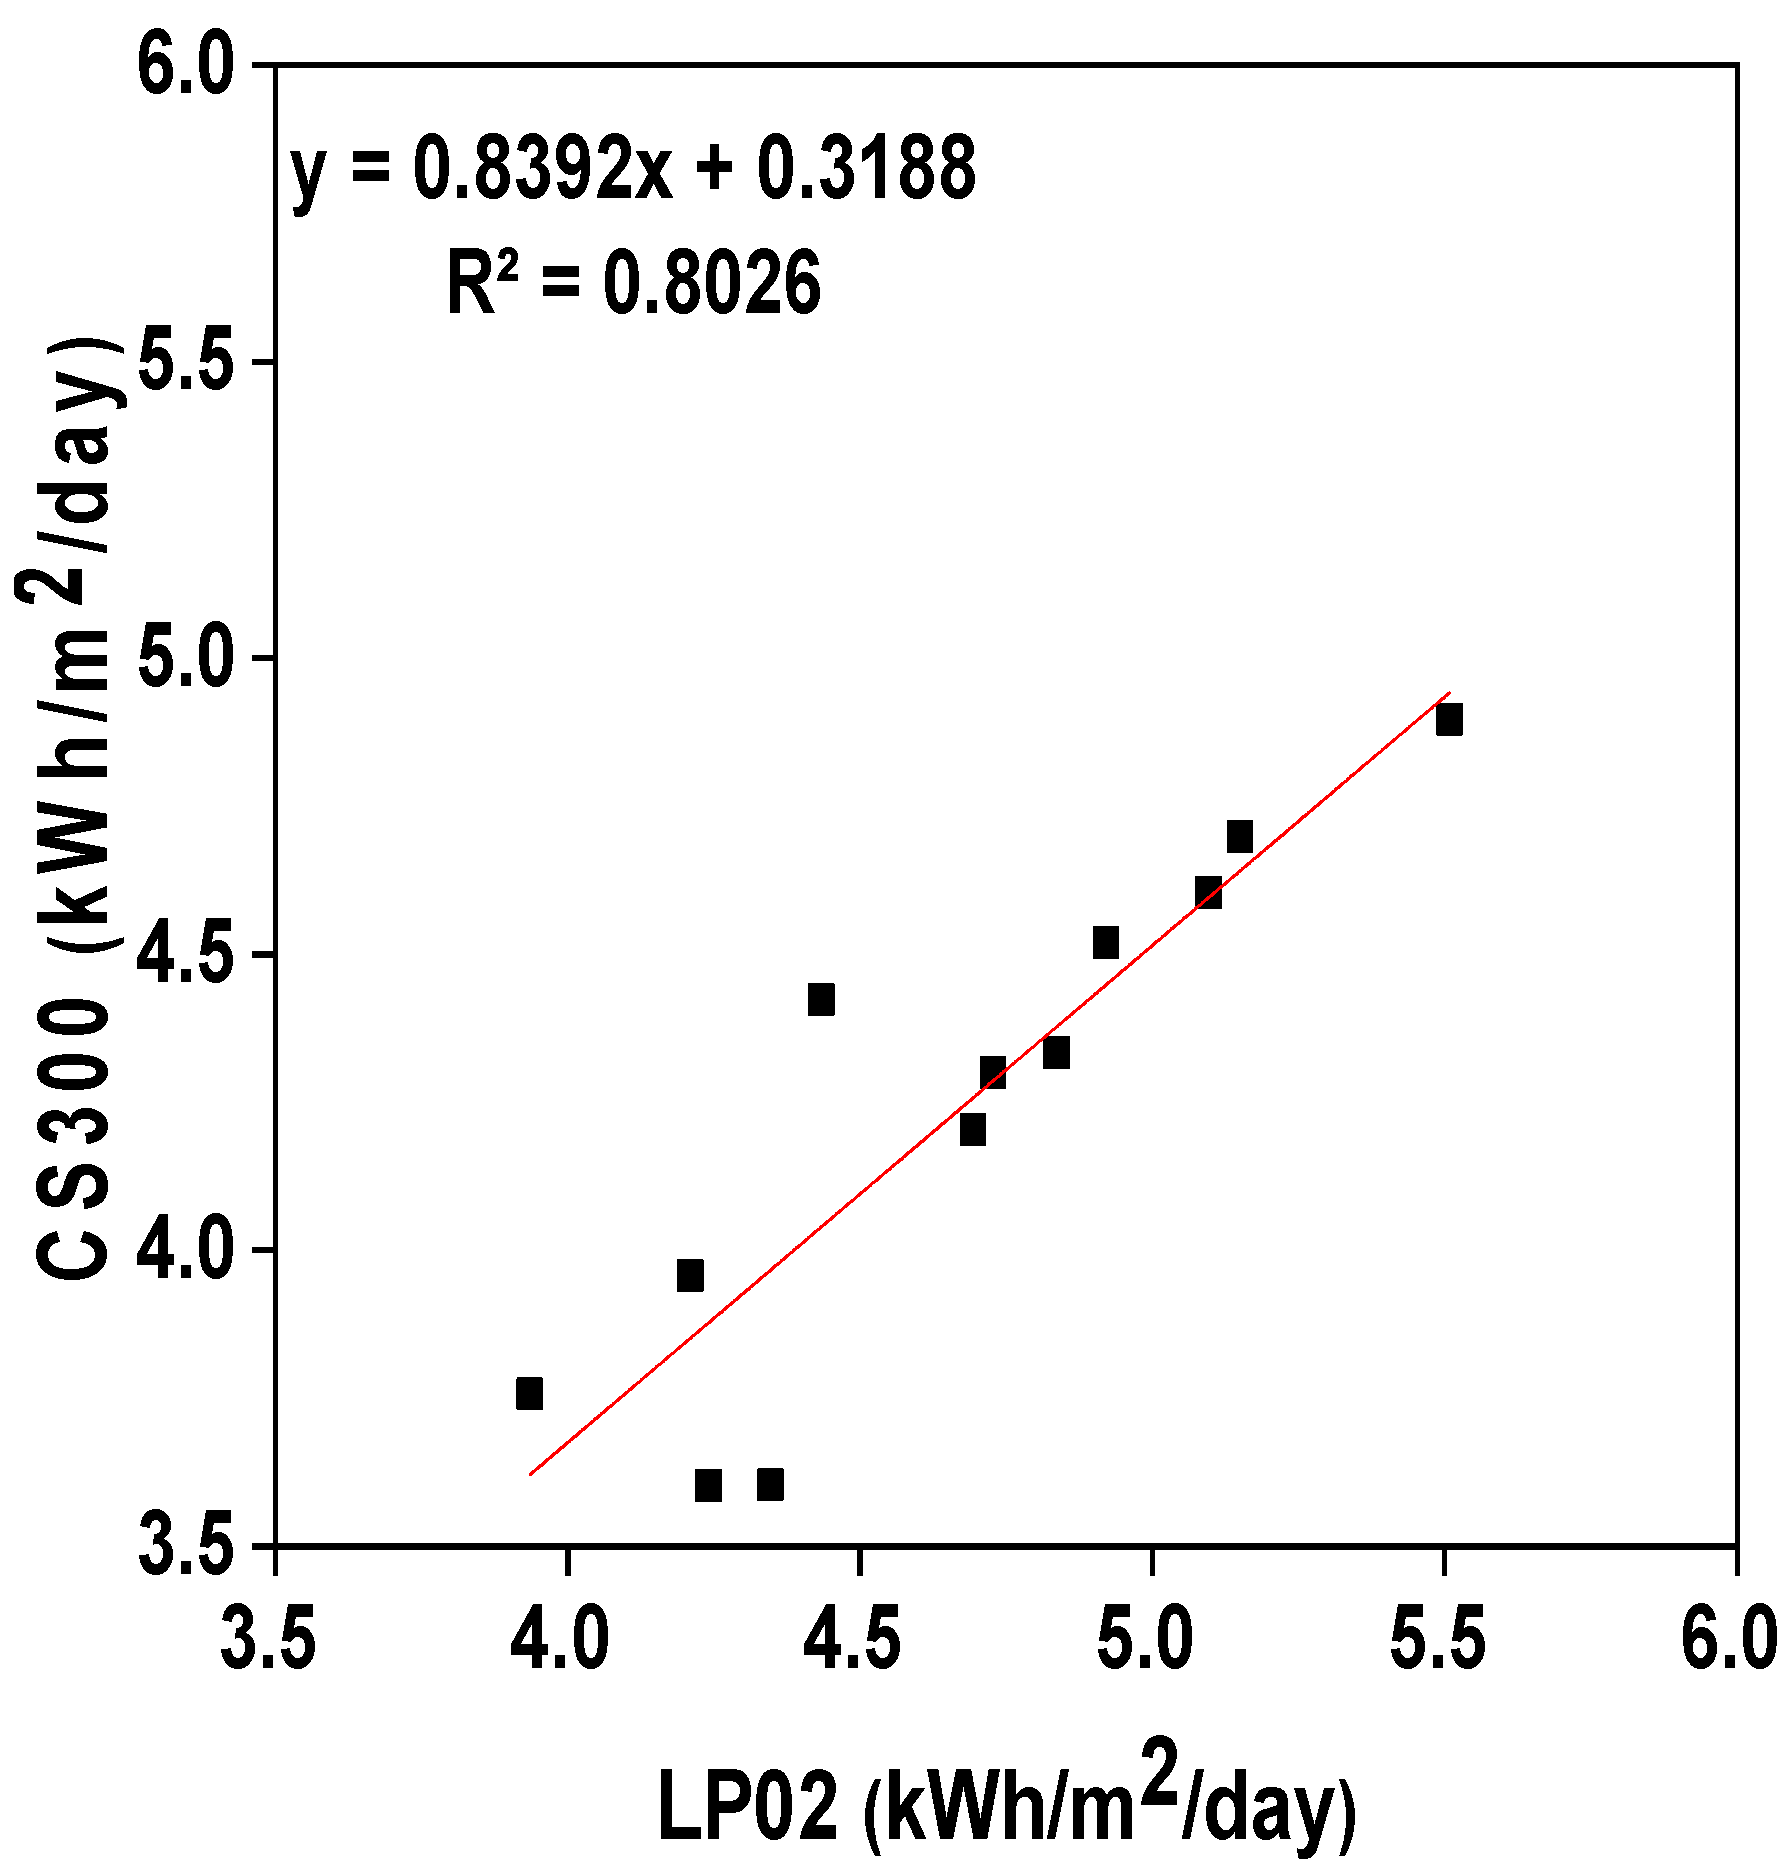
On a monthly time scale, Figure 8 shows the regression line of the data from the LP02 and CS300 sensors in kWh/m2/day. A high correlation coefficient of over 80% is observed. This means that the two sensors have produced variations that are generally in phase. However, there is a slight dispersion in the months of May, June, and August during the dry season.
Figure 8.
Comparison of measurements from LP02 and CS300 sensors.
The surface global radiation measurements from this study, obtained using pyranometers, make it possible to validate satellite data at hourly and monthly scales. This involves comparative approaches to better understand measurement errors. To do this, different sky conditions were considered on a diurnal scale.
3.2. Validation of Satellite SolarGIS Data
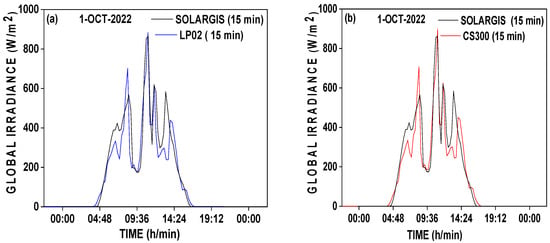
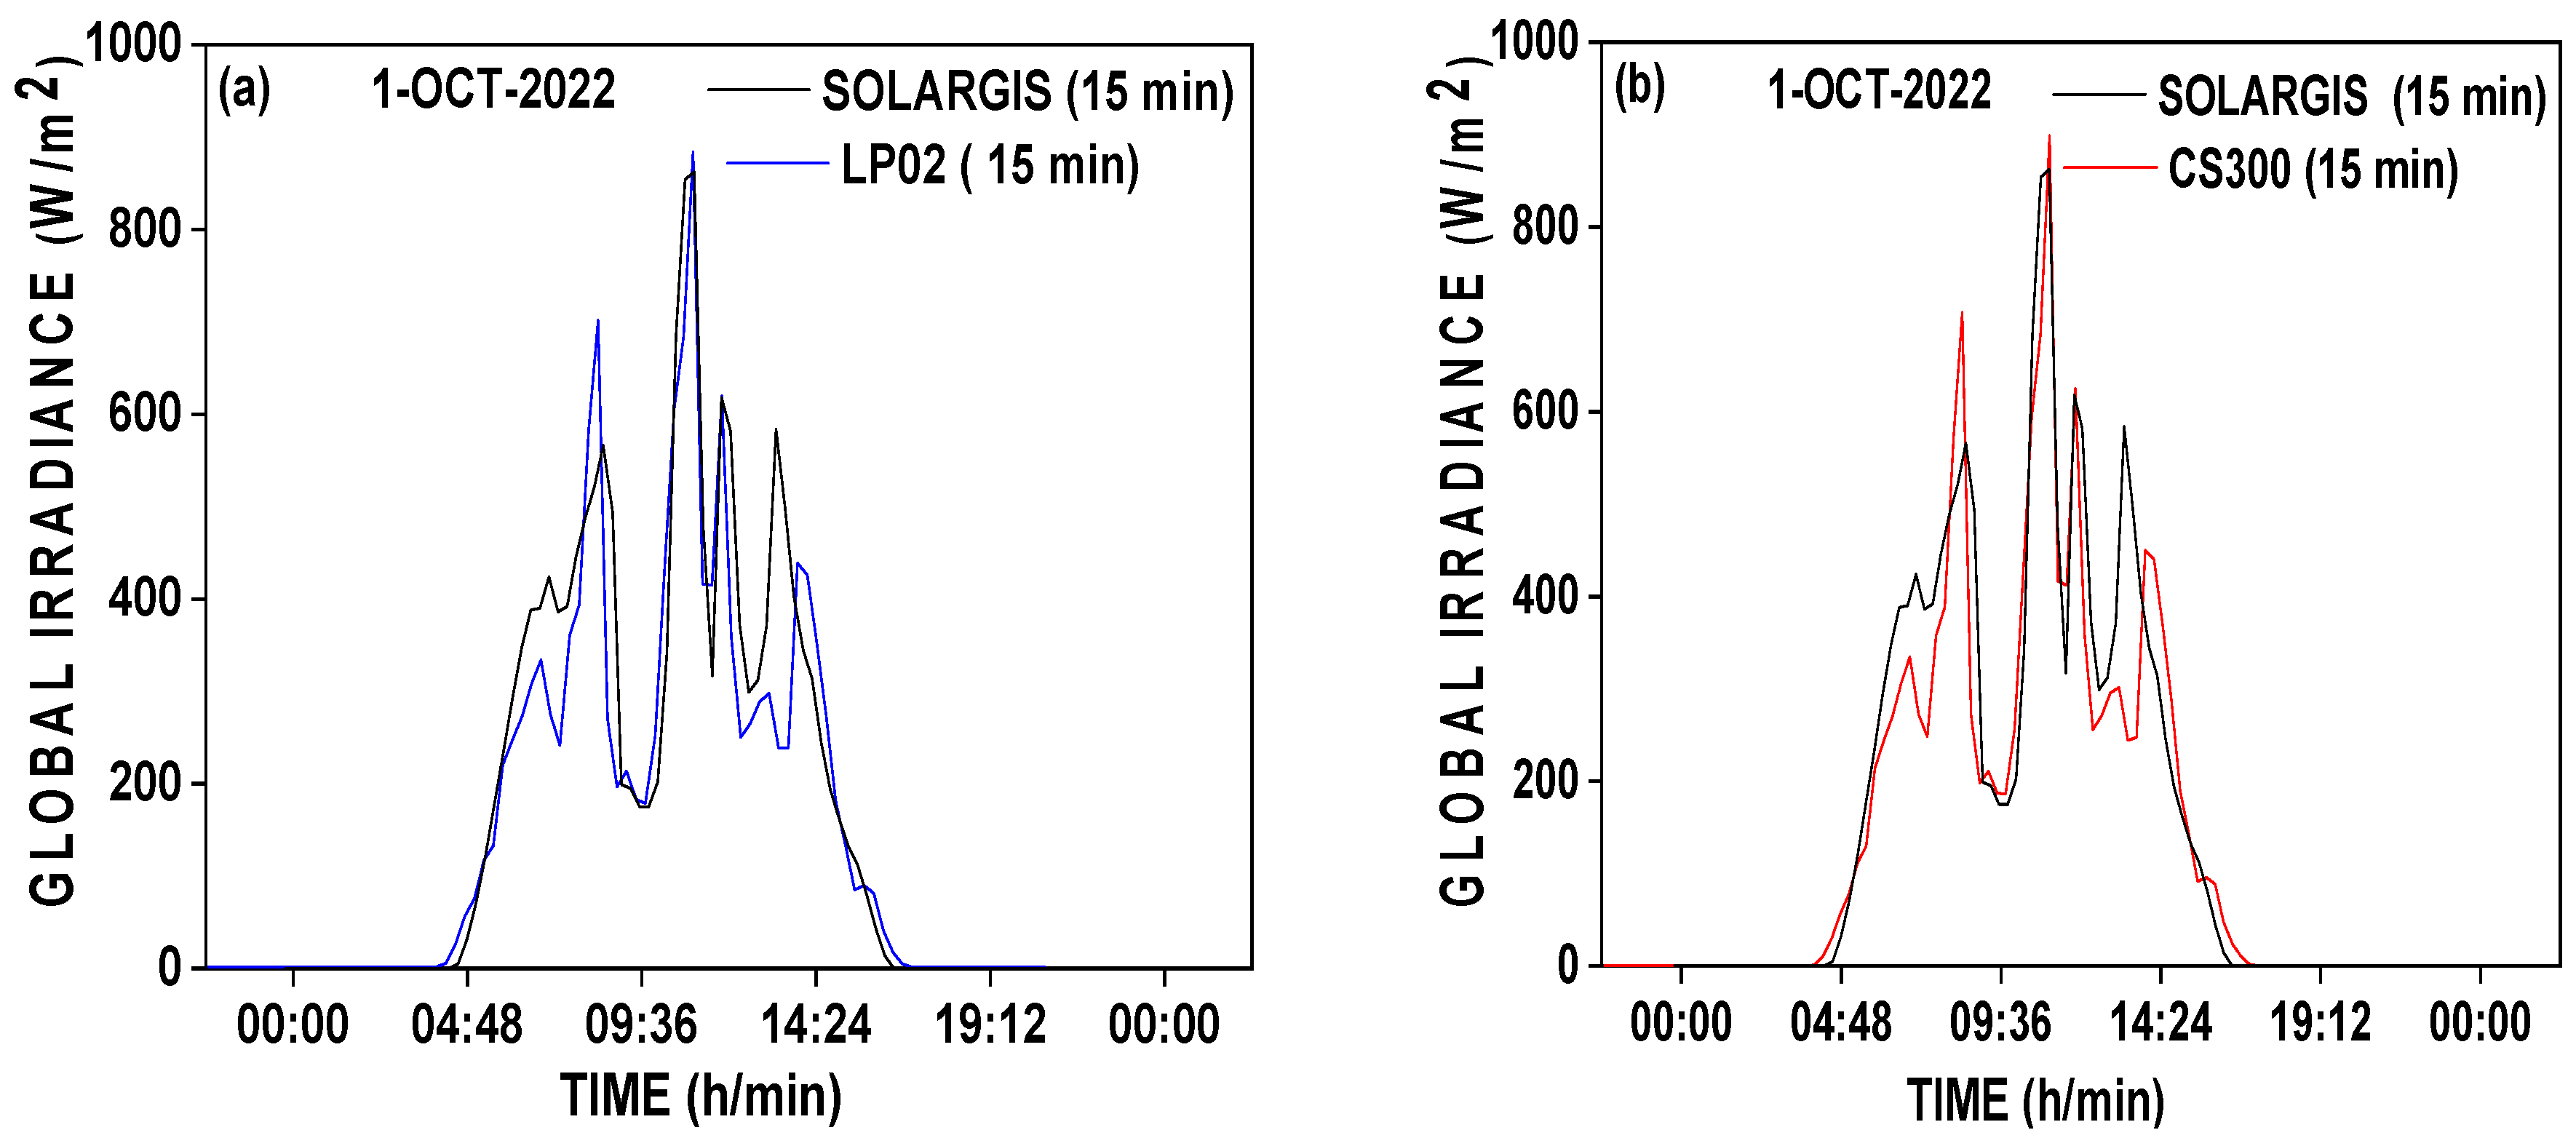
The graphs in Figure 9 show the superposition of the LP02 and CS300 sensor recordings with the satellite database. The records in the SolarGIS database generally corroborate those from the pyranometers. They match the sensors’ diurnal changes quite well.
Figure 9.
Comparison of diurnal changes from SOLARGIS-LP02 (a) and SOLARGIS-CS300 (b) for partially cloudy.
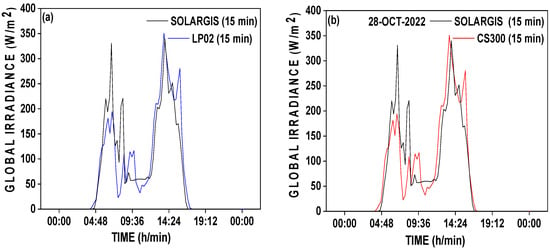
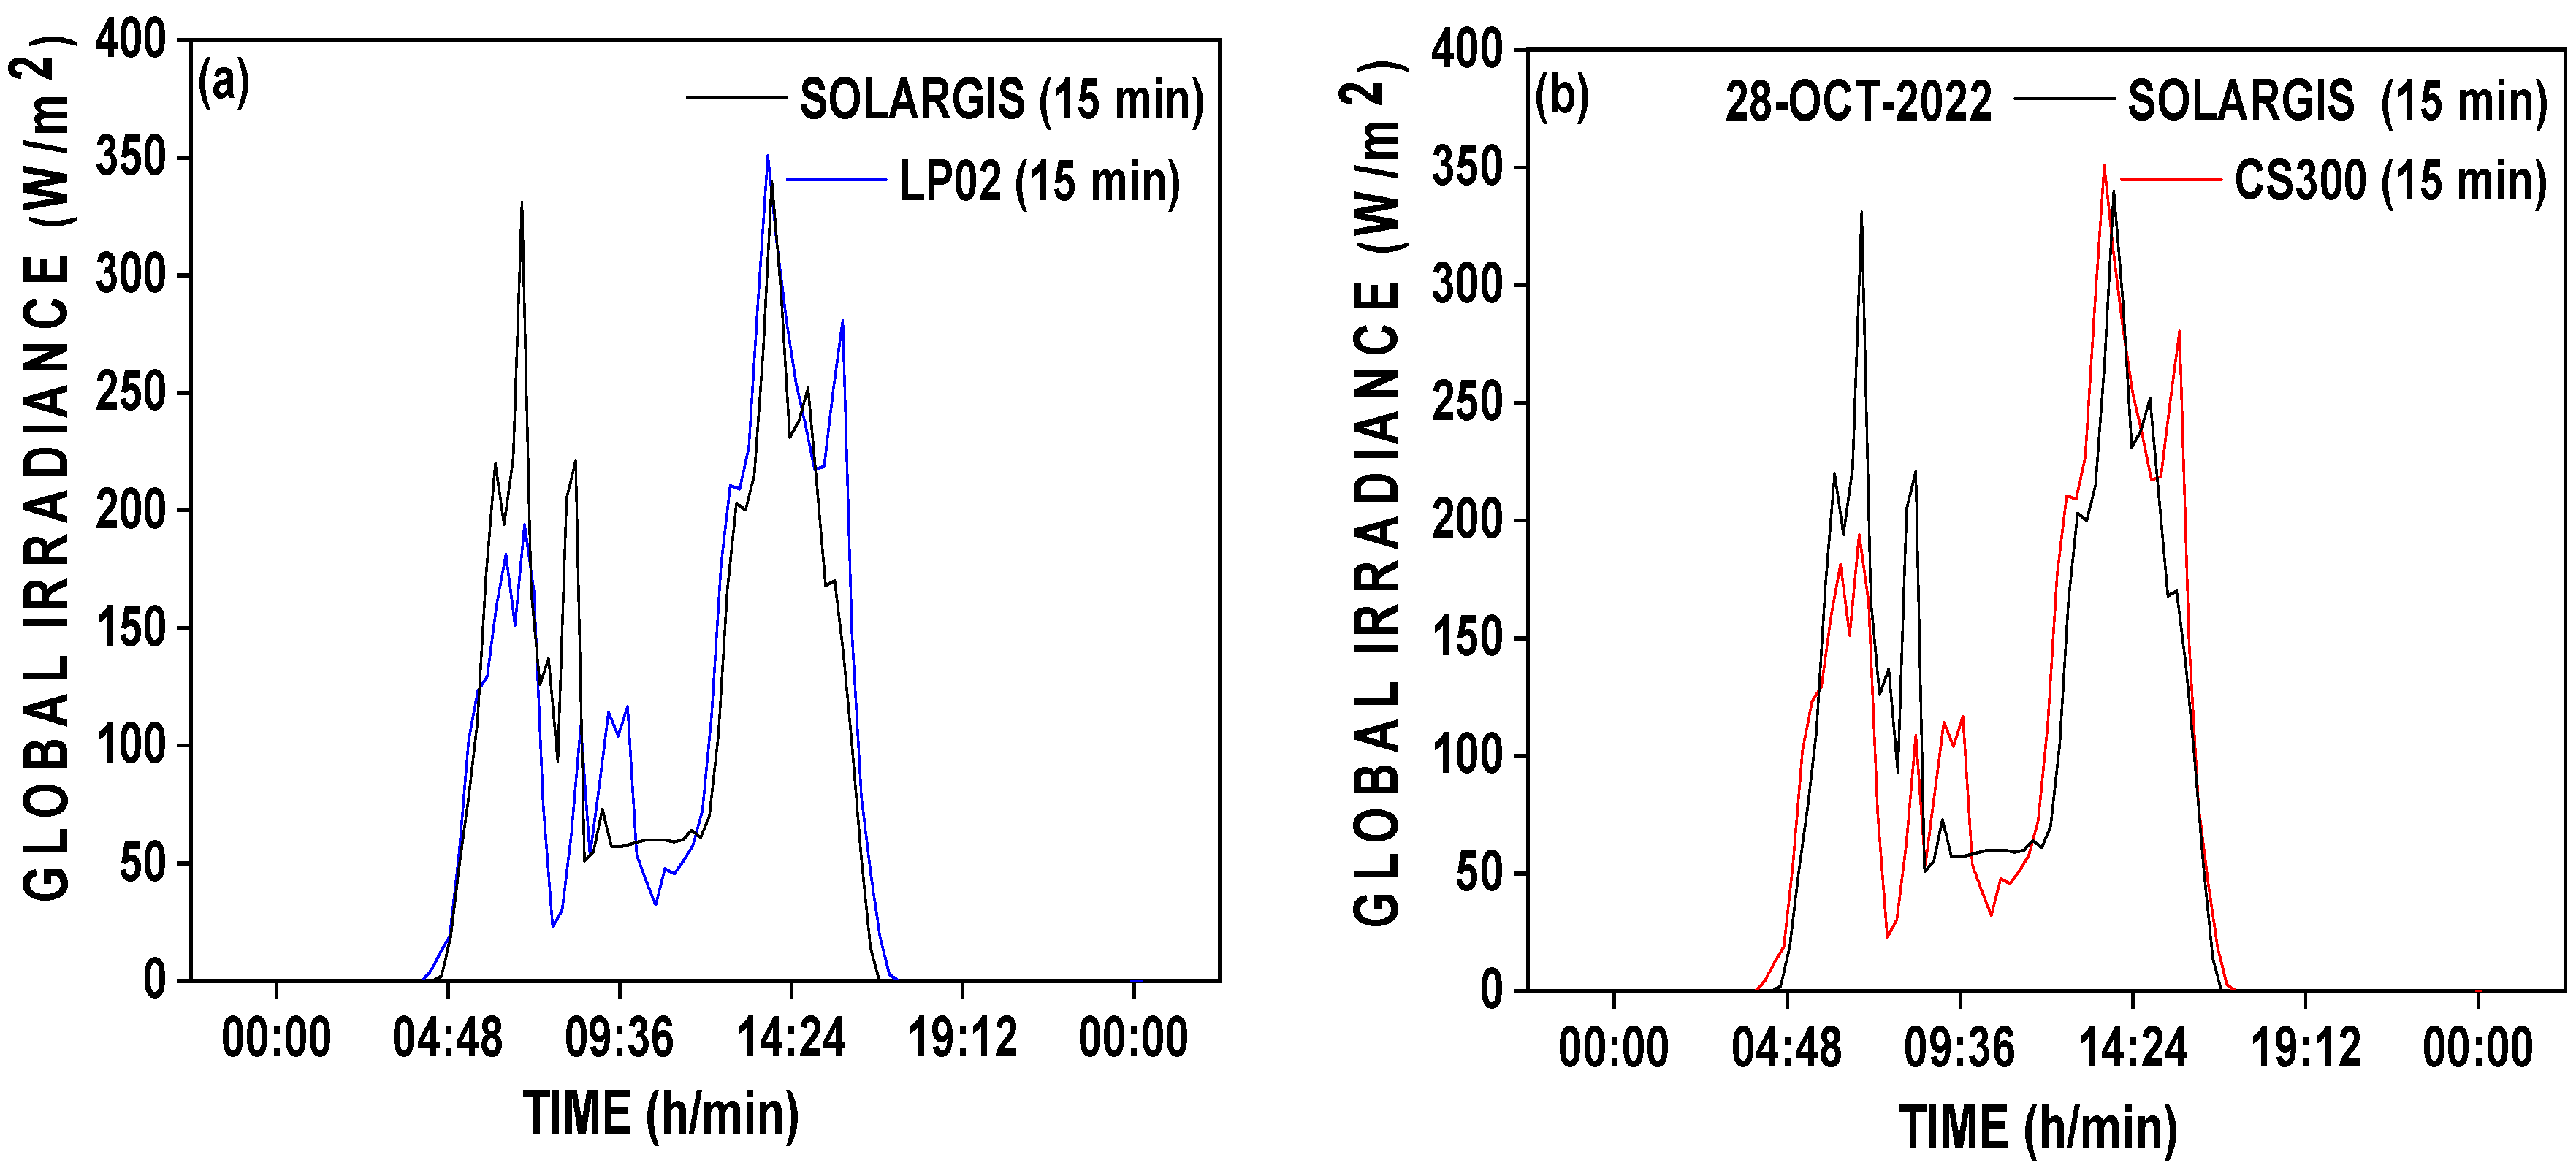
Under heavy cloud cover (Figure 10), a slight overestimation of the data from the SolarGIS database is noted.
Figure 10.
Idem Figure 9 but for heavy cloud cover sky. (a) SOLARGIS-LP02; (b) SOLARGIS-CS300.
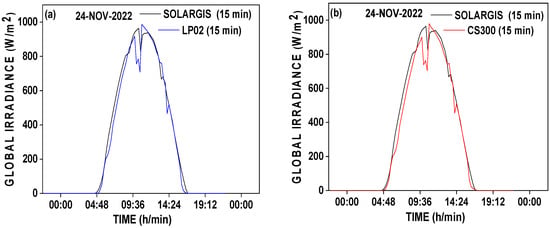
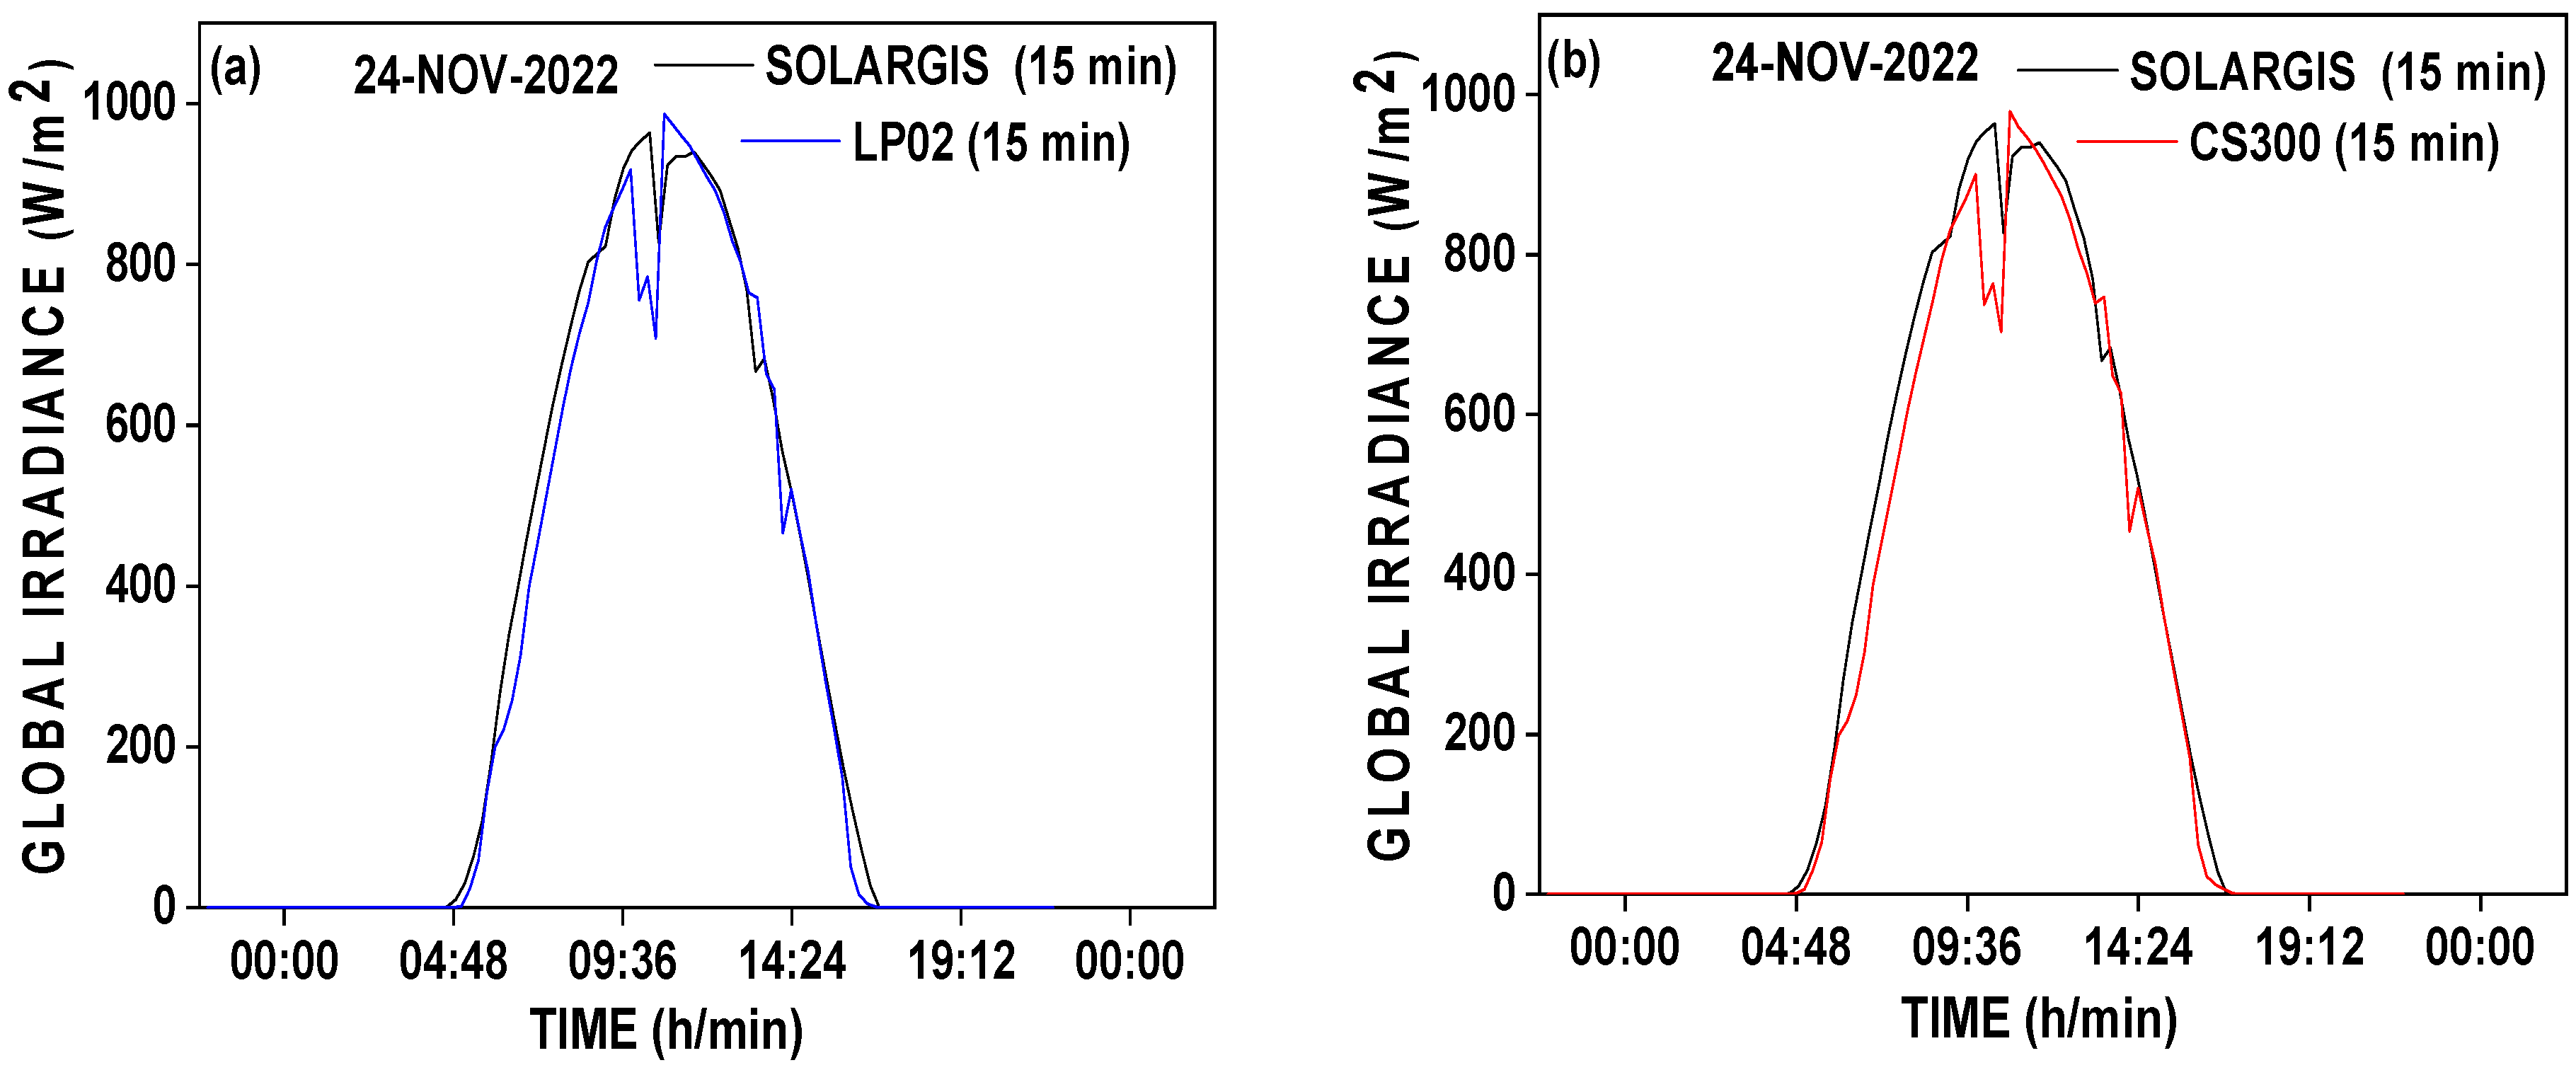
In contrast, in clear-sky conditions, Figure 11 shows an almost perfect overlap of the compared data. The curve of the LP02 sensor appears to be slightly below that of SolarGIS.
Figure 11.
Idem Figure 10 but for clear sky. (a) SOLARGIS-LP02; (b) SOLARGIS-CS300.
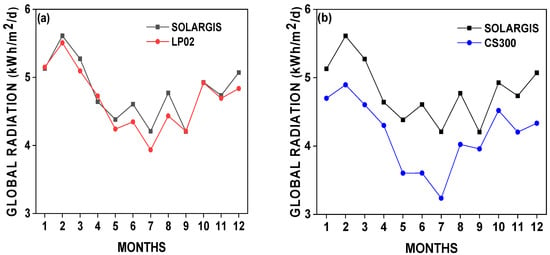
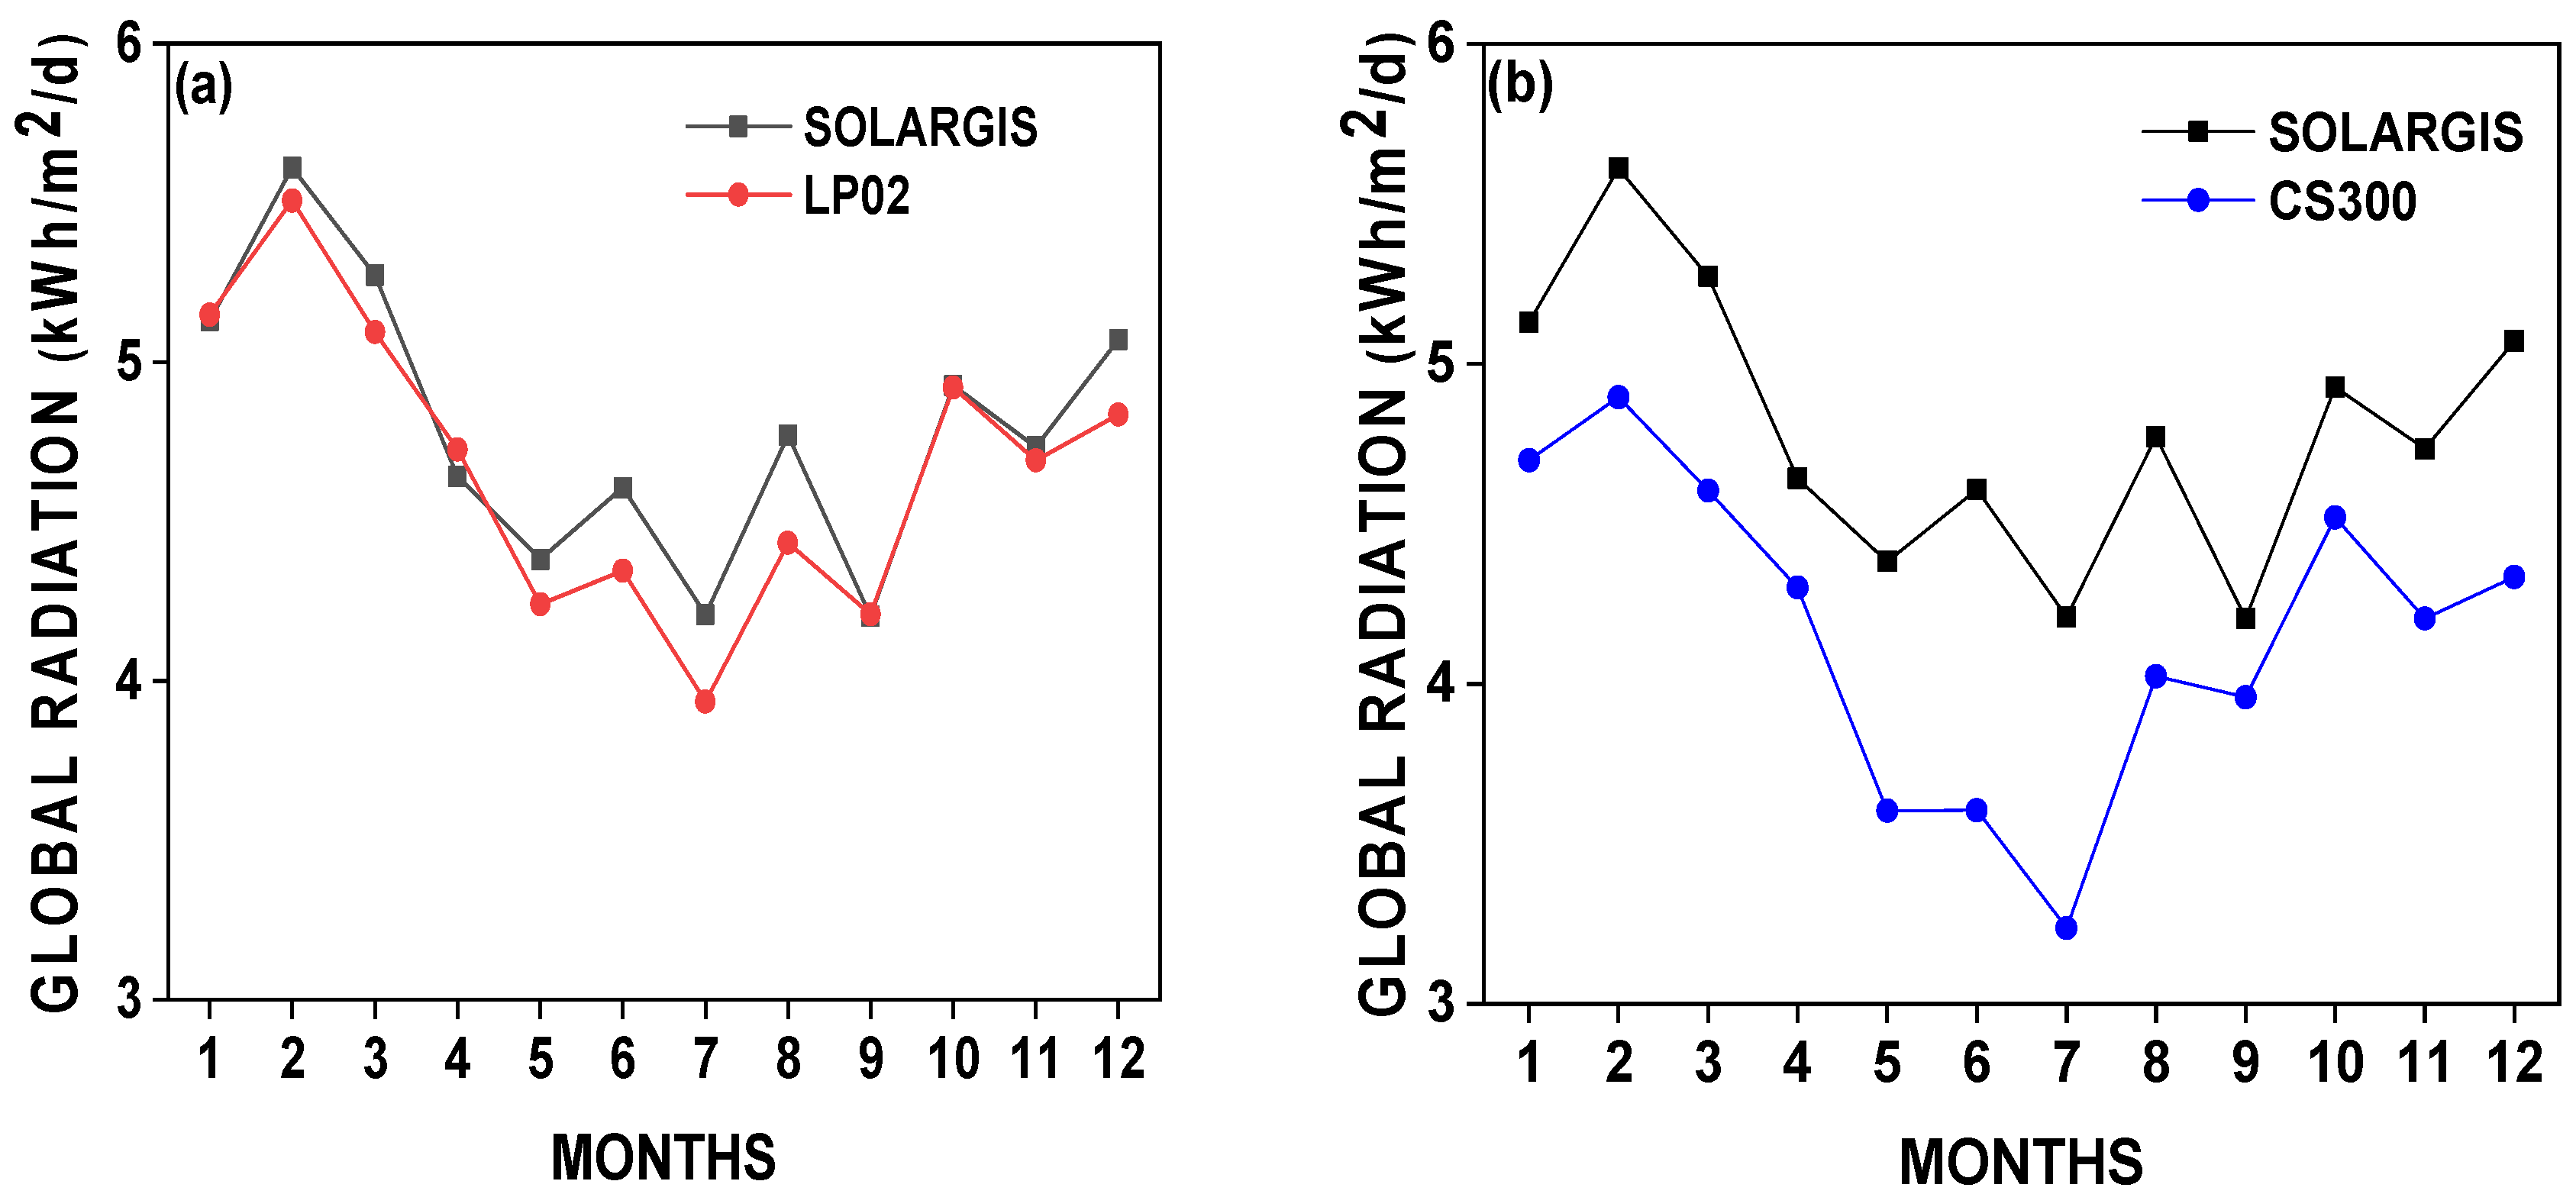
Figure 12 shows the annual variation in the monthly mean GHI data in kWh/m2/day from SolarGIS and the LP02 and CS300 sensors. The monthly data from SolarGIS are well correlated with the observations from the two sensors. However, the gaps are larger during the dry season in Brazzaville (from June to August) and are, furthermore, higher with the CS300 sensor. The observed differences are plausibly associated with the spectral range, the measurement range of these two sensors (See Table 1), inherent spectral mismatch, temperature dependence, and angular response. The LP02 records more irradiance than the CS300 and has the same spectral range as SolarGIS sensors (0.3 to 3 μm). Moreover, LP02 records more energy in the shortwave range between 0.28 and 0.36 μm.
Figure 12.
Annual scale comparison of monthly values from SolarGIS and from LP02 and CS300 sensors. (a) SOLARGIS-LP02; (b) SOLARGIS-CS300.
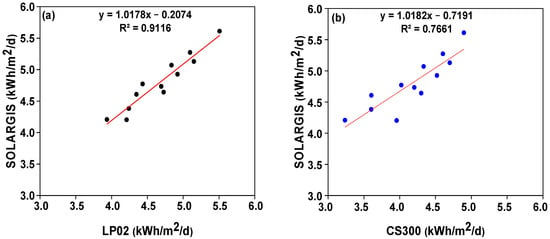
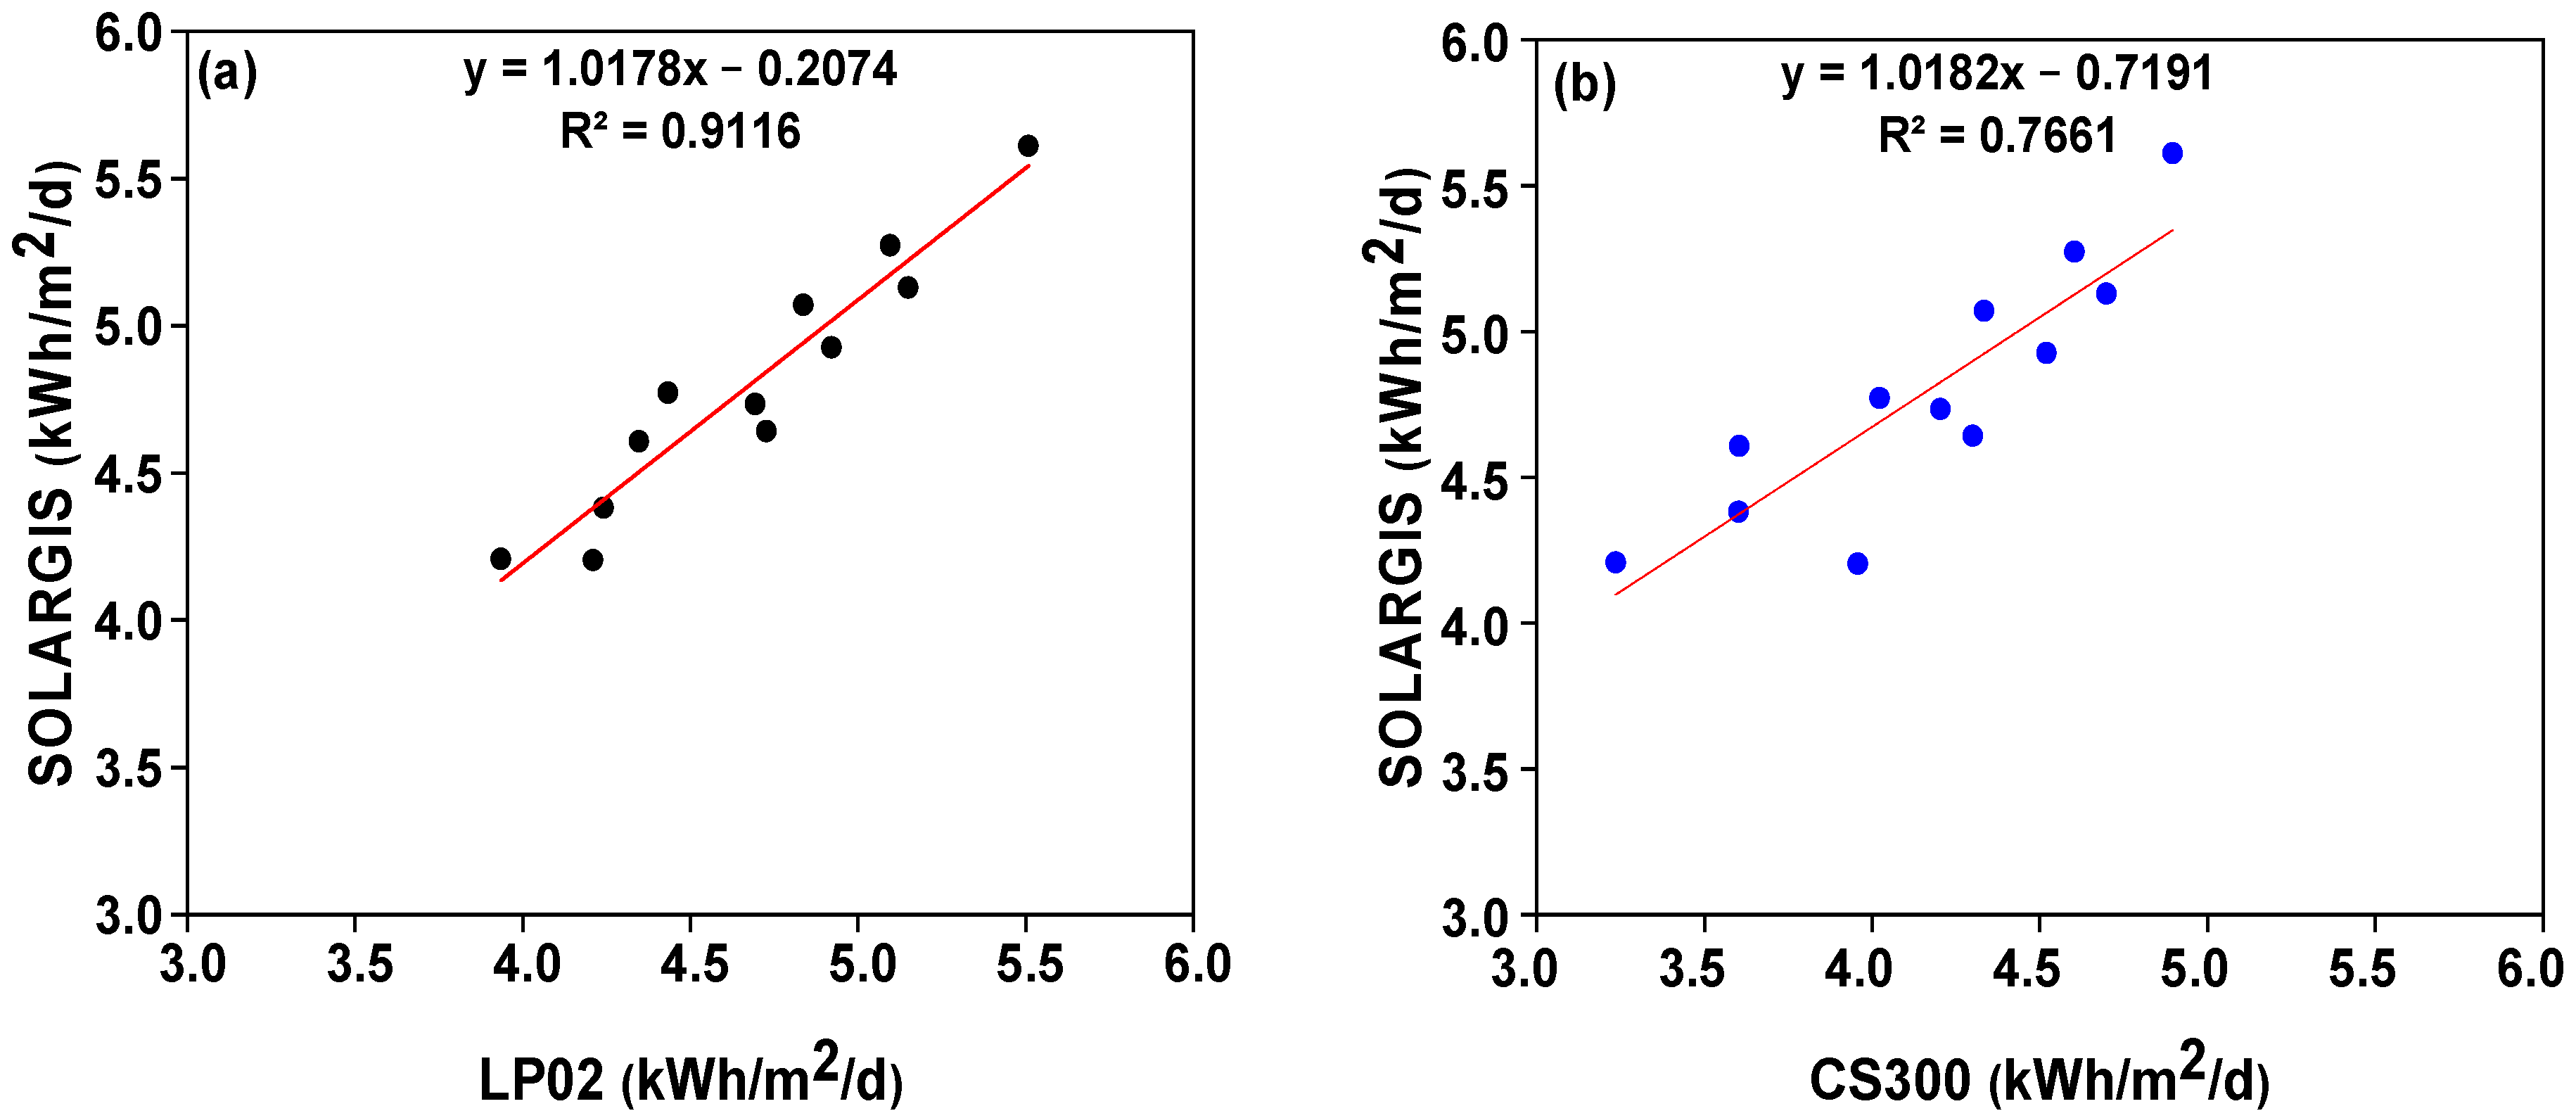
Figure 13 shows the correlations between the monthly data from SolarGIS and the LP02 and CS300 sensors. We note a strong correlation of 0.91 with the LP02 and a relatively lower correlation of 0.77 with the CS300. This corroborates the level of dispersion around the linear regression lines.
Figure 13.
Correlation between monthly data of SOLARGIS-LP02 (a) and SOLARGIS-SCS300 (b). In red, the linear regression line.
Table 2 presents the results of the comparisons between satellite measurements and those of in situ sensors LP02 and CS300. Five statistical parameters have been calculated: coefficient of determination (R2), root mean square error (RMSE), mean bias (MBE), mean absolute error (MAE), and mean absolute percentage error (MAPE).
Table 2.
Measurement accuracy indicators: correlation R2, root mean square error (RMSE), mean bias error (MBE), mean absolute error (MAE), and mean absolute percentage error (MAPE). In parentheses, the percentages of relative uncertainty between monthly in situ measurements and SolarGIS.
In Brazzaville, the annual mean GHI varies between 4.24 kWh/m2/day and 4.79 kWh/m2/day depending on the sensors used. The correlations are relatively high, around 0.84. The LP02 has lower RMSE, MBE, and MAE values, respectively equal to 0.17 kWh/m2/day, −0.12 kWh/m2, and 0.14 kWh/m2, showing that this sensor exhibits better agreement with SolarGis than the CS300. This does not mean that the CS300 is not reliable.
The IEC 61724/2 standard defines the acceptable percentage differences for the evaluation of solar resources. For hourly, daily, and monthly data, the uncertainties (RMSE, or MBE) must be less than or equal to 10%, 7–9%, and 5%, respectively [22]. The data from LP02 have RMSEs below 5% and are thus relatively more reliable than those from CS300, which are around 14%.
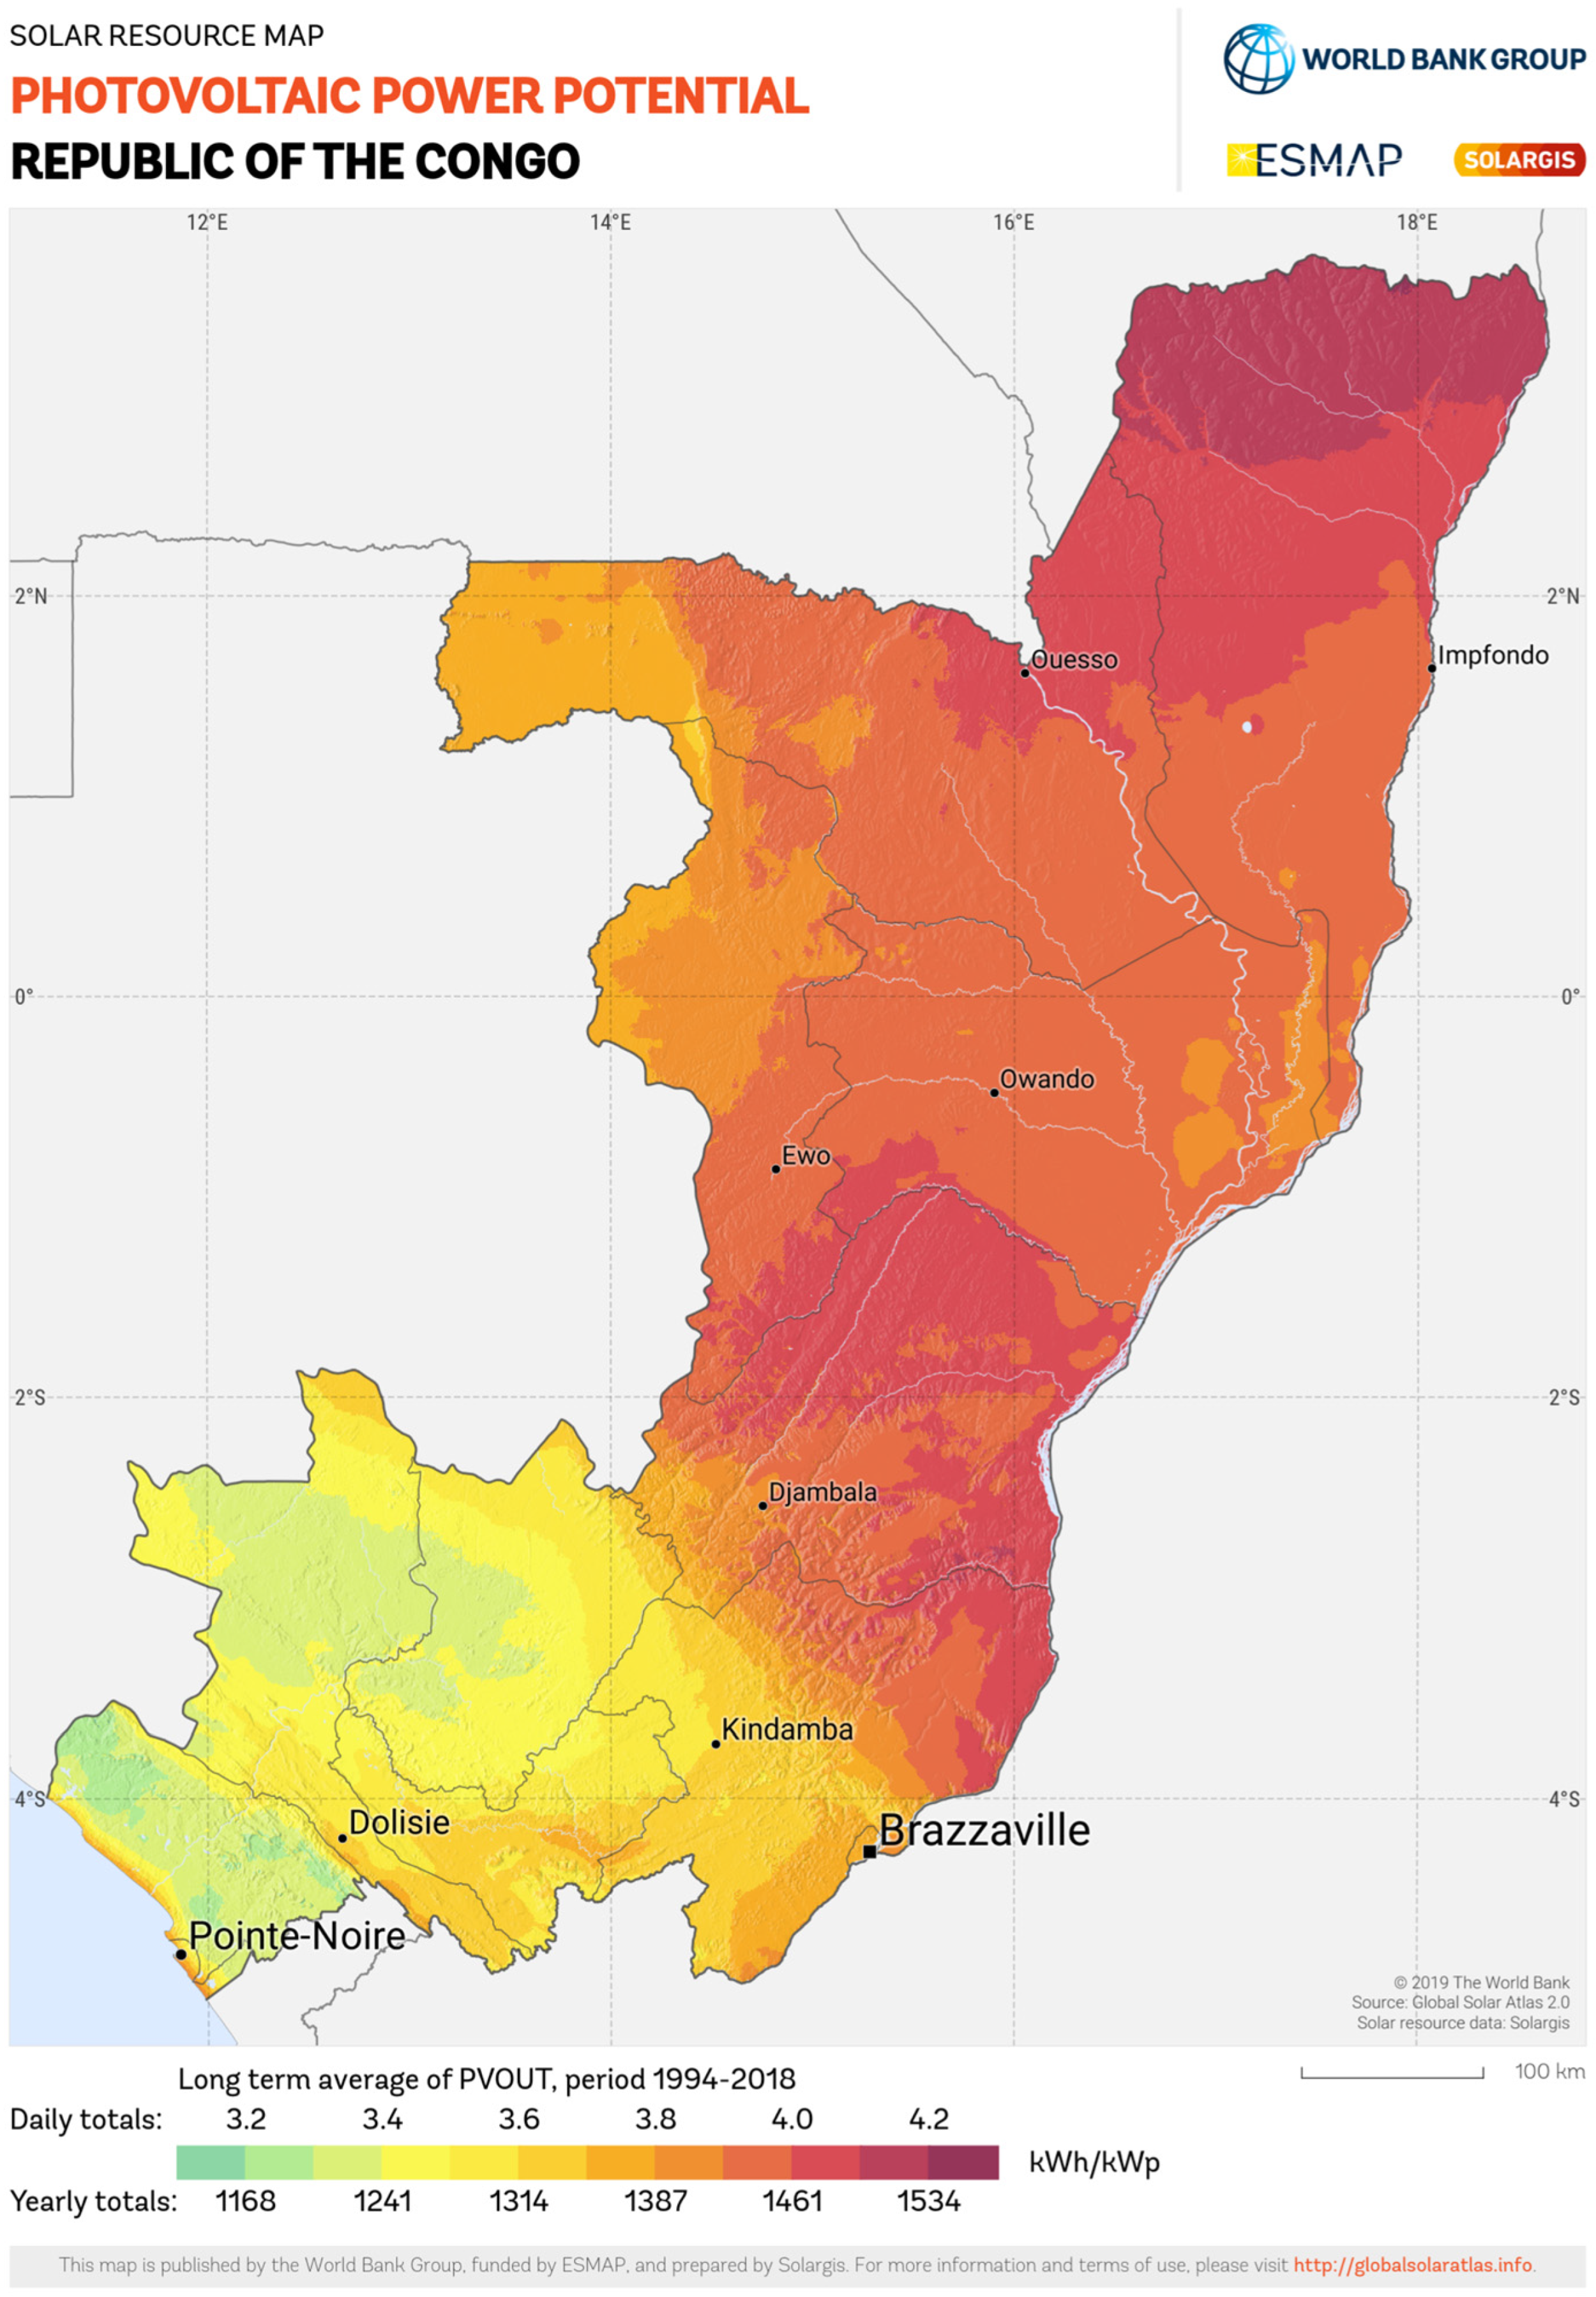
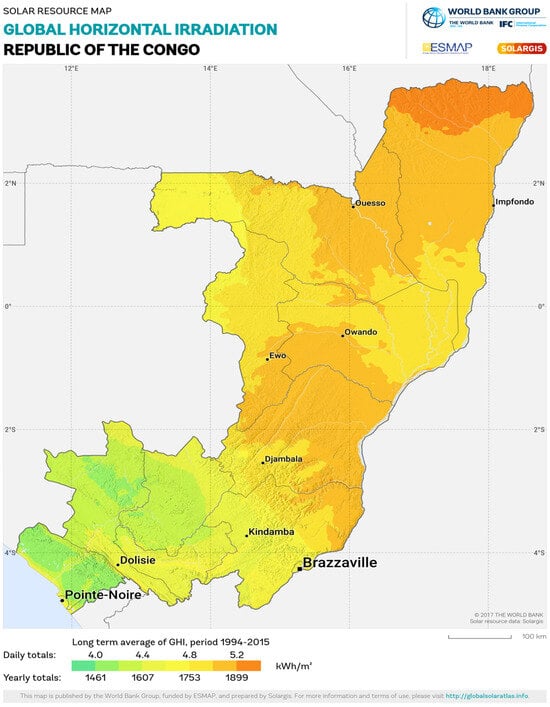
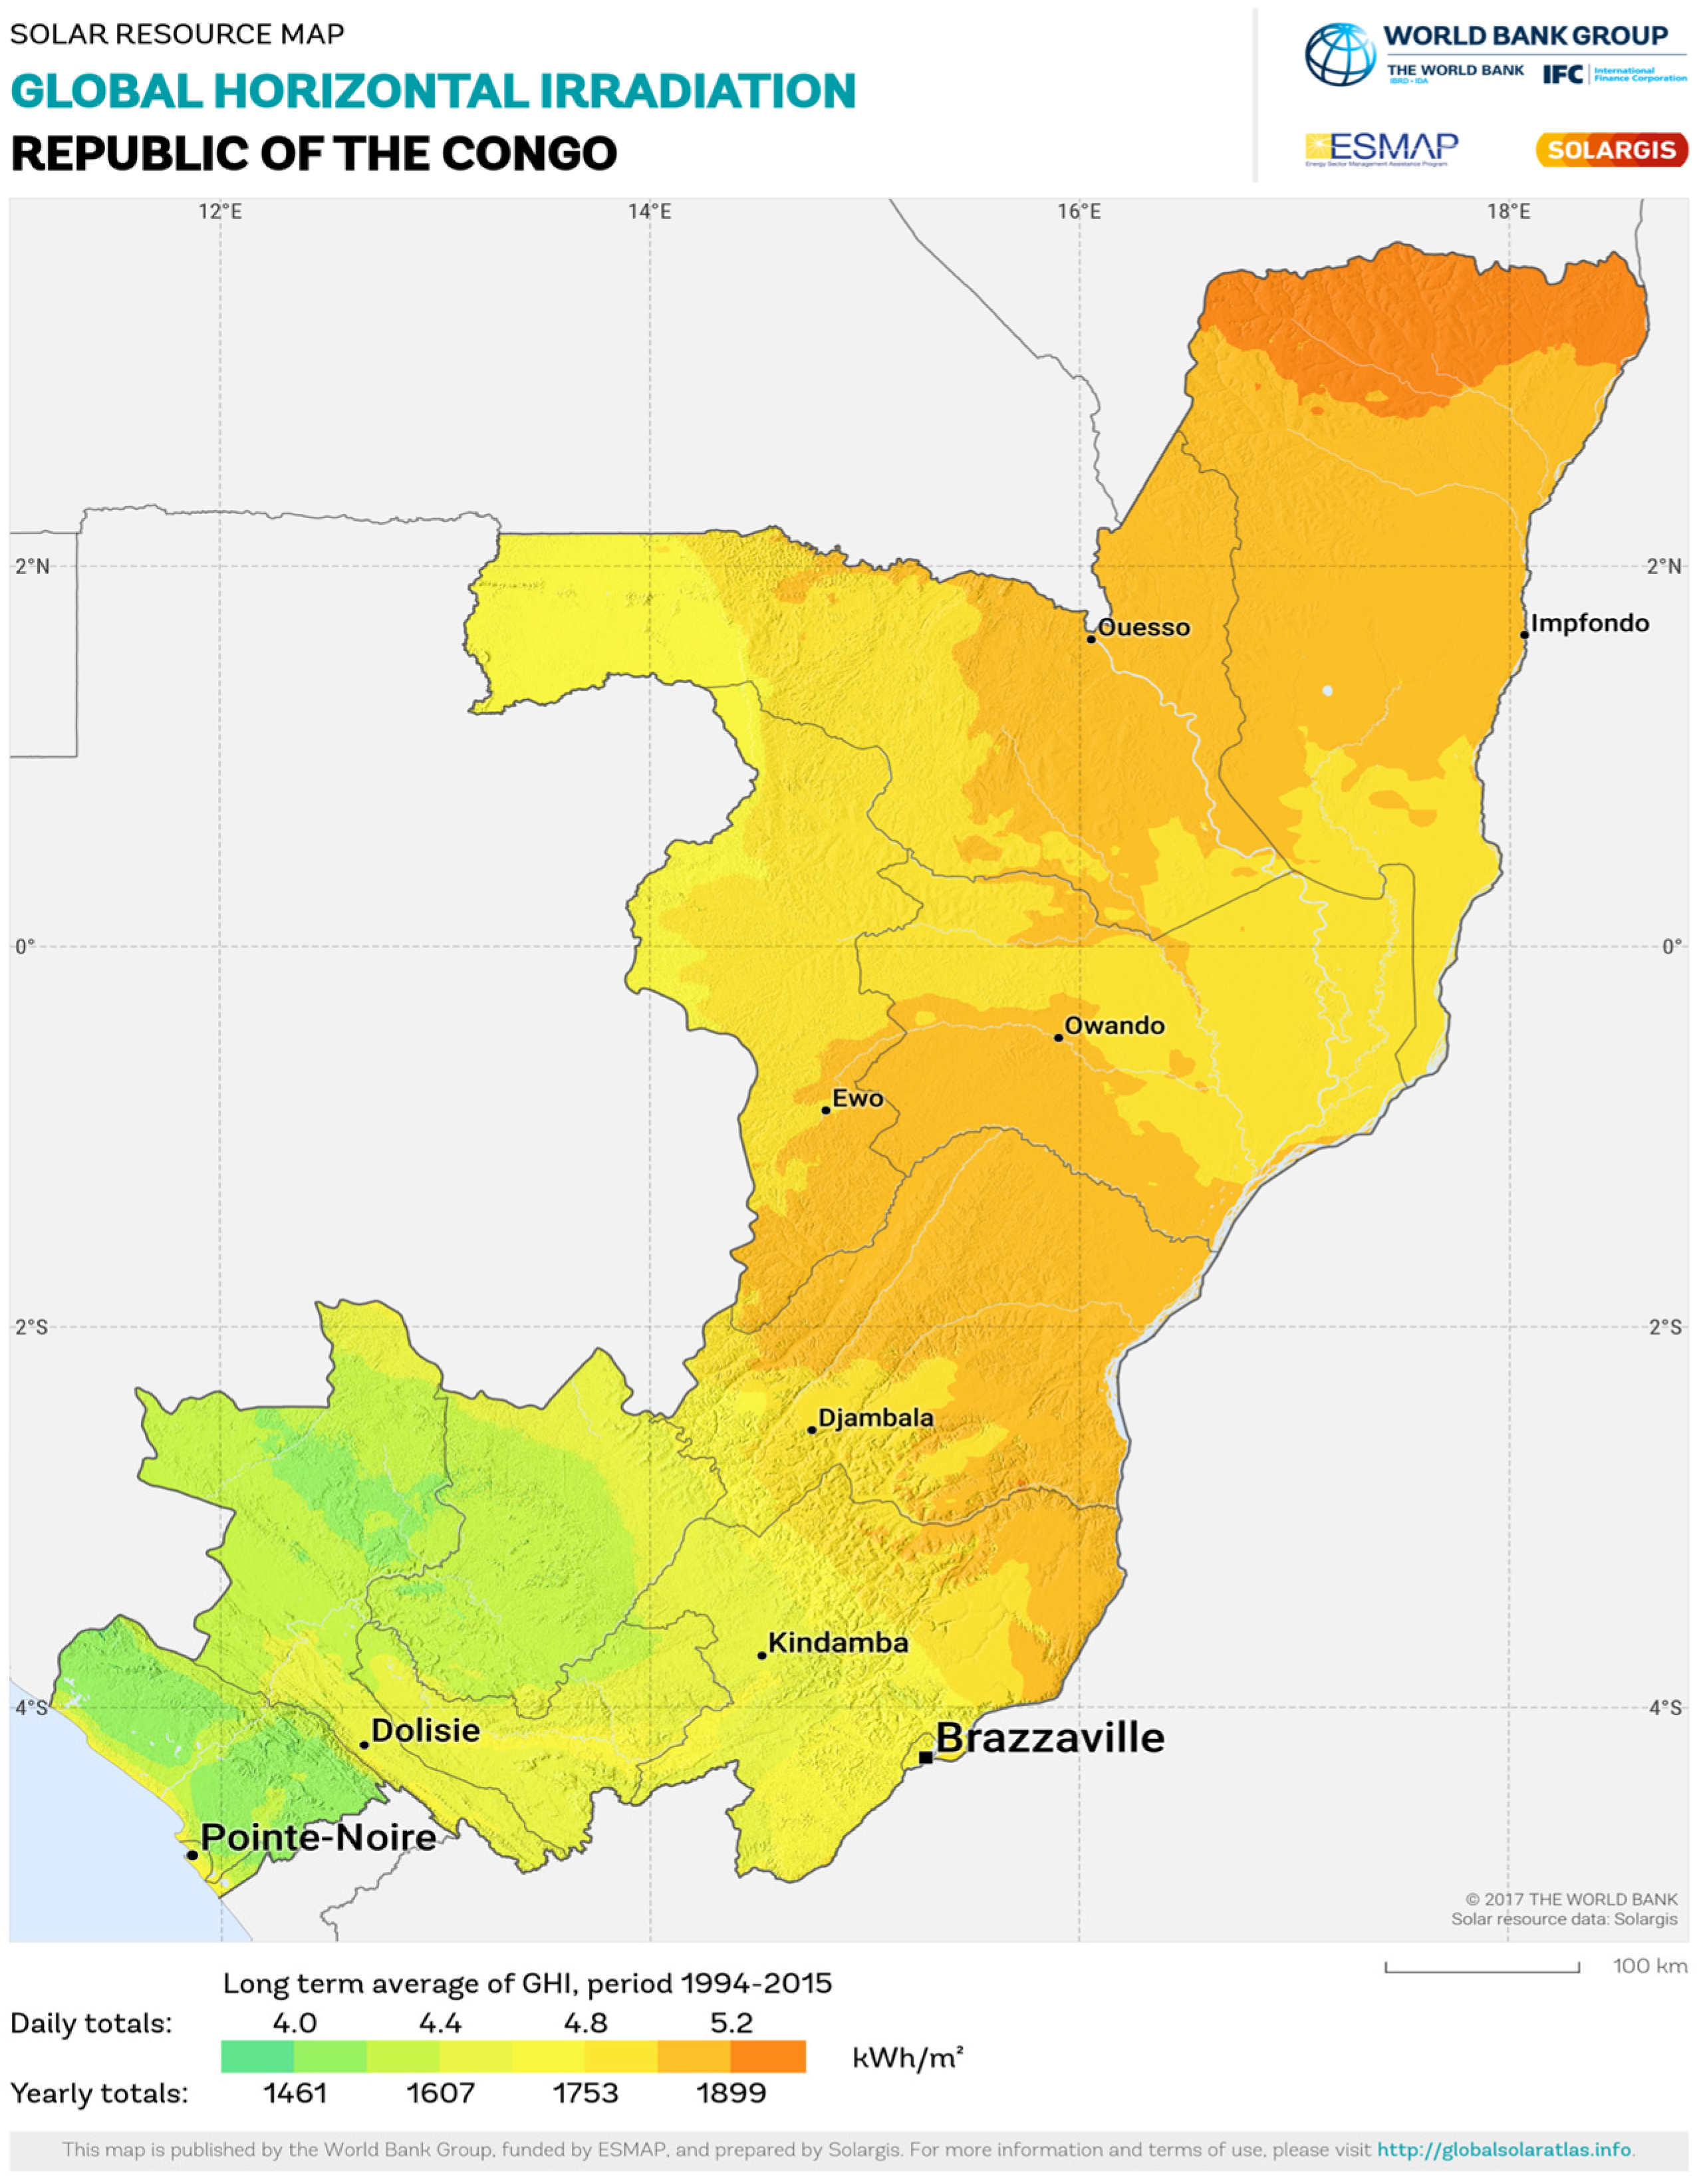
The LP02 sensor measurements better reflect the long-term mean of GHI from 1994 to 2015 in the SOLARGIS database, ranging from 1461 to 1899 kWh/m2 in the color palette. Hence, for the Republic of the Congo, we can use the solar potential from SolarGIS data as shown in Figure 14. This is the result of the World Bank Group’s Energy Sector Management Assistance Program (ESMAP) [39].
Figure 14.
Solar map of the Republic of the Congo. Source: https://solargis.com/resources/free-maps-and-gis-data?locality=republic-of-the-congo (accessed on 25 April 2025).
In Table 2, the data sample size is 12 months. For daily data, it is around 360 ± 5 days.
The MBE values are calculated to quantify the overestimation or underestimation of SolarGIS data compared to in situ ground measurements by the LP02 and CS300 pyranometers. The MBE values are −0.12 kWh/m2 (2.6%) and −0.55 kWh/m2 (13.1%), respectively. These mean that, on average, the SolarGIS database underestimates the monthly values of GHI measured by the LP02 and CS300 by 2.6% and 13.1%, respectively. The dispersion of the differences between the two types of measurements, as reported by the RMSE, indicates their actual divergences. Our results give respective values of RMSE = 0.17 kWh/m2 (3.8%) and RMSE = 0.59 kWh/m2 (14.03%) for the LP02 and the CS300. The results obtained are in agreement with the RMSE values reported in the work conducted by several authors [22,24,25,40].
The RMSE and MBE values of LP02 (3.82% and 2.6%) that validate SolarGIS data in Brazzaville and the Republic of the Congo are also in agreement with those found in countries in the tropical zone [41]. Furthermore, the MAE in the study (0.216 kWh/m2/day) of [26] is within the interval of those found in our study: 0.14–0.55 kWh/m2/day.
3.3. Photovoltaic Production Potential and Uncertainties
The RMSE values of 0.17 kWh/m2/day and 0.59 kWh/m2/day found respectively from LP02 and CS300 give a difference in photovoltaic energy production compared to SolarGIS data, on the order of 0.14 kWh/kWp/day and 0.49 kWh/kWp/day, respectively, as mentioned by the World Bank, 2020: Ranking of Selected Countries, Based on Zonal Statistics of Practical PV Power Potential. However, according to this document, our on-site ground measurements yield an average photovoltaic energy production of 3.9 kWh/kWp for the LP02 and 3.5 kWh/kWp for the CS300, as in [26]. These results are in line with the zonal values of photovoltaic production potential determined by SolarGIS (Figure 15 below) [42].
3.4. Solar Potential in Rural Areas
In the Likouala, Western, and Central departments, remote sensing provides a mean GHI value initially estimated at 5.2 kWh/m2/day. This value was corrected to approximately 5.2 kWh/m2/day × (1 − 0.038) = 5.002 kWh/m2/day and 5.2 kWh/m2/day × (1−0.14) = 4.47 kWh/m2/day, taking into account the respective margins of error (RMSE) determined by comparing the data measured on the ground by the two sensors (LP02 and CS300) with those estimated using remote sensing (SolarGIS). These observations support the claim that sub-Saharan Africa has significant solar potential for rural communities to benefit from solar electricity generation, with GHI generally ranging from 4 to 7 kWh/m2/day [43]. It is also worth noting that the authors of [44] emphasized that these irradiance levels make photovoltaic systems particularly well-suited for electrifying isolated rural areas.
Despite this solar potential, rural access to electricity has historically been low in the Republic of the Congo. In 2012, the electrification rate in the country was less than 50%, with only 41.6% of the total population having access to electricity. This included 11.7% in rural areas, 58.9% in urban areas, and an average electricity consumption of 181.7 kWh per capita [45].
The rural electrification rate is a major national concern and challenge. As a consequence, the National Energy Pact has set the following ambitious objectives: (1) to increase the availability of renewable energy in the national electrification strategy plan and (2) to increase access to electricity. Finally, increasing the rural access rate will be achieved through stand-alone solar systems (90%) and mini-grids (10%), with required investment levels of $338 million, comprising 50% from private sources and 50% from public sources [11].
Figure 15.
Photovoltaic power potential. From solar resource maps of the Republic of Congo (Solar Resource map, SolarGIS, 2021: https://solargis.com/resources/free-maps-and-gis-data?locality=republic-of-the-congo (accessed on 25 April 2025)).
4. Discussion
The need to assess solar potential has become increasingly urgent as energy generation transitions from fossil fuels to renewable technologies. The main objective of this research is to evaluate the accuracy of satellite data to determine solar potential. Data were collected from in situ sensors (LP02 and CS300) and compared to satellite solar radiation data from SolarGIS at hourly, monthly, and annual scales.
Different sky cloudiness conditions in Brazzaville were examined. Under a cloudy sky, the LP02 sensor recorded, from the calculations of the area under the diurnal curve (Figure 5), the daily averages of 79.25 W/m2 and 51.89 W/m2, respectively, on September 7 and 28 October 2022. In contrast, the CS300 sensor recorded daily averages of 74.15 W/m2 and 47.86 W/m2, respectively, on the same dates. The average difference between the two LP02 and CS300 sensors is around 4W/m2, which means a variation of around 7% of the average GHI measured by the LP02 sensor.
Under a partially overcast sky (Figure 6), on October 1 and 8 November 2022, the LP02 sensor measured daily values of 165.4 W/m2 and 123.2 W/m2, respectively, and the CS300 sensor measured daily values of 156.0 W/m2 and 112.1 W/m2, respectively, on the same dates. This shows a slight increase in the difference between the average values measured by the two sensors. This is 10 W/m2, which means a variation of around 9% of the average GHI measured by the LP02 sensor.
This gap increases with increasing satellite estimates of GHI (Figure 7). The difference between the values measured by the LP02 and CS300 sensors is around 31 W/m2; this means approximately 9.6% of the average value measured by LP02. This difference is primarily associated with the broader spectral response of the LP02 (0.28–3 µm) compared with the CS300 (0.36–1.12 µm), which results in different responses to the spectral composition of incident solar radiation. Moreover, this gap does not exceed 10%. However, at the monthly scale, a correlation between the two sensors is R2 = 0.80 (Figure 8), thus indicating a good variation in the same direction of the data from the two sensors. In addition, there is a strong agreement between the two datasets with a low value of RMSE = 0.47 kWh/m2/day.
The average values of satellite estimates of solar radiation at the horizontal surface, as provided by SolarGIS observations, were evaluated and validated by the LP02 and CS300 sensors on two time scales: hourly and monthly. Comparative approaches, based on the calculation of uncertainties, have allowed us to analyze the gaps between the different observations. In so doing, different sky conditions were considered on a diurnal scale. For the monthly and annual time scales, the averages were calculated, as well as the uncertainties (Table 1).
The uncertainties in the measurement results of the two pyranometers are presented to determine the performance of the two sensors in the intertropical zone. Looking at the two graphs in Figure 9. The daily GHI values were 165.39 W/m2 and 156.03 W/m2 for the LP02 and CS300 pyranometers, respectively, while SolarGIS provided an average value of 166.03 W/m2. The SolarGIS estimate therefore shows closer agreement with the LP02 measurements, with a difference of 0.6 W/m2. In contrast, this uncertainty is higher, at around 10 W/m2, between SolarGIS and CS300 measurements.
Daily averages of GHI were also determined for days with high cloud cover (Figure 10). The LP02 pyranometer recorded a daily value of 51.89 W/m2, whereas the CS300 pyranometer recorded a value of 47.86 W/m2, both of which are significantly lower than the average daily value of 68.89 W/m2 recorded by SolarGIS. With regard to these pyranometers, the calculated uncertainties are, respectively, 17 W/m2 for LP02 and 21 W/m2 for the CS300 pyranometer. It is noted that the average values of SolarGIS are slightly higher than those measured by the LP02 pyranometer.
However, for cloudless days (Figure 11), the daily average GHI values were 324.90 W/m2 for the LP02 pyranometer and 293.57 W/m2 for the CS300 pyranometer, respectively. In these cases, an average daily GHI value of 289.22 W/m2 was determined by SolarGIS. However, a high uncertainty of 35.68 W/m2 was noted from the value recorded by the LP02 pyranometer. However, the CS300 sensor measurements showed an uncertainty on the order of 4.35 W/m2 during clear days when GHI levels are the highest. Thus, the LP02 pyranometer underestimates the GHI levels of SolarGIS in clear sky conditions. Therefore, it is noted that during certain sky conditions, the CS300 overestimates the SolarGIS data.
On a monthly time scale (Figure 12), the SolarGIS database provides monthly average GHI values that are generally higher than those of the LP02 pyranometer. The gaps are low, at around −0.08 kWh/m2, while CS300 monthly averages were lower than SolarGIS, with differences of about 0.33 kWh/m2. In contrast, the monthly average values recorded by the CS300 sensor are less than those of the SolarGIS database. However, it should be noted that during February, March, and May to August, the monthly average values recorded by the LP02 sensor underestimated the satellite measurements. This aspect highlights the importance of in situ ground measurements for improving the accuracy of global solar radiation assessments. This assessment of GHI at different time scales is of paramount importance for determining the main characteristics of the local solar resource, including interannual variability and long-term statistical characteristics of GHI.
The measurements show that the LP02 pyranometer provides slightly higher irradiance values than the CS300. This difference is mainly explained by the wider spectral range of the LP02 (0.28–3 µm) and its slower response time, compared to the silicon-based sensor, which is sensitive over a narrower spectral range (0.36–1.12 µm) and reacts more quickly to rapid variations in irradiance (Table 1). Spectral-response differences, temperature response, and angular errors specific to silicon-based sensors also contribute to the observed discrepancies [46].
In terms of variation, SolarGIS and LP02 yielded R2 = 0.91, an MBE of −0.12 kWh/m2 (−2.61%), an RMSE of 0.17 kWh/m2 (3.82%), and an MAE of 0.14 kWh/m2 (3%). For SolarGIS and CS300, R2 was 0.77, with an MBE of −0.55 kWh/m2 (−13.1%), an RMSE of 0.59 kWh/m2 (14.0%), and an MAE of approximately 0.55 kWh/m2 (13.1%). These results indicate closer agreement between SolarGIS and LP02 than between SolarGIS and CS300.
These uncertainties are in agreement with other results from the literature. For example, NASA estimated Solcast and PVG’s data were compared with ground-based solar global measurements observed from six sites in the Republic of Ireland. The mean absolute percentage uncertainty (MAPE) for four sites ranged from 2.68% to 7.70%, and the RMSE was in the range of 0.45 to 5.71 W/m2. In contrast, in our study, the first comparative approach (SolarGis-LP02) shows a MAPE of 2.9% and an RMSE = 0.17 kWh/m2 (7.1 W/m2), thus indicating a slightly better agreement than the results (0.45 to 5.71 W/m2) reported in [47].
Studies carried out in China [48], based on the comparison between the monthly values estimated by CLARA-A2 and SARAH-E and the ground measurements from 59 stations, showed an overestimation of approximately 8.0 W/m2. This study corroborates our results (RMSE = 7.1 W/m2). Additionally, there was also a significant decrease in bias to −2.1 W/m2 for CLARA-A2 and −3.2 W/m2 for SARAH-E when only rural stations were taken into account. However, a global validation study based on six Solcast irradiance products [49], derived from the most recent satellites, reported RMSE values 9.0% higher than those we achieved with SolarGis-LP02 (3.8%). Compared to SolarGis-CS300, they were lower than our results of 14.0% (Table 2).
Under the same tropical climate, our work has shown a low RMSE value found with SolarGis-LP02, namely 3.8%. This value remains close to that observed in the study conducted at the Petrolina site in Brazil [50,51]. Indeed, they observed that the global solar radiation data from the CAMS satellite indicated better performance (2.0%) compared to other databases.
The annual average value determined from the CS300 in Brazzaville is 4.24 kWh/m2/d, close to 4.42 kWh/m2/day and 4.33 kWh/m2/day, which were observed during the first study of global solar radiation measurements carried out in 1968 and 1969 at the same location [52]. This average value from CS300 also remains close to the annual average value (4.41 kWh/m2/day) found in Léopoldville (current DRC/Kinshasa: 4°19′ S, 15°20′ E, 300 m) in 1951 [53]. These low annual average values, compared to those found with the LP02 sensor (4.67 kWh/m2/day), suggest an underestimation of the radiation balance by the sensors used in the studies in 1951, 1968, and 1969. The observed differences may be attributed to the technological limitations of the time (1951, 1968, and 1969), including the pyranometers used, such as the KIPP Belllani or KiPP and Zonen, and to the consideration of variations in the height of the sun and the spectral domain of the sensors.
In rural areas, compared to the Republic of Djibouti, which faces significant challenges in rural energy supply, the authors [54] determined, based on a surface solar irradiance model (SSI), a maximum relative error of around 8% and an average annual solar potential of 5.8 kWh/m2/day. Similarly, in the Colombian Amazon, effective renewable energy solutions for rural villages in isolated areas have been developed through a study conducted by [55] on the evaluation of different data sources (IDEAM) and solar irradiation estimates through simulations using satellite images (NASA/HOMER, NASA/POWER, RANDOM FOREST) [56,57,58]. Despite the limited number of ground stations, the comparison of different data sources shows that those from NASA exhibit a relative error of approximately 20.93%, which is greater than that of the RF satellite model when compared to the in situ reference data from IDEAM [59]. Based on these comparisons, this work suggests that the estimated solar radiation data are sufficiently reliable for the development of effective renewable energy-based solutions in isolated regions. However, they must be validated by in situ data for the design of microgrids and photovoltaic systems to improve energy access in isolated communities.
Finally, the procedure for conducting preliminary studies to assess solar and photovoltaic potential proves useful in planning to provide electricity to isolated rural communities or those not connected to the electrical grid. For the Republic of Congo, we have shown that it is possible to use SolarGIS data with RMSEs ranging from 0.17 to 0.59 kWh/m2/day, or between 3.8 and 14% (Table 2), which allows for reliable determination of the solar potential in different localities. These results are in line with the zonal values of photovoltaic production potential determined by SolarGIS (Figure 15). Indeed, the estimated photovoltaic production is around 1424 kWh/kWp. In order to estimate the number of households that can be served by a photovoltaic production system, this study relies on the work of [60] and the World Bank [61], in which a 50 kWp photovoltaic system would serve between 30 and 230 consumers in a rural community. Furthermore, the International Energy Agency [62] sets a minimum consumption of 250 kWh per household. In the case of this study, with 50 kWp, our photovoltaic system would produce 50 kWp × 1424 kWh/kWp = 71,200 kWh/year. Given the minimum consumption of the IEA, we would serve 285 households. This clearly illustrates the significant potential of these systems to contribute to access to electricity in the isolated rural areas of the Republic of Congo, potentially enabling the supply of electricity to several dozen households.
5. Conclusions
The difficulties related to the modernization of the Republic of Congo hinterland are particularly due to the lack of electricity and the remoteness of certain areas from the national power grid.
Policies have been developed within the framework of programs and development plans for the electrification of such areas. Consequently, this requires reliable measurements of solar energy potential, which cannot be deployed across the entire national territory. To do this, we conducted research to outline the development of photovoltaic solar systems that are better suited for equatorial regions.
This study evaluated the potential for photovoltaic energy production in Brazzaville, Republic of Congo, using in situ solar radiation measurements and SolarGIS satellite data. Ground measurements collected over a period of one year using the LP02 and CS300 pyranometers provided a database to characterize the solar resource and calibrate the SolarGIS data using statistical indicators.
The results show a strong correlation between the SolarGIS estimates and the LP02 measurements (R2 = 0.91). A comparatively weaker correlation was observed with the CS300 (R2 = 0.77). The RMSE is 0.17 kWh/m2/day (3.8%) for the LP02, corresponding to an estimated uncertainty in photovoltaic energy production of approximately 0.14 kWh/kWp/day. On the other hand, the CS300 shows a higher RMSE of approximately 0.59 kWh/m2/day (14.0%), corresponding to an estimated photovoltaic energy production of around 0.49 kWh/kWp/day.
Based on ground measurements, the average photovoltaic energy yield is estimated at approximately 3.9 kWh/kWp/day, which is about 1424 kWh/kWp/year for the LP02 and 3.5 kWh/kWp/day for the CS300. Based on this, we estimated that a 50 kWp photovoltaic solar system could potentially power around 285 households in a village. Our work is a precursor for planning and investments within the framework of a country’s rural electrification policy. Thus, our results highlight the broader role that photovoltaic solar energy could play in the sustainable energy transition of the Republic of Congo. The deployment of photovoltaic systems could help diversify the national electricity mix in addition to existing electricity production technologies.
Public policies should therefore encourage the development of photovoltaic infrastructure, particularly decentralized systems and solar mini-grids, while establishing appropriate regulatory and institutional frameworks. Unfortunately, investments in developing countries are hindered by their debt, thus limiting the execution of programs and plans for the rapid development of photovoltaic solar systems in rural areas of interest. However, SolarGIS calibration measurement campaigns will still be required to consolidate this work in the country’s other climatic zones because seasonal local meteorological factors, such as variable cloud cover during the rainy season and dust accumulation on sensors and solar panels during the dry season [63].
Author Contributions
Conceptualization, F.P.T., M.D.N.N., C.B.B., B.M.-M. and J.C.L.; methodology, F.P.T. and C.B.B.; formal analysis, F.P.T. and M.D.N.N.; investigation, F.P.T., M.D.N.N. and B.M.-M.; resources, M.D.N.N., B.M.-M. and J.C.L.; data curation, F.P.T.; writing—original draft preparation, F.P.T. and M.D.N.N.; writing—review and editing, F.P.T., C.B.B., M.D.N.N., B.M.-M. and J.C.L.; visualization, F.P.T. and M.D.N.N.; supervision, B.M.-M. and J.C.L.; project administration, M.D.N.N., B.M.-M. and J.C.L.; funding acquisition, M.D.N.N., B.M.-M. and J.C.L. Original data are available from F.P.T. and M.D.N.N. All authors have read and agreed to the published version of the manuscript.
Funding
The Royal Society-DFID Africa Capacity Building Initiative grant provided financial support for this work in the “Africa Clean Energy Research Alliance” ACERA project “Solar Treatment of biomass for power generation”. This work was carried out with the aid of a grant from UNESCO and the International Development Research Centre, Ottawa, Canada. The views expressed herein do not necessarily represent those of UNESCO, IDRC or its Board of Governors. Financial support at Leeds was provided by the grant: CRESUM HYRES: Creating resilient sustainable microgrids through hybrid renewable energy systems (EPSRC. EP/R030243/1).
Data Availability Statement
The original contributions presented in this study are included in the article. Further inquiries can be directed to the corresponding author.
Acknowledgments
We are grateful for the equipment funded by the CRESUM-HYRES grant, which was approved by the UK PI and Co-I responsible for the solar component of the project. The authors would like to acknowledge SolarGIS in Slovakia for Solar data availability and the Institut National de Recherche en Sciences Exactes et Naturelles (IRSEN) in Brazzaville for logistical contribution.
Conflicts of Interest
The authors declare no conflicts of interest.
References
- Yang, Y.; Xia, S.; Huang, P.; Qian, J. Energy Transition: Connotations, Mechanisms and Effects. Energy Strategy Rev. 2024, 52, 101320. [Google Scholar] [CrossRef] [Scilit]
- Rahman, A.; Murad, S.M.W.; Mohsin, A.K.; Wang, X. Does Renewable Energy Proactively Contribute to Mitigating Carbon Emissions in Major Fossil Fuels Consuming Countries? J. Clean. Prod. 2024, 452, 142113. [Google Scholar] [CrossRef] [Scilit]
- Ghorbani, Y.; Zhang, S.E.; Nwaila, G.T.; Bourdeau, J.E.; Rose, D.H. Embracing a Diverse Approach to a Globally Inclusive Green Energy Transition: Moving Beyond Decarbonisation and Recognising Realistic Carbon Reduction Strategies. J. Clean. Prod. 2024, 434, 140414. [Google Scholar] [CrossRef] [Scilit]
- Peng, K.; Feng, K.; Chen, B.; Shan, Y.; Zhang, N.; Wang, P.; Fang, K.; Bai, Y.; Zou, X.; Wei, W.; et al. The Global Power Sector’s Low-Carbon Transition May Enhance Sustainable Development Goal Achievement. Nat. Commun. 2023, 14, 3144. [Google Scholar] [CrossRef] [Scilit] [PubMed]
- Ouedraogo, N.S. Modeling sustainable long-term electricity supply-demand in Africa. Appl. Energy 2017, 190, 1047–1067. [Google Scholar] [CrossRef] [Scilit]
- Ahmad, T.; Zhang, D. A critical review of comparative global historical energy consumption and future demand: The story told so far. Energy Rep. 2020, 6, 1973–1991. [Google Scholar] [CrossRef] [Scilit]
- Spalding-Fecher, R.; Senatla, M.; Yamba, F.; Lukwesa, B.; Himunzowa, G.; Heaps, C.; Chapman, A.; Mahumane, G.; Tembo, B.; Nyambe, I. Electricity supply and demand scenarios for the Southern African power pool. Energy Policy 2017, 101, 403–414. [Google Scholar] [CrossRef] [Scilit]
- Adom, P.K.; Insaidoo, M.; Minlah, M.K.; Abdallah, A.-M. Does renewable energy concentration increase the variance/uncertainty in electricity prices in Africa? Renew. Energy 2017, 107, 81–100. [Google Scholar] [CrossRef] [Scilit]
- Omaye, S.O.; Sa’ad, S.; Adama, A.H.; Dotti, R. Energy consumption, economic growth and energy transition in Africa: A cross-sectional dependence analysis. Energy Rev. 2022, 46, 502–514. [Google Scholar] [CrossRef] [Scilit]
- World Bank. World Development Indicators: Access to Electricity (% of Population); World Bank: Washington, DC, USA, 2023.
- Banque Mondiale/République du Congo. Pacte National Énergétique de la République du Congo—Initiative Mission 300. Sommet de Dar es Salaam, Janvier 2025. 2025. Available online: https://thedocs.worldbank.org/en/doc/ce91545b5a0c9e201bc7622f58b26618-0010012025/original/Congo-National-Energy-Compact-Mission-300.pdf (accessed on 8 June 2026).
- Republic of Congo. Plan National de Développement (PND) 2022–2026: Une Économie Forte, Diversifiée et Résiliente, pour Une Croissance Inclusive et un Développement Durable Irréversible; Journal Officiel de la République du Congo: Brazzaville, Congo, 2022.
- World Bank; Republic of Congo. National Energy Compact of the Republic of the Congo—Mission 300 Initiative; World Bank: Washington, DC, USA; Government of the Republic of Congo: Brazzaville, Congo, 2025.
- Harmsen, E.W.; Cruz, P.T.; Mecikalski, J.R. Calibration of selected pyranometers and satellite derived solar radiation in Puerto Rico. Int. J. Renew. Energy Technol. 2014, 5, 43–54. [Google Scholar] [CrossRef] [Scilit]
- Ouhechou, A.; Philippon, N.; Morel, B.; Trentmann, J.; Graillet, A.; Mariscal, A.; Nouvellon, Y. Inter-comparison and validation against in-situ measurements of satellite estimates of incoming solar radiation for Central Africa: From the annual means to the diurnal cycles. Atmos. Res. 2023, 287, 106711. [Google Scholar] [CrossRef] [Scilit]
- Bilal, B.; Graversen, R.; Boström, T. Solar radiation estimation at high latitudes: Assessment of the CMSAF databases, ASR and ERA5. Sol. Energy 2019, 182, 397–411. [Google Scholar] [CrossRef] [Scilit]
- Du, Y.; Shi, H.; Zhang, J.; Xia, X.; Yao, Z.; Fu, D.; Hu, B.; Huang, C. Evaluation of MERRA-2 hourly surface solar radiation across China. Sol. Energy 2022, 234, 103–110. [Google Scholar] [CrossRef] [Scilit]
- Palmer, D.; Blanchard, R. Evaluation of High-Resolution Satellite-Derived Solar Radiation Data for PV Performance Simulation in East Africa. Sustainability 2021, 13, 11852. [Google Scholar] [CrossRef] [Scilit]
- Mabasa, B.; Lysko, M.D.; Moloi, S.J. Validating Hourly Satellite Based and Reanalysis Based Global Horizontal Irradiance Datasets over South Africa. Geomatics 2021, 1, 429–449. [Google Scholar] [CrossRef] [Scilit]
- Kakou, P.-C.K.; Laouali, D.; Aka, B.; Osei, J.A.; Ette, N.F.K.; Frey, G. Multi-Timescale Validation of Satellite-Derived Global Horizontal Irradiance in Cote d’Ivoire. Remote Sens. 2025, 17, 998. [Google Scholar] [CrossRef] [Scilit]
- Almarshoud, A.F. Validation of Satellite-Derived Solar Irradiance Datasets: A Case Study in Saudi Arabia. Future Sustain. Energy Syst. 2024, 2, 1–7. [Google Scholar] [CrossRef] [Scilit]
- Esposito, E.; Leanza, G.; Di Francia, G. Comparative Analysis of Ground-Based Solar Irradiance Measurements and Copernicus Satellite Observations. Energies 2024, 17, 1579. [Google Scholar] [CrossRef] [Scilit]
- Logothetis, S.-A.; Salamalikis, V.; Kazantzidis, A. A Machine Learning Approach to Retrieving Aerosol Optical Depth Using Solar Radiation Measurements. Remote Sens. 2024, 16, 1132. [Google Scholar] [CrossRef] [Scilit]
- Rodriguez, E.; Garcia-Ferrero, J.; Sanchez-Aparicio, M.; Iglesias, J.M.; Oliver-Serra, A.; Santos, M.J.; Andres-Anaya, P.; Cascon, J.M.; Montero Garcia, G.; Medina, A.; et al. Validation of a 3D Local-Scale Adaptive Solar Radiation Model by Using Pyranometer Measurements and a High-Resolution Digital Elevation Model. Sensors 2024, 24, 1823. [Google Scholar] [CrossRef] [Scilit] [PubMed]
- Raptis, I.-P.; Kazadzis, S.; Fountoulakis, I.; Papachristopoulou, K.; Kouklaki, D.; Psiloglou, B.E.; Kazantzidis, A.; Benetatos, C.; Papadimitriou, N.; Eleftheratos, K. Evaluation of the Solar Energy Nowcasting System (SENSE) during a 12-Months Intensive Measurement Campaign in Athens, Greece. Energies 2023, 16, 5361. [Google Scholar] [CrossRef] [Scilit]
- Ayompe, L.M.; Duffy, A. An Assessment of the Energy Generation Potential of Photovoltaic Systems in Cameroon Using Satellite-Derived Solar Radiation Datasets. Sustain. Energy Technol. Assess. 2013, 5, 3228–3241. [Google Scholar] [CrossRef] [Scilit]
- Fall, B. ICT in Education in the Republic of Congo (Congo-Brazzaville); World Bank: Washington, DC, USA, 2007.
- De Wasseige, C.; Tadoum, M.; Eba’a, A.R.; Doumenge, C. The Forests of the Congo Basin-Forests and Climate Change; Weyrich: Bastogne, Belgium, 2015. [Google Scholar]
- FOSA. Études Prospectives du Secteur Forestier en Afrique, République du Congo; FOSA: Brazzaville, Congo, 2007. [Google Scholar]
- Kimpouni, V.; Nzila, J.D.D.; Watha-Ndoudy, N.; Madzella-Mbiemo, M.I.; Yallo Mouhamed, S.; Kampe, J.-P. Exploring Local People’s Perception of Ecosystem Services in Djoumouna Periurban Forest, Brazzaville, Congo. Int. J. For. Res. 2021, 2021, 6612649. [Google Scholar] [CrossRef] [Scilit]
- UICN. Atlas pour la Conservation des Forêts Tropicales d’Afrique; UICN: Gland, Switzerland, 1996. [Google Scholar]
- Mpounza, M.; Samba-Kimbata, M.J. Aperçu sur le climat de l’Afrique centrale occidentale. In Paysages Quaternaires de l’Afrique Centrale Atlantique; Raymond, L., Dominique, S., Eds.; ORSTOM: Paris, France, 1990; pp. 31–41. [Google Scholar]
- Gonmadje, C.F.; Doumenge, C.; Sunderland, T.C.H.; Balinga, M.P.B.; Sonké, B. Analyse phytogéographique des forêts d’Afrique Centrale: Le cas du massif de Ngovayang (Cameroun). Plant Ecol. Evol. 2012, 145, 152–164. [Google Scholar] [CrossRef] [Scilit]
- Simo-Tagne, M.; Bennamoun, L. Numerical study of timber solar drying with application to different geographical and climatic conditions in Central Africa. Sol. Energy 2018, 170, 454–469. [Google Scholar] [CrossRef] [Scilit]
- Kent, K.R.; Banda, E.J.K.B.; Phillip, K. Determining global solar radiation incident on tilted surfaces with different tilt angles at the department of physics Makerere university. Phys. Sci. Int. J. 2016, 12, 1–19. [Google Scholar] [CrossRef] [Scilit]
- Lo, F.T.; Avolio, E.; Gullì, D.; Federico, S.; Calidonna, C.R.; Sempreviva, A. Comparison of hourly solar radiation from a ground–based station, remote sensing and weather forecast models at a coastal site of South Italy (Lamezia Terme). Energy Procedia 2015, 76, 148–155. [Google Scholar] [CrossRef] [Scilit]
- ISO 9060:2018; Solar Energy—Specification and Classification of Instruments for Measuring Hemispherical Solar and Direct Solar Radiation. ISO: Geneva, Switzerland, 2018.
- Urraca, R.; Martinez-de-Pison, E.; Sanz-Garcia, A.; Antonanzas, J.; Antonanzas-Torres, F. Estimation methods for global solar radiation: Case study evaluation of five different approaches in central Spain. Renew. Sustain. Energy Rev. 2017, 77, 1098–1113. [Google Scholar] [CrossRef] [Scilit]
- World Bank. Global Solar Atlas 2.0. Solar Resource Data: SOLARGIS. Available online: https://solargis.com/resources/free-maps-and-gis-data?locality=republic-of-the-congo (accessed on 25 April 2025).
- Kouklaki, D.; Papachristopoulou, K.; Fountoulakis, I.; Tsekeri, A.; Raptis, P.-I.; Kazadzis, S.; Eleftheratos, K. Impact of Aerosols on Surface Solar Radiation and Solar Energy in the Mediterranean Basin. Environ. Sci. Proc. 2023, 26, 56. [Google Scholar] [CrossRef] [Scilit]
- World Bank; Solargis. Global Solar Atlas 2.0: Validation Report. 2019. Available online: https://documents.worldbank.org/en/publication/documents-reports/documentdetail/507341592893487792 (accessed on 11 October 2024).
- World Bank; Solargis. Global Photovoltaic Power Potential by Country; World Bank: Washington, DC, USA, 2020.
- Baurzhan, S.; Jenkins, G.P. Off-grid solar PV: Is it an affordable or appropriate solution for rural electrification in Sub-Saharan African countries? Renew. Sustain. Energy Rev. 2016, 60, 1405–1418. [Google Scholar] [CrossRef] [Scilit]
- Dincer, I.; Rosen, M.A. Exergy: Energy, Environment and Sustainable Development; Elsevier: Amsterdam, The Netherlands, 2016. [Google Scholar]
- World Bank. Indicators. 2016. Available online: http://data.worldbank.org/indicator (accessed on 8 June 2026).
- Mubarak, R.; Schilke, H.; Seckmeyer, G. Improving the Irradiance Data Measured by Silicon-Based Sensors. Energies 2021, 14, 2766. [Google Scholar] [CrossRef] [Scilit]
- AlFaraj, J.; Popovici, E.; Leahy, P. Solar Irradiance Database Comparison for PV System Design: A Case Study. Sustainability 2024, 16, 6436. [Google Scholar] [CrossRef] [Scilit]
- Wang, Y.; Trentmann, J.; Yuan, W.; Wild, M. Validation of CM SAF CLARA-A2 and SARAH-E surface solar radiation datasets over China. Remote Sens. 2018, 10, 1977. [Google Scholar] [CrossRef] [Scilit]
- Yang, D.; Bright, J.M. Worldwide validation of 8 satellite-derived and reanalysis solar radiation products: A preliminary evaluation and overall metrics for hourly data over 27 years. Sol. Energy 2020, 210, 3–19. [Google Scholar] [CrossRef] [Scilit]
- Salazar, G.; Gueymard, C.; Galdino, J.B.; de Castro Vilela, O.; Fraidenraich, N. Solar irradiance time series derived from high-quality measurements, satellite-based models, and reanalyses at a near-equatorial site in Brazil. Renew. Sustain. Energy Rev. 2020, 117, 109478. [Google Scholar] [CrossRef] [Scilit]
- Solargis. Global Solar Atlas 2.0: Validation Report; Energy Sector Management Assistance Program (ESMAP); World Bank: Washington, DC, USA, 2019.
- Riou, C. Le Rayonnement Solaire à Brazzaville en 1968 et 1969; ORSTOM: Brazzaville, Congo, 1970.
- Dupont, G.; Schüepp, W. Solar Radiation in Léopoldville (Belgian Congo); Radiation Bureau, Meteorological Service of the Colony: Léopoldville, Congo, 1954. [Google Scholar]
- Pillot, B.; Muselli, M.; Poggi, P.; Dias, J.B. Satellite-based assessment and in situ validation of solar irradiation maps in the Republic of Djibouti. Sol. Energy 2015, 120, 603–619. [Google Scholar] [CrossRef] [Scilit]
- Ordoñez Palacios, L.E.; Bucheli Guerrero, V.A.; Caicedo Bravo, E.F. Assessment of Solar Irradiation Data Sources and Prediction Models for Rural Villages in the Colombian Amazon Region. IEEE Lat. Am. Trans. 2024, 22, 1019–1025. [Google Scholar] [CrossRef] [Scilit]
- Ordoñez Palacios, L.E.; Bucheli Guerrero, V.; Ordoñez, H. Machine Learning for Solar Resource Assessment Using Satellite Images. Energies 2022, 15, 3985. [Google Scholar] [CrossRef] [Scilit]
- HOMER Energy. HOMER Pro—Microgrid Software for Designing Optimized Hybrid Microgrids. Available online: https://www.homerenergy.com/homer-pro (accessed on 9 June 2021).
- NASA (National Aeronautics and Space Administration). POWER Project. Data Access Viewer (DAV). Available online: https://power.larc.nasa.gov/data-access-viewer/ (accessed on 21 March 2023).
- IDEAM. Consulta y Descarga de Datos Hidrometeorológicos. Available online: https://atencionciudadano.ideam.gov.co/ (accessed on 9 June 2021).
- Tangka, J.K.; Besong, M.B.; Djoukeng, H.G. Performance Evaluation of a Typical 50kWp Solar Park Village Energy Option in Cameroon. Eur. J. Appl. Sci. 2023, 11, 98–116. [Google Scholar] [CrossRef] [Scilit]
- World Bank. Off-Grid Solar Access Project for Underserved Counties in Kenya: Project Appraisal Document. Report No. PAD2008, Energy and Extractives Global Practice, Africa Region; World Bank: Washington, DC, USA, 2017.
- International Energy Agency (IEA). World Energy Outlook 2015—Methodology for Energy Access Analysis. 2015. Available online: https://iea.blob.core.windows.net/assets/5a314029-69c2-42a9-98ac-d1c5deeb59b3/WEO2015.pdf (accessed on 3 March 2020).
- Bouka Biona, C.; Boutin, C. Évolution saisonnière de l’échelle spatiale du rayonnement solaire global en zone Sahélienne. Atmos. Ocean 1985, 23, 117–134. [Google Scholar] [CrossRef] [Scilit]

Disclaimer/Publisher’s Note: The statements, opinions and data contained in all publications are solely those of the individual author(s) and contributor(s) and not of MDPI and/or the editor(s). MDPI and/or the editor(s) disclaim responsibility for any injury to people or property resulting from any ideas, methods, instructions or products referred to in the content. |
© 2026 by the authors. Licensee MDPI, Basel, Switzerland. This article is an open access article distributed under the terms and conditions of the Creative Commons Attribution (CC BY) license.