


Abstract
To address the harmonic amplification problem caused by the injection of characteristic harmonics into the AC side of an LCC sending-end converter station, this paper proposes a resonance localization and suppression method based on the harmonic amplification theory and the s-domain nodal admittance matrix. First, a frequency-domain nodal admittance matrix model of the AC-side system is established. Resonance mode analysis is performed to obtain the potential resonant frequencies, damping levels, and nodal voltage mode shapes, thereby identifying the risk frequency bands and sensitive nodes for characteristic harmonic amplification. Second, the nodal impedance matrix is obtained by inverting the nodal admittance matrix, and the mutual impedance characteristics between the harmonic source and various nodes, as well as the propagation and amplification mechanism of characteristic harmonics in the AC network, are analyzed. Third, a parameter perturbation method is adopted to analyze the influence of key electrical parameters on harmonic amplification, providing a basis for sensitive component identification and mitigation measure design. Finally, a C-type damping filter is installed at the identified resonance-sensitive nodes to suppress the resonance. The results show that the proposed method can effectively characterize the frequency-domain resonance characteristics of the AC side of the converter station, and the C-type damping filter can reduce the impedance peak in the target frequency band and enhance system damping, thus effectively suppressing characteristic harmonic amplification.
1. Introduction
With the continuous growth of centralized development and long-distance transmission demands for large-scale renewable energy bases, ultra-high-voltage direct current (UHVDC) transmission technology has been widely applied in modern power systems due to its advantages of large transmission capacity, long transmission distance, and low line losses [1,2]. In UHVDC transmission systems, converter stations play a critical role in energy conversion between AC and DC systems. Their complex structure and prominent electromagnetic transient characteristics not only affect the safety and stability of the DC transmission system itself but also significantly impact the power quality of the AC-side grid. Among various converter topologies, the line-commutated converter (LCC) is still widely adopted in sending-end stations of large-scale renewable energy bases due to its high power rating, mature technology, and low cost. Therefore, the harmonic behavior of LCC sending-end converter stations deserves particular attention.
For LCC stations, due to the pronounced nonlinear switching characteristics of thyristor converters, typical 12-pulse converter valve groups inject characteristic currents of order 12k ± 1 into the AC system in practical engineering. When the parameters of components such as AC system lines, transformers, filters, and reactive power compensation devices form resonance conditions with these characteristic harmonics, harmonic currents may be amplified in the network, which may result in elevated bus harmonic voltage, filter overload, capacitor overheating and protection misoperation, endangering equipment safety and grid power quality [3,4,5]. This phenomenon is referred to as characteristic harmonic amplification, and it is particularly pronounced in LCC sending-end stations where the AC network is relatively weak and the harmonic source is concentrated. Therefore, studying the propagation mechanism and suppression methods of characteristic harmonic amplification on the AC side of LCC converter stations is of great significance for ensuring the safe and stable operation of UHVDC transmission projects.
Currently, extensive research has been conducted on AC/DC oscillation problems in renewable energy systems. These studies can be broadly categorized into time-domain methods and frequency-domain methods. References [6,7] adopt eigenvalue analysis methods based on state-space models to analyze oscillation problems, but these methods face the “curse of dimensionality” and difficulties in model establishment in power systems with high penetration of power electronics. Reference [8] focuses on suppressing harmonic amplification and studies optimal configuration schemes for grid-connected inverters, but the optimization objective is single and does not consider investment costs and hardware configuration, making it difficult to implement in engineering. Reference [9] proposes a multi-objective parameter optimization method for passive filters in converter stations, but fails to analyze the transfer and amplification of harmonics from a mechanism perspective.
In recent years, the main analysis method for system harmonics and resonance stability is the impedance analysis method [10,11,12], which is generally based on the “negative resistance” effect exhibited by power electronic devices [13,14]. However, Reference [15] proposes that resonance stability analysis and control of AC grids based on impedance models of power electronic devices cannot be established. To address this issue, Reference [16] represents the nonlinear characteristics of power electronic devices using harmonic voltage sources and harmonic current sources, allowing renewable energy power systems to still be described by linear systems. It explains the mechanism of wideband oscillations as a “harmonic amplification” phenomenon caused by network resonance, thereby establishing a new framework for explaining the mechanism of wideband oscillations in renewable energy power systems. Reference [17] constructs a benchmark test system for this new framework, verifies the feasibility of the “harmonic amplification” theory using a positive-sequence network model, and demonstrates the applicability of analyzing harmonic amplification effects based on positive-sequence network models. This harmonic amplification theory provides the theoretical foundation for the present work.
Within the harmonic amplification framework, an efficient frequency-domain tool is still needed to localize resonance and identify sensitive nodes in a complex grid. The frequency-domain analysis method based on the s-domain nodal admittance matrix can uniformly characterize the electrical characteristics of various system components at different frequencies and can further reveal the coupling relationship between harmonic injection points and response points through the nodal impedance matrix [18,19,20]. Compared with traditional time-domain simulation methods, the s-domain nodal admittance matrix method does not require multiple repeated time-domain calculations and can directly scan system impedance characteristics in the frequency domain, greatly improving the efficiency of resonance analysis, especially suitable for harmonic resonance assessment in large-scale complex power grids. Therefore, within the framework of harmonic amplification theory, the s-domain nodal admittance matrix method is still applicable for resonance localization and sensitive node identification in complex power grids [21].
Based on harmonic amplification theory, this paper addresses the characteristic harmonic amplification problem on the AC side of LCC stations. The s-domain nodal admittance matrix method is used to establish a system frequency-domain model. Through matrix analysis and simulation analysis, the mutual impedance between harmonic injection points and observation points is obtained, and the transfer and amplification characteristics of harmonics in the network are observed. On this basis, a parameter perturbation method is further combined to identify key nodes and key branches that significantly affect specific high-order harmonic amplification, and a C-type damping filter is installed to verify the suppression effect on harmonic amplification. By avoiding the inaccuracy of impedance modeling of power electronic devices, this study provides a theoretical basis for the selection of characteristic harmonic mitigation schemes and the design of their parameters.
2. Resonance Localization and Sensitivity Analysis Based on s-Domain Nodal Admittance Matrix Method
2.1. s-Domain Nodal Admittance Matrix Modeling
To analyze the system, the s-domain nodal admittance matrix of the system must first be established. Currently, mature harmonic impedance models exist for various components in AC systems [22].
As the power source of the power system, the synchronous generator is an indispensable component in AC systems. According to the physical characteristics of the generator, the harmonic model of the generator can be simulated by a series circuit of resistance and reactance. Considering the frequency-dependent characteristics of generator resistance and reactance as well as the skin effect, the basic harmonic model of the generator can be expressed as:
where Ra is the resistance of the generator; Xd″ is the subtransient reactance of the generator; f0 is the reference frequency of the system; h is the harmonic order, and f = h×f0.
Systematic research has been conducted on transformer harmonic models [23]. According to the physical characteristics of transformers, the harmonic model of transformers can be simulated by a π-type circuit. Considering the frequency-dependent characteristics of transformer resistance and reactance, the basic harmonic model of transformers in this paper is expressed as:
where RT is the transformer resistance; XT is the transformer reactance; ZT is the transformer impedance.
ZT(f) = RT(f) + jXT(f)
Transmission lines can also be simulated using a π-type circuit. When the transmission line is relatively long, distributed parameters are used for the transmission line. Considering the skin effect, its harmonic model can be expressed as:
where R0 is the resistance per unit length of the transmission line, X0 is the reactance per unit length of the transmission line, B0 is the susceptance per unit length of the transmission line, L is the transmission line length; Zs is the surge impedance of the transmission line, γ is the propagation coefficient of the transmission line; and Zeq is the equivalent series impedance of the transmission line, Yeq is the equivalent shunt admittance of the transmission line.
Based on the harmonic models of various components in the power system, the s-domain nodal admittance matrix Y(s) of the system can be obtained.
2.2. s-Domain Matrix Solution and Resonance Localization
In the frequency domain, the nodal injection current and nodal voltage satisfy:
where V(s) is the nodal voltage vector, and I(s) is the nodal current vector.
I(s) = V(s)Y(s)
To avoid the difficulty of directly solving for the zeros of the determinant of the s-domain nodal admittance matrix, a two-stage solution method is adopted: estimation in an undamped system followed by precise solution in the complete system [19]. After solving, we obtain:
where sk is the k-th zero of the matrix determinant, i.e., the k-th resonance mode; the real part σk is the resonance attenuation factor; the imaginary part ωk is the resonance angular frequency.
det[Y(sk)] = 0 ⇒ sk = −σk + ωk
According to matrix theory, for each resonance mode, the corresponding right eigenvector can be obtained:
where is the unit right eigenvector corresponding to the sk resonance mode, called the nodal voltage mode shape vector [19]. It is normalized such that
The element with the largest absolute value in vector is 1, and the remaining elements are scaled proportionally. Therefore, the absolute values of the elements in the vector range between 0 and 1. The larger the absolute value of an element, the higher the voltage participation degree of that node in this resonance mode; the node with an element value of 1 is the dominant node of this mode.
To further analyze the response relationship of nodal voltages to characteristic harmonic current injection, the nodal impedance matrix is obtained by inverting the nodal admittance matrix:
Z(s) = Y−1(s)
The element Zij(s) of matrix Z(s) characterizes the voltage response at node i caused by current injection at node j; i.e.,
where the diagonal element Zii(s) is the self-impedance of node i, reflecting the voltage amplification capability of that node for local harmonic injection; the off-diagonal element Zij(s) is the mutual impedance between nodes, reflecting the harmonic propagation coupling strength between nodes.
When harmonic current Ik(s) is injected only at node k, we have:
Ui(s) = Zik(s)Ik(s)
Furthermore, to identify which node is most sensitive at the target resonance angular frequency ωr and which nodes have the strongest coupling, the nodal resonance sensitivity index is defined as:
where Sinode(ωr) is the nodal resonance sensitivity index, whose physical meaning is the proportion of node i in the total resonance response.
The normalized harmonic propagation index between nodes is defined as:
where Pij(ωr) is the normalized harmonic propagation index, used to measure the relative strength of harmonic disturbance propagation from node j to node i. The larger this index, the more critical the propagation path from node j to node i.
On this basis, to account for both the local amplification characteristics of the node itself and the coupling propagation characteristics with other nodes, the nodal comprehensive influence index is defined as:
where Di(ωr) is the nodal comprehensive influence index; α and β are weight coefficients for local amplification and propagation coupling effects, respectively, satisfying:
α + β = 1
Equation (15) characterizes the comprehensive role of nodes in resonance formation from two dimensions: “node self-amplification capability” and “network coupling propagation capability”. By ranking according to Di(ωr), sensitive node localization can be achieved. Regarding the weighting coefficients α and β, they reflect the relative importance of the nodal self-amplification capability and the network coupling propagation capability, respectively. In this paper, α = 0.4 and β = 0.6 are adopted based on engineering experience. In the harmonic amplification problem of an LCC sending-end converter station, the harmonic voltage response at a node is determined not only by its own self-impedance but also, to a significant extent, by the coupling propagation from other nodes. In such weak AC networks with concentrated harmonic sources, the network coupling propagation effect is generally slightly stronger than the local amplification effect, so β is chosen to be slightly larger than α.
The resonance frequencies, nodal voltage mode shapes, and nodal comprehensive influence indices obtained from the above s-domain analysis will provide a basis for the parameter tuning of the subsequent C-type damping filter: the resonance frequency determines the tuning frequency of the filter, and the nodal voltage mode shapes and nodal comprehensive influence index distribution determine the installation location of the filter.
2.3. Parameter Sensitivity Analysis Method
Based on the established nodal admittance matrix Y(s) and nodal impedance matrix Z(s), the influence of system parameter variations on nodal impedance characteristics can be further analyzed. Since filter parameters, line parameters, and system equivalent parameters in the AC system all change the network admittance distribution, it is necessary to study the effects of various parameters on nodal self-impedance, nodal mutual impedance, and nodal comprehensive influence degree from the perspective of parameter perturbation, thereby providing a basis for sensitive element identification and subsequent resonance control.
Let the system parameter vector be:
The nodal admittance matrix and impedance matrix can both be expressed as functions of the parameter vector p; i.e.,
From the matrix identity relationship:
Z(s)Y(s)=I
Taking the derivative with respect to parameter pk, we obtain:
Further rearranging:
Equation (18) shows that any change in parameter pk acts on the entire impedance matrix through the nodal admittance matrix. Therefore, parameter sensitivity analysis is essentially examining the influence of parameter perturbation on the distribution characteristics of each element of the impedance matrix.
The sensitivity of nodal mutual impedance to parameter pk is:
Its normalized form is:
If Sij,knorm(ω) is large, it indicates that parameter pk has a strong influence on the coupling relationship between node i and node j, meaning that this parameter is more likely to change the strength distribution of harmonic propagation in the system.
3. Principle and Parameter Tuning Strategy of C-Type Damping Filter
The C-type damping filter is a passive filtering device that combines reactive power compensation, harmonic filtering, and damping enhancement. Compared with traditional single-tuned or high-pass filters, its main feature is the fundamental frequency tuning branch, which bypasses the damping resistor at the fundamental frequency, thereby significantly reducing fundamental active power loss. In the harmonic frequency band, the damping resistor participates in network damping and suppresses resonance modes over a relatively wide frequency range. Therefore, the C-type filter is highly suitable for suppressing harmonic amplification caused by characteristic harmonics.
The C-type damping filter is a passive filtering device that combines reactive power compensation, harmonic filtering, and damping enhancement functions. Compared with traditional single-tuned filters or high-pass filters, the main feature of the C-type filter is the introduction of a fundamental frequency tuning circuit in the damping branch, which essentially bypasses the damping resistor at the fundamental frequency, thereby significantly reducing fundamental active power loss. In the harmonic frequency band, the damping resistor participates in network damping, producing suppression effects on resonance modes within a relatively wide frequency band. Therefore, the C-type filter is highly suitable for suppressing harmonic amplification caused by characteristic harmonics [24].
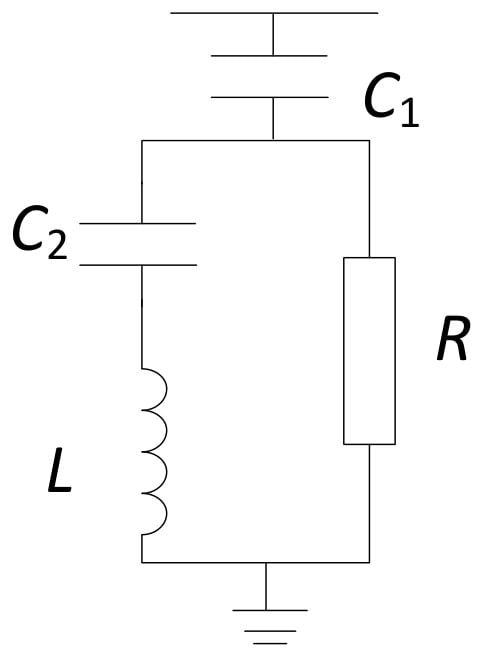
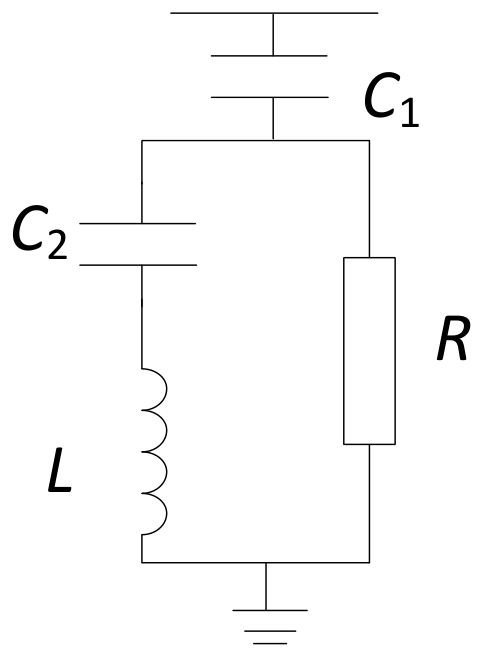
The typical C-type damping filter topology is shown in Figure 1, consisting of the main capacitor C1, tuning inductor L, auxiliary capacitor C2, and damping resistor R. Among them, the tuning inductor and auxiliary capacitor form a series resonant branch, which is tuned at the fundamental frequency. Its fundamental frequency tuning condition can be expressed as:
where ω0 is the system fundamental angular frequency; XL is the reactance of L at the fundamental frequency; and XC2 is the reactance of C2 at the fundamental frequency.
XL = XC2 ⇒ ω0L = 1/ω0C2
Figure 1.
Topology of the C-type damped filter.
When the frequency is the fundamental frequency, the impedance of the series branch formed by L and C2 is close to zero, and the damping resistor is bypassed. Therefore, the fundamental current flowing through the damping resistor is very small, and the fundamental active power loss is low.
To determine the C-type damping filter parameters and enable the filter to provide maximum damping in the target resonance frequency, the parameter tuning is carried out according to the following steps [16].
First, determine the main capacitor parameter C1. C1 mainly determines the reactive power compensation capacity provided by the filter at the fundamental frequency. Therefore, C1 can be determined according to the reactive power compensation capacity required by the system. The relationship can be written as:
QC = XC1U2
From this, we obtain:
where QC is the reactive power provided by the filter at the fundamental frequency; U is the RMS value of the line voltage at the connected bus.
The selection of the main capacitor should consider not only the reactive power compensation requirement but also the influence on system impedance characteristics. The selection of C1 should strike a balance between reactive power compensation requirements and resonance suppression effects.
At the h-th harmonic, the complete impedance of the C-type damping filter is:
To provide maximum damping at the tuning order n, the input impedance at this frequency should be purely resistive; i.e., its imaginary part is zero:
Rearranging into a quadratic equation in terms of XC2:
For this equation to have a real solution, the discriminant must be non-negative, which gives R ≥ 2 XC1/n. To maximize damping, R takes its minimum value:
At this time, Equation (29) has a unique solution:
In summary, the parameter tuning formulas for the C-type damping filter when suppressing the n-th harmonic are:
4. Case Study
4.1. Case Introduction
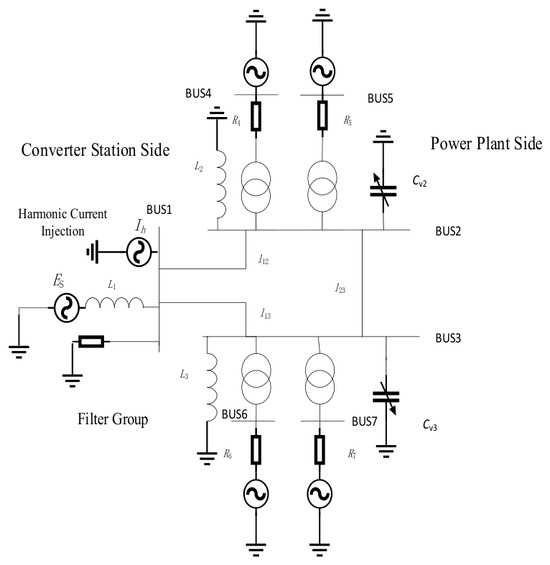
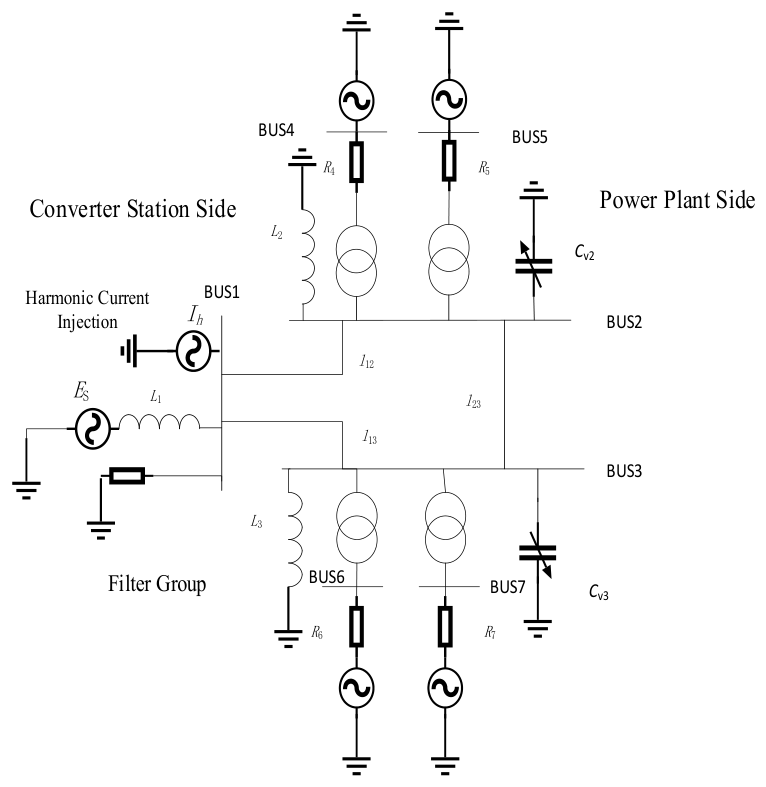
To verify the accuracy of the proposed theory, for the phenomenon of harmonic voltage rise and harmonic current amplification caused by the injection of the 23rd characteristic harmonic into the AC system at an LCC sending-end converter station, s-domain matrix analysis was performed in MATLAB R2024a, and time-domain simulation analysis was conducted in PSCAD. Figure 2 shows the structure of the AC side of this system, with a total of 7 nodes. BUS1 is connected to the LCC station in the actual system and belongs to the harmonic source, which is simulated by harmonic current source injection in the simulation. BUS1 is connected to an AC filter group, including HP3 (3rd-order high-pass filter), BP11/13 (11th/13th-order double-tuned band-pass filter), HP24/36 (24th/36th-order high-pass filter), and SC (shunt capacitor). This filter group is the actual engineering configuration, with filter parameters designed according to standards, used for filtering corresponding characteristic harmonics and providing reactive power compensation, and is not the optimization object of this paper. BUS1 is connected to BUS2 and BUS3 through transmission lines. BUS2 and BUS3 belong to the power plant side, each connected to two synchronous motors through two 765/22 transformers, and each is connected in parallel with an inductor and a variable capacitor. The four transformers and synchronous motors have the same parameters. The parameters of the system are shown in Table 1, Table 2, Table 3 and Table 4, where all parameters are positive-sequence parameters.
Figure 2.
Seven-bus test system.
Table 1.
Electrical parameters of the single-circuit 750 kV AC transmission line.
Table 2.
Generator parameters.
Table 3.
Transformer parameters.
Table 4.
Other system parameters.
4.2. Harmonic Amplification Phenomenon Analysis and Resonance Localization
First, the s-domain nodal admittance matrix of the system is established. Initially, the variable capacitors Cv2 and Cv3 of BUS2 and BUS3 are 0.02 μF and 0.16 μF, respectively. Within the frequency range of 1500 Hz, the resonance modes and corresponding nodal voltage mode shapes are calculated, with the results shown in Table 5.
Table 5.
Resonance modes and node voltage mode shapes of the system within 1500 Hz range.
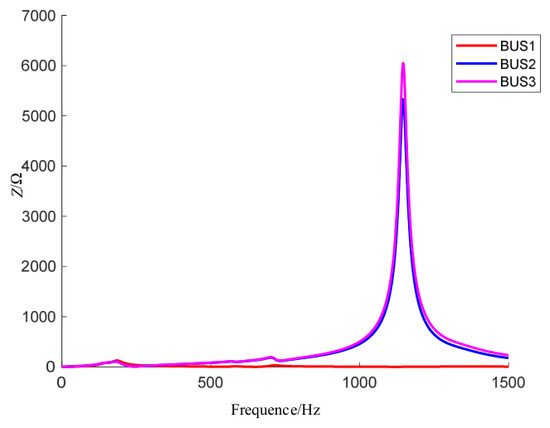
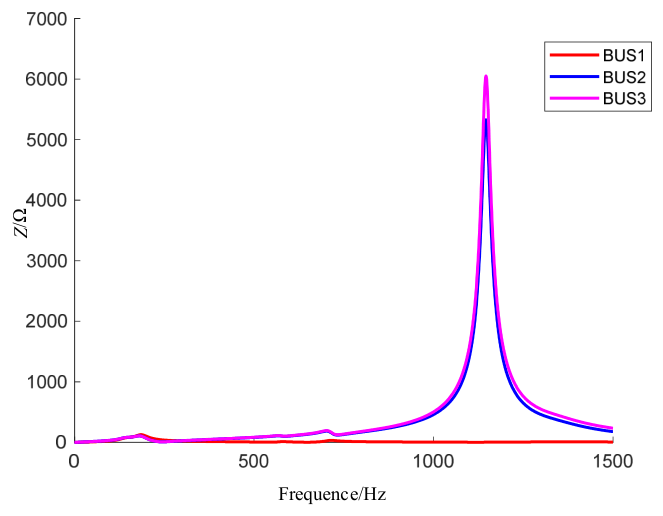
Table 5 shows that the system has six resonant modes within 1500 Hz. This paper considers only the resonant mode with a resonant frequency of 1142.316 Hz. Because it is close to the 23rd harmonic and its damping ratio ζ = 0.00692 is extremely small, according to the viewpoint in reference [16], the harmonic amplification factor is clearly inversely proportional to the damping ratio; therefore, it may cause severe oscillations in the system. By observing its nodal voltage mode shape, BUS2 and BUS3 have the largest values, so the harmonic amplification phenomena at BUS2 and BUS3 are analyzed with emphasis. Figure 3 shows the impedance-frequency characteristic curves obtained by scanning at BUS1–BUS3 through the harmonic impedance solving interface in the simulation platform. BUS2 and BUS3 exhibit extremely large peaks near the 23rd harmonic, which is consistent with the results inferred from the s-domain nodal admittance matrix.
Figure 3.
Impedance scanning results at BUS1–BUS3 ports.
By inverting the s-domain nodal admittance matrix, according to the method in Chapter 2, the comprehensive influence indices of each node at 1150 Hz are calculated, and the results are shown in Table 6. BUS2 and BUS3 have the largest indices and are similar, playing a key role in harmonic amplification and transfer.
Table 6.
Comprehensive influence indices of system nodes at 1150 Hz.
In this paper, the LCC station is represented by a wideband current source converter model, in which a fundamental current source and a harmonic current source are connected in parallel, and the nonlinear characteristics of the power electronic devices are characterized by the harmonic current source [16]. This representation is consistent with the harmonic amplification theory. It should be noted that the focus of this paper is the propagation and amplification of the injected harmonic currents in the AC network, rather than the generation of harmonics inside the converter station. Factors such as dynamic closed-loop control, valve commutation overlap, and dynamic AC/DC system coupling mainly affect the magnitudes of the characteristic harmonic currents generated by the LCC, which is a harmonic source modeling issue and is beyond the scope of this paper.
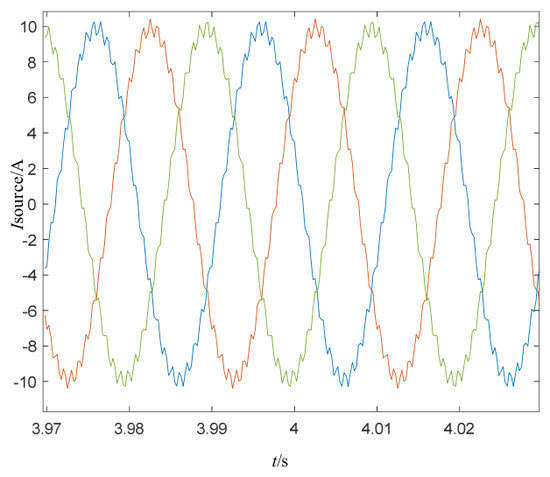
In PSCAD, a 23rd three-phase harmonic current with an amplitude of 0.5 A is injected at BUS1 on the converter station side. The fundamental current source amplitude is 10 A, and the 23rd harmonic proportion is 5%, which represents a relatively severe condition for the characteristic harmonic. It should be noted that the injected current amplitude is used here to excite the network so that its frequency-domain response can be observed. Since this paper focuses on the harmonic amplification factor and the mutual impedance, which are inherent properties of the AC network, the conclusions are not affected by the absolute magnitude of the injected signal. This has been verified by further tests: when the injected source current is increased proportionally, the harmonic currents on the network side increase by the same proportion, while the current amplification factor and the mutual impedance remain essentially unchanged.
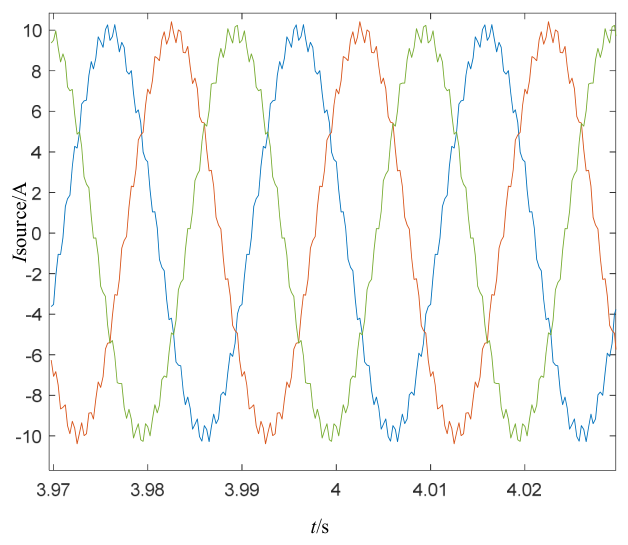
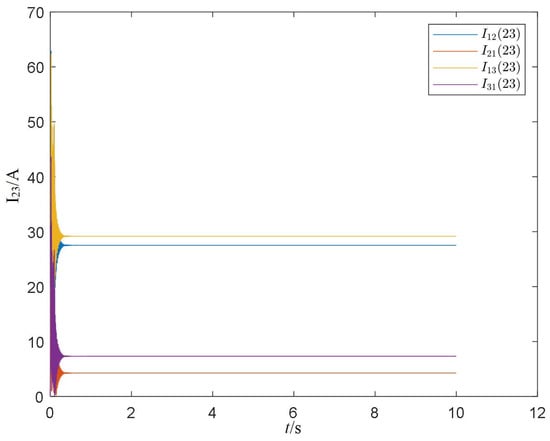
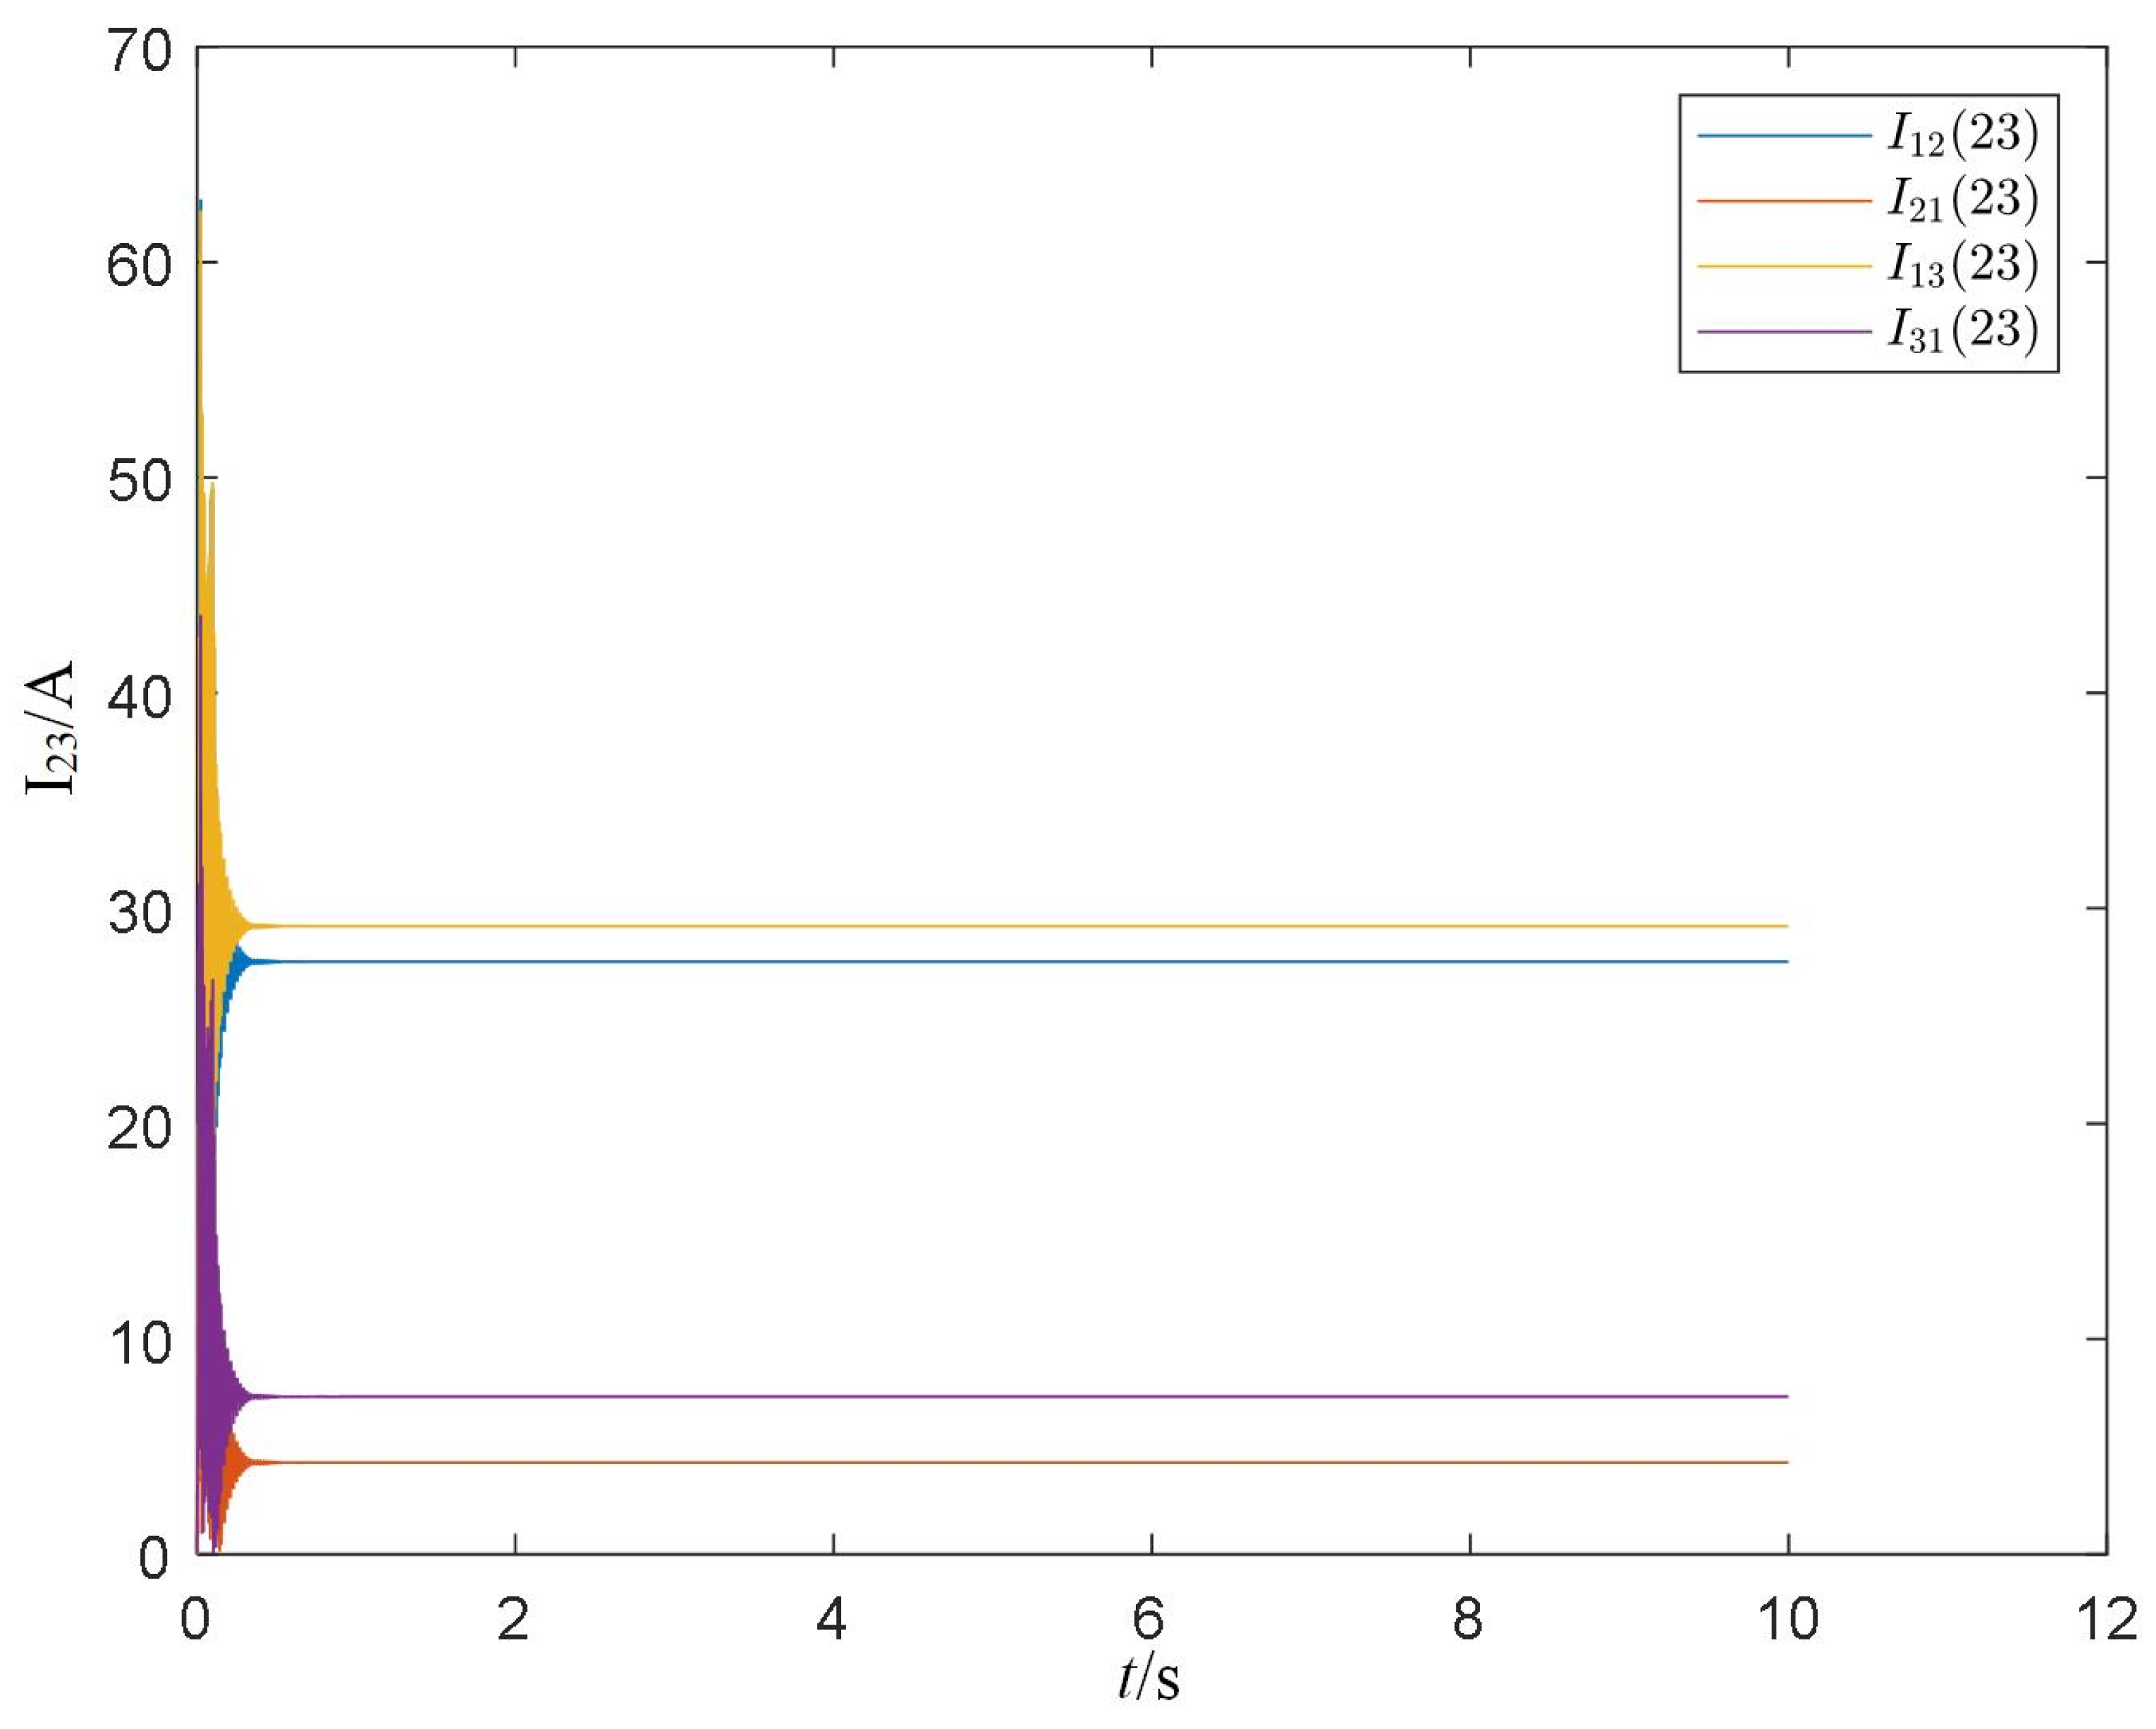
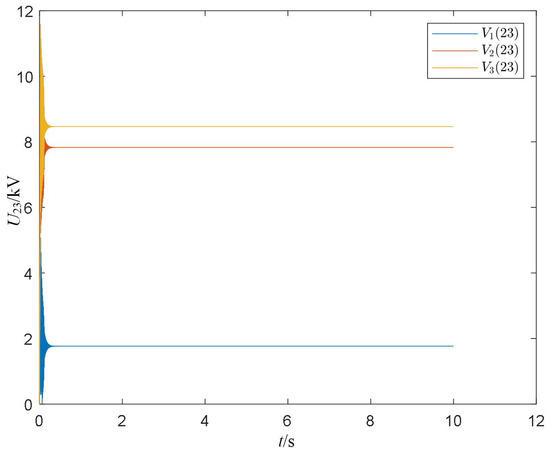
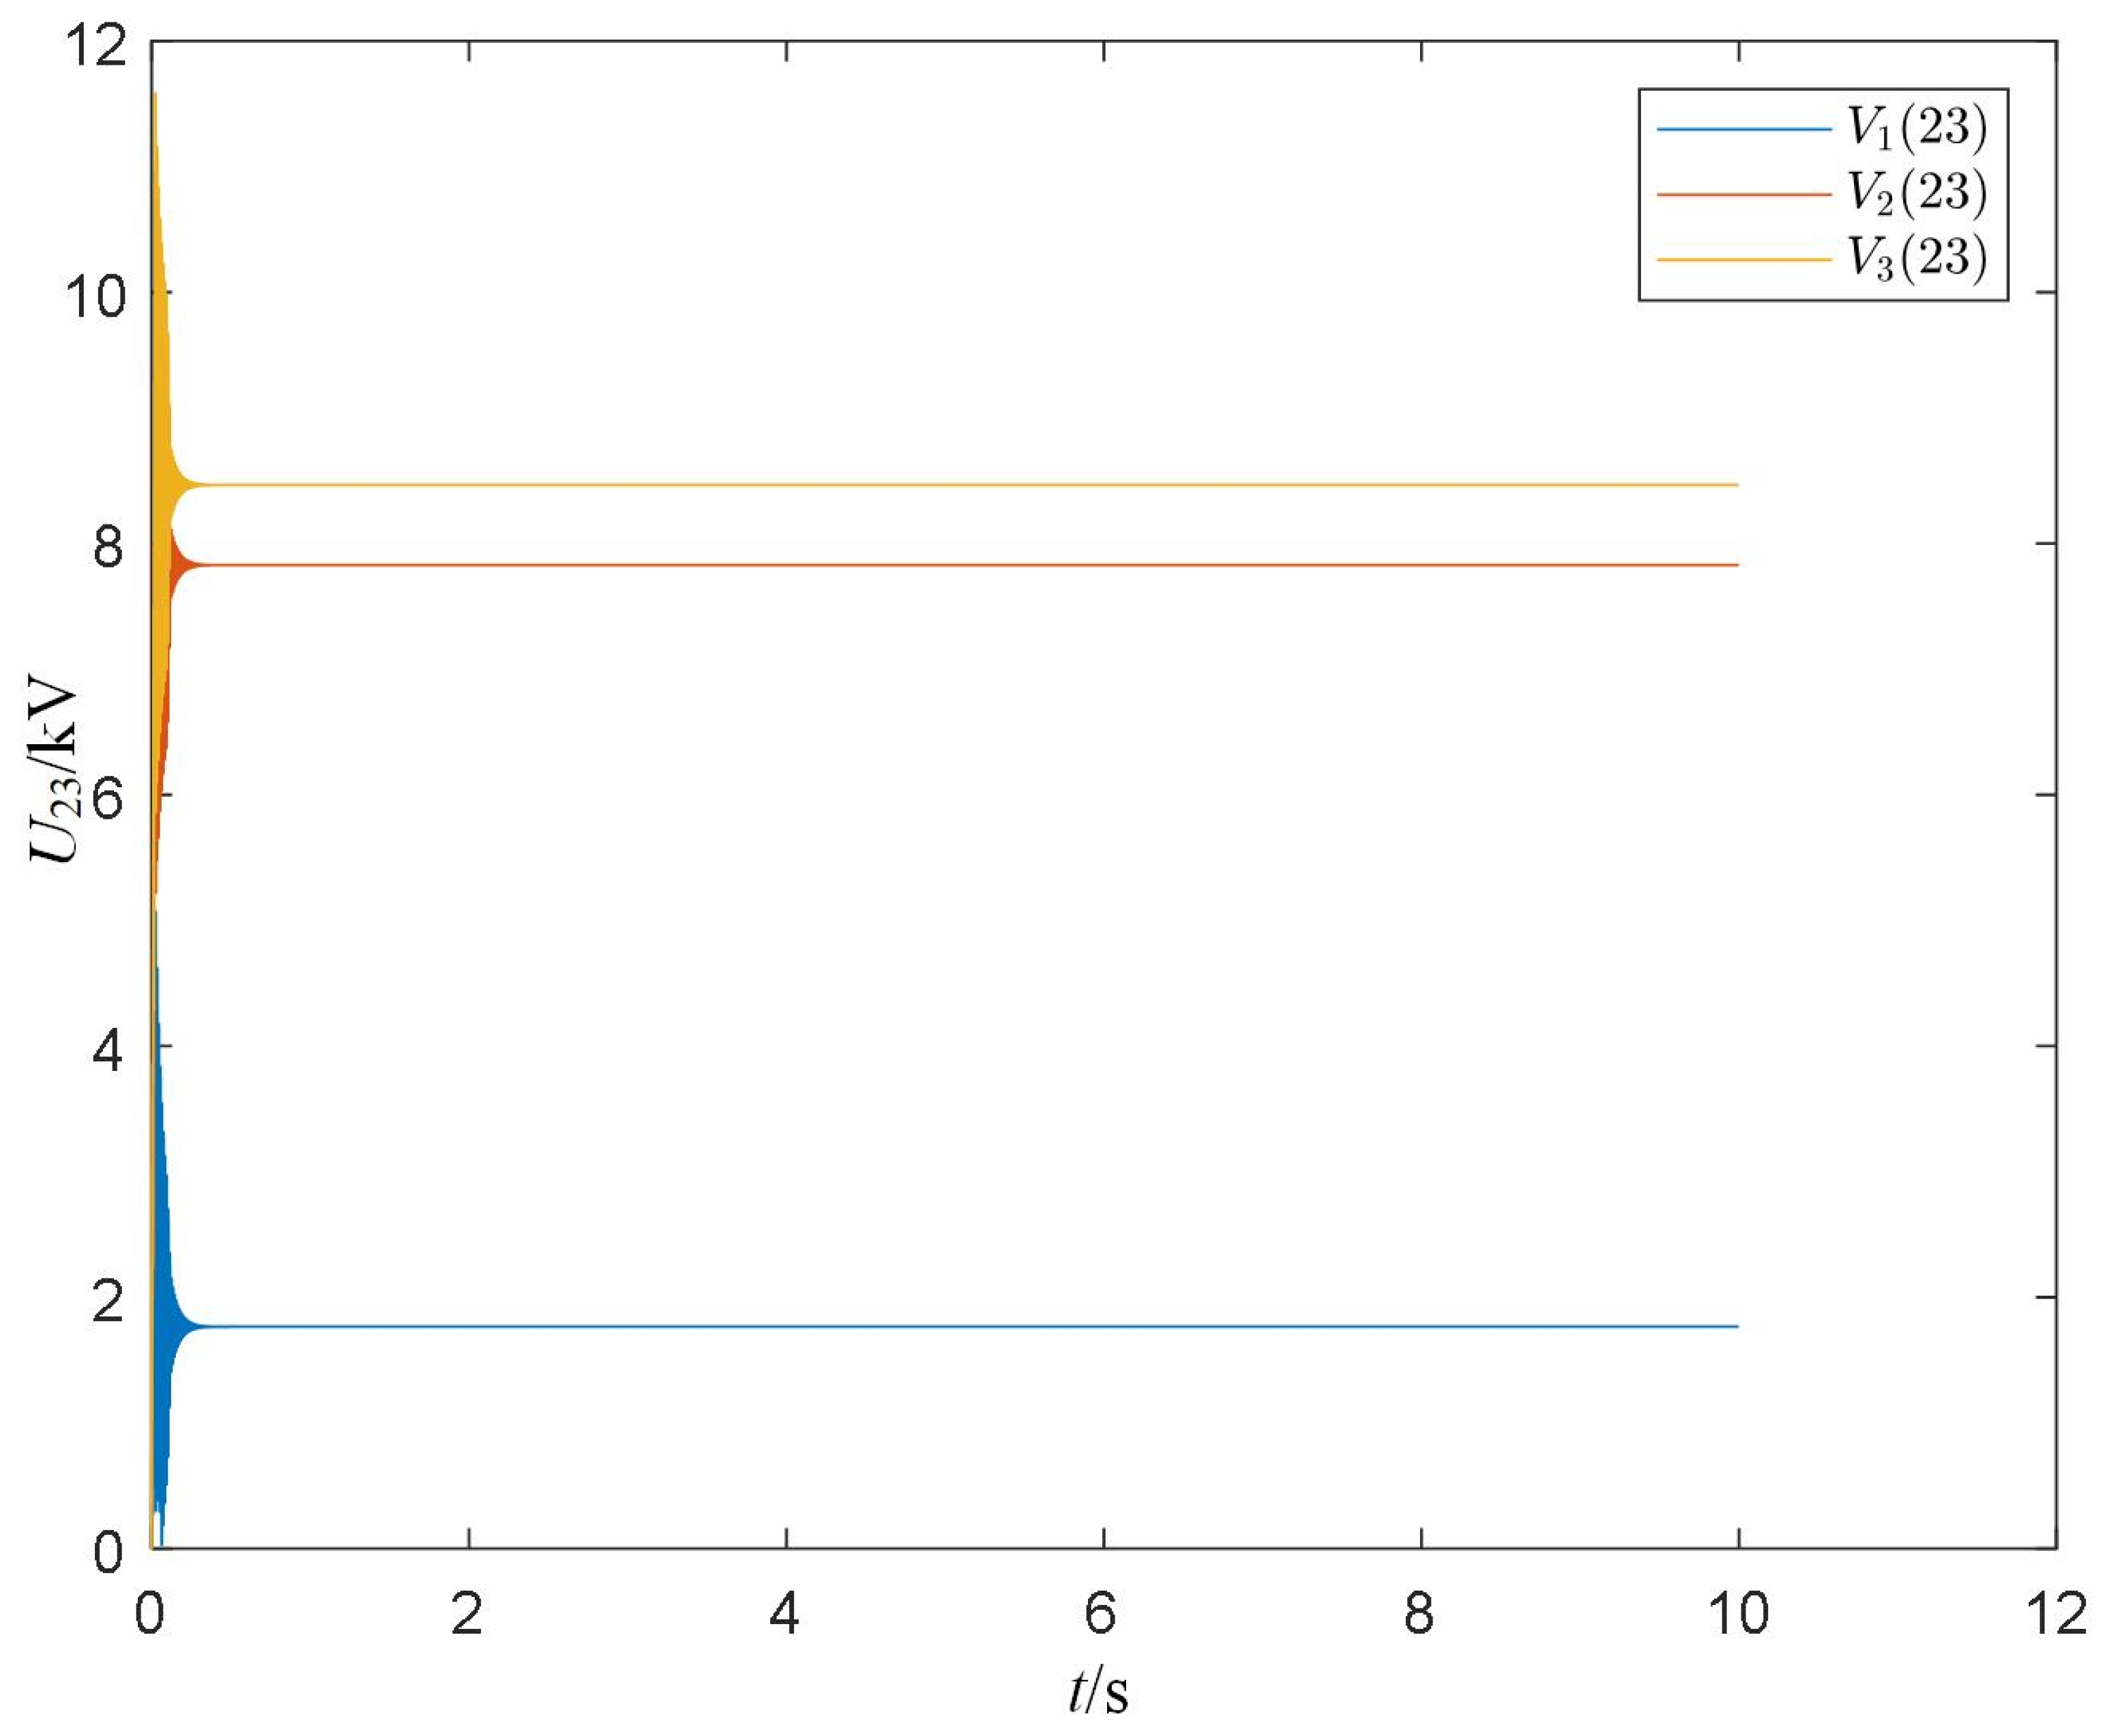
The current source waveform shows obvious distortion, as shown in Figure 4. Among them, the harmonic currents of transmission line 1–2 and transmission line 1–3, as well as the harmonic voltages of BUS1-BUS3, are relatively significant. The results are shown in Figure 5 and Figure 6, and the magnitudes and their ratios to the fundamental amplitude are shown in Table 7. I12(23) and I23(23) are amplified by approximately 55 and 58 times compared with the harmonic source of 0.5 A, showing obvious harmonic amplification, but their proportions to the fundamental are far less than 5% of the harmonic source, within the allowable range. For harmonic voltages, the mutual impedances Z21(23) and Z31(23) are approximately 15.66 kΩ and 16.93 kΩ, respectively. V2(23) and V3(23) account for 1.21% and 1.31% of the fundamental, respectively. According to GB/T 14549-1993, the allowable harmonic voltage content for odd harmonics at 220 kV and above is 1.6%. Therefore, the 23rd harmonic voltages at BUS2 and BUS3 are already close to this limit. If the harmonic source is increased to 1 A, the harmonic voltages at BUS2 and BUS3 will exceed the allowable range, further confirming the necessity of harmonic suppression. Therefore, it is necessary to focus on reducing the values of mutual impedances Z21(23) and Z31(23).
Figure 4.
Waveform of the current source.
Figure 5.
Magnitudes of the 23rd harmonic currents in lines 1–2 and 1–3.
Figure 6.
Magnitudes of the 23rd harmonic voltages at BUS1–BUS3.
Table 7.
Harmonic magnitudes of different indices and their ratios to the fundamental component.
4.3. Parameter Sensitivity Analysis
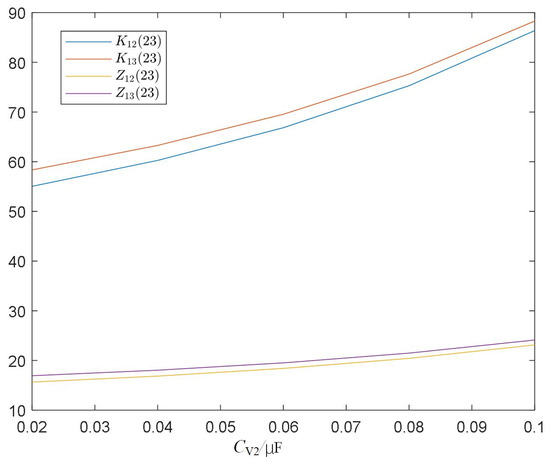
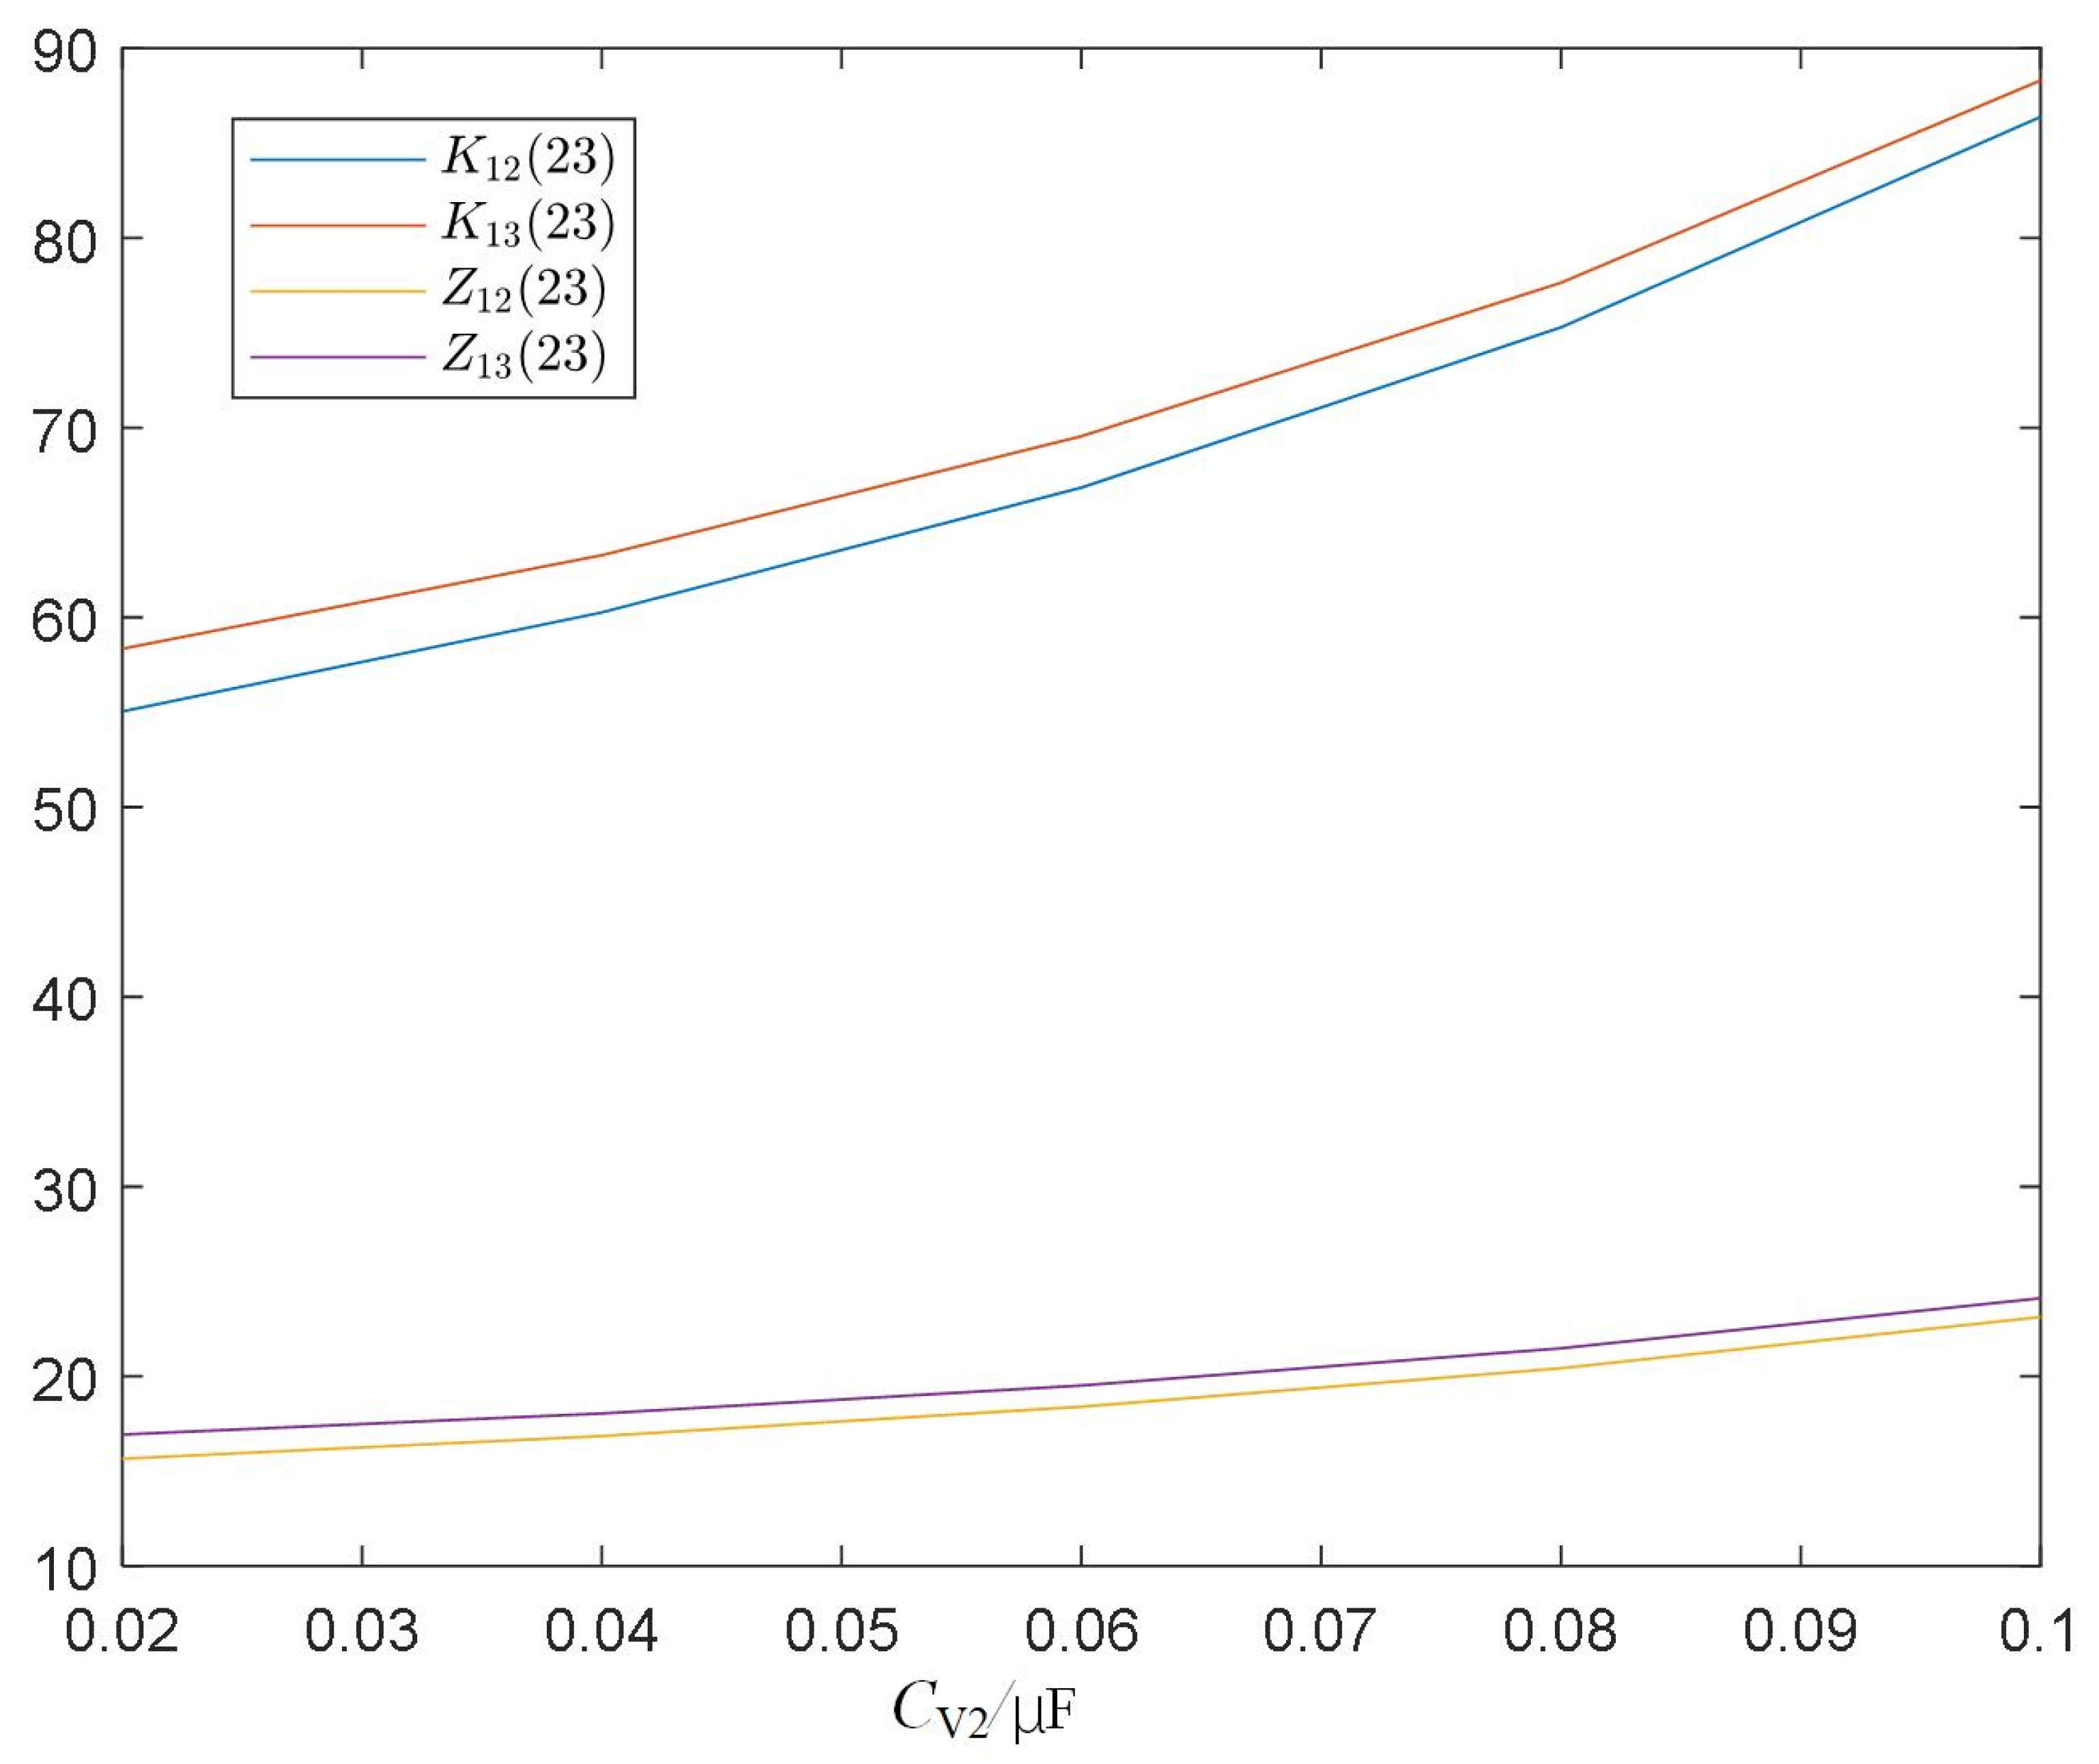
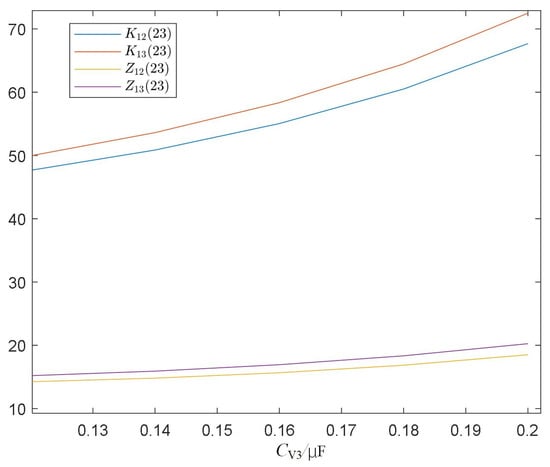
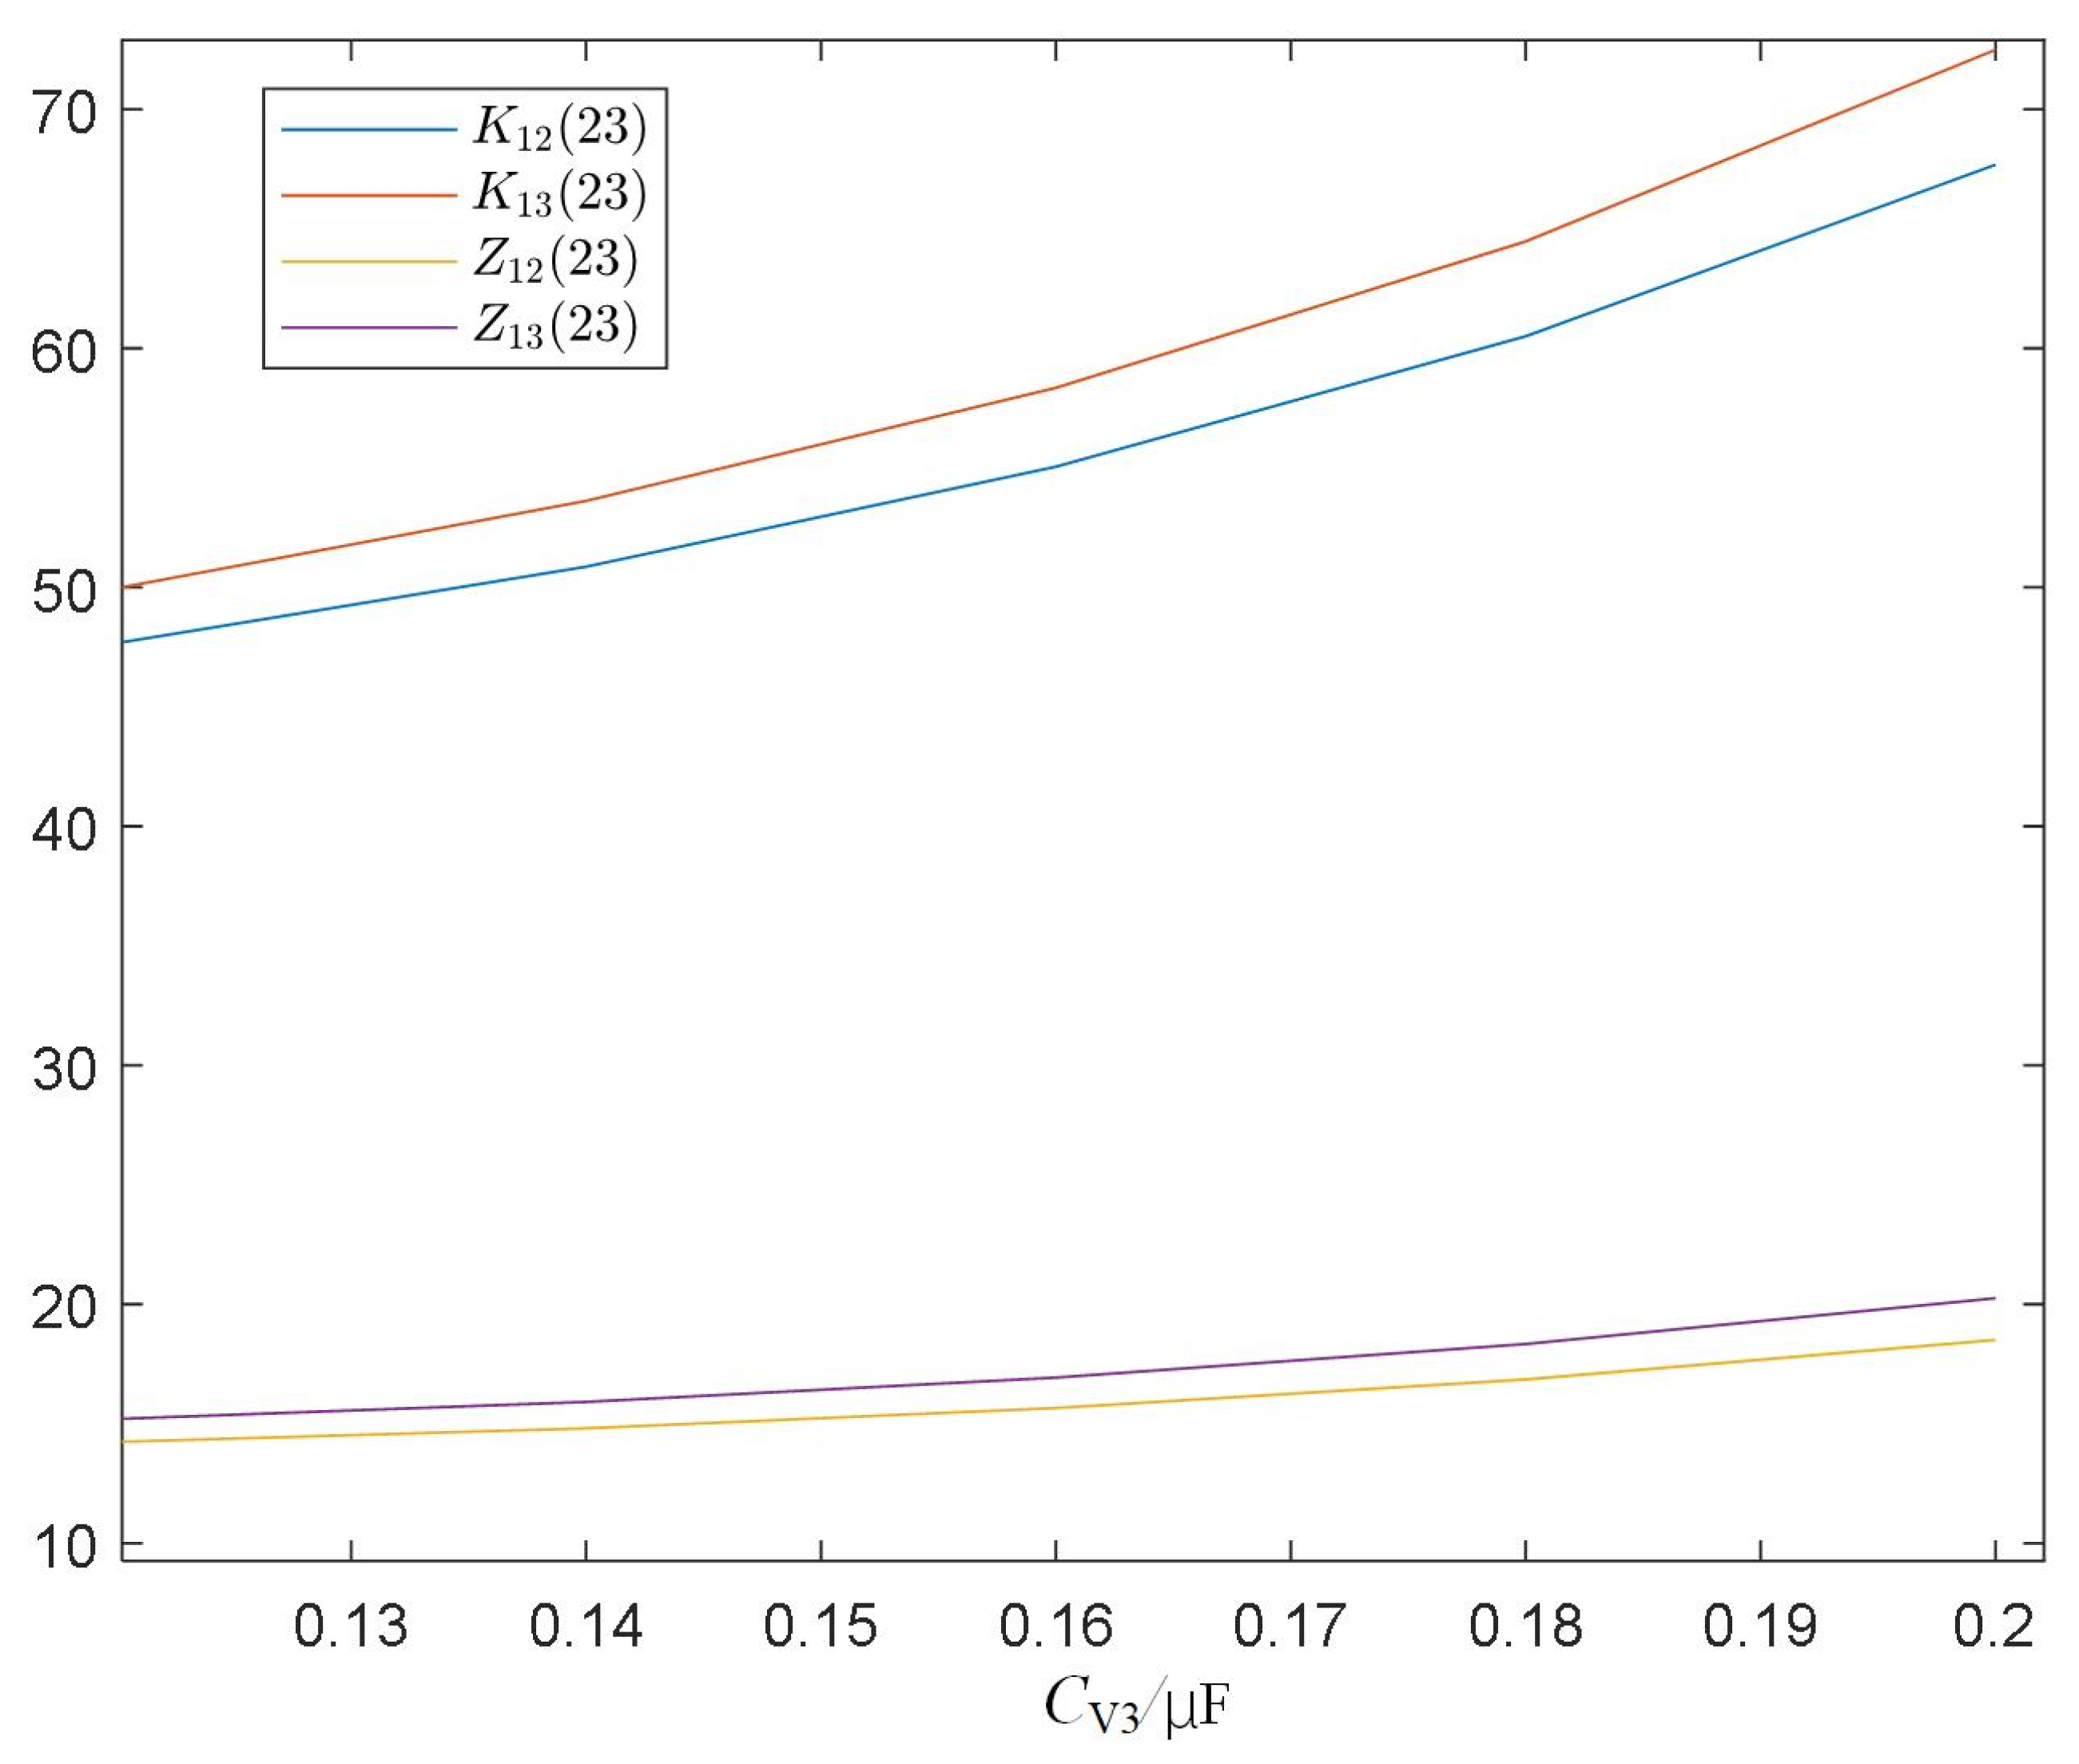
Using the parameter perturbation method, the amplification factors K12(23) and K13(23) of I12(23) and I13(23) relative to the harmonic source, and the mutual impedances Z21(23) and Z31(23) are selected as observation indices. The sensitivity of these indices to Cv2 and Cv3 is analyzed, and the results are shown in Figure 7 and Figure 8. For convenient comparison, the mutual impedance is in kΩ and the current amplification factor is in units of 1, and the mutual impedance and current amplification factor are placed in the same figure. From Figure 7 and Figure 8, it can be seen that each index increases monotonically with the increase in the variable capacitance value. The curves are approximately linear at low capacitance values and exhibit a slight nonlinear upward trend at higher capacitance values. The current amplification factor changes more significantly than the mutual impedance. BUS2 and BUS3 are highly sensitive to the 23rd harmonic, and small parameter changes will cause large changes in the harmonic amplification effect. When both capacitors are adjusted to 0, the current amplification factor and mutual impedance are the smallest, but amplification still exists.
Figure 7.
Sensitivity of each index with respect to Cv2.
Figure 8.
Sensitivity of each index with respect to Cv3.
4.4. Resonance Suppression Using C-Type Damping Filter
According to the s-domain resonance mode analysis in the previous two sections, the system has a weakly damped resonance mode near 1142 Hz, and BUS3 is the dominant node. Accordingly, this section sets the tuning frequency of the C-type damping filter to the 23rd harmonic frequency and installs it at the BUS3 bus to verify its suppression effect on characteristic harmonic amplification. Assume that the reactive power compensation capacity provided by the C-type filter at the fundamental frequency is QC = 200 Mvar. According to Equation (34), the parameters of each part of the filter are calculated as shown in Table 8.
Table 8.
Parameters of the C-type damped filter.
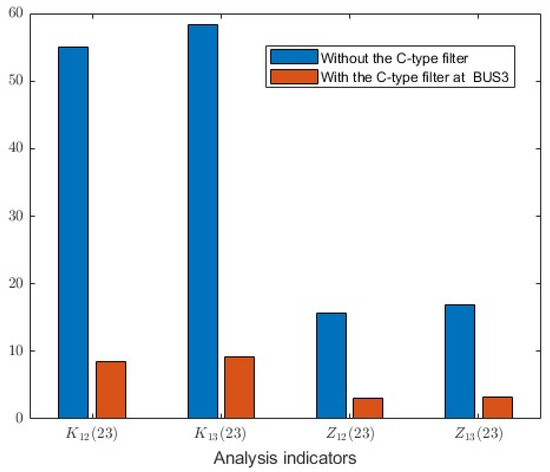
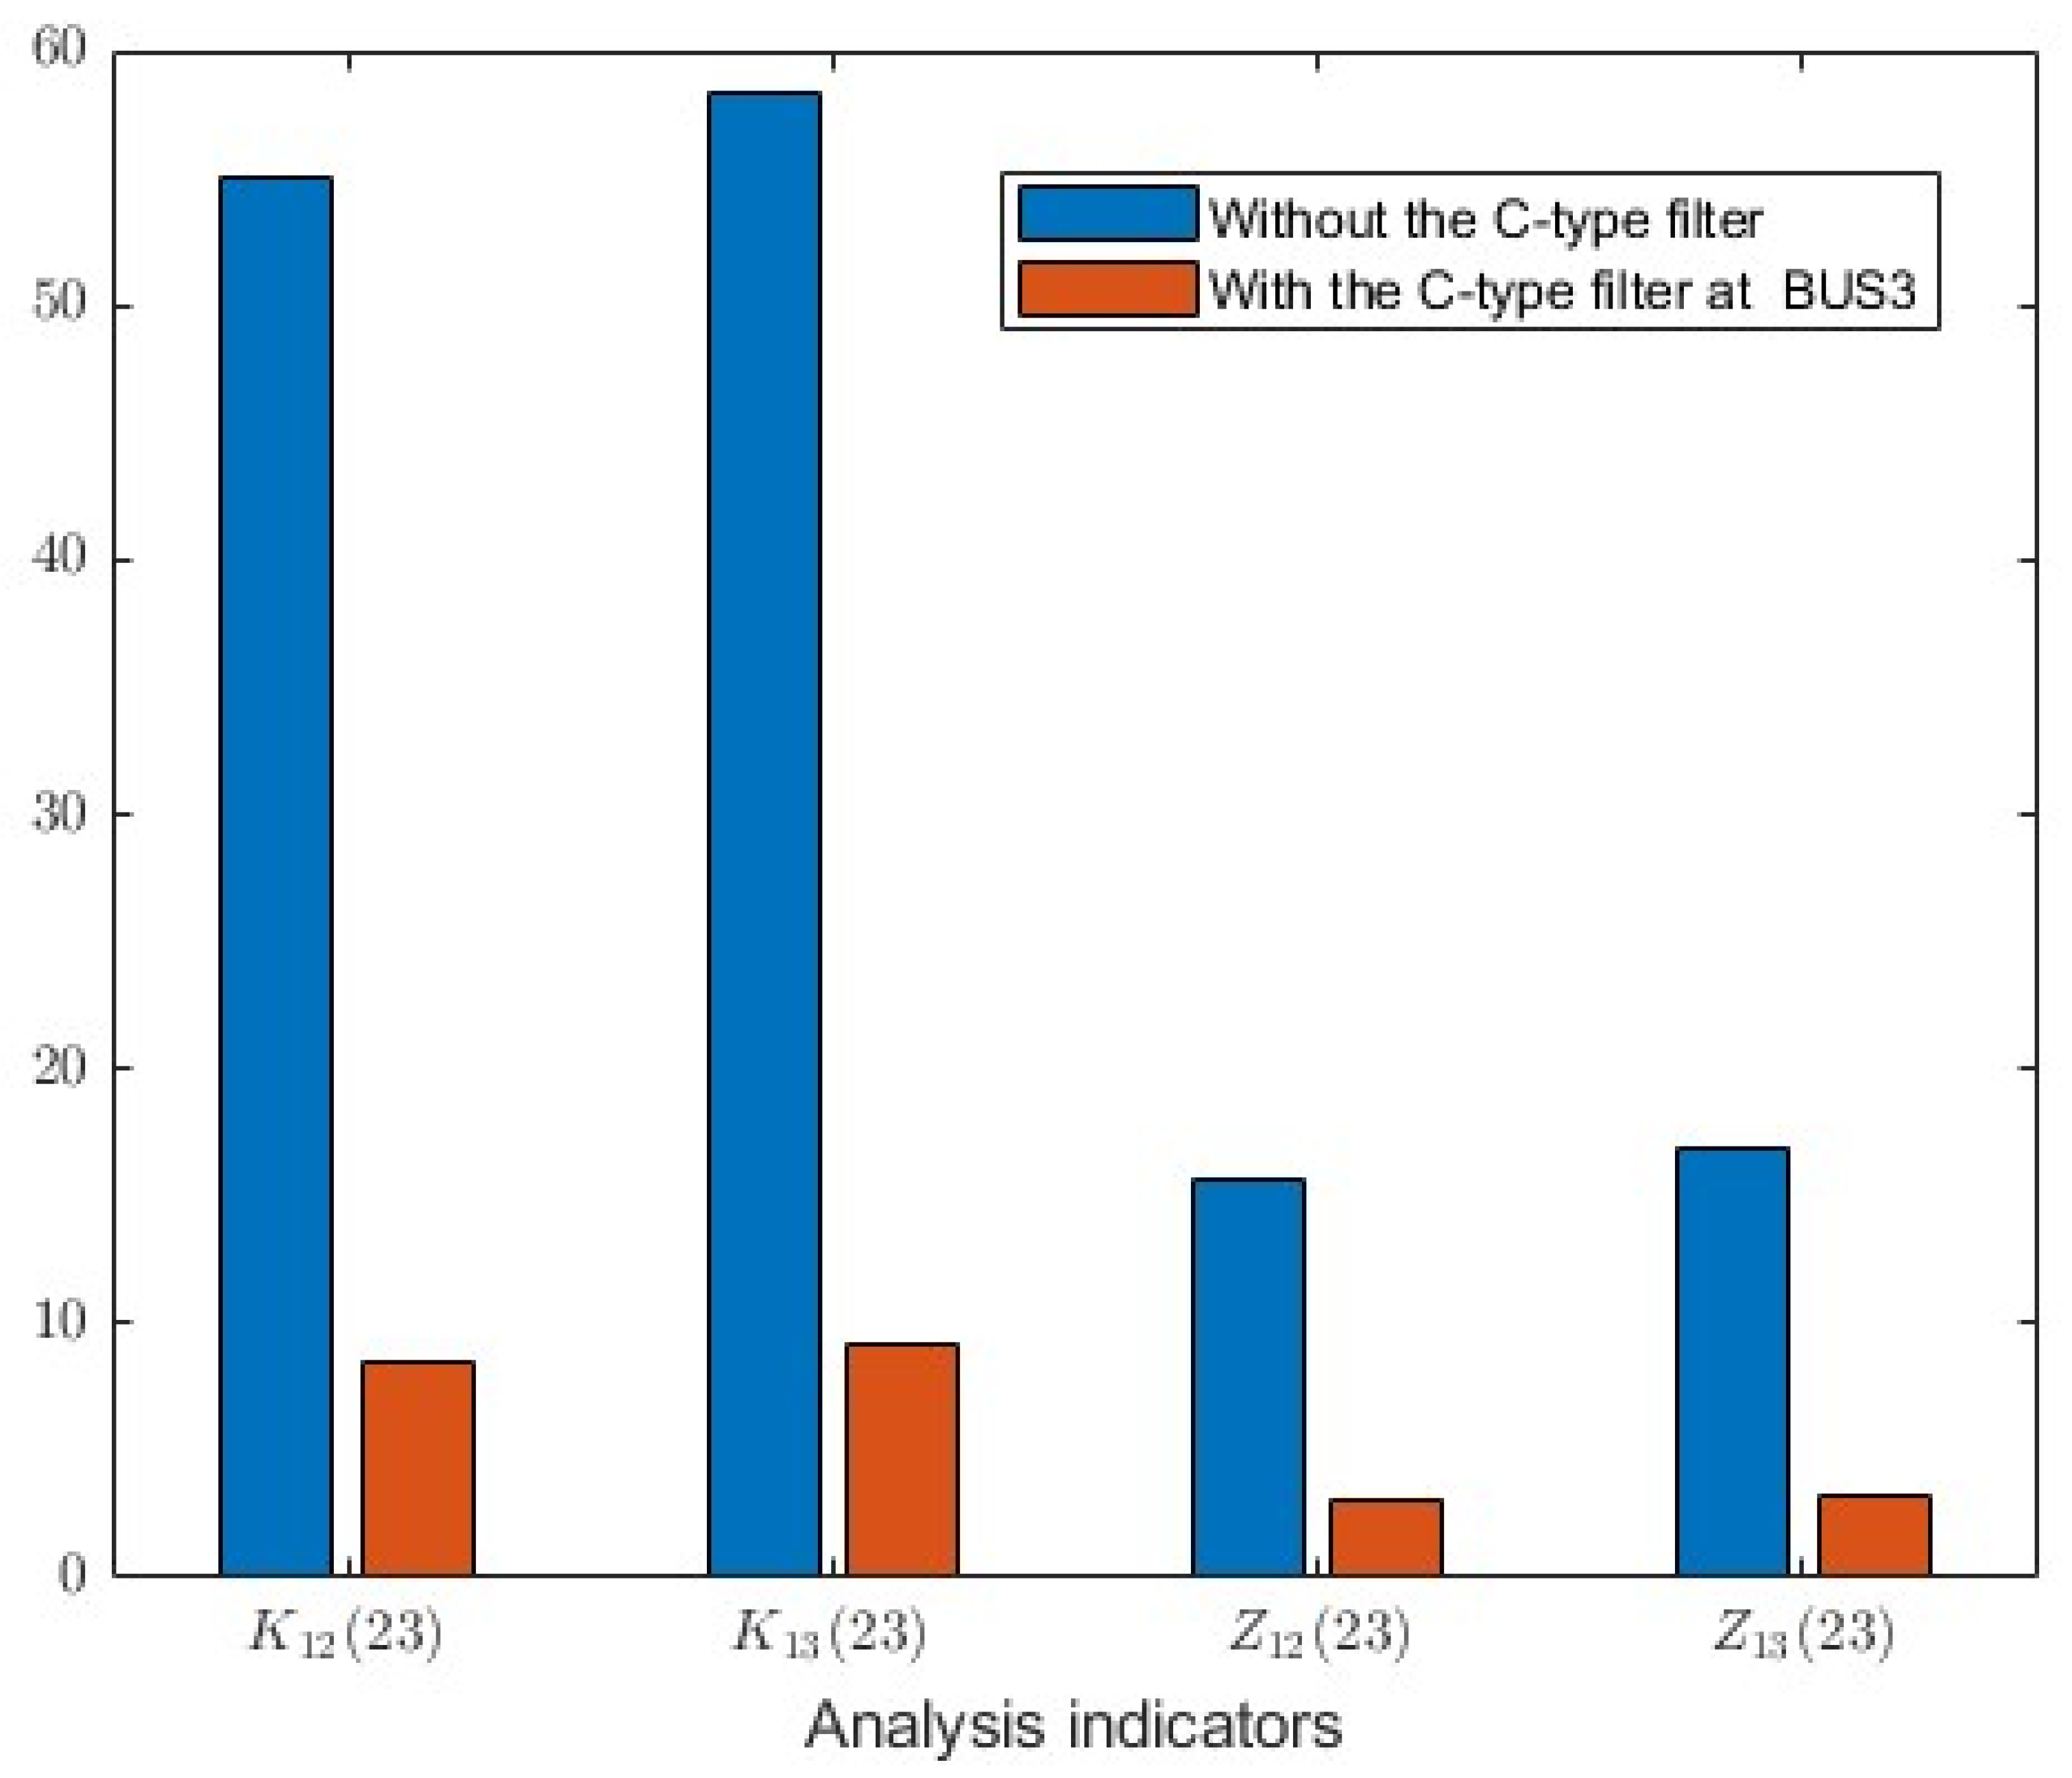
After installing the C-type filter, simulation analysis is performed again and compared with the case before installation. The results are shown in Figure 9. It can be seen from the figure that the current amplification factor and mutual impedance are significantly reduced, approximately 1/6 of those before installation. At this time, the harmonic currents and harmonic indices as ratios to the fundamental are all below 0.5%, meeting the standards, and the suppression effect of the C-type filter is relatively significant.
Figure 9.
Comparison of indices before and after installing the C-type filter at BUS3.
However, introducing a new passive filter inevitably changes the nodal admittance matrix and may shift the system’s resonant modes. To verify the overall stability, the six resonant modes within the 1500 Hz range before and after the installation are compared, as shown in Table 9. The results indicate that the most critical mode (originally at 1142.3 Hz with extremely weak damping) is successfully shifted to 949.8 Hz. This frequency shift moves the resonance peak away from the 23rd and 25th characteristic harmonic frequencies, thereby eliminating the risk of harmonic excitation. For the other five lower-frequency modes, the frequency shifts are relatively minor. Since these frequencies do not correspond to dominant characteristic harmonic sources (and the 11th/13th harmonics are already filtered by the existing filter group), the minor shifts do not introduce new harmonic amplification risks. Therefore, the C-type filter effectively suppresses the target resonance without adversely affecting the stability of the other modes.
Table 9.
Comparison of resonant frequencies before and after installing the C-type filter at BUS3.
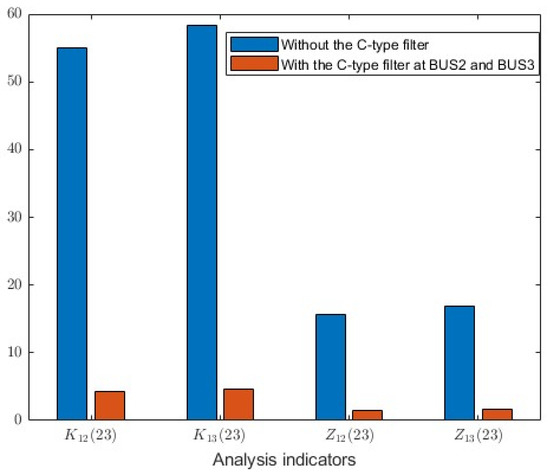
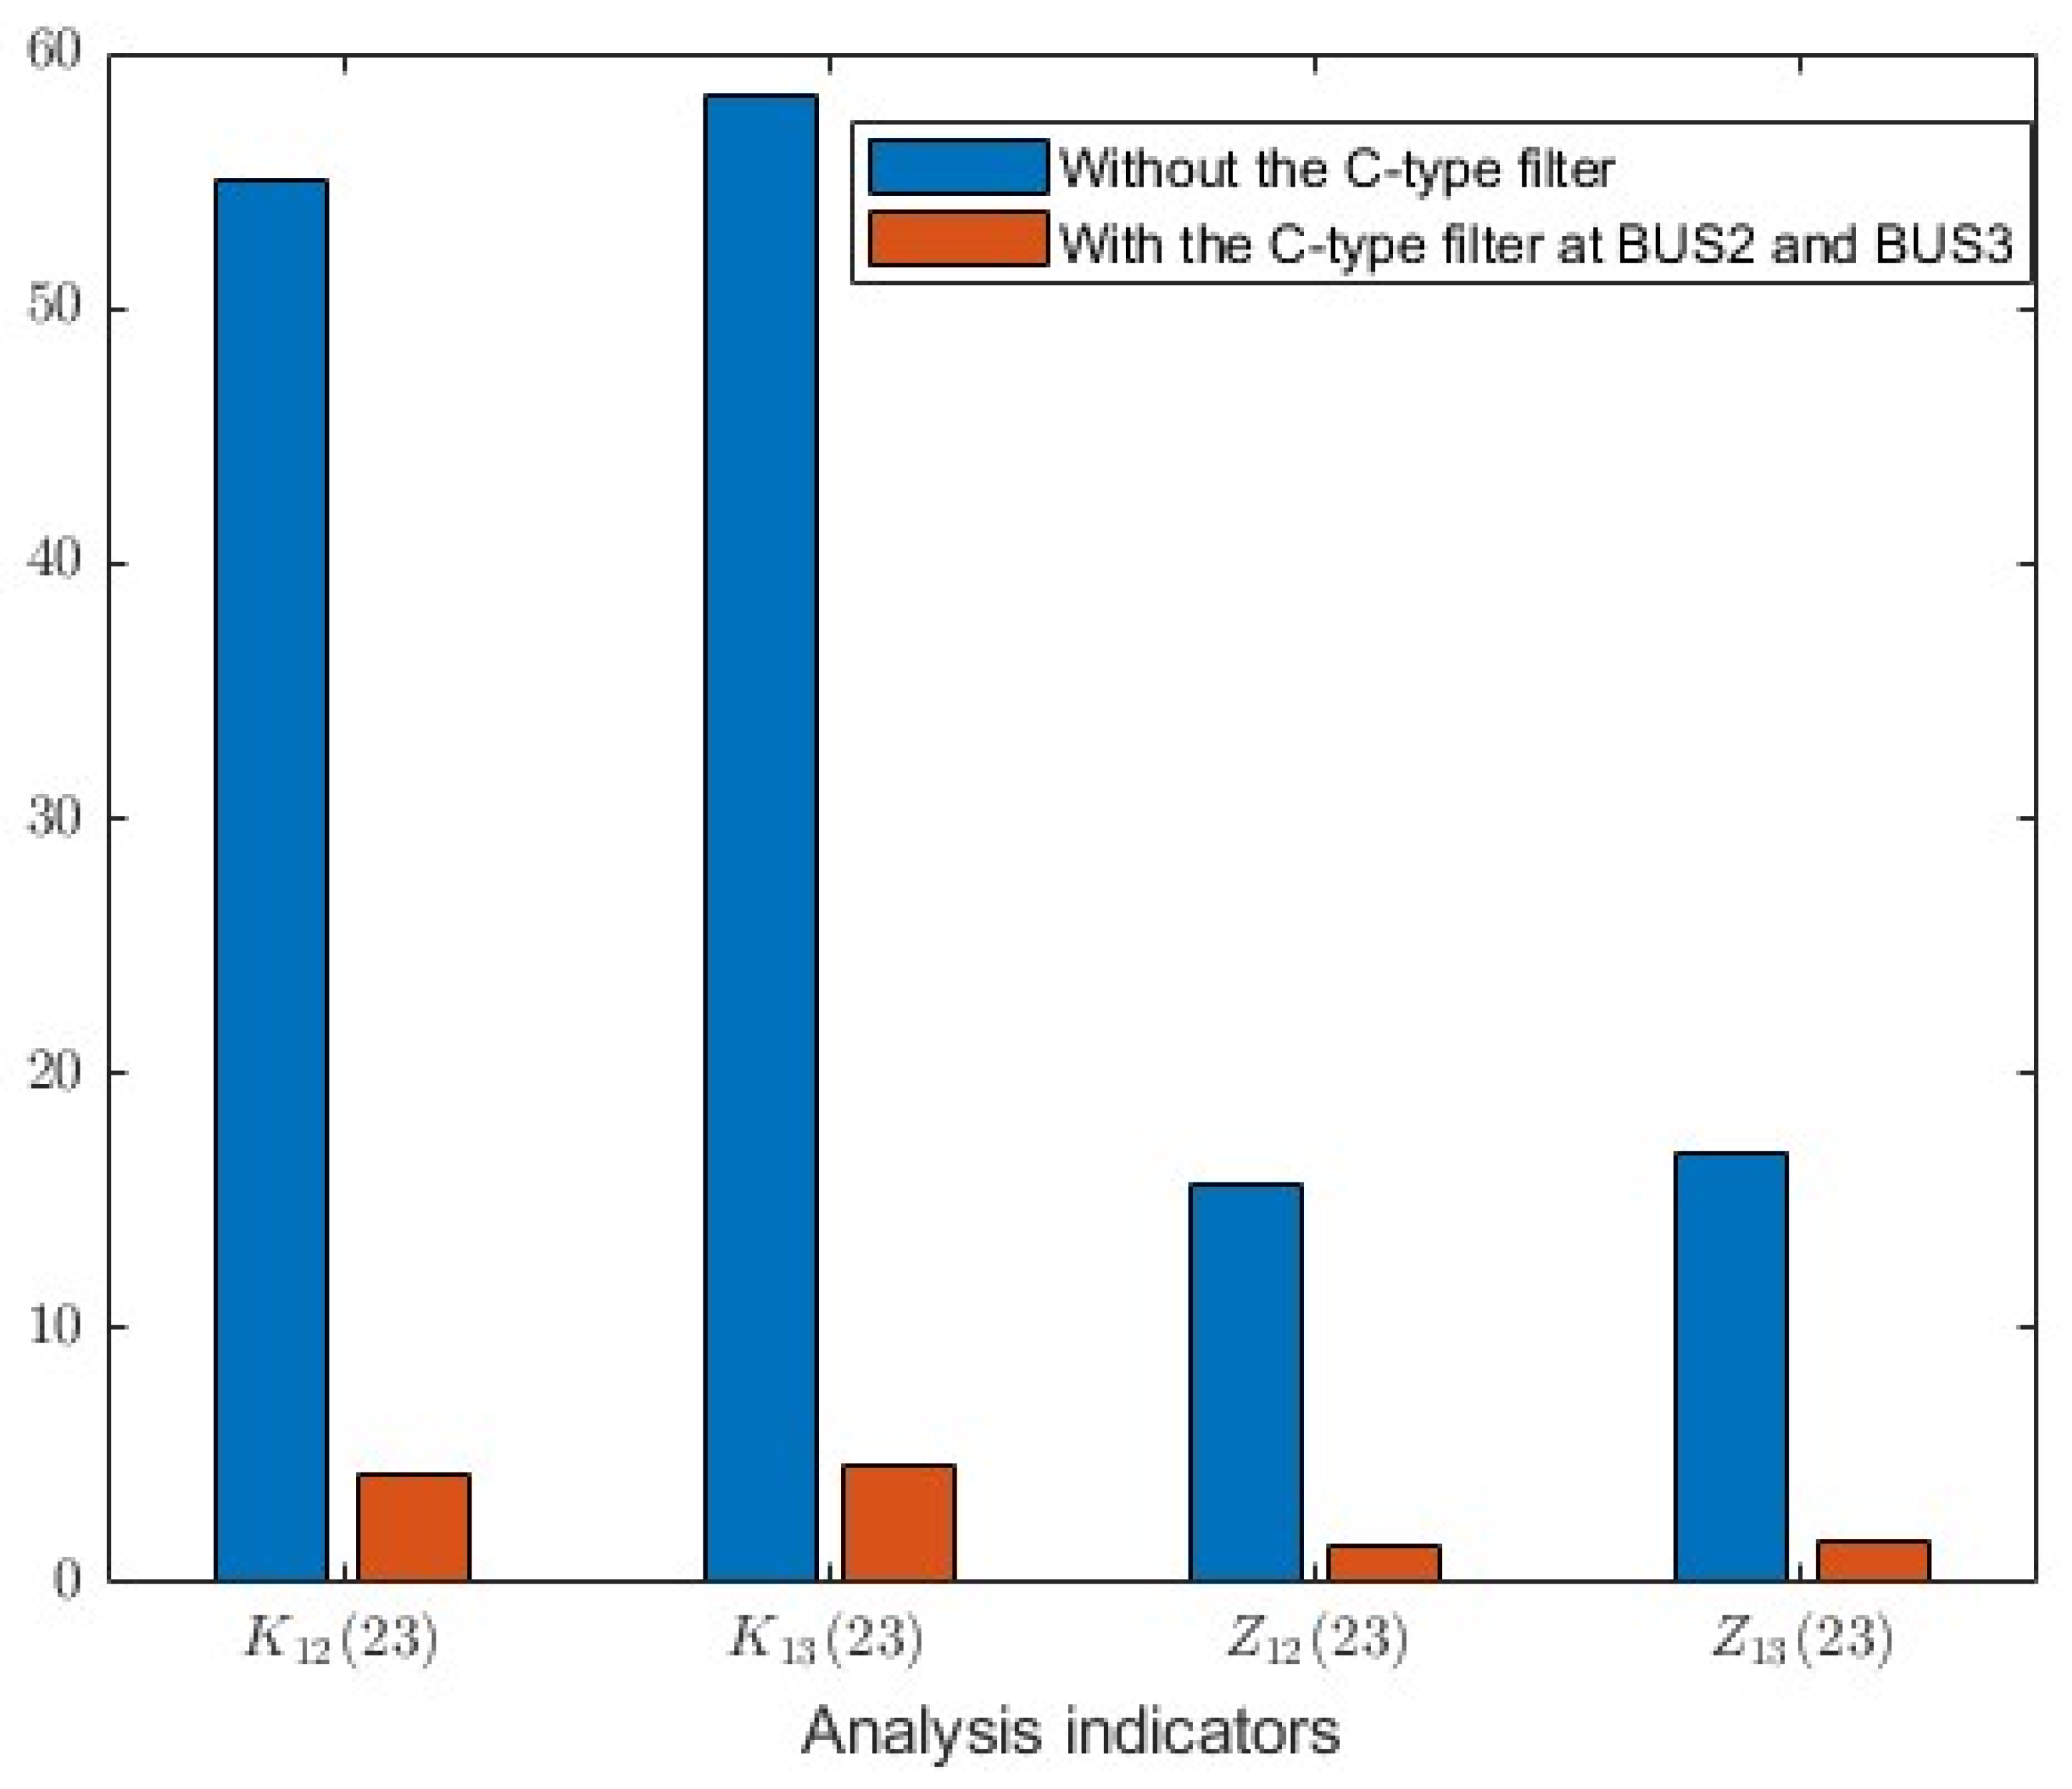
Furthermore, if C-type filters are installed at both BUS2 and BUS3 (which are both resonance-sensitive points), the results are shown in Figure 10. The four indices are reduced to less than 10% of the original values, which can basically be ignored compared with the fundamental. In actual engineering, since the single-bus installation at BUS3 already reduces the harmonic levels well below the standard limits, installing an additional filter at BUS2 would double the capital investment but yield a very limited marginal improvement in THD performance. Therefore, the single-bus configuration at BUS3 is considered the most economical and practical solution.
Figure 10.
Comparison of indices before and after installing C-type filters at both BUS2 and BUS3.
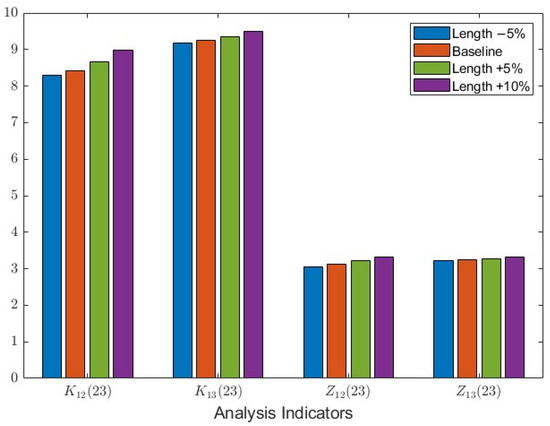
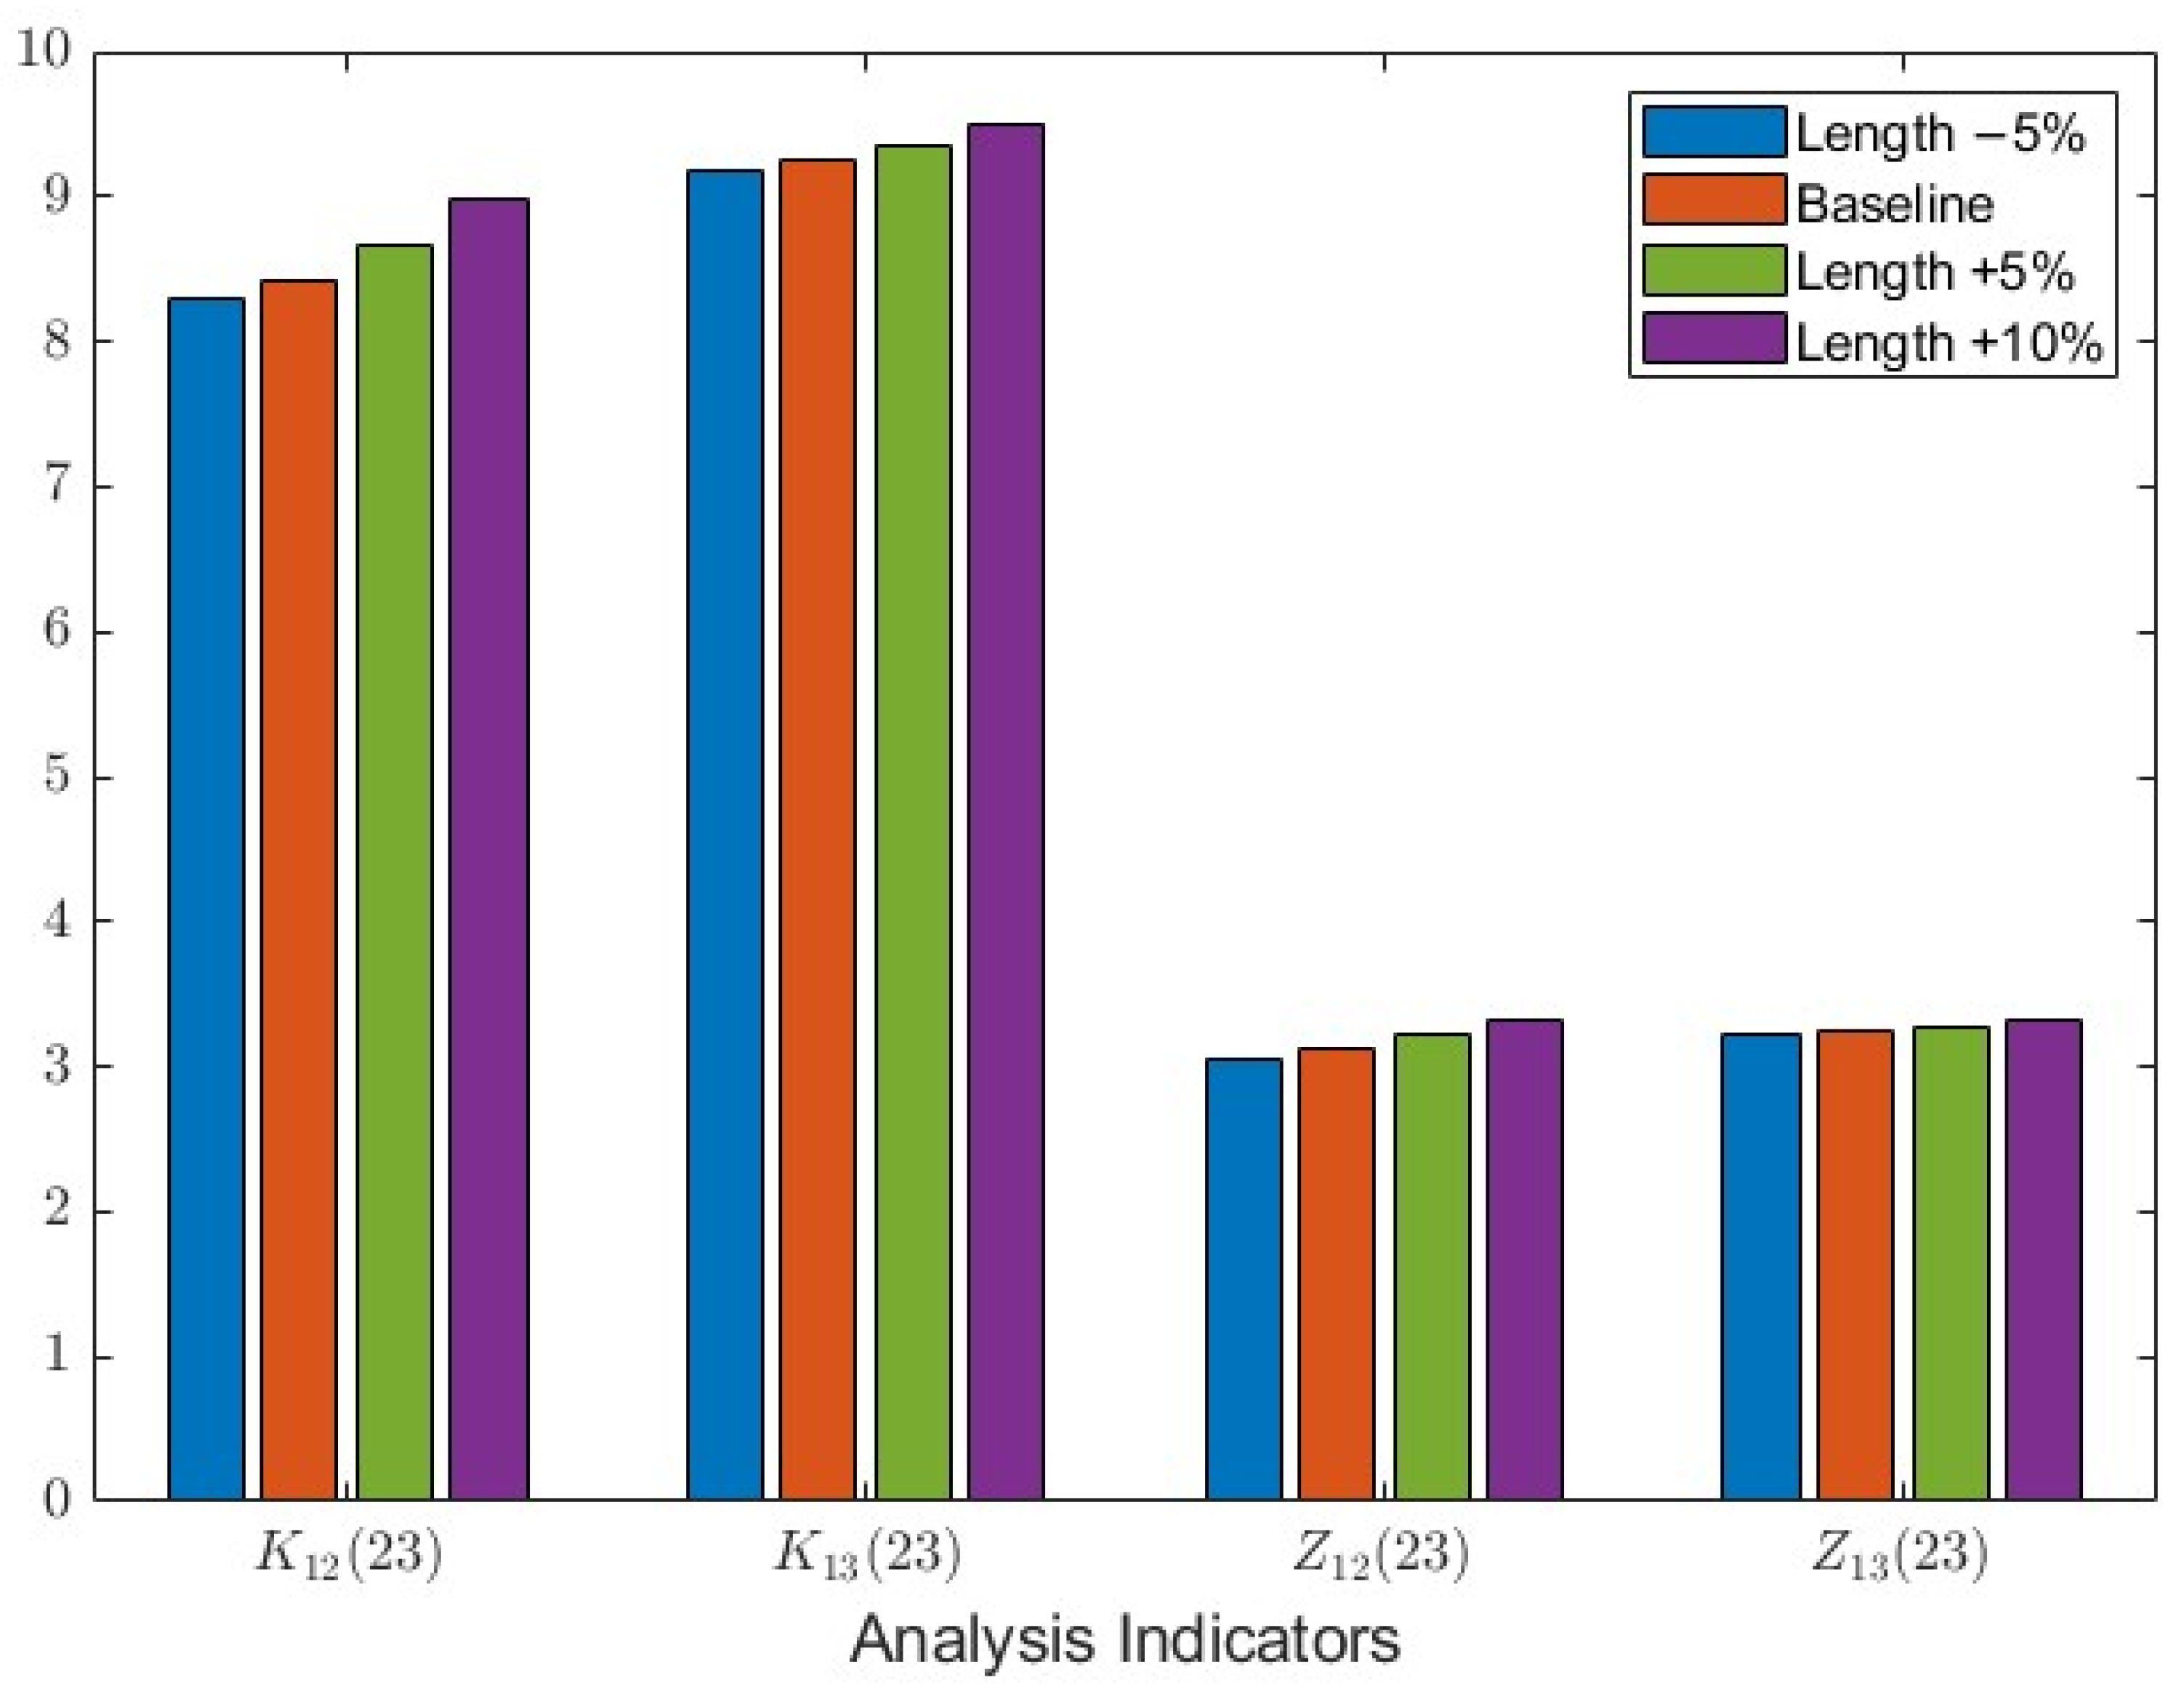
In actual situations, system parameters often fluctuate. For example, line equivalent parameters may deviate due to factors such as ambient temperature and conductor sag. To simulate this parameter deviation, this paper changes the length of l12 to equivalently implement the perturbation of RLC parameters. The length varies within the range of −5% to +10% of the base value, and the response of each 23rd harmonic index after installing the C-type filter is observed. The results are shown in Figure 11.
Figure 11.
Comparison of suppression effects of C-type filter on various indicators under different line lengths.
From Figure 11, it can be seen that when the line length varies within the range of −5% to +10%, the fluctuation amplitudes of the four groups of indices are not large. Among them, the current amplification factor K12(23) is relatively most sensitive to line length changes, but even under the +10% condition, the K12(23) after installing the filter is still only 8.99, far lower than 55.04 without the filter, and the suppression rate remains above 83%. The above results indicate that under small-range deviations of line parameters, the C-type damping filter maintains good suppression effects and has certain robustness to system parameter changes.
While the robustness analysis in this paper primarily focuses on continuous parameter variations (e.g., line length), it is worth mentioning that in the event of major structural changes (such as line outages or severe generation dispatch), the nodal admittance matrix of the system would undergo significant reconfiguration, and the resonance characteristics could be substantially altered. Preliminary attempts have indicated that although the C-type filter can still provide broadband damping, its optimal tuning point might need to be re-evaluated. A comprehensive evaluation of filter adaptability under extreme contingencies (e.g., N−1 scanning) will be an important direction for our future work.
4.5. Analysis of 25th Harmonic Amplification Characteristics and Suppression Effect
For 12-pulse LCCs, the 23rd harmonic and 25th harmonic are a pair of twin characteristic harmonics. Under ideal conditions, they appear in pairs with similar amplitudes and may both cause harmonic pollution to the AC system. To comprehensively evaluate the response characteristics of the system to LCC characteristic harmonics and verify the universality of the C-type damping filter, this section analyzes the harmonic amplification situation when the 25th harmonic is injected.
Based on the independence between harmonics, a 0.5 A 25th three-phase harmonic current is injected at BUS1. Similar to Table 7, the 25th harmonic magnitudes of each index and their ratios to the fundamental are measured, as shown in Table 10. The simulation results show that the current amplification factors of the 25th harmonic at BUS2 and BUS3 are approximately 32 and 32.6, respectively. Compared with the amplification factors of 55.0 and 58.3 for the 23rd harmonic, the harmonic amplification factor is reduced, but obvious amplification still occurs, indicating that the resonance peak of this resonance mode has a certain frequency bandwidth.
Table 10.
The 25th harmonic magnitudes of different indices and their ratios to the fundamental component.
After installing the C-type filter with the same parameters as the previous section at BUS3, taking the current amplification factor of the 25th harmonic at BUS3 as an example, the amplification factor is reduced from about 32 times to 6.4 times, with a suppression rate of about 80%. Compared with the 85% for the 23rd harmonic, the overall suppression effect is still significant, indicating that the C-type filter tuned to the 23rd harmonic still has good suppression capability in its adjacent frequency band.
It is worth mentioning that shifting the tuning frequency slightly higher from the 23rd harmonic to an intermediate point between the 23rd and 25th harmonics was also tested in our study, which indeed achieved a balanced suppression for both twin harmonics. However, the case study in this paper is based on a practical engineering project where the 23rd harmonic amplification is the dominant issue. Since the 25th harmonic suppression rate (80%) already fully meets the grid standard, tuning exactly at the 23rd harmonic remains the most economical and practical choice. For future scenarios where both 23rd and 25th harmonics experience severe amplification simultaneously, adjusting the tuning point to an intermediate frequency or a double-tuned topology can be adopted to achieve precise balanced suppression.
5. Conclusions
Based on the harmonic amplification theory in wideband oscillations, this paper addresses the 23rd characteristic harmonic amplification problem on the AC side of an LCC sending-end converter station. The s-domain nodal admittance matrix model of the system is established, and combined with the nodal impedance matrix, resonance mode analysis, and parameter sensitivity analysis, the system resonance characteristics and their suppression measures are studied. Thus, a set of strategies for LCC characteristic harmonic mitigation is formed, and the effectiveness of the proposed method is verified through MATLAB frequency-domain calculation and PSCAD time-domain simulation. The main conclusions are as follows:
- The s-domain nodal admittance matrix can describe the frequency-domain impedance characteristics of the AC-side network of the converter station. Through resonance mode analysis, the potential resonance frequencies, damping levels, and nodal participation degrees of the system can be obtained, thereby identifying the risk frequency bands and dominant nodes of characteristic harmonic amplification.
- Characteristic harmonic amplification is mainly affected by the impedance coupling between the harmonic source and the AC network. The larger the nodal mutual impedance, the more obvious the propagation and amplification of harmonic currents in the network, and the more likely it is to form higher harmonic voltages at sensitive nodes. Therefore, nodal impedance characteristics can be used as an important basis for harmonic amplification risk assessment and mitigation point selection.
- Parameter sensitivity analysis can reflect the degree of influence of different components on harmonic amplification, providing a basis for key equipment identification and mitigation measure design; the C-type damping filter can enhance system damping in the target frequency band, reduce resonance peaks and nodal mutual impedances, thereby effectively suppressing characteristic harmonic amplification, and can maintain its effect within a frequency band near the tuning point. Configuring it at resonance-sensitive nodes can improve the mitigation effect and enhance system harmonic stability.
It should be noted that this paper focuses on the propagation and amplification of characteristic harmonics in the AC network, and the LCC is represented by an equivalent harmonic current source. The effects of dynamic closed-loop control, valve commutation overlap, and dynamic AC/DC system coupling on the harmonic generation of the LCC itself are not considered in this paper. These factors mainly affect the magnitudes of the characteristic harmonic currents injected into the AC system, and their influence on the harmonic amplification mechanism can be studied in future work by combining detailed converter models with the proposed frequency-domain method.
Author Contributions
Conceptualization, Y.Z. and G.W.; methodology, Y.Z. and Y.H.; software, G.W.; validation, Y.Z.; formal analysis, Y.Z.; investigation, T.H. and S.L.; resources, G.W.; data curation, Y.Z.; writing—original draft preparation, Y.Z. and G.W.; writing—review and editing, Y.Z., Y.H. and G.W.; visualization, Y.Z.; supervision, Y.H. and G.W.; project administration, Y.H.; funding acquisition, Y.H. All authors have read and agreed to the published version of the manuscript.
Funding
This research was funded by the National Natural Science Foundation of China, grant number U24B2076.
Data Availability Statement
The original contributions presented in this study are included in the article. Further inquiries can be directed to the corresponding author(s).
Conflicts of Interest
The authors declare no conflicts of interest.
References
- Kang, C.; Yao, L. Key scientific issues and theoretical research framework for power systems with high proportion of renewable energy. Autom. Electr. Power Syst. 2017, 41, 2–11. [Google Scholar]
- Zhang, Z.; Kang, C. Challenges and prospects for constructing the new-type power system towards a carbon neutrality future. Proc. CSEE 2022, 42, 2806–2818. [Google Scholar]
- Li, M.; Yu, Z.; Xu, T.; He, J.; Wang, C.; Xie, X.; Liu, C. Study of complex oscillation caused by renewable energy integration and its solution. Power Syst. Technol. 2017, 41, 1035–1042. [Google Scholar]
- Chen, L.; Xu, S.; Sun, H.; Bi, J.; Song, R.; Yi, J.; Guo, Q. A survey on wide-frequency oscillation for power systems with high penetration of power electronics. Proc. CSEE 2021, 41, 2297–2310. [Google Scholar]
- Zhang, D.; Chen, X. Overview of broadband oscillation mitigation of new energy generation power system based on impedance perspective. Proc. CSEE 2024, 44, 9672–9691. [Google Scholar]
- Fan, L.; Miao, Z. Nyquist-stability-criterion-based SSR explanation for type-3 wind generators. IEEE Trans. Energy Convers. 2012, 27, 807–809. [Google Scholar] [CrossRef] [Scilit]
- Fan, L.; Zhu, C.; Miao, Z.; Hu, M. Modal analysis of a DFIG-based wind farm interfaced with a series compensated network. IEEE Trans. Energy Convers. 2011, 26, 1010–1020. [Google Scholar] [CrossRef] [Scilit]
- Sun, X.; Lei, W.; Dai, Y.; Yin, Y.; Liu, Q. Optimization configuration of grid-connected inverters to suppress harmonic amplification in a microgrid. Energies 2022, 15, 4989. [Google Scholar] [CrossRef] [Scilit]
- Liu, X.; Xue, T.; Zhang, L.; Zhang, Y. Passive filters multi-objective parameter optimization for HVDC converter station harmonics. Mod. Electron. Tech. 2026, 49, 111–120. [Google Scholar]
- Xu, Z. Three technical challenges faced by power grids with high proportion of non-synchronous machine sources. South. Power Syst. Technol. 2020, 14, 1–9. [Google Scholar]
- Sun, J. Impedance-based stability criterion for grid-connected inverters. IEEE Trans. Power Electron. 2011, 26, 3075–3078. [Google Scholar] [CrossRef] [Scilit]
- Sun, J.; Liu, H. Impedance modeling and analysis of modular multilevel converters. In 2016 IEEE 17th Workshop on Control and Modeling for Power Electronics (COMPEL); IEEE: New York, NY, USA, 2016; pp. 1–9. [Google Scholar]
- Xing, F.; Xu, Z. Research on characteristic indices for negative resistive and capacitive effect of two-level voltage-source converter. Autom. Electr. Power Syst. 2021, 45, 12–19. [Google Scholar]
- Xing, F.; Xu, Z. Investigation on negative-resistance effect of doubly-fed induction generator. Acta Energiae Solaris Sin. 2022, 43, 324–332. [Google Scholar]
- Xu, Z.; Zhang, Z.; Xiao, H. Flexible Transmission Systems Based on Sub-Module Cascaded Converters; China Machine Press: Beijing, China, 2025. [Google Scholar]
- Xu, Z. Wideband oscillation mechanism and its suppression technology based on C-type damping filter. South. Power Syst. Technol. 2026, 20, 3–11. [Google Scholar]
- Xu, Z. Benchmark system for wideband oscillation mechanism verification and characteristic demonstration. South. Power Syst. Technol. 2026, 1–12. [Google Scholar]
- Xu, Z.; Wang, S.; Xing, F.; Xiao, H. Qualitative analysis method of electric network resonance stability. Electr. Power Constr. 2017, 38, 1–8. [Google Scholar]
- Xu, Z. Resonance stability analysis method based on s-domain node admittance matrix. Electr. Power Autom. Equip. 2023, 43, 1–8. [Google Scholar]
- Chen, Q.; Bu, S. Impedance-based stability analysis of power system wideband oscillations: A bridge between s domain and frequency domain. IEEE Trans. Power Syst. 2023, 39, 5854–5868. [Google Scholar] [CrossRef] [Scilit]
- Wang, S.; Fu, M.; Ma, J.; Zhou, S.; Zhang, Y.; Liu, T.; Peng, M. Resonance sensitivity analysis of DC-fed AC systems based on s-domain nodal admittance matrix. Power Syst. Prot. Control 2025, 53, 136–146. [Google Scholar]
- Wakileh, G.J. Power System Harmonics: Fundamental Principles, Analysis Methods and Filter Design; Xu, Z., Translator; China Machine Press: Beijing, China, 2011. [Google Scholar]
- Fang, S.; Li, J.; Huang, Y.; Qiu, W.; Sang, H. Research and evaluation of the transformer harmonic model. Proc. CSU-EPSA 2013, 25, 103–108. [Google Scholar]
- Xu, F.; Jia, J.; Guo, K.; Xu, L.; Chen, J.; Lu, Y. An optimal design method of the resonant-free C-type filter. Electr. Power Eng. Technol. 2024, 43, 183–193. [Google Scholar]

Disclaimer/Publisher’s Note: The statements, opinions and data contained in all publications are solely those of the individual author(s) and contributor(s) and not of MDPI and/or the editor(s). MDPI and/or the editor(s) disclaim responsibility for any injury to people or property resulting from any ideas, methods, instructions or products referred to in the content. |
© 2026 by the authors. Licensee MDPI, Basel, Switzerland. This article is an open access article distributed under the terms and conditions of the Creative Commons Attribution (CC BY) license.