


Abstract
To address the safety concerns in off-grid wind–solar hydrogen production systems, where fluctuating renewable power input can induce transient current shocks to the anion-exchange membrane (AEM) electrolyzer and exacerbate hydrogen–oxygen crossover under high-pressure operation, this paper develops a system-level simulation model of the AEM electrolyzer hydrogen production system based on system-level thermodynamic dynamic modeling. Three energy storage topologies—single supercapacitor, flywheel–battery hybrid, and supercapacitor–battery hybrid—are selected for comparative simulation studies. The regulation performance of each scheme is comprehensively evaluated using metrics including DC bus voltage stability, electrolyzer current slew rate (di/dt), anode–cathode pressure difference, and hydrogen content in oxygen (HTO) at a hydrogen-side pressure of 3 MPa. The results indicate that the single supercapacitor scheme, limited by its energy capacity, fails to maintain bus voltage stability in the later stage, with HTO rising from approximately 13,375 ppm to 13,405 ppm under 3 MPa, while in the pressure-effect tests HTO increases from 1900 ppm to 13,375 ppm as the hydrogen-side gauge pressure rises from 65 kPa to 3 MPa. Both the flywheel–battery and supercapacitor–battery schemes maintain the DC bus voltage within the 690–710 V range and keep HTO concentration stable under high-pressure conditions. Among them, the supercapacitor–battery topology exhibits the lowest current slew rate and the best transient impact suppression performance.
1. Introduction
Under the guidance of the “carbon peaking and carbon neutrality” goals, large-scale development and utilization of renewable energy sources such as wind and solar power have become central to the global energy transition [1]. Off-grid flexible hydrogen production systems enable local consumption of renewable energy output, bypassing constraints related to grid capacity and dispatch, and thus represent a key technological pathway for addressing clean energy curtailment in remote areas and achieving localized green hydrogen production. However, wind and solar power generation inherently exhibit randomness, intermittency, and wide-frequency fluctuations. When directly connected to an anion exchange membrane (AEM) electrolyzer hydrogen production system, these characteristics readily cause severe DC bus voltage oscillations and frequent current transients [2,3]. Such power disturbances not only reduce the local utilization efficiency of renewable energy but also inflict a range of irreversible damage on the electrolyzer. These include accelerated membrane electrode aging due to transient current shocks, pressure imbalance between the anode and cathode compartments, and aggravated hydrogen–oxygen crossover, all of which fundamentally compromise the safety, stability, and service life of off-grid hydrogen production systems [4].
Hybrid energy storage technology, leveraging the complementary advantages of multiple storage units, can effectively smooth the power fluctuations caused by renewable energy output and accommodate the dynamic operating requirements of AEM electrolyzers for flexible hydrogen production, making it a viable solution for enhancing the stability of off-grid hydrogen production systems [5]. Different energy storage topologies exhibit significant differences in power response speed, energy regulation capacity, and transient disturbance suppression capability, ultimately leading to distinctly different regulatory effects on power quality at the hydrogen production side, electrolyzer operating conditions, and overall process safety. Therefore, conducting a comparative evaluation of the dynamic performance of various hybrid energy storage topologies holds substantial engineering value for topology selection and long-term optimized operation of off-grid green hydrogen systems.
Meanwhile, most current studies on renewable-energy-based hydrogen production adopt lumped-parameter electrolyzer models [6,7,8], which assume that operating parameters such as internal temperature, pressure, and electrochemical reaction rates remain uniformly constant throughout the system, thereby neglecting the time-varying evolution of thermodynamic parameters under actual dynamic conditions. This modeling approach fails to accurately reveal the underlying mechanisms behind phenomena such as internal gas permeation, chamber pressure imbalance, and drastic fluctuations in hydrogen production rate under fluctuating wind and solar power conditions. Consequently, it leads to insufficient theoretical support and limited dynamic analysis accuracy in the evaluation of energy storage topologies. The introduction of a system-level thermodynamic dynamic model for the AEM electrolyzer, combined with multi-dimensional measured wind and solar data for performance comparison of different storage topologies, can effectively compensate for the mechanistic deficiencies of conventional lumped-parameter modeling and enhance the scientific rigor and accuracy of system dynamic evaluation results.
In terms of current research progress both domestically and internationally, most AEM electrolyzer modeling efforts focus on establishing lumped-parameter models based on macroscopic steady-state parameters such as voltage and efficiency, which can only characterize the average steady-state performance of the electrolyzer [9,10,11]. Meanwhile, thermodynamic modeling incorporating heat and mass transfer has been limited to individual core components, lacking system-level integration [12,13]. Consequently, these approaches fail to capture the dynamic response of the entire hydrogen production system under severe wind–PV fluctuations, or the transient issues induced by local reaction rate variations—such as excessive hydrogen content in oxygen (HTO) and excessive current slew rate—and are therefore insufficient to support high-accuracy dynamic performance analysis of hydrogen production systems.
In the field of renewable-energy-based hydrogen production and energy storage regulation, energy storage devices serve as the core components for smoothing wind and solar power fluctuations and ensuring the stable operation of flexible hydrogen production [14]. Single energy storage solutions generally suffer from inherent shortcomings: batteries offer high energy density but relatively slow power response, making them inadequate for suppressing high-frequency power disturbances; flywheels and supercapacitors provide extremely fast transient response but have limited energy storage capacity. Consequently, various hybrid energy storage topologies have been progressively adopted in hydrogen production systems, employing hierarchical power allocation strategies to meet both steady-state operational requirements and transient disturbance rejection demands. Most existing studies focus on control strategy optimization for a single storage type or a specific hybrid topology [15,16,17,18], with limited comparative research across multiple storage schemes.
Recent studies have made significant progress in renewable-powered electrolysis hybrid systems. For example, Serik et al. [19] reviewed green hydrogen production technologies and highlighted that high capital costs and infrastructure gaps remain major barriers to large-scale deployment. Mahmood et al. [20] developed Pt-free electrocatalysts for hydrogen evolution, while Eid and Antonietti [21] demonstrated carbon nitride materials with superior HER performance, showing the potential for cost reduction. At the system level, Jia et al. [22] and Zhang et al. [23] modeled HTO behavior in alkaline electrolyzers and revealed that gas purity is strongly affected by pressure, temperature, and operating states. Bekki et al. [24] proposed a robust control strategy for a PV-TEG hybrid system with hydrogen and battery storage, but the study focused on a single topology and did not compare multiple energy storage configurations. These studies provide valuable insights, yet several challenges remain: (i) most studies focus on a single storage topology or a specific control strategy, lacking a fair comparison among multiple topologies under identical operating conditions; (ii) HTO behavior under high-pressure transient conditions is still not fully understood, especially for AEM electrolyzers; and (iii) dynamic performance validation against experimental data remains limited. These gaps motivate the present work.
Moreover, the evaluation metrics used in these studies are largely confined to grid-connected power quality aspects [25], without incorporating critical indicators such as electrolyzer transient impact levels, hydrogen production safety margins, and gas-path thermodynamic stability. This narrow evaluation framework falls short of the comprehensive assessment requirements for safe and stable operation of off-grid flexible hydrogen production systems.
In view of the research status outlined above, three main deficiencies remain in current studies on off-grid wind–solar hydrogen production coupled with energy storage. First, the accuracy of electrolyzer modeling is limited: Second, the performance comparison of energy storage topologies relies on a narrow set of evaluation criteria; most existing assessment frameworks focus predominantly on power quality indicators, lacking a comprehensive multi-dimensional evaluation framework that incorporates electrolyzer transient characteristics, hydrogen production safety, and gas-path operational stability. Third, the comparative performance results lack mechanistic interpretation; most studies remain at the level of simulation data comparison, without explaining the underlying reasons for the differing regulation effects of various storage topologies in terms of the internal thermodynamic mechanisms of the electrolyzer.
To address the aforementioned issues, this paper first develops a complete system-level thermodynamic dynamic model of the AEM electrolyzer hydrogen production system, which reproduces the time-varying evolution of internal temperature, pressure, reaction rates, and gas permeation phenomena, thereby completing the full-system simulation model for off-grid wind–solar hydrogen production. Second, three off-grid hydrogen production simulation models with distinct storage topologies—single supercapacitor, flywheel–battery hybrid, and battery–supercapacitor hybrid—are established, with simulation input conditions defined based on synthetic wind and solar power data. Third, a multi-dimensional dynamic performance evaluation framework is constructed, encompassing transient impact resistance, hydrogen production safety, and operational stability, and a cross-comparative analysis of the three storage topologies is conducted. Finally, based on the system-level thermodynamic dynamic model, the underlying mechanisms by which different storage topologies regulate the operating state of the AEM electrolyzer hydrogen production system are revealed, enabling the selection of the optimal storage topology for off-grid wind–solar hydrogen production scenarios, along with corresponding engineering recommendations.
2. System Architecture and Thermodynamic Dynamic Modeling
2.1. Overall Architecture of the Off-Grid Flexible Hydrogen Production System
The renewable-energy-based off-grid flexible hydrogen production system studied in this paper mainly consists of four parts: wind and photovoltaic (PV) power generation units, a hybrid energy storage unit, a DC bus, and an AEM electrolyzer hydrogen production system unit [26]. The system operates in off-grid mode, with wind and PV as the sole energy inputs, supplying power to the AEM electrolyzer system via the DC bus. The hybrid energy storage unit is connected in parallel to the DC bus and serves to smooth power peaks and valleys, mitigate fluctuations, and regulate transient voltage, thereby accommodating the dynamic operating requirements of flexible hydrogen production.
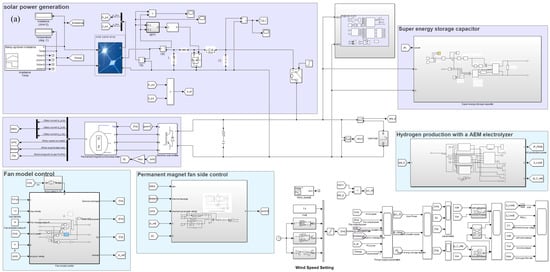
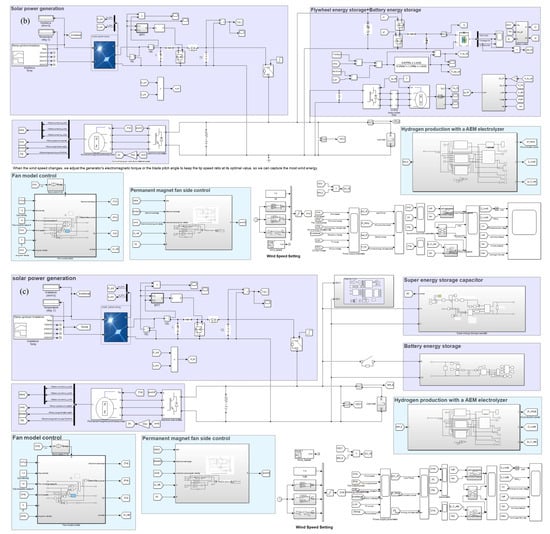
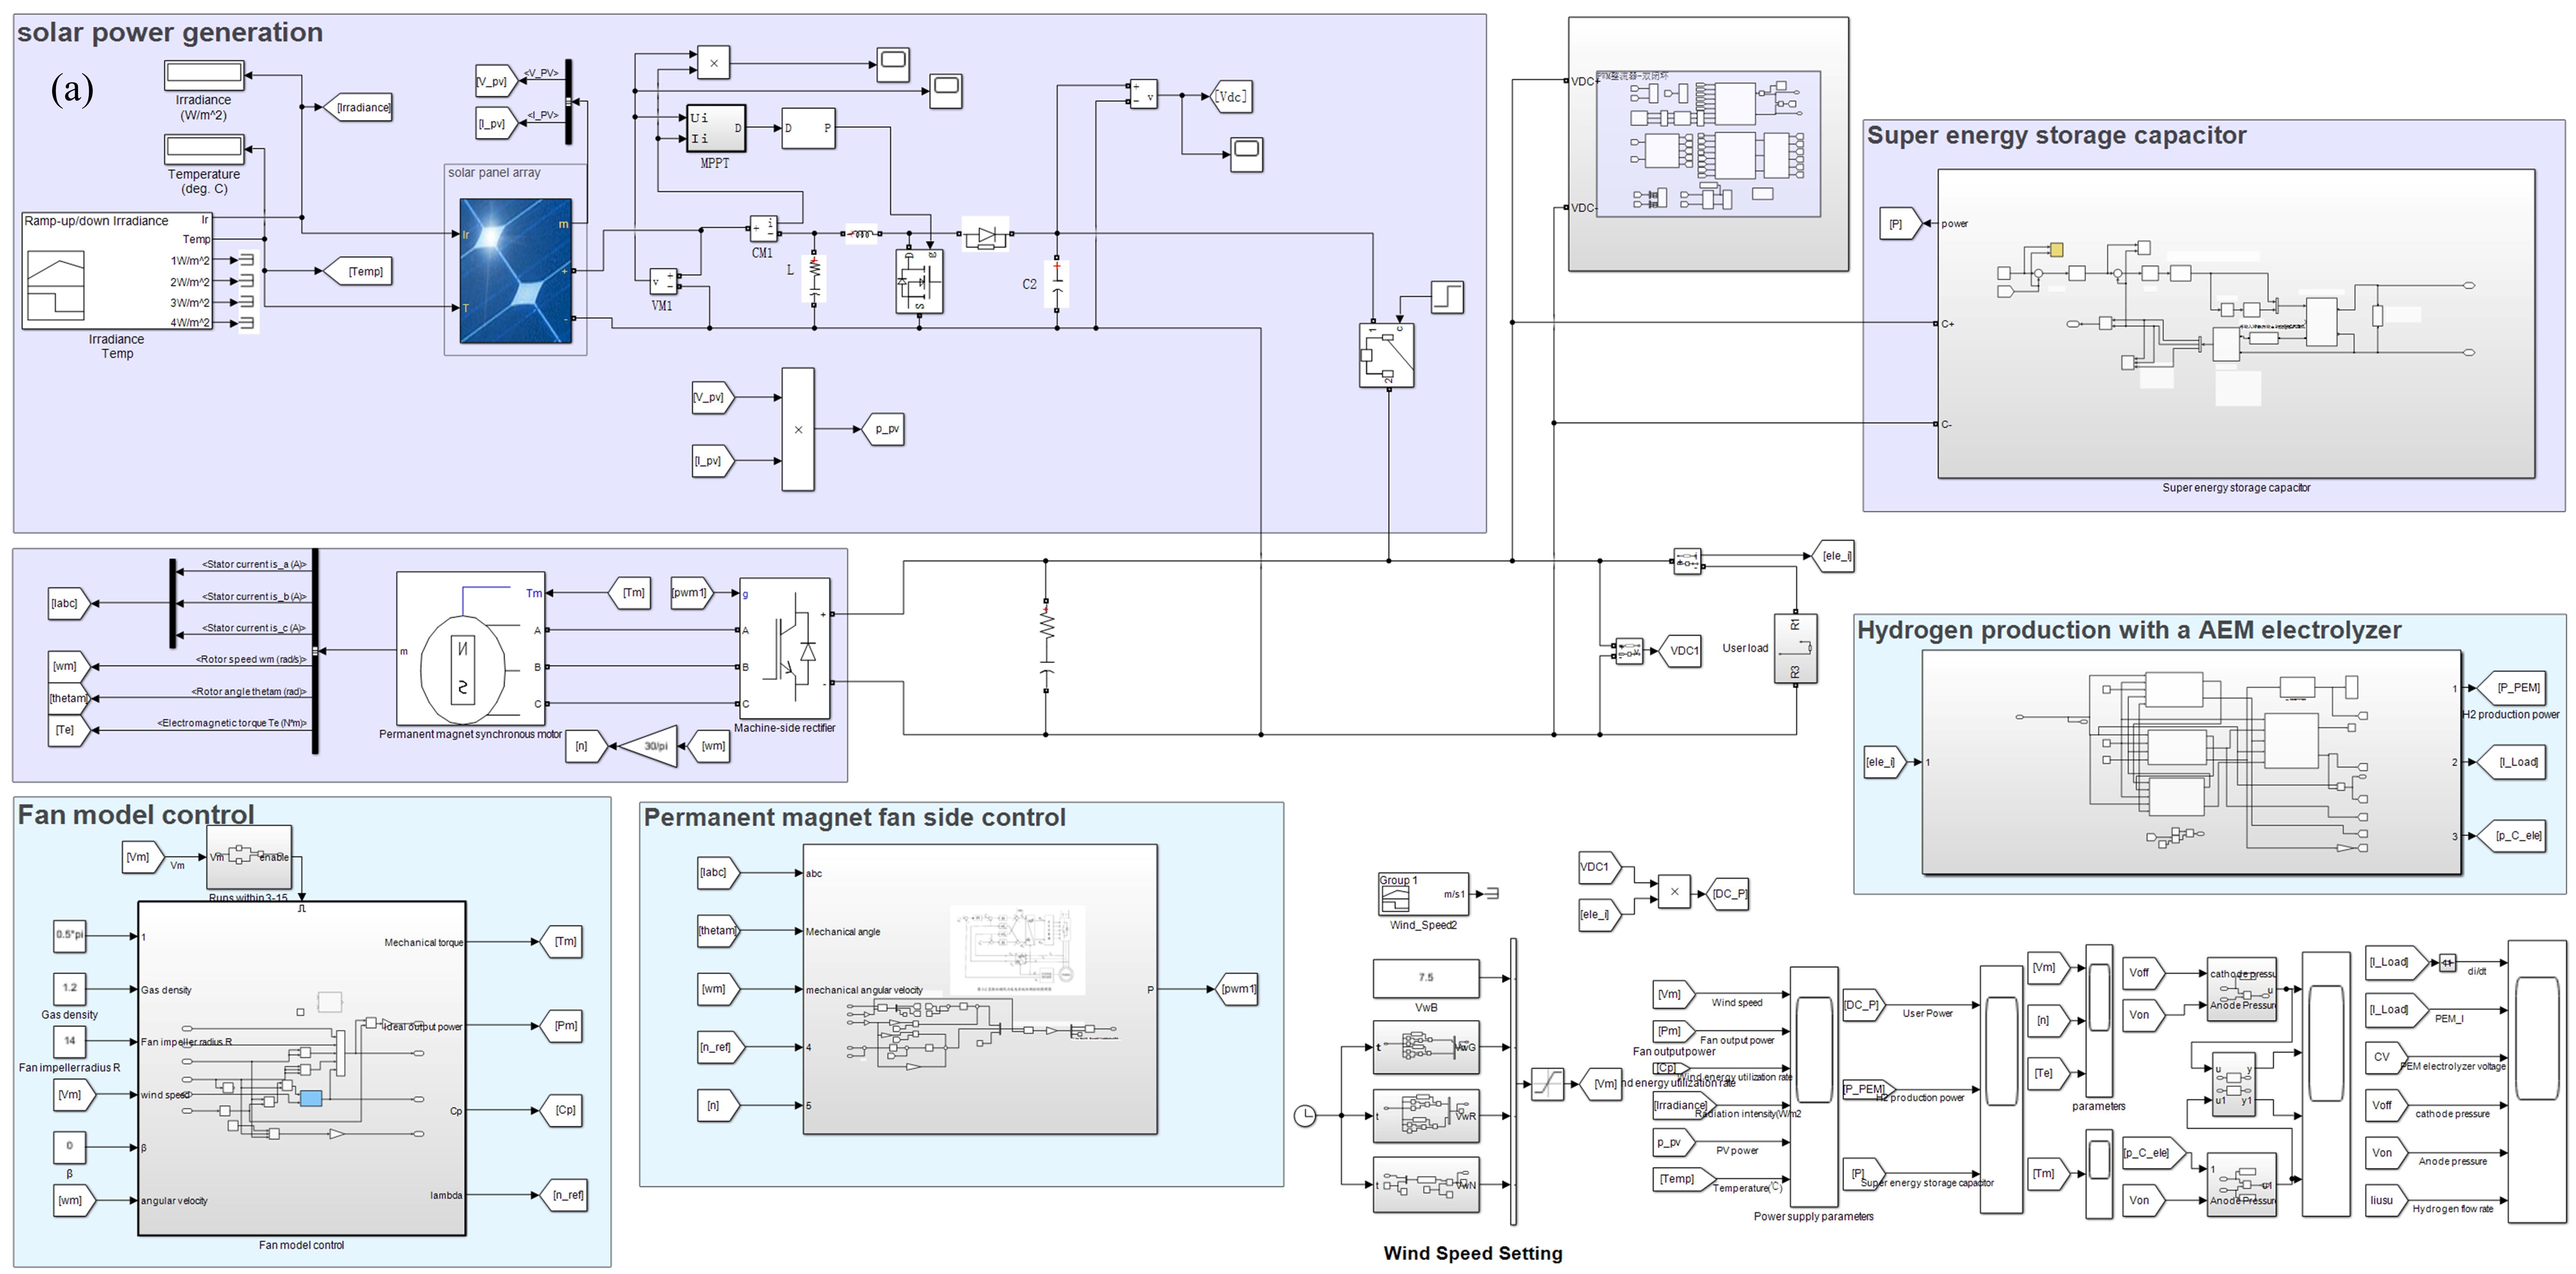
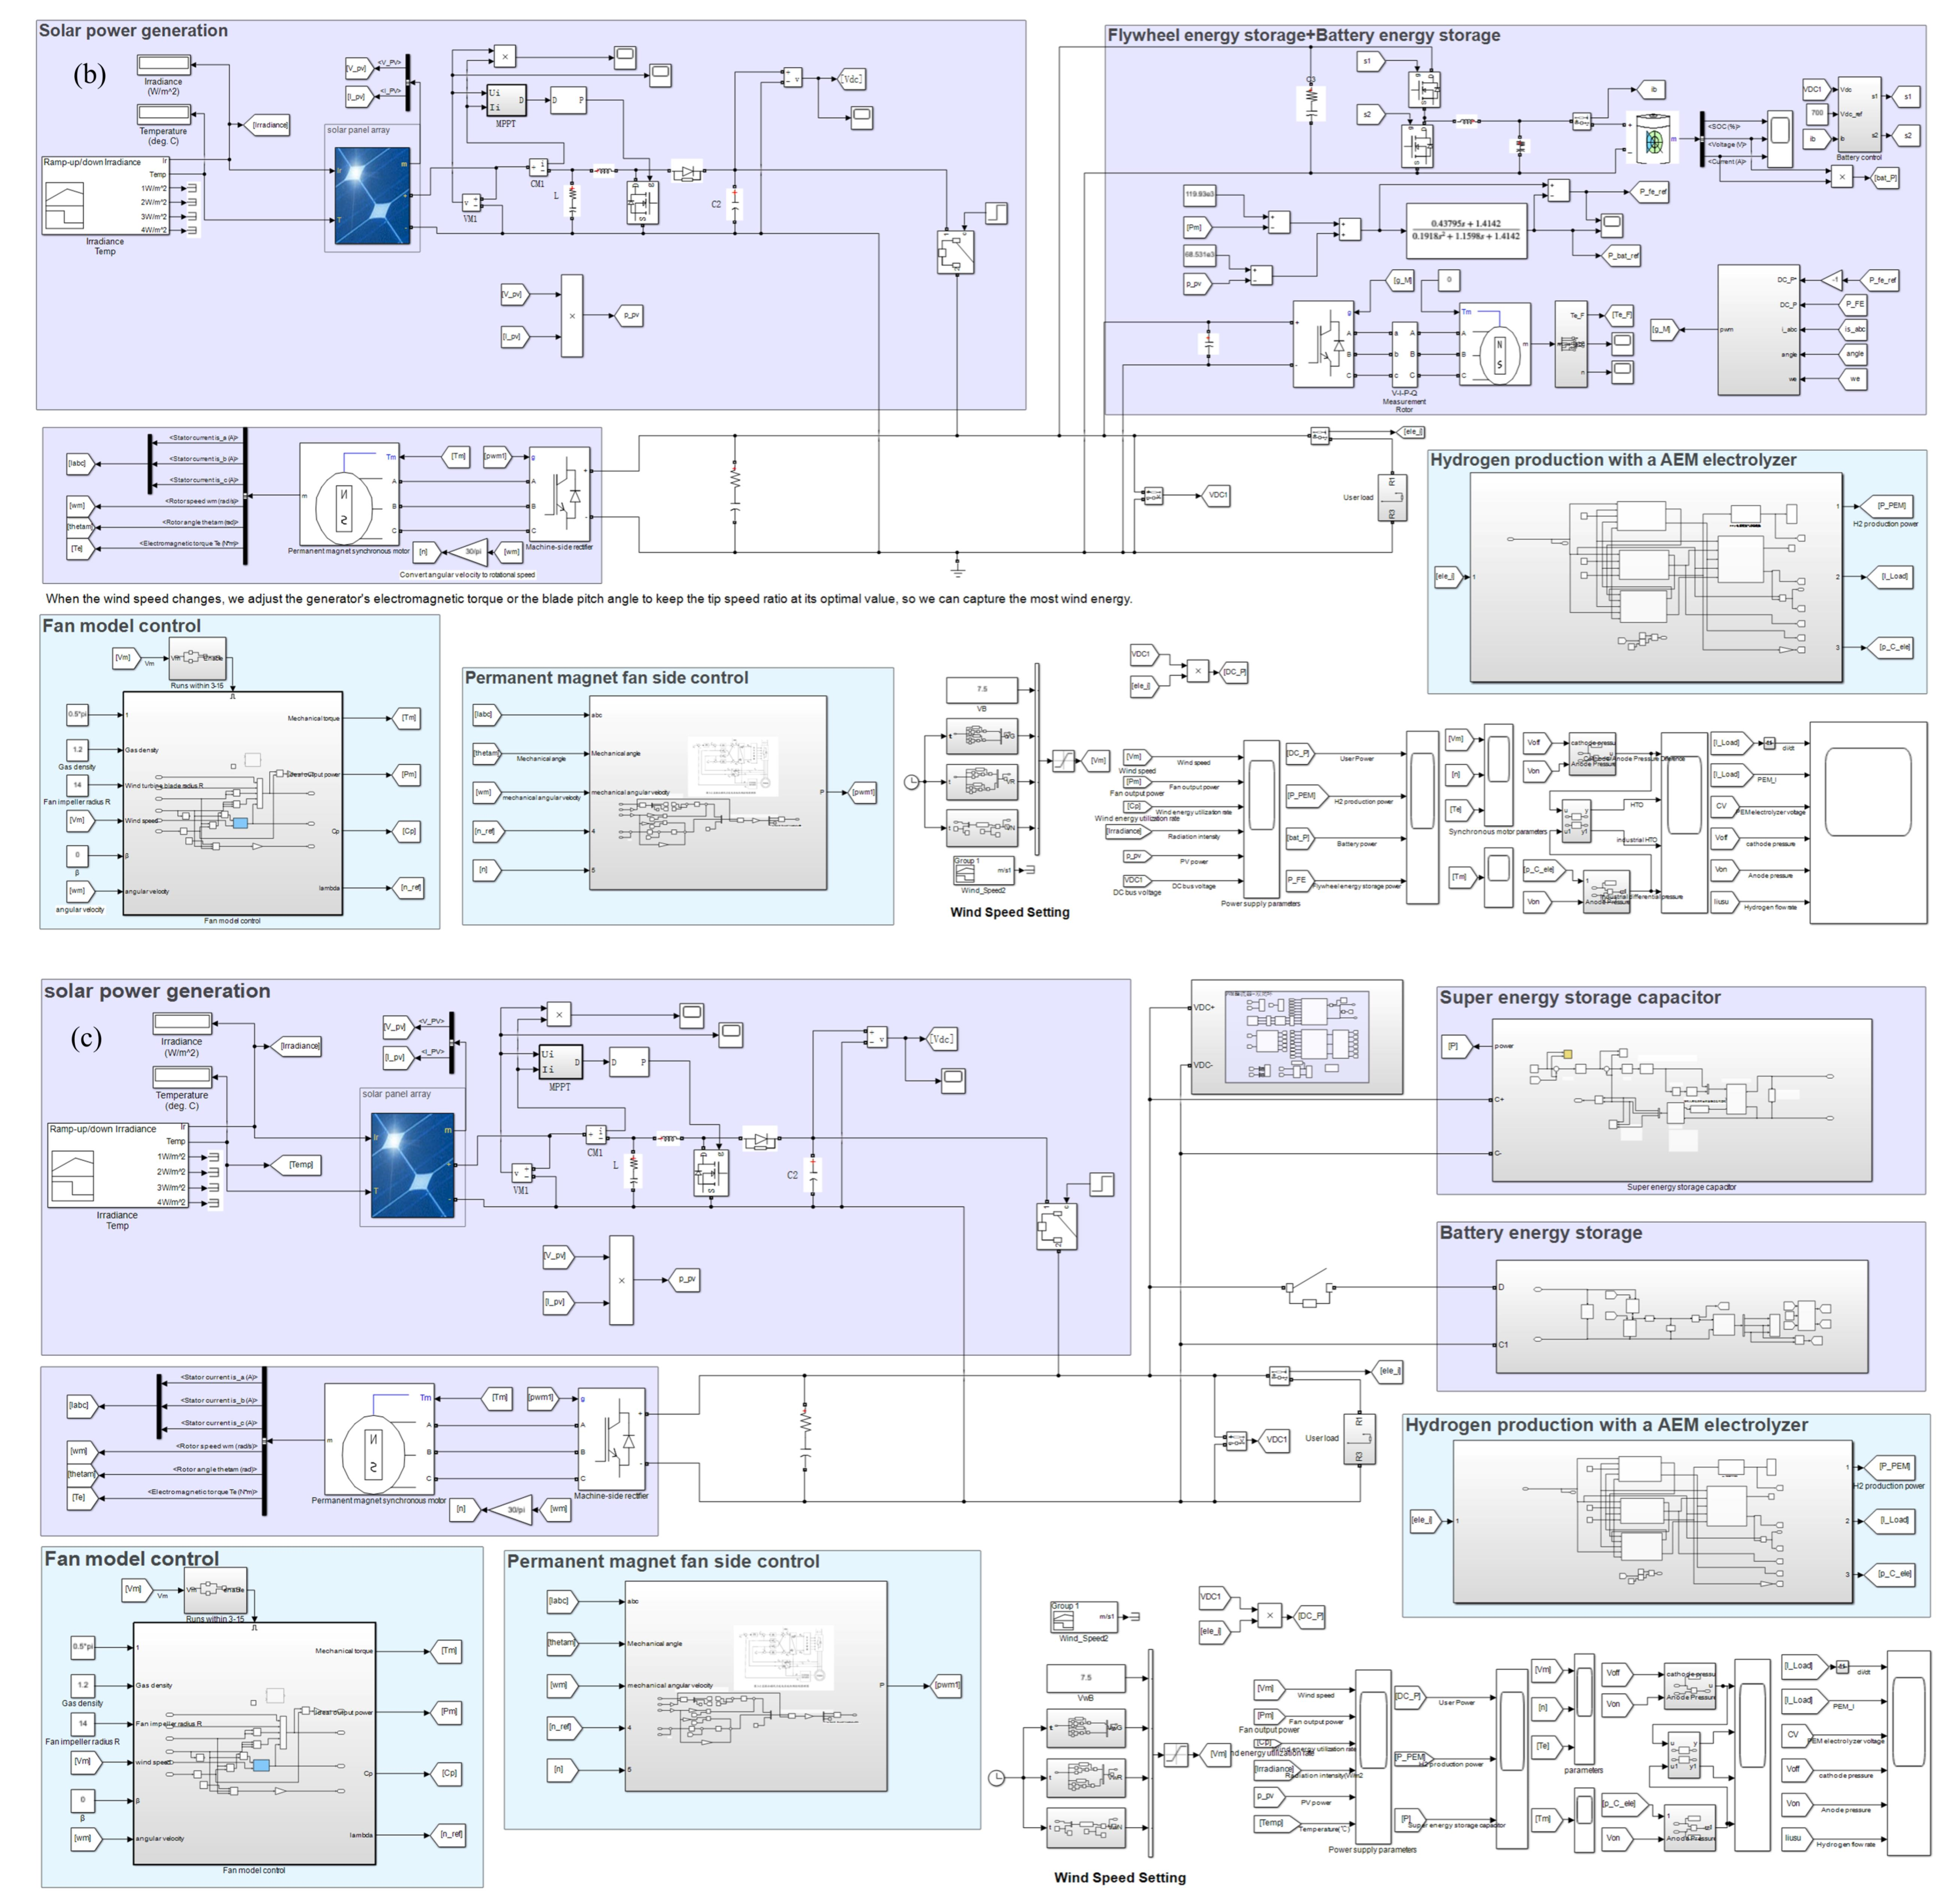
To comprehensively compare the regulation performance of different energy storage topologies, three commonly used engineering topologies are selected in this study [27,28,29]. Topology 1 is a single supercapacitor energy storage topology, as shown in Figure 1a, which relies on the high-frequency response advantage of supercapacitors to smooth system fluctuations. Topology 2 is a flywheel–battery hybrid energy storage topology, as illustrated in Figure 1b, where the flywheel handles high-frequency transient regulation while the battery undertakes low-frequency energy regulation [30]. Topology 3 is a battery–supercapacitor hybrid energy storage topology, as shown in Figure 1c, which combines the high energy density of batteries with the fast response of supercapacitors to achieve hierarchical regulation of high- and low-frequency fluctuations.
Figure 1.
Renewable energy off-grid flexible hydrogen production system: (a) single supercapacitor energy storage; (b) flywheel–battery hybrid energy storage; (c) supercapacitor–battery hybrid energy storage.
Wind turbines are driven by wind energy, and the characteristics of wind speed directly determine the output performance of the turbine. Therefore, wind speed modeling serves as the foundation for simulating wind turbine behavior. To reflect the randomness and fluctuations of wind speed, a combination of four typical wind speed components is generally adopted as the wind speed model, namely the base wind VB, gust wind VG, ramp wind VR, and random wind VN [31].
Base wind: Under normal turbine operation, wind speed varies around a mean level; the base wind component VB is typically considered constant.
Gust wind: To account for sudden wind speed changes, the gust component VG is introduced in Equation (1):
where Gmax is the maximum gust wind speed, T1G is the gust start time, and TG is the gust period.
Ramp wind: To simulate the gradual variation characteristics of wind speed, the ramp wind component VR is introduced in addition to the base wind, as given in Equation (2).
where AR is the maximum ramp wind speed, TSR is the ramp wind start time, and TER is the ramp wind end time.
Random wind: To simulate the stochastic disturbance component in wind speed, the random wind component VN is superimposed, as given in Equation (3):
where φi is the random phase uniformly distributed between 0 and 2π, wl is the angular frequency of each frequency band, KN is the surface roughness coefficient, Fr is the disturbance range, and μ is the mean wind speed at the relative height, and Sv(wi) is the power spectral density (PSD) function of the random wind speed component.
In summary, the mathematical model of wind speed is given by Equation (4):
Vw = VB + VG + VR + VN
2.2. Thermodynamic Modeling of the AEM Electrolyzer Hydrogen Production System
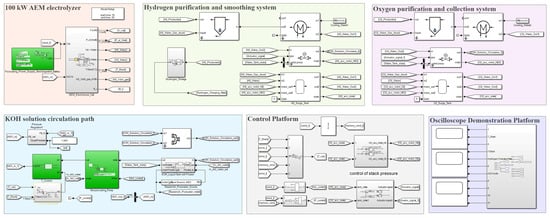
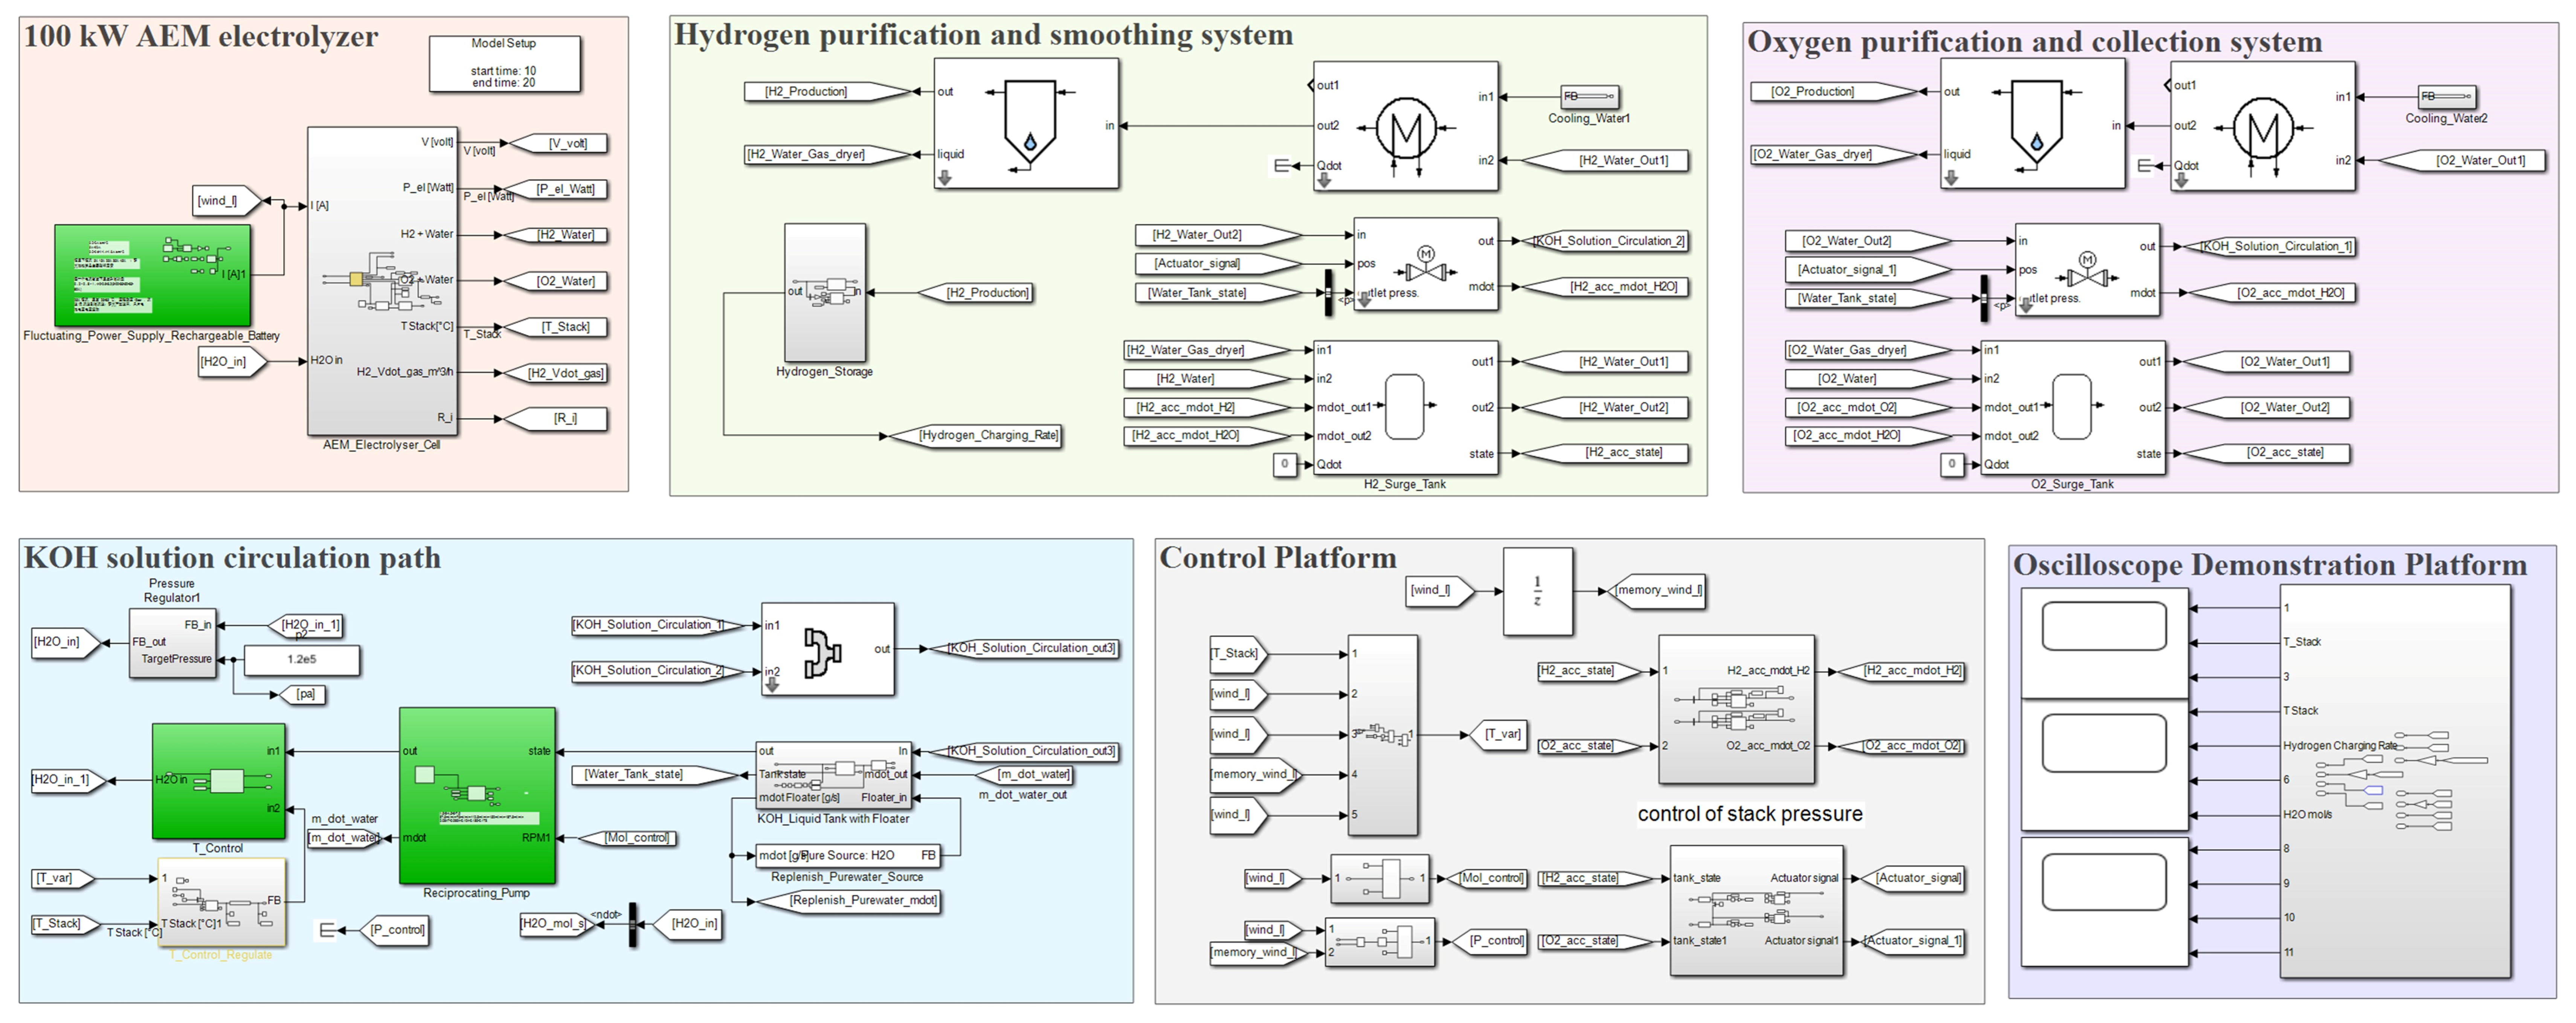
A complete AEM electrolyzer hydrogen production system is constructed based on thermodynamic modeling. As shown in Figure 2, the system consists of a KOH solution tank, a reciprocating pump, temperature/pressure and flow rate controllers, an AEM electrolyzer, buffer tanks, solenoid valves, an intercooler, a mixer, a gas–liquid separator, a compressor, and other auxiliary components. During the hydrogen production process, the fluctuating power from wind turbines or photovoltaic sources, after simple conditioning, is fed into the AEM electrolyzer system. The generated hydrogen and oxygen pass through buffer tanks and then enter the intercooler for temperature control. Subsequently, the gas–liquid separator returns the alkaline solution to the buffer tank, while the gases are compressed into the hydrogen storage tank via the compressor. Meanwhile, the liquid in the buffer tank is circulated to the KOH solution tank through the mixer under the control of solenoid valves (PID). Finally, deionized water in the alkaline solution tank is replenished through the water makeup tank [32].
Figure 2.
Simulation model of the AEM electrolyzer hydrogen production system based on system-level thermodynamic dynamic modeling.
In this section, a thermodynamic model of the AEM electrolyzer hydrogen production system is established, encompassing electrochemical mechanism models, thermodynamic and heat transfer models, dynamic models of key auxiliary components (pumps, valves, tanks, separators, and mixers), closed-loop control logic, and performance evaluation metrics. The model establishes mass, energy, and charge conservation equations for each component of the AEM electrolyzer system and couples them with auxiliary system models to achieve a refined description of the full-system dynamic behavior [33].
Mass is a conserved quantity (except in nuclear reactions). In the absence of chemical reactions within the system, the mass of any individual compound is also conserved, as described by the mass conservation equation in Equation (5):
In thermodynamic simulation modeling, all components except the tank do not accumulate mass. If there is no mass accumulation within the control volume—for example, under steady-state or steady-flow conditions—the equation reduces to Equation (6):
In thermodynamic simulation modeling, the energy storage modules of components have inputs and outputs—such as Qdot or Pmch—that represent energy crossing the module boundaries.
When such a signal has a positive value, the energy flow is directed from outside the module to its interior; the energy/power/heat is then added to the fluid or to the internal energy storage.
Conversely, when such a signal is negative, the energy flow is directed from the module interior to the outside, meaning that energy/power/heat is extracted from the fluid or from the internal energy storage.
Equation (7) represents the energy conservation law, where Hin,i is the enthalpy flow rate of the i-th inlet stream, Hout,j is the enthalpy flow rate of the j-th outlet stream, Qk is the k-th heat flow rate, Pm is the m-th mechanical power, and U is the internal energy of the component.
This implies that for a compressor, Pmch is typically positive, as mechanical energy from the shaft is added to the fluid; for a turbine, it is negative, since power is extracted from the fluid.
For thermal components such as a reactor, the Qdot signal—representing heat exchange with the environment—is usually negative, as heat is released from the reactor (assuming a cold ambient environment).
In a steady-state adiabatic chemical reactor, the total enthalpy (sensible heat + enthalpy of formation) at the inlet and outlet are equal. However, due to differences in species concentrations between the inlet and outlet streams, the corresponding temperatures may differ significantly.
In thermodynamic simulation, both gas-phase and liquid-phase models are involved. For gas-phase modeling, two approaches are available: the ideal gas equation of state and the real gas model based on the Peng–Robinson equation of state (EOS). In this study, the real gas Peng–Robinson EOS is adopted.
The Peng–Robinson equation of state involves three interrelated state parameters—pressure p, temperature T, and molar volume v—as given in Equation (8):
From the state parameters (p, v, T), the departure functions for molar enthalpy (denoted as h) and molar entropy (denoted as s) can be calculated:
where α is defined in the Peng–Robinson equation of state, Tγ is the reduced temperature, pγ is the reduced pressure, Z is the compressibility factor (as given in Equation (10)), and B is the correction coefficient (as given in Equation (11)).
The temperature dependency of the saturated liquid density is modeled using the following Equations (12) and (13):
ρf,sat(T) = ρc(1 + Aτ1/3 + Bτ2/3 + Cτ + Dτ4/3)
The liquid density is calculated using the PR-EOS, as given in Equation (14). Its offset is matched to the liquid density at the reference temperature Tv,ref. With a specified bulk modulus, the liquid phase is modeled as compressible.
For the liquid phase, the heat capacity of all compounds is assumed to be temperature-dependent, as given in Equation (15):
The coefficients A, B, C, and D must be provided in the chemical fluid property database, along with the applicable temperature limits for the polynomial. Outside these limits, the heat capacity is assumed to be constant.
To ensure consistency with the gas-phase calculations, the liquid enthalpy is derived from the gas-phase enthalpy and converted to the liquid state using an explicitly given function of the enthalpy of vaporization, as shown in Equation (16).
hm,f,sat,i(T) = hm,g(T) − hfg(T)
To ensure consistency in the calculation of dense-state and supercritical region paths, a linear interpolation of the pressure-dependent liquid enthalpy is performed between the saturation pressure and the critical pressure, as given in Equation (17).
Based on thermodynamic modeling, the properties of liquid and gas mixtures are obtained from the pure-component properties by simple summation. The enthalpy and entropy of the mixture are given by Equation (18) and Equation (19), respectively.
A key component in the present thermodynamic modeling is the equilibrium reactor, which calculates the chemical equilibrium at a given temperature and pressure from specified initial compositions. The thermodynamic equilibrium is defined by the minimum of the Gibbs free energy G.
For the given reaction in Equation (20):
aA + bB ↔ cC + dD
The chemical equilibrium condition is given by Equations (21) and (22):
where Ψj is the mole fraction of species j, ΔG is the Gibbs free energy difference between products and reactants, and R is the universal gas constant. It is assumed that all products and reactants are in the gas phase, and that all concentrations used are the total concentrations of the respective species.
The chemical processes occurring during the operation of the AEM electrolyzer consist of two half-reactions [34]: the oxygen evolution reaction (OER) at the anode and the hydrogen evolution reaction (HER) at the cathode.
Oxygen evolution reaction (OER):
4OH− → O2 + 2H2O + 4e−
Hydrogen evolution reaction (HER):
4H2O + 4e− → 2H2 + 4OH−
Overall reaction:
2H2O → 2H2 + O2
In this study, the actual operating voltage of the AEM electrolyzer [35] mainly consists of four components: the open-circuit voltage Eoc, the cathodic and anodic activation polarizations Vact, the ohmic polarization Vohm, and the concentration polarization Vcon:
Vcell = Eoc + Vact + Vohm + Vcon
The open-circuit voltage Eoc is governed by the Nernst Equation (27), which depends on the temperature T and the activity of the reacting species a [36].
Under the standard conditions of 298 K and 1 bar, the reference electrolysis voltage can be calculated [37] as given in Equations (28) and (29):
In alkaline water electrolysis via the half-cell reactions of Equations (23) and (24), when oxygen is assumed to behave as an ideal gas at 298 K and 1 bar, Equation (30) simplifies to Equation (31):
E+ ≈ 1.23 + pKe − 0.06pH
At the cathode, Equation (32) reduces to Equation (33) when hydrogen is assumed to behave as an ideal gas at 298 K and 1 bar.
E− ≈ pKe − 0.06pH
In summary, the voltage required for water electrolysis in an alkaline environment is given by:
Ecell = E+ − E− = 1.23V
The relationship between the current and the chemical gas production rate at each electrode is governed by Faraday’s law of electrolysis. Equations (35) and (36) quantitatively describe the proportional relationship between the current passing through the electrode and the molar production rate of the electrochemical reaction products.
Meanwhile, in the AEM electrolyzer, in the absence of mass transport limitations, the kinetics of charge transfer at any metal/electrolyte interface follow the Butler–Volmer relationship [38]. Equation (37) quantitatively describes the nonlinear relationship between the net reaction current density i at the electrode and the charge-transfer overpotential η.
where i0 is the exchange current density of the half-cell process (A·cm−2), β is the symmetry factor, n = 2 is the number of electrons exchanged during the electrochemical splitting of one water molecule, F = 96,485 C/mol is the Faraday constant (the charge of one mole of electrons), R = 8.314 J/mol/K is the universal gas constant, η is the charge-transfer overpotential (V), and T is the absolute temperature (K).
The gas–liquid separator module is primarily designed to reduce condensed liquid in the gas stream. In this module, the liquid fraction carried in the adiabatic flow is reduced, and the retention rate is regulated by a retention factor. This factor is correlated with the separation efficiency η via a lookup table—the higher the retention rate, the more liquid is removed. The corresponding relationship is given by Equation (38):
where η denotes the retention efficiency. This relationship is determined via a lookup table, with a higher retention rate corresponding to more effective liquid separation.
mLiquidWaterSeperated = mLiquidWaterEntered × η
Intercooler module: heat exchange between two fluids based on the NTU (Number of Transfer Units) method. The intercooler calculates the state changes resulting from indirect heat exchange between two media. The module supports three flow configurations: counterflow, parallel flow, and crossflow. The NTU method is employed to model the heat exchanger and determine the maximum possible heat transfer between the two fluid streams. The actual heat transfer rate is then obtained via the effectiveness ε, defined as the ratio of actual heat transfer to the maximum possible heat transfer, as given in Equation (39):
Parallel flow (Equation (40)), counterflow (Equation (41)), and crossflow (Equations (42)–(46)):
Cmin = min(m1cp1,m2cp2)
Cmax = max(m1cp1,m2cp2)
Thus, Equation (47) is derived:
UA is the heat transfer rate per unit temperature difference between the fluid streams (W/K), representing the combined heat transfer between the fluid and the wall as well as conduction through the wall. It is the product of the overall heat transfer coefficient and the effective heat transfer area between the fluids.
Qmax = Cmin(Thi − Tci)
To approximate the dynamic thermal behavior of the module, the model assumes that the two fluid streams entering the intercooler exchange heat via their respective thermal masses. The heat exchange between these thermal masses and the ambient environment is described by the following relationship:
QLenv(flow1 → env) = KenvAenv(T1 − Tenv)
Meanwhile, to prevent the fluid temperature from overshooting the ambient temperature, this heat exchange is constrained by the enthalpy difference between the streams evaluated at T1 and Tenv.
The three-way valve divides the incoming fluid into two streams, with the split ratio determined by a given position value. A valve position of 1 means the valve is fully open and all fluid is directed to the first outlet, whereas a value of 0 closes the valve, directing the entire flow to the second outlet, as described by Equations (51) and (52). This process is adiabatic.
From the first law of thermodynamics, Equation (53) can be derived:
The pressure drop is independent of the valve position.
The solenoid valve module is configured to calculate the pressure drop based on the flow coefficient Kv (volumetric flow rate):
The mixer module calculates the temperature, composition, and pressure resulting from the adiabatic mixing of two fluid streams. It accounts for phase change but does not consider chemical reactions. The outlet enthalpy is the sum of the inlet enthalpies. The module supports two mixer modes. In Mode 1, the mixer simply combines the two fluid streams—with or without phase change—and the outlet mass flow rate equals the sum of the inlet mass flow rates. From the first law of thermodynamics applied to the mixer, Equation (55) is obtained:
Two methods are available in the mask for calculating the resulting flow pressure: the first is the minimum of the two pressures, and the second is the mole-weighted average of the inlet pressures [39], as given in Equation (56). On this basis, the pressure loss factor k is defined in Equation (57):
Due to space limitations, detailed modeling of some core components—including tanks, the proportional mixer, compressor, pump, etc.—is provided in the Supplementary Material.
2.3. HTO and Hydrogen Crossover Transport Model
The hydrogen crossover transport framework of the AEM electrolyzer model in this study is based on the solution-diffusion mechanism and incorporates the effect of electro-osmotic drag on the membrane hydration state. To reflect the pressure-driven effect under high pressure, the model calibrated by the industrial collaborator combines diffusion and pressure effects into a pressure-dependent effective permeation coefficient. The hydrogen transmembrane permeation flux, JH2, is given by Equation (58):
where JH2 is the hydrogen transmembrane permeation flux (mol/(m2·s)); PH2,eff is the effective permeation coefficient (mol/(m·s·Pa)), determined internally by the industrial-calibrated model and incorporating the dependence on temperature T, membrane hydration degree λ, and cathode–anode pressure difference Δp (the pressure-difference-dependent term essentially accounts for the pressure-driven convective transport effect); Lmem is the membrane thickness (μm); and PH2,cat and PH2,an are the hydrogen partial pressures at the cathode and anode sides, respectively.
Electro-osmotic drag affects the membrane hydration state via water transport rather than directly transporting neutral H2 molecules, thereby indirectly modifying PH2,eff (Equation (59)).
where JH2O,EOD is the water flux induced by electro-osmotic drag, ξEOD is the electro-osmotic drag coefficient, i is the current density, and F is the Faraday constant.
To quantitatively distinguish between the increase in absolute permeation and the low-load concentration effect, this study simultaneously reports the oxygen production rate, nO2, and the transmembrane hydrogen molar flow rate, nH2,cross, as given in Equations (60) and (61):
where yH2 is the dry-basis volume fraction of hydrogen in the oxygen-side outlet gas (i.e., HTO, in ppm); nO2 is the theoretical molar oxygen production rate per unit time (mol/s); I is the electrolysis current (A); F is the Faraday constant (96,485 C/mol); and Ncell is the number of electrolyzer cells.
In this study, a conservative safety threshold of 2 vol% hydrogen (dry basis) at the oxygen-side outlet is adopted [40].
The system simulation model is shown in Figure 2, which mainly includes the AEM electrolysis main system loop, the control section, and the display platform. All analyses in this study are conducted based on the aforementioned platform.
To comprehensively evaluate the transient dynamic performance of the three energy storage topologies, five indicators were selected: T-1 (di/dt), T-2 (HTO), T-3 (ΔP), D-1 (Ubus), and D-2 (H2 rate), representing current transient impact, hydrogen-in-oxygen safety, pressure difference fluctuation, bus voltage deviation, and hydrogen production performance, respectively. Among them, the first four are cost-type indicators, for which lower values indicate better performance, while D-2 is a benefit-type indicator, for which higher values indicate better performance. The feature extraction method for each indicator is listed in Table 1.
Table 1.
Selection of evaluation parameters.
In this study, the Min-Max normalization method was adopted to map all indicators to a score range of 30–100. For cost-type indicators, the reverse normalization formula is expressed as:
For benefit-type indicators, the forward normalization formula is expressed as:
In terms of weight selection, since the five indicators represent different aspects of transient dynamic performance, the equal weighting method was employed, i.e., the weight of each indicator is wi = 1/5 = 0.2. Finally, the linear weighted summation method was used to calculate the comprehensive score of each topology:
where Scorej is the final comprehensive score of the j-th topology, and Sij is the normalized score of the j-th topology on the i-th indicator.
3. Simulation Results and Comparative Analysis of Multi-Dimensional Evaluation Metrics
3.1. Model Calibration and Validation
The AEM electrolyzer model in this study was calibrated based on measured data from an AEM prototype. The anion exchange membrane parameters, including membrane thickness range, OH− conductivity, swelling ratio, mechanical strength, and ionomer information, are listed in Table 2. The anode and cathode parameters are given in Table 3.
Table 2.
Anion exchange membrane parameters.
Table 3.
Electrode parameters.
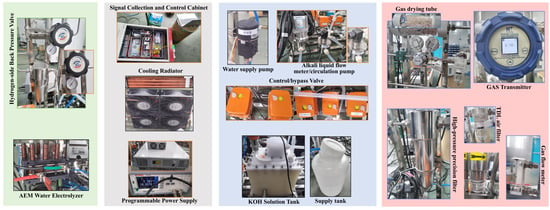
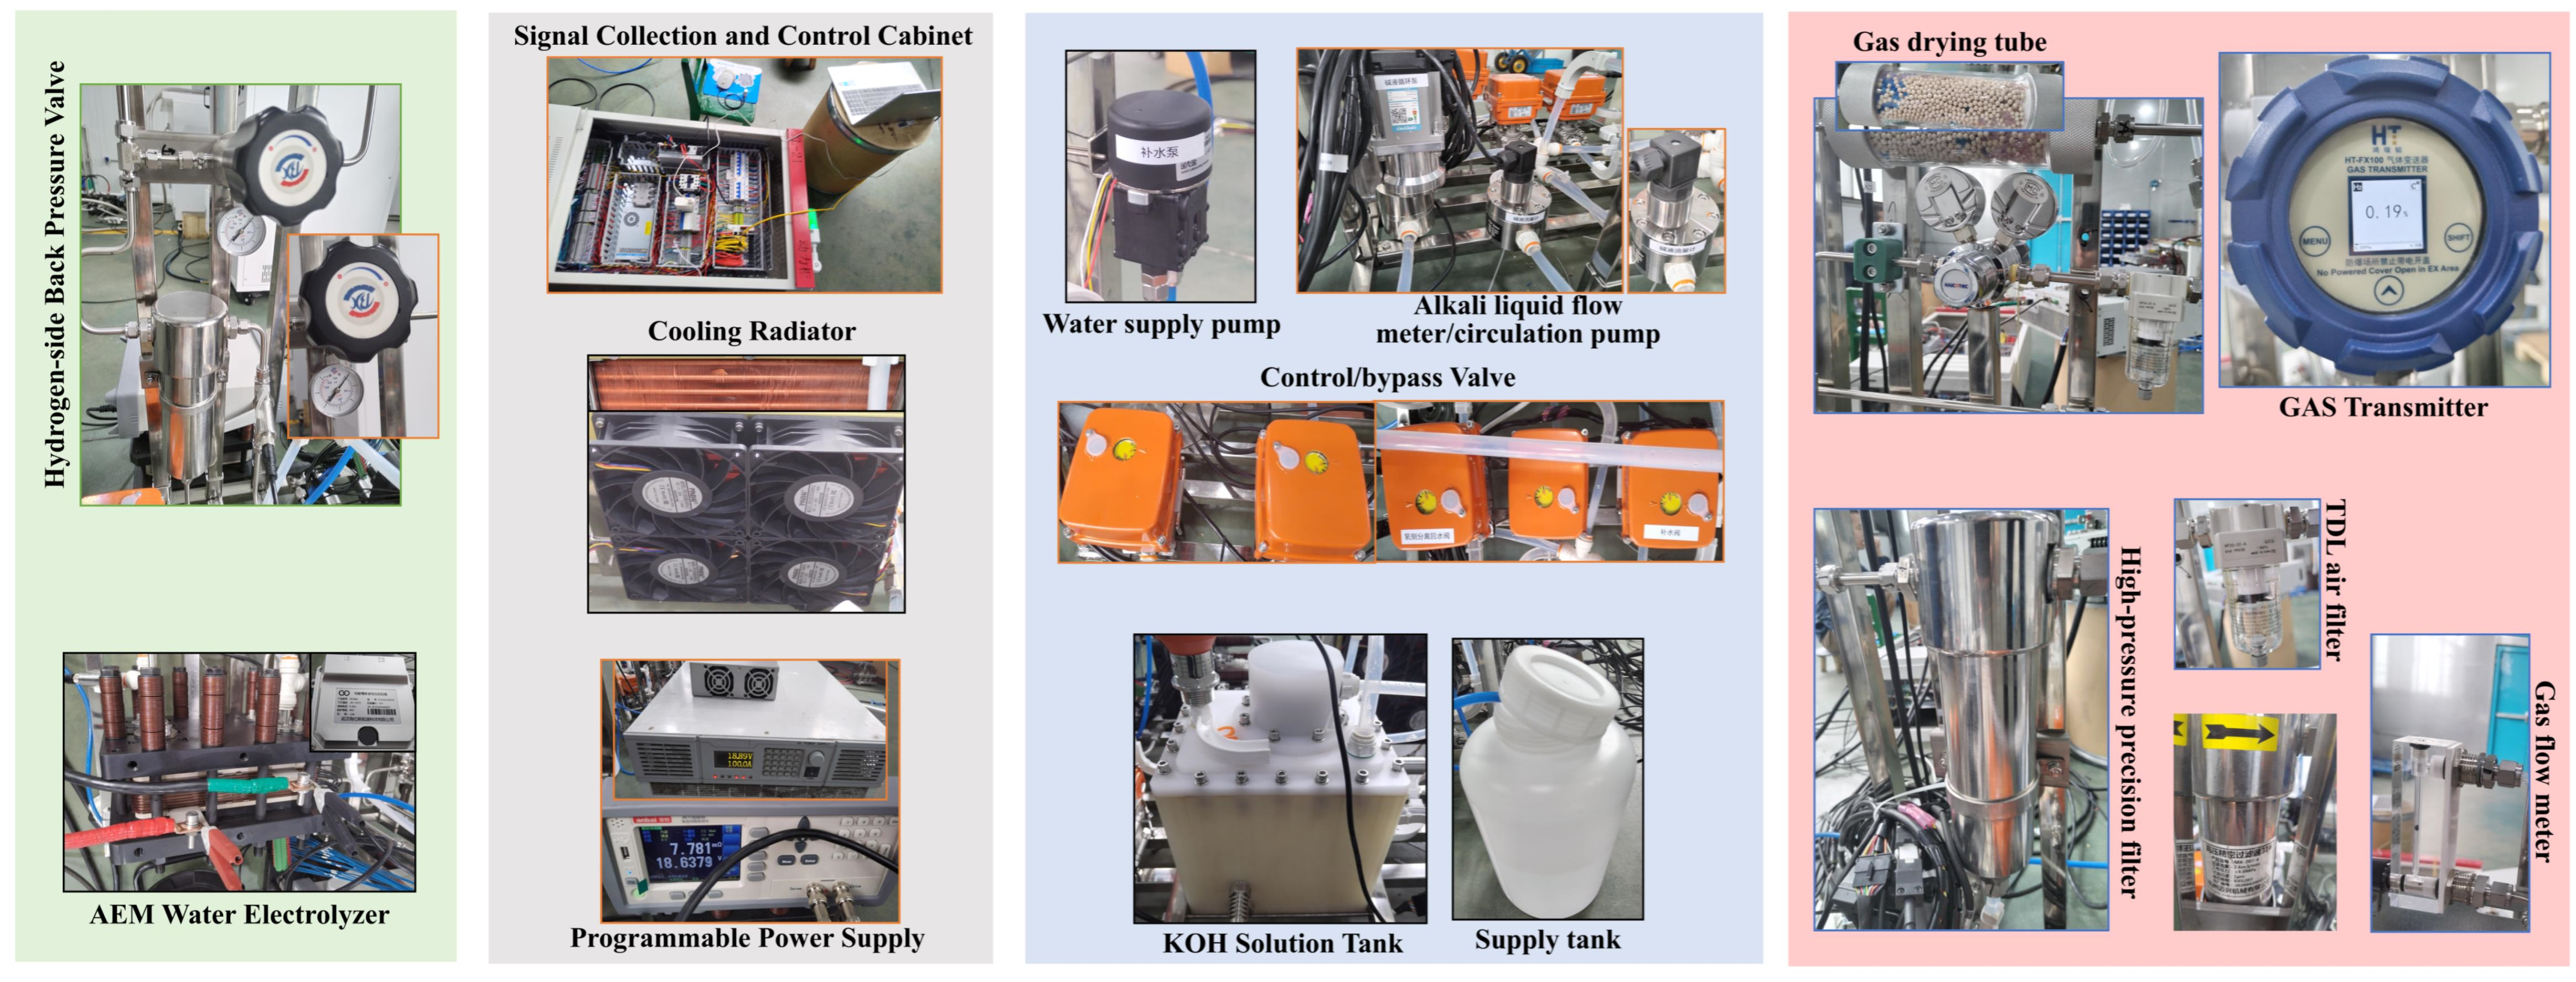
In this study, HTO is defined as the dry-basis volume fraction of hydrogen in the oxygen-side outlet gas after gas–liquid separation and condensation-based water removal, with units uniformly expressed in ppm. The measurement point is located at the outlet of the oxygen-side gas–liquid separator, and HTO is measured after drying using an industrial-grade HT-FX100 transmitter, as shown in Figure 3.
Figure 3.
Experimental platform for the AEM electrolyzer hydrogen production system.
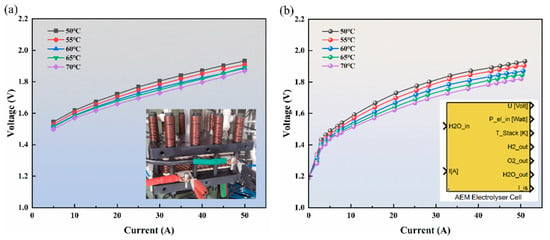
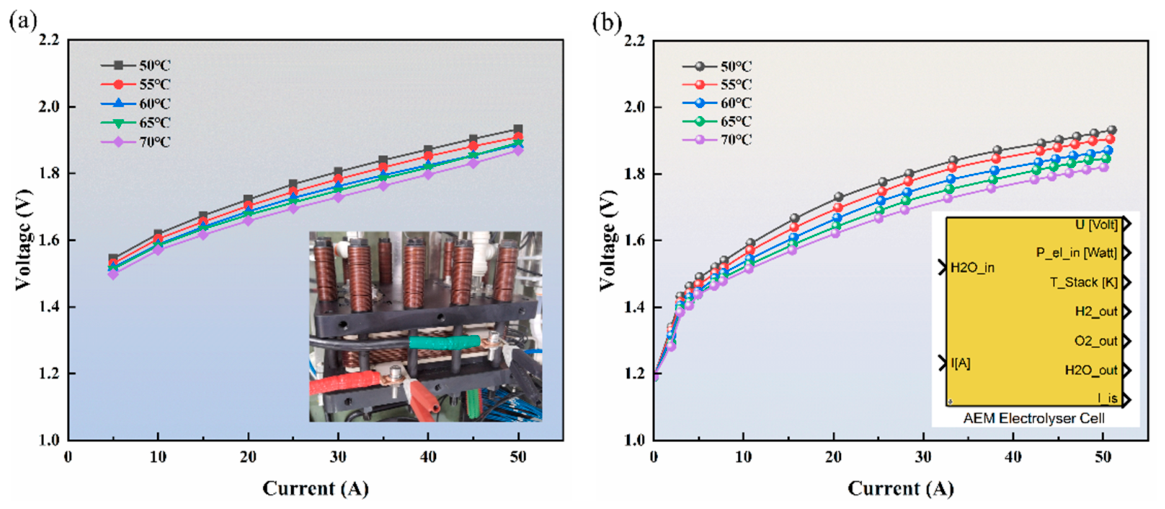
To validate the model under different operating temperatures, the simulated polarization curves were compared with the experimental measurements at 50 °C, 60 °C, and 70 °C, as shown in Figure 4. The simulated curves (solid lines) agree well with the experimental data (symbols) over the entire current density range. The maximum deviation is less than 50 mV, as listed in Table 4, indicating that the model can accurately reproduce the effect of temperature on the cell voltage.
Figure 4.
Comparison of simulated and experimental polarization curves at different temperatures. (a) Experimental results; (b) Simulation results.
Table 4.
Quantitative error metrics between model predictions and experimental data.
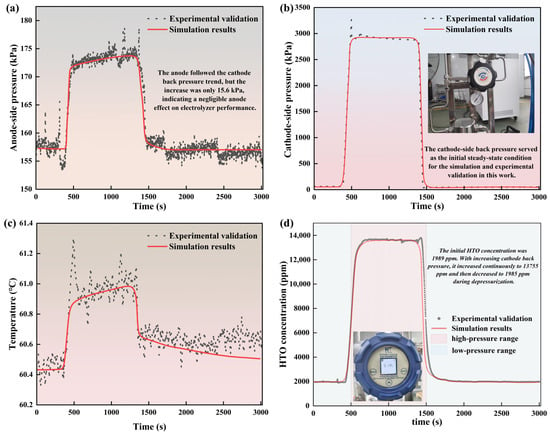
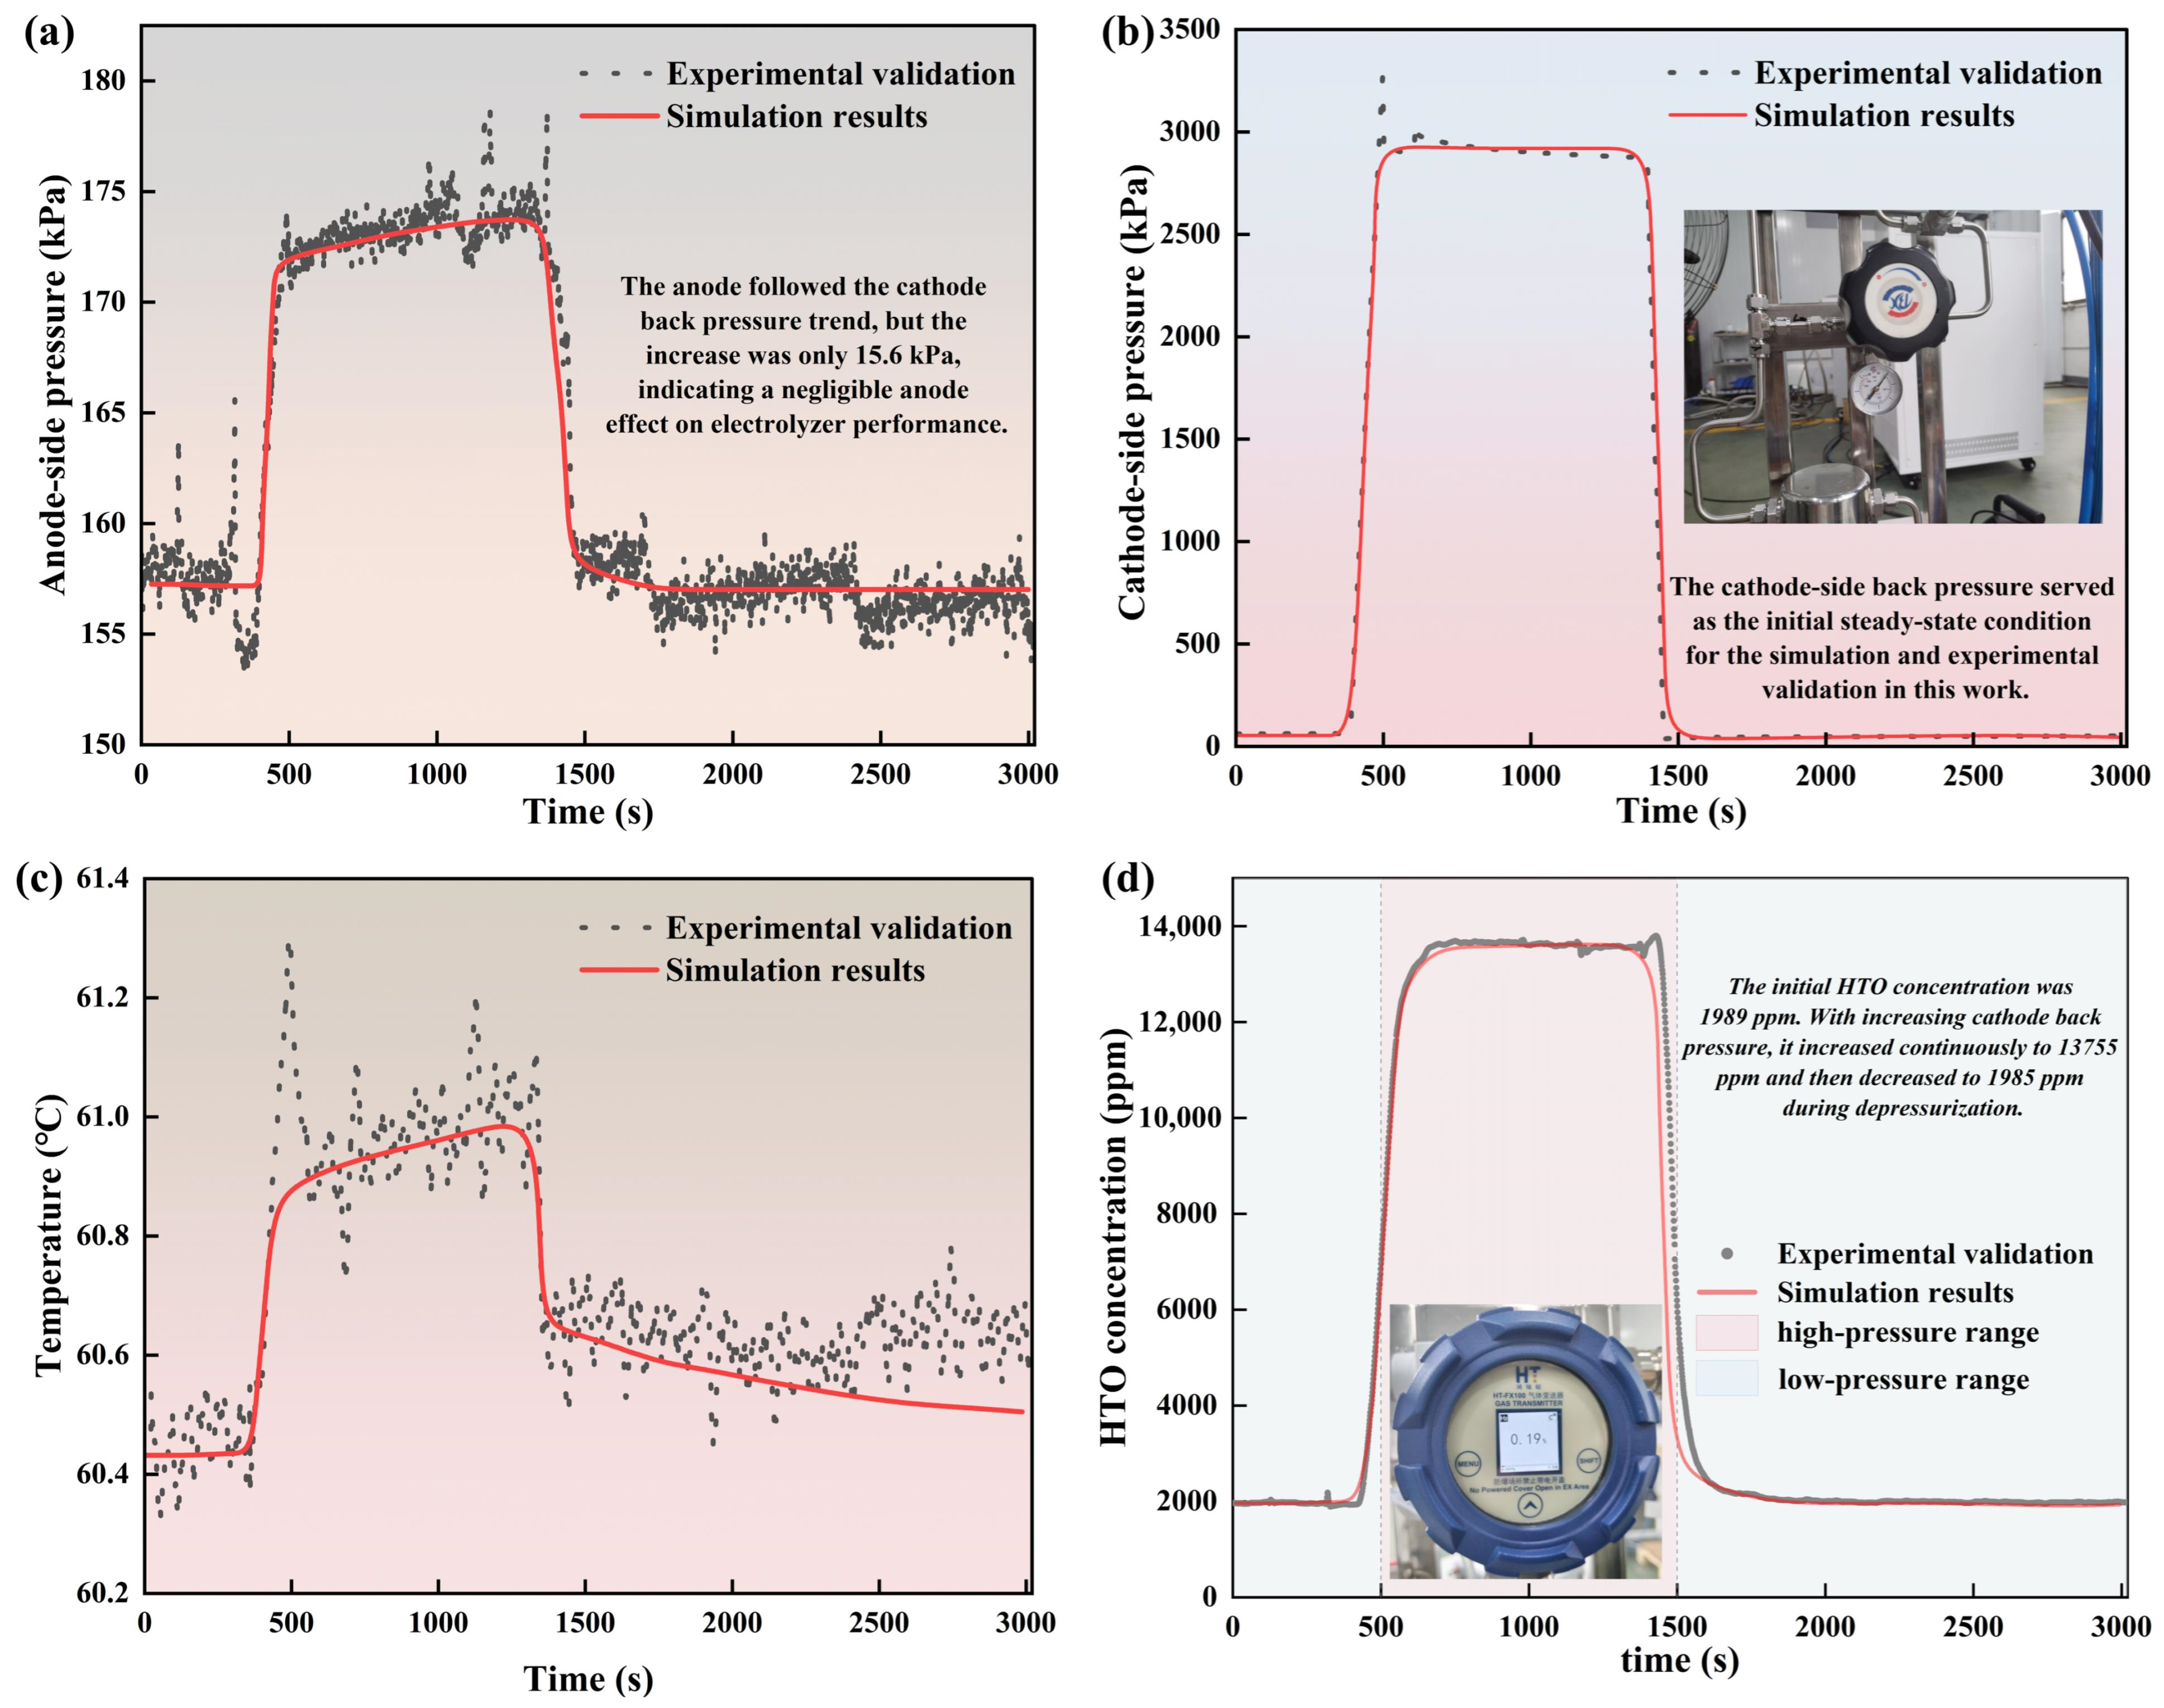
In addition to the polarization curves, the calibrated model was further validated against the experimental measurements of HTO concentration and anode–cathode pressures, as shown in Figure 5a,b,d. The simulated HTO concentrations agree well with the measured data over the investigated pressure range, with the maximum error and RMSE summarized in Table 4. Similarly, the model accurately reproduces the anode and cathode pressures, and the corresponding quantitative metrics are also listed in Table 4. Furthermore, the effect of cathode-side hydrogen back pressure on the AEM electrolyzer was analyzed under constant current, with the back pressure increasing from 65 kPa to 3 MPa (gauge pressure), as shown in Figure 5b,c. The model captures the variation trends of temperature and HTO concentration with back pressure, confirming its capability to predict system behavior under varying operating conditions. Overall, the good agreement between simulation and experiment for HTO, pressure, and back-pressure effects further confirms the reliability of the calibrated model.
Figure 5.
AEM electrolyzer calibration under cathode-side H2 back pressure (65 kPa–3 MPa, gauge): (a) anode pressure; (b) cathode pressure; (c) temperature; (d) HTO.
3.2. Wind–Solar Output Characteristics, Transient Impact Resistance, Hydrogen Production Safety, and Operational Stability
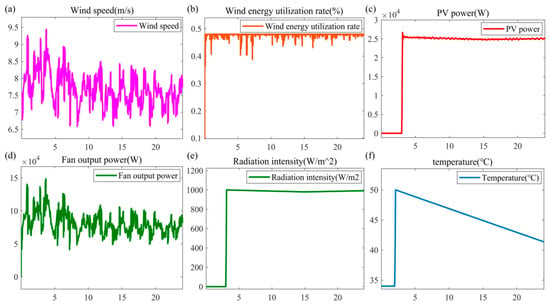
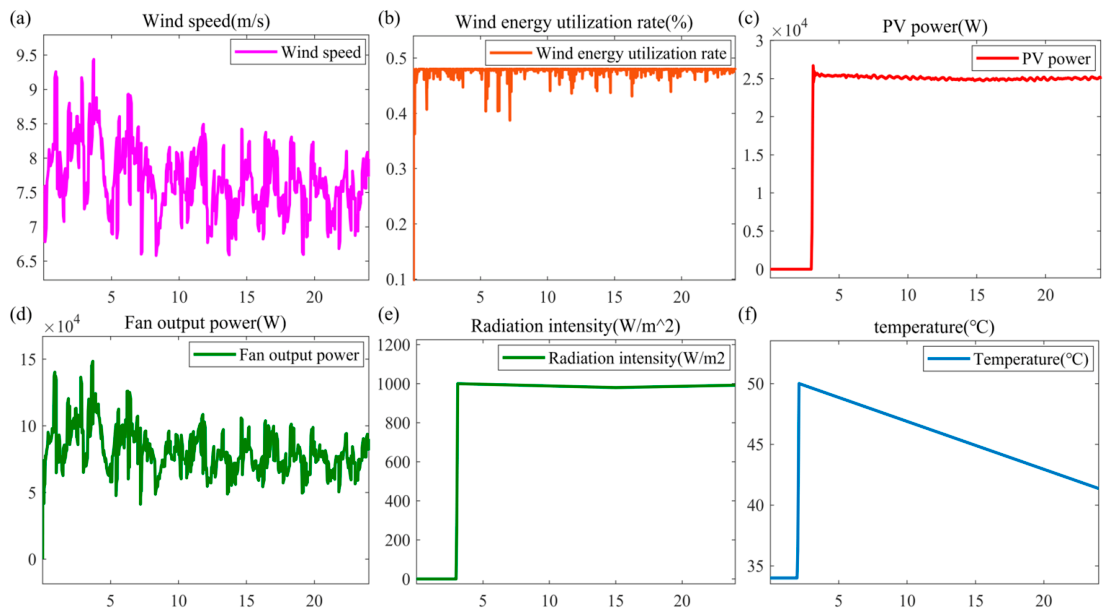
The mathematical model of the permanent magnet direct-drive wind power generation system is shown in Figure 1. Wind speed is simulated using Equation (4). The variation of the power coefficient Cp is presented in Figure 6. During operation, Cp fluctuates near its rated value with relatively small deviations, as shown in Figure 6b, indicating effective maximum power point tracking (MPPT). The output power curve of the wind turbine system is shown in Figure 6d, which closely follows the wind speed profile (Figure 6a), further confirming successful MPPT implementation.
Figure 6.
Meteorological parameters and output characteristics of the synthetic wind–solar power generation system: (a) wind speed; (b) wind energy utilization coefficient; (c) PV output power; (d) wind turbine output power; (e) irradiance; (f) temperature.
Overall, the output characteristics of the synthetic wind–solar power generation system exhibit significant randomness, and the wind turbine and PV output powers follow the variations in wind speed and irradiance, respectively. This meets the simulation requirements of off-grid hydrogen production systems regarding power fluctuation characteristics. Consequently, the three off-grid hydrogen production configurations—namely, single supercapacitor, flywheel–battery hybrid, and supercapacitor–battery hybrid—can be comparatively evaluated in subsequent AEM electrolyzer flexible hydrogen production simulations.
The three energy storage topologies were simulated under identical broadband, large-amplitude, and random wind–solar fluctuation conditions, driving the same 100 kW AEM electrolyzer hydrogen production system. The only variables that change are the topology structure and the resulting power allocation path. The battery and supercapacitor parameters used in the three topologies are completely identical: the load condition is the same 100 kW AEM electrolyzer hydrogen production system; the battery has a rated voltage of 400 V, a rated capacity of 200 Ah, an initial SOC of 50%, a response time of 2 s, and saturation/protection limits of Vmax = 435.52 V, SOCmin = 15%, and SOCmax = 95%; the supercapacitor has a rated capacitance of 99.5 F, an equivalent DC series resistance of 8.9 × 10⁻³ Ω, a rated voltage of 480 V, 18 series and 2 parallel units, an initial voltage of 380 V, an operating temperature of 25 °C, and saturation/protection limits of Vmax = 500 V and Vmin = 200 V; the simulation condition is large-amplitude, random fluctuations for all three topologies; Topologies 2 and 3 adopt exactly the same power allocation strategy, i.e., frequency decoupling based on a second-order low-pass filter, where the low-frequency component is allocated to the battery, and the high-frequency component is allocated to the flywheel (Topology 2) or the supercapacitor (Topology 3), as listed in Table 5, Table 6, Table 7, Table 8 and Table 9.
Table 5.
Comparison of key parameters and comparison basis for the three energy storage topologies.
Table 6.
Comparison of key battery parameters and comparison basis among the three energy storage topologies.
Table 7.
Comparison of key supercapacitor parameters and comparison basis among the three energy storage topologies.
Table 8.
Key parameters of the flywheel in the three energy storage topologies.
Table 9.
Control parameters and power allocation strategies of the three energy storage topologies.
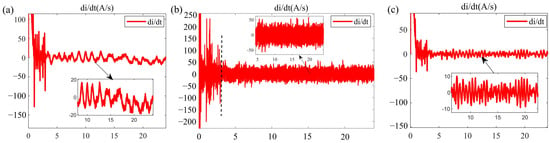
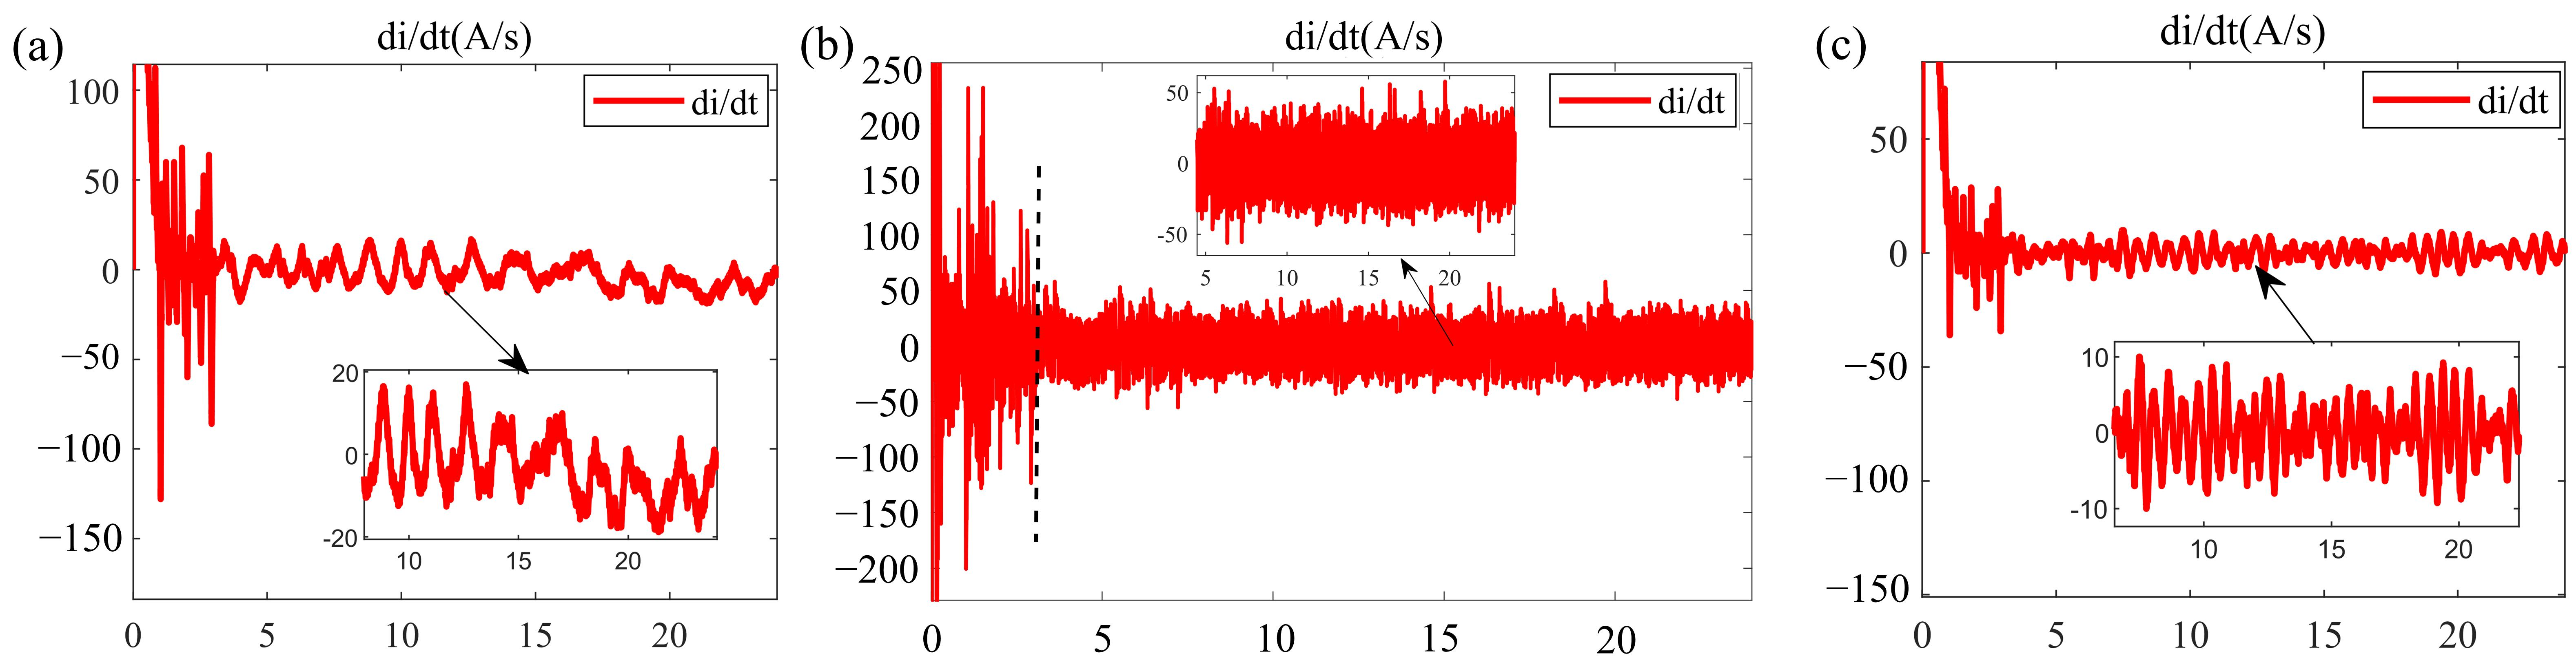
The current slew rate di/dt serves as a key metric for assessing the transient impact resistance, membrane electrode fatigue damage, and dynamic adaptability of the AEM electrolyzer, as shown in Figure 7. Severe wind–PV power fluctuations cause frequent current transients in the electrolyzer.
Figure 7.
AEM electrolyzer transient impact indicator (current slew rate di/dt): (a) single supercapacitor (SC); (b) flywheel–battery (FW–BAT); (c) supercapacitor–battery (SC–BAT).
Based on the simulated di/dt parameters of the three topologies, the transient impact suppression performance of different energy storage configurations on the electrolyzer is compared.
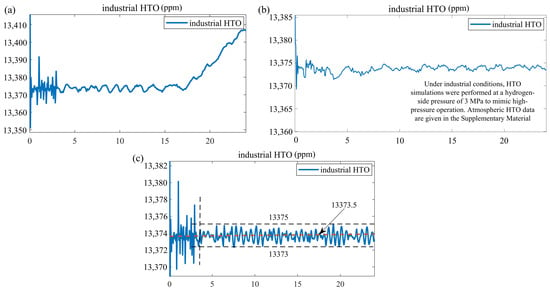
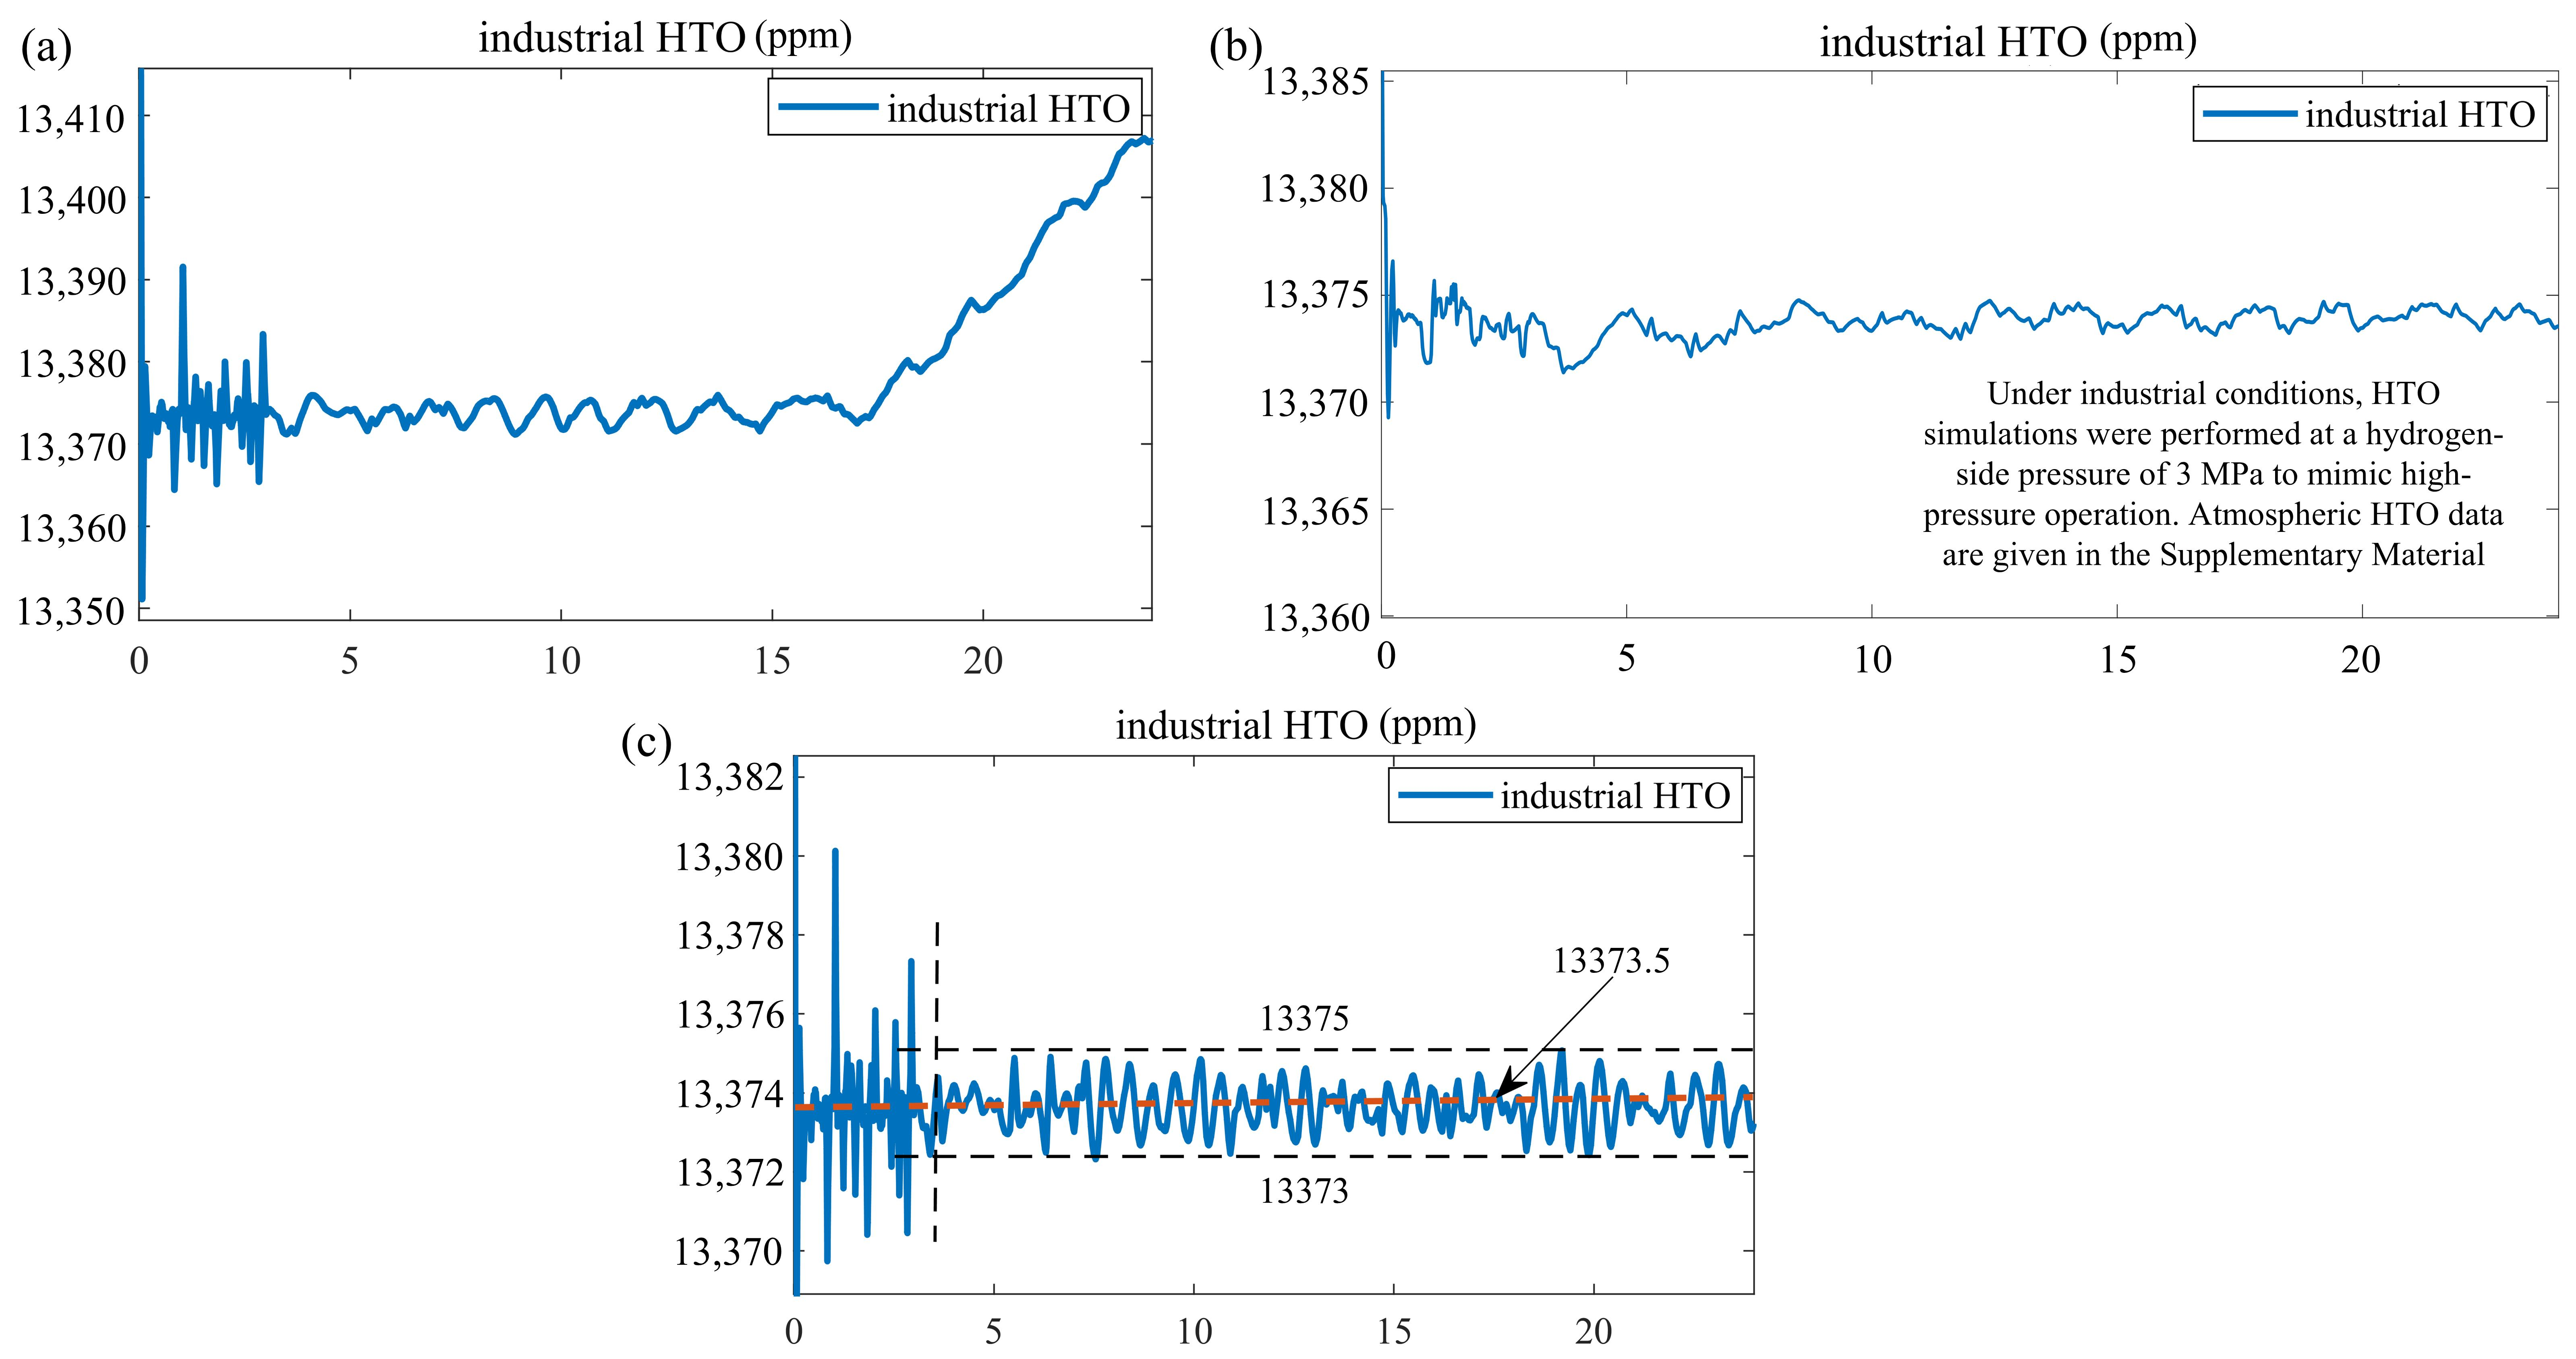
With the aid of HTO (hydrogen content in oxygen) data obtained from the thermodynamic simulation, as shown in Figure 8, the HTO concentration serves as a critical measured indicator for quantifying the extent of gas crossover and explosion risk from a safety perspective. More severe system fluctuations lead to higher transmembrane gas permeation flux, resulting in elevated peak and mean HTO concentrations, thereby reducing the operational safety margin of the hydrogen production system. Therefore, suppressing system dynamic fluctuations through appropriate energy storage topologies represents a key technical pathway for reducing HTO concentration and fundamentally eliminating gas-crossover safety hazards in off-grid flexible hydrogen production.
Figure 8.
HTO data of the AEM electrolyzer: (a) single supercapacitor (SC); (b) flywheel–battery (FW–BAT); (c) supercapacitor–battery (SC–BAT).
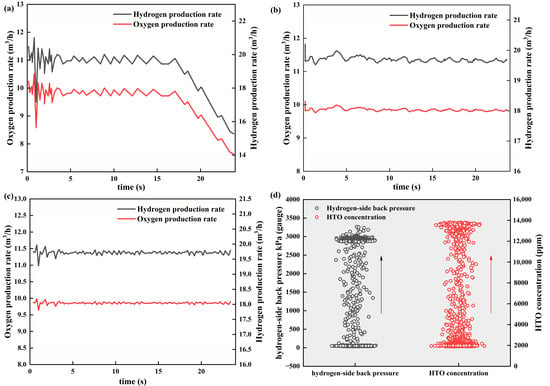
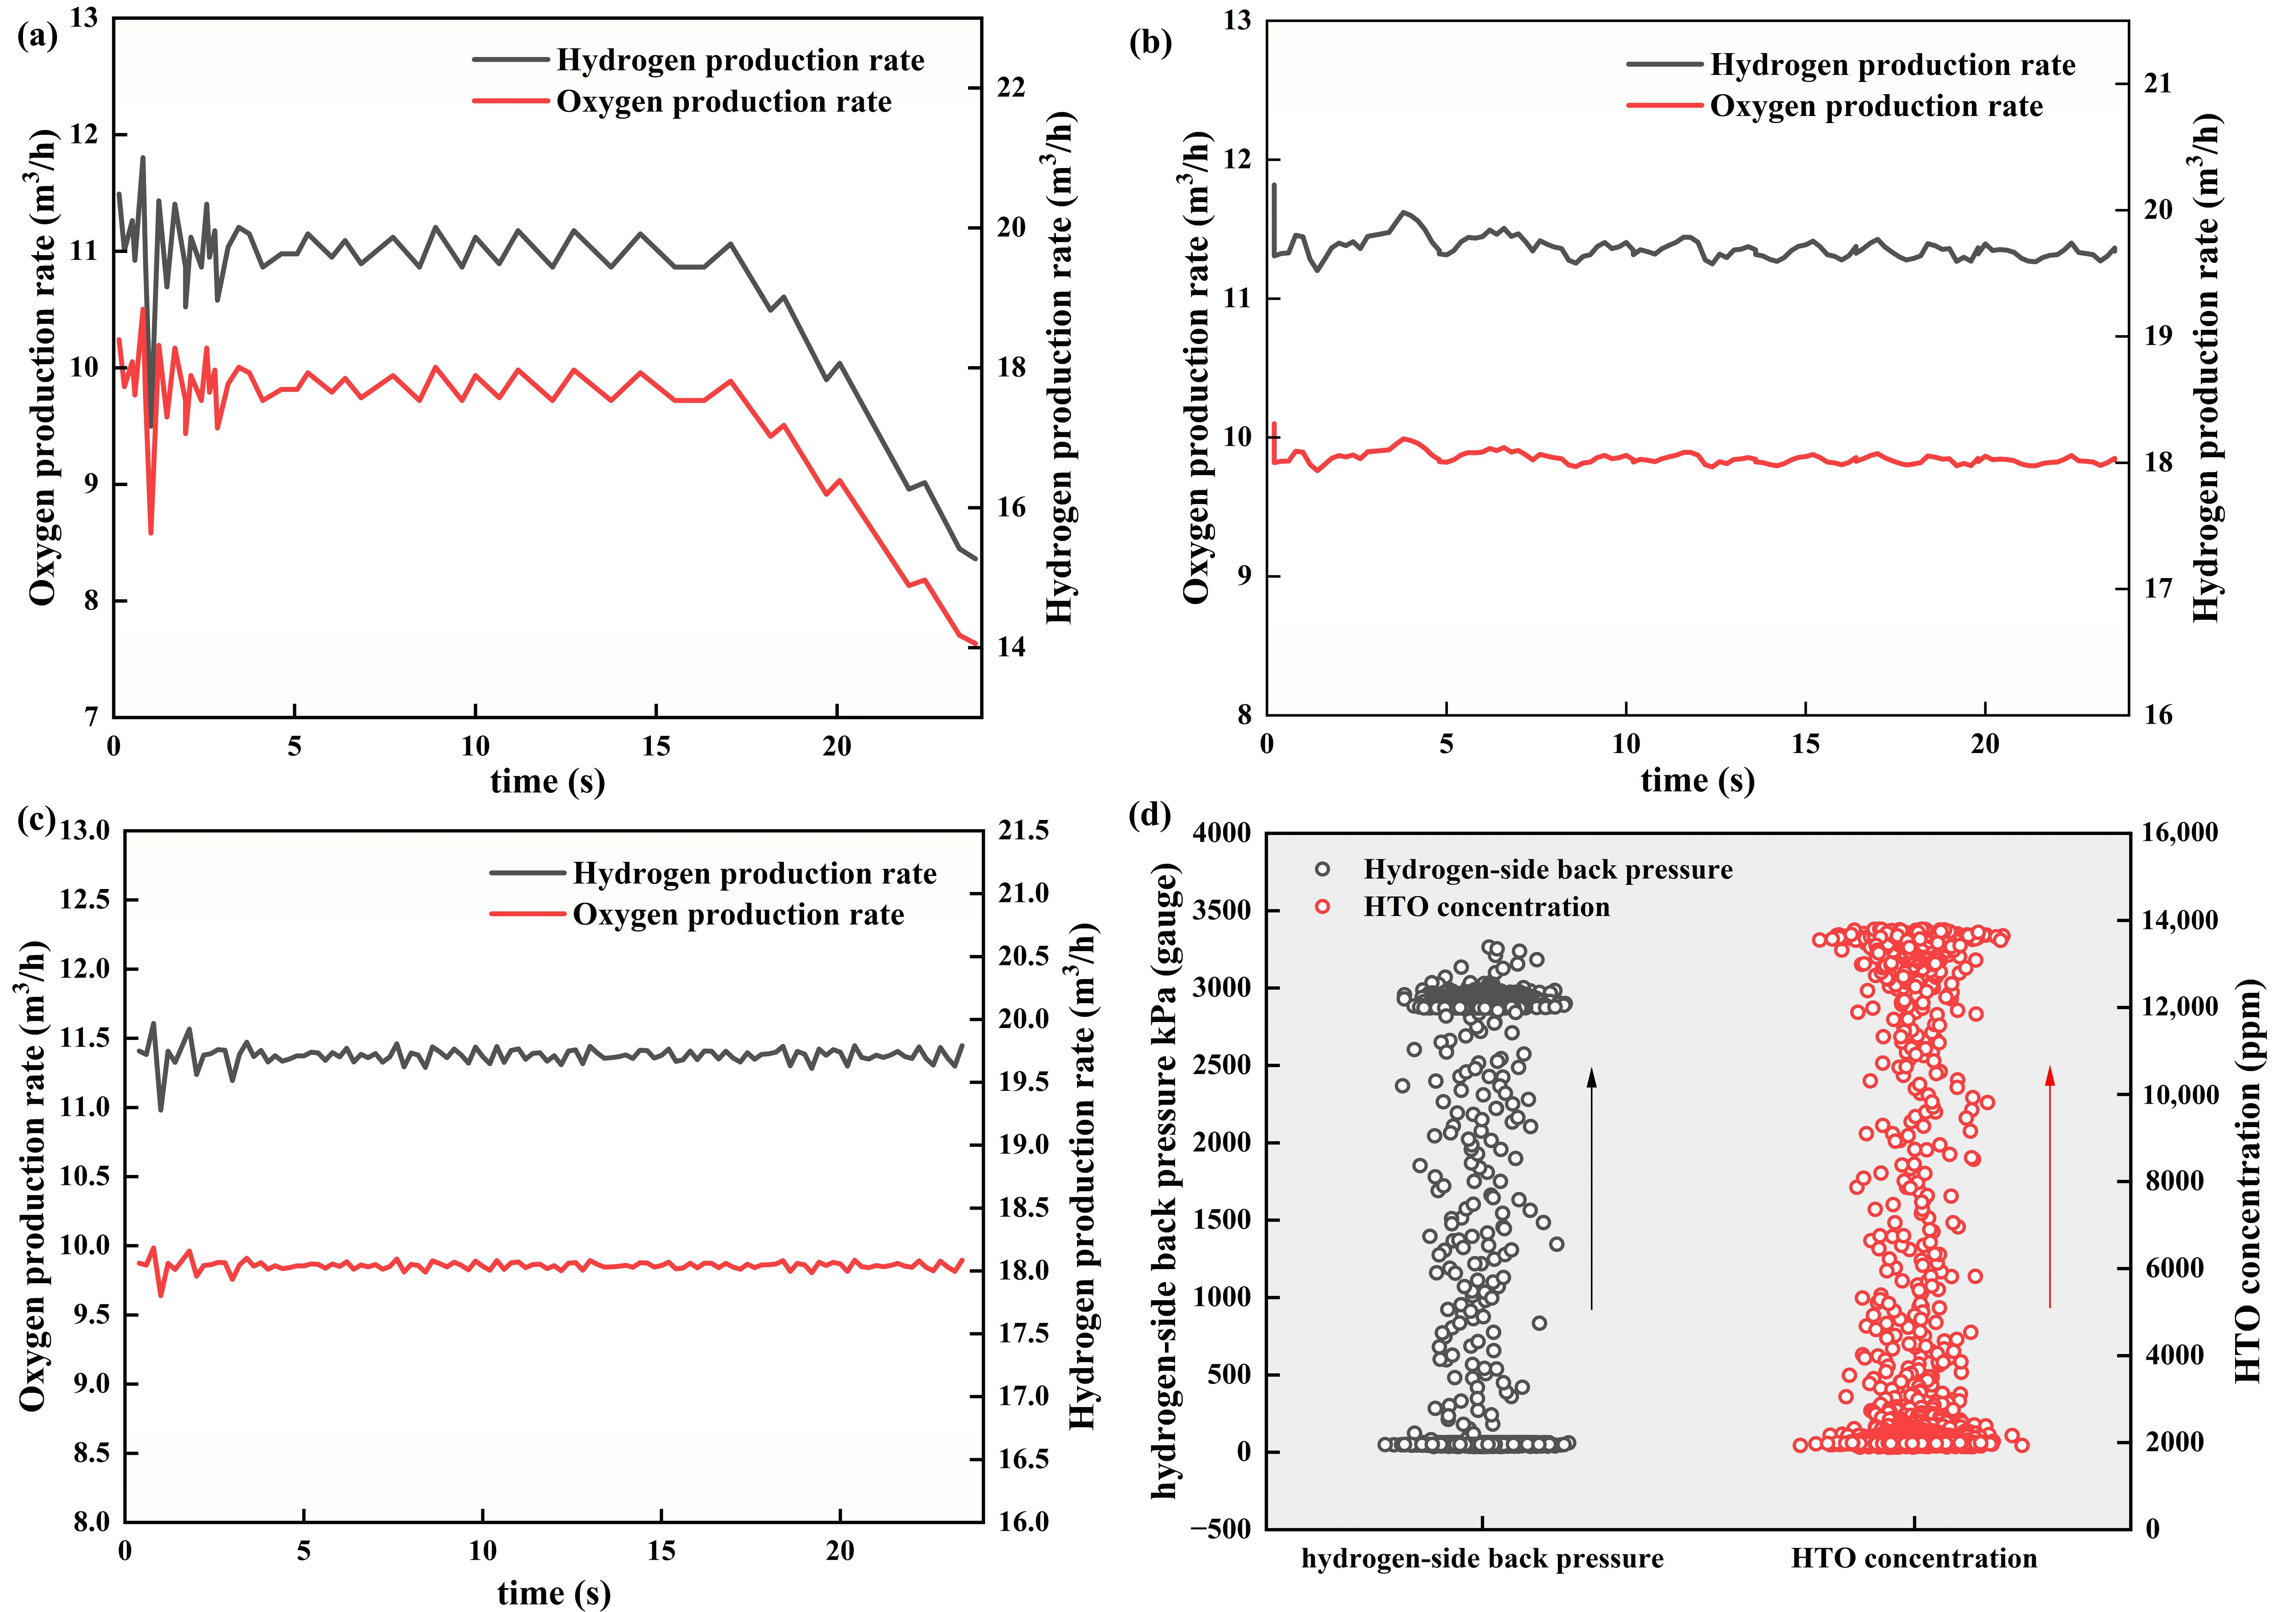
The mechanism of HTO increase can be divided into two stages. Stage 1: Pressure effect (65 kPa–3 MPa, constant current). At a gauge pressure of 65 kPa, the HTO at the oxygen-side outlet was 1900 ppm; when the hydrogen side was pressurized to 3 MPa, HTO increased to 13,375 ppm, corresponding to a 7.04-fold increase. This trend indicates that the high pressure difference not only increased the hydrogen partial pressure difference but also significantly enhanced pressure-driven convective permeation, while the oxygen production rate remained constant. HTO increased from 1900 ppm to 13,375 ppm (approximately 7-fold). According to Equations (60) and (61), the crossover flux increased proportionally by about 7-fold. This confirms that the pressure increasing directly led to an increase in permeation flux, independent of any decrease in oxygen production.
Stage 2: Topology effect (before and after the collapse of the single supercapacitor at 3 MPa). The oxygen production rate decreased from 9.8625 m3/h to 7.6575 m3/h, and HTO increased from approximately 13,375 ppm to approximately 13,408 ppm. The calculated crossover flux remained essentially unchanged (or changed from 1.297 × 10⁻³ to 1.386 × 10⁻³), indicating that the HTO increase mainly originated from the concentration effect caused by the reduced oxygen production, rather than a significant increase in permeation flux. The enhancement effect of the increased pressure difference on permeation was limited, as shown in Figure 9.
Figure 9.
(a–c) Hydrogen and oxygen production rates; (d) HTO concentration under hydrogen-side gauge pressures from 65 kPa to 3 MPa.
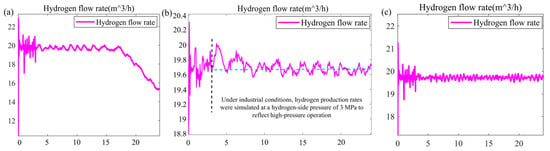
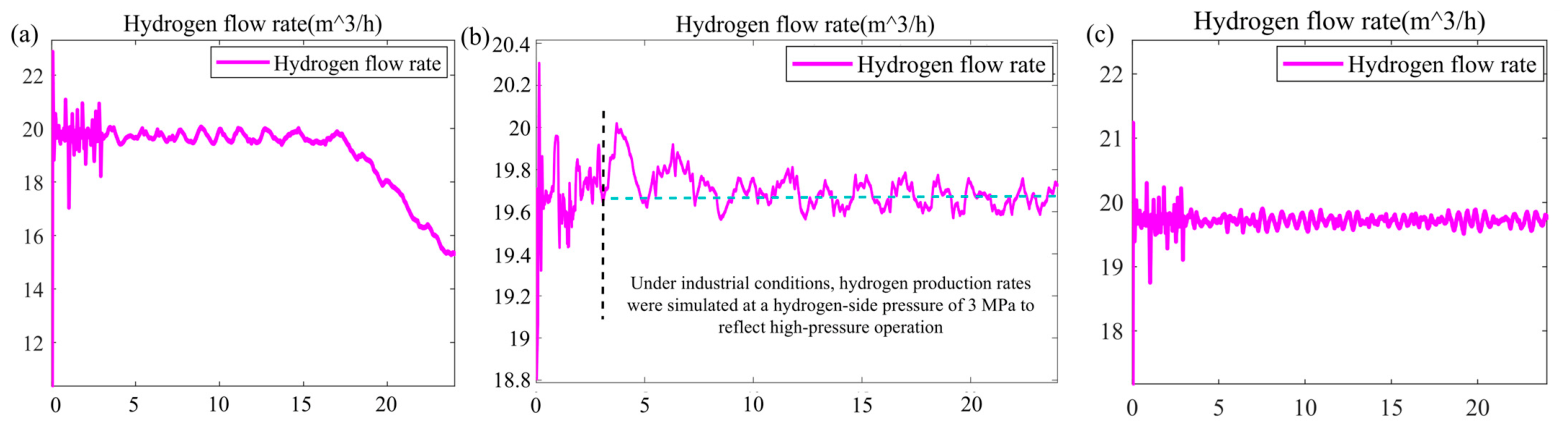
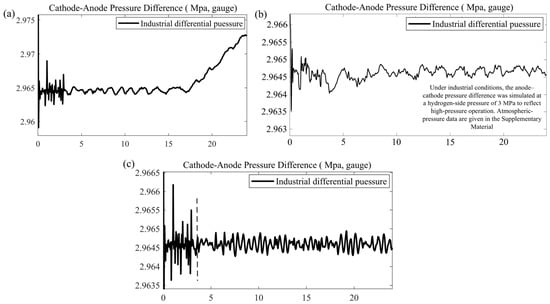
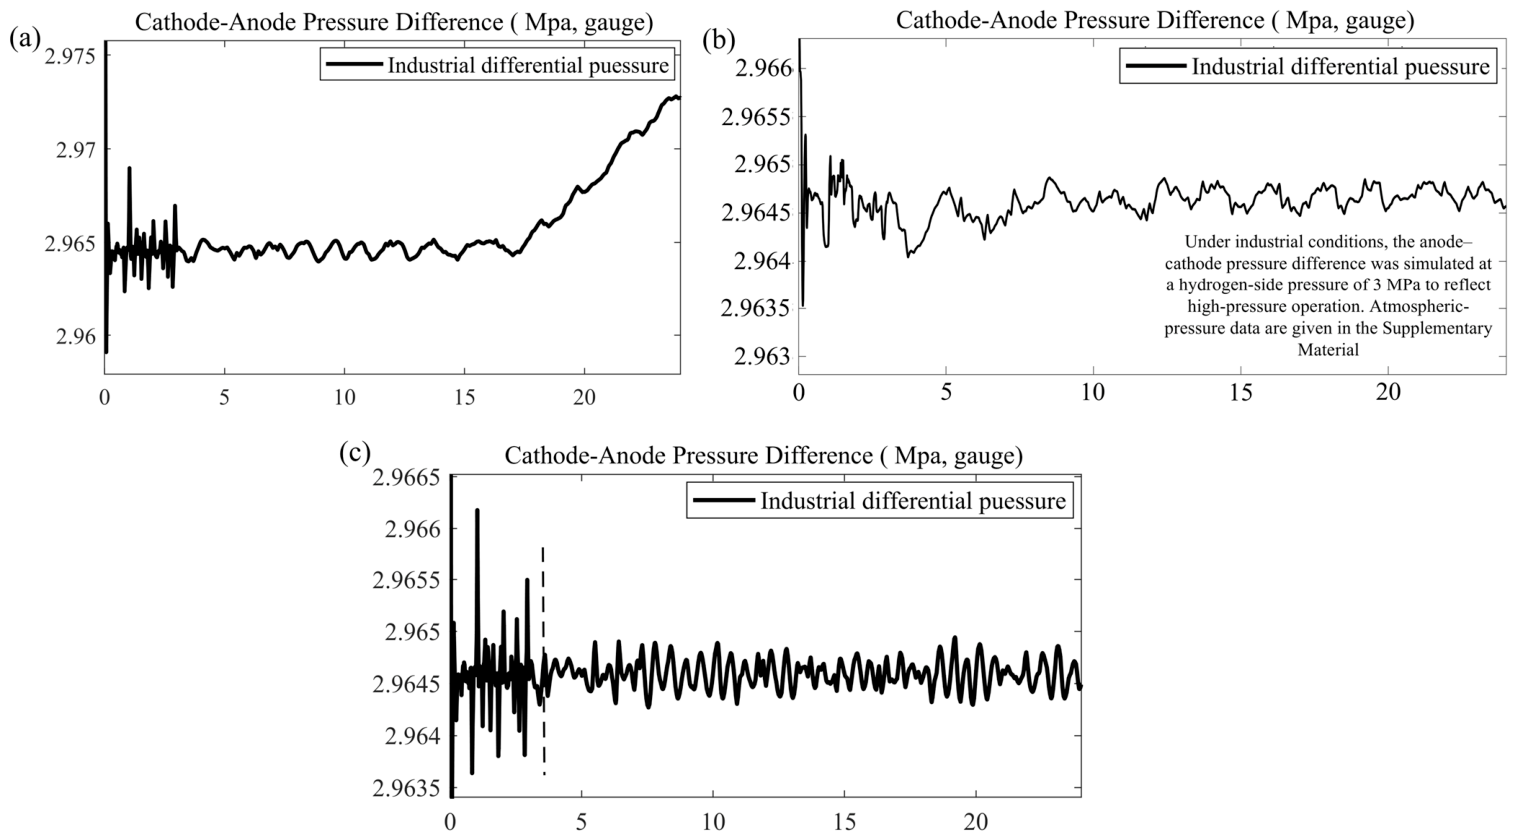
Based on simulated data of the AEM electrolyzer hydrogen production rate and anode–cathode pressure difference, combined with the thermodynamic model, this section investigates the influence mechanisms of different energy storage topologies on the production stability and gas-path operational reliability of the off-grid hydrogen production system, as shown in Figure 10 and Figure 11.
Figure 10.
AEM electrolyzer hydrogen production rate: (a) single supercapacitor (SC); (b) flywheel–battery (FW–BAT); (c) supercapacitor–battery (SC–BAT).
Figure 11.
Anode–cathode pressure difference of the industrial AEM electrolyzer: (a) single supercapacitor (SC); (b) flywheel–battery (FW–BAT); (c) supercapacitor–battery (SC–BAT).
As shown in Figure 10 and Figure 11, electrical disturbances induced by renewable power fluctuations are directly transmitted to the gas-path system of the electrolyzer, causing dynamic deviations in anode–cathode pressure and disrupting the gas production rate. This ultimately leads to oscillations in the overall hydrogen production rate and a decline in operational stability. Stable electrical input to the system can effectively balance the gas-path pressure and synchronize the electrochemical reaction progress, ensuring continuous and smooth hydrogen output—an essential condition for efficient and stable off-grid flexible hydrogen production. The differences in fluctuation suppression capability among energy storage topologies directly affect the gas-path pressure difference and gas production state, thereby leading to a hierarchical differentiation in hydrogen production capacity and operational stability.
3.3. Comparison of DC Bus Voltage Stability, Electrolyzer Transient Impact Performance, Hydrogen Production Safety, and Operational Stability
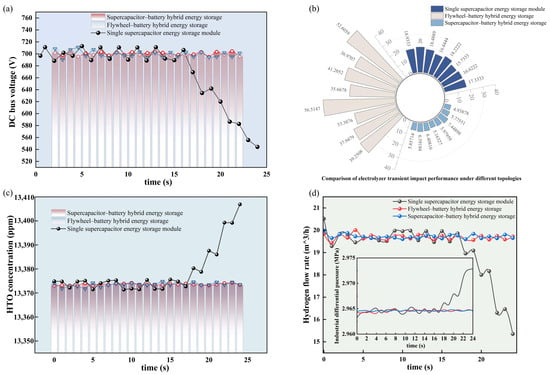
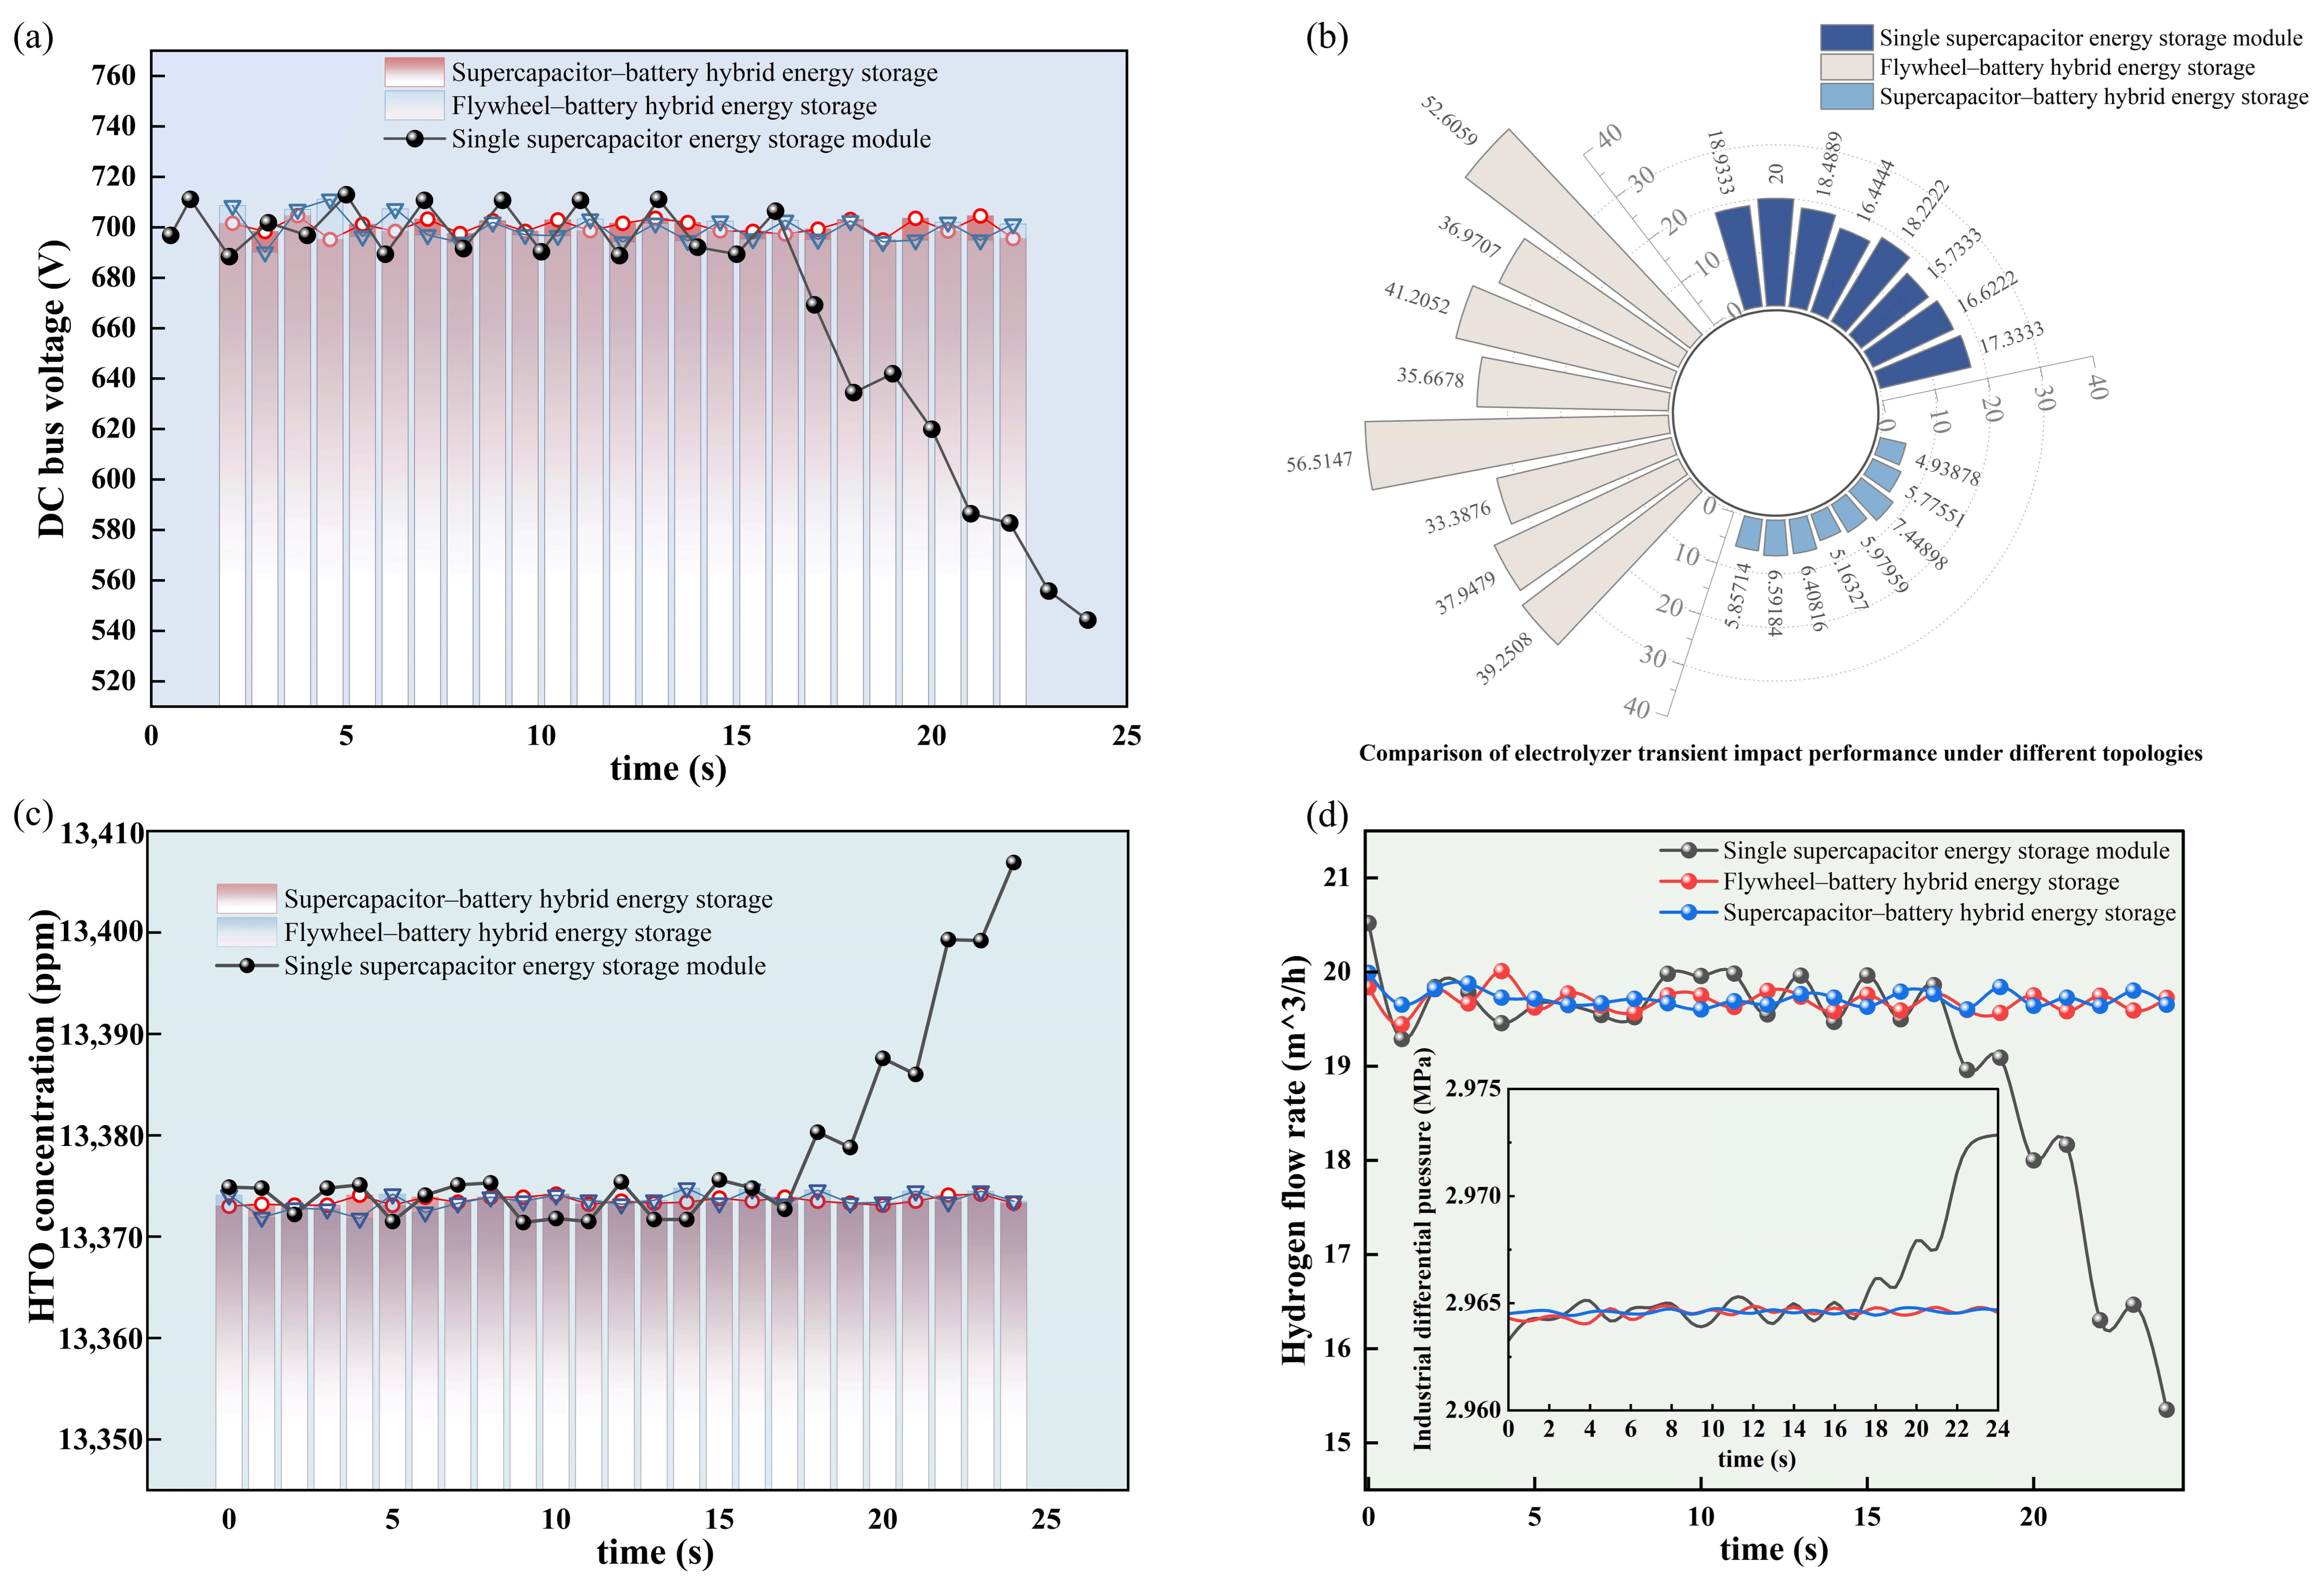
To quantitatively evaluate the regulation performance of the three hybrid energy storage topologies under wide-frequency wind–PV power disturbances, this section presents a multi-dimensional comparative analysis covering DC bus voltage dynamic stability (Figure 12a), electrolyzer current transient impact characteristics (Figure 12b), hydrogen production safety performance (Figure 12c), and operational stability (Figure 12d).
Figure 12.
Performance comparison of different energy storage technologies for off-grid hydrogen production: (a) DC bus voltage stability; (b) electrolyzer transient impact performance; (c) hydrogen production safety (HTO); (d) operational stability.
Under the single supercapacitor storage scheme, the DC bus voltage initially fluctuates between 690 and 710 V, but subsequently collapses severely to approximately 540–550 V after about 17 s, indicating a loss of voltage support rather than a moderate fluctuation. During power disturbances, the supercapacitor, limited by its energy capacity, fails to provide sustained power support and is unable to maintain stable DC bus voltage, exhibiting poor voltage support performance. However, in terms of the electrolyzer input current slew rate di/dt, this topology shows a certain suppression effect on current transients, with transient impact performance superior to that of the flywheel–battery hybrid scheme.
When the flywheel–battery hybrid storage topology is adopted, except for a short-term voltage peak of 710 V caused by the system startup transient, the DC bus voltage remains within the range of 695–705 V throughout the entire operation, with fluctuation amplitude significantly smaller than that of the single supercapacitor scheme. The battery provides energy support, ensuring sufficient voltage sustainability, and the dynamic stability of the bus voltage is notably improved. However, due to the power response characteristics of the flywheel and battery, the output current slew rates di/dt of this topology is relatively high, resulting in a greater transient current impact on the electrolyzer compared with the single supercapacitor scheme.
The supercapacitor–battery hybrid storage topology combines the dual advantages of fast power response from supercapacitors and energy storage from batteries. Under renewable power fluctuations, the DC bus voltage remains within 695–705 V for the majority of the time, achieving voltage regulation performance comparable to that of the flywheel–battery scheme. Meanwhile, the supercapacitor handles high-frequency power fluctuations, resulting in the lowest electrolyzer input current slew rate di/dt among the three topologies, effectively mitigating transient impacts caused by abrupt power changes.
For the single-supercapacitor configuration, the DC bus voltage underwent a severe collapse after approximately 17 s, with a time outside the permitted range of about 7 s and an RMSD of 59.411 V. In contrast, the two hybrid energy storage configurations maintained the bus voltage within 695–705 V, with zero time outside the permitted range and RMSD values of only 5.331 V and 2.909 V, respectively. In terms of HTO, the single-supercapacitor configuration exhibited a continuous upward trend in the later stage, with a maximum deviation of 33.361 ppm, whereas the two hybrid configurations kept HTO stable around 13,374 ppm, with RMSD values of only 0.795 ppm and 0.381 ppm, respectively. The flywheel–battery configuration showed the highest maximum di/dt of 56.515 A/s among the three topologies, while the supercapacitor–battery configuration achieved the lowest values for all four di/dt metrics. These results are consistent with the waveform trends in Figure 7, indicating that the supercapacitor–battery topology significantly suppresses the transient impact on the electrolyzer, as listed in Table 10, Table 11 and Table 12.
Table 10.
Quantitative comparison of DC bus voltage metrics for the three energy storage topologies.
Table 11.
Quantitative comparison of HTO metrics for the three energy storage topologies.
Table 12.
Quantitative comparison of di/dt metrics for the three energy storage topologies.
To further reveal the influence of the three storage topologies on the operational safety of the AEM electrolyzer, a comparative analysis of two key safety indicators—the anode–cathode pressure difference (Figure 11) and the hydrogen content in oxygen (HTO, Figure 12c)—is conducted under both atmospheric conditions and industrial high-pressure conditions with hydrogen-side pressure elevated to 3 MPa.
For the single supercapacitor energy storage scheme, in the later stage of wide-frequency wind–PV disturbances, the limited energy storage capacity leads to insufficient voltage support endurance, causing the system to remain in a power imbalance state for extended periods. Over time, both the anode–cathode pressure difference and the HTO concentration exhibit a continuous upward trend. In particular, under industrial high-pressure conditions with the hydrogen-side pressure elevated to 3 MPa, the HTO mass concentration gradually rises from the initial steady-state value of 13,375 ppm to 13,405 ppm. This sustained increasing trend indicates that power supply instability disrupts the gas–liquid dynamic equilibrium within the electrolyzer, causing the hydrogen–oxygen crossover risk to accumulate over time, which is detrimental to the long-term safe operation of high-pressure hydrogen production systems.
Both the flywheel–battery and supercapacitor–battery hybrid storage topologies, benefiting from the sufficient long-term energy supply capability of batteries, are able to maintain power supply–demand balance throughout the entire disturbance period. Under both atmospheric and 3 MPa hydrogen-side pressurization conditions, the anode–cathode pressure difference is stably maintained within the normal operating range, while the HTO concentration fluctuates slightly around 13,375 ppm without any sustained upward trend. In comparison, the supercapacitor–battery topology exhibits the lowest current slew rate di/dt, which further reduces transient thermodynamic disturbances within the electrolyzer and achieves the best dynamic pressure balance between the anode and cathode.
3.4. Overall Performance Ranking and Application Suitability of the Three Storage Topologies
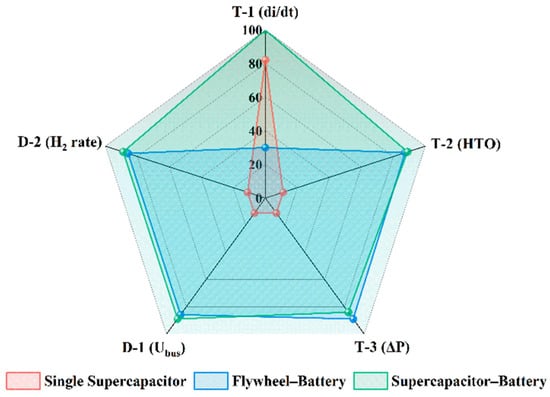
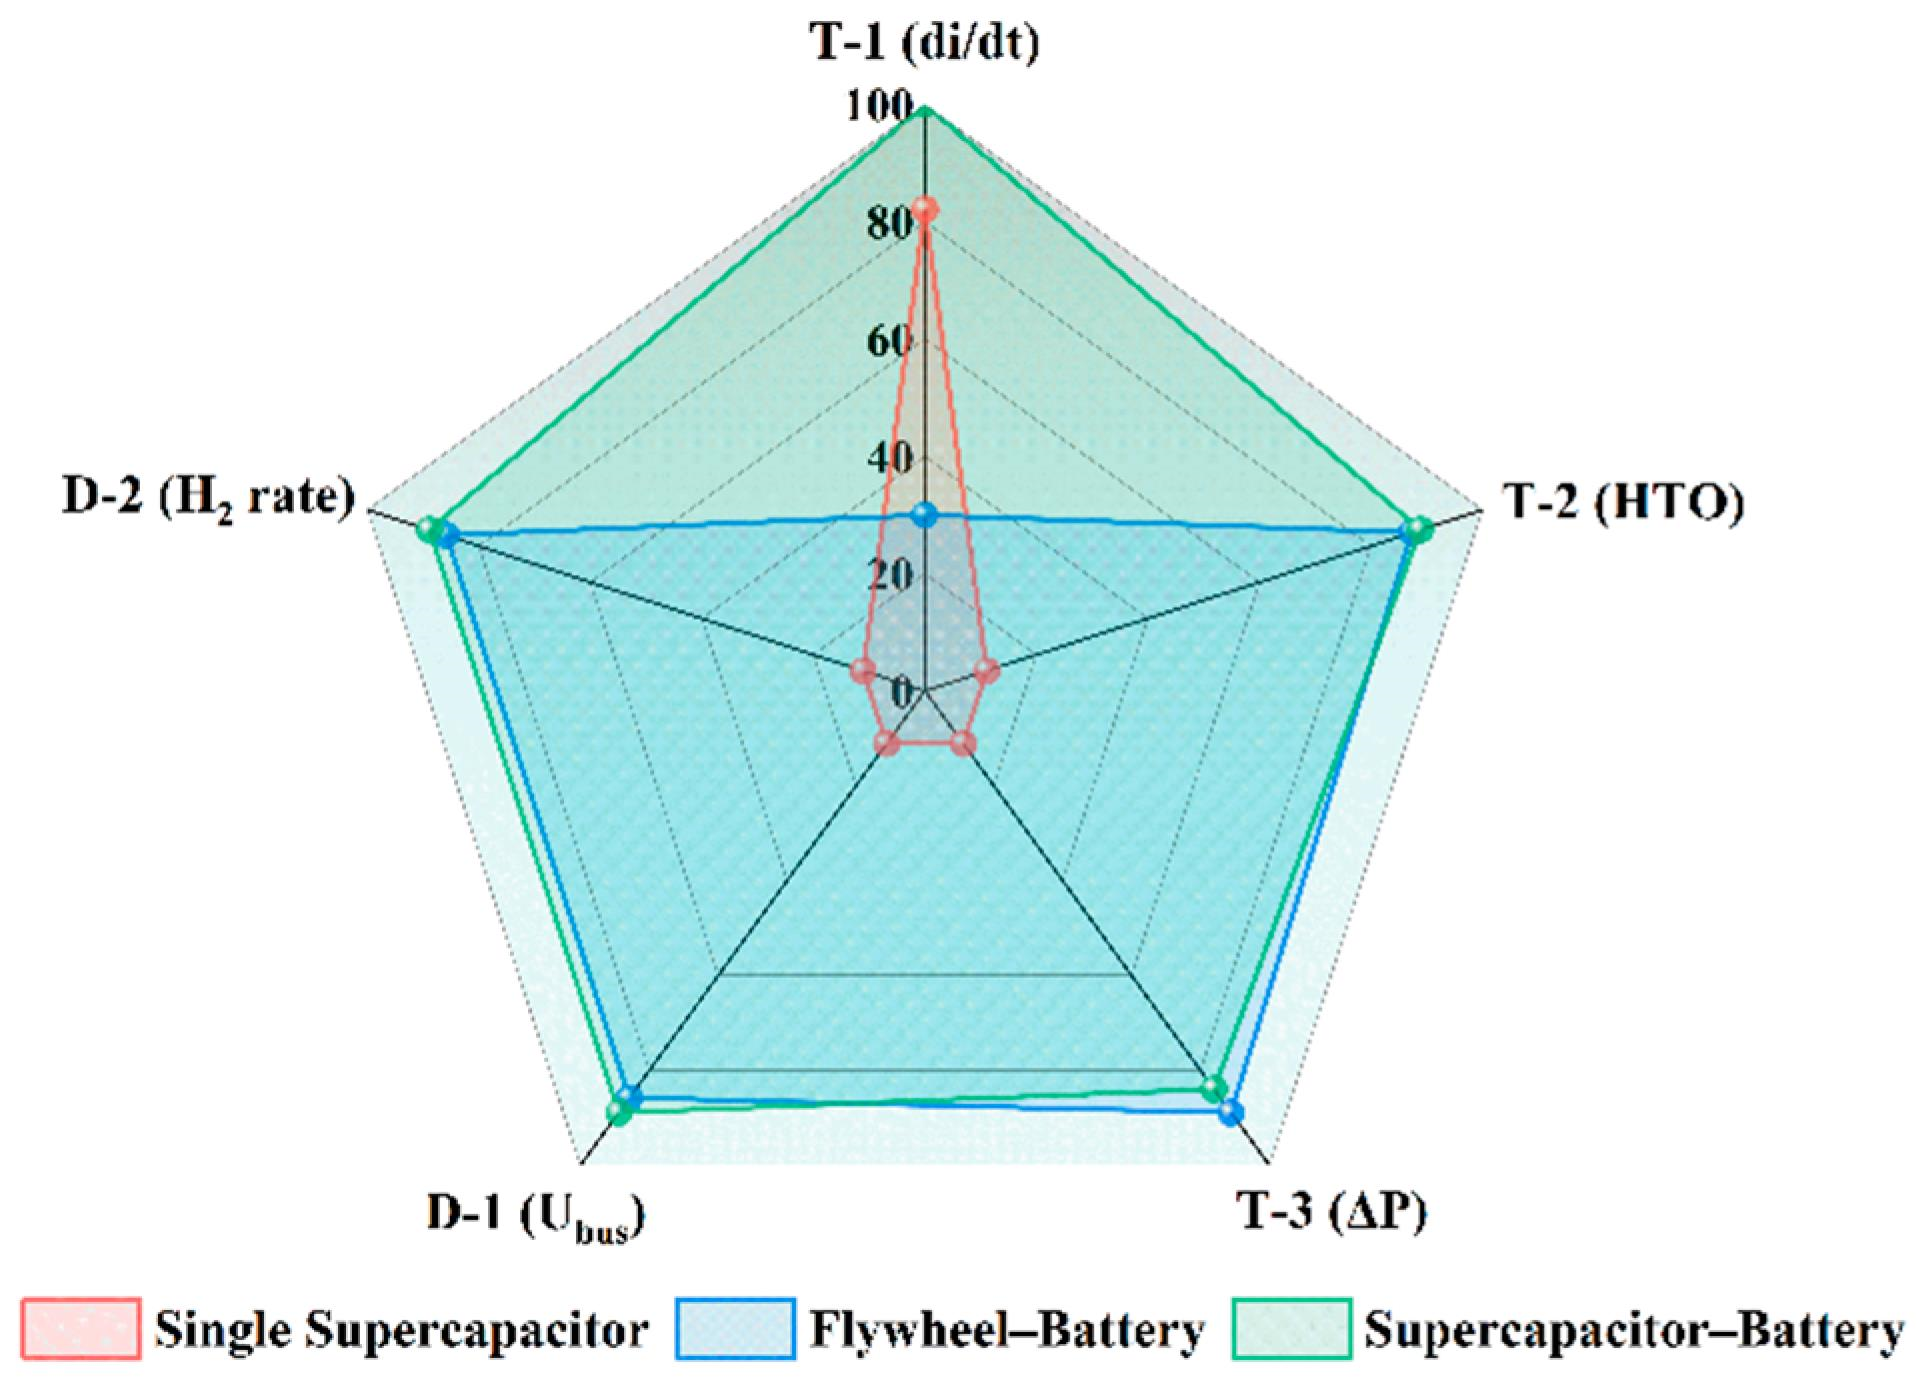
A comprehensive evaluation of the simulation results for the three energy storage topologies is conducted based on multiple assessment dimensions, including DC bus voltage dynamic stability, electrolyzer transient impact level, hydrogen production safety under high-pressure conditions, as shown in Figure 13.
Figure 13.
Comprehensive-performance radar comparison of three hybrid energy-storage topologies for off-grid hydrogen production system.
As shown in Table 13, the normalized scores and comprehensive scores of the three topologies are presented. For each indicator, the best performance is scored as 100 and the worst as 30. The comprehensive score is calculated using equal weighting and linear weighted summation. The supercapacitor–battery topology achieves the highest comprehensive score (99.12), followed by the flywheel–battery topology (84.64), while the single supercapacitor topology has the lowest score (40.42). This indicates that, under the studied conditions, the supercapacitor–battery topology exhibits the best overall transient dynamic performance.
Table 13.
Evaluation indicator parameters.
The single supercapacitor storage topology offers the advantages of fast response and good suppression of transient current impacts on the electrolyzer. However, it is constrained by limited energy capacity and fails to maintain DC bus voltage stability under prolonged wind–PV fluctuating conditions. Under industrial high-pressure hydrogen production at 3 MPa on the hydrogen side, power imbalance in the later stage leads to a continuous rise in both the anode–cathode pressure difference and the HTO concentration, with the hydrogen–oxygen crossover risk accumulating over time, resulting in poor long-term operational safety. Therefore, this topology is more suitable for short-term, high-frequency power smoothing applications and is not recommended for long-duration off-grid wind–PV hydrogen production scenarios.
The flywheel–battery hybrid storage topology exhibits good DC bus voltage control performance. Over the entire operating range, both the HTO concentration and the anode–cathode pressure difference remain stable, ensuring safe and reliable high-pressure hydrogen production. However, its suppression of transient current impacts on the electrolyzer is limited, with the di/dt performance inferior to that of supercapacitor-based schemes. Frequent and large current transients may accelerate membrane electrode aging in the AEM electrolyzer. This topology is therefore suitable for off-grid hydrogen production scenarios characterized by relatively moderate rates of wind–PV power variation.
The supercapacitor–battery hybrid storage topology integrates the high-frequency fast power regulation capability of supercapacitors with the long-term energy supply advantage of batteries. It achieves the best performance in terms of DC bus voltage fluctuation range, energy endurance, and hydrogen production safety under high-pressure conditions, while exhibiting the lowest current slew rate di/dt among the three schemes, thereby minimizing the impact of transient shocks on electrolyzer lifetime. This topology is well-suited for off-grid flexible hydrogen production under wide-band and large-amplitude, wind–PV fluctuations, and is identified as the optimal hybrid energy storage scheme under the conditions of this study, as summarized in Table 14.
Table 14.
Comprehensive comparison of performance metrics for different energy storage topologies.
In contrast to previous studies that mainly focused on ALK/PEM electrolyzers or single energy storage topologies under atmospheric to moderate pressures, this work compares three energy storage topologies for a 100 kW off-grid AEM hydrogen production system at 65 kPa–3 MPa (gauge pressure), and further reveals the HTO dynamic mechanism under high-pressure transient conditions, as summarized in Table 15.
Table 15.
Comparison of this work with representative studies in related fields.
4. Conclusions and Future Work
To address the issues of transient impacts on the AEM electrolyzer system and operational safety risks under high-pressure conditions caused by renewable power fluctuations in off-grid wind–PV hydrogen production systems, this paper establishes a system-level simulation model of the AEM electrolyzer hydrogen production system based on thermodynamic modeling. A comparative analysis is conducted on the regulation performance of three energy storage topologies—single supercapacitor, flywheel–battery, and supercapacitor–battery. The main contributions of this work are as follows:
(a) A system-level simulation model of the AEM electrolyzer hydrogen production system is established based on thermodynamic parameters.
(b) In terms of DC bus voltage stability and transient suppression: the single supercapacitor scheme, limited by its energy capacity, exhibits a voltage fluctuation range of 690–710 V and struggles to maintain voltage stability in the later stage. Both the flywheel–battery and supercapacitor–battery schemes maintain the DC bus voltage within 695–705 V stable performance. Among them, the supercapacitor–battery topology achieves the lowest di/dt and provides the best suppression of transient impacts on the electrolyzer.
(c) Regarding hydrogen production safety under 3 MPa hydrogen-side pressure: the single supercapacitor scheme exhibits continuous increases in both anode–cathode pressure difference and HTO concentration due to later-stage power imbalance, leading to an elevated risk of hydrogen–oxygen crossover. In contrast, both hybrid storage schemes maintain HTO concentration with slight fluctuations around 13,375 ppm, demonstrating superior safety under high-pressure operation.
(d) Based on comprehensive evaluation of bus voltage stability, transient impact suppression, hydrogen production safety, and transient operational performance under the specific component sizes, controller settings, initial conditions, and short-duration synthetic disturbances used in this study, the overall ranking of the three topologies is: supercapacitor–battery > flywheel–battery > single supercapacitor. Under these specific conditions, the supercapacitor–battery configuration produced smaller simulated current-slew rates and bus-voltage deviations.
Future work may focus on designing adaptive frequency-sharing allocation strategies for energy storage based on the spectral characteristics of wind and solar power output; introducing measured wind–solar datasets for robustness validation under multiple operating conditions; and further conducting electrolyzer degradation and system economic assessments on the basis of the thermodynamic model, so as to provide more comprehensive theoretical support for storage configuration selection in off-grid flexible hydrogen production systems. Meanwhile, the comparison between simulated and experimental hydrogen production rates under dynamic conditions will be conducted in future work. Future work will also carry out further parametric analysis and comparison regarding energy storage capacity sizing, controller bandwidth, initial SOC, renewable power fluctuation timescale, system economic cost, and electrolyzer type, so as to investigate the effects of these parameters on topology ranking.
Supplementary Materials
The following supporting information can be downloaded at https://www.mdpi.com/article/10.3390/en19215069/s1: Figure S1: AEM electrolyzer modeling; Figure S2: Intercooler modeling; Figure S3: Valve modeling; Figure S4: Mixer modeling; Figure S5: Pump modeling; Figure S6: Compressor Modeling; Figure S7: Transient response curves of anode–cathode pressure difference and safety parameter (HTO) of the electrolyzer under power disturbances with different hybrid storage topologies; Figure S8: Dynamic response curves of electrolyzer electrical parameters under power disturbances for different hybrid storage topologies; Figure S9: PWM rectifier with dual closed-loop control; Figure S10: Overall simulation diagram of the AEM electrolyzer.
Author Contributions
Conceptualization, H.D., X.F. and J.P.; Methodology, H.D., X.F. and J.P.; Software, H.D., Z.C., X.Z. and J.P.; Validation, H.D., X.Z. and J.P.; Formal analysis, H.D. and J.P.; Investigation, H.D., Z.C., X.F., X.Z. and J.P.; Resources, X.F., X.Z. and J.P.; Data curation, H.D. and J.P.; Writing—original draft, H.D.; Writing—review and editing, Z.C., X.F., X.Z. and J.P.; Visualization, H.D., X.Z. and J.P.; Supervision, Z.C., X.F., X.Z. and J.P.; Project administration, X.Z. and J.P.; Funding acquisition, Z.C., X.Z. and J.P. All authors have read and agreed to the published version of the manuscript.
Funding
The authors received financial supports from Open funding of Hubei Engineering Research Center for Safety Monitoring of New Energy and Power Grid Equipment for this study and Doctoral research funding of Hubei University of Technology (XJ2024008201) for this study.
Data Availability Statement
The original contributions presented in this study are included in the article/Supplementary Material. Further inquiries can be directed to the corresponding author.
Conflicts of Interest
Author Zhongyan Chen was employed by the company Shandong Fuel Cell Power In Technology Co., Ltd. (FCPI). The remaining authors declare that the research was conducted in the absence of any commercial or financial relationships that could be construed as a potential conflict of interest.
Nomenclature
| Vw | Resultant wind speed [m/s] | m | Total mass flow [g/s] |
| VB | Basic wind speed component [m/s] | U | Total internal energy [J] |
| VG | Gust wind speed component [m/s] | H | Total Enthalpy flow [J/s] |
| VR | Ramp wind speed component [m/s] | Q | Heat Flow [W] |
| VN | Random wind speed component [m/s] | S | Total entropy [J/K] |
| t | Time [s] | G | Total Gibb’s function [J] |
| Gmax | Maximum gust amplitude [m/s] | p | Pressure [Pa] |
| T1G | Gust start time [s] | h | Specific enthalpy [J/kg] |
| TG | Gust period [s] | Z | Compressibility factor [-] |
| AR | Maximum ramp amplitude [m/s] | ρ | Density [g/m3] |
| TSR | Ramp start time [s] | Pm | Mechanical or Electrical Power [W] |
| TER | Ramp end time [s] | ni | Amount of substance of species i [mol] |
| Sv (ωi) | Power Spectral Density [m2/Hz] | Ψi | Mole fraction of the species i [-] |
| KN | Surface roughness coefficient [-] | R | Universal gas constant [J/(mol·K)] |
| Fr | Disturbance range [m] | ε | Effectiveness [-] |
| μ | Mean wind speed at relative height [m/s] | η | Efficiency [-] |
| ωi | Angular frequency of the i-th random component [rad/s] | cp | Specific heat capacity [J/(g·K)] |
| Δω | Frequency step size [rad/s] | k | Pressure Loss Factor [Pa/(g/s)2] |
| ϕi | Random phase angle [rad] | w | Acentric factor [-] |
| in/out | Incoming/Outgoing [-] | min/max | Minimal/Maximal [-] |
| ig | Ideal gas [-] | sat | Saturated [-] |
| f/g(gas)/fg | Liquid phase (Formation)/Gas phase/Evaporation [-] | env | Environment [-] |
| TM | Thermal mass [-] | F | Faraday constant [C/mol] |
| pos | Valve Position [-] | Cath/an | Cathode/Anode |
References
- Song, Y.C.; Yan, W.; Li, Y.F.; Su, P.B.; Cheng, H.; Zhang, G.Q.; Zhu, Z.F.; Lv, Y.Y. Integrated Offshore Oil and Gas–Renewable Energy Systems for China’s Low-Carbon Transition: Coupling Pathways and Integration Challenges. Energies 2026, 19, 4201. [Google Scholar] [CrossRef] [Scilit]
- Shen, D.; Dong, Y.; Lei, Z.; Yang, F.; Cheng, L.; Jing, J. Fault diagnosis of cells in PEM electrolyzer stack under fluctuating power source. Int. J. Hydrogen Energy 2025, 97, 350–361. [Google Scholar] [CrossRef] [Scilit]
- Nnabuife, S.G.; Hamzat, A.K.; Whidborne, J.; Kuang, B.; Jenkins, K.W. Integration of renewable energy sources in tandem with electrolysis: A technology review for green hydrogen production. Int. J. Hydrogen Energy 2025, 107, 218–240. [Google Scholar] [CrossRef] [Scilit]
- Maoulida, F.; Guilbert, D.; Camara, M.B.; Dakyo, B. Dynamic electrical degradation of PEM electrolyzers under renewable energy intermittency: Mechanisms, diagnostics, and mitigation strategies—A comprehensive review. Renew. Sustain. Energy Rev. 2026, 225, 116170. [Google Scholar] [CrossRef] [Scilit]
- Alharthi, Y.Z. An Analysis of Hybrid Renewable Energy-Based Hydrogen Production and Power Supply for Off-Grid Systems. Processes 2024, 12, 1201. [Google Scholar] [CrossRef] [Scilit]
- Cao, T.T.; Ye, Z.Y.; Wu, Q.; Wan, X.R.; Wang, J.Y.; Li, D.Y. A Review of Adaptive Control Methods for Grid-Connected PV Inverters in Complex Distribution Systems. Energies 2025, 18, 473. [Google Scholar] [CrossRef] [Scilit]
- Arsad, A.Z.; Hannan, M.A.; Al-Shetwi, A.Q.; Mansur, M.; Muttaqi, K.M.; Dong, Z.Y.; Blaabjerg, F. Hydrogen energy storage integrated hybrid renewable energy systems: A review analysis for future research directions. Int. J. Hydrogen Energy 2022, 47, 17285–17312. [Google Scholar] [CrossRef] [Scilit]
- Hu, Z.H.; Huo, H.B.; Li, D.J.; Song, G.Q.; Xu, J.X. Composite control of a hydrogen production system coupling the wind-solar power generation with PEM electrolyzer. Int. J. Hydrogen Energy 2026, 226, 154437. [Google Scholar] [CrossRef] [Scilit]
- Folgado, F.J.; González, I.; Calderón, A.J. PEM Electrolyzer Digital Replica based on internal resistance determination applied to hydrogen energy storage. J. Energy Storage 2024, 75, 109694. [Google Scholar] [CrossRef] [Scilit]
- Deng, W.; Pei, W.; Yi, Y.; Zhuang, Y.; Kong, L. Study on enhancing hydrogen production potential from renewable energy in multi-terminal DC system. Energy Rep. 2021, 7, 395–404. [Google Scholar] [CrossRef] [Scilit]
- Abdel Haleem, A.; Huyan, J.; Nagasawa, K.; Kuroda, Y.; Nishiki, Y.; Kato, A.; Nakai, T.; Araki, T.; Mitsushima, S. Effects of operation and shutdown parameters and electrode materials on the reverse current phenomenon in alkaline water electrolyzers. J. Power Sources 2022, 535, 231454. [Google Scholar] [CrossRef] [Scilit]
- Al Sakka, M.; Gualous, H.; Van Mierlo, J.; Culcu, H. Thermal modeling and heat management of supercapacitor modules for vehicle applications. J. Power Sources 2009, 194, 581–587. [Google Scholar] [CrossRef] [Scilit]
- Alias, A.D.; Verayiah, R.; Ramasamy, A.; Mokhlis, H.; Ba-swaimi, S. Optimal multi-objective planning model for solar PV and energy storage systems in distribution systems: Long-term technical, economic, and environmental tradeoff analysis. J. Renew. Sustain. Energy 2026, 18, 044103. [Google Scholar] [CrossRef] [Scilit]
- Bocklisch, T. Hybrid energy storage approach for renewable energy applications. J. Energy Storage 2016, 8, 311–319. [Google Scholar] [CrossRef] [Scilit]
- Caponi, R.; Vizza, D.; Bassano, C.; Del Zotto, L.; Bocci, E. Dynamic Comparative Assessment of Long-Term Simulation Strategies for an Off-Grid PV-AEM Electrolyzer System. Energies 2025, 18, 4209. [Google Scholar] [CrossRef] [Scilit]
- Ge, L.J.; Zhang, B.H.; Huang, W.T.; Li, Y.Z.; Hou, L.Y.; Xiao, J.B.; Mao, Z.M.; Li, X.P. A review of hydrogen generation, storage, and applications in power system. J. Energy Storage 2024, 75, 109307. [Google Scholar] [CrossRef] [Scilit]
- Kohole, Y.W.; Ngouleu, C.A.W.; Fohagui, F.C.V.; Tchuen, G. A comprehensive comparison of battery, hydrogen, pumped-hydro and thermal energy storage technologies for hybrid renewable energy systems integration. J. Energy Storage 2024, 93, 112299. [Google Scholar] [CrossRef] [Scilit]
- Li, J.C.; Xiao, Y.; Lu, S.Q. Optimal configuration of multi microgrid electric hydrogen hybrid energy storage capacity based on distributed robustness. J. Energy Storage 2024, 76, 109762. [Google Scholar] [CrossRef] [Scilit]
- Serik, A.; Kuspanov, Z.; Daulbayev, C. Cost-effective strategies and technologies for green hydrogen production. Renew. Sustain. Energy Rev. 2026, 226, 116242. [Google Scholar] [CrossRef] [Scilit]
- Mahmood, S.A.; Abdu, H.I.; Almohannadi, E.K.; Usmonov, B.; Khudayberdieva, A.; Shibl, M.F.; Soliman, K.A.; Mobarak, N.N.; Eid, K. Facile One-Pot Synthesis of Hierarchical Porous Carbon Nanofibers Encapsulated Metal Nanocrystals as Efficient Pt-Free Electrocatalysts for Green Hydrogen Production. Int. J. Hydrogen Energy 2026, 227, 154556. [Google Scholar] [CrossRef] [Scilit]
- Eid, K.; Antonietti, M. Water Electrolysis Beyond Platinum: Carbon Nitride Materials for Electrochemical Hydrogen Evolution. Adv. Sci. 2025, 12, e14030. [Google Scholar] [CrossRef] [Scilit] [PubMed]
- Jia, H.; Zhao, Z.; Tong, D.; Hou, X.; Li, S.; Sun, W.; Li, G.; Bai, S.; Sun, K. Numerical analysis of the effects of operating parameters on polarization behavior and gas purity in alkaline electrolyzers. Int. J. Hydrogen Energy 2026, 240, 155466. [Google Scholar] [CrossRef] [Scilit]
- Zhang, H.; Fan, F.; Zhu, S.; Hao, W.; Wang, Y.; Song, K.; Zhao, H.; Chan, S.H. Modeling and Validation of Hydrogen-Oxygen Impurity in Alkaline Electrolyzers under Multiple Operational States for Hydrogen-Based Microgrid Scheduling. Appl. Energy 2026, 427, 128894. [Google Scholar] [CrossRef] [Scilit]
- Bekki, I.; Rizki, H.; Lamzouri, F.E.-Z.; Boufounas, E.-M.; Bejjit, L. Robust power control and energy management of a stand-alone PV-TEG hybrid system integrated with hydrogen and battery storage in a DC microgrid. J. Energy Storage 2026, 169, 122522. [Google Scholar] [CrossRef] [Scilit]
- Li, M.F.; Yang, J.C.; Mehrpooya, M.; Guo, Z.J.; He, T.B. Off-grid green hydrogen production and liquefaction system driven by renewable energy and LNG cold energy: A comprehensive 4E analysis and optimization. Appl. Energy 2025, 392, 125882. [Google Scholar] [CrossRef] [Scilit]
- Abdin, Z.; Mérida, W. Hybrid energy systems for off-grid power supply and hydrogen production based on renewable energy: A techno-economic analysis. Energy Convers. Manag. 2019, 196, 1068–1079. [Google Scholar] [CrossRef] [Scilit]
- Dissanayake, K.; Kularatna-Abeywardana, D. A review of supercapacitors: Materials, technology, challenges, and renewable energy applications. J. Energy Storage 2024, 96, 112563. [Google Scholar] [CrossRef] [Scilit]
- Li, X.J.; Palazzolo, A. A review of flywheel energy storage systems: State of the art and opportunities. J. Energy Storage 2022, 46, 103576. [Google Scholar] [CrossRef] [Scilit]
- Maroufi, S.M.; Karrari, S.; Rajashekaraiah, K.; De Carne, G. Power Management of Hybrid Flywheel-Battery Energy Storage Systems Considering the State of Charge and Power Ramp Rate. IEEE Trans. Power Electron. 2025, 40, 9944–9955. [Google Scholar] [CrossRef] [Scilit]
- Wen, S.; Gong, Y.; Zhao, S.; Zeng, X.; Mu, X. Application of flywheel-battery hybrid energy storage in frequency regulation of new and renewable energy power plants. Energies 2026, 19, 1586. [Google Scholar] [CrossRef] [Scilit]
- Li, Z.L.; Li, H.; Liu, S.J.; Fan, X.Q. Direct-drive permanent magnet wind power generation system based on MPCC-PIγDμ control. Power Syst. Autom. 2023, 35, 1–10. (In Chinese) [Google Scholar] [CrossRef] [Scilit] [PubMed]
- Keller, R.; Baader, F.J.; Bardow, A.; Müller, M.; Peters, R. Experimental demonstration of dynamic demand response scheduling for PEM-electrolyzers. Appl. Energy 2025, 393, 126014. [Google Scholar] [CrossRef] [Scilit]
- Spiegel, C. PEM Fuel Cell Modeling and Simulation Using MATLAB; Academic Press: Amsterdam, The Netherlands, 2008. [Google Scholar] [CrossRef] [Scilit]
- Liu, C.; Geng, Z.; Wang, X.; Liu, W.; Wang, Y.; Xia, Q.; Li, W.; Jin, L.; Zhang, C. Development of advanced anion exchange membrane from the view of the performance of water electrolysis cell. J. Energy Chem. 2024, 90, 348–369. [Google Scholar] [CrossRef] [Scilit]
- Sakas, G.; Ibáñez-Rioja, A.; Ruuskanen, V.; Kosonen, A.; Ahola, J.; Bergmann, O. Dynamic energy and mass balance model for an industrial alkaline water electrolyzer plant process. Int. J. Hydrogen Energy 2022, 47, 4328–4345. [Google Scholar] [CrossRef] [Scilit]
- Bi, X.; Wang, G.; Cui, D.; Qu, X.; Shi, S.; Yu, D.; Cheng, M.; Ji, Y. Simulation study on the effect of temperature on hydrogen production performance of alkaline electrolytic water. Fuel 2025, 380, 133209. [Google Scholar] [CrossRef] [Scilit]
- Elmaihy, A.; Amin, M.I.; Bennaya, M.; Rashad, A. Thermodynamic modeling of alkaline water electrolyzer and assessment of reported cell voltages correlations at low temperature and atmospheric pressure: Critical review. J. Energy Storage 2024, 96, 112674. [Google Scholar] [CrossRef] [Scilit]
- Lawand, K.; Sampathkumar, S.N.; Mury, Z.; Van Herle, J. Membrane electrode assembly simulation of anion exchange membrane water electrolysis. J. Power Sources 2024, 595, 234047. [Google Scholar] [CrossRef] [Scilit]
- Cheng, X.; Lin, J.; Zhao, Z.; Yang, B.; Song, Y.; Wang, J. Modeling study of efficiency losses in water electrolysis systems caused by low frequency current and power fluctuations. Int. J. Hydrogen Energy 2025, 106, 850–863. [Google Scholar] [CrossRef] [Scilit]
- Qiu, Y.; Zhou, B.; Zang, T.; Zhou, Y.; Chen, S.; Qi, R.; Li, J.; Lin, J. Extended Load Flexibility of Utility-Scale P2H Plants: Optimal Production Scheduling Considering Dynamic Thermal and HTO Impurity Effects. Renew. Energy 2023, 217, 119198. [Google Scholar] [CrossRef] [Scilit]
- Tipán-Salazar, L.; Naval, N.; Yusta, J.M. Techno-economic management of hybrid renewable systems with pumped hydro energy storage for green hydrogen production by proton-exchange membrane electrolyzers. Energy Convers. Manag. X 2026, 32, 102298. [Google Scholar] [CrossRef] [Scilit]
- Rabet, S.; Laleh, S.S.; Kusheshi, N.; Gholamian, E.; Mahmoudi, S.M.S.; Zare, V.; Mehr, A.S. Green hydrogen-enabled power-to-methane energy storage in a biomass-solar hybrid system: A 4E assessment and multi-objective optimization. Int. J. Hydrogen Energy 2026, 224, 154258. [Google Scholar] [CrossRef] [Scilit]
- Erdiwansyah; Mamat, R.; Ghazali, M.F.; Basrawi, F.; Rosdi, S.M. Future Directions in Renewable Energy: Hydrogen, Hybrid Systems, and Scalable Energy Storage Technologies. Water-Energy Nexus 2026, in press. [Google Scholar] [CrossRef] [Scilit]
- Ahmed, M.R.; Hasan, M.R.; Barua, T.; Hoque, M.E. Techno-economic and feasibility investigation of standalone renewable energy-based hybrid systems with battery and hydrogen storage. Next Res. 2025, 2, 100720. [Google Scholar] [CrossRef] [Scilit]
- Wu, Y.; Chen, P. Hybrid Water Electrolysis toward Energy-Efficient Hydrogen Production Coupled with Value-Added Chemical Synthesis. Green Chem. 2026, 28, 3043–3072. [Google Scholar] [CrossRef] [Scilit]

Disclaimer/Publisher’s Note: The statements, opinions and data contained in all publications are solely those of the individual author(s) and contributor(s) and not of MDPI and/or the editor(s). MDPI and/or the editor(s) disclaim responsibility for any injury to people or property resulting from any ideas, methods, instructions or products referred to in the content. |
© 2026 by the authors. Licensee MDPI, Basel, Switzerland. This article is an open access article distributed under the terms and conditions of the Creative Commons Attribution (CC BY) license.