


Abstract
Lightning-induced tripping poses a major threat to the safe operation of high-voltage transmission lines in subtropical hilly regions. To reveal the multi-factor driving mechanisms of tripping events and realize quantitative risk prediction, this study takes Jiangxi Province of China, a typical subtropical hilly area, as the research case. Multi-source datasets including tripping records, lightning location observations, high-resolution meteorological products, transmission-line attributes, and 30 m resolution DEM terrain data were integrated. Variables were analyzed, screened, and compared based on feature importance and Pearson correlation coefficients to select appropriate representative modelling features. Two baseline models (Logistic Regression and Random Forest) and three gradient-boosting ensemble models, namely, XGBoost, LightGBM, and CatBoost, were compared. CatBoost, with the optimal overall performance, was selected as the final model to output continuous tripping risk probabilities, and a four-level risk classification system was established. The results indicate that lightning activity, line attributes, and topographic conditions jointly dominate the occurrence of lightning-induced tripping. Model validation on the test set shows that 78.92% of historical tripping points and 72.18% of non-tripping points were assigned to reasonable corresponding risk intervals, and similar performance was observed in individual-case validation. The analytical workflow established in this study can provide a reference for lightning risk assessment of transmission lines in similar subtropical hilly regions.
1. Introduction
High-voltage transmission lines constitute critical infrastructure for cross-regional power delivery within modern energy systems, and their operational reliability is directly related to energy security and the resilience of new-type power systems [1]. Worldwide, lightning represents the primary meteorological hazard causing unplanned outages of overhead transmission lines. In warm, humid subtropical monsoon climate zones, frequent lightning activities readily induce line flashover and tripping and may even trigger cascading power-grid failures, posing severe challenges to the safe operation of power systems [2,3]. Numerous global transmission corridors are located in hilly–mountainous mixed terrain. Complex underlying surfaces modify local convective development, lightning distribution, and the lightning exposure level of power lines. Clarifying the generation mechanism of lightning-induced tripping under multi-factor coupling and realizing quantifiable probabilistic risk prediction constitute a shared scientific concern in the international field of power meteorology [4,5].
Early studies on transmission-line lightning-induced tripping mainly adopted physical simulations based on the electro-geometric model, focusing on evaluating the influences of engineering parameters such as tower structure, shielding-wire configuration, and grounding resistance on the lightning-withstand performance of lines [6,7]. Such approaches possess clear physical mechanisms; nevertheless, in regions with rugged terrain, they cannot adequately characterize the synergistic effects of local micrometeorology, micro-topography, and real-world lightning events, leading to notable estimation biases [8]. With the progressive deployment of lightning location networks across many countries, substantial studies have constructed statistical correlations between lightning parameters and line failures by analyzing the distribution characteristics of lightning frequency, peak current amplitude, and polarity derived from lightning monitoring datasets [9,10]. Nevertheless, lightning observations alone are insufficient to explain tripping occurrences. Essentially, lightning-induced tripping arises from the coupled interactions among lightning activities, local meteorological conditions, inherent power-grid properties, and topographic underlying surfaces [11,12].
In recent years, machine learning methods have been widely applied to power-grid disaster risk assessment, offering new approaches for interpreting complex nonlinear relationships among multi-source heterogeneous factors [13]. Algorithms including Random Forest and gradient-boosting decision trees have been employed for lightning-caused fault identification and probabilistic prediction [14,15]. Gradient-boosting ensemble models such as XGBoost, LightGBM and CatBoost have gained extensive adoption in power-fault modeling owing to their favorable anti-noise capability and mixed-feature processing performance [16,17,18]. Despite considerable existing achievements, several obvious research gaps remain. Many modeling efforts focus merely on single-type driving factors, lacking comprehensive analysis integrating lightning observations, high-resolution meteorological products, power-grid attributes, and fine-grained topographic datasets [19,20]. Some studies overlook multicollinearity among variables and lack rigorous, reproducible feature-selection workflows [21,22]. Furthermore, for subtropical hilly terrain, cases that compare multiple advanced ensemble algorithms and output continuous risk probabilities based on long-term real-world tripping records remain limited, restricting method reference and cross-regional model transferability [23,24].
The subtropical hilly regions in South China exhibit intense lightning activity [25] and dense power-grid layouts [26], forming an ideal testbed for addressing the above-mentioned scientific issues. This study takes Jiangxi Province, a typical representative of such climatic-geomorphic conditions, as the research case. Multi-source datasets covering 2015–2024 are utilized, including historical lightning-induced tripping records, observations from the China Lightning Location Network, high-spatiotemporal-resolution merged meteorological products, vector data of transmission lines, and 30 m resolution DEM terrain data. This study first reveals multi-scale spatiotemporal patterns of lightning-induced tripping and quantitatively interprets the driving effects of lightning, meteorology, line attributes, and topographic conditions on tripping events. Second, feature selection and comparative analysis are performed by combining feature importance and Pearson correlation coefficients to select appropriate representative modelling factors. Further, the prediction performances of two baseline models (Logistic Regression and Random Forest) and three ensemble models (XGBoost, LightGBM, and CatBoost) are compared. The optimal model is selected to generate continuous lightning-induced tripping risk probabilities, followed by risk-level classification. This work can not only provide technical support for lightning-protection operation and maintenance in the study area but its analytical workflow, factor-interpretation framework, and modeling strategy can also serve as a referenceable paradigm for transmission-line lightning risk assessment in analogous subtropical hilly regions worldwide.
2. Data and Methods
2.1. Overview of the Study Area
The study area covers Jiangxi Province, China, with a geographic extent ranging from 24°29′ N to 30°04′ N and 113°57′ E to 118°47′ E. Characterized by a subtropical humid monsoon climate, this region receives an annual average precipitation of 1300–2000 mm, with rainfall concentrated in spring and summer. Severe convective weather occurs frequently alongside intensive lightning activity. The annual average relative humidity varies between 75% and 85%, while the annual average temperature ranges from 17.8 °C to 19.3 °C. Transmission lines with a voltage level of 110 kV and above in Jiangxi Province were selected as the research objects.
2.2. Multi-Source Data and Preprocessing
2.2.1. Lightning-Induced Tripping Data
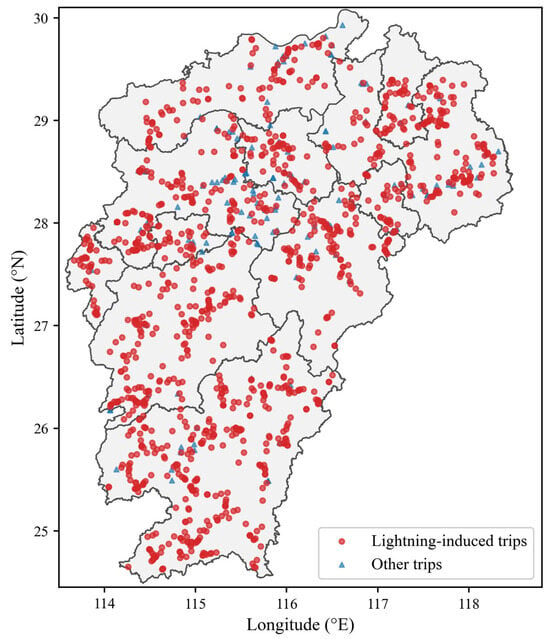
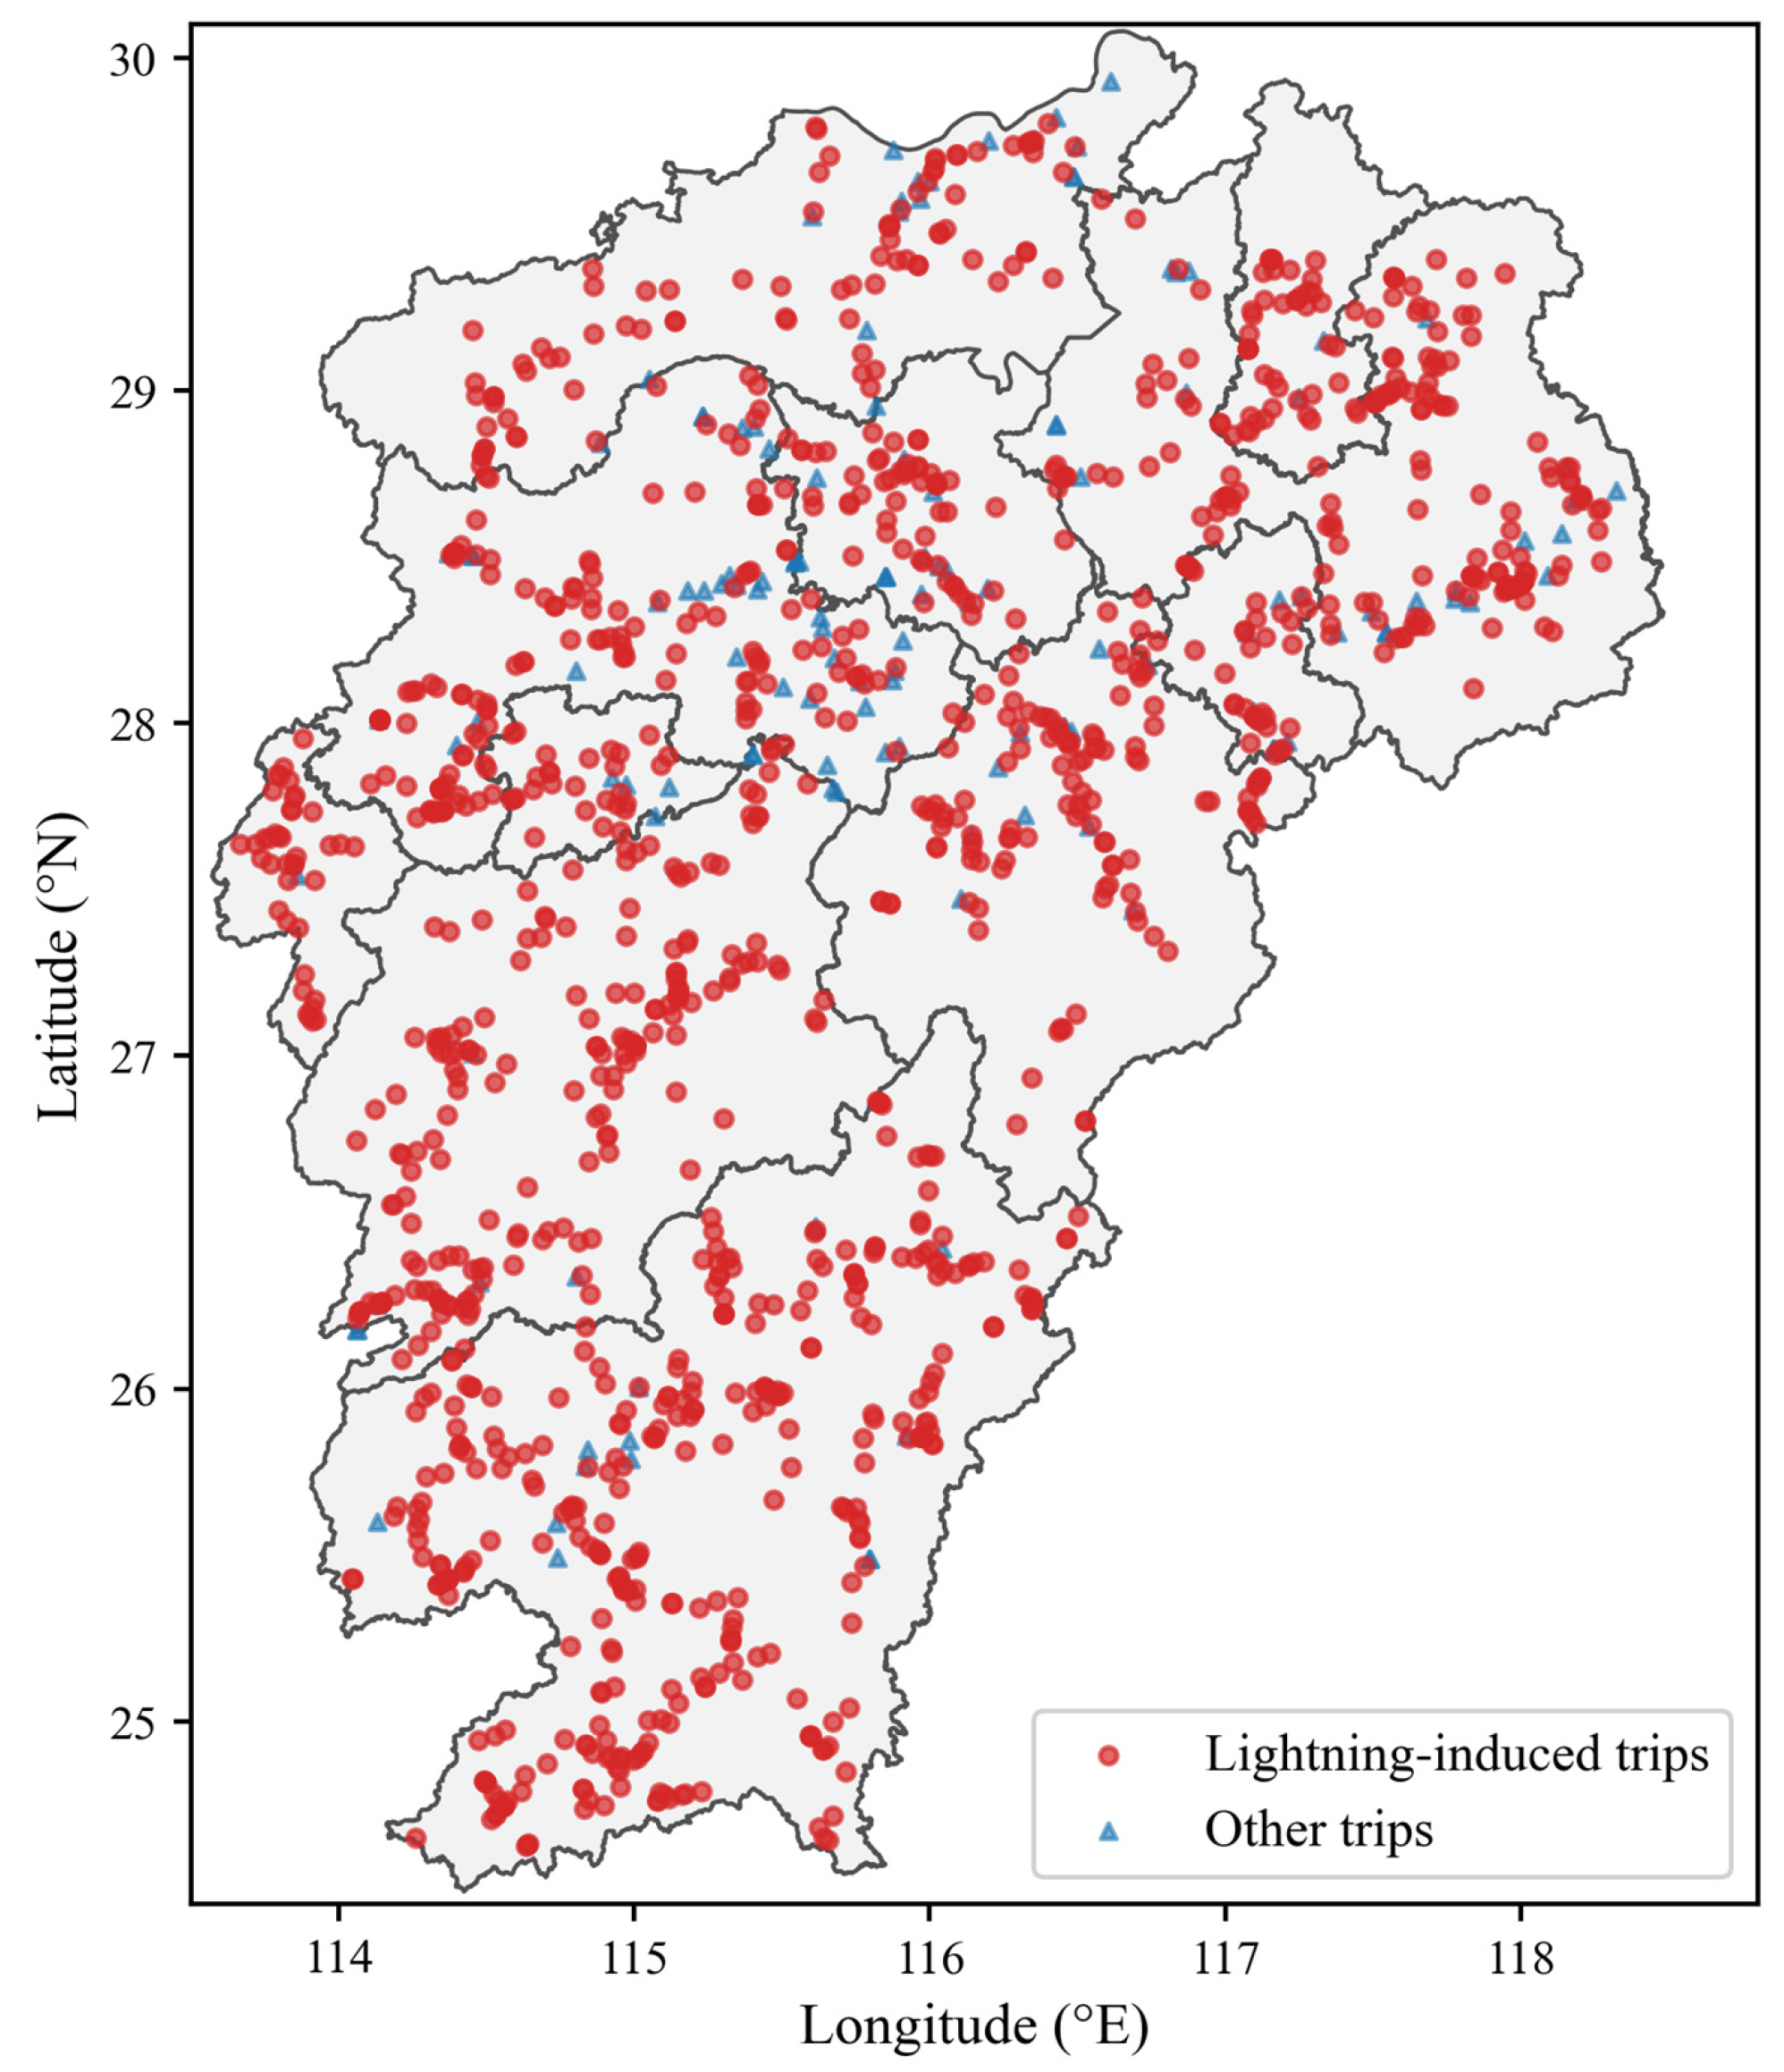
A total of 1289 tripping records of transmission lines in Jiangxi Province from 2015 to 2024 were collected for this study (Figure 1), among which 1173 records were lightning-induced tripping events, accounting for 91% of the total dataset. Each lightning-induced tripping record contains multiple attributes, including the longitude and latitude of the tripping location, tripping occurrence time, fault clearance time, and line voltage level. Based on the longitude, latitude, and occurrence time of each tripping event, the corresponding datasets of lightning activity, meteorological conditions, transmission line features, and topographic attributes were extracted via spatiotemporal matching. These datasets were further adopted to analyze the driving factors of lightning-induced tripping and construct a tripping risk prediction model.
Figure 1.
Spatial distribution of lightning-induced tripping points of transmission lines in Jiangxi Province, 2015–2024.
2.2.2. Lightning Data
The lightning data adopted in this study were derived from observations of the China Lightning Location Network (CLLN), which enables real-time and accurate positioning of lightning initiation and propagation processes. Each lightning record contains attributes including the occurrence time, longitude, latitude, peak current magnitude, and lightning polarity. Records with abnormal peak current values and zero-current entries were eliminated prior to matching. Considering the instantaneous nature of lightning-induced tripping events, we matched lightning parameters that occurred within a 1 km radius and one hour prior to each lightning-induced tripping point. Two lightning characteristic variables were extracted: the total number of lightning events triggering tripping (L_Frq) and the average peak current of matched lightning (L_I).
2.2.3. Meteorological Data
Meteorological factors exhibit substantial variability, and meteorological datasets with high spatiotemporal resolution are required for research on lightning-induced tripping. The meteorological data adopted in this study are the Multi-Source Hourly Merged Products covering Jiangxi Province (MSHPs). This dataset integrates multi-source observational information from automatic ground weather stations, weather radars, satellite remote sensing, and numerical weather prediction models and is generated after strict quality control and variational data assimilation. It spatially covers the entire territory of Jiangxi Province, with a spatial resolution of 1 km and a temporal resolution of 1 h. The dataset contains multiple near-surface meteorological variables, including air temperature, relative humidity, 10 m wind, hourly precipitation, and surface pressure, which can finely characterize the unstable environmental conditions favorable for regional severe convection. These data are utilized to match the synchronous meteorological conditions corresponding to each transmission line tripping point.
Jiangxi features an alternating terrain of mountains and hills, frequent local convective activities, and dense lightning. Benefiting from its 1 km grid resolution, this merged dataset can reproduce small-scale disparities in thermal conditions, water vapor distribution, and wind fields, enabling accurate matching of real-time synchronous meteorological elements at each transmission line lightning tripping location. Five meteorological parameters were extracted from the dataset: relative humidity (M_Rh), air temperature (M_Tm), surface pressure (M_Pa), 10 m wind speed (M_Ws), and hourly precipitation (M_Tp). Spatiotemporal matching was then performed to obtain the corresponding meteorological factor data for each lightning-induced tripping record.
2.2.4. Transmission Line and Topographic Data
The layout, scale, and voltage levels of transmission line grids constitute the core artificial infrastructure factors governing regional lightning-induced tripping risk. Such factors must be incorporated to fully interpret the formation mechanism and spatial differentiation of lightning-induced tripping incidents [1,27]. To quantitatively analyze the driving effect of inherent grid characteristics on lightning-induced tripping occurrences, three transmission line characteristic indicators within a 1 km buffer of each lightning-induced tripping point were extracted in this study: total number of transmission lines (T_Nb), cumulative total line length (T_Ln), and maximum voltage level (T_Ve). The number and total length of lines reflect the density of power corridors surrounding each tripping location; densely distributed line corridors are more prone to simultaneous multi-point lightning-induced tripping. The maximum voltage level directly determines line insulation configuration and lightning protection design criteria. Distinct differences exist in the mechanisms of shielding failure and backflashover-induced tripping for lines with different voltage classes [6].
Topography serves as a critical underlying surface factor regulating the spatial distribution of regional lightning strikes and the shielding performance of transmission lines, exerting a remarkable impact on the frequency of lightning-induced tripping events on power transmission lines [9,28,29,30]. In this study, the 30 m resolution Shuttle Radar Topography Mission (SRTM) digital elevation model (DEM) from the United States was adopted to extract three core topographic indicators corresponding to each lightning-induced tripping point: elevation (G_Tr), slope (G_Sl), and aspect (G_As). These topographic parameters are calculated from a fixed topographic base and will not undergo obvious changes over short timescales; hence, they can be treated as stable, static influencing factors for analyzing the driving mechanisms of lightning faults.
A total of 13 potential driving factors for lightning-induced tripping risk were selected in the above analysis, all of which cover the time period from 2015 to 2024. Detailed information on these factors is presented in Table 1.
Table 1.
Attributes of driving factors for lightning-induced tripping risk.
2.3. Research Methods
2.3.1. Construction of Training Dataset
When constructing the lightning-induced tripping risk prediction model, lightning-induced tripping records in Jiangxi Province from 2015 to 2024 were adopted as positive samples, while a certain number of non-tripping points were selected as negative samples. Referring to previous studies on forest lightning fire risk prediction modeling [31], a ratio of 1:1.5 was set between positive lightning tripping samples and negative non-tripping samples, and the negative samples were randomly selected in both temporal and spatial dimensions. The sample dataset was compiled by matching the 13 driving factors listed in Table 1 according to the date and geographic coordinates of each lightning tripping point and non-tripping point.
2.3.2. Ensemble Learning Models
Compared with conventional machine learning models, ensemble-learning algorithms combine multiple weak learners to construct a strong learner with improved generalization ability and robustness [13]. Its core idea is that different learners correct each other’s errors to improve algorithm accuracy. In this study, three mainstream ensemble-learning models derived from gradient-boosting decision trees, namely, XGBoost, LightGBM, and CatBoost, are adopted to establish risk-prediction models for lightning-induced tripping of transmission lines in the Jiangxi power grid. To conduct a comprehensive horizontal comparison and verify the superiority of gradient-boosting models, two widely adopted baseline models, Logistic Regression and Random Forest, are also introduced in this study.
Logistic Regression is a classic linear statistical classification model. It establishes a linear combination of input features and uses the sigmoid function to map outputs into probability values between 0 and 1, which is widely used as a simple baseline for imbalanced classification tasks. It has good interpretability and low computational cost but cannot capture complex nonlinear and interactive relationships between predictive features.
Random Forest belongs to bagging-based ensemble learning. It constructs numerous independent decision trees through random sampling of samples and features and aggregates prediction results by voting or averaging. It can handle nonlinear relationships and resist overfitting via the bagging strategy, yet it lacks the sequential residual-fitting mechanism of boosting algorithms.
Built upon the serial iterative boosting philosophy of ensemble learning, XGBoost is an optimized upgrade of the classical gradient-boosting decision tree (GBDT). It performs multiple rounds of gradient-boosting iterations, where each iteration generates a decision-tree weak learner fitted on the residual of the previous ensemble model. The final prediction output is obtained by weighted summation of outputs from all weak learners [16,32]. By introducing L1 and L2 regularization terms to suppress overfitting and supporting parallel feature-split computation, the model can efficiently process multi-source heterogeneous monitoring data including meteorology, topography, and lightning. It exhibits advantages of high prediction accuracy and strong anti-noise capability [33].
LightGBM also follows the boosting ensemble framework. On the basis of XGBoost, it adopts optimization strategies such as histogram-based binning, leaf-wise tree growth, and gradient-based one-side sampling, which substantially reduce memory consumption and training time. Over-growth is avoided by constraining the maximum leaf depth. It shows prominent training-efficiency advantages for large-sample datasets of lightning-induced tripping containing meteorological variables and lightning frequency while retaining the favorable fitting capacity of gradient-boosting trees [14,15,34].
CatBoost is a gradient-boosting ensemble-tree model optimized for categorical features. Its key improvement is the ordered target-encoding mechanism, which can automatically handle categorical hazard-exposure features in practical scenarios and effectively mitigate gradient-estimation bias and prediction shift induced by categorical variables [17]. Similarly to the other two models, it adopts a serial-ensemble architecture of multiple decision trees and improves generalization performance via error complementarity among learners. It achieves better adaptability for power-grid lightning-risk modelling with categorical topographic zones and transmission-line attributes [18].
Although the five models cover linear baseline, bagging ensemble, and gradient-boosting tree algorithms, they differ greatly in modelling mechanisms and optimization priorities: Logistic Regression is a simple linear baseline with high interpretability; Random Forest relies on a bagging strategy to capture nonlinear relationships; XGBoost possesses complete regularization schemes and high stability; LightGBM delivers superior computational efficiency; CatBoost provides native support for categorical features. Horizontal comparison among the five models can fully verify the reliability of lightning-induced tripping risk-prediction results [35].
2.3.3. Model Evaluation Metrics
To evaluate the predictive performance of the selected machine learning model for lightning-induced tripping risk, a confusion matrix was utilized. A confusion matrix summarizes the prediction performance of a classifier and takes the form of a k-order matrix for k-class classification tasks. This study addresses a binary classification problem; hence, a 2 × 2 confusion matrix is adopted, which divides all samples into four categories (Table 2): true negative (TN), false positive (FP), false negative (FN), and true positive (TP).
Table 2.
Binary confusion matrix.
Accuracy (Acc) is defined as the ratio of correctly predicted samples to the total number of samples. Although this metric is intuitive, it fails to perform well on datasets with imbalanced positive and negative samples. Precision (P) focuses on prediction outputs and represents the proportion of true positive samples among all samples predicted as positive. Recall (R) targets actual samples and quantifies the fraction of real positive samples that are correctly identified. The corresponding formulas are presented as follows:
P and R are two contradictory evaluation metrics. Generally, a high P is accompanied by a low R, and overemphasis on either metric will lead to biased model performance. Meanwhile, Acc is susceptible to the impact of sample imbalance. The F1 score (F1) can balance P and R to reconcile these two indicators:
The Receiver Operating Characteristic (ROC) curve is derived from the confusion matrix. Multiple thresholds can be selected to plot the ROC curve. The default threshold is generally set to 0.5; samples with predicted probabilities greater than 0.5 are classified as positive, while those below 0.5 are classified as negative. An ROC curve that bulges more toward the top-left corner indicates better model performance. ROC-AUC refers to the area under the ROC curve and the horizontal axis. Unlike precision (P), recall (R), and F1, ROC-AUC is independent of threshold selection. Since the ROC curve usually lies above the line y = x, the value of ROC-AUC ranges from 0.5 to 1.
For imbalanced classification tasks such as lightning-induced tripping prediction, the precision–recall (PR) curve and PR-AUC are further adopted to complement the ROC evaluation. The PR curve is plotted based on precision and recall under varying classification thresholds. A PR curve closer to the top-right region represents superior model predictive capability. PR-AUC is defined as the area under the PR curve. Different from ROC-AUC, PR-AUC is sensitive to the proportion of positive samples and is more suitable for assessing model performance on datasets with severe class imbalance. The criteria for evaluating classification models based on ROC-AUC are summarized in Table 3.
Table 3.
Model efficiency and grading.
3. Results
3.1. Analysis of Lightning-Induced Tripping and Its Driving Factors
3.1.1. Spatiotemporal Distribution Characteristics of Lightning-Induced Tripping
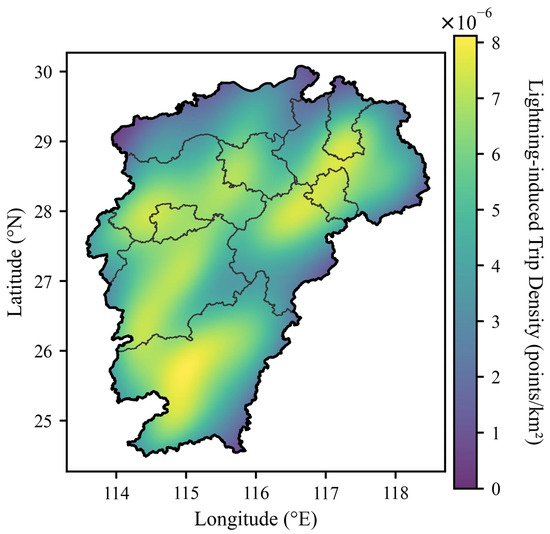
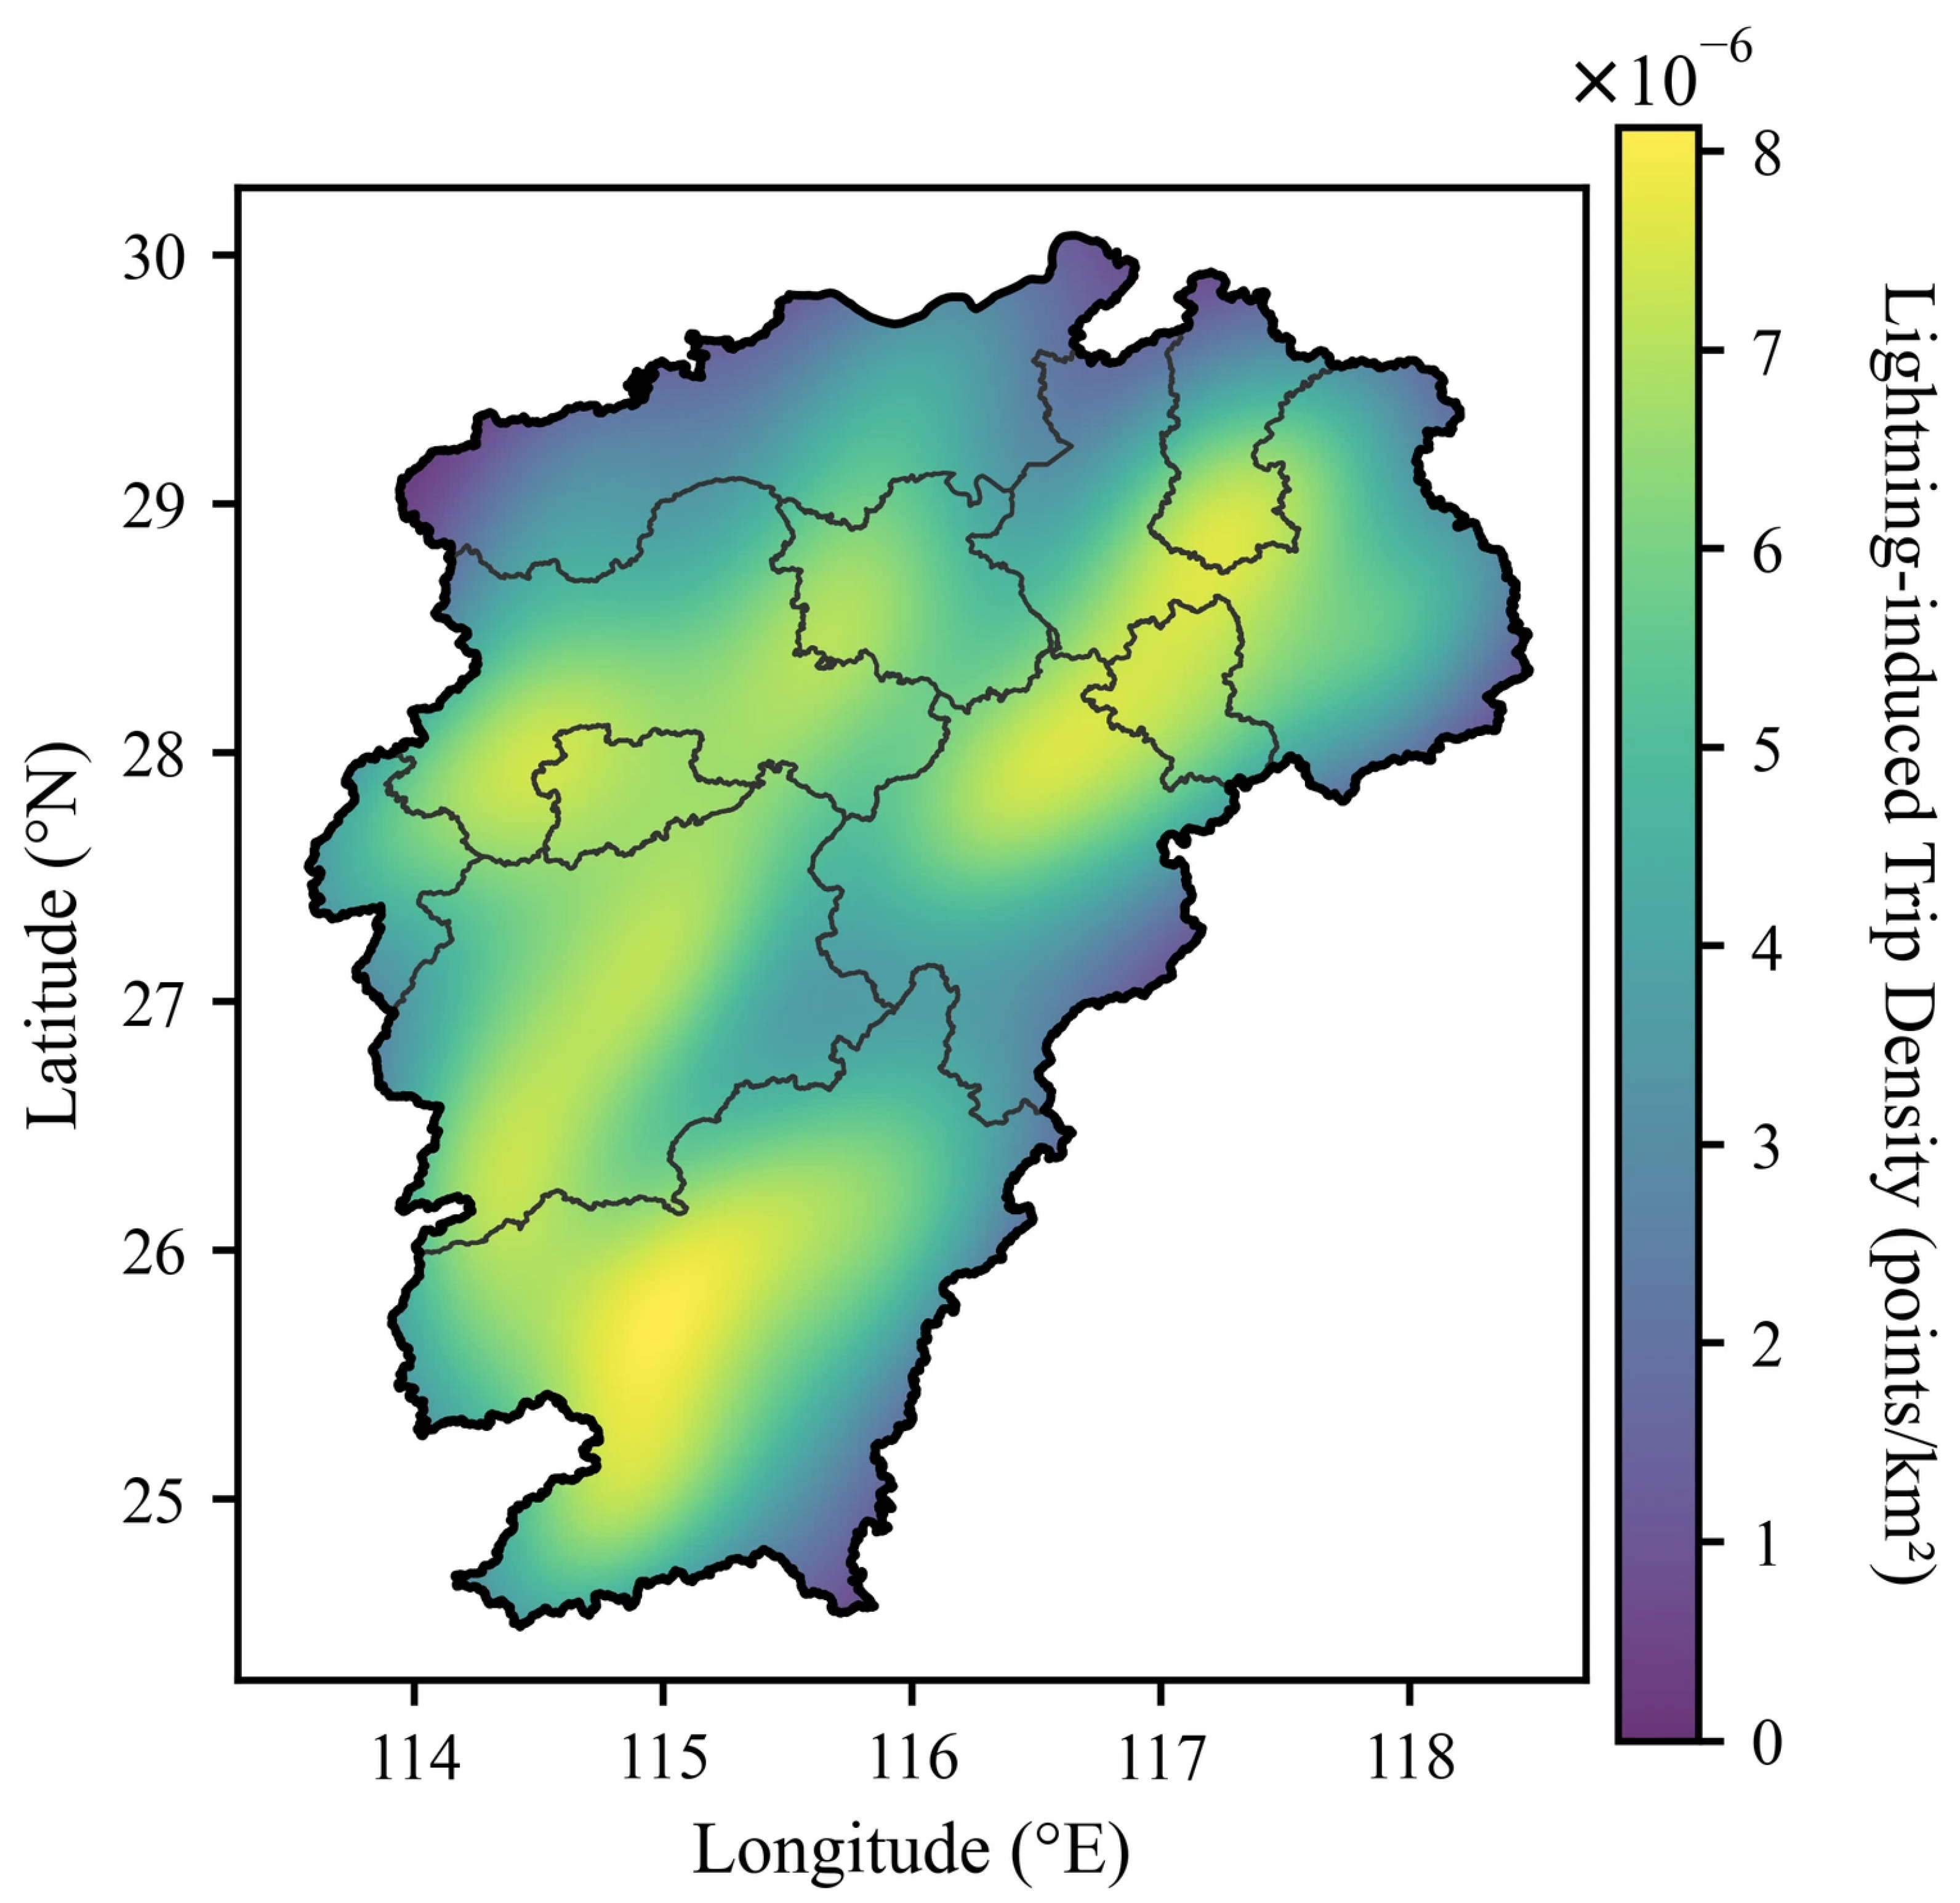
A total of 1173 lightning-induced tripping incidents occurred on transmission lines across Jiangxi Province from 2015 to 2024. The kernel density of lightning-induced tripping presents a spatial pattern of multi-center agglomeration in inland areas with gradual attenuation toward provincial boundaries (Figure 2). Three high-density cores are identified in the northeastern, central, and southern parts of Jiangxi. Zones with moderate density surround these high-value cores, while density drops markedly in peripheral areas of the province. Overall, the kernel density decreases concentrically from inland high-value centers to provincial borders, showing obvious spatial differentiation.
Figure 2.
Spatial distribution of the kernel density of lightning-induced tripping in Jiangxi Province from 2015 to 2024.
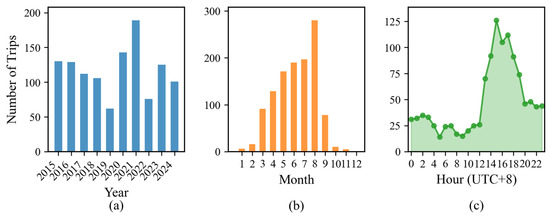
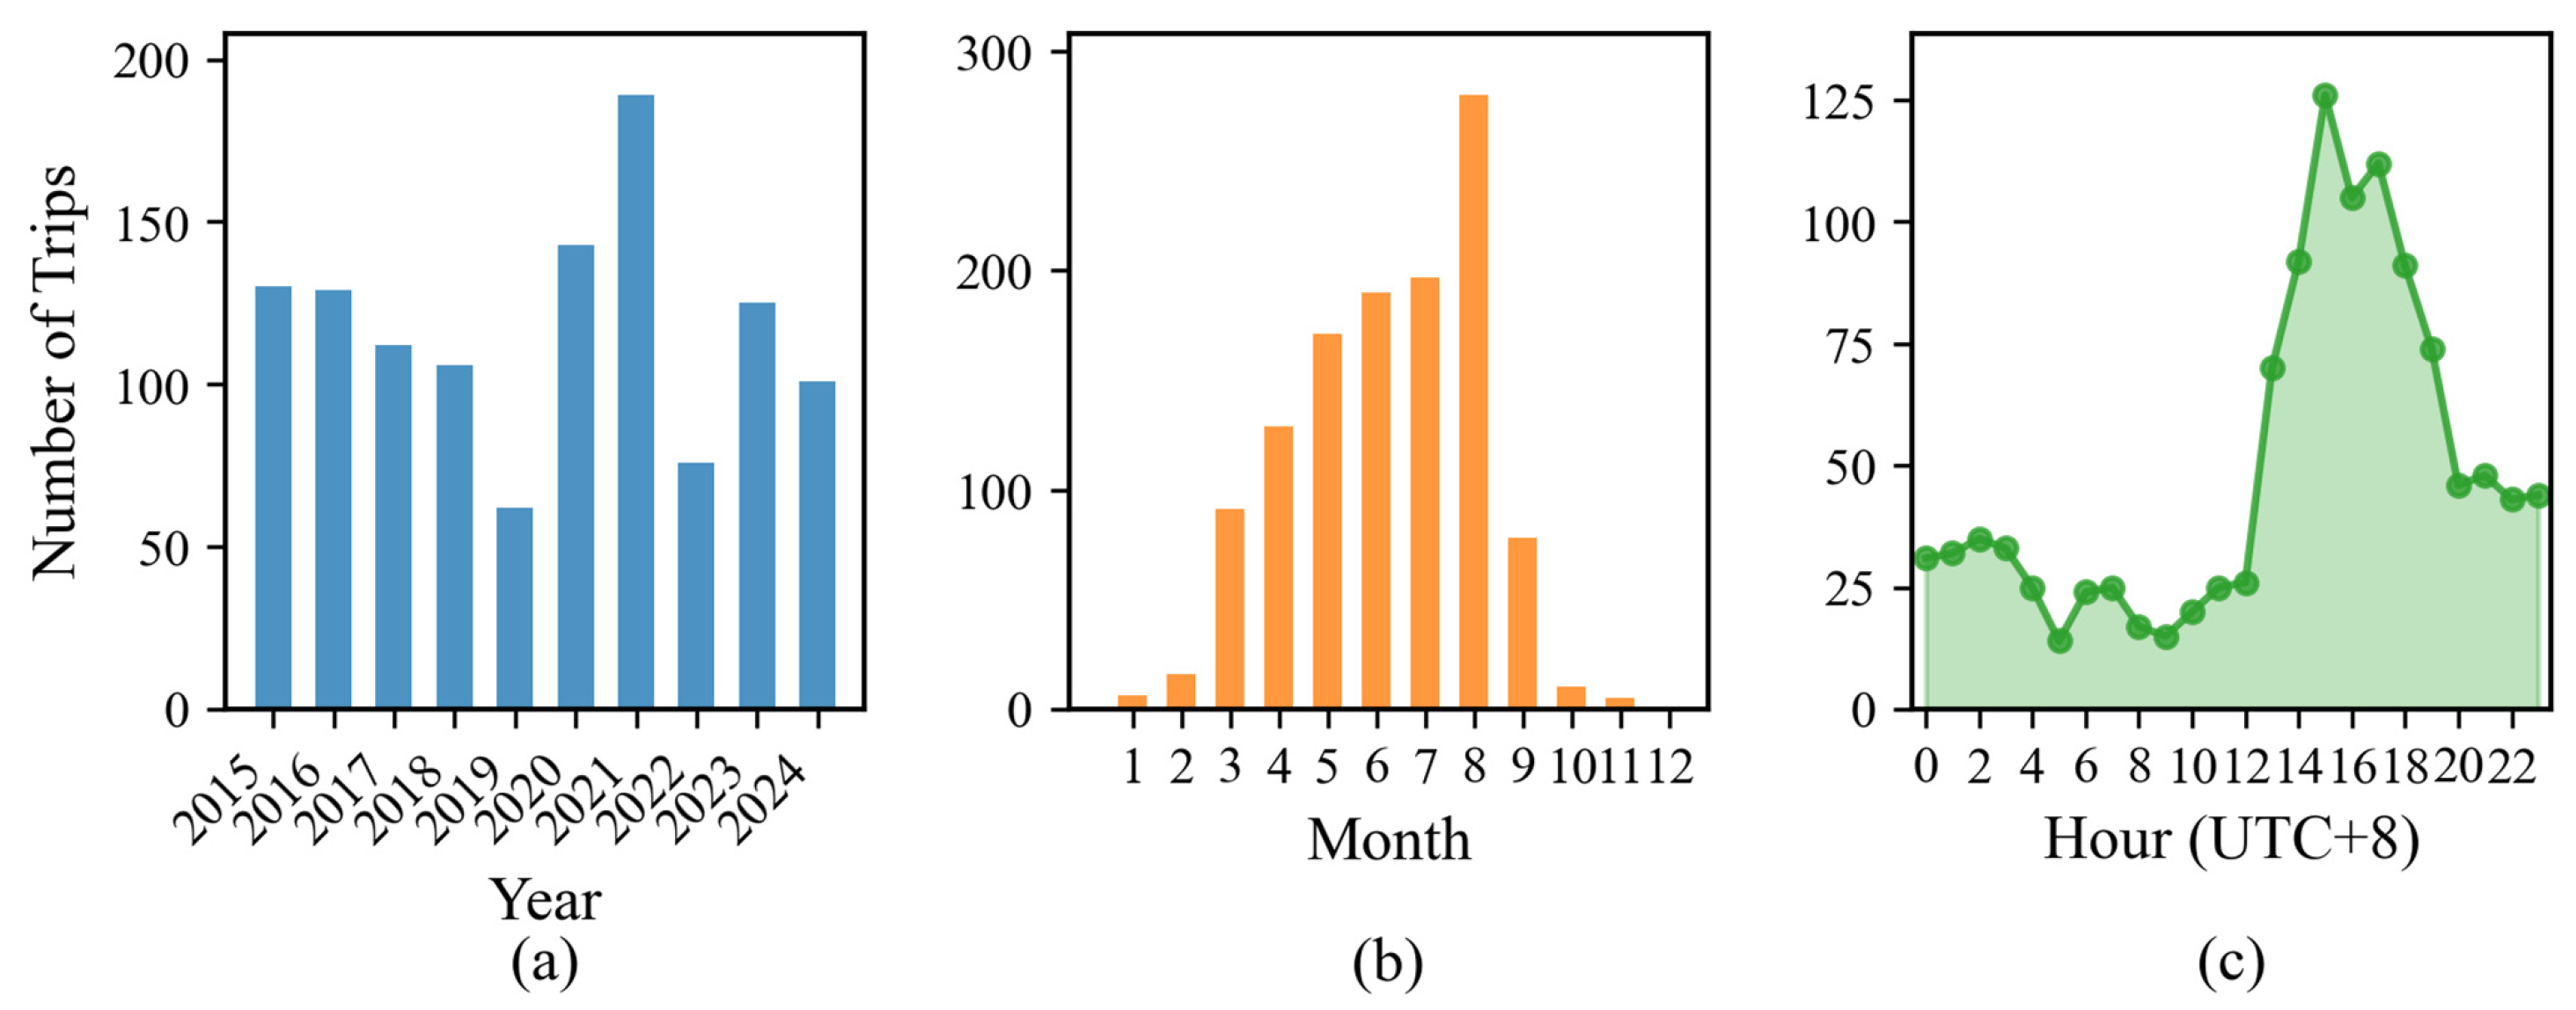
From multi-temporal scale perspectives (Figure 3), lightning-induced tripping records in Jiangxi Province exhibit prominent interannual fluctuations. The overall frequency remained at a relatively high level during 2015–2018, dropped to the minimum of the study period in 2019, and peaked in 2021 before declining year by year afterward. The distribution characteristics at monthly and diurnal scales are derived from all samples over the 10-year period from 2015 to 2024. At the monthly scale, tripping incidents were highly concentrated in the flood season from March to September, with August recording the maximum annual tripping frequency. By contrast, the occurrence of lightning-induced tripping was extremely low in the non-flood winter–spring periods (January–February and October–November), consistent with the seasonal rhythm of severe convective thunderstorms dominated by the East Asian monsoon.
Figure 3.
Temporal variations of lightning-induced tripping in Jiangxi Province from 2015 to 2024: (a) interannual variation, (b) monthly variation, and (c) diurnal variation.
The diurnal variation presents a typical single afternoon peak. Tripping counts stayed generally low from midnight to noon, rose rapidly starting at 13:00, and reached the daily maximum at 15:00. Local thermal convection driven by afternoon surface heating constitutes the core cause of concentrated afternoon lightning tripping. Collectively, interannual climate oscillations, seasonal water vapor conditions, and diurnal thermal forcing jointly control the multi-scale temporal differentiation pattern of lightning-induced tripping.
3.1.2. Spatiotemporal Distribution Characteristics of Lightning
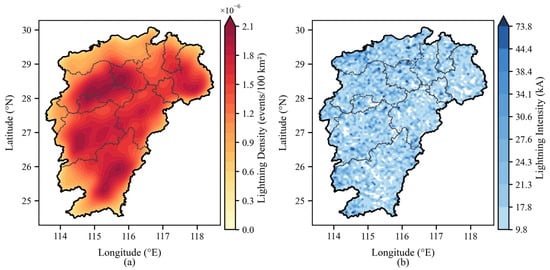
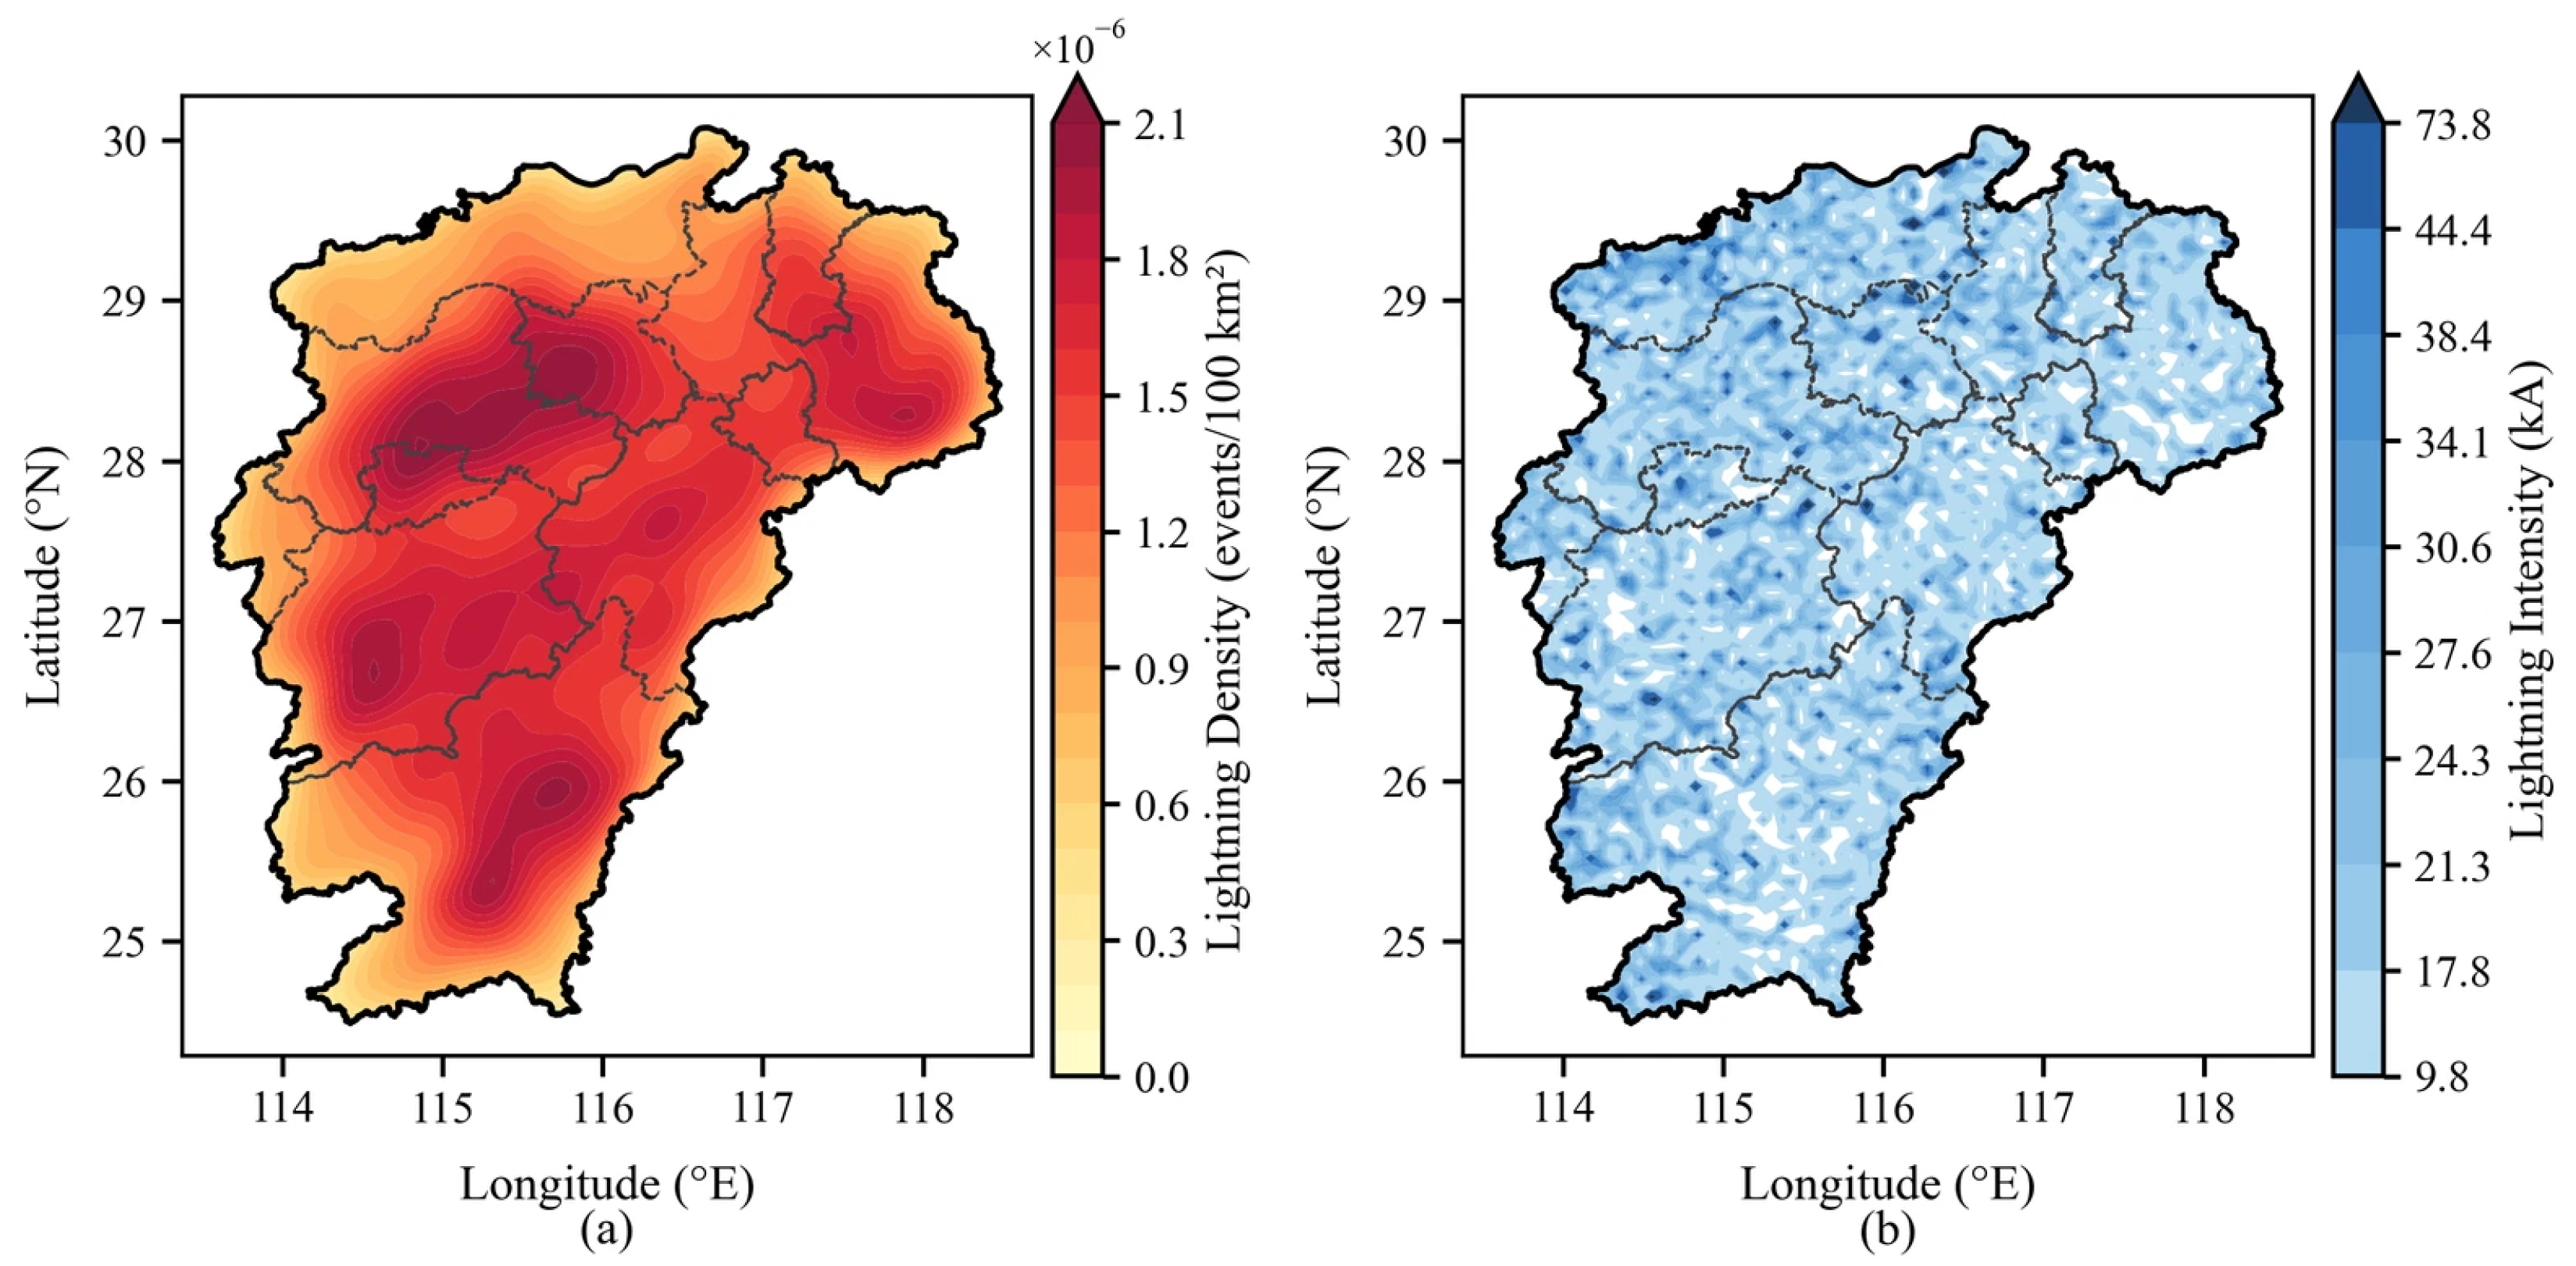
Lightning density and lightning intensity displayed differentiated spatial patterns in Jiangxi Province from 2015 to 2024. The lightning density (Figure 4a) presents widespread dense agglomeration inside the province, with contiguous high-density belts distributed in central, southern, and northeastern Jiangxi; the density gradually weakens only at provincial marginal zones. This spatial pattern is jointly controlled by inland topographic convergence and seasonal monsoon vapor convergence. By comparison, lightning intensity (Figure 4b) shows slight overall spatial heterogeneity. Moderate and weak lightning dominate the entire study area, and high-intensity values only sporadically emerge in scattered local regions, without any contiguous concentrated zones of strong lightning.
Figure 4.
Spatial distributions of kernel density (a) and intensity (b) of lightning in Jiangxi Province from 2015 to 2024.
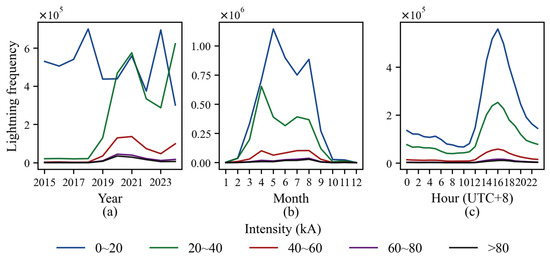
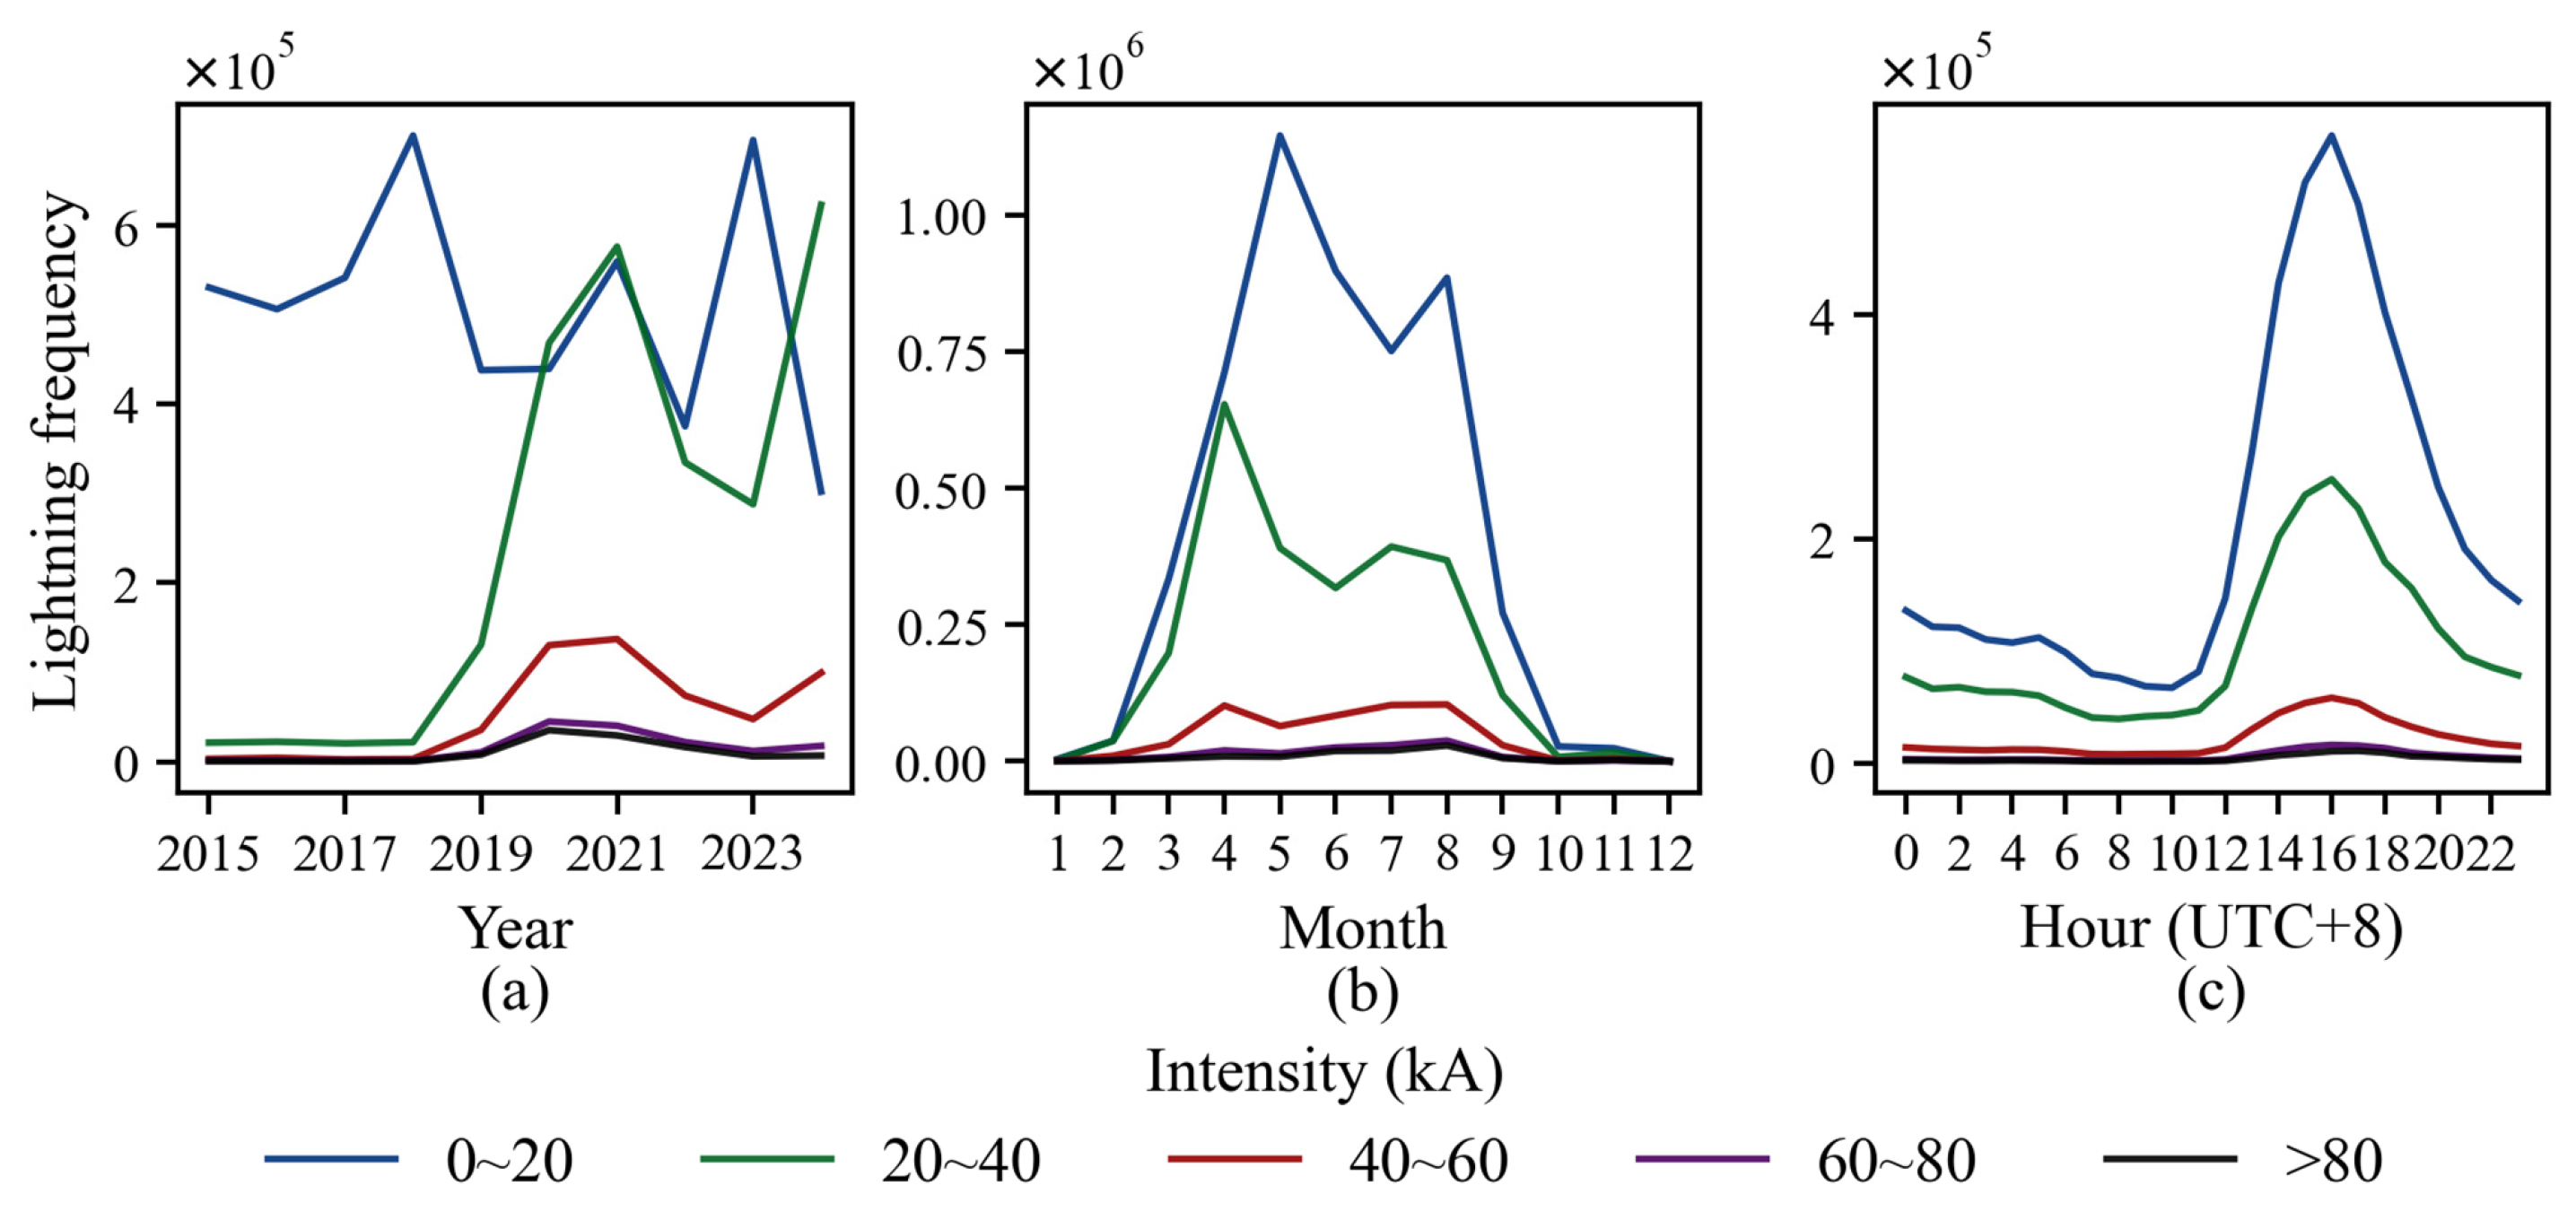
The absolute values of lightning intensity were classified into five grades: 0–20 kA, 20–40 kA, 40–60 kA, 60–80 kA, and >80 kA. We statistically analyzed the total lightning frequency, positive lightning frequency, and negative lightning frequency corresponding to each intensity grade from 2015 to 2024 (Table 4) and further investigated their temporal variation characteristics at interannual, monthly, and diurnal scales (Figure 5).
Table 4.
Lightning frequency of different intensity levels in Jiangxi Province from 2015 to 2024.
Figure 5.
Temporal distributions of lightning with different intensities in Jiangxi Province from 2015 to 2024: (a) interannual variation, (b) monthly variation, and (c) diurnal variation.
The percentages in parentheses in Table 4 represent the proportion of lightning events in each intensity grade relative to the total lightning, positive lightning, and negative lightning. For all intensity grades, negative lightning frequency was markedly higher than positive lightning frequency, accounting for over 83% of the total lightning frequency. As lightning intensity increased, the total, negative, and positive lightning frequencies all exhibited a declining trend. The interannual fluctuation amplitude of lightning frequency at each intensity grade was prominent: before 2014, weak lightning (0–20 kA) presented far higher frequencies than other intensity groups; since 2014, the lightning frequency within the 20–40 kA range has approached that of the 0–20 kA range.
The monthly variation rhythms of lightning at all intensity grades were highly consistent, generally showing a unimodal seasonal distribution. Lightning activity concentrated in the flood season from June to August, with July reaching the annual peak of lightning frequency, followed by June. This temporal pattern basically matched the months with frequent lightning-induced disasters in the study region. Diurnal variations also maintained synchronous trends across all groups. Afternoon convective heating drove a rapid rise in lightning frequency and formed a diurnal peak. Groups of different intensities only differed in fluctuation amplitude, with nearly identical temporal phases.
3.1.3. Analysis of Driving Factors
- Lightning Factors and Lightning-Induced Tripping
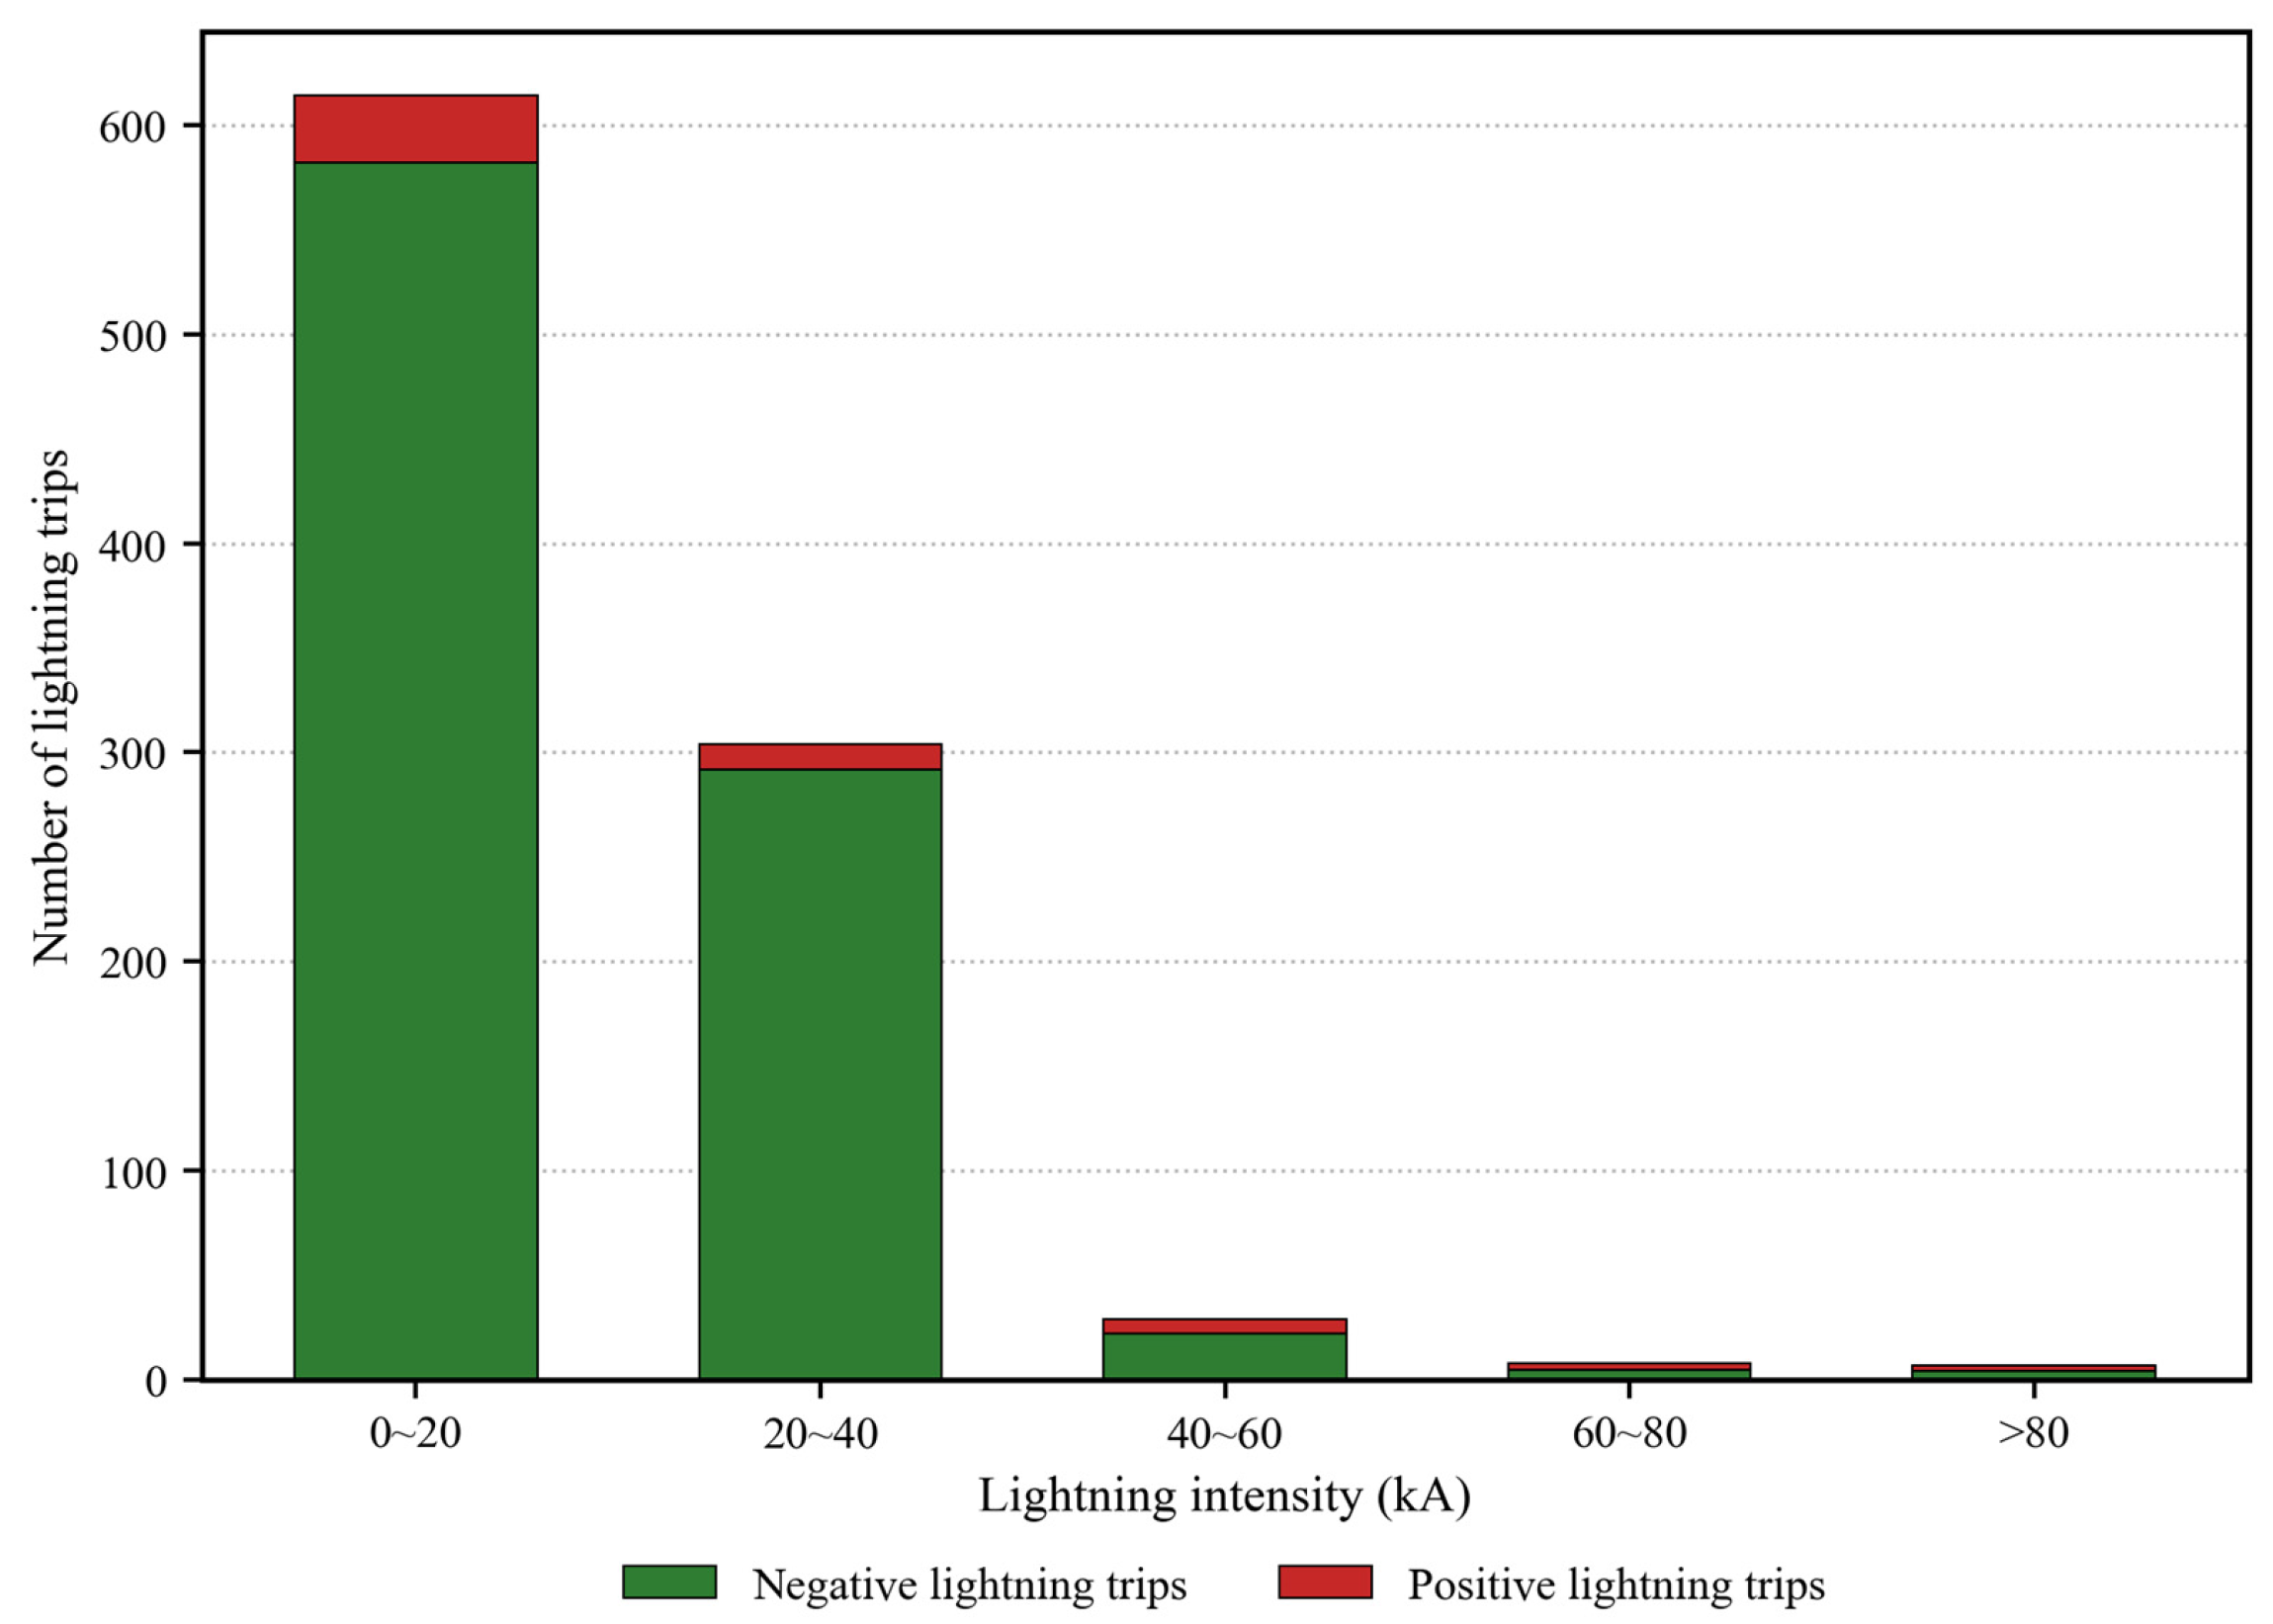
To further explore the influence of lightning factors on the probability of lightning-induced tripping, the average intensity of all lightning within a 1 km radius and 1 h prior to each lightning-induced tripping event was calculated to investigate variations in lightning-induced tripping counts corresponding to different intensity intervals (Figure 6). Statistical results reveal that tripping events are predominantly induced by lightning ranging from 0 to 40 kA, accounting for 94.7% of all lightning-induced tripping; the highest tripping frequency occurs within the 0–20 kA interval. For all intensity levels, the number of tripping events induced by negative lightning is markedly higher than that induced by positive lightning. As lightning intensity increases, the tripping counts caused by both positive and negative lightning exhibit an overall rapid declining trend. Although positive lightning accounts for a small proportion of total lightning, its contribution to tripping rises in the high-intensity range above 40 kA. This indicates that high-current positive lightning poses non-negligible risks of transmission line faults.
Figure 6.
Lightning-induced tripping counts under different lightning intensity levels in Jiangxi Province, 2015–2024.
- 2.
- Meteorological Factors and Lightning-Induced Tripping
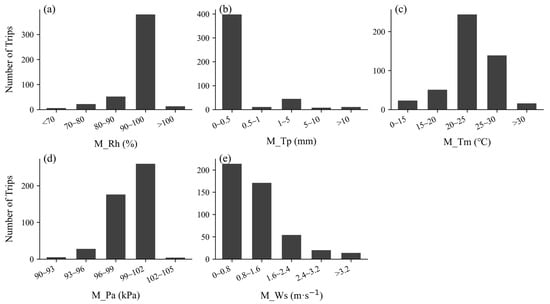
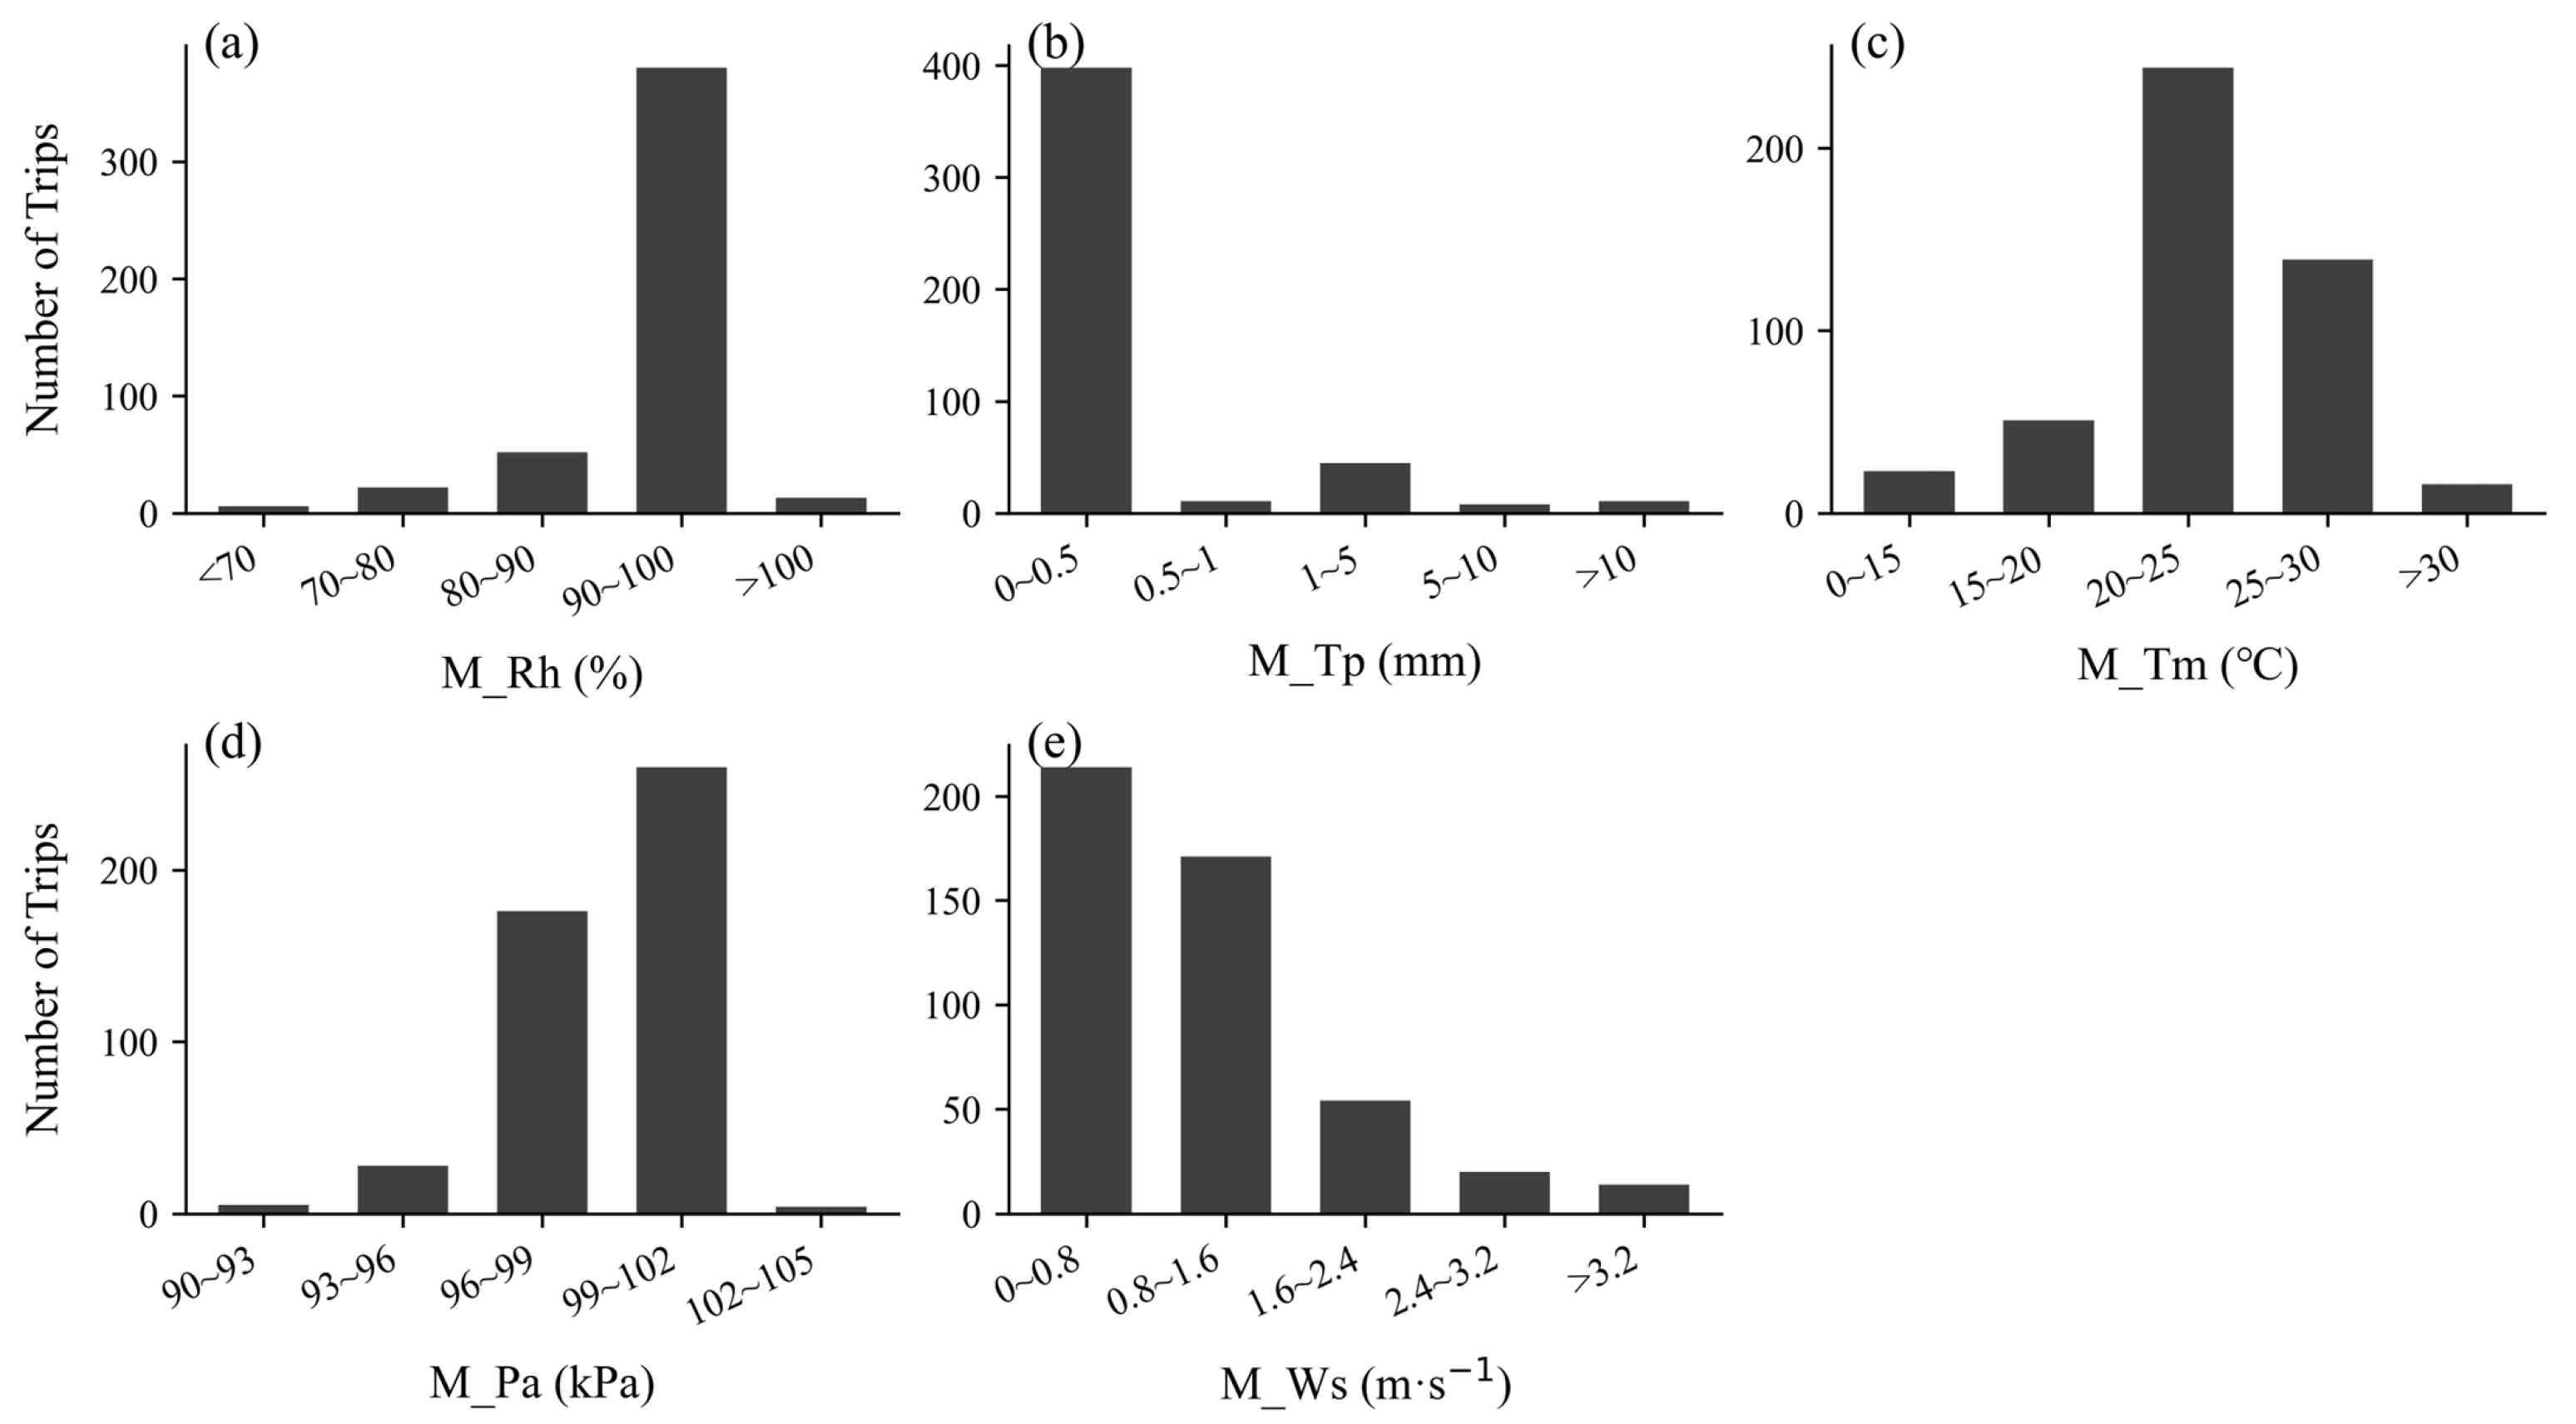
Correlation analysis between the number of lightning-induced trippings and monthly meteorological factors from 2015 to 2024 was conducted using multiple linear regression (Table 5). The results reveal that the number of lightning-induced trippings has a significant negative correlation with M_Pa (r = −0.696) and a significant positive correlation with M_Tm (r = 0.634). M_Rh, M_Tp, and M_Ws show weak correlations with tripping counts. Statistical analysis of lightning-induced tripping counts across different ranges of meteorological factors (Figure 7) indicates that lightning-induced tripping events predominantly occur within the intervals: M_Tp: 0–0.5 mm; M_Pa: 990–1020 hPa; M_Tm: 20–25 °C; M_Rh: 90–100%; M_Ws: 0–1.6 m·s−1.
Table 5.
Correlation between lightning-induced tripping and meteorological factors in Jiangxi Province, 2015–2024.
Figure 7.
Number of lightning-induced trippings within ranges of different meteorological factors in Jiangxi Province, 2015–2024: (a) Relative humidity, (b) Hourly precipitation, (c) Temperature, (d) Surface pressure, (e) 10-m wind speed.
- 3.
- Transmission Line Characteristics, Topographic Factors, and Lightning-Induced Tripping
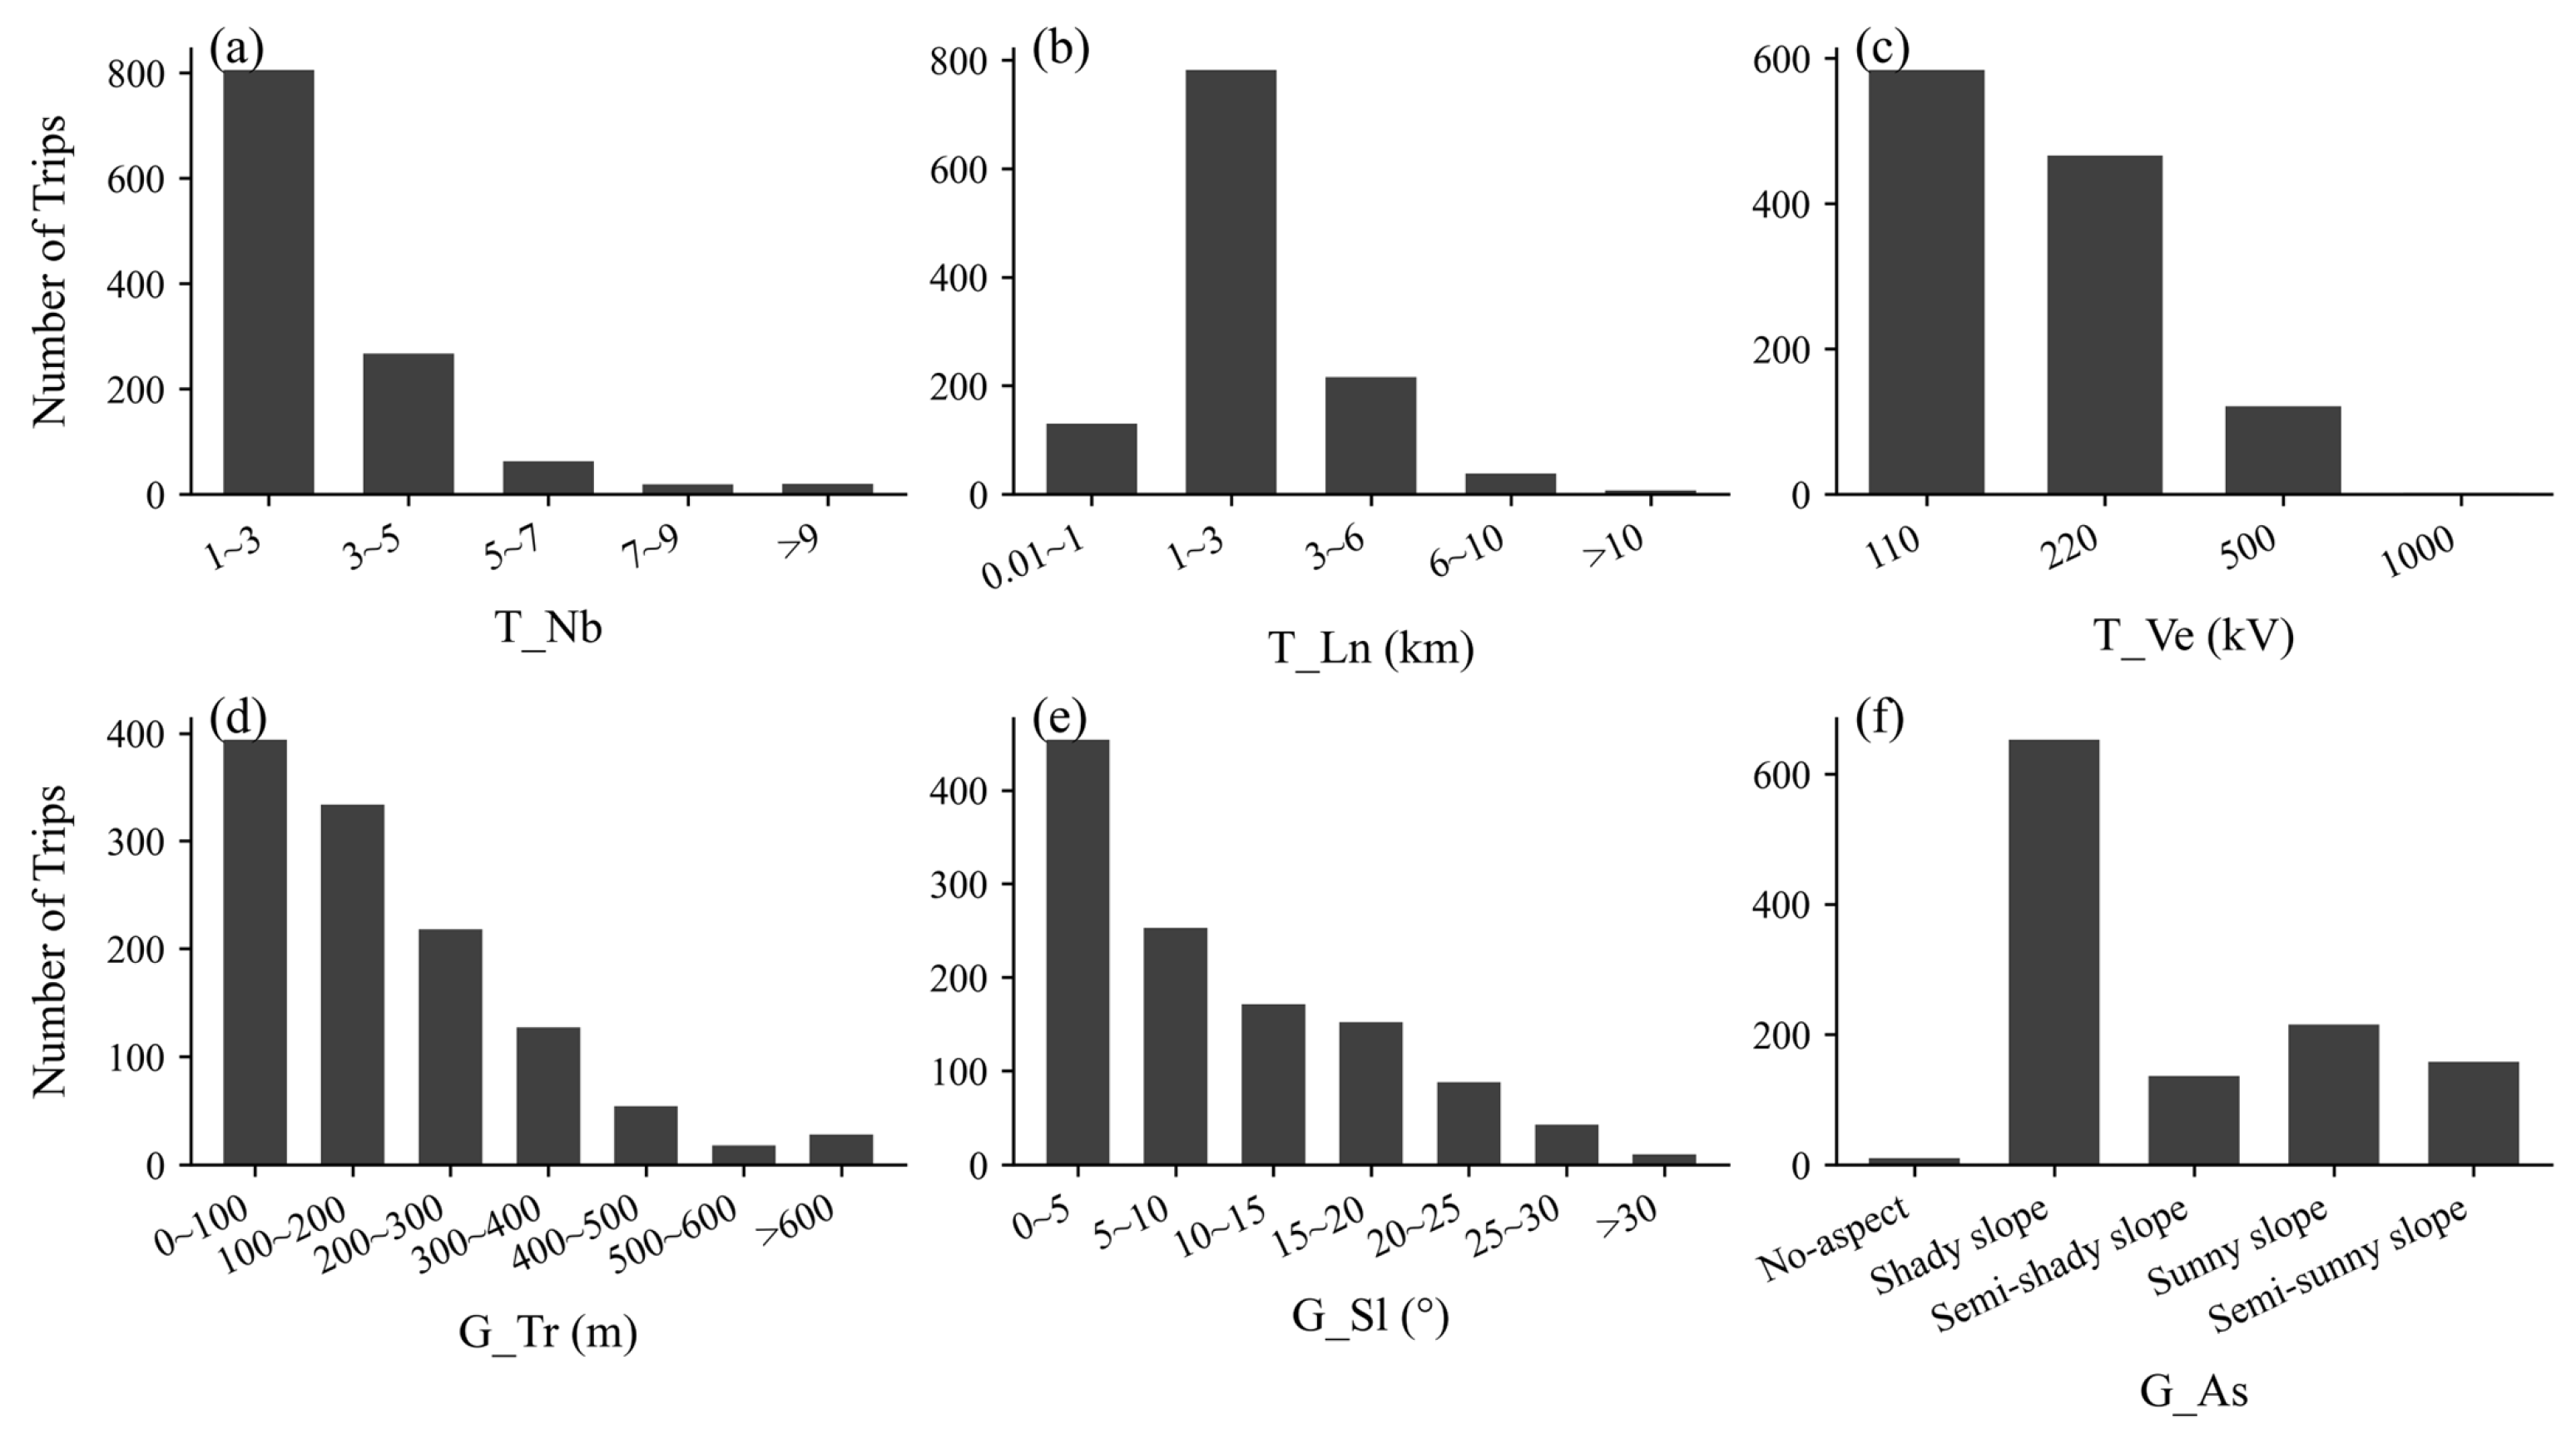
The inherent attributes of transmission lines and regional topographic conditions jointly regulate the spatial distribution pattern of lightning-induced tripping of transmission lines in Jiangxi Province (Figure 8). In terms of line characteristics, lightning-induced tripping events are mainly concentrated in the statistical ranges where T_Nb is 1–3 and T_Ln is 1–3 km. As the number of lines and cumulative line length within each unit further increase, the frequency of lightning-induced tripping shows an obvious downward trend. For T_Ve, 110 kV lines exhibit the highest count of lightning-induced tripping, followed by 220 kV lines, whereas tripping counts drop significantly for high-voltage lines of 500 kV and 1000 kV. Such differences mainly stem from distinctions in insulation configuration, tower structure, and lightning-protection design among lines of different voltage levels. High-voltage lines are generally equipped with superior lightning-protection devices that can effectively withstand most lightning surges. By contrast, 110 kV and 220 kV medium-and-low-voltage lines possess relatively limited insulation margin and are more susceptible to lightning flashover tripping [36].
Topographic conditions exert a non-negligible modulating effect on the occurrence of lightning-induced tripping [37]. According to the statistical results of elevation factor G_Tr and slope factor G_Sl, the number of lightning-induced trippings decreases continuously with rising elevation and terrain slope. High-frequency tripping samples are largely distributed over low-elevation (0–200 m) and gentle-terrain (0–10°) zones. Low-elevation gentle areas usually feature dense human settlements and power-grid facilities. Meanwhile, local thermal conditions favor the genesis of convective storms. Combined with the line exposure effect, these conditions ultimately lead to a high incidence of lightning-induced tripping.
Statistics for the aspect factor G_As indicate that the frequency of lightning-induced tripping on shaded slopes is much higher than that on semi-shaded, sun-facing, and semi-sun-facing slopes. Shaded slopes receive less solar radiation, and surface cooling facilitates the formation of local cold pools, which promote the development of convective clouds and raise lightning probability, further amplifying the lightning-failure risk for transmission lines. Summarizing the above statistical characteristics, 110 kV and 220 kV transmission lines located in low-elevation gentle-slope zones constitute the key targets for lightning-disaster prevention in Jiangxi Province.
Figure 8.
Number of lightning-induced trippings under ranges of different transmission line characteristics and topographic factors in Jiangxi Province, 2015–2024: (a) Total number of transmission lines, (b) Cumulative total line length, (c) Maximum voltage level, (d) Elevation, (e) Slope, (f) Aspect.
3.2. Risk Prediction Model for Lightning-Induced Tripping of Transmission Lines
3.2.1. Feature Selection
Previous studies have demonstrated that incorporating all feature parameters in the sample set into model construction may cause feature redundancy due to high correlations among features, while features irrelevant to lightning-induced tripping can degrade model-fitting performance [12,23,38]. Therefore, this study intends to analyze and evaluate feature importance and inter-feature correlations, followed by feature screening for preliminary modelling. The obtained model is further compared with the model trained using all features, with AUC adopted as the primary evaluation metric.
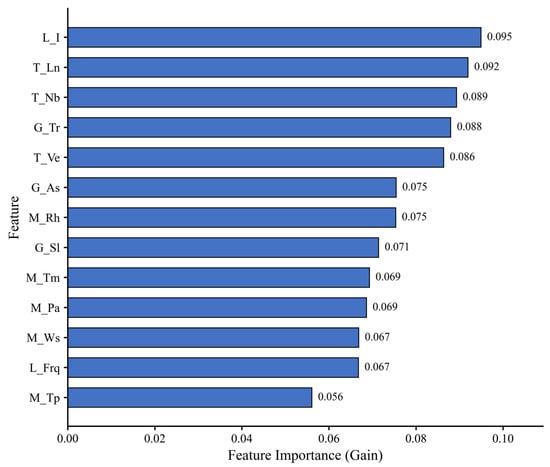
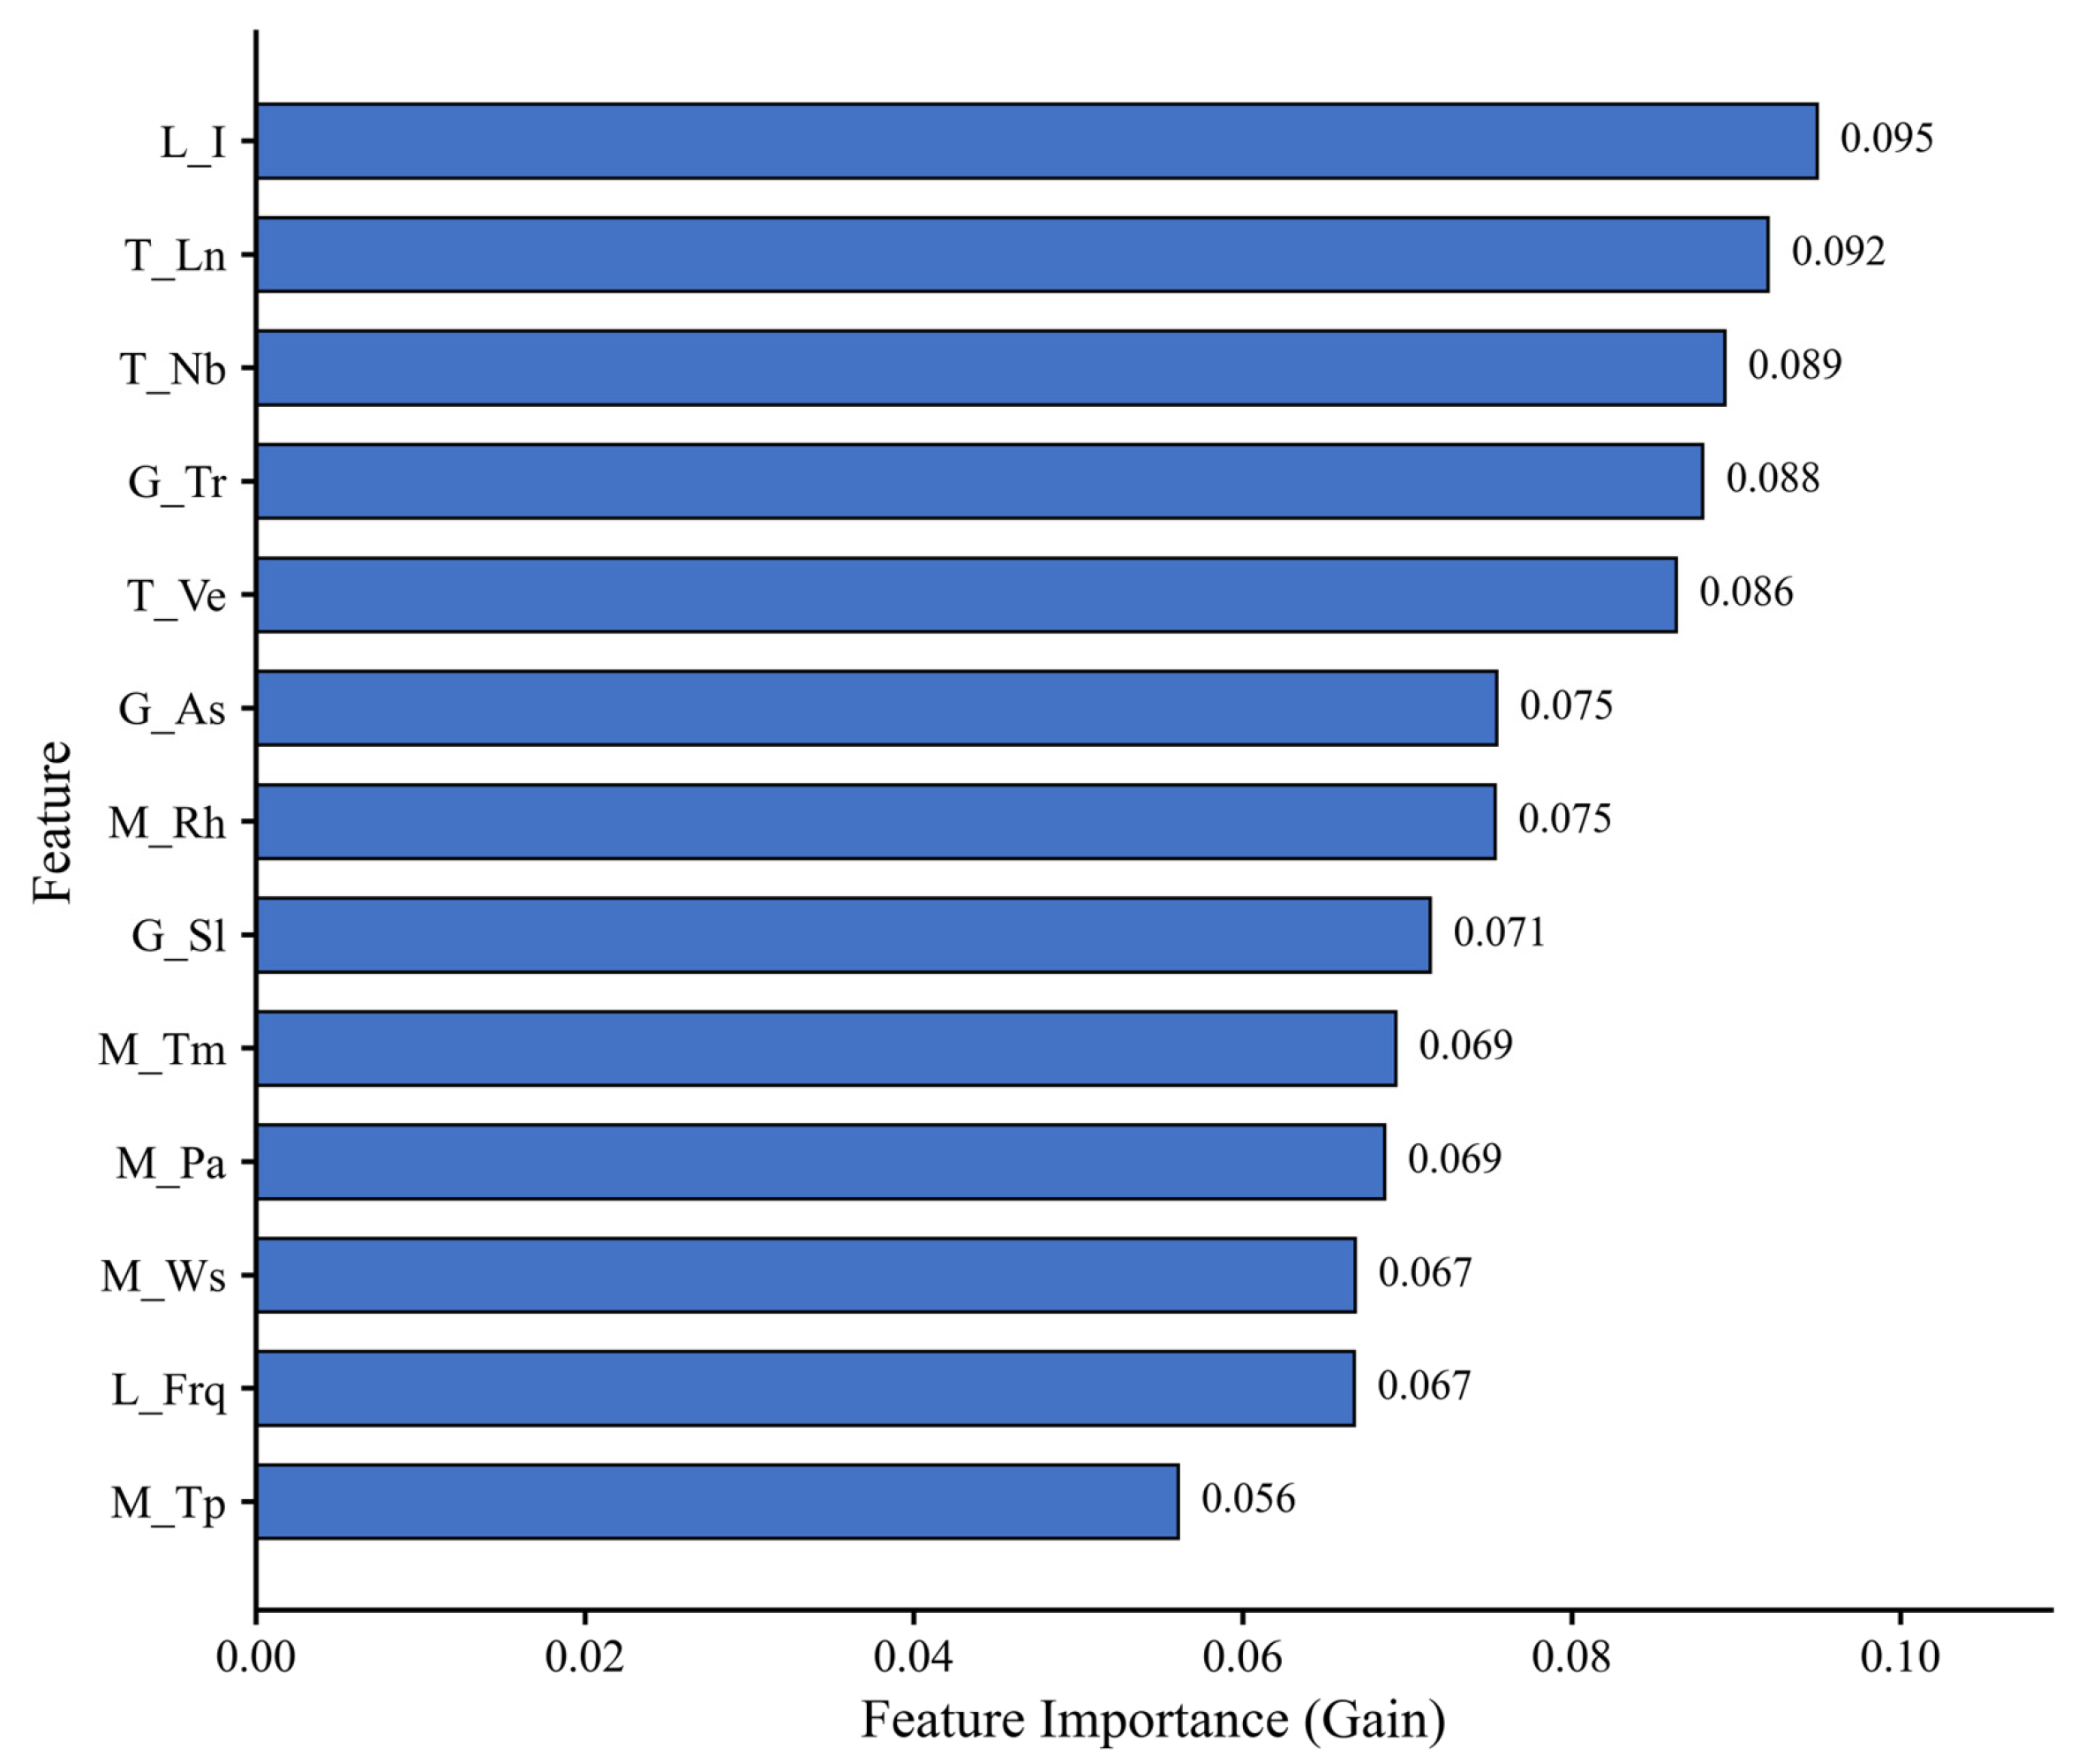
This study evaluates feature importance based on the gain metric, where feature weights are adaptively assigned during model training. Specifically, the algorithm calculates the reduction in node impurity brought by each feature split and accumulates and averages the weighted gain contributions across all decision trees to quantify the predictive significance of each feature. In short, the overall importance weight of each feature is derived from the average splitting gain over all individual trees. The calculated importance of the 13 feature parameters is shown in Figure 9. Feature importance exhibits a gradient-decreasing distribution: Lightning intensity L_I (0.095) ranks first in contribution, followed by transmission-line-related factors T_Ln, T_Nb, and T_Ve. Terrain factors G_Tr, G_As, and G_Sl constitute the second tier. Meteorological factors show generally weak contributions; relative humidity M_Rh (0.075) performs best among meteorological variables. Wind speed M_Ws and lightning frequency L_Frq yield comparable contributions, while precipitation M_Tp (0.056) has the lowest importance.
Figure 9.
Comparison of feature importance.
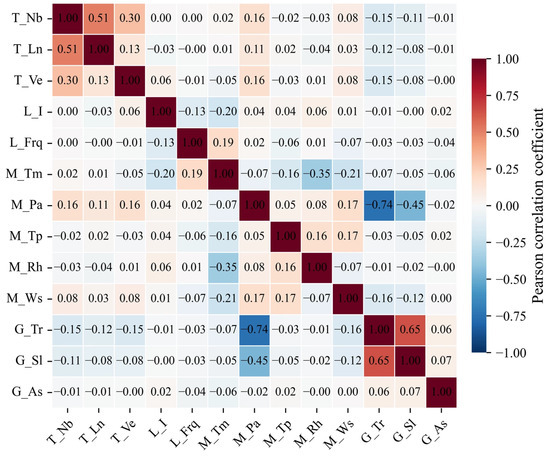
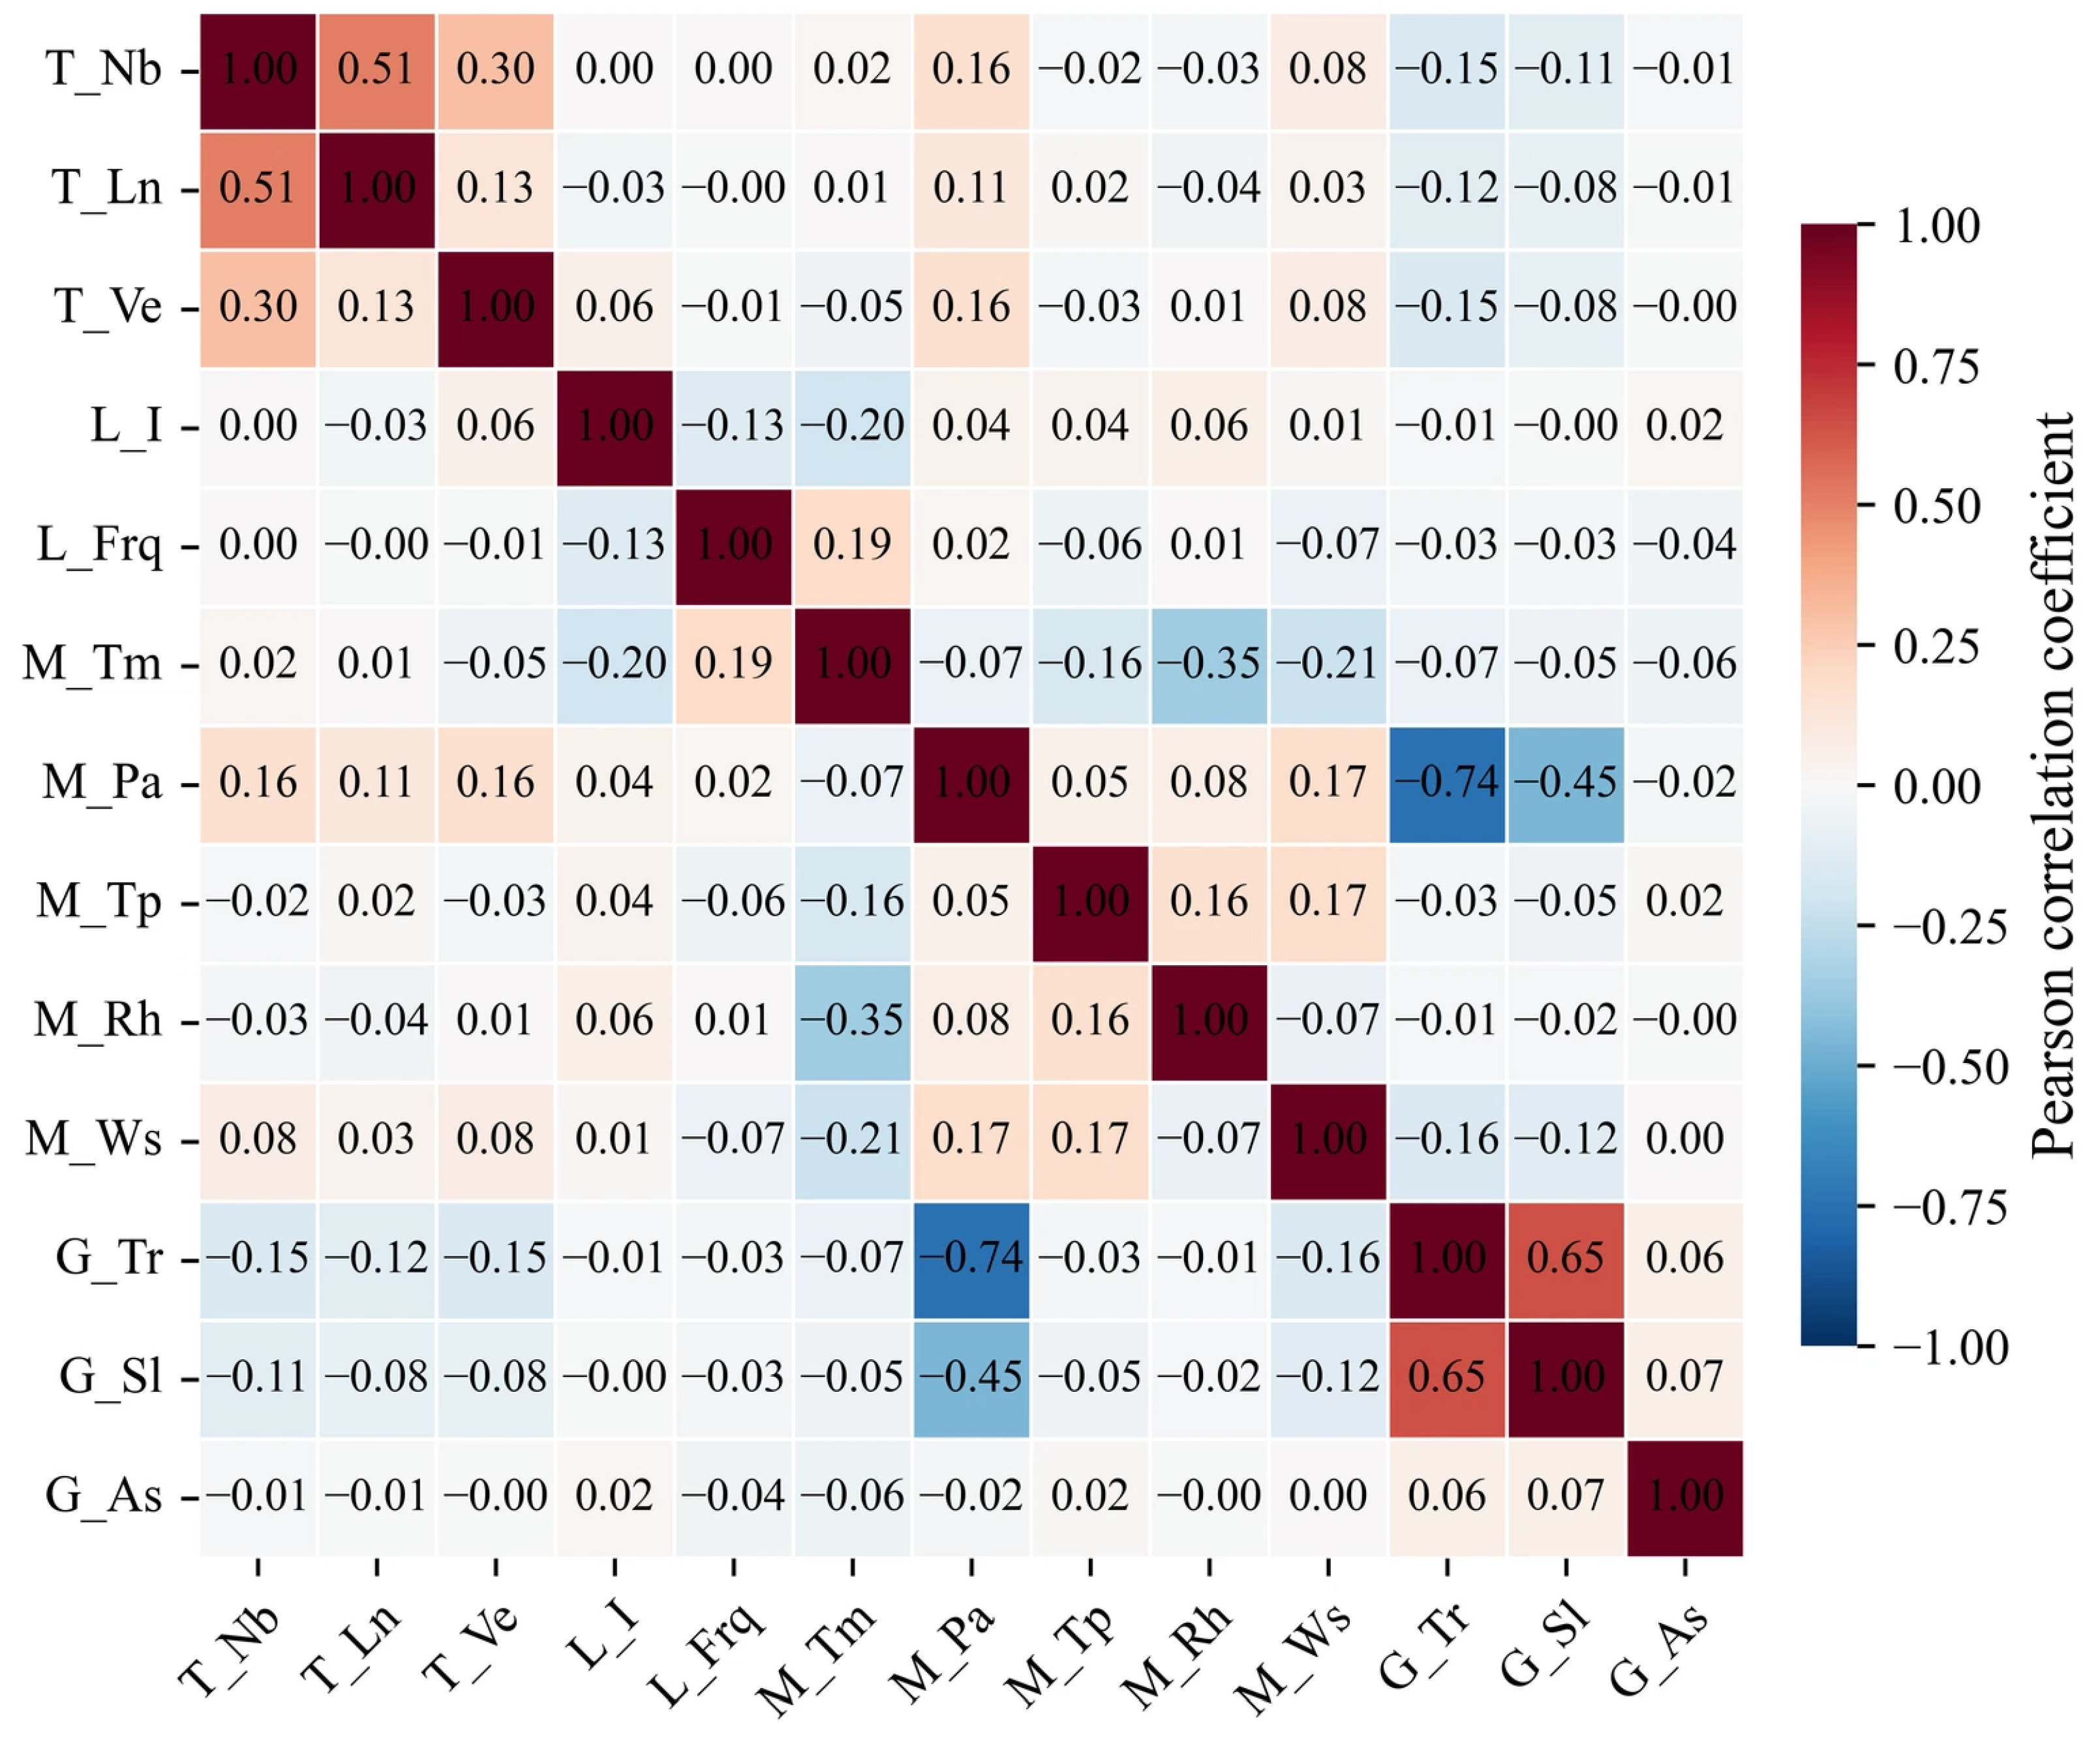
On the basis of the above analysis, Pearson correlation coefficients among all feature parameters are further calculated (Figure 10). The Pearson correlation coefficient matrix reveals two groups of strong collinear pairs in the dataset. Elevation G_Tr shows an extremely strong negative correlation with air pressure M_Pa (r = −0.74) and a significant positive correlation with slope G_Sl (r = 0.65). A moderate negative correlation is also observed between slope G_Sl and air pressure M_Pa (r = −0.45). For line-related variables, only line count T_Nb and cumulative line length T_Ln present a moderate negative correlation (r = −0.51). The absolute correlation coefficients for the remaining variable pairs are mostly below 0.3. Overall collinearity risks are concentrated in the terrain-meteorology coupling group and the line-scale group.
Figure 10.
Feature correlation matrix.
In this study, variable pairs with |r| > 0.6 are defined as strongly collinear pairs. For strongly collinear variable pairs, the variable with higher feature importance is retained while the other one is discarded. Meanwhile, the variable with the lowest global feature importance is eliminated. Finally, ten features are screened for modelling: L_I, T_Ln, T_Nb, T_Ve, G_As, M_Rh, G_Sl, M_Tm, M_Ws, and L_Frq. The elimination rules are as follows: Discard G_Tr, which is strongly correlated with G_Sl and contains redundant information; remove M_Pa, which is tightly coupled with G_Tr, and exclude M_Tp with the lowest global contribution. This feature set fully covers four dimensions: lightning activity, transmission-line attributes, terrain conditions, and meteorological environments. It avoids all strong collinear combinations, preserves high-gain predictive information while reducing model redundancy, and satisfies the input requirements of models.
Pre-modeling was performed using XGBoost, LightGBM, and CatBoost based on the 10 filtered features and the full set of 13 features, and the ROC-AUC values were compared. The results show that the ROC-AUC of the models with filtered features are 0.7140, 0.6829, and 0.7080, while the corresponding ROC-AUC of models using all features reach 0.7442, 0.7195, and 0.7359. Overall, the model constructed with the full feature set achieves better predictive performance. This is because ensemble tree models including XGBoost, LightGBM, and CatBoost exhibit strong robustness to moderately collinear features; such models can automatically weaken the interference of redundant features and effectively capture the coupled interaction information among multiple predictors. Meanwhile, the low-importance features excluded in feature screening are not entirely invalid. They carry subtle local predictive information that can complement the core features. Although feature selection eliminates feature redundancy, it inevitably leads to the loss of valid information. The adverse effect of information loss outweighs the benefits of dimension reduction and noise reduction. Consequently, modeling with all features yields superior prediction performance. Therefore, the full feature set is adopted for model construction in this study.
3.2.2. Comparison of Model Training Results
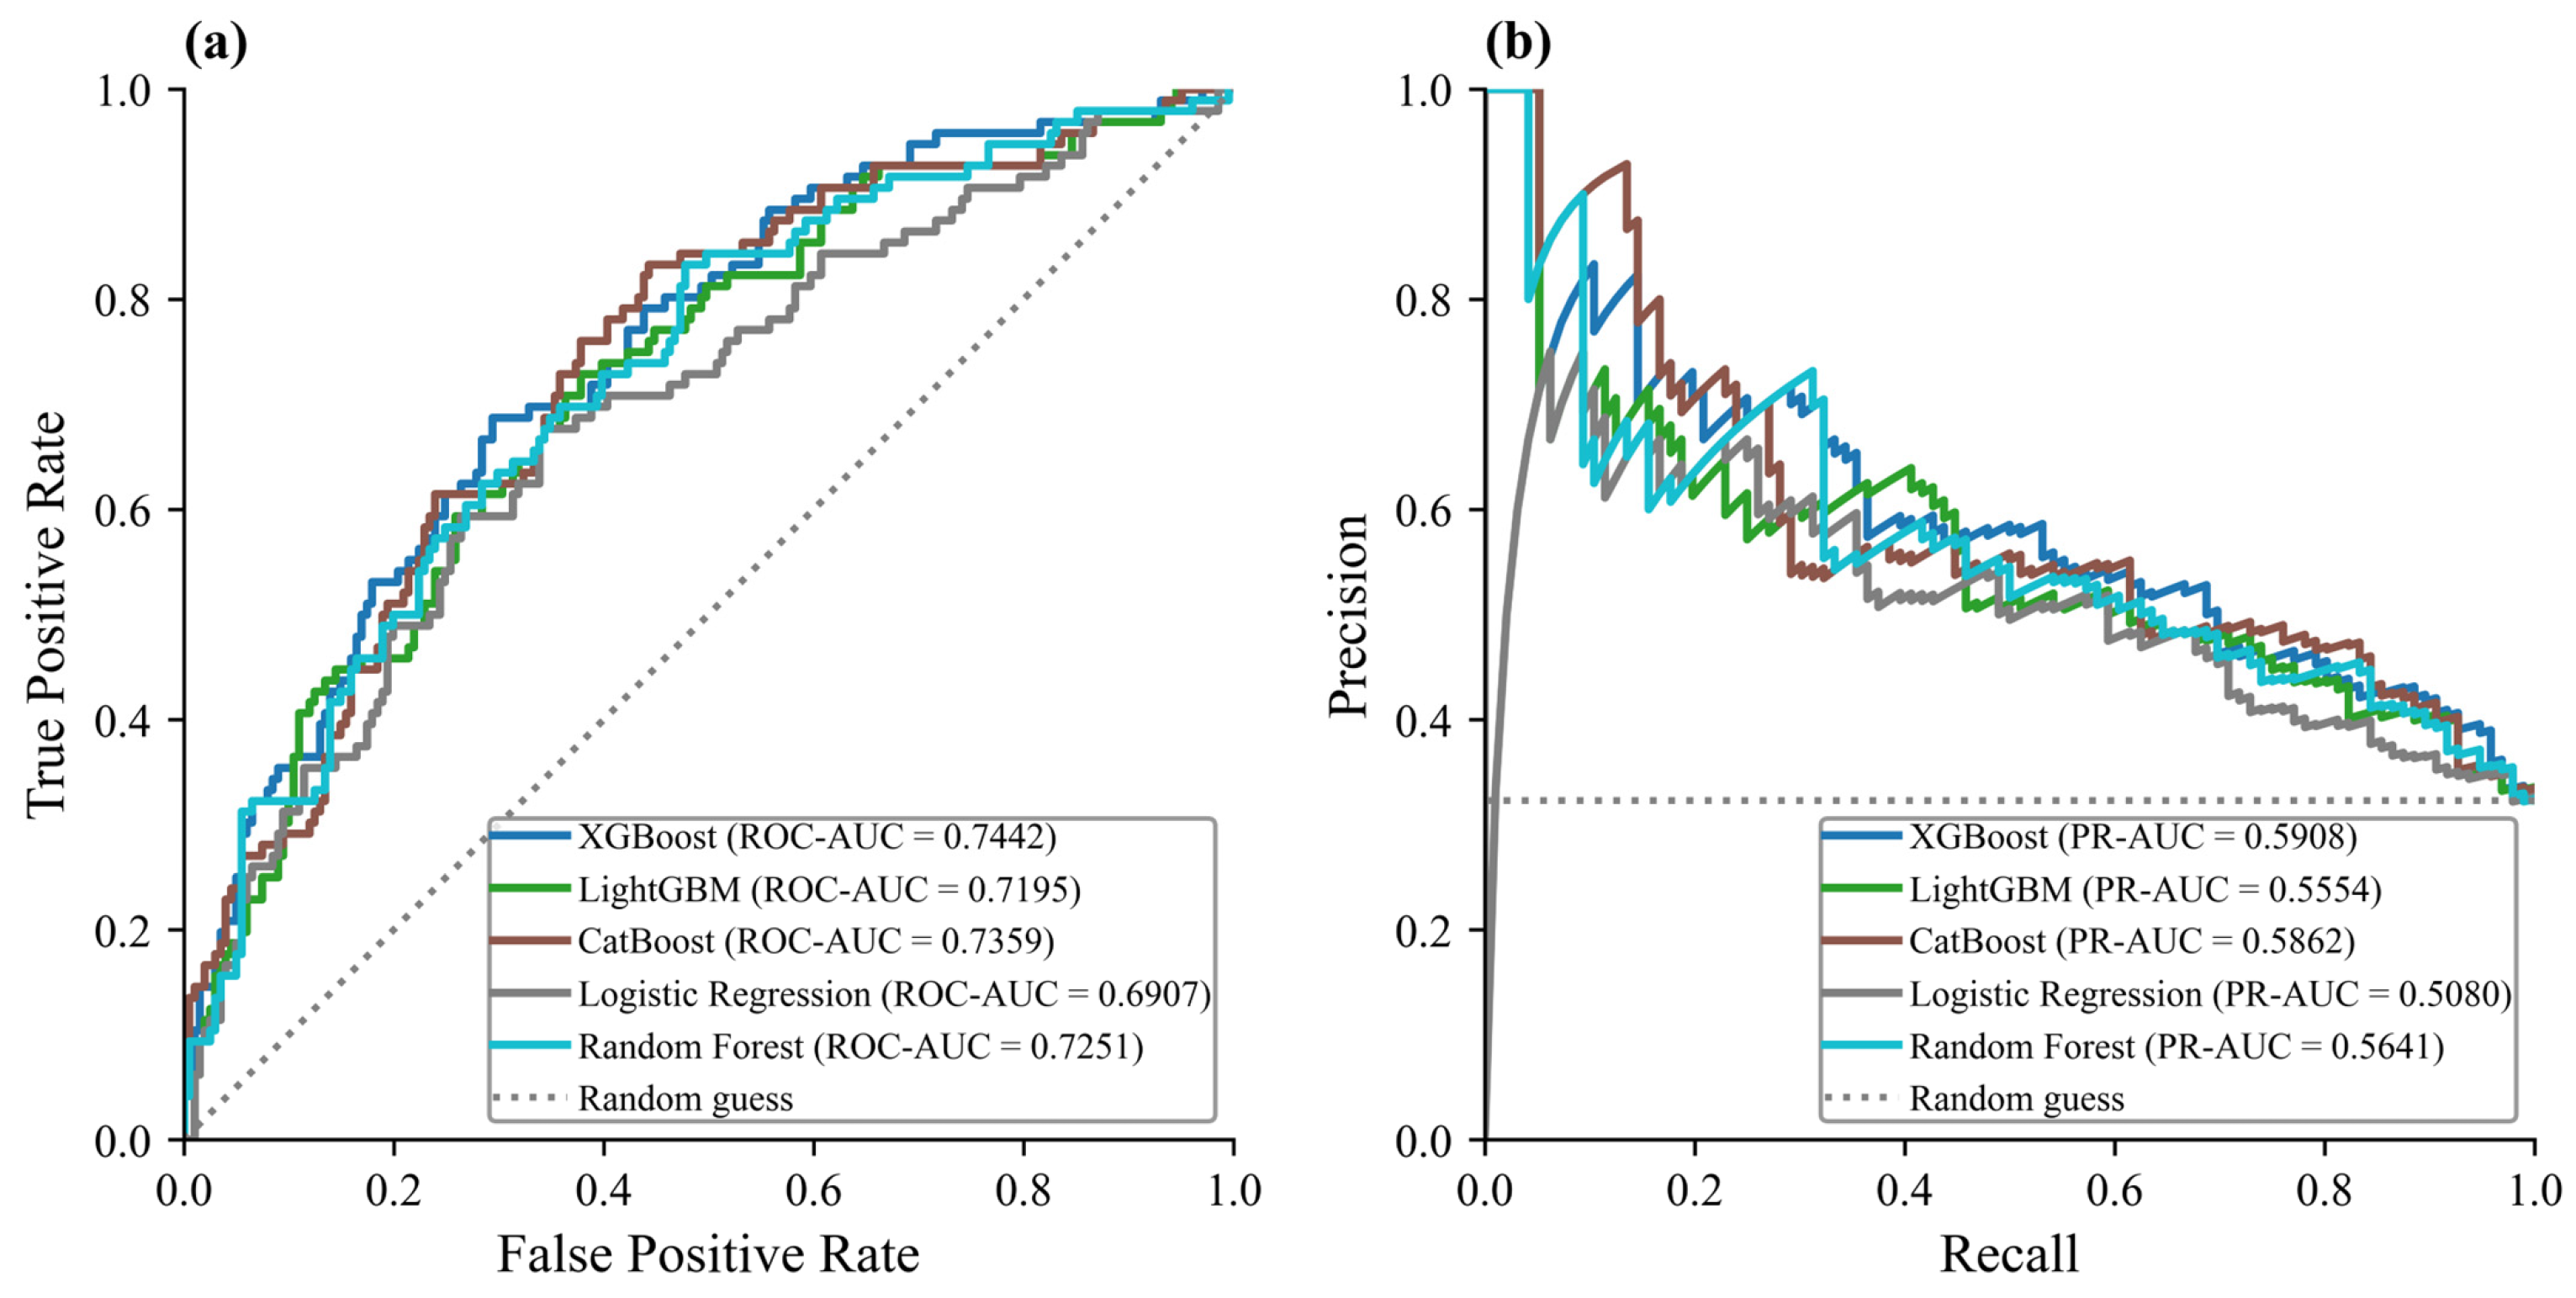
The dataset was stratified and randomly split into a training set and a test set at a ratio of 7:3. Stratified random splitting was performed based on sample labels to maintain the identical positive-to-negative sample ratio in the training and test subsets as that of the original full dataset. No temporal or geographic filtering was applied during this split, and all samples were shuffled before division. Five models, including two baseline algorithms (Logistic Regression and Random Forest) and three gradient-boosting ensemble models, namely, XGBoost, LightGBM, and CatBoost, were tuned, trained, and independently validated using the test set. All models were iterated to their optimal hyperparameters to ensure fair horizontal comparison. According to the ROC curves (Figure 11a), the ROC-AUC values of the five models have the following order: XGBoost (0.7442) > CatBoost (0.7359) > Random Forest (0.7251) > LightGBM (0.7195) > Logistic Regression (0.6907). All five curves lie distinctly above the random-guess baseline, demonstrating that all five algorithms can effectively predict lightning-induced tripping events of transmission lines in Jiangxi Province [12,39].
The PR curves (Figure 11b) yield a generally consistent ranking in terms of PR-AUC: XGBoost (0.5908) > CatBoost (0.5862) > Random Forest (0.5641) > LightGBM (0.5554) > Logistic Regression (0.5080). All PR curves exceed the positive-sample random baseline, confirming the models’ ability to identify the minority lightning-induced tripping samples under class imbalance. XGBoost achieves the highest ROC-AUC and PR-AUC among all five models, closely followed by CatBoost. The two gradient-boosting models outperform Random Forest and the linear Logistic Regression baseline, which indicates the superiority of gradient-boosting frameworks for this lightning tripping prediction task.
Figure 11.
ROC (a) and PR (b) curves of the five models.
Further comparisons based on classification metrics show that (Table 6), for tripping fault samples (class 1), among the five models, CatBoost achieves the highest F1 score (0.5959) for tripping fault samples (class 1), while Logistic Regression and Random Forest obtain extremely high recall (0.9792 and 0.9271, respectively) but suffer from much lower precision for fault samples. Logistic Regression yields a recall of 0.9792 for class 1, yet its precision is only 0.3230, and it performs very poorly on non-tripping samples (class 0) with a precision of 0.6667 and an extremely low recall of 0.0199. Random Forest also exhibits high fault-sample recall (0.9271), accompanied by low precision (0.3708) and weak performance for class 0 samples. CatBoost achieves the highest recall of 0.7604 among the three models, exhibiting the best sensitivity for identifying scarce fault samples that are prone to omission. CatBoost yields balanced precision, recall, and F1 for non-tripping samples (class 0) and obtains the highest F1 score (0.5959) for tripping samples among all three models. XGBoost achieves a moderate recall of 0.6979 for fault samples, while LightGBM ranks the lowest in fault-sample recall (0.6771). Although XGBoost and LightGBM show competitive performance on non-tripping samples, their capacity to capture lightning-induced tripping events is inferior to CatBoost. By contrast, the two baseline models (Logistic Regression and Random Forest) sacrifice precision and the prediction performance of non-tripping samples to pursue high recall of fault samples, resulting in severe imbalance between the prediction of the two classes. Considering the ROC and PR curves, fault-sample identification capability, and overall classification balance, CatBoost was selected as the final prediction model in this study. Its advantages in detecting imbalanced fault samples, such as lightning-induced tripping, are more suitable for the practical operational requirements of power-grid lightning-protection early warning.
Table 6.
Precision, recall, and F1 score of the three models.
We further adopted a climatological-statistical baseline (climatological forecast) for reference, which assigns risk values based on historical tripping frequency within corresponding spatiotemporal bins. With the same 7:3 train–test split, it achieves ROC-AUC = 0.6112 and PR-AUC = 0.5227. All five machine learning models surpass this baseline, confirming the benefits of multi-source feature-driven prediction.
Direct quantitative comparison with the physical electro-geometric model (EGM) is not feasible here, since EGM requires tower-specific fine engineering parameters unavailable for our province-wide regional-scale assessment. Although key EGM-related factors are included in our model inputs, full EGM implementation and benchmarking cannot be completed in this study. Future work using tower-level engineering data may realize direct comparisons between data-driven models and physical EGM simulations.
3.2.3. Prediction Results of Lightning-Induced Tripping Risk for Transmission Lines
CatBoost adopted in this study is a tree-based ensemble learning algorithm under the gradient-boosting framework. It iteratively trains a set of Classification and Regression Trees (CARTs), and the final prediction result is obtained by summing the outputs of multiple decision trees. For the binary-classification task of lightning-induced tripping prediction, the logistic loss function is adopted. To mitigate prediction shift caused by categorical features, CatBoost implements ordered boosting and ordered target statistics during model training. Meanwhile, regularization terms are introduced to constrain tree complexity and reduce model overfitting. Each individual decision tree outputs raw scores. After summing the raw scores from all trees, the sigmoid activation function maps the aggregated value to the range of 0–1, yielding the risk probability p of lightning-induced tripping for a given sample. The calculation formula is expressed as
where K denotes the total number of decision trees; fk(x) represents the leaf-node score output by the k-th decision tree for the input feature vector x; p ∈ [0, 1], and a value closer to 1 indicates a higher risk of lightning-induced tripping of transmission lines. Rather than directly outputting class labels, such probabilistic output enables the quantification of lightning-induced tripping risk levels and provides a continuous risk indicator for the fine-scale risk assessment of transmission-line lightning hazards.
Referring to the probabilistic risk classification paradigm proposed by Fan, et al. [24], the thresholds were determined in combination with the operational requirements of transmission-line lightning early warning in China. The classification criteria for lightning-induced tripping probability are listed in Table 7.
Table 7.
Risk-level classification of transmission-line lightning-induced tripping.
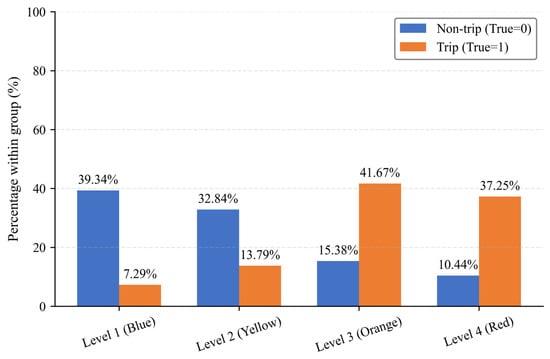
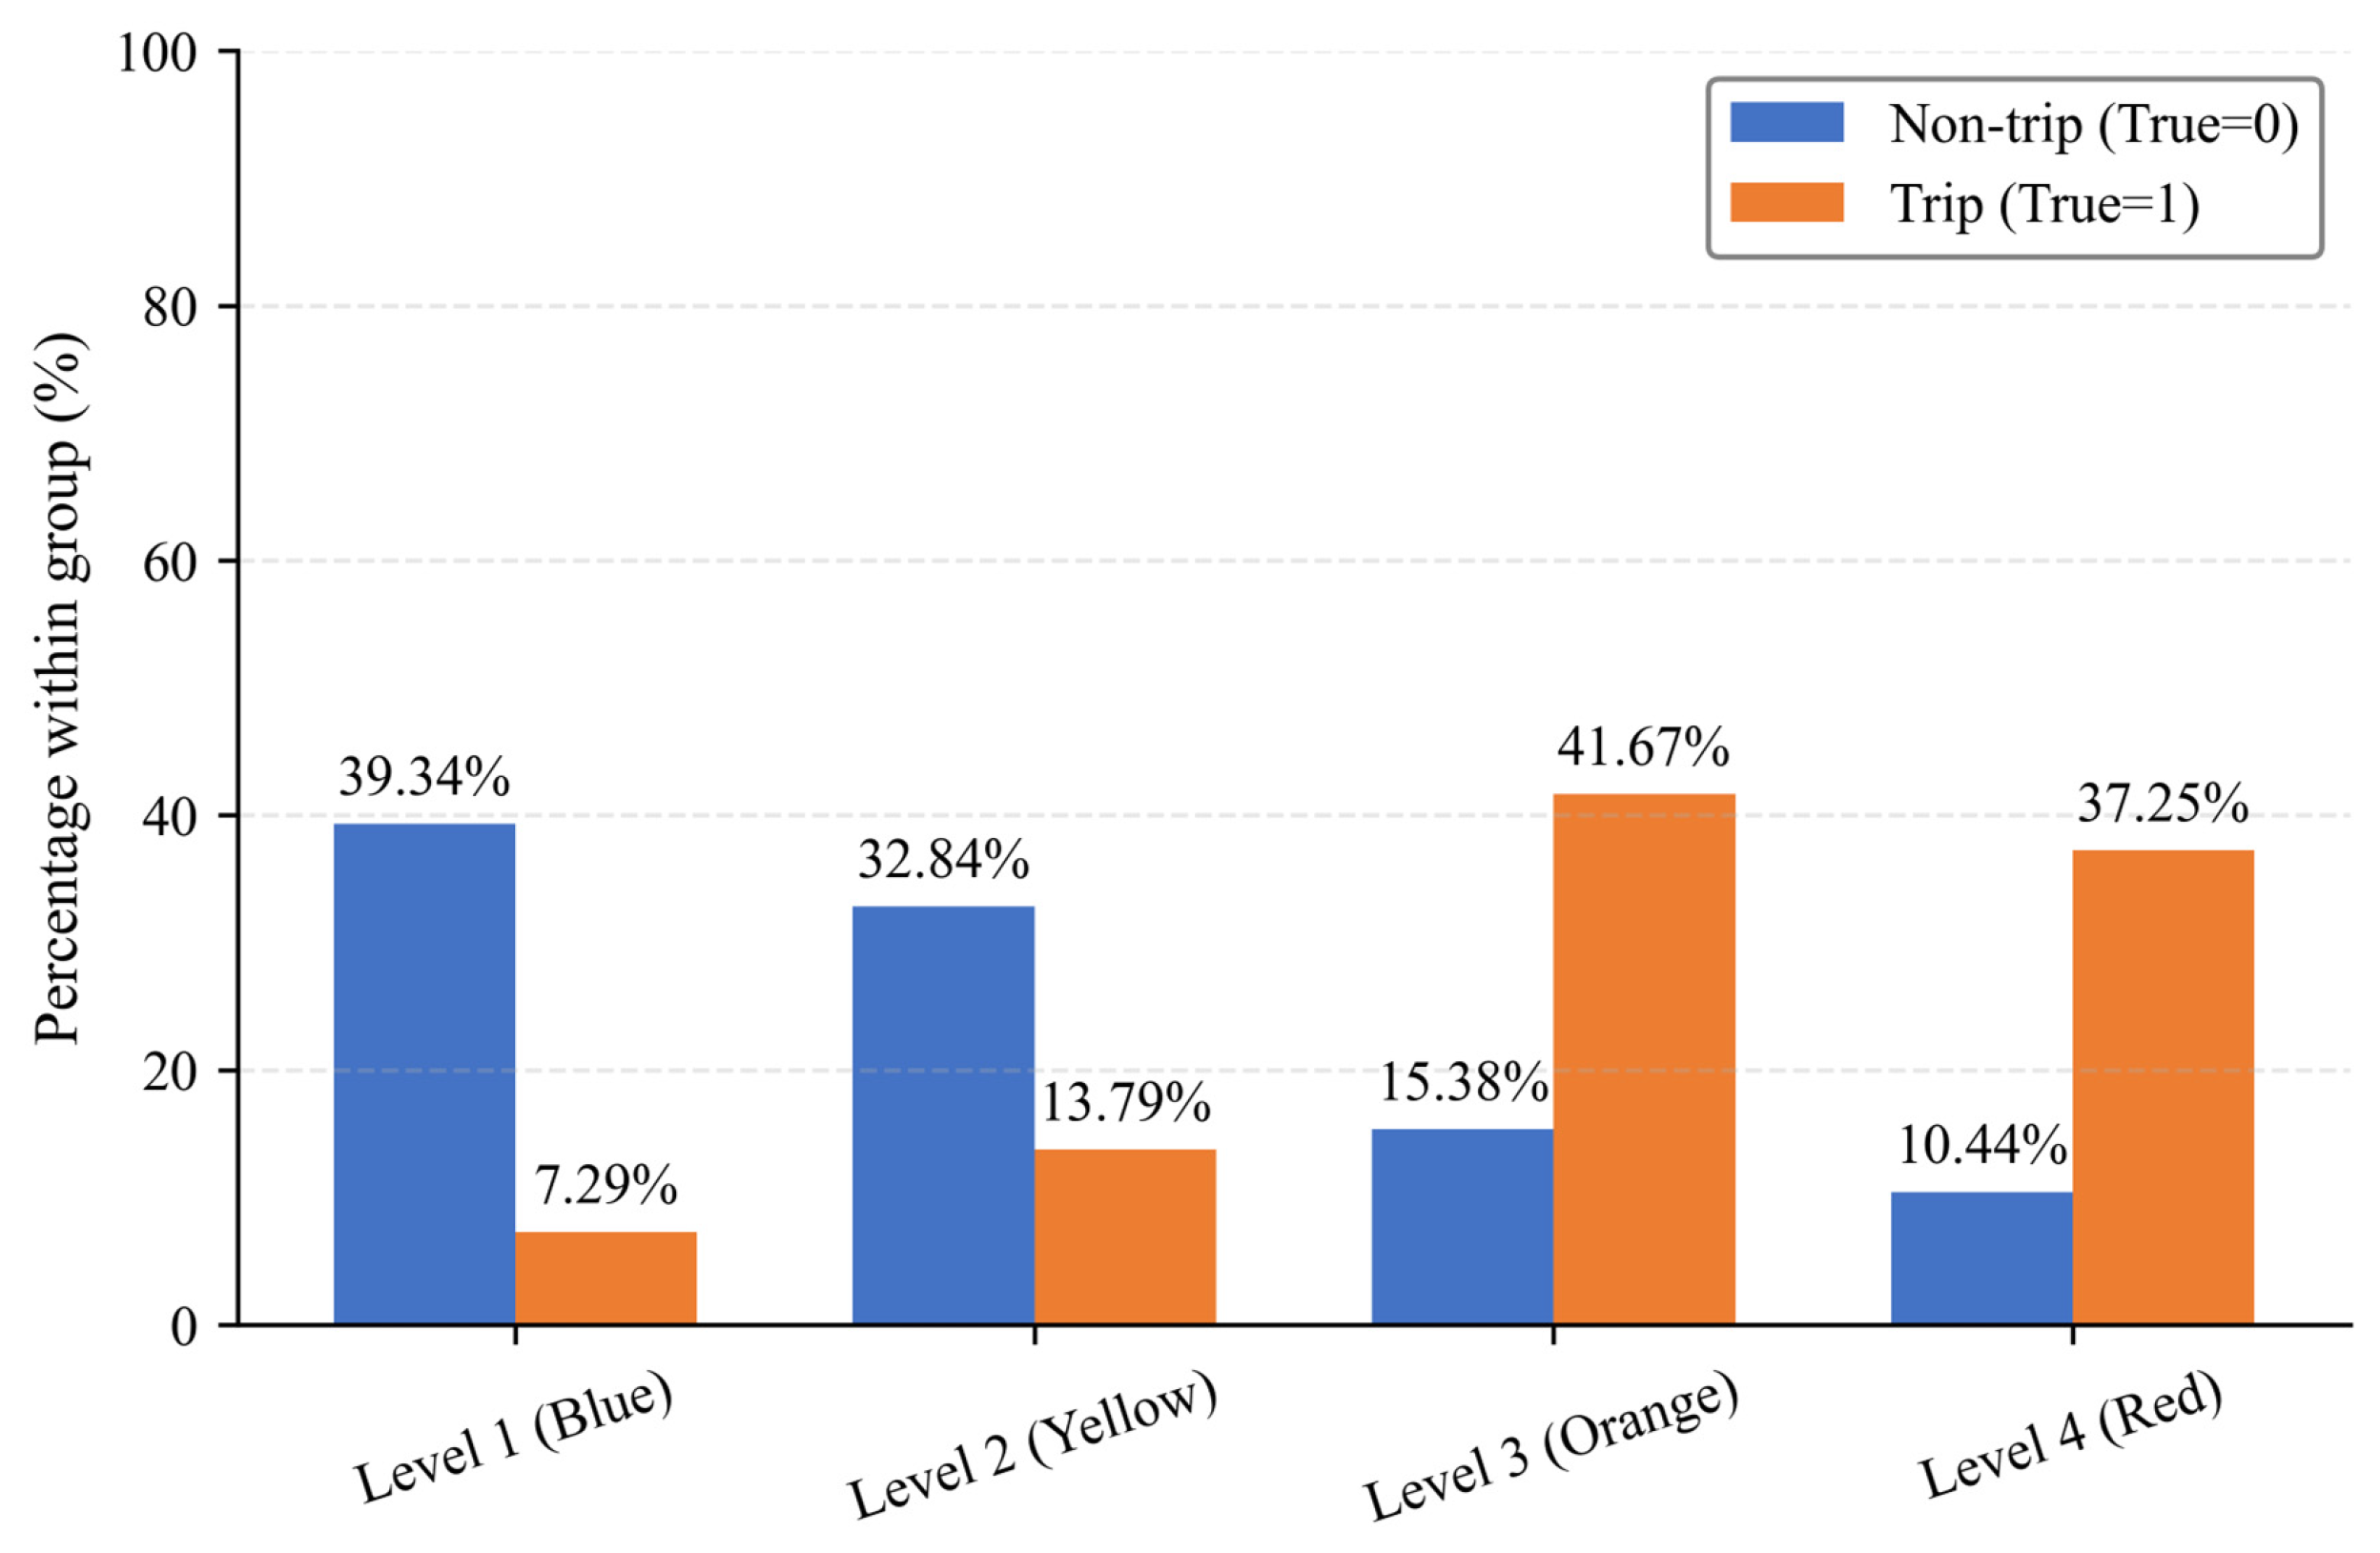
Figure 12 illustrates the proportion of true tripping and non-tripping samples distributed across four risk levels predicted by the CatBoost model on the held-out test set. For non-tripping samples (True = 0), the majority are assigned to low- and moderate-risk grades: 39.34% fall into Level 1 (blue, low risk) and 32.84% into Level 2 (yellow, moderate risk), while only 10.44% are classified as Level 4 (red, high risk). In contrast, actual tripping samples (True = 1) are predominantly concentrated within the high-risk categories: 41.67% in Level 3 (orange, relatively high risk) and 37.25% in Level 4 (red, high risk). In total, 78.92% of real tripping samples are predicted as Level 3 or Level 4, and 72.18% of non-tripping samples are assigned to Level 1 or Level 2. This clear separation in distribution demonstrates that the model can effectively distinguish lightning-induced tripping hazards.
Figure 12.
Risk-level percentage distribution of tripping and non-tripping test samples predicted by CatBoost.
To further verify the model’s accuracy, two case dates (19 April and 21 April 2025) were selected, on which four and six lightning-induced tripping events occurred on transmission lines of 110 kV and above in Jiangxi Province, respectively. All ten actual tripping locations and 100 randomly sampled locations with lightning occurrences but no tripping were adopted for validation. The predicted lightning-induced tripping risks of the ten tripping points from the CatBoost model are presented in Table 8. According to the prediction results, most historical real-world tripping samples fell within the risk probability range of 0.40–0.80 (Risk Level 3, orange), covering six locations. Two locations yielded predicted probabilities higher than 0.80 (Risk Level 4, red), and the remaining two locations had probabilities below 0.40 (Risk Level 2, yellow).
Table 8.
Predicted tripping risks for ten lightning-induced tripping points.
Such inconsistent prediction results are primarily caused by the stochastic uncertainty of lightning-induced tripping accidents. Most actual tripping samples were classified as relatively high risk or higher by the model, indicating that the model can effectively identify locations prone to historical lightning-induced tripping. Notably, a small number of real tripping points were categorized as moderate-risk. This reflects that lightning-induced tripping is a low-probability stochastic event; even when comprehensive risk conditions are not prominent, extreme local convection and accidental lightning strikes can still trigger tripping failures [12]. Overall, the continuous risk probabilities output by the model show good agreement with actual tripping events.
Statistical results of risk-probability predictions for 100 historical non-tripping points are shown in Table 9. Among all 100 non-tripping samples, 39 were predicted as Level 1 (low risk), and 33 belonged to Level 2 (moderate risk), jointly accounting for 72% of the total samples. In addition, 20 and eight non-tripping points fell into Level 3 (relatively high risk) and Level 4 (high risk), respectively, accounting for only 28% of all samples. Most non-fault points were classified as low-to-moderate risk levels, demonstrating the model’s reliable ability to identify low-susceptibility line segments.
Table 9.
Predicted tripping risks for one hundred non-lightning-induced-tripping points.
The relatively high predicted risk of partial non-tripping samples is also reasonable due to the physical randomness of lightning disasters. Although some points possess favorable environmental conditions for tripping, including lightning activity, meteorological factors, and topographic features, actual tripping failures did not occur due to the absence of effective lightning strikes [12]. Combining the prediction performance for both tripping and non-tripping samples, the proposed CatBoost model can effectively identify potential high-risk fault locations while maintaining satisfactory discrimination ability for safe samples.
4. Discussion
4.1. Discussion of Modeling Results
This study analyzes the multi-factor driving mechanism of lightning-induced tripping on transmission lines based on multi-source heterogeneous datasets. Two baseline models (Logistic Regression and Random Forest) and three gradient-boosting ensemble models, namely, XGBoost, LightGBM, and CatBoost, are compared, and a prediction framework for lightning-induced tripping risk that outputs continuous risk probabilities is constructed. The results reveal that lightning parameters, inherent attributes of transmission lines, topographic conditions, and local meteorological environments jointly shape the spatiotemporal distribution of lightning-induced tripping, which is generally consistent with findings from existing studies on power-grid lightning faults [12,28].
In this study, feature contribution scores are defined based on the gain-based feature importance, which quantifies the total reduction in prediction loss contributed by each feature during model training. According to the gain-based feature contribution results, lightning current intensity, cumulative line length, and line count present the highest predictive contributions to lightning-induced tripping. Notably, the high importance of cumulative line length and line count does not represent a direct physical triggering effect of lightning tripping. Instead, these two line attribute variables primarily reflect the infrastructure exposure level: Regions with longer cumulative line length and denser line layouts possess higher grid exposure probability, thereby increasing the statistical likelihood of lightning stroke contact and subsequent tripping accidents. This indicates that, besides lightning activity itself, the exposure level of power-grid infrastructure exerts non-negligible modulating effects on tripping risk. In contrast, the individual contribution of meteorological factors is relatively limited, suggesting that lightning-induced tripping represents a complex multi-factor coupled event that cannot be fully explained by any single meteorological variable [36]. We note that low individual gain importance of meteorological variables cannot rule out their combined interactive effects; meteorological factors may jointly function via feature interactions even when single-variable contributions are limited.
In terms of model comparison, CatBoost achieves the best comprehensive performance, with ROC-AUC = 0.7442, PR-AUC = 0.5908, fault sample precision of 0.4899, and recall of 0.7604. It exhibits superior sensitivity for identifying minority tripping samples and is more suitable for imbalanced lightning-induced tripping prediction tasks. Although LightGBM has advantages in training efficiency and XGBoost shows competitive discrimination ability, both models exhibit lower sensitivity for identifying minority fault samples compared with CatBoost. It should be noted that the model achieves a moderate AUC value according to Table 3, and the relatively low precision leads to a high false alarm rate. This is an inherent limitation for extremely imbalanced fault prediction tasks. In such scenarios, improving recall to capture rare tripping events inevitably sacrifices precision; this precision–recall tradeoff cannot be easily eliminated only by replacing or tuning algorithms.
Validation results on the test set and at the individual-case scale show that some real tripping samples are only classified into low and moderate risk levels, whereas several non-tripping samples obtain relatively high predicted risk values. This observation confirms the stochastic nature of lightning-induced tripping: risk models describe potential occurrence probabilities rather than deterministic fault outcomes. Even under moderate comprehensive environmental risk, an accidental lightning strike can still trigger tripping; conversely, faults will not occur without actual lightning strokes despite high-risk environmental conditions [24]. This understanding is critical for clarifying the role of machine learning in power-grid disaster risk assessment. Models should serve as auxiliary tools for risk analysis rather than definitive fault-judgement instruments [14].
It should be noted that this study does not perform additional probability calibration on the predicted risk outputs. Model discrimination (evaluated by ROC-AUC and PR-AUC in this work) and probability calibration are two distinct evaluation dimensions: good discrimination indicates that the model can separate tripping and non-tripping samples well, while well-calibrated probabilities mean that the predicted risk values are statistically consistent with the real occurrence frequency of lightning-induced tripping. High discrimination performance does not guarantee well-calibrated predicted probabilities. Therefore, in future studies, calibration approaches such as Platt scaling can be adopted to further refine the output risk probabilities and improve the reliability of quantitative risk estimation. It is worth noting that the predicted risk represents the conditional probability of line tripping given lightning events, rather than the probability of lightning occurrence. Note that machine learning results reflect statistical predictive associations rather than strict causal proofs.
Although this study builds models by taking Jiangxi Province as a typical case, the complete data-analysis workflow, feature-selection strategy, multi-factor interpretation paradigm, and risk-classification method have cross-regional reference value. They can provide a reusable technical framework for lightning risk assessment of transmission lines in global subtropical hilly–mountainous transition zones [4,25]. Such regional transferability is premised on similar climatic features, terrain conditions, and power grid operational characteristics among target regions. Numerous high-voltage transmission corridors worldwide are located in humid subtropical hilly regions and face similar threats from severe convective lightning. The modeling workflow proposed in this study, which integrates lightning location observations, high-resolution merged meteorological products, DEM terrain data, and power-grid vector datasets, can be transferred to other regions with comparable data sources. Nevertheless, directly transferring the trained XGBoost model parameters without fine-tuning to other provinces or countries is not recommended. This study clearly distinguishes the transferable modeling methodology from the non-transferable trained model parameters. The analytical workflow and feature engineering strategy are generalizable, while the trained model parameters are region-specific. Due to regional differences in lightning climate, power-grid insulation criteria, and topographic backgrounds, it is suggested to adopt an identical feature-engineering pipeline and retrain or perform transfer fine-tuning using local samples [19,].
4.2. Limitations and Future Work
Several key limitations remain in this work. First, negative samples in this study are obtained via spatiotemporal random sampling. More advanced resampling algorithms can be adopted in future research to mitigate potential biases induced by sample imbalance [23]. Simple spatiotemporal random sampling may introduce slight sampling bias due to uneven spatial and temporal lightning distributions. In addition, stratified random sampling was strictly adopted for train–test splitting to guarantee consistent positive/negative sample ratios across datasets and ensure valid model evaluation. Second, fine-scale engineering parameters such as tower grounding resistance and shielding-wire configuration are not included among input features, constrained by the accessibility of public operational datasets. Third, model validation mainly relies on offline tests with historical samples, lacking long-term online real-time early-warning operational verification. Future work can incorporate forecast-driven meteorological data to extend the framework toward short-term dynamic lightning risk early warning. Fourth, the model presents a relatively high false alarm rate caused by dataset imbalance, which restricts direct deterministic fault judgement. Current model predictions contain inherent stochastic uncertainty caused by random lightning strike behavior. Nevertheless, the graded risk results can still provide effective decision support for power grid maintenance scheduling and regional lightning disaster early warning. Meanwhile, explainable artificial intelligence (XAI) tools can be introduced to further disentangle the nonlinear response relationships between individual factors and tripping probability [40]. Future work can incorporate forecast-driven meteorological data to extend the framework toward short-term dynamic lightning risk early warning and adopt probability calibration or additional feature engineering to reduce false alarms.
5. Conclusions
(1) A total of 1173 lightning-induced tripping events were recorded on 110 kV and above transmission lines in Jiangxi Province from 2015 to 2024. Lightning-induced tripping exhibited a spatial pattern of multi-center agglomeration across inland areas. Temporally, tripping events concentrated in the flood season from March to September and showed a single-peak diurnal pattern in the afternoon. Regional lightning was overwhelmingly dominated by weak-to-moderate lightning with peak currents of 0–40 kA, which triggered 94.7% of all tripping failures. Although positive lightning accounted for a low overall proportion, its contribution to tripping increased within the high-current range above 40 kA.
(2) Lightning-induced tripping is driven by the coupled effects of multiple factors including lightning activity, meteorological conditions, transmission-line attributes and topography. Lightning current intensity, cumulative line length, and line count ranked high among all predictive factors. Topographic effects of elevation, slope gradient, and slope aspect were remarkable; 110 kV and 220 kV lines located in low-elevation gentle-slope zones were high-risk targets for lightning hazards. Variables were screened, analyzed, and compared based on feature importance and Pearson correlation coefficients, and all 13 input features were finally selected.
(3) Among all compared approaches, the gradient-boosting tree models outperform baseline methods. Considering comprehensive metrics including ROC-AUC, PR-AUC, F1 score, and classification balance for imbalanced samples, CatBoost was selected as the final prediction model. A four-level risk classification system for lightning-induced tripping was established using continuous 0-to-1 probability outputs from this model. Test-set validation shows that a total of 78.92% of real tripping samples are predicted to be at relatively high risk or higher, and 72.18% of non-tripping samples fall into low-to-moderate risk levels. Further case validation demonstrates that 80% of historical tripping samples are classified as relatively high risk or higher, and 72% of non-tripping samples are categorized as low-to-moderate risk. Partial mismatches between predicted results and actual observations reflect the inherent low-probability stochastic nature of lightning-induced tripping.
(4) The complete analytical framework constructed in this study, consisting of multi-source data fusion, feature selection, ensemble modelling, and probabilistic risk classification, can provide technical support for lightning-protection operation and maintenance of the Jiangxi power grid and deliver a reusable paradigm for lightning risk assessment of transmission lines in other subtropical hilly regions. For similar regions, it is recommended to prioritize integrating multi-source datasets of lightning location, high-resolution meteorological grids, power-grid information, and topographic data; implement feature engineering with rigorous multicollinearity tests; and adopt gradient-boosting tree models to produce probabilistic risk outputs for supporting differentiated lightning-protection planning. Future studies are suggested to incorporate tower engineering parameters, develop short-term dynamic early-warning systems using forecast meteorological data, and employ explainable AI to further reveal the nonlinear effects of driving factors.
Author Contributions
Conceptualization, H.L. and J.W. (Jianming Wu); methodology, H.L. and J.H.; software, H.L. and J.H.; validation, H.L., S.H., and S.W.; formal analysis, H.L. and J.H.; investigation, J.C. and J.W. (Jiahui Wan); resources, S.H. and J.C.; data curation, H.L. and J.W. (Jiahui Wan); writing—original draft preparation, H.L. and J.H.; writing—review and editing, J.W. (Jianming Wu) and J.H.; visualization, H.L. and J.H.; supervision, J.W. (Jianming Wu); project administration, S.H.; funding acquisition, J.W. (Jianming Wu). All authors have read and agreed to the published version of the manuscript.
Funding
This research was funded by State Grid Jiangxi Electric Power Co., Ltd., grant number 52182025000G.
Data Availability Statement
The data that support the findings of this study are available from State Grid Jiangxi Electric Power Co., Ltd. Restrictions apply to the availability of these data, which were used under license for this study. Data are not publicly available.
Acknowledgments
The authors appreciate the financial support provided by State Grid Jiangxi Electric Power Co., Ltd. and the technical support provided by Jiangxi Meteorological Service Center.
Conflicts of Interest
Author Haoshuang Liao was employed by State Grid Jiangxi Electric Power Research Institute; Shenbing Hua was employed by State Grid China Electric Power Research Institute; Jian Chen was employed by Nanjing NARI Water Resources and Hydropower Technology Company Limited; Shijun Wang was employed by Gansu Electric Power Corporation, State Grid. The remaining authors (Jianlin Hu, Jianming Wu, and Jiahui Wan) declare that the research was conducted in the absence of any commercial or financial relationships that could be construed as a potential conflict of interest. The authors declare that this study received funding from State Grid Jiangxi Electric Power Co., Ltd. The funder was not involved in the study design; collection, analysis, and interpretation of data; the writing of this article; or the decision to submit it for publication.
References
- Huo, H.; Wang, D.; Chen, H.; Zhao, C.; Cheng, Q. Considering the methods of lightning protection and early warning for power transmission lines based on lightning data analysis. IEEE Access 2024, 12, 54168–54181. [Google Scholar] [CrossRef] [Scilit]
- Tarko, R.; Gajdzica, J.; Nowak, W.; Szpyra, W. Study of the lightning overvoltage protection effectiveness of high voltage mixed overhead cable power lines. Energies 2021, 14, 2329. [Google Scholar] [CrossRef] [Scilit]
- Christodoulou, C.; Ekonomou, L.; Fotis, G.; Harkiolakis, N.; Stathopulos, I. Optimization of Hellenic overhead high-voltage transmission lines lightning protection. Energy 2009, 34, 502–509. [Google Scholar] [CrossRef] [Scilit]
- Wan, Z.; Fu, L.; Du, Z.; Chen, Z.; Liu, C.; Zhu, Y.; Ma, X. Refined risk assessment and differentiated protection of lightning damage in distribution network lines considering the underlying surface environment. Front. Energy Res. 2024, 12, 1308200. [Google Scholar] [CrossRef] [Scilit]
- Chen, J.; Chen, X.; Wang, Y.; Deng, Y.; Chen, Y.; Jing, M.; Zhang, H.; Pan, H. Study on the Correction Method of Lightning Strike Trip Rate of Transmission Lines Under the Complex Influence of Microtopography Factors. IET Sci. Meas. Technol. 2025, 19, e70035. [Google Scholar] [CrossRef] [Scilit]
- Conceição, D.; Alipio, R.; Lopes, I.J.; Chisholm, W. A comprehensive analysis on the influence of the adopted cumulative peak current distribution in the assessment of overhead lines lightning performance. Energies 2023, 16, 5836. [Google Scholar] [CrossRef] [Scilit]
- Martinez-Velasco, J.A. Power System Transients: Parameter Determination; CRC Press: Boca Raton, FL, USA, 2017. [Google Scholar]
- Wang, C.; Xiang, N.; Wang, S.; Lyu, Z.; Chen, Z. Analysis of lightning strike fault characteristics in data-driven dense channels of new power systems. In Proceedings of the ICLP 2024; 37th International Conference on Lightning Protection, Dresden, Germany, 1–7 September 2024; pp. 650–655. [Google Scholar]
- Zhang, Y.; Zhang, Y.; Zou, M.; Wang, J.; Li, Y.; Tan, Y.; Feng, Y.; Zhang, H.; Zhu, S. Advances in lightning monitoring and location technology research in China. Remote Sens. 2022, 14, 1293. [Google Scholar] [CrossRef] [Scilit]
- Hu, Y. Analysis of influencing factors of transmission line operation safety and prevention countermeasures. In Proceedings of the IOP Conference Series: Earth and Environmental Science; IOP Publishing Ltd.: Bristol, UK, 2021; p. 042045. [Google Scholar]
- Hong, Q.; Chen, Y.; He, Y.; Huang, Z.; Huang, X.; Lu, H.; He, Y. Study on lightning trip protection for distribution lines in a certain area of northern Guangzhou. In Proceedings of the 2021 International Conference on Advanced Technology of Electrical Engineering and Energy (ATEEE), Qingdao, China, 24–26 December 2021; pp. 46–50. [Google Scholar]
- Tang, S.; Yang, X.; Huang, J.; Hu, J.; Zuo, J.; Li, S. Spatiotemporal-Imbalance-Aware Risk Prediction Framework for Lightning-Caused Distribution Grid Failures. Sustainability 2025, 17, 7228. [Google Scholar] [CrossRef] [Scilit]
- You, W.; Guo, D.; Wu, Y.; Li, W. Multiple load forecasting of integrated energy system based on sequential-parallel hybrid ensemble learning. Energies 2023, 16, 3268. [Google Scholar] [CrossRef] [Scilit]
- Zhou, X.; Li, J. Risk assessment of high-voltage power grid under typhoon disaster based on model-driven and data-driven methods. Energies 2025, 18, 809. [Google Scholar] [CrossRef] [Scilit]
- Yang, Y.; Wang, Y.; Zhang, X. Research on power system small signal stability analysis and correction based on LightGBM algorithm. Electr. Eng. 2024, 106, 4469–4486. [Google Scholar] [CrossRef] [Scilit]
- Chen, T.; Guestrin, C. Xgboost: A scalable tree boosting system. In Proceedings of the 22nd Acm Sigkdd International Conference on Knowledge Discovery and Data Mining, San Francisco, CA, USA, 13–17 August 2016; pp. 785–794. [Google Scholar]
- Prokhorenkova, L.; Gusev, G.; Vorobev, A.; Dorogush, A.V.; Gulin, A. CatBoost: Unbiased boosting with categorical features. Adv. Neural Inf. Process. Syst. 2018, 31, 6639–6649. [Google Scholar]
- Zhu, R.; Ciren, G.; Tang, B.; Gong, X. Power system short-term voltage stability assessment based on improved CatBoost with consideration of model confidence. Energy Sci. Eng. 2023, 11, 783–795. [Google Scholar] [CrossRef] [Scilit]
- Burq, A.; Jouhaud, J.; Xing, V.; Bouvier, V.; Forcadell, V.; Taszarek, M.; Vrac, M.; Faranda, D. From logistic regression to deep learning: Machine learning modeling of lightning in ERA5 reanalysis data. Earth Syst. Dyn. 2026, 2026, 1–35. [Google Scholar] [CrossRef] [Scilit]
- Ke, J.; Zhang, L.; Wang, J.; Ma, Y.; Wang, C. Disaster assessment of power grid transmission lines under multi-source data fusion. In Proceedings of the 2025 4th International Conference on Energy, Power and Electrical Technology (ICEPET), Chengdu, China, 25–27 April 2025; pp. 237–242. [Google Scholar]
- Huang, G.; Wu, G.; Guo, Y.; Liang, M.; Li, J.; Dai, J.; Yan, X.; Gao, G. Risk assessment models of power transmission lines undergoing heavy ice at mountain zones based on numerical model and machine learning. J. Clean. Prod. 2023, 415, 137623. [Google Scholar] [CrossRef] [Scilit]
- Bian, H.; Zhang, J.; Xie, G.; Zhang, C. Risk analysis of lightning, strong wind, wildfire, and ice and snow disaster-related transmission line trip accidents. In Proceedings of the 2024 9th Asia Conference on Power and Electrical Engineering (ACPEE), Shanghai, China, 11–13 April 2024; pp. 2584–2590. [Google Scholar]
- Sivhugwana, K.S.; Ranganai, E. Short-term forecasting of unplanned power outages using machine learning algorithms: A robust feature engineering strategy against multicollinearity and nonlinearity. Energies 2025, 18, 4994. [Google Scholar] [CrossRef] [Scilit]
- Fan, R.; Zeng, W.; Ming, Z.; Zhang, W.; Huang, R.; Liu, J. Risk reliability assessment of transmission lines under multiple natural disasters in modern power systems. Energies 2023, 16, 6548. [Google Scholar] [CrossRef] [Scilit]
- Xu, M.; Qie, X.; Pang, W.; Shi, G.; Liang, L.; Sun, Z.; Yuan, S.; Zhu, K.; Zhao, P. Lightning climatology across the Chinese continent from 2010 to 2020. Atmos. Res. 2022, 275, 106251. [Google Scholar] [CrossRef] [Scilit]
- Liu, Y.; Xu, Z.; Zhou, L.; Kang, F.; Xu, Z. Research on differential lightning protection of 10 kV distribution lines in mountainous area based on classification and recognition of topography. Int. J. Crit. Infrastruct. 2022, 18, 321–335. [Google Scholar] [CrossRef] [Scilit]
- Ahmedov, E.; Mukhtarova, K. Enhancing the Reliability of Power Systems by Optimizing Lightning Protection of Overhead Transmission Lines. Reliab. Theory Appl. 2025, 20, 841–852. [Google Scholar]
- Hu, J.; Zhu, T.; Hu, J.; Fang, Z.; Zhang, R. Study on the lightning protection performance for a 110 kV non-shield-wired overhead line with anti-thunder and anti-icing composite insulators. Energies 2023, 16, 815. [Google Scholar] [CrossRef] [Scilit]
- Yang, Y.; Wang, S.; Wang, S.; Wang, Q.; Xie, W.; Ye, L.; Tu, J.; Zhang, X.; Li, G.; Xiang, N. Lightning trip-out risk assessment and differential lightning protection of 35 kV transmission lines in mountain wind farm. Energy Rep. 2022, 8, 581–588. [Google Scholar] [CrossRef] [Scilit]
- Hu, Y.; Yang, M.; Qu, L.; An, Y.; Wang, J.; Cheng, Y.; Sha, X.; Wang, Q.; Ma, C.; An, B. Improved electrogeometric model of UHV transmission line based on long gap discharge and its application. Front. Energy Res. 2022, 10, 862795. [Google Scholar] [CrossRef] [Scilit]
- Guo, F.; Wang, G.; Su, Z.; Liang, H.; Wang, W.; Lin, F.; Liu, A. What drives forest fire in Fujian, China? Evidence from logistic regression and Random Forests. Int. J. Wildland Fire 2016, 25, 505. [Google Scholar] [CrossRef] [Scilit]
- Friedman, J.H. Greedy function approximation: A gradient boosting machine. Ann. Stat. 2001, 29, 1189–1232. [Google Scholar] [CrossRef] [Scilit]
- Sleem, A.A.; Syed, M.N. Novel predictive factors to boost short-term electricity demand forecasting using machine learning models. IEEE Access 2025, 13, 147265–147290. [Google Scholar] [CrossRef] [Scilit]
- Thamtam, H.; Rathee, S.; Joshi, S.K.; Nagaraj, K.; Bhat, S.K.; Kumar, A. Explainable AI–driven sustainable transformer health monitoring for resilient power distribution systems. Energy Convers. Manag. X 2026, 31, 102133. [Google Scholar] [CrossRef] [Scilit]
- Ghasemkhani, B.; Kut, R.A.; Yilmaz, R.; Birant, D.; Arıkök, Y.A.; Güzelyol, T.E.; Kut, T. Machine learning model development to predict power outage duration (POD): A case study for electric utilities. Sensors 2024, 24, 4313. [Google Scholar] [CrossRef] [Scilit] [PubMed]
- Tang, Y.; He, K.; Shu, H.; Wang, K.; Lou, W.; Qin, Z.; Han, Y.; Dai, Y. Reliability and safety assessment of distribution networks in mountainous plateau areas subject to low-amplitude lightning. Reliab. Eng. Syst. Saf. 2025, 264, 111305. [Google Scholar] [CrossRef] [Scilit]
- Shi, T.; Yang, J.; Lin, X.; Huang, L.; Wang, G. Analysis of lightning strike failure of extra high voltage overhead lines in Hubei power grid. In Proceedings of the 2020 IEEE 3rd Student Conference on Electrical Machines and Systems (SCEMS), Jinan, China, 4–6 December 2020; pp. 306–311. [Google Scholar]
- Luo, G.; Mao, T.; Ni, W.; Le, J. Transmission Line Fault Type Identification Based on Polar Lights Optimizer-Selected Features and a Gramian Angular Field Attention Fusion Network. Sensors 2026, 26, 4502. [Google Scholar] [CrossRef] [Scilit] [PubMed]
- Wang, Z.; Chen, W.; Niu, Y.; Wang, C.; Tao, Y.; Li, J.; Wu, S.; Song, G. Regional Lightning Occurrence Probability Forecasting and Risk Identification Based on Resampling Ensemble Machine Learning. Atmosphere 2026, 17, 766. [Google Scholar] [CrossRef] [Scilit]
- Deng, Y.; He, X.; Wang, Y.; Lan, L.; Du, Z. SHAP-Based Interpretable Neural Network Framework for Lightning Risk Analysis and Diagnosis in Power Transmission Lines. IEEE Trans. Power Deliv. 2026, 41, 1783–1790. [Google Scholar] [CrossRef] [Scilit]

Disclaimer/Publisher’s Note: The statements, opinions and data contained in all publications are solely those of the individual author(s) and contributor(s) and not of MDPI and/or the editor(s). MDPI and/or the editor(s) disclaim responsibility for any injury to people or property resulting from any ideas, methods, instructions or products referred to in the content. |
© 2026 by the authors. Licensee MDPI, Basel, Switzerland. This article is an open access article distributed under the terms and conditions of the Creative Commons Attribution (CC BY) license.