


Abstract
Conventional hydropower potential assessment (HPA) does not explicitly account for operational requirements and constraints affecting hydropower availability in multifunctional river systems (MRSs). This study introduces Operational Hydropower Potential Assessment (OHPA), a hierarchical framework integrating hydrological conditions, operational requirements, and constraints into conventional HPA. The framework distinguishes hydrological assessment from operational assessment and combines their outcomes to determine reference and operational hydropower potential (OHP). The methodology was applied to five operational reaches of the upper canalised Vistula River in Poland using hydrological observations, technical hydropower parameters, and documented operational information. Daily water discharge exhibited strong spatial coherence, with Spearman correlations of 0.815–0.972 and the first principal component explaining 92.38% of total variance. Annual hydro-technical reference energy ranged from 66.90 to 79.01 GWh. For the Smolice–Łączany reach, the OHPA index decreased from 0.752 to 0.390 under a very-low-flow scenario, demonstrating the sensitivity of hydropower availability to hydrological extremes. Documented high-water closures occurred near the 99th percentile of long-term discharge, highlighting additional operational limitations. OHPA provides a transferable framework for quantifying hydropower availability under variable hydrological conditions, operational constraints, and competing water uses in multifunctional river systems.
1. Introduction
Inland waterways have evolved into multifunctional river systems (MRSs) that simultaneously support electricity generation, flood protection, drought mitigation, inland navigation, water supply, irrigation, and ecosystem conservation. Climate-change adaptation and the renewable energy potential of flowing waters increase the strategic importance of these systems. River operation therefore requires balancing multiple and often competing technical, environmental, and socio-economic objectives, making electricity generation dependent on river operating conditions and water-use requirements, as well as natural hydrological conditions [1,2]. The transition towards smart and sustainable economies also increases the importance of renewable energy management and efficient use of existing energy infrastructure.
Hydrological extremes increase this operational complexity. Floods require temporary storage to maintain flood-control capacity, whereas droughts intensify competition among hydropower production, navigation, environmental protection, agriculture, and municipal water supply. Digital monitoring, hydrological forecasting, artificial intelligence, and decision-support systems support adaptive river operation under changing hydrological conditions [3,4]. Hydropower potential assessment (HPA) provides a framework for evaluating hydropower resources and supporting hydropower development planning. HPA methods have progressively incorporated hydrological, technical, economic, environmental, and spatial constraints, refining hydropower resource assessment [1,5]. Nevertheless, existing HPA methodologies remain primarily focused on resource availability and development feasibility, while operational conditions governing electricity generation are generally addressed through reservoir operation and water-resource management rather than within HPA [6,7].
This separation limits the representation of hydropower availability in MRSs. Reservoir operating rules, flood-control requirements, drought mitigation, navigation constraints, environmental flow regulations, and competing water uses can affect the hydrological and hydraulic conditions available for hydropower generation under changing hydrological conditions. These operational factors remain largely external to conventional HPA methodologies despite their direct influence on hydropower availability [4,8]. Conventional HPA therefore does not explicitly quantify the hydropower potential remaining available under documented operating conditions, requirements, and constraints in MRSs. To address this gap, this study introduces Operational Hydropower Potential Assessment (OHPA) as an operational extension of conventional HPA that explicitly accounts for documented river operating conditions, requirements, and constraints.
The objective of this study is to develop a hierarchical assessment model for OHPA that integrates hydrological conditions with documented operational information or explicitly defined scenarios to assess hydropower availability in MRSs. The proposed framework combines this hierarchical structure with continuous monitoring and iterative reassessment to account for changes in hydrological and operational conditions. The research objective is addressed through the following research questions:
RQ1. What methodological limitations of existing HPA approaches reduce their applicability to MRSs operating under hydrological extremes?
RQ2. Which operating conditions, requirements, and constraints should be represented within OHPA to characterise hydropower availability in MRSs?
RQ3. How can hydrological conditions and documented or scenario-based operating conditions, requirements, and constraints be integrated within a hierarchical assessment model for OHPA?
RQ4. How can operational hydropower availability be reassessed using updated hydrological observations and operational information within the proposed OHPA framework?
This study contributes to hydropower research by introducing OHPA as an operational extension of conventional HPA for assessing hydropower availability in MRSs. The proposed hierarchical assessment model separates the assessment of hydrological conditions from the assessment of operating conditions, requirements, and constraints represented through documented operational information or explicitly defined scenarios and integrates these information streams through the determination of reference and operational OHP. The OHPA index measures hydropower availability relative to reference OHP determined for the same hydrological conditions and technical configuration, allowing the effects of the assessed operating conditions and applicable constraints to be distinguished from differences in the underlying hydrological state. Continuous monitoring and iterative reassessment allow OHPA to be updated as river conditions change. Within this framework, operational hydropower potential (OHP) represents hydropower potential under the assessed hydrological conditions subject to the operating conditions and applicable constraints represented for the assessed mode.
The remainder of this paper is organised as follows. Section 2 reviews the evolution of hydropower potential assessment and establishes the methodological foundations of the proposed OHPA framework. Section 3 presents the hierarchical assessment model, its mathematical formulation, and the operational assessment procedure. Section 4 applies the methodology to five operational reaches of the upper canalised Vistula River and presents the OHPA evaluation and sensitivity analysis. Section 5 discusses the principal findings, theoretical contributions, practical implications, limitations, and directions for future research. Section 6 concludes this study.
2. Literature Review
2.1. Multifunctional River Systems
Rivers used as inland waterways have evolved from infrastructures serving individual hydraulic functions into multifunctional river systems (MRSs) supporting interdependent technical, environmental, economic, and social objectives. In addition to electricity generation, contemporary river systems support inland navigation, flood protection, drought mitigation, water supply, irrigation, ecosystem conservation, recreation, and regional economic development. This evolution has shifted river management from sector-specific operation to coordinated use of shared water resources [2,8]. Water–energy–food studies also demonstrate the interdependence of water-resource functions within river basins [9,10]. These interactions require coordinated operation of hydraulic infrastructure and management of competing water uses [11,12].
Multifunctionality complicates river planning and operation. Earlier approaches focused on optimising individual hydraulic structures for specific purposes, whereas basin-scale management integrates reservoirs, navigation infrastructure, hydropower plants, environmental requirements, and competing water uses [13,14]. From an engineering perspective, these functions impose different and potentially conflicting requirements on river discharge, water levels, hydraulic head, and infrastructure operation. Hydropower generation depends on the discharge available for turbine operation, effective hydraulic head, and installed generating capacity, whereas inland navigation requires sufficient navigable depth and suitable hydraulic conditions. Flood protection may require adjustments to water levels and hydraulic structure operation, while drought mitigation and environmental protection impose additional requirements on water allocation and minimum flow conditions. These requirements can be expressed through engineering parameters such as minimum navigable depth, minimum environmental discharge, permissible water-level ranges, and maximum turbine discharge. Decisions concerning one function can alter water availability and operating conditions for others, extending their effects beyond individual hydraulic structures [15,16].
Inland navigation imposes specific operational requirements because navigation safety and transport efficiency depend on maintaining appropriate water levels, flow conditions, and hydraulic infrastructure performance. Navigation requirements can affect the hydrological and hydraulic conditions relevant to hydropower generation, while flood-control and drought-mitigation measures can alter the amount and timing of water available for other uses [17,18]. River Information Services (RISs) and other digital navigation technologies improve navigation coordination but focus primarily on navigation efficiency rather than integrated river operation [19,20]. Navigation performance also depends on reservoir operation and the management of water resources among competing functions [18,21]. Maintaining navigability requires coordinated management of reservoirs, hydraulic structures, and sediment processes rather than isolated engineering interventions [22,23]. However, navigation restrictions do not necessarily imply equivalent reductions in hydropower generation, since their effects depend on the specific hydraulic and operational mechanisms involved.
Environmental requirements affect river operating conditions and the use of available water resources. Environmental flow regulations, sediment transport, ecological restoration, water-quality protection, and biodiversity conservation affect water storage, release, and hydraulic conditions across river functions [24,25]. River management must reconcile ecological requirements with economic and social water uses at the basin scale. Environmental sustainability is an integral component of MRS planning and operation [26,27]. In run-of-river hydropower systems, environmental requirements can affect turbine discharge availability and permissible operating conditions, thereby influencing hydropower utilisation [12,28].
Hydrological extremes further intensify interactions among river functions by changing water availability, hydraulic conditions, and operational priorities. During prolonged droughts and low-flow periods, reduced water availability may increase competition among hydropower generation, inland navigation, environmental protection, and water supply. Conversely, high-flow events may require flood-control measures, navigation restrictions, and adjustments to hydraulic infrastructure operation. Climate-related changes in precipitation patterns and river discharge can affect hydropower generation, although their impacts vary according to local hydrological conditions, infrastructure characteristics, and water-allocation priorities [29,30]. These interactions create operational challenges because restrictions imposed on individual river functions may have different consequences for hydropower availability. Their quantitative effects depend on changes in turbine discharge, effective hydraulic head, or generating-unit availability rather than on the occurrence of operational restrictions alone.
MRSs are treated as integrated socio-technical systems rather than collections of independent hydraulic facilities. Operational strategies seek to balance competing water uses and maintain system performance under changing environmental conditions [31,32]. Multi-objective approaches show that coordinated management can reduce conflicts among water uses and improve long-term river-system performance [33,34]. However, navigation, flood protection, environmental protection, reservoir operation, and hydropower generation impose distinct and sometimes competing requirements. Their combined influence on the hydrological and hydraulic conditions governing hydropower availability remains difficult to represent within a unified operational assessment. Hydrological extremes intensify this problem by changing water availability and the interactions among competing river functions. However, the combined influence of hydrological variability and competing operational requirements on hydropower availability remains difficult to represent within conventional hydropower potential assessment. This creates a need for an assessment framework that distinguishes hydrological conditions from operational requirements and constraints and accounts for their quantitatively specified effects on hydropower availability.
2.2. Operational River Management Under Hydrological Extremes
Hydrological extremes increase the operational demands on MRSs. Changes in flood occurrence, prolonged droughts, and climate variability reduce the predictability of river discharge and increase uncertainty in reservoir operation and water allocation. River management has shifted from fixed operating rules towards adaptive strategies responsive to changing hydrological conditions and operational priorities [3,35]. Probabilistic hydrological forecasting, risk-informed planning, and adaptive control allow operational decisions to account for hydrological uncertainty [15,16]. Operational flexibility is critical for maintaining MRS performance under variable hydrological conditions [10,36]. Adaptive river management requires balancing objectives that compete for shared water resources. Flood protection, hydropower generation, inland navigation, environmental flow regulation, irrigation, municipal water supply, and ecosystem conservation must be coordinated as water availability changes. Reservoir operation has shifted from single-purpose optimisation towards multi-objective management combining hydraulic safety, energy production, navigation, and environmental protection [8,9]. Coordinated operation of reservoir cascades can increase flexibility, reduce conflicts among water users, and strengthen system resilience [14,34]. In navigable river systems, coordinated reservoir operation can improve water allocation while maintaining navigation and flood-protection functions [17,18]. System-wide operation of hydraulic infrastructure can reconcile engineering performance with ecological requirements [13,23].
River-operation complexity has driven the development of Decision Support Systems (DSSs) that integrate hydrological forecasting, optimisation, simulation, and real-time monitoring [31,37]. Long-term scheduling models combine operational, environmental, and economic criteria, linking short-term decisions with long-term management objectives [33,38]. Digital operational platforms integrate scheduling, simulation, operational databases, and scenario analysis [39,40]. These systems allow operational decisions to be revised as hydrological conditions and operating requirements change.
Artificial intelligence, machine learning, digital twins, and smart hydropower technologies expand forecasting, optimisation, monitoring, and control capabilities. AI-based methods improve reservoir-inflow forecasting, while machine-learning applications address scenario analysis, reservoir scheduling, and water-allocation optimisation [4,41]. Smart hydropower integrates sensing, predictive analytics, automated control, and digital communication to adjust hydropower operation to changing hydrological conditions [42,43]. Interoperability among forecasting, optimisation, monitoring, and control systems enables coordinated operation of multifunctional river infrastructure [44,45]. Cloud computing, intelligent sensors, and data-driven control enable operational responses to changing river conditions [46,47].
Operational river management has thus shifted from fixed, function-specific rules towards adaptive management of competing water uses. Hydrological forecasting, optimisation, scheduling, DSS, and digital technologies enable operational decisions to respond to changes in water availability and operating conditions and requirements. These approaches, however, primarily address the operation of existing river systems and hydropower facilities, whereas HPA assesses hydropower resources and their feasibility for utilisation. The representation of documented operating conditions, requirements, and constraints within HPA therefore remains a methodological gap between operational river management and hydropower potential assessment. Addressing this gap requires an assessment structure that distinguishes hydrological conditions from river operating conditions while enabling their quantitatively supported effects on hydropower availability to be evaluated jointly.
2.3. Evolution and Limitations of Hydropower Potential Assessment
HPA has evolved to improve hydropower resource estimation and support energy planning and water-resource management. Successive developments have expanded the physical, engineering, environmental, economic, and spatial constraints represented in HPA, increasing its applicability across geographical and planning scales [1,48]. Global assessments place HPA within integrated energy planning, water-resource management, and long-term energy policy [49,50]. HPA distinguishes several assessment levels. Early approaches estimated energy resources primarily from river discharge and hydraulic head, whereas subsequent studies incorporated engineering feasibility, economic viability, environmental restrictions, and spatial planning considerations, leading to the classification of hydropower potential as theoretical, technical, economic, and effective [7,51]. Each level narrows the available resource by applying technical, economic, environmental, or regulatory constraints to the physically available potential [5,52].
Geographic Information Systems (GISs), hydrological modelling, remote sensing, multi-criteria decision analysis, and spatial optimisation have expanded the analytical scope of HPA [46,53]. Hydrological modelling coupled with geospatial analysis improves assessment in river basins with limited monitoring data, while GIS-based methods identify technically feasible small-scale and run-of-river sites by combining engineering and environmental constraints [54,55]. Spatial screening and environmental assessment support the identification and prioritisation of small hydropower resources [56,57]. Software platforms, web-based databases, automated decision-support tools, and digital assessment environments improve transparency, reproducibility, and consistency in large-scale HPA [39,40]. Automated site identification and integrated engineering constraints support regional planning and site selection [58,59].
Climate variability adds a temporal dimension to HPA. Continental-scale investigations show that climate change can alter regional hydropower resources, requiring long-term hydrological variability to be considered in resource assessment [60]. Subsequent studies combine historical hydrological variability, climate projections, and spatial modelling to assess hydropower resources under changing climatic conditions [61]. Regional investigations identify residual hydropower resources using geospatial and multi-criteria methods [62,63]. GIS-supported renewable-energy planning and remote sensing improve spatial characterisation of river systems and integration of environmental constraints [64,65], while regional applications demonstrate the applicability of geospatial methods to technically feasible site identification under different hydrological and geographical conditions [55,66].
HPA has also been applied across different geographical, institutional, and technological settings. Studies conducted in Poland identify institutional, environmental, and infrastructural barriers limiting small hydropower development despite the availability of technically feasible resources [67,68], while local case studies show the importance of site-specific hydraulic conditions and existing water infrastructure [69]. HPA has also expanded beyond conventional river systems to conduit hydropower integrated within water-distribution infrastructure [70,71]. Contemporary HPA thus represents physical, hydrological, technical, economic, environmental, and spatial constraints at different assessment levels.
Operating conditions are less directly represented within this hierarchy. Existing HPA methodologies evaluate hydropower potential primarily through physical, engineering, economic, environmental, and spatial characteristics, whereas reservoir operating rules, navigation and environmental requirements, flood-control and drought-mitigation measures, and competing water uses are generally addressed within operational optimisation and water-resource management rather than explicitly represented within HPA [6,8]. Existing HPA classifications distinguish theoretical, technical, economic, and effective potential [5,7], but these levels do not explicitly represent how documented operating conditions, requirements, and constraints affect hydropower availability under the prevailing hydrological conditions. The magnitude and mechanism of these effects may vary: Operating conditions can modify the discharge available to hydropower installations, alter hydraulic conditions, or temporarily restrict generation, while other requirements may not have a directly quantifiable effect on hydropower availability. Floods and droughts can further modify the influence of reservoir operating rules, navigation requirements, environmental flows, and competing water uses on hydropower availability [36,72,73].
HPA and operational river management therefore represent complementary but methodologically distinct domains. HPA characterises hydropower resources through successive resource and feasibility constraints, whereas operational river management governs the use of river-system resources under changing hydrological conditions and competing functional requirements. Their integration within a common assessment framework remains limited. OHPA addresses this gap as an operational extension of conventional HPA by distinguishing the hydrological state from operating conditions represented through documented operational information or explicitly defined scenarios and integrating their quantitatively specified effects in the assessment of hydropower availability. Reference and operational OHP provide a common hydrological and technical basis for this comparison, while the OHPA index expresses their relationship as a normalised measure of operational hydropower availability.
3. Materials and Methods
3.1. Research Methodology
Figure 1 presents the research methodology for developing and applying the proposed OHPA framework.
Figure 1.
Research methodology for the proposed OHPA framework.
The methodology comprises three interconnected components: methodological inputs, the OHPA analytical framework, and assessment outputs. The inputs cover three dimensions: hydrological conditions, river-system characteristics, and operational information. Hydrological variables characterise water availability through river discharge, flow variability, and hydrological extremes. River-system variables describe the river network, reservoirs and hydraulic structures, topography, and hydropower characteristics. Operational information comprises documented operating conditions or explicitly defined scenario conditions, together with operating rules, constraints, and water-use requirements governing river operation [33].
The analytical framework comprises four sequential stages. The conceptual framework defines the OHPA concept, objectives, and key assessment factors. The hierarchical assessment model integrates hydrological conditions with operational requirements and constraints for hydropower availability assessment. The operational assessment procedure integrates observed hydrology with documented or scenario-based operating conditions. Application and evaluation comprise the determination of reference and operational OHP and the calculation of the OHPA index. The calculations were performed using MATLAB R2025b (The MathWorks, Inc., Natick, MA, USA).
Reference OHP represents the hydropower potential determined from observed hydrological conditions and the technical characteristics of the hydropower installation. Operational OHP represents hydropower potential under the same hydrological conditions subject to the assessed operating conditions and applicable constraints. Using the same hydrological basis enables reference and operational OHP to be compared without conflating operational and hydrological differences.
The methodology is applied to the upper canalised Vistula River as a representative MRS. Hydrological observations, river-system and hydropower characteristics, and documented operational information provide the empirical basis for the assessment. Updated hydrological observations and operational information enable reassessment as hydrological and operational conditions change. Section 3.2 presents the hierarchical assessment model.
3.2. Hierarchical Assessment Model for OHPA
The hierarchical assessment model structures the information required to determine OHPA into four functional levels (Figure 2).
Figure 2.
Information architecture of the hierarchical OHPA model.
Two complementary information streams form the assessment basis: hydrological observations obtained through monitoring and operational information derived from documented operating conditions or explicitly defined scenarios. These streams are assessed separately at Levels 1 and 2 and integrated at Level 3 to determine reference and operational OHP. Level 4 uses these values to calculate the OHPA index.
Level 1 assesses the hydrological conditions relevant to hydropower availability. Monitoring provides continuous observations used to characterise river discharge, flow variability, and hydrological extremes over the assessment period. The resulting hydrological characterisation defines the water-availability conditions used for OHP determination and remains distinct from the operational assessment performed at Level 2.
Level 2 assesses the operating conditions governing river use. Operational conditions may be derived from documented operational information or represented through explicitly defined scenarios, depending on the purpose and data basis of the assessment. It considers operating rules and constraints and water-use requirements associated with navigation, water supply, environmental requirements, flood protection, and other river functions. These factors define the operational context for hydropower generation. Levels 1 and 2 are complementary rather than sequential: the former characterises hydrological conditions, while the latter characterises the requirements and constraints governing river operation.
Level 3 integrates the hydrological and operational assessments through the determination of reference and operational OHP. Reference OHP represents hydropower potential determined from the assessed hydrological conditions and the technical characteristics of the hydropower installation. Operational OHP represents hydropower potential under the same hydrological conditions, subject to the operating conditions and applicable constraints represented for the assessed mode. The common hydrological basis enables differences between reference and operational OHP to be assessed in relation to the operational conditions represented in the model. Both OHP values provide the quantitative basis for OHPA determination at Level 4.
Level 4 determines the OHPA index from reference and operational OHP. The index expresses operational hydropower availability relative to reference OHP, complementing the absolute OHP values with a normalised measure for comparison across assessed operating conditions.
The OHPA supports the identification of conditions associated with reduced hydropower availability, comparison of operating conditions, and river-management decision-making in a multi-use river system. Monitoring, assessment, and decision-making remain functionally distinct: monitoring supplies observations, the OHPA model evaluates hydropower availability, and the resulting information supports rather than prescribes river-management decisions. The quantitative implementation of this assessment structure, including the formulation of reference and operational OHP and the OHPA index, is presented in Section 3.3.
3.3. Model Formulation
The model formulation provides the quantitative basis for determining reference and operational OHP and the OHPA index within the hierarchical assessment structure. Level 1 establishes the hydrological state used in the assessment; Level 2 identifies the operating conditions, requirements, and constraints represented through documented operational information or explicitly defined scenarios; Level 3 integrates both information streams to determine reference and operational OHP; Level 4 quantifies their relationship through the OHPA index.
At Level 1, the hydrological conditions relevant to hydropower generation for each operational river reach Ri are represented by
where Xi,t denotes the hydrological state vector; Qi,t is the observed river discharge, m3 s−1; Hi,t is the effective hydraulic head, m; i = 1,…,n denotes the operational river reach; and t = 1,…,T denotes the time step within the assessment period. River discharge characterises hydrological water availability, while effective hydraulic head defines the hydraulic conditions for energy conversion. Effective hydraulic head represents the net hydraulic head available for hydropower conversion at the installation, accounting for the difference between upstream and downstream water levels and associated hydraulic losses. The Level 1 hydrological state provides the common basis for reference and operational OHP determination at Level 3.
Xi,t = {Qi,t,Hi,t},
Level 2 independently characterises the operating conditions governing river use. Operational conditions are represented either by documented operational information (k = doc) or by explicitly defined scenarios (k = sc):
where k denotes the operational-information mode; doc denotes documented operating conditions; and sc denotes explicitly defined scenario conditions.
k ∈ {doc,sc}.
The distinction preserves data provenance and prevents scenario assumptions from being interpreted as documented operating effects. These conditions include operating rules and constraints and water-use requirements associated with navigation, water supply, environmental requirements, flood protection, and other river functions. Their quantitative representation depends on whether their physical effect on hydropower availability is quantitatively specified for the assessed mode. A quantitatively specified diversion, abstraction, or redistribution of flow is represented through the discharge available to the hydropower installation; a quantitatively specified hydraulic restriction is represented through the corresponding hydraulic conditions; a condition explicitly establishing generation unavailability is represented through operational availability. Operating requirements without a quantified physical effect are retained as Level 2 assessment information and are not converted into assumed changes in discharge, hydraulic head, or hydropower output.
At Level 3, the Level 1 hydrological state is combined with the technical characteristics of the hydropower installation to determine the reference OHP. The river discharge usable for hydropower generation is limited by the maximum turbine discharge:
where is the reference discharge usable for hydropower generation within river reach Ri at time step t, m3 s−1; is the maximum turbine discharge of the hydropower installation associated with reach Ri, m3 s−1. This constraint prevents river discharge exceeding the hydraulic capacity of the installation from increasing the estimated reference potential.
The instantaneous reference hydropower output is
where is the instantaneous reference hydropower output within river reach Ri at time step t, MW; ρ is water density, kg m−3; g is gravitational acceleration, m s−2; ηi is the overall hydropower conversion efficiency of the hydropower installation associated with river reach Ri, which is dimensionless; and is the total installed hydropower capacity within river reach Ri, MW. The limits imposed by and ensure that reference hydropower outputs do not exceed the hydraulic or installed power capacity of the hydropower installation.
The reference OHP over assessment period T is
where is the reference OHP for river reach Ri over the assessment period T, MWh; Δt is the duration of time step, h. The resulting provides the Level 3 hydro-technical reference benchmark for the assessed period.
The operational OHP is determined at Level 3 by integrating the Level 1 hydrological state and the operating conditions represented at Level 2 for assessment mode k with the technical characteristics of the hydropower installation. The operational state is represented by
where is the operational-state vector; is the discharge physically available to the hydropower installation, m3 s−1; is the corresponding effective hydraulic head, m; and Ai,t,k is the operational-availability variable for assessment mode k:
Ai,t,k ∈ {0,1}.
Here, Ai,t,k = 1 when hydropower generation is operationally available within river reach Ri at time step t for assessment mode k, and Ai,t,k = 0 when the operating conditions specified for that mode establish that hydropower generation is unavailable. The variable represents the operating state specified for assessment mode k rather than an estimated reduction coefficient.
If Level 2 information for assessment mode k identifies a quantitatively specified diversion, abstraction, or redistribution of flow, the operational discharge is
where is the quantitatively specified flow modification for assessment mode k that reduces the discharge available to the hydropower installation, m3 s−1. In the absence of such a specified flow modification, . This formulation prevents Level 2 requirements of different physical natures from being treated as additive water withdrawals.
If Level 2 information for assessment mode identifies a quantitatively specified change in hydraulic conditions, represents the corresponding effective hydraulic head. In the absence of such a specified hydraulic modification, . No hydraulic adjustment is introduced without a quantitative basis provided by documented operational information or an explicitly defined scenario.
The instantaneous operational hydropower output for assessment mode k is
where is the instantaneous operational hydropower output for assessment mode k, MW.
The operational OHP for assessment mode k over the same assessment period is
where is the operational OHP for river reach Ri under assessment mode k over the assessment period T, MWh.
Level 3 produces two directly comparable quantities. Reference OHP is determined from the Level 1 hydrological state within the technical limits of the hydropower installation, whereas operational OHP additionally incorporates the quantitatively specified effects identified at Level 2 for assessment mode k. Both quantities are determined for the same hydrological conditions, assessment period, and technical configuration.
At Level 4, operational hydropower availability is quantified by relating the operational OHP for assessment mode k to the corresponding reference OHP:
where OHPAi,k is the dimensionless OHPA index for river reach Ri under assessment mode k.
For practical interpretation, the index may be expressed as a percentage:
where OHPAi,k,% is the OHPA index expressed as a percentage.
OHPAi,k,% = 100 OHPAi,k,
An OHPAi,k value equal to 1 indicates equality between operational and reference OHP under the same hydrological conditions, assessment period, and technical configuration. Values below 1 indicate a reduction in operational hydropower availability relative to the hydro-technical reference benchmark.
The four-level formulation preserves the functional separation established in the OHPA framework. Level 1 converts hydrological observations into the hydrological state used by the model. Level 2 represents operating conditions, requirements, and constraints using documented operational information or explicitly defined scenarios independently of Level 1. Level 3 integrates the two information streams with the technical characteristics of the hydropower installation to determine reference and operational OHP. Level 4 relates operational OHP to the hydro-technical reference benchmark through the OHPA index. The resulting index quantifies operational hydropower availability without prescribing operating rules or water-allocation decisions.
The following subsection presents the study area, its division into operational river reaches, and the input data used to apply the proposed OHPA methodology.
3.4. Study Area, Operational River Reaches, and Input Data
The proposed OHPA methodology was applied to the upper canalised Vistula River in Poland, where hydropower generation interacts with inland navigation, flood protection, environmental requirements, water supply, and other river uses [16,33]. Hydropower availability in the Upper Vistula River Basin is also affected by hydrometeorological variability, particularly drought and low-flow conditions [74].
The analysed river section was divided into five operational river reaches (R1–R5) bounded by six consecutive barrages of the Upper Vistula Cascade: Dwory, Smolice, Łączany, Kościuszko, Dąbie, and Przewóz. Each inter-barrage section constitutes a separate OHPA unit, allowing reach-specific hydrological conditions, hydropower infrastructure, and operating conditions to be represented within the same OHPA framework. The principal spatial and hydrotechnical characteristics of the five operational river reaches are summarised in Table 1 [75]. For quantitative hydropower calculations, each reach is associated with the hydropower installation at its downstream bounding barrage (R1-Smolice, R2-Łączany, R3-Kościuszko, R4-Dąbie, and R5-Przewóz). This convention prevents double counting of installations while preserving the reach-based spatial structure. The five reaches are connected assessment units within one hydrologically coherent river system and are not treated as independent hydrological replicates.
Table 1.
Spatial and hydrotechnical characteristics of the operational reaches in the analysed Upper Vistula Cascade.
Values in Table 1 reproduce the public waterway description [75] and are used for spatial and hydrotechnical context only. The plant-specific parameters used in the quantitative OHP calculations are reported separately below and may differ where operator or turbine-manufacturer data provide a more detailed technical basis.
The spatial configuration of the five reaches is presented in Figure 3. Reach R2 (Smolice–Łączany) was selected for detailed OHPA because it includes navigation and hydropower infrastructure and is subject to documented water-management conditions associated with the Łączany–Skawina system. Its location within the analysed river section is shown in Figure 3.
Figure 3.
Operational reaches of the analysed upper canalised Vistula River: (a) spatial configuration of the analysed Upper Vistula section; (b) longitudinal profile of the Upper Vistula Cascade.
Hydrological observations provide the Level 1 input data for the OHPA. Daily river-discharge series for the analysed Upper Vistula system were obtained from IMGW-PIB [76] and processed for 11 complete hydrological years (2014–2024), corresponding to 1 November 2013–31 October 2024. The quantitative case-study implementation uses daily discharge as the directly observed Level 1 input. Dynamic effective head was not reconstructed from the IMGW water-level series because paired headwater and tailwater observations were not consistently available at all five hydropower installations.
For each operational river reach, a documented or explicitly defined discharge proxy was assigned to the associated downstream hydropower installation and processed at daily resolution over the common assessment period. Direct IMGW profiles were used where available; where no local profile represented the required inflow, transparent lower/upper discharge proxies were retained as uncertainty bounds. Table 2 summarises the Level 1 discharge inputs used in the quantitative case study.
Table 2.
Hydrological input data used in the Level 1 OHPA.
The same observed discharge basis is used for reference and operational calculations within each assessment mode. Operational effects are introduced independently at Level 2 and therefore do not modify the underlying Level 1 discharge observations. Where sufficiently resolved headwater and tailwater records are available in future applications, the general formulation in Section 3.3 permits time-varying effective head to be used directly. In the present case study, unsupported time-varying head series were not imposed.
The Level 1 discharge inputs were combined with plant-specific hydro-technical limits for the Level 3 calculations. The principal parameters used in the case-study computation were maximum plant turbine discharge () and installed hydropower capacity (). Published head values and turbine configuration were retained as physical-consistency checks rather than interpreted as complete daily effective-head series.
The technical characteristics of the hydropower installations were obtained from operator documentation and turbine-manufacturer or other verified technical sources [77,78,79,80,81,82]. The plant-specific parameters and discharge-proxy treatment used directly in the quantitative case study are summarised in Table 3.
Table 3.
Technical and computational input parameters used in the Level 3 OHP calculations.
For the quantitative case-study implementation, the hydro-technical reference was evaluated using the normalised flow-availability factor:
where FHAFi,t is the flow-availability factor for reach Ri at time step t, which is dimensionless; is the observed or explicitly defined discharge input or proxy assigned to the hydropower installation associated with reach Ri at time step t, m3 s−1. The corresponding instantaneous reference hydropower output is
This provides a normalised case-study implementation of the general Level 3 formulation based on rated plant power and maximum turbine discharge, avoiding the introduction of unsupported daily effective-head or efficiency series. Published head values were used for physical-consistency checks. At Smolice, a literal plant-wide interpretation of the published = 56 m3 s−1 would imply efficiency greater than unity when combined with = 2.0 MW and the published head of 2.65 m; therefore = 112 m3 s−1 (2 × 56 m3 s−1) is used as the primary case, and 56 m3 s−1 is retained only as a sensitivity variant pending operator confirmation.
Observed electricity generation is not required as a computational input to the OHPA model. Where verified generation records are available from hydropower operators, they can be used independently to compare calculated operational OHP with recorded generation and provide additional empirical validation.
Operational information provides the Level 2 inputs for the OHPA. For the case-study application, the baseline assessment mode is based on documented operating conditions (k = doc) identified from publicly available operating rules, water-management documentation, and other verified sources [75,83,84,85]. These sources describe reach-specific operating conditions, requirements, and constraints associated with navigation, environmental requirements, water supply, flood protection, and other river functions.
The operational information was screened according to its physical effect on hydropower availability. A documented diversion, abstraction, or redistribution of flow is represented through ; a quantitatively specified change in hydraulic conditions is represented through ; a documented condition establishing generation unavailability is represented through Ai,t,doc. Operating requirements for which the available documentation does not provide a quantified physical effect are retained as Level 2 information and are not converted into assumed changes in discharge, hydraulic head, or hydropower output. The operational inputs and their representation in the OHPA model are summarised in Table 4.
Table 4.
Documented operational information used in the Level 2 OHPA.
Only operational effects supported by a quantitative physical basis are propagated from the Level 2 to Level 3 OHP calculations. Consequently, the presence of a documented river-use requirement in Table 4 does not by itself imply a reduction in OHP. Its effect is included only when the available information specifies how the requirement modifies discharge, hydraulic conditions, or operational availability.
Explicitly defined scenarios (k = sc) use the same Level 2 representation but replace documented operational values with specified scenario inputs. Scenario assumptions are identified separately from documented conditions and are used for sensitivity or scenario analysis rather than interpreted as observed operating effects. The distinction between k = doc and k = sc preserves the provenance of the operational inputs while retaining the same mathematical structure of the OHPA model.
Together, the hydrological observations in Table 2, technical parameters in Table 3, and operational information in Table 4 provide the input dataset for implementation of the OHPA procedure described in Section 3.5.
3.5. Operational Assessment Procedure
OHPA is determined for each operational river reach Ri over a defined assessment period using two independent information streams: hydrological observations and operational information represented by documented operating conditions or explicitly defined scenarios. Hydrological observations provide the Level 1 hydrological inputs for the assessment. In the present case study, daily river discharge constitutes the directly observed Level 1 input. Effective hydraulic head remains part of the general formulation and can be incorporated where sufficiently resolved headwater and tailwater observations are available. Operational records, officially established operating rules, water-management documentation, and other verified sources provide the operating conditions, requirements, and constraints assessed at Level 2. Only effects that can be quantitatively related to hydropower operation are introduced into the Level 3 calculations. Requirements without a quantified physical effect remain part of the Level 2 assessment and are not converted into assumed changes in discharge, hydraulic head, or hydropower output.
Level 1 characterises the hydrological state of each reach from the available observations. Level 2 independently assesses the operating conditions represented for the selected assessment mode and identifies their quantitatively specified effects on hydropower operation. The two information streams are integrated at Level 3. The reference and operational OHP follow the general formulation presented in Section 3.3, while the quantitative Upper Vistula case study implements the reference calculation using the normalised formulation given in Equations (13) and (14). Reference OHP represents hydropower potential for the observed hydrological state within the technical limits of the hydropower installation. Operational OHP incorporates the quantitatively specified effects identified at Level 2 while retaining the same assessment period and technical configuration. Level 4 relates operational OHP to reference OHP through the OHPA index.
The procedure is applied consistently across the analysed river reaches. Reach-specific differences in reference OHP arise from hydrological conditions and hydropower installation characteristics, whereas differences between reference and operational OHP reflect the quantitatively specified operational effects represented for the assessed mode. Using the same formulation and assessment period preserves comparability of OHPA among reaches without assuming identical hydrological, technical, or operating conditions. Reassessment is performed when the information underlying Level 1 or Level 2 changes. New hydrological observations update the Level 1 assessment, whereas new or revised operational information updates Level 2 independently. The affected Level 3 quantities and the Level 4 OHPA index are subsequently recalculated using the unchanged model formulation. Monitoring therefore supplies hydrological observations but is not controlled by, or subject to feedback from, the OHPA. Likewise, OHPA does not prescribe reservoir operation, hydraulic-structure control, or water allocation; it quantifies the resulting hydropower availability under the assessed conditions.
Repeated application of the procedure provides temporally comparable reference OHP, operational OHP, and OHPA values and permits changes in hydropower availability to be distinguished from changes in the assessment methodology. Section 4 applies the procedure to the upper canalised Vistula River using hydrological observations, hydropower installation characteristics, and the documented operational information available for the analysed reaches. In the Upper Vistula application, the primary quantitative calculations combine the daily Level 1 discharge inputs with plant-specific and values using Equations (13) and (14). Documented navigation and operational events are propagated to OHP only when a direct physical effect on turbine discharge, hydraulic conditions, or unit availability is quantitatively supported; otherwise, they are analysed as Level 2 operational evidence. R2 is additionally evaluated under an explicitly defined flow-redistribution scenario (k = sc) separately from the documented operational assessment (k = doc).
4. Results and Application of the OHPA Framework
4.1. Hydrological Coherence and Extreme-Flow Conditions
The hydrological analysis covered 11 complete hydrological years (2014–2024), corresponding to 1 November 2013–31 October 2024 (4018 daily time steps). Pairwise daily Spearman correlations among the five mainstem Vistula profiles used for the coherence analysis ranged from 0.815 to 0.972. The highest correlation occurred between Jawiszowice and Bieruń Nowy (rho = 0.972), while Czernichów-Prom and Sierosławice were also strongly correlated (rho = 0.969). The consistently high correlations indicate a dominant common temporal signal along the analysed mainstem.
Principal component analysis was performed on standardised log-transformed daily discharges for the 3916 days with complete observations at all five mainstem profiles. The principal components (PCs) were ranked according to their explained variance. The first component (PC1) explained 92.379% of total variance, and the second component (PC2) explained a further 5.05%. PC1 loadings were nearly uniform and positive (0.440–0.452), confirming that the first component represents a system-scale hydrological mode rather than a localised reach response. The five operational reaches are therefore treated as connected units exposed to common hydrological forcing, while reach-scale differences are interpreted primarily in relation to infrastructure, flow redistribution, local tributary inputs, and operating conditions. The principal-component results are presented in Figure 4, while the descriptive flow-distribution metrics for five mainstem profiles are summarised in Table 5.
Figure 4.
Explained variance of the principal components derived from standardised log-transformed daily discharge at five mainstem Vistula profiles (complete-case N = 3916).
Table 5.
Selected flow-distribution metrics for the principal mainstem Vistula profiles over hydrological years 2014–2024 (discharge in m3 s−1).
For the detailed R2 analysis, the observed Smolice discharge series was used to define empirical hydrological-state classes: very low (≤P10), low (P10–P25), normal (P25–P75), high (P75–P90), and very high (>P90). The corresponding Smolice thresholds were P10 = 29.5 m3 s−1, P25 = 33.9 m3 s−1, P75 = 72.35 m3 s−1, and P90 = 113 m3 s−1. These classes provide an observed, flow-based representation of hydrological scarcity and excess without imposing an external drought index on the OHPA calculation.
4.2. Influence of Regulated Tributaries on System Hydrology
Because the mainstem signal reflects both natural inflow and upstream regulation, the Skawa was analysed as an observational example of how reservoir operation can modify the boundary conditions delivered to the Vistula. The Świnna Poręba reservoir was officially completed in 2017 and is operated, among other purposes, to retain water and support flows during low-flow periods [87]. Hydrological year 2017 was therefore treated as a transition year and excluded from the pre/post comparison.
Upstream of the reservoir, at Sucha Beskidzka, the empirical low-flow Q95 (P5) decreased from 2.13 m3 s−1 in 2014–2016 to 1.48 m3 s−1 in 2018–2024. In contrast, downstream low-flow values increased from 1.46 to 5.25 m3 s−1 at Wadowice and from 1.66 to 6.08 m3 s−1 at Zator. The coefficient of variation also decreased downstream, from 1.363 to 0.991 at Wadowice and from 1.494 to 1.052 at Zator. The contrasting upstream and downstream response is consistent with flow equalisation by reservoir operation, although the comparison is observational and is not interpreted as a controlled causal experiment. The corresponding changes in empirical low-flow Q95 are shown in Figure 5.
Figure 5.
Empirical low-flow Q95 (P5) before full operation (2014–2016) and during the full-operation period (2018–2024) of the Świnna Poręba reservoir. Hydrological year 2017 was treated as a transition period.
Exploratory regressions of downstream discharge on upstream discharge also indicated a post-operation shift and interaction, with estimated upstream crossover discharges of approximately 8.9 m3 s−1 for Wadowice and 9.3 m3 s−1 for Zator. This pattern supports the interpretation that the influence of reservoir regulation is most visible in the low-flow range and illustrates how tributary regulation may affect the hydrological conditions of the downstream multifunctional Vistula system.
4.3. Hydro-Technical Reference Hydropower Availability
Hydro-technical reference availability was calculated before applying any operational constraint. For each reach-associated hydropower installation, the case-study reference was determined using the normalised flow-availability formulation given in Equations (13) and (14). The resulting annual values represent flow-limited hydro-technical reference envelopes under observed hydrology; they are not actual electricity production.
For R1 (Smolice), the primary interpretation uses = 112 m3 s−1, i.e., 2 × 56 m3 s−1 for the two bulb units. This resolves the physical inconsistency of interpreting the published 56 m3 s−1 value as plant-wide together with = 2.0 MW and the published head of 2.65 m. Under the primary interpretation, mean annual was 8.79 GWh year−1, with annual values ranging from 6.41 to 10.14 GWh year−1. The 56 m3 s−1 interpretation produced 13.93 GWh year−1 and is retained only as a sensitivity case pending operator confirmation [77].
For R2 (Łączany), alternative upstream discharge definitions yielded mean annual values of 16.48 GWh year−1 using Smolice alone and 18.20 GWh year−1 using the combined Smolice–Zator reference proxy. R3 (Kościuszko), evaluated using Czernichów-Prom discharge together with = 3.3 MW and = 100 m3 s−1 [79], produced a mean annual reference of 13.42 GWh year−1 (10.94–17.02 GWh year−1). At R4 (Dąbie), the lower Kraków-flow reconstruction produced 12.80 GWh year−1, whereas the downstream Sierosławice proxy produced 17.40 GWh year−1. The corresponding R5 (Przewóz) estimates were 15.41 and 21.20 GWh year−1. Across all five reach-associated installations, the mean annual hydro-technical reference envelope therefore ranged from 66.90 to 79.01 GWh year−1 (Table 6).
Table 6.
Hydro-technical reference availability for the five reach-associated hydropower installations: hydrological years 2014–2024.
The calculated OHP values represent estimated hydropower potential under the defined hydrological and operational conditions and should not be interpreted as actual electricity generation. Public operator benchmarks provide plausibility checks but are not treated as time-matched validation data. The planned annual production reported for Smolice (6.91 GWh year−1) corresponds to approximately 79% of the mean annual under the interpretation, while the 11 GWh value published for Łączany corresponds to approximately 60–67% of the two reference variants [77,78]. Because the publication periods of these benchmark values are not matched to the 2014–2024 hydrological series, these ratios are not interpreted as observed OHPA values.
4.4. Documented Operational Constraints and Hydrological Context
A structured operational-event database was compiled from public navigation notices and archived operational information issued by RZGW Kraków [75,83,84,85,86]. The database contains 53 event records covering confirmed closures and restrictions associated with low flow, high water, ice, maintenance, failures, power outages, works, technical tests, operating schedules, sporting or security events, and other documented causes. Public archival coverage was not sufficiently continuous for 2014–2018 to infer unrestricted operation. The core quantitative operational window was therefore defined as 2021–2024, when 14, 6, 9, and 13 year-coded events, respectively, were identified; 2019–2020 records were retained as contextual evidence. A missing public notice was never coded as a confirmed OPEN operation.
Within the 2021–2024 core window, 42 year-coded events were identified: 27 CLOSED and 15 RESTRICTED. These events were not automatically translated into hydropower-energy losses because a navigation closure or lock restriction does not necessarily imply a reduction in turbine discharge, effective head, or generating-unit availability. Instead, the event database provides independent Level 2 evidence about the operating context and allows the hydrological conditions associated with selected restrictions to be tested directly (Table 7).
Table 7.
Selected documented operational episodes and their hydrological context. Percentiles refer to the full 2014–2024 Czernichów-Prom discharge series.
The high-water events provide clear hydrological support for event classification: The median discharges during the 2021 and 2024 closures corresponded to approximately the 99th percentile of the long-term Czernichów-Prom series. By contrast, the 2024 Kościuszko low-flow schedule showed a weaker purely hydrological signal than the 2019 restriction, consistent with the official notice also identifying intensive tourist traffic as an operating factor. This contrast supports the Level 2 treatment of documented events as multi-factor operating states rather than converting every notice into a single discharge subtraction.
4.5. Scenario-Based OHPA Evaluation for the Representative R2 Reach
The reach R2 was used to demonstrate the numerical OHPA calculation without attributing an undocumented fraction of river flow to a specific competing function. The hydro-technical reference was defined using the combined Smolice and Zator discharge as the gross upstream flow proxy and the Łączany technical limits ( = 2.5 MW; = 62 m3 s−1). A separate flow-redistribution scenario used the observed Czernichów-Prom main-channel discharge as the discharge input. The difference between these flow series cannot be assigned uniquely to the Łączany-Skawina canal, navigation, water supply, routing, or local inflows; therefore, the calculation is explicitly classified as scenario-based rather than as an observed operational loss.
Across hydrological years 2014–2024, mean annual reference OHP for the gross upstream flow proxy was 18.20 GWh year−1, while the flow-redistribution scenario yielded a mean annual OHP of 13.69 GWh year−1. The resulting multi-year OHPA index was 0.752, corresponding to a 24.8% reduction in hydropower availability relative to the hydro-technical reference. Annual OHPA values ranged from 0.673 to 0.876, demonstrating that the represented redistribution effect was not constant in time (Table 8).
Table 8.
Hydropower availability for R2 under the defined flow-redistribution scenario across hydrological states.
The OHPA index showed a strong dependence on the hydrological state, with values of 0.390 under very-low-flow conditions, 0.500 under low-flow conditions, and 0.711 under normal conditions, increasing to 0.993 and 1.000 under high- and very-high-flow conditions, respectively. Thus, the relative effect of the defined redistribution scenario decreased with increasing flow and became negligible once the available reference flow approached or exceeded the turbine-capacity limit, as illustrated in Figure 6.
Figure 6.
OHPA index for the representative R2 reach across hydrological states under explicitly defined flow-redistribution scenario, not interpreted as measured electricity-production losses.
4.6. Sensitivity and Uncertainty Analysis
Sensitivity analysis focused on uncertainties that materially affect the physical calculation rather than on arbitrary perturbations of non-observed navigation, drought, flood-control, or environmental discharges. The largest technical-parameter ambiguity occurred at Smolice. Interpreting the published = 56 m3 s−1 value as plant-wide capacity increased the calculated mean annual reference energy from 8.79 to 13.93 GWh year−1 (+58.5%), but this interpretation implies conversion efficiency greater than unity when combined with the published and head and was therefore rejected as the primary case. Retaining it as a sensitivity variant documents the data ambiguity without treating the physically inconsistent value as equally plausible.
Hydrological-proxy uncertainty was smaller at Łączany (16.48–18.20 GWh year−1; +10.4% from the conservative to gross proxy) but substantially larger in the Kraków reach. The Dąbie reference ranged from 12.80 to 17.40 GWh year−1 (+36.0%), and the Przewóz reference ranged from 15.41 to 21.20 GWh year−1 (+37.6%). The lower Kraków reconstruction based on Czernichów-Prom, Radziszów, and Balice and the observed Sierosławice series were strongly correlated over 3901 common days (Pearson r = 0.973), but a linear comparison revealed a systematic offset, with a slope of 1.034 and an intercept of approximately 24.4 m3 s−1. The result supports the use of transparent lower and upper reference bounds rather than a single reconstructed discharge.
Hydraulic-head uncertainty was considered separately because continuous plant-specific effective-head series were unavailable for the analysed installations. In the normalised case-study formulation (Equations (13) and (14)), published head values are not direct computational inputs but are used for physical-consistency checks. An arbitrary perturbation of published head values was therefore not introduced as a quantitative sensitivity test because it would not affect the reported case-study OHP results or represent observed effective-head variability. In the general hydropower formulation, for a given turbine discharge, and while the installed-capacity limit is not binding, hydropower output varies linearly with effective hydraulic head. Accordingly, relative uncertainty in effective head results in approximately proportional relative uncertainty in hydropower output. The absence of time-resolved effective-head data remains a source of uncertainty that cannot be quantified independently with the available dataset.
The operational-event layer introduces a different type of uncertainty: incomplete archival coverage and interval censoring of some start or end dates. These uncertainties were handled by preserving event-status provenance rather than converting unknown periods into unrestricted operation. Similarly, documented navigation restrictions were not assigned an energy penalty unless a direct effect on turbine discharge, hydraulic conditions, or unit availability could be identified. Additional electricity-generation data from plant operators would strengthen external validation but are not required to reproduce the hydrological, hydro-technical, event-based, or scenario-based results presented here.
5. Discussion
The case-study results support the central premise of OHPA: The hydropower resource and its operational availability are distinct but interrelated properties of an MRS. The five Upper Vistula reaches are exposed to a strongly coherent hydrological signal, yet their hydro-technical reference characteristics and documented operating states differ. This empirical pattern supports treating the cascade as a hydrologically coherent system comprising operationally heterogeneous assessment units.
(1) Ad RQ1. Conventional HPA has two interrelated methodological limitations that reduce its applicability to MRSs under hydrological extremes. First, it does not explicitly separate the hydro-technical reference determined by observed hydrology from the effects of documented or explicitly defined operating conditions on hydropower availability. This separation is particularly important under extreme-flow conditions, when observed hydrology defines the hydro-technical reference, while river-management requirements and operational conditions can modify hydropower availability relative to that reference. Second, the hydro-technical reference itself is subject to uncertainty when local discharge must be represented by alternative proxies or published turbine parameters are ambiguous. The five-reach reference envelope of 66.90–79.01 GWh year−1 illustrates how this uncertainty affects the reference used to assess operating effects in the Upper Vistula case. Without this separation, hydrological and operational influences on hydropower availability cannot be consistently distinguished. OHPA addresses these limitations by establishing the hydro-technical reference under observed hydrology as a distinct baseline and evaluating quantitatively specified operating effects against it while retaining the associated reference uncertainty.
(2) Ad RQ2. The reconstructed event database and documented operating requirements show that relevant Level 2 conditions include operational restrictions triggered by high water, ice, and low-flow conditions, technical failures, maintenance, power outages, works, navigation schedules, environmental-flow requirements, other documented water-use requirements, and event-related restrictions. These conditions affect hydropower availability through different physical mechanisms and therefore should not be represented as uniform reductions in turbine discharge. A lock closure does not necessarily reduce turbine discharge, whereas a quantitatively specified flow redistribution, hydraulic restriction, or generating-unit outage can directly affect OHP. Accordingly, Level 2 represents the relevant operating conditions, requirements, and constraints, while only their documented and quantitatively specified physical effects are propagated to Level 3 for OHP calculation.
(3) Ad RQ3. Hydrological and operational information are integrated by maintaining their separation at Levels 1 and 2 and selectively coupling them at Level 3 through quantitatively specified physical effects on OHP. Level 1 characterises the hydrological state, while Level 2 represents documented or explicitly defined operating conditions, requirements, and constraints. At Level 3, the hydro-technical reference is determined from observed hydrology and plant-specific technical characteristics, whereas operational OHP incorporates only those Level 2 effects that can be quantitatively represented through turbine discharge, hydraulic conditions, or generation availability. Level 4 expresses the resulting operational OHP relative to the corresponding hydro-technical reference through the OHPA index, preserving a common hydrological basis for their comparison. Mainstem correlations of 0.815–0.972 and the 92.38% contribution of PC1 indicate a dominant system-scale hydrological forcing, while hydro-technical characteristics and documented operating states vary among individual assessment units. The resulting hierarchy therefore reconciles system-scale hydrological coherence with reach-specific operational heterogeneity, allowing operational effects to be evaluated without treating neighbouring reaches as hydrologically independent. The R2 scenario illustrates the resulting state-dependent assessment: the multi-year scenario-based OHPA index of 0.752 decreased to 0.390 under very-low-flow conditions and approached unity under high and very-high flows.
(4) Ad RQ4. Operational hydropower availability can be reassessed within the same hierarchical structure as hydrological conditions, documented operating events, or plant-specific information change. Updated hydrological observations update the Level 1 hydrological state and allow the hydro-technical reference to be recalculated for the corresponding assessment period, while newly documented or modified operating conditions update Level 2. At Level 3, the updated inputs are used to recalculate the corresponding reference and operational OHP, from which Level 4 derives the updated OHPA index. This structure enables repeated assessment by updating the relevant inputs while retaining the same assessment architecture, thereby preserving the distinction between changes in the hydrological reference and changes in operational hydropower availability associated with operating conditions. The present application also shows that such reassessment can be performed using publicly available data without requiring internal operator databases. Public IMGW data define the hydrological state; public technical information defines the hydro-technical limits; public operational notices identify documented constraints. Where the physical effect of an event cannot be quantified, OHPA preserves it as Level 2 evidence rather than assigning an unsupported quantitative effect on OHP. The OHPA framework can be applied to other multifunctional river systems by retaining the same hierarchical assessment structure while adapting the hydrological inputs, hydropower characteristics, and documented operating conditions and constraints to local system characteristics.
The hydrological-coherence result extends the interpretation of hydropower availability beyond the individual barrage. In the Upper Vistula, most daily flow variability is shared, and neighbouring barrages should therefore not be treated as statistically independent hydrological replicates. Spatial differences in hydropower availability should instead be interpreted in relation to plant characteristics, flow redistribution, tributary inflows, and operating conditions. The observed downstream changes in low-flow characteristics following regulation of the Skawa further indicate that tributary regulation may modify the hydrological conditions entering the main river system. These findings demonstrate why hydrological connectivity and operational heterogeneity should be represented jointly rather than treated as separate system properties. Within OHPA, the common hydrological signal provides the basis for comparison across reaches, while reach-specific technical and operating conditions determine how that shared hydrological resource translates into hydropower availability.
The R2 scenario demonstrates the practical value of this distinction. Its 24.8% multi-year reduction does not represent an observed loss of electricity generation and cannot be attributed uniquely to navigation or the Łączany–Skawina water-supply function; it quantifies the effect of the explicitly defined flow-redistribution scenario on hydropower availability at the associated Łączany installation. The scenario-based OHPA index decreases to 0.390 under very-low-flow conditions, showing that the relative effect of the specified redistribution increases as water availability becomes more constrained. The R2 results therefore demonstrate that the operational significance of a specified flow redistribution is state-dependent rather than constant, becoming proportionally greater as the available hydrological resource decreases.
Several limitations define the present scope of application. Continuous plant-specific effective head and turbine discharge are unavailable for all installations, requiring a rated-flow hydro-technical envelope to represent the reference range. Public operational archives support event-based analysis mainly from 2021 onward and cannot be treated as complete day-by-day operating logs for earlier years. At Smolice, the published maximum turbine discharge of 56 m3 s−1 is assumed to apply per turbine, giving a primary plant-wide value of 112 m3 s−1; the alternative plant-wide interpretation of 56 m3 s−1 is retained as a sensitivity variant because, when combined with the published installed capacity and head, it would imply an efficiency greater than unity. For R2, the difference between the upstream gross-flow proxy and the main-channel discharge is treated as a flow-redistribution scenario rather than as an observed operational loss, because it may reflect several physical processes that cannot be separated with the available data. These assumptions introduce uncertainty into the Smolice hydro-technical reference and limit the operational attribution of the R2 results. These data and model limitations are reported explicitly, and effects lacking quantitative support are not converted into deterministic corrections to OHP. OHPA remains applicable across low- and high-flow hydrological states, including hydrological extremes, provided that the relevant hydrological and operating conditions can be quantitatively characterised within the assessment framework. Hydrological extremes are therefore distinguished from short-term emergency operating regimes in which the MRS temporarily operates outside the standard quantitatively assessable regime and overriding safety, flood-protection, hydraulic-structure protection, or other emergency procedures determine system operation. Such emergency regimes remain outside the standard OHPA framework until the hydrological and operating conditions can again be quantitatively characterised. Observed electricity-generation records from plant operators would provide an independent basis for external validation. Time-matched records could be compared with corresponding reference and operational/scenario OHP values to examine their correspondence with observed generation under the same hydrological and operating conditions. Their current absence limits external validation but not the reproducibility of the public-data analyses.
6. Conclusions
This study developed OHPA as a framework for extending conventional hydropower-potential assessment from hydro-technical resource estimation to the assessment of operational availability in multifunctional river systems and implemented it through a four-level hierarchical model. Its central methodological principle is the explicit separation of the hydro-technical reference from the effects of documented or explicitly defined operating conditions. Level 2 represents these conditions according to their physical effects on turbine discharge, hydraulic conditions, or generation availability rather than assuming that navigation, environmental, flood-control, drought-mitigation, and other functions constitute additive discharge withdrawals.
Applications to five operational reaches of the upper canalised Vistula River showed that hydrological coherence can coexist with reach-specific operational differentiation within a single MRS. Mainstem correlations of 0.815–0.972 and the 92.38% contribution of PC1 support treating the reaches as connected assessment units rather than independent hydrological cases. The mean annual hydro-technical reference envelope of 66.90–79.01 GWh year−1 reflects variation associated with discharge-proxy uncertainty and plant-parameter interpretation. At R2, the defined flow-redistribution scenario yielded a scenario-based OHPA index of 0.752, indicating that operational OHP represented 75.2% of the corresponding hydro-technical reference under the specified scenario. The decline of the index to 0.390 under very-low-flow conditions indicates that the relative effect of the specified redistribution increases as water availability becomes more constrained.
The operational-event analysis reinforced the need to distinguish hydrological conditions from documented operating causes and their quantifiable implications for hydropower availability. High-water closures coincided with extreme discharge conditions, whereas low-flow restrictions reflected hydrological scarcity together with additional operating considerations. A documented operational event therefore does not itself constitute a quantitative reduction in OHP; such a reduction is introduced only when its physical effect can be explicitly represented. This prevents unsupported quantitative adjustments from entering the assessment.
The theoretical contribution of OHPA is twofold: It conceptualises an MRS as a hydrologically connected system of operationally differentiated assessment units and establishes an explicit distinction between the hydro-technical resource and its operational availability. Operational availability thereby constitutes a distinct assessment dimension, linking the hydro-technical resource to quantitatively specified operating effects within a common hydrological context. In practical terms, OHPA provides river managers and hydropower operators with a quantitative basis for distinguishing hydrological limitations from supported operating effects, identifying the hydrological states in which specified effects have the greatest relative influence, and reassessing availability as conditions change. OHPA is an assessment rather than an allocation tool: It evaluates operational consequences without prescribing how water should be distributed among competing river functions. Its implementation using public hydrological, technical, and operational data enables application where detailed operator records are unavailable.
The present application is nevertheless limited by the absence of continuous plant-specific effective-head and turbine-discharge records, incomplete historical operational archives, uncertainty in selected plant parameters, and the scenario-based representation of the R2 flow redistribution. These limitations primarily constrain the precision of operational attribution and the depth of external validation. Future research should strengthen OHPA through time-matched validation against observed electricity-generation records and test its transferability across river systems with contrasting hydrological regimes, operating conditions, and degrees of multifunctionality.
Author Contributions
Conceptualisation, K.W., T.D. and R.R.; data curation, K.W., R.R. and S.M.; formal analysis, K.W., S.M. and T.D.; funding acquisition, K.W.; investigation, K.W., T.D., S.M., L.D. and R.R.; methodology, K.W., R.R. and T.D.; project administration, K.W.; resources, K.W., R.R., and S.M.; software, S.M. and T.D.; supervision, K.W. and T.D.; validation, K.W., T.D., S.M. and R.R.; visualization, K.W., L.D. and S.M.; writing—original draft, K.W., T.D., R.R. and S.M.; writing—review and editing, K.W., L.D. and S.M. All authors have read and agreed to the published version of the manuscript.
Funding
This research outcome was funded by the research project no 1/S/KRiZR/2026 and financed by the Maritime University of Szczecin from a subsidy of the Ministry of Science and Higher Education.
Data Availability Statement
Hydrological observations used in this study are publicly available from IMGW-PIB [76]. Public technical and operational sources used in the case study are identified in references [75,77,78,79,80,81,82,83,84,85,86,87]. Processed datasets and calculation outputs supporting the reported results are available from the corresponding author upon reasonable request.
Conflicts of Interest
The authors declare no conflicts of interest.
Abbreviations
| DSS | Decision Support Systems |
| GISs | Geographic Information Systems |
| HPA | Hydropower Potential Assessment |
| MRS | Multifunctional River System |
| OHP | Operational Hydropower Potential |
| OHPA | Operational Hydropower Potential Assessment |
| PC | Principal Component |
| RISs | River Information Services |
References
- Gernaat, D.E.H.J.; Bogaart, P.W.; van Vuuren, D.P.; Biemans, H.; Niessink, R. High-resolution assessment of global technical and economic hydropower potential. Nat. Energy 2017, 2, 821–828. [Google Scholar] [CrossRef] [Scilit]
- Moran, E.F.; Lopez, M.C.; Moore, N.; Müller, N.; Hyndman, D.W. Sustainable hydropower in the 21st century. Proc. Natl. Acad. Sci. USA 2018, 115, 11891–11898. [Google Scholar] [CrossRef] [Scilit] [PubMed]
- Obahoundje, S.; Diedhiou, A.; Akpoti, K.; Kouassi, K.L.; Ofosu, E.A.; Kouame, D.G.M. Predicting climate-driven changes in reservoir inflows and hydropower in Côte d’Ivoire using machine learning modeling. Energy 2024, 302, 131849. [Google Scholar] [CrossRef] [Scilit]
- Ma, H.; Xiao, H. Practice and Prospects for Intelligent Construction and Smart Operation of Lancang River Hydropower Projects. J. Intell. Constr. 2024, 2, 1–14. [Google Scholar] [CrossRef] [Scilit]
- Marcinkowski, P. Large-scale assessment of hydropower potential: Current state and future projections for Poland. Energy 2025, 328, 136700. [Google Scholar] [CrossRef] [Scilit]
- Raso, L.; Bader, J.-C.; Weijs, S. Reservoir Operation Optimized for Hydropower Production Reduces Conflict with Traditional Water Uses in the Senegal River. J. Water Resour. Plan. Manag. 2020, 146, 05020003. [Google Scholar] [CrossRef] [Scilit]
- Operacz, A. The term “effective hydropower potential” based on sustainable development—An initial case study of the Raba river in Poland. Renew. Sustain. Energy Rev. 2017, 75, 1453–1463. [Google Scholar] [CrossRef] [Scilit]
- Damazio, J.M.; dos Santos, M.A. The multiple services of hydropower plants in the context of sustainable electric sector in Brazil. Energy Explor. Exploit. 2024, 42, 1131–1144. [Google Scholar] [CrossRef] [Scilit]
- Rasul, G.; Neupane, N.; Hussain, A.; Pasakhala, B. Beyond hydropower: Towards an integrated solution for water, energy and food security in South Asia. Int. J. Water Resour. Dev. 2021, 37, 466–490. [Google Scholar] [CrossRef] [Scilit]
- Awah, L.S.; Belle, J.A.; Nyam, Y.S.; Orimoloye, I.R. A Systematic Analysis of Systems Approach and Flood Risk Management Research: Trends, Gaps, and Opportunities. Int. J. Disaster Risk Sci. 2024, 15, 45–57. [Google Scholar] [CrossRef] [Scilit]
- Dora, B.K.; Bhat, S.; Mitra, A.; Ernst, D.; Halinka, A.; Zychma, D.; Sowa, P. The Global Electricity Grid: A Comprehensive Review. Energies 2025, 18, 1152. [Google Scholar] [CrossRef] [Scilit]
- Lehneis, R.; Harnisch, F.; Thrän, D. Electricity Production Landscape of Run-of-River Power Plants in Germany. Resources 2024, 13, 174. [Google Scholar] [CrossRef] [Scilit]
- Woś, K.; Radoń, R.; Tekielak, T.; Wrzosek, K.; Pieron, Ł.; Piórecki, M. Role of Multifunctional Water Reservoirs in the Upper Vistula Basin in Reducing Flood Risk. Water 2022, 14, 4025. [Google Scholar] [CrossRef] [Scilit]
- Zeng, H.; Zhang, T.-Y.; Liao, Y.-M.; Ma, G.-W.; Li, J.-D.; Huang, W.-B.; Zhu, Y.-M.; Chen, S.-J. Hierarchical Framework for Reservoir Co-management: A Cross-scale Reservoir Dispatch Paradigm Balancing Energy and Morphogenic Flow Needs. Water Resour. Manag. 2026, 40, 108. [Google Scholar] [CrossRef] [Scilit]
- Flores, I.A.C.; Paz, S.M.; Gómez, M.F.V.; Willems, P.; Gobin, A. Impacts of climate change on the hydropower potential of a multipurpose storage system project in Bolivian Andes. J. Hydrol. Reg. Stud. 2025, 62, 102903. [Google Scholar] [CrossRef] [Scilit]
- Chen, Y.; Huang, G.; Liu, Y.; Luo, B.; Wang, S.G.; Li, Y.P.; Li, X. Energy-water-carbon system management in response to climate change in China under uncertainties (2026–2050). Resour. Conserv. Recycl. 2025, 212, 107957. [Google Scholar] [CrossRef] [Scilit]
- Tomczyk, P. Potential and prospects for hydropower development: Example of the Odra River basin in Poland. Renew. Energy 2026, 269, 125879. [Google Scholar] [CrossRef] [Scilit]
- Durajczyk, P.; Drop, N.; Niedzielski, P. Possibilities of Using Inland Navigation to Improve the Efficiency of Interurban Freight Transport with the Use of the RIS System—Case Study of the Route Opole–Szczecin. Sustainability 2024, 16, 10754. [Google Scholar] [CrossRef] [Scilit]
- Niedzielski, P.; Durajczyk, P.; Drop, N. Utilizing the RIS system to improve the efficiency of inland waterway transport companies. Procedia Comput. Sci. 2021, 192, 4853–4864. [Google Scholar] [CrossRef] [Scilit]
- Pieron, Ł.; Jędrzychowski, K.; Iwicki, S.; Durajczyk, P. Harmonisation of Navigation Signs on Inland Waterways in Poland with European Regulations to Improve Navigation Safety. Sustainability 2026, 18, 3844. [Google Scholar] [CrossRef] [Scilit]
- Baszak, M.; Ewelina Złoczowska, E.; Ślączka, W.; Czarnecka-Komorowska, D.; Garbacz, T. Analysis and assessment of the possibility of transporting liquefied natural gas on the Oder in the context of the island gasification of Poland. Adv. Sci. Technol. Res. J. 2025, 19, 30–41. [Google Scholar] [CrossRef] [Scilit] [PubMed]
- Woś, K.; Wrzosek, K.; Kolerski, T. The Energy Potential of the Lower Vistula River in the Context of the Adaptation of Polish Inland Waterways to the Standards of Routes of International Importance. Energies 2022, 15, 1711. [Google Scholar] [CrossRef] [Scilit]
- Biegowski, J.; Robakiewicz, M.; Woś, K.; Wrzosek, K. Sediment Transport Management Using the Planned Construction of the Lower Vistula Cascade as an Example. Energies 2022, 15, 1689. [Google Scholar] [CrossRef] [Scilit]
- Tomczyk, P.; Wiatkowski, M. Shaping changes in the ecological status of watercourses within barrages with hydropower schemes—Literature review. Arch. Environ. Prot. 2020, 46, 78–94. [Google Scholar] [CrossRef] [Scilit]
- Kuriqi, A.; Pinheiro, A.N.; Sordo–Ward, A.; Bejarano, M.D.; Garrote, L. Ecological impacts of run–of–river hydropower plants—Current status and future prospects on the brink of energy transition. Renew. Sustain. Energy Rev. 2021, 142, 110833. [Google Scholar] [CrossRef] [Scilit]
- Młyński, D.; Operacz, A.; Wałęga, A. Sensitivity of methods for calculating environmental flows based on hydrological characteristics of watercourses regarding the hydropower potential of rivers. J. Clean. Prod. 2020, 250, 119527. [Google Scholar] [CrossRef] [Scilit]
- Wasti, A.; Ray, P.; Wi, S.; Folch, C.; Ubierna, M.; Karki, P. Climate Change and the Hydropower Sector: A Global Review. WIREs Clim. Change 2022, 13, e757. [Google Scholar] [CrossRef] [Scilit]
- Ahialey, E.K.; Kabo-Bah, A.T.; Gyamfi, S. Impacts of LULC and Climate Changes on Hydropower Generation and Development: A Systematic Review. Heliyon 2023, 9, e21247. [Google Scholar] [CrossRef] [Scilit] [PubMed]
- Levasseur, A.; Mercier-Blais, S.; Prairie, Y.T.; Tremblay, A.; Turpin, C. Improving the accuracy of electricity carbon footprint: Estimation of hydroelectric reservoir greenhouse gas emissions. Renew. Sustain. Energy Rev. 2021, 136, 110433. [Google Scholar] [CrossRef] [Scilit]
- Golgojan, A.; White, C.J.; Bertram, D. An assessment of run of river hydropower potential in Great Britain. Proc. Inst. Civ. Eng. Water Manag. 2025, 178, 42–61. [Google Scholar] [CrossRef] [Scilit]
- Feng, X.; Salmani, S.; Bagheri, S.; Shourian, M. Optimal Multipurpose Reservoir Operation using Many-objectives Particle Swarm Optimization. Water Resour. Manag. 2026, 40, 377. [Google Scholar] [CrossRef] [Scilit]
- Tang, R.; Ren, M.; Wang, Y.; Zhang, X. A Framework of Multi-Objective Reservoir Operation Model Construction Based on Competitive Feature Recognition. Water Resour. Manag. 2026, 40, 416. [Google Scholar] [CrossRef] [Scilit]
- Wang, H.; Guo, S.; Tian, J.; Zhong, S. Multi-objective Reservoir Operation Scheme Considering Hydrologic Alteration and Ecological Water Demand. Water Resour. Manag. 2026, 40, 205. [Google Scholar] [CrossRef] [Scilit]
- Mo, C.; Lin, Z.; Li, N.; Wan, X.; Tang, G.; Huang, Y. Multi-objective Joint Optimization Operation of Cascade Reservoirs Considering River Hydrological Health Assessment. Water Resour. Manag. 2026, 40, 87. [Google Scholar] [CrossRef] [Scilit]
- Bărbulescu, A.; Costache, R.; Dumitriu, C.Ș. Climate Change and Hydrological Processes. Water 2025, 17, 1474. [Google Scholar] [CrossRef] [Scilit]
- Granata, F.; Di Nunno, F. Pathways for Hydrological Resilience: Strategies for Adaptation in a Changing Climate. Earth. Syst. Environ. 2026, 10, 203–231. [Google Scholar] [CrossRef] [Scilit]
- Sharma, R.N.; Chand, N.; Sharma, V.; Yadav, D. Decision support system for operation, scheduling and optimization of hydro power plant in Jammu and Kashmir region. Renew. Sustain. Energy Rev. 2015, 43, 1099–1113. [Google Scholar] [CrossRef] [Scilit]
- Myateg, T.; Mitrofanov, S.; Xi, C.; Sekretarev, Y.; Safaraliev, M.; Volosatov, R.; Arestova, A.; Gulakhmadov, A. Long-Term Hydropower Plant Scheduling Considering Environmental and Economic Criteria. Sustainability 2024, 16, 10106. [Google Scholar] [CrossRef] [Scilit]
- Buchatskiy, P.Y.; Onishchenko, S.V.; Teploukhov, S.V.; Atagyan, D.A. Software Application for Identifying the Location of Small Hydropower Plants, Taking into Account the Landscape and Climatic Characteristics of the Region. In Proceedings of the 9th International Conference on Information, Control, and Communication Technologies (ICCT), Gomel, Belarus, 7–11 October 2025; pp. 1–4. [Google Scholar] [CrossRef] [Scilit]
- Punys, P.; Jurevičius, L.; Balčiūnas, A. HYPOSO Map Viewer: A Web-Based Atlas of Small-Scale Hydropower for Selected African and Latin American Countries. Water 2024, 16, 1276. [Google Scholar] [CrossRef] [Scilit]
- Sahin, M.E.; Ozbay Karakus, M. Smart hydropower management: Utilizing machine learning and deep learning method to enhance dam’s energy generation efficiency. Neural Comput. Appl. 2024, 36, 11195–11211. [Google Scholar] [CrossRef] [Scilit]
- Cao, J.; Jing, R.; Liu, X.; Li, G.; Chen, H.; Deng, L.; Lu, L.; Zhou, S.; Li, Q. A review on the development of smart hydropower: Definition, technology, application and prospect. Renew. Sustain. Energy Rev. 2026, 239, 117137. [Google Scholar] [CrossRef] [Scilit]
- Rot Weiss, E.; Gselman, R.; Polner, R.; Šafarič, R. Cascade Hydropower Plant Operational Dispatch Control Using Deep Reinforcement Learning on a Digital Twin Environment. Energies 2025, 18, 4660. [Google Scholar] [CrossRef] [Scilit]
- Kougias, I.; Aggidis, G.; Avellan, F.; Deniz, S.; Lundin, U.; Moro, A.; Muntean, S.; Novara, D.; Pérez-Díaz, J.I.; Quaranta, E.; et al. Analysis of emerging technologies in the hydropower sector. Renew. Sustain. Energy Rev. 2019, 113, 109257. [Google Scholar] [CrossRef] [Scilit]
- Karakoyun, Y. Determination of Effective Parameters for Hydropower Plants’ Energy Generation: A Case Study. Appl. Sci. 2024, 14, 2069. [Google Scholar] [CrossRef] [Scilit]
- Bhattarai, R.; Mishra, B.K.; Bhattarai, D.; Khatiwada, D.; Kumar, P.; Meraj, G. Assessing Hydropower Potential in Nepal’s Sunkoshi River Basin: An Integrated GIS and SWAT Hydrological Modeling Approach. Scientifica 2024, 2024, 1–19. [Google Scholar] [CrossRef] [Scilit] [PubMed]
- Aybehon, E.Y.; Tefera, W.M.; Akirso, B. Assessment and mapping of potential sites for small-scale hydropower in Gidabo River catchment. Hydrol. Sci. J. 2024, 69, 1274–1287. [Google Scholar] [CrossRef] [Scilit]
- Zhou, Y.; Hejazi, M.; Smith, S.; Edmonds, J.; Clarke, H.; Li, L.; Calvin, K.; Thomson, A. A comprehensive view of global potential for hydro-generated electricity. Energy Environ. Sci. 2015, 8, 2622–2633. [Google Scholar] [CrossRef] [Scilit]
- Tefera, W.M.; Kasiviswanathan, K.S. A global-scale hydropower potential assessment and feasibility evaluations. Water Resour. Econ. 2022, 38, 100198. [Google Scholar] [CrossRef] [Scilit]
- Korkovelos, A.; Mentis, D.; Siyal, S.H.; Arderne, C.; Rogner, H.; Bazilian, M.; Howells, M.; Beck, H.; De Roo, A. A Geospatial Assessment of Small-Scale Hydropower Potential in Sub-Saharan Africa. Energies 2018, 11, 3100. [Google Scholar] [CrossRef] [Scilit]
- Hoes, O.A.C.; Meijer, L.J.J.; van der Ent, R.J.; van de Giesen, N.C. Systematic high-resolution assessment of global hydropower potential. PLoS ONE 2017, 12, e0171844. [Google Scholar] [CrossRef] [Scilit] [PubMed]
- Tauš, P.; Beer, M. Evaluation of the Hydropower Potential of the Torysa River and Its Energy Use in the Process of Reducing Energy Poverty of Local Communities. Energies 2022, 15, 3584. [Google Scholar] [CrossRef] [Scilit]
- Butt, A.Q.; Shangguan, D.; Waseem, M.; Abbas, A.; Banerjee, A.; Yadav, N. Assessment of Hydropower Potential in the Upper Indus Basin: A Geographic Information System-Based Multi-Criteria Decision Analysis for Sustainable Water Resources in Pakistan. Resources 2025, 14, 49. [Google Scholar] [CrossRef] [Scilit]
- Kouadio, C.A.; Kouassi, K.L.; Diedhiou, A.; Obahoundje, S.; Amoussou, E.; Kamagate, B.; Paturel, J.; Coulibaly, T.J.H.; Coulibaly, H.S.J.P.; Didi, R.S.; et al. Assessing the Hydropower Potential Using Hydrological Models and Geospatial Tools in the White Bandama Watershed (Côte d’Ivoire, West Africa). Front. Water 2022, 4, 844934. [Google Scholar] [CrossRef] [Scilit]
- Areri, D.C.; Bibi, T.S. Identification of small-scale hydropower potential sites using geographic information system and hydrologic modeling technique: Awata river, Genale Dawa basin, Ethiopia. Energy Rep. 2023, 9, 2405–2419. [Google Scholar] [CrossRef] [Scilit]
- Torrefranca, I.; Otadoy, R.E.; Tongco, A. Incorporating Landscape Dynamics in Small-Scale Hydropower Site Location Using a GIS and Spatial Analysis Tool: The Case of Bohol, Central Philippines. Energies 2022, 15, 1130. [Google Scholar] [CrossRef] [Scilit]
- Sammartano, V.; Liuzzo, L.; Freni, G. Identification of Potential Locations for Run-of-River Hydropower Plants Using a GIS-Based Procedure. Energies 2019, 12, 3446. [Google Scholar] [CrossRef] [Scilit]
- Guzović, Z.; Barbarić, M.; Bačelić Medić, Z.; Degiuli, N. New Software for the Techno–Economic Analysis of Small Hydro Power Plants. Water 2023, 15, 1651. [Google Scholar] [CrossRef] [Scilit]
- Alcalá, G.; Grisales-Noreña, L.F.; Hernandez-Escobedo, Q.; Muñoz-Criollo, J.J.; Revuelta-Acosta, J.D. SHP Assessment for a Run-of-River (RoR) Scheme Using a Rectangular Mesh Sweeping Approach (MSA) Based on GIS. Energies 2021, 14, 3095. [Google Scholar] [CrossRef] [Scilit]
- Lehner, B.; Czisch, G.; Vassolo, S. The impact of global change on the hydropower potential of Europe: A model-based analysis. Energy Policy 2005, 33, 839–855. [Google Scholar] [CrossRef] [Scilit]
- Gutierrez, L.; Huerta, A.; Llauca, H.; Bourrel, L.; Lavado-Casimiro, W. Assessment of Run-of-River and Hydropower Plants in Peru: Current and Potential Sites, Historical Variability (1981–2020), and Climate Change Projections (2035–2100). Climate 2025, 13, 125. [Google Scholar] [CrossRef] [Scilit]
- Quaranta, E.; Bódis, K.; Kasiulis, E.; McNabola, A.; Pistocchi, A. Is There a Residual and Hidden Potential for Small and Micro Hydropower in Europe? A Screening-Level Regional Assessment. Water Resour. Manag. 2022, 36, 1745–1762. [Google Scholar] [CrossRef] [Scilit]
- Bimenyimana, S.; Wang, C.; Habihirwe, O. Geospatial multi-criteria assessment of hydroelectric site suitability in the West African power pool. Renew. Energ. 2026, 4, 1–29. [Google Scholar] [CrossRef] [Scilit]
- Kochanek, A.; Generowicz, A.; Zacłona, T. The Role of Geographic Information Systems in Environmental Management and the Development of Renewable Energy Sources—A Review Approach. Energies 2025, 18, 4740. [Google Scholar] [CrossRef] [Scilit]
- Sonare, A.P.; Ochawar, R.S.; Balamwar, S.; Kulkarni, M.B. Green energy estimation using remote sensing techniques: A comprehensive review of methods, applications, and future directions. Energy Rep. 2026, 15, 109354. [Google Scholar] [CrossRef] [Scilit]
- Shah, S.H.A.; Tanoli, J.I.; Habib, U.; Rehman, Q.U.; Ali, E.; Mohamed, A. Assessing Potential of Dor River as Small Hydro Project for Lessening Energy Crisis and Enhancing Tarbela Reservoir Life in Khyber Pakhtunkhwa, Pakistan. Water 2022, 14, 2683. [Google Scholar] [CrossRef] [Scilit]
- Sieg, P. Barriers and management practices for small hydropower: The case of the Kujawsko-Pomorskie Region in Poland’s green energy transition. Acta Sci. Pol. Adm. Locorum 2026, 25, 153–183. [Google Scholar] [CrossRef] [Scilit]
- Kałuża, T.; Hämmerling, M.; Zawadzki, P.; Czekała, W.; Kasperek, R.; Sojka, M.; Mokwa, M.; Ptak, M.; Szkudlarek, A.; Czechlowski, M.; et al. The hydropower sector in Poland: Barriers and the outlook for the future. Renew. Sustain. Energy Rev. 2022, 163, 112500. [Google Scholar] [CrossRef] [Scilit]
- Kasperek, R.; Wiatkowski, M. Hydropower generation on the Nysa Kłodzka River. Ecol. Chem. Eng. S 2014, 21, 327–336. [Google Scholar] [CrossRef] [Scilit]
- Bekker, A.; van Dijk, M.; Niebuhr, C.M.; Hansen, C. Framework development for the evaluation of conduit hydropower within water distribution systems: A South African case study. J. Clean. Prod. 2021, 283, 125326. [Google Scholar] [CrossRef] [Scilit]
- Pieron, Ł.; Woś, K.; Wrzosek, K. Water Reservoirs in Plans to Improve Navigability of the Lower Section of the Vistula. Water 2022, 14, 4042. [Google Scholar] [CrossRef] [Scilit]
- Baratgin, L.; Polcher, J.; Dumas, P.; Quirion, P. Modeling hydropower operations at the scale of a power grid: A demand-based approach. Hydrol. Earth Syst. Sci. 2024, 28, 5479–5509. [Google Scholar] [CrossRef] [Scilit]
- Operacz, A.; Grahl-Madsen, M. Program of Hydropower Potential Assessment as an Effective Possibilities in Upper Vistula Water Region in Poland. Acta Sci. Pol. Form. Circumiectus 2018, 17, 157–172. [Google Scholar] [CrossRef] [Scilit]
- Młyński, D.; Książek, L.; Bogdał, A. Meteorological drought effect for Central Europe’s hydropower potential. Renew. Sustain. Energy Rev. 2024, 191, 114175. [Google Scholar] [CrossRef] [Scilit]
- State Water Holding Polish Waters. Upper Vistula Waterway. Regional Water Management Authority in Kraków. 2026. Available online: https://www.gov.pl/web/wody-polskie-krakow/droga-wodna-gornej-wisly (accessed on 12 August 2026).
- Institute of Meteorology and Water Management–National Research Institute (IMGW-PIB). Hydrological Measurement and Observation Data. Available online: https://danepubliczne.imgw.pl/data/dane_pomiarowo_obserwacyjne/dane_hydrologiczne/ (accessed on 13 August 2026).
- Niedzica Hydropower Plants Company. Smolice Hydropower Plant. Available online: https://www.zew-niedzica.pl/elektrownie/elektrownia-smolice/ (accessed on 13 August 2026).
- Niedzica Hydropower Plants Company. Łączany Hydropower Plant. Available online: https://www.zew-niedzica.pl/elektrownie/elektrownia-laczany/ (accessed on 13 August 2026).
- MAVEL a.s. 3.3 MW Polish Hydro Power Plant Kosciuszko Commissioned with Three MAVEL Horizontal Kaplan Turbines. Benešov, Czech Republic, 21 May 2003. Available online: https://mavel.cz/wp-content/uploads/2016/03/FINAL_KosciuzskoPressRelease2003r1.pdf (accessed on 13 August 2026).
- TAURON Ekoenergia sp. z o.o. Dąbie Hydropower Plant. Technical Data. Available online: https://ekoenergia.tauron.pl/elektrownie/energia-wodna/ew-krakow/dabie (accessed on 20 August 2026).
- Municipality of Kraków. Assumptions for the Plan for Heat, Electricity and Gaseous Fuel Supply for the Municipality of Kraków. Kraków, Poland. 2014. Available online: https://www.bip.krakow.pl/zarzadzenia/2014/2868/X19UUF9fMzYwODI%3D/Zalacznik_Nr_1_do_uchwaly_-_Zalozenia_sierpien_2014.pdf (accessed on 13 August 2026).
- TAURON Ekoenergia sp. z o.o. Przewóz Hydropower Plant. Technical Data. Available online: https://ekoenergia.tauron.pl/elektrownie/energia-wodna/ew-krakow/przewoz (accessed on 20 August 2026).
- State Water Holding Polish Waters, Regional Water Management Authority in Kraków. Navigation Notice No. 12/2026. Kraków, Poland, 2026. Available online: https://www.gov.pl/web/wody-polskie-krakow/aktualne-komunikaty-nawigacyjne2 (accessed on 13 August 2026).
- State Water Holding Polish Waters, Regional Water Management Authority in Kraków. Notice to Skippers No. 23/2024. Kraków, Poland, 28 June 2024. Available online: https://www.gov.pl/attachment/90a3ff78-a963-43ec-a0dd-c6af20697598 (accessed on 13 August 2026).
- State Water Holding Polish Waters, Regional Water Management Authority in Kraków. Navigation Notice No. 24/2025. Kraków, Poland, 30 September 2025. Available online: https://www.gov.pl/attachment/103e0e62-f22c-4570-9ab5-881e33bb52f3 (accessed on 13 August 2026).
- State Water Holding Polish Waters, Regional Water Management Authority in Kraków. Navigation Notices and Archive of Navigation Information. Available online: https://www.gov.pl/web/wody-polskie-krakow/archiwum-informacji-zeglugowej (accessed on 20 August 2026).
- State Water Holding Polish Waters, Regional Water Management Authority in Kraków. Reservoirs—Świnna Poręba Reservoir. Available online: https://www.gov.pl/web/wody-polskie-krakow/Zbiorniki (accessed on 20 August 2026).
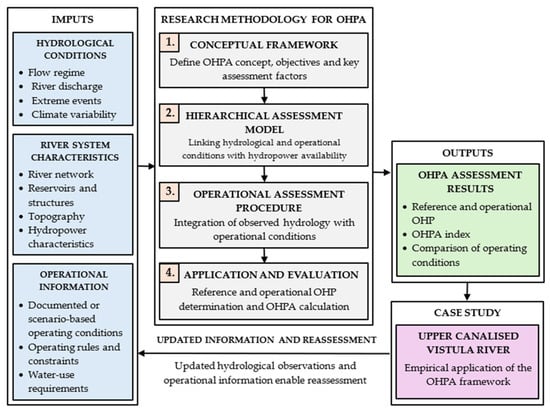
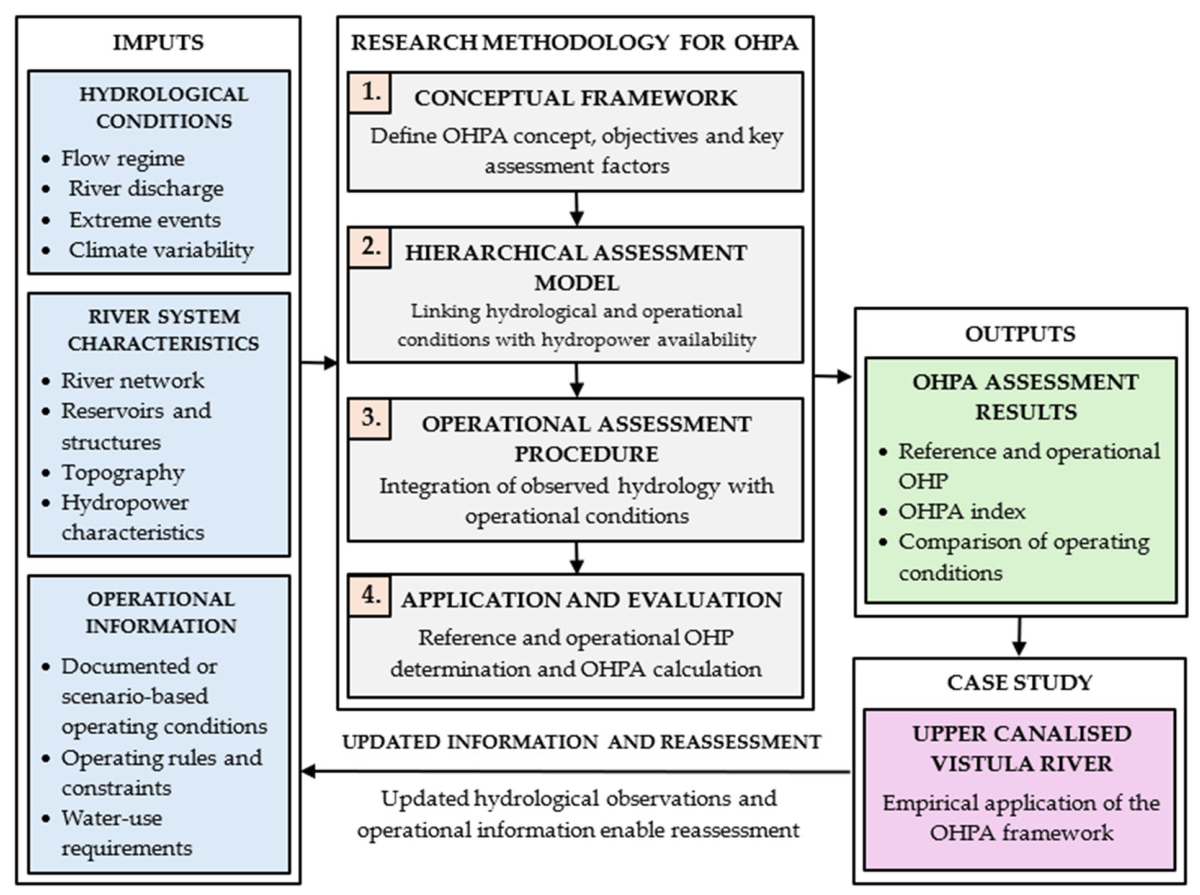
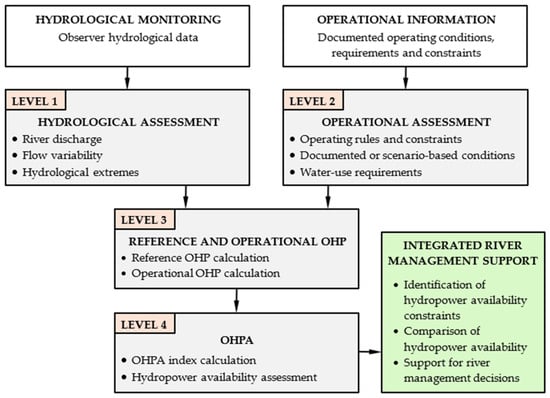
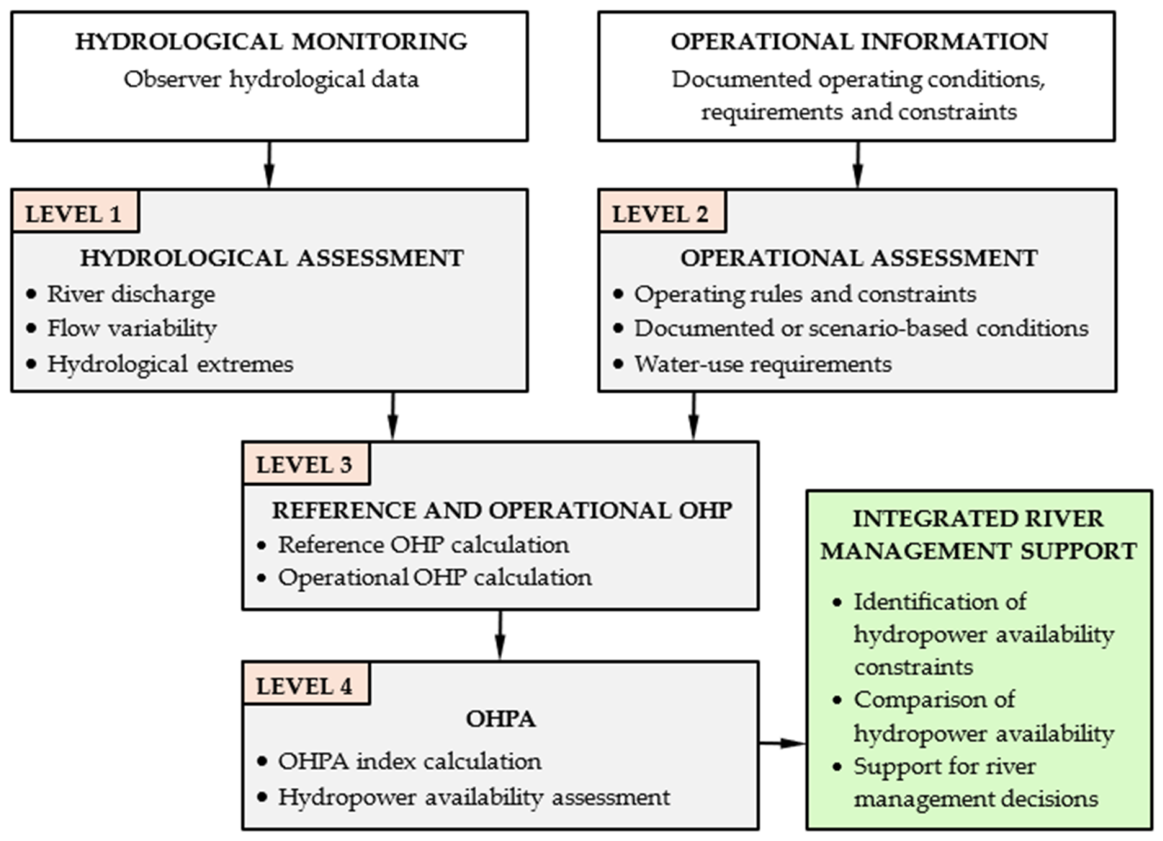
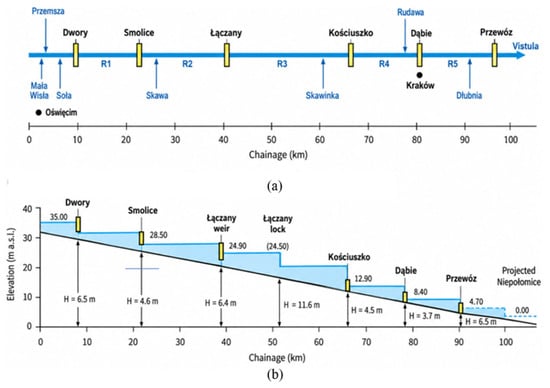
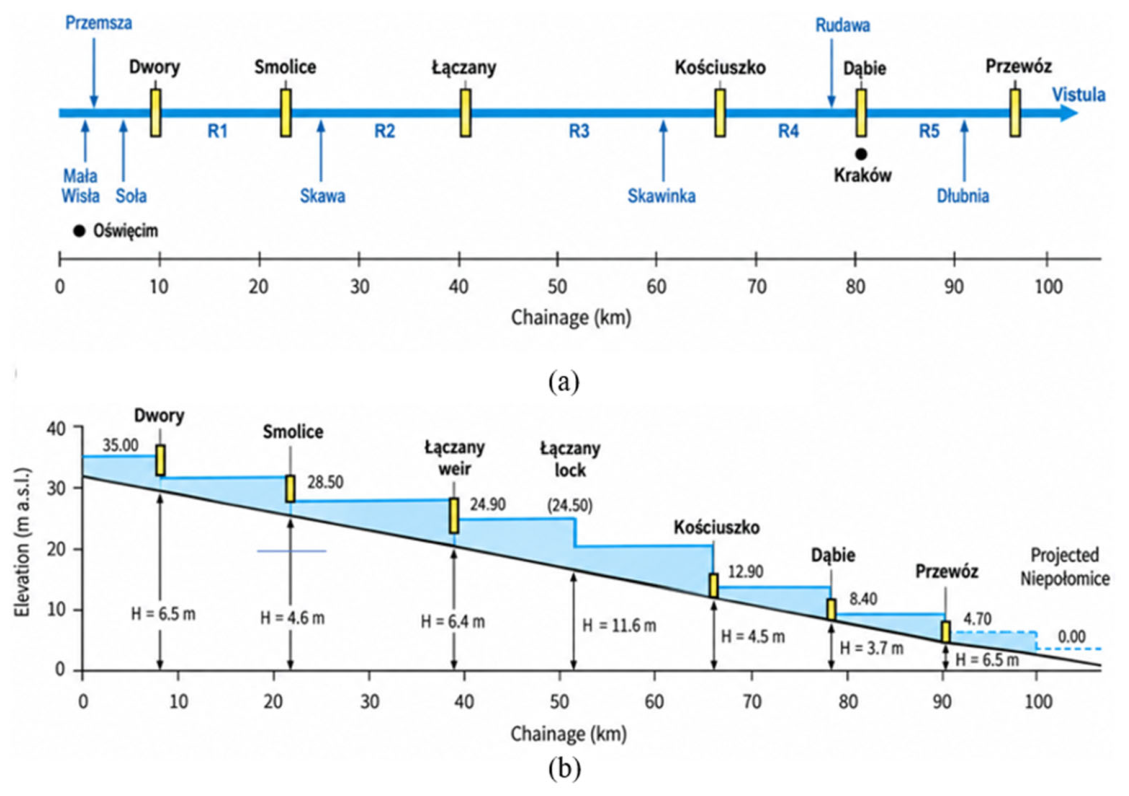
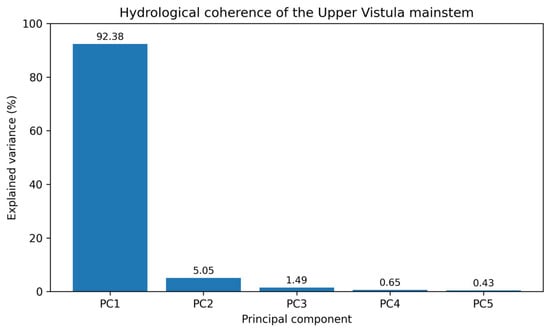
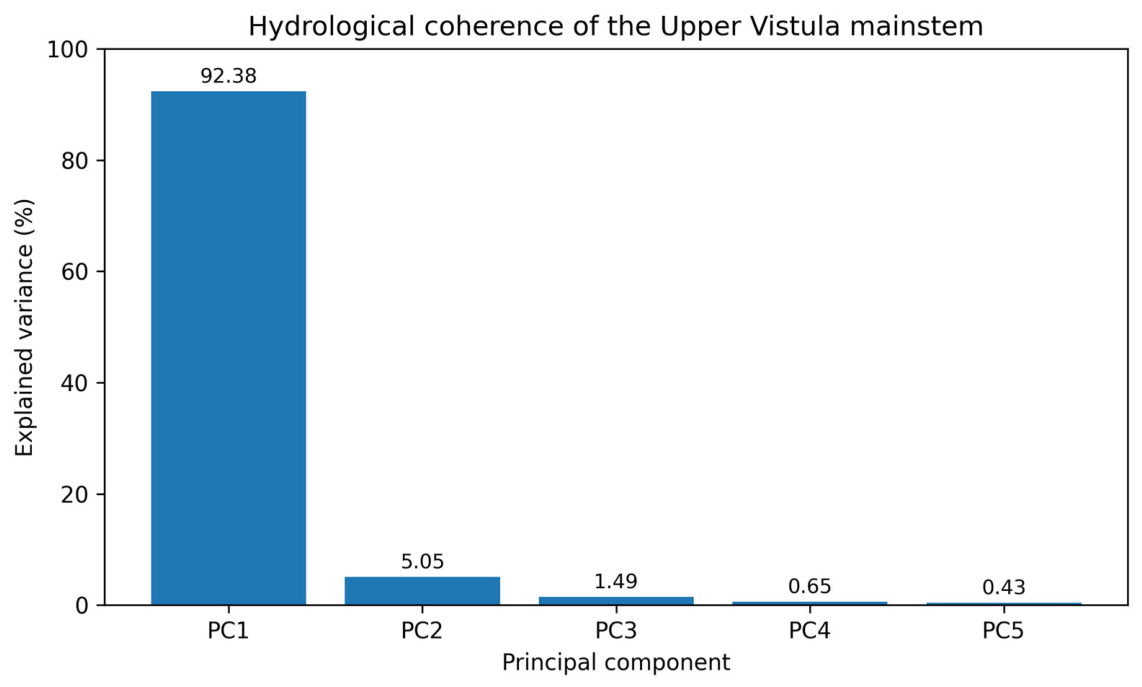
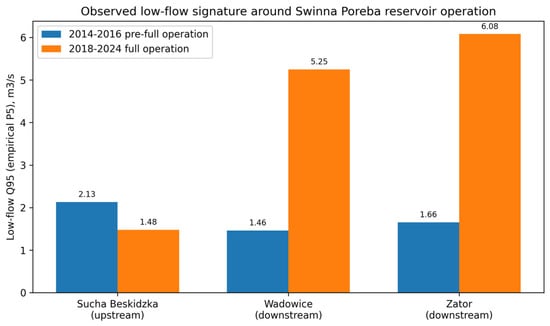
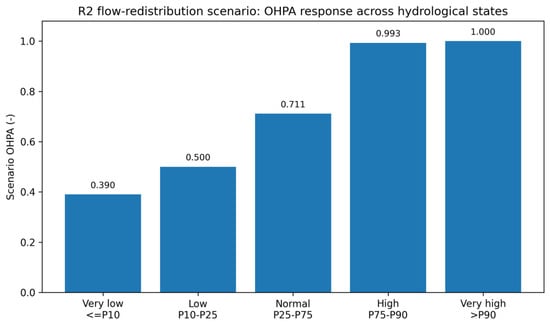

Disclaimer/Publisher’s Note: The statements, opinions and data contained in all publications are solely those of the individual author(s) and contributor(s) and not of MDPI and/or the editor(s). MDPI and/or the editor(s) disclaim responsibility for any injury to people or property resulting from any ideas, methods, instructions or products referred to in the content. |
© 2026 by the authors. Licensee MDPI, Basel, Switzerland. This article is an open access article distributed under the terms and conditions of the Creative Commons Attribution (CC BY) license.