


Abstract
Industrial parks serve as the core carriers for low-carbon transition in the industrial sector, while multi-energy complementary integrated energy systems (IESs) represent the key technological pathway for achieving efficient decarbonization in such parks. However, the output volatility of high-penetration renewable energy sources, coupled with the scheduling complexity under carbon emission constraints, poses severe challenges to day-ahead decision-making for park-level integrated energy systems. To address this issue, this paper developed a two-stage distributionally robust optimization (DRO) scheduling model based on the Wasserstein distance. First, an electricity–heat–gas–hydrogen IES architecture is established, and a day-ahead scheduling optimization model is formulated with the objective of minimizing the sum of system operation and maintenance costs, energy purchase costs, tiered carbon trading costs, and renewable curtailment penalty costs. Second, to cope with the uncertainty of wind and solar power outputs, the recourse decisions are parameterized after uncertainty achievement, transforming the original problem into a single-level program that can be directly solved by commercial solvers. Finally, simulation verification is conducted using an aluminum-based new material industrial park as a case study. The results demonstrate that the hydrogen energy storage system can effectively achieve cross-period transfer and efficient accommodation of renewable electricity. Compared with the conventional box-uncertainty robust optimization method, the proposed approach achieves a superior balance between scheduling economy and operational robustness, validating the effectiveness and engineering practicality of the model.
1. Introduction
Amid the global endeavor toward carbon neutrality [1,2], industrial parks, as the core aggregation units of energy consumption and carbon emissions, stand at the forefront of the low-carbon transition. Low-carbon park IES features high-penetration renewable energy and synergistic multi-energy flow complementarity. Building such systems requires balancing three key objectives: reliable energy supply, strict carbon emission control, and satisfactory operational economy, which has become a core research focus for zero-carbon parks [3].
Hydrogen energy, characterized by high energy density, extended storage duration, and zero-emission cleanliness, holds considerable promise for low-carbon park development. Rong et al. [4] investigated an integrated park system exclusively powered by wind and solar generation, demonstrating that hydrogen energy storage facilitates cross-period long-term storage of renewable energy. It enabled substantial carbon reduction on the energy supply side. Zhou et al. [5] further substantiated that hydrogen energy storage effectively mitigates the volatility inherent in variable renewable output, furnishing a critical technical pathway toward off-grid autonomous operation for low-carbon parks. Building upon these foundations, He et al. [6] proposed an electricity–hydrogen co-generation model, offering a paradigmatic implementation scheme for multi-energy synergy in low-carbon parks. Zhou et al. [7] developed a prototype system and optimized key operational parameters to quantitatively analyze the applicable boundaries and economic characteristics of different operation modes for wind–hydrogen coupled energy storage. Their work provides practical guidance for the engineering deployment of hydrogen storage in off-grid low-carbon parks.
Although the technical value of hydrogen energy storage has been extensively validated, its potential within park-level systems remains insufficiently exploited. Tariq et al. [8] investigated the regulatory role of green hydrogen across various scenarios in electricity–heat coupled systems. However, the scope was confined to its utilization solely as fuel cell feedstock, leaving its multi-scenario utilization potential and deep decarbonization value underutilized, thereby constraining the system’s decarbonization effectiveness. To further enhance comprehensive energy utilization efficiency and expand the application boundaries of hydrogen energy, multi-energy cogeneration and power-to-gas (P2G) technologies have emerged as new research frontiers. Rismanchi et al. [9] proposed a multi-energy co-generation system architecture and conducted a life-cycle environmental impact assessment, confirming that this paradigm significantly improved energy cascade utilization and reduced system-wide life-cycle carbon emissions. Chen et al. [10] focused on P2G technology applications, converting surplus wind turbines (WTs) and photovoltaic (PV) output within the park into natural gas for storage and utilization, while monetizing the resulting carbon emission reductions through carbon market mechanisms. This approach enhanced renewable energy accommodation while reducing the park’s dependence on external power grids and natural gas markets. Furthermore, references [11,12] integrated P2G units with carbon capture systems through coupled modeling, constructing comprehensive system models and operational mechanisms that enable internal carbon recycling within the park. This fundamentally reduced carbon emission levels, providing a reference for zero-carbon parks to achieve the dual objectives of near-zero emissions and energy self-sufficiency.
Building upon the aforementioned carbon capture technologies, the market-oriented carbon emission reduction mechanisms represent another pivotal research frontier for zero-carbon parks to achieve refined carbon emission management and enhance the economic viability. Li et al. [13] introduced the carbon emission flow theory, which accurately characterized the spatio-temporal transmission trajectories of carbon emissions within power grids, thereby furnishing a critical analytical tool for refined low-carbon dispatch. Based on this theory, Chen et al. [14] examined the interaction mechanisms between market-oriented price signals and the behaviors of emission reduction entities from the perspective of the entire power supply chain. It provided theoretical foundations for the design of tiered carbon trading mechanisms in zero-carbon parks. Liang et al. [15] systematically established refined mathematical models for bilateral tiered carbon trading and carbon capture power plants. They employed the life-cycle assessment methodology to account for the full-chain carbon emissions per unit of electricity, exerting stringent constraints on high-emission enterprises while delivering robust incentives for low-carbon ones. Xiao et al. [16] further validated the synergistic emission reduction advantages of integrating tiered carbon trading mechanisms with carbon capture systems. Meanwhile, this study identified the core driving role of high renewable energy penetration in system decarbonization but it failed to account for the impacts of uncertainty in renewable energy output on the system.
In practical engineering scenarios, the uncertainty and volatility of wind and solar power outputs exert significant impacts on energy balance reliability, carbon emission control effectiveness, and operational economy. To address this issue, the primary methodologies include stochastic optimization (SO), robust optimization (RO), and distributionally robust optimization (DRO). SO treats new energy outputs using deterministic probability distribution functions and constructs optimization models by generating extensive scenario sets. Hua et al. [17] employed Beta and Weibull distributions to characterize PV and WTs, respectively, which transformed the uncertainty problem into a multi-scenario deterministic problem. Although this approach reduced model complexity, the scenario generation process remained challenging. Ju et al. [18] introduced the Kantorovich distance to measure scenario similarity, thereby obtaining typical output scenarios and their probability weights to balance computational burden and simulation accuracy. However, such RO results are often excessively conservative. They are typically applied to safety-critical special scenarios [19] at the expense of the system’s economic dispatch. Compared to RO, DRO accounts for uncertainty to prevent overly conservative optimization results and has garnered extensive attention from scholars worldwide. Lin et al. [20] constructed a DRO model based on scenario generation employing Taguchi’s orthogonal experimental design to construct the uncertainty set, which improved computational efficiency but was slightly inferior in economic performance compared to conventional DRO. Ma et al. [21] estimated the empirical mean and covariance of WT forecast errors based on limited historical data to construct a distributionally robust chance-constrained model. However, as the moment-based uncertainty set failed to incorporate additional distributional information, there remains room for reducing conservatism. Shen et al. [22] constructed the uncertainty set based on the Wasserstein distance, achieving relatively high accuracy but a large number of variables were introduced in the paper, rendering the process rather cumbersome.
To address the issues of the singular utilization pathway of hydrogen energy, the inadequacy of carbon mitigation regulatory strategies in accounting for the output characteristics of renewable energy sources, and the excessive conservatism or high computational complexity inherent in traditional uncertainty dispatch methods, this paper develops a two-stage DRO scheduling model incorporating tiered carbon trading and wind–solar uncertainty. The main contributions are summarized as follows:
(1) A scheduling framework for an electricity–heat–gas–hydrogen multi-energy coupled integrated energy system is constructed. Considering the substantial thermal load demand characteristic of metal processing in industrial parks, combined heat and power (CHP) units, hydrogen–oxygen fuel cells, and air-source heat pumps are designed to fully couple electricity, gas, and hydrogen, thereby ensuring the continuous supply of thermal loads.
(2) An uncertainty set based on the Wasserstein distance is constructed, which can accurately characterize the actual distribution of wind and solar output deviations. A two-stage adaptive distributionally robust optimization solution method is proposed. Affine decision rules are adopted to parameterize the second-stage recourse decisions under wind and solar fluctuations, enabling the system to respond promptly to the volatility and intermittency of renewable energy outputs during intraday operation.
(3) Through further mathematical derivation, the original nested three-layer min-max-min optimization problem containing multi-dimensional complex integral operations is equivalently transformed into a single-layer mixed-integer linear programming model, significantly reducing the solution complexity while balancing computational efficiency and engineering practicality.
The remainder of this paper is organized as follows. Section 2 introduces the structural framework of the industrial park energy system under investigation, the energy coupling relationships, and the associated mathematical models. Section 3 presents the two-stage DRO mathematical model based on the Wasserstein distance, the construction of the uncertainty set, and the fundamental approach for model transformation. Section 4 conducts simulation experiments to verify the low-carbon characteristics and robustness of the proposed model, along with sensitivity analysis on key parameters.
2. Basic Structure and Mathematical Models of the Energy System
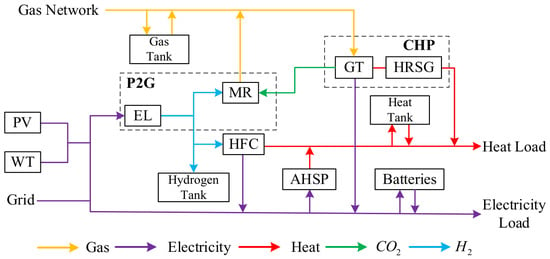
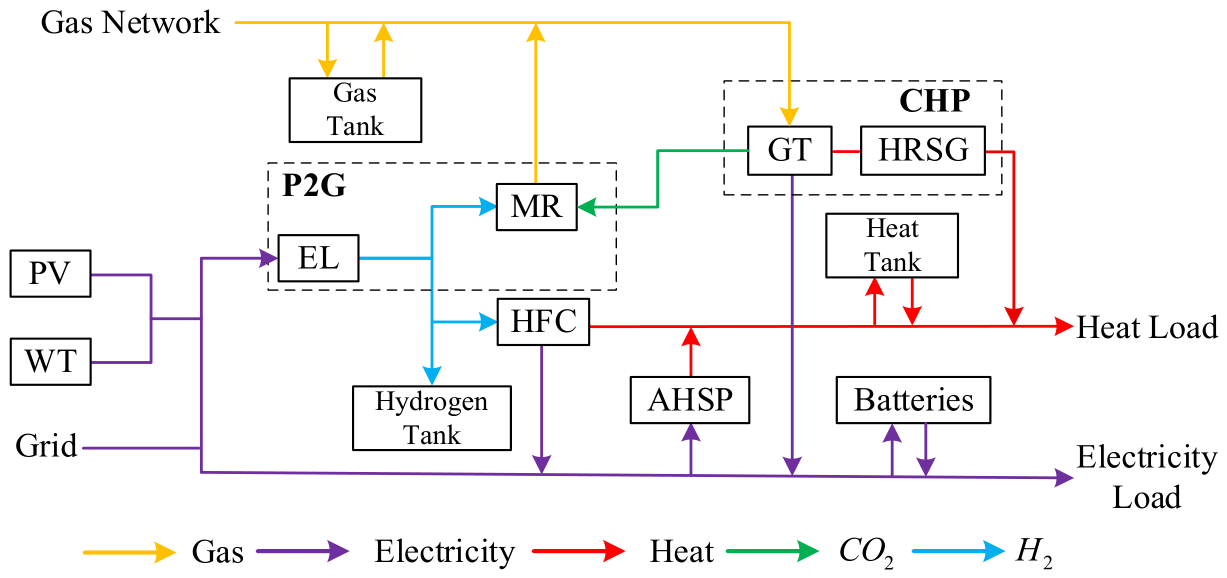
This paper investigates an electricity–heat–gas–hydrogen integrated energy system (IES), the basic structure of which is illustrated in Figure 1. The system comprises independent energy supply components, an energy coupling system consisting of P2G, CHP, and air-source heat pump (ASHP). Apart from conventional electrical, gas, and thermal storage devices, a hydrogen energy storage unit is incorporated to ensure the long-term and stable storage of curtailed renewable energy. By coupling the conventional P2G device with hydrogen storage-related equipment, the coupling pathways between hydrogen storage and other energy forms are expanded. Meanwhile, the methane reactor (MR), serving as a critical carbon recovery device, guarantees the low-carbon operation of the system.
Figure 1.
The basic structure of IES.
In this paper, the P2G device is considered to consist of two components: the electrolyzer (EL) and MR. The fundamental operating principle of the EL device is water electrolysis for hydrogen production. The hydrogen produced is partially reacted with carbon dioxide emitted equipment to generate methane, which is fed back into the gas network to achieve carbon recovery. A portion can be supplied to the hydrogen fuel cell (HFC) to generate electricity and heat for injection into the respective networks. The remainder can be stored in the hydrogen storage tank. The relevant mathematical models described above can be formulated as follows:
The external characteristics of the EL device can be expressed as:
where denotes the hydrogen output at time ; denotes the electrical power input at time ; denotes the energy conversion efficiency of the EL; and and denote the lower and upper bounds of the input electrical power, respectively.
The external characteristics of the MR device can be expressed as:
where denotes the hydrogen input at time , which is determined by the carbon emissions accompanying the electricity generation process of the gas turbine (GT) at power output ; in this paper, the proportional relationship between the two is described by coefficient ; denotes the gas energy output at time ; represents the energy conversion efficiency of the MR; and and denote the lower and upper bounds of the gas energy output, respectively.
The external characteristics of the HFC device can be expressed as:
where denotes the hydrogen input at time ; denotes the electrical power output at time ; denotes the electrical energy conversion efficiency of the HFC; and denote the lower and upper bounds of the electrical power output, respectively; denotes the thermal energy output at time ; represents the thermal energy conversion efficiency of the HFC; and denote the lower and upper bounds of the thermal energy output, respectively.
The battery, thermal storage tank, gas storage tank, and hydrogen storage tank in the system all follow similar mathematical models, and their time-coupled models can be expressed as:
where and denote the remaining energy of the storage device at times and ; denotes the time span from to ; and denote the charging and discharging power of each energy storage device, respectively; and and denote the charging and discharging efficiencies, respectively.
The output boundary constraints and the charging–discharging exclusivity constraints of the energy storage device model can be expressed as:
where binary variables and denote whether the storage is charging or discharging; and denote the lower and upper bounds of the charging capacity of the storage device; and denote the lower and upper bounds of the discharging capacity; and and denote the lower and upper bounds of the storage capacity. Meanwhile, the charging and discharging energy states of each storage device are mutually exclusive.
The external characteristics of the ASHP device can be expressed as:
where denotes the coefficient of performance; and denote the heating power and power consumption, respectively; and denote the lower and upper bounds of the thermal energy output, respectively.
The CHP system operates through the combination of a GT and a waste heat boiler. The GT generates electricity by burning natural gas, while the waste heat generated is output as thermal power through the waste heat boiler. Its physical model is defined as:
where denotes the electrical energy output of the GT at time ; denotes the natural gas consumption of the GT at time ; denotes the thermal energy output of the GT at time ; denotes the power generation efficiency of the GT; denotes the heat generation efficiency of the waste heat boiler; and denote the lower and upper bounds of the electrical energy output, respectively; and and denote the lower and upper bounds of the thermal energy output, respectively.
3. Two-Stage DRO Model
3.1. Modeling of WT and PV Output Uncertainty
This paper constructs the model of the deviation between the actual output and the forecast value of the WT and PV units. The uncertainty set is used to describe the discrepancy between the two distributions based on the Wasserstein distance. Given that historical data over several scenarios have been obtained, if there exist independent and identically distributed deviation vectors , their empirical distribution can be defined as:
where is the indicator function of the data, which takes a nonzero value if and only if , and is zero otherwise. When a sufficiently large number of error vectors is available, i.e., , the empirical distribution converges to the true distribution . The “difference” between the constructed empirical distribution and the true distribution is precisely the Wasserstein distance, which is defined as:
where denotes the output-deviation distribution described by the ambiguity set, denotes the empirical distribution of the output deviations, denotes the support set of the data, denotes the first-order norm, and denotes the joint distribution of and . In essence, it describes the minimum cost of transporting the probability masses from one distribution to the other. Since it does not omit any point of the distribution, its geometric accuracy is high. Given an appropriate radius , the ambiguity set based on the Wasserstein distance can be described as:
3.2. Basic Structure of Two-Stage DRO Model
This paper proposes a two-stage DRO model that accounts for WT and PV output uncertainty. The first-stage decisions are generated from the day-ahead plan and represent the decisions made before the parameter uncertainty is revealed. The second-stage decisions address the uncertainty of the actual deviations of the WT/PV output and re-dispatch the equipment within the system under the worst-case deviations. The objective function of the DRO model is expressed as:
where denotes the system operation and maintenance cost, denotes the energy procurement cost, denotes the carbon emission cost, denotes the WT and PV curtailment penalty cost, denotes the expectation of the minimum adjustment cost under the worst-case distribution within the ambiguity set B, and denotes the deviation adjustment cost.
3.2.1. First-Stage Scheduling Optimization
Since the uncertainty of the forecast deviation has not yet been achieved in the first stage, the system formulates the energy procurement and scheduling plans for the next 24 h on the basis of the day-ahead forecast values of the WT and PV output. The objective function is expressed as follows
(1) System operation and maintenance cost
where denotes the set of system equipment, including the battery, the thermal storage tank, the gas storage tank, the hydrogen storage tank, the ASHP, the P2G unit, the gas boiler, the gas turbine, and the waste-heat boiler; and is the unit maintenance cost of equipment .
(2) Energy procurement cost
where denotes the unit price of the electricity purchased from the upstream grid in period t, denotes the unit price of the natural gas purchased from the gas network, and and denote the amount of electricity and gas purchased in period t, respectively.
(3) Carbon emission cost
The tiered carbon trading model establishes tiered pricing intervals according to the amount of carbon emissions: the portion of emissions that exceeds the predetermined allowance by a greater margin must be offset by purchasing carbon trading quotas at a higher price, thereby incentivizing producers to reduce their carbon emissions. In this paper, the actual carbon emission is:
where denotes the carbon emission factor per unit of energy consumed, and denotes the amount of carbon fixed by the MR.
The tiered carbon emission cost model can be expressed as:
where denotes the carbon trading cost, denotes the base carbon price, denotes the length of each carbon interval in the tiered scheme, and the price increment ratio.
(4) WT/PV curtailment penalty cost
where and are the curtailed wind power and curtailed PV power at time t, and and are the corresponding curtailment penalty coefficients.
In addition to the equipment constraints of Equations (1)–(7), the first-stage optimization model must also satisfy the following constraints:
- (1)
- Boundary constraints on the curtailed WT and PV power
- (2)
- Power balance constraints for each form of energy
3.2.2. Second-Stage Scheduling Optimization
On the basis of the first-stage schedule, the objective of the second stage is to counteract the influence of WT and PV uncertainty on the system by adjusting the equipment outputs and the amount of curtailed power within the system. The additional power adjustment in the second stage is expressed in a form such as . In the power subsystem, if the actual output of WT and PV surpasses the scheduled level, generating units will reduce their output. A negative sign is assigned to the corresponding power adjustment . Loads may increase consumption to accommodate the surplus, and a positive sign is prefixed to their adjustment value . Taking the EL and the HFC as examples, the corrective inequality constraints are expressed as follows:
In addition, taking the electrical power balance as an example, the following power adjustment equality constraint must be appended:
It can be observed in Equation (20) that the vectors and determine the magnitude of the adjustment power. For convenience of formulation and derivation, let denotes the power adjustment coefficient and denotes the total output deviation of the WT and PV units. The adjustment power of each device can then be expressed in terms of the uncertainty vector and the adjustment coefficient, e.g., . Equations (19)–(20) can thus be rewritten in the following form:
The above procedure can be extended to all the equipment constraints in the system and the balance constraints of other forms of energy. The complete corrective constraints and the relevant explanations are presented in Appendix A.
The second-stage adjustment cost therefore comprises the additional operation and maintenance cost incurred in responding to the WT and PV forecast errors and the curtailment penalty cost, and can be expressed as:
3.2.3. Model Transformation of the Second-Stage Problem
To facilitate the description of the transformation procedure, the objective function (11) can be written in the following compact form:
In Equation (24), the first-stage decision vector x comprises the day-ahead scheduling plans of all the devices in the system. While the second-stage variable vector y describes the re-dispatch adjustment amounts after the achievement of the WT and PV uncertainty. The core difficulty of the model is handling the inner maximization problem, namely identifying the distribution within the ambiguity set that maximizes the expected re-dispatch cost. The inner maximization in Equation (24) involves a Wasserstein uncertainty set, whose primal form is too complex for the problem to be solved directly. Its Lagrangian function is constructed to obtain the dual problem as follows, and the complete derivation is presented in Appendix B:
An optimization problem of the form of Equation (25) no longer requires the computation of high-dimensional integrals, which reduces the difficulty of solution. Furthermore, because the two-stage model is linear with respect to the parameters and the support set of the uncertain parameter possesses upper and lower bounds and , i.e., , it has been proved in reference [23] that the original optimization problem can be transformed into the following form:
where denotes the equipment constraints and the power balance constraints, are the second-stage corrective constraints. The reformulation in Equation (26) retains all empirical sample points together with the per-dimension upper and lower bounds of the support set as the candidate extreme points. In the exact Wasserstein reformulation, all vertices of the support set should in principle be enumerated; however, since the uncertain vector comprises 48-dimensional WT/PV deviation variables, the number of box vertices (248) is computationally intractable [23] in order to obtain a trade-off between computational tractability and conservative accuracy. So, we approximate the vertex set by the independent coordinate-wise bounds. In these scenarios, all dimensions simultaneously attain their extreme values have negligible probability. Now, the original optimization problem has been transformed into a linear model that can be readily solved by a commercial solver.
4. Results and Discussion
4.1. Basic Data
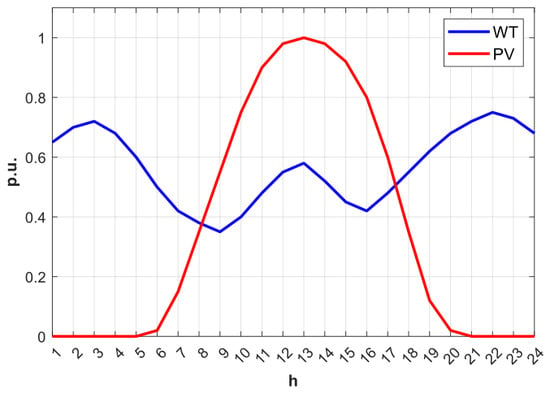
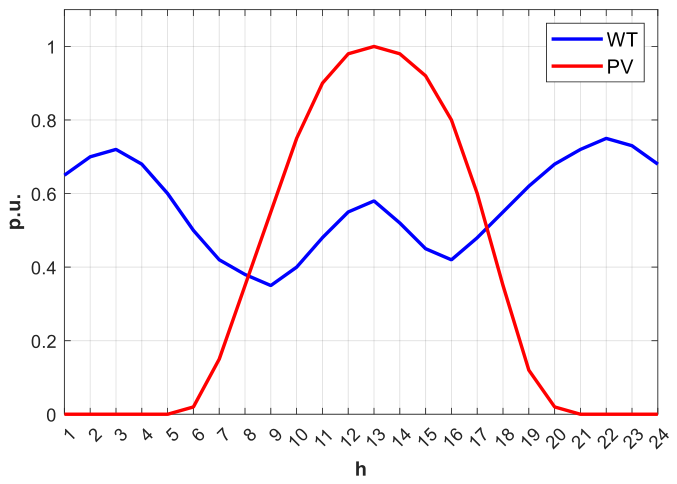
This paper considers an electricity–heat–gas–hydrogen IES situated in an industrial park producing aluminum-based new materials as the research object for case verification. With a 24-h scheduling horizon, the normalized curves of the expected WT and PV power outputs in the system are shown in Figure 2. The radius for constructing the Wasserstein uncertainty set is determined according to reference [24].
Figure 2.
Expected WT and PV power outputs.
For the carbon trading parameters, the natural gas price is taken as CNY 0.45. The base carbon trading price is 0.250 CNY/kg. The tier length is 2000 kg, and the tier increment is 25%. The carbon-fixation ratio of the MR is 0.9. The parameters of the remaining equipment are listed in Table 1 and Table 2.
Table 1.
Operating parameters of coupling devices.
Table 2.
Operating parameters of energy storage devices.
4.2. Simulation Results and Analysis
4.2.1. Electrical Power Balance Analysis
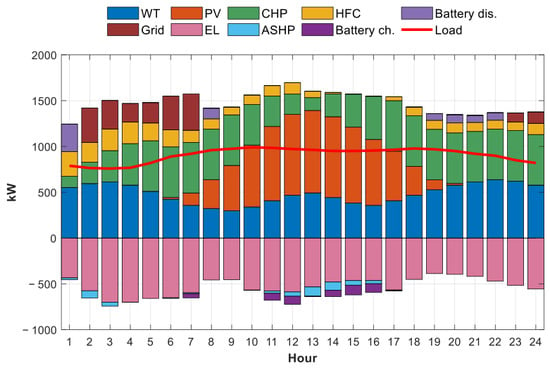
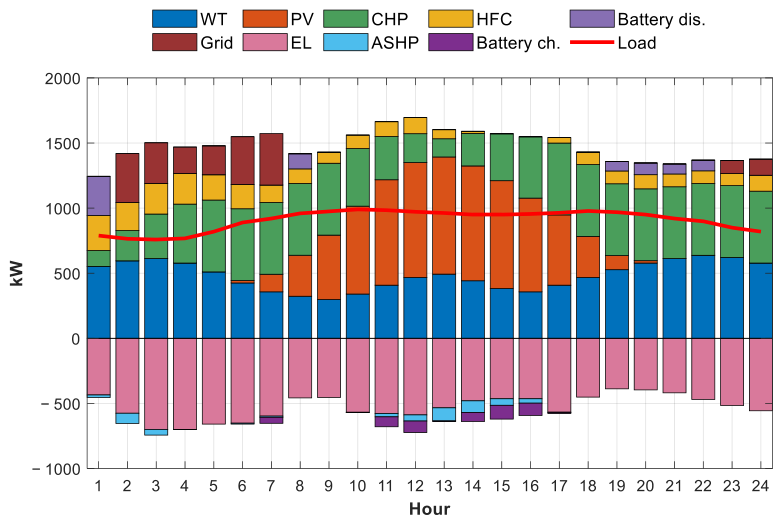
The electrical power balance of the park is illustrated in Figure 3. From the perspective of the generation mix, the renewable energy penetration of the park reaches 69.2%, establishing renewables as the dominant contributor to the system’s power supply. Specifically, wind power sustains a high output of approximately 500–612 kW during the nighttime hours (at hour 21–4), thereby filling the supply gap left by the absence of PV generation at night. PV reaches its peak output of about 900 kW around hour 12 and serves as the principal daytime power source. The coupling and energy-storage devices operate under a time-of-use strategy: the EL operates at full load during the midday period when PV output is abundant, with a maximum power of approximately 495 kW, converting surplus renewable electricality into hydrogen for storage and thereby realizing the on-site absorption of what would otherwise be curtailed renewable power. The battery is charged during off-peak electricity-price periods and discharges to supply power during peak-price periods, effectively smoothing the fluctuations of the net load. The CHP unit operates steadily throughout the day as a base-load power source and, by virtue of its CHP characteristics, simultaneously satisfies the base electricity and heat loads, thereby avoiding the waste of residual heat. The HFC is mainly brought into operation during the evening load peak (hours 19–21) to fill the supply gap and relieve the peak-shaving burden on the GT.
Figure 3.
Electrical power balance.
4.2.2. Thermal Power Balance Analysis
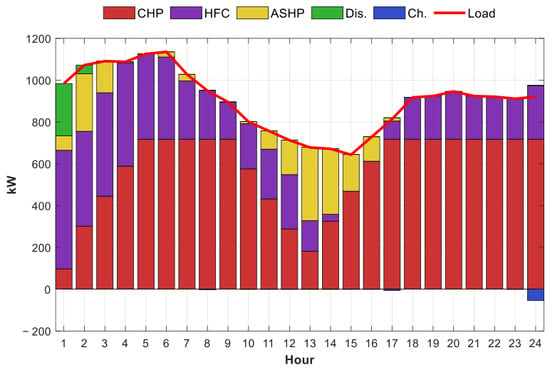
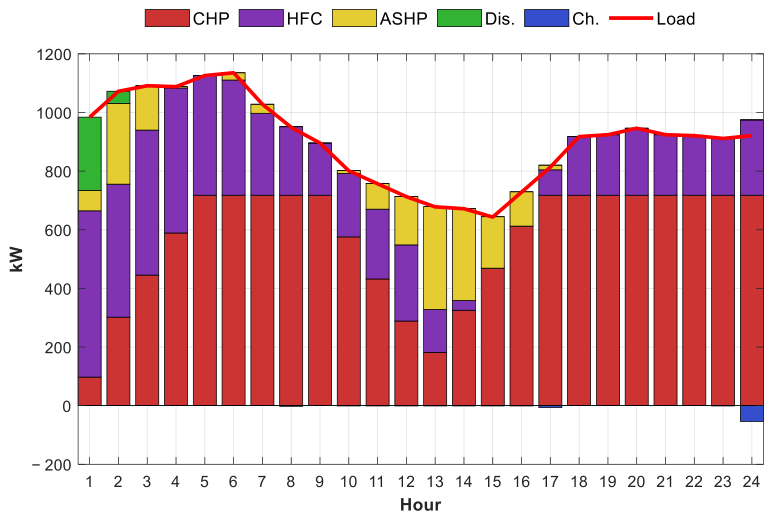
The thermal power balance of the park is presented in Figure 4. Heat is supplied primarily by the residual heat recovered from the CHP unit and the heat generated by the ASHP, supplemented by discharge from the thermal energy storage. The residual heat cogenerated by the CHP during power generation contributes approximately 72% of the heat-load demand, constituting the base-load heat source of the system. During off-peak electricity-price periods (hours 1–7), the ASHP makes full use of low-cost electricity to produce heat, and it further consumes part of the electricity to bridge the heat-supply gap during heat-load peak periods (hours 9–17). In addition, the waste heat recovered by the HFC during power generation contributes about 3% of the heat-load demand, further improving the efficiency of cascade energy utilization. Operating in a manner similar to the electrical energy storage, the thermal storage tank is charged during heat-load trough periods and discharged during heat-load peak periods, thereby achieving temporal shifting of the heat load as well as peak shaving and valley filling, which enhances the operational flexibility of the system. Overall, the energy-storage devices need not intervene excessively in the thermal power balance. By converting other forms of energy through the CHP, HFC, and ASHP, the heat-load demand of the industrial park can essentially be satisfied.
Figure 4.
Thermal power balance.
4.2.3. Hydrogen–Carbon Utilization Analysis
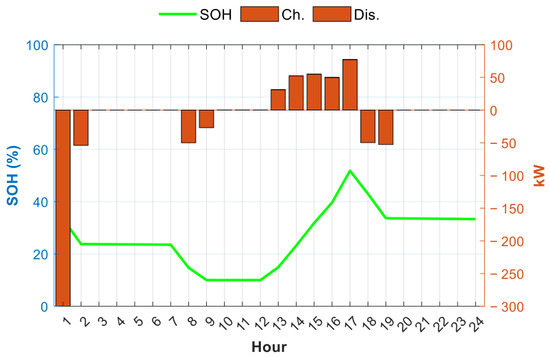
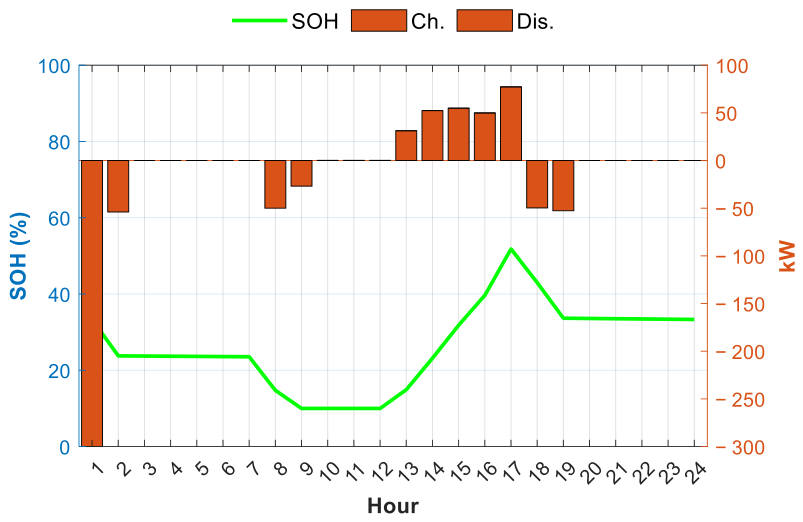
The operating curve of the state of hydrogen charge of the hydrogen storage tank is shown in Figure 5, which intuitively reflects the cross-period energy-transfer characteristics of hydrogen within the scheduling horizon. During the scheduling cycle, the total hydrogen production of the EL is approximately 2790 kWh, and the hydrogen output is distributed among three internal utilization pathways without external pure hydrogen load: about 71.4% is fed into the MR to participate in the carbon-recycling methanation reaction, about 22.5% is delivered to the HFC for combined power and heat generation, and the remaining about 6.1% is stored in the hydrogen storage tank to enable cross-period scheduling. The hydrogen storage tank exhibits a pronounced diurnal cycling pattern. During the daytime period of abundant PV generation (hours 10–16), the hydrogen production of the EL exceeds the concurrent hydrogen-load demand, and the storage tank is continuously charged. During the nighttime and evening-peak periods (hours 1–6 and 19–23), renewable generation declines, and the storage tank releases hydrogen to fill the hydrogen-supply gap of the HFC and MR, with a cumulative discharging amount of about 349 kWh. Throughout the scheduling horizon, the tank capacity is maintained within the safe operating range of 60–540 kWh, and the charging/discharging cycles are complete, verifying the long-duration energy-transfer capability of hydrogen energy storage.
Figure 5.
Operating state of the hydrogen storage tank.
To verify whether the cross-period energy transfer capability of hydrogen storage still holds under renewable output uncertainty, and to quantify its actual value in uncertain scenarios, an ablation study was conducted following the risk-aware evaluation framework proposed by Abdollahi et al. [25]. Specifically, two strategies are solved under the exact same Wasserstein ambiguity set, equipment parameters, and market prices:
Strategy 1: Considering the hydrogen storage which operates at its rated capacity.
Strategy 2: Without considering the hydrogen storage.
In Strategy 2, the hydrogen absorption devices must be supplied in real time by the electrolyzer, with no inter-temporal buffering available. All other constraints and model settings remain identical between the two cases, so that the observed difference can be solely attributed to the cross-period regulation capability of hydrogen storage. Instead of relying solely on expected operating cost, which tends to underestimate the value of storage under uncertainty, the Conditional Value-at-Risk (CVaR) at 95% confidence level is adopted as a complementary metric to capture the tail risk of worst-case scenarios. It is important to clarify that CVaR is only used for ex-post value comparison and does not enter the two-stage DRO scheduling model itself; the uncertainty is still fully described by the Wasserstein ambiguity set defined in Equation (10).
Table 3 compares the cost distributions of the two cases. Removing hydrogen storage increases the expected total daily cost from CNY 432,280.74 to CNY 440,111.94, corresponding to an increment of CNY 7831.20 (1.81%). More notably, the cost increase is more pronounced in the tail of the distribution: the 95th percentile VaR rises by 1.87%, and the CVaR95 (average cost of the worst 5% scenarios) rises by 1.89%, both higher than the increase in expected cost. The tail dispersion, measured as the difference between CVaR95 and expected cost, narrows by 30.4% when hydrogen storage is enabled (from CNY 1118.08 to CNY 777.46). This result confirms that hydrogen storage does not merely reduce average operating cost, but more importantly, compresses the downside risk exposure under extreme renewable fluctuations.
Table 3.
Comparison of system performance with and without hydrogen storage (α = 0.95).
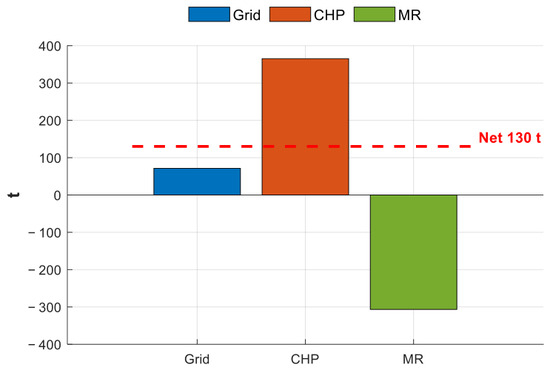
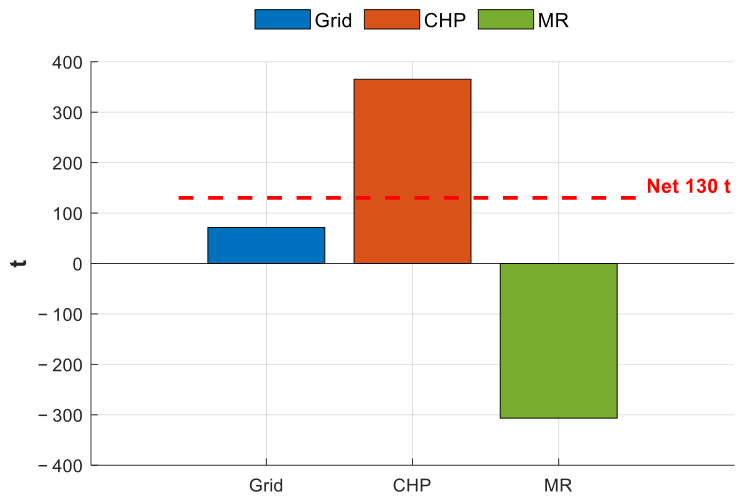
The carbon emissions of the system and the associated carbon trading costs are illustrated in Figure 6. In terms of emission sources, the carbon emissions arising from the natural-gas consumption of the CHP unit account for the vast majority of the system’s total emissions, making the CHP unit the primary target of system-level carbon management. The MR plays a pivotal role in carbon recovery in this context: through the methanation of the hydrogen produced by the EL with the CO2 within the system, it converts part of the carbon emissions back into natural gas and feeds it into the gas network of the park, thereby achieving the recycling of carbon resources. Concurrently, this process directly reduces the net carbon emissions of the system and lowers the excess-emission costs incurred under the tiered carbon trading scheme. The carbon-recovery mechanism of the MR thus acts in synergy with the price constraint of the tiered carbon trading scheme: on the one hand, the market-based mechanism exerts pressure on the system to reduce emissions, while on the other hand, the technical pathway achieves the internal circulation of carbon, jointly supporting the low-carbon operation objective of the park.
Figure 6.
System carbon emission analysis.
4.3. Comparative Analysis of Uncertainty Optimization Models
To evaluate the performance of the two-stage distributionally robust optimization method based on the Wasserstein ambiguity set proposed in this paper, a comparative analysis was conducted against three benchmark methods:
Case 1: Deterministic optimization: a day-ahead scheduling model that disregards the output uncertainty of WT and PV.
Case 2: RO based on a box uncertainty set.
Case 3: Two-stage DRO based on a moment-based uncertainty set.
Case 4: Two-stage DRO based on the Wasserstein uncertainty set proposed in this paper.
The computational results and solution times of the four methods are summarized in Table 4.
Table 4.
Operational results and solution time.
From the perspective of total cost, Case 1, which completely disregards uncertainty, yields the lowest theoretical cost. However, it is applicable only to the idealized scenario in which the outputs of WT and PV are fully predictable. In actual operation, fluctuations in WT and PV output readily lead to power deficits or curtailment spillovers; so, the actual operating cost deviates considerably from the theoretical value. Case 2 adopts box-based robust optimization, and its total cost is approximately 55.5% higher than that of Case 1, of which the energy procurement cost increases by about 31% and the carbon trading cost by 218%, rendering its scheduling solution the most conservative. The core deficiency of Case 2 is that it takes only the upper and lower bounds of renewable output as the worst-case scenario without considering the probabilistic distribution characteristics, thereby reserving excessive reserve margins for extreme low-probability scenarios and forcing the gas turbine to maintain a high output level, which leads to substantial idle waste of resources. In Case 2, the increment in the carbon trading cost markedly exceeds that of the energy procurement cost. This phenomenon is directly related to the nonlinear pricing of the tiered carbon trading scheme: the additional CHP output reserved for reserve provision not only raises the base gas consumption but also drives the total carbon emissions across the tier threshold into a higher bracket in which the carbon price is marked up by 25%, so that the marginal carbon cost rises in a stepwise manner and, ultimately, the growth of the carbon cost far exceeds that of the gas procurement cost itself. This further indicates that, under a tiered carbon trading mechanism, an over-conservative scheduling strategy amplifies the economic loss through the carbon market mechanism, further highlighting the necessity of accurately characterizing uncertainty.
Case 3 constructs its ambiguity set on the basis of mean–covariance moment information. Although its total cost remains at a level similar to those of Cases 1 and 4, it suffers significant curtailment losses. The essential reason is that a moment-based ambiguity set constrains only the first- and second-order moments of the distribution, thereby discarding part of the information contained in the actual distribution function. Consequently, it cannot accurately characterize the extreme fluctuation scenarios of WT and PV output and fails to effectively cover tail risks. This method therefore fails to achieve the core objective of the zero-carbon park of maximizing the accommodation of renewable energy, and its robustness is deficient. By contrast, the total operating cost of the proposed Case 4 is approximately 35.4% lower than that of Case 2, substantially reducing the redundant cost induced by conservative scheduling while guaranteeing constraint satisfaction under all scenarios. Compared with Case 1, Case 4 achieves effective coverage of WT and PV uncertainty at only a small additional cost. With regard to the key indicator, the curtailed power of Case 4 is zero, achieving the full accommodation of renewable energy. This result verifies the advantages of the Wasserstein ambiguity set: the distance ball constructed on the basis of the empirical distribution of historical data fully preserves the shape characteristics of the distribution and enables a more accurate coverage of extreme tail scenarios. It is neither as over-conservative as conventional robust optimization nor prone to omitting tail risks as the moment-based method, thereby achieving a refined characterization of uncertainty.
4.4. Sensitivity Analysis
This section conducts a sensitivity analysis to investigate the parameter sensitivity of the proposed method and its adaptability under varying data scales and market environments. Three variables are selected as analytical objects: the number of historical samples, the base carbon trading price, and the radius of the Wasserstein ambiguity set. We further elaborate three corresponding issues: the data-driven properties of the uncertainty optimization method, the policy guidance of carbon trading on scheduling decisions, and the balance between robustness and operational economy.
4.4.1. Influence of the Sample Number on the Simulation Results
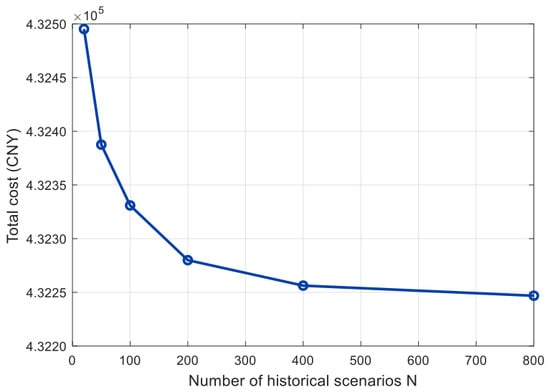
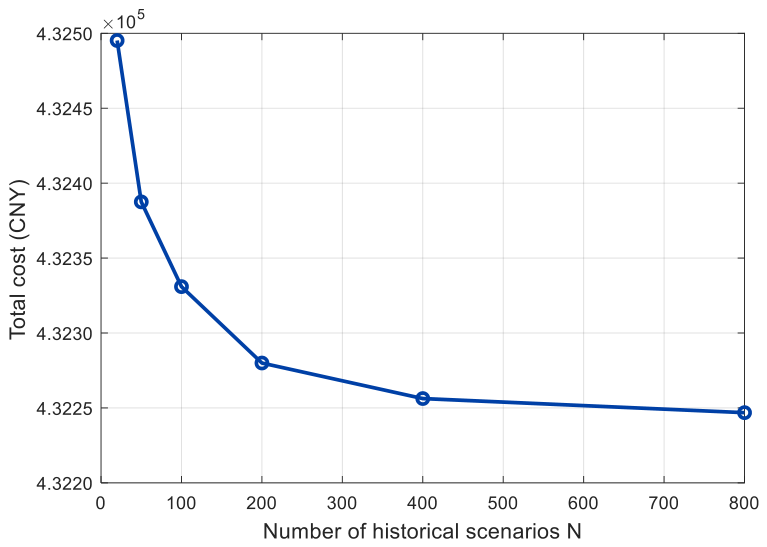
Figure 7 presents the variation in the total system cost as the number of historical samples, N, varies within the range of 20–800. To keep the calibration capability of the ambiguity-set constraints consistent across the comparative trials, the Wasserstein radius is contracted synchronously with the increase in the sample number. The results show that, as the sample number increases from 20 to 800, the total system cost decreases from CNY 432,495 to CNY 432,247, exhibiting an overall monotonically decreasing trend. This is because the more abundant the historical samples are, the closer the empirical distribution function approximates the true distribution, and the more accurately the ambiguity set characterizes the renewable-energy output. Therefore, the value of N = 200 adopted in this paper represents an ideal scale: at this point, the total cost has essentially stabilized while the computational scale remains relatively small, balancing the accuracy of the simulation results with the solution time.
Figure 7.
Impact of sample size on simulation results.
4.4.2. Influence of the Base Carbon Price on Carbon Emissions and Energy Procurement Costs
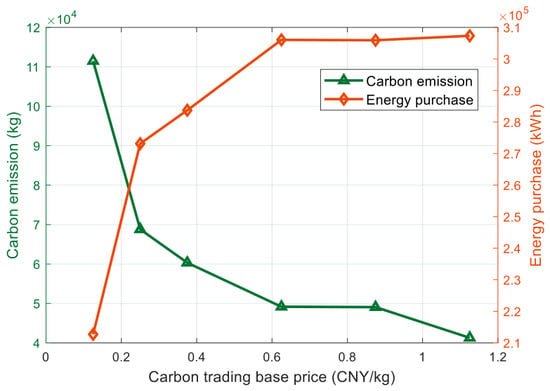
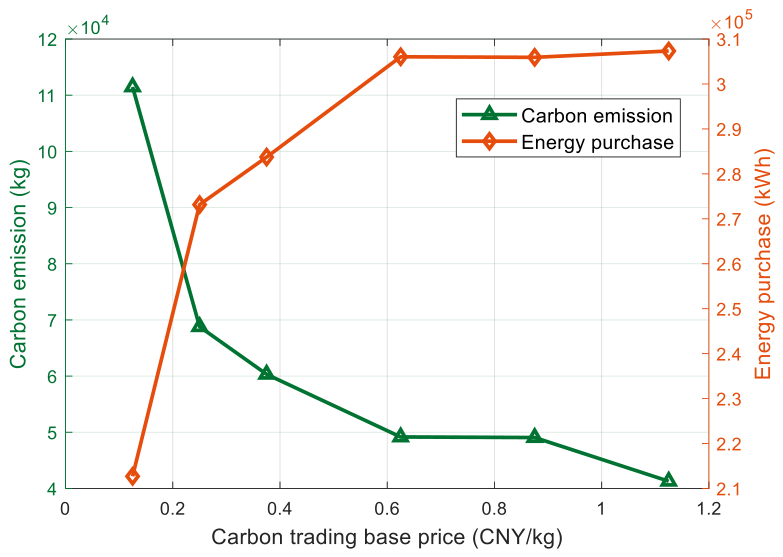
Figure 8 presents the influence of the base carbon trading price on the net carbon emissions of the system and on the energy procurement costs. It can readily be seen that the net carbon emissions of the system decrease monotonically with the increase in the base carbon price. This is because, when the base carbon price is low, the carbon emission cost accounts for only a limited share of the total cost and the scheduling prioritizes economic efficiency, so that the carbon-recovery benefit of the MR is not fully released. As the base carbon price rises, the marginal cost of excess emissions under the tiered pricing escalates in a stepwise manner, prompting the system to actively reduce the output of gas-consuming equipment, raise the carbon-recovery power of the MR and the supply share of the HFC, and preferentially accommodate WT and PV output in place of fossil energy. The carbon emission reduction is rapid at first and then gradually slows down, and the emission curve flattens in the high-carbon-price region.
Figure 8.
Impact of carbon base price on carbon emissions and energy purchase costs.
On the other hand, the rise in the base carbon price exerts opposite effects on the gas and electricity procurement costs. The curtailment of gas-fired output drives a sustained decline in the gas procurement cost, whereas the increased demand for electrically driven equipment and purchased electricity pushes up the electricity procurement cost. Accordingly, in the low-carbon-price region the reduction in the gas procurement cost dominates and the total energy procurement cost increases slightly, whereas in the high-carbon-price region, the increase in the electricity procurement cost prevails and the total energy procurement cost turns upward. Therefore, a reasonably set base carbon price can effectively drive the low-carbon transition of the system while balancing emission-reduction performance with operational economic efficiency.
4.4.3. Influence of the Wasserstein Radius on the Simulation Results
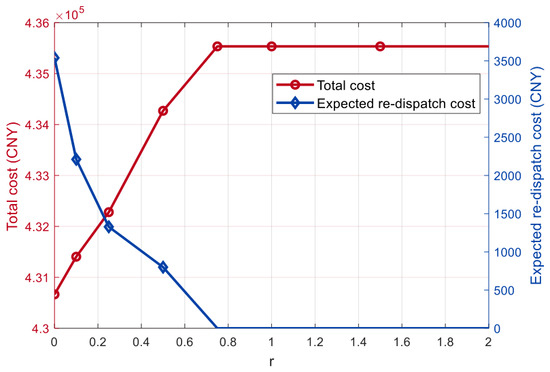
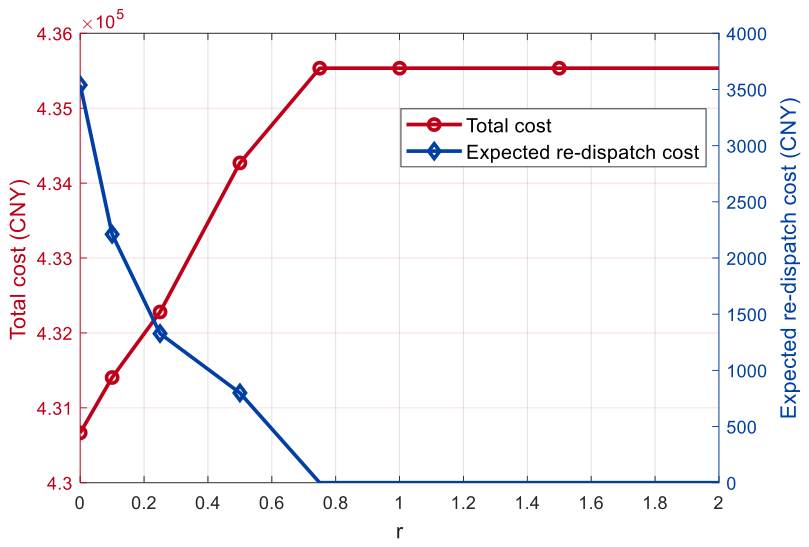
Figure 9 presents the variations in the total system cost and the second-stage re-dispatch cost when the normalized value of the Wasserstein radius ranging from 0 to 2. As r increases from 0 to 0.5, the total system cost rises from CNY 430,666 to CNY 434,270, whereas the re-dispatch cost decreases from CNY 3540 to CNY 803. This result is consistent with the definition of the ambiguity set: as r tends to 0, the ambiguity set degenerates into the deterministic model and, because the fluctuation in renewable output is entirely disregarded, the total cost reaches its minimum. Within a certain range, however, gradually enlarging the radius of the Wasserstein ball widens the admissible fluctuation range of the uncertain variables, making the uncertainty of WT and PV output increasingly significant, and the system is obliged to perform additional dispatch to hedge against the uncertainty, so that the total cost gradually increases. From another perspective, an enlarged radius allows the optimization model to search for the most conservative result over a broader range, thereby enhancing the robustness of the solution. Accordingly, the second-stage re-dispatch cost instead exhibits a decreasing trend.
Figure 9.
Impact of the Wasserstein radius on the total cost.
Once r reaches 0.75, the total cost essentially stabilizes at CNY 435,534. At this point, the regulation capability of the re-dispatch equipment is already sufficient to cover a larger uncertainty range, and the constraint range of the ambiguity set has been relaxed to the extent that it no longer influences the conservative decisions. The problem then degenerates into an ordinary robust optimization model that disregards the distributional characteristics of WT and PV output, and the decision process considers only the boundary limits of the uncertain variables, rendering the results overly conservative. This paper therefore selects a radius of 0.25, which provides reasonably robust protection at a relatively small cost increment.
5. Conclusions
Focusing on the WT and PV output uncertainty in the integrated energy system of an industrial park and the associated low-carbon scheduling requirements, this paper establishes a distributionally robust optimization scheduling model based on the Wasserstein distance and verifies the effectiveness of the method in a real park scenario. The main conclusions are as follows:
(1) An integrated energy system architecture featuring electricity–heat–gas–hydrogen multi-energy coupling can effectively accommodate the diversified energy demands of a zero-carbon park. Through the coordinated operation of energy-conversion equipment and multiple types of energy storage, the regulation potential of multi-energy complementarity can be fully exploited to promote the efficient accommodation of renewable energy. Case results demonstrate that the system reaches a renewable energy penetration rate of 69.2%, with CHP waste heat covering 72% of the base thermal load. The electrolyzer produces 2790 kWh of hydrogen in total, which is primarily allocated to internal carbon recycling and combined heat and power generation. Charging during daytime surplus and discharging at peak loads, the hydrogen storage unit cuts tail risk dispersion under extreme wind/solar fluctuations by 30.4%, and notably enhances system resilience.
(2) The distributionally robust optimization method based on the Wasserstein distance achieves a superior balance between scheduling economic efficiency and operational robustness. Compared with box-set robust optimization, the proposed method cuts total operating cost by approximately 35.4% and prevents the drastic rise in carbon trading costs triggered by over-conservative scheduling. Relative to the deterministic scheduling model, it delivers full coverage of wind and solar output uncertainty across all scenarios with merely a 0.47% cost increase, and achieves complete renewable energy accommodation with zero curtailment.
(3) By parameterizing the recourse decisions and applying duality theory, the proposed model-reformulation approach effectively resolves the difficulty of solving an optimization model that involves complex integrals and multidimensional probability distributions, equivalently transforming the nested optimization problem into a single-level mixed-integer linear program that can be efficiently solved by commercial solvers. This guarantees the computational efficiency of the model and its feasibility for engineering applications.
The proposed model is designed for heavy industrial parks with complete electricity–heat–gas–hydrogen infrastructures and tiered carbon trading mechanisms. Key adaptations for other scenarios are outlined below:
(1) Different energy infrastructures: For parks without hydrogen facilities, remove hydrogen-related coupling units to derive a conventional electricity–heat–gas IES scheduling model. It will reduce decarbonization potential. For parks without natural gas access, replace CHP and MR units with electric heating and direct hydrogen supply, and adjust carbon accounting to grid-side emission factors. For light-industry parks with low thermal loads, downsize CHP and thermal storage capacity accordingly.
(2) Different regulatory environments: Under fixed-price carbon trading, simplify the tiered carbon cost function to a linear form. Under free carbon quotas or green certificate policies, adjust baseline emission allowances and add renewable accommodation incentives. For regions with regulated energy prices, update procurement cost coefficients to local levels.
Future research may further extend the coupled modeling of multiple sources of uncertainty by incorporating load-side uncertainty, energy prices, and other multidimensional factors. In addition, a multi-time-scale coordinated scheduling framework could be established, which, combined with a refined carbon-management mechanism, would further optimize the system operation strategy and enhance the adaptability of the model to complex park scenarios.
Author Contributions
Conceptualization, H.J. (Hai Jiang) and L.X.; methodology, H.J. (Hai Jiang) and L.X.; validation, G.L.; formal analysis, H.J. (Hai Jiang), L.X., and H.J. (Haoshuai Jia); data curation, G.L. and R.C.; writing—original draft, H.J. (Hai Jiang); writing—review and editing, R.C. and H.L.; visualization, R.C. and F.M.; supervision, H.J. (Haoshuai Jia) and H.L. All authors have read and agreed to the published version of the manuscript.
Funding
This research was funded by the project of HYDROCHINA Engineering Consulting Co., Ltd. (Grant NO. ZX-KJXN-20250021).
Data Availability Statement
The data presented in this study are available upon request from the corresponding author.
Conflicts of Interest
Authors Hai Jiang, Li Xiong, Haoshuai Jia, Guijun Liu, and Rongbo Chen are affiliated with China Renewable Energy Engineering Institute (Beijing 100120, China) and HYDROCHINA Engineering Consulting Co., Ltd. (Beijing 100120, China). The remaining authors declare that the research was conducted in the absence of any commercial or financial relationships that could be construed as a potential conflict of interest. The authors declare that this study received funding from HYDROCHINA Engineering Consulting Co., Ltd. The funder was not involved in the study design, collection, analysis, interpretation of data, the writing of this article, or the decision to submit it for publication.
Abbreviations
The following abbreviations are used in this manuscript:
| Abbreviation | Meaning |
| IES | Integrated energy system |
| WT | Wind turbine |
| PV | Photovoltaic |
| GT | Gas turbine |
| CHP | Combined heat and power |
| EL | Electrolyzer |
| MR | Methane reactor |
| HFC | Hydrogen fuel cell |
| ASHP | Air-source heat pump |
| P2G | Power-to-gas |
| SO | Stochastic optimization |
| RO | Robust optimization |
| DRO | Distributionally robust optimization |
Appendix A
The corrective constraints of the two-stage optimal scheduling model are formulated as follows.
- (1)
- Coupling device corrective constraints
- (2)
- Storage device corrective constraints
Owing to the similar physical characteristics of the storage devices, their corrective constraints are consolidated into the compact form of Equation (A10), where denotes the battery, the thermal storage tank, the gas storage tank, and the hydrogen storage tank.
- (3)
- Electric power balance corrective constraints
This equality indicates that, based on the deviation of the WT and PV power output, the second-stage model re-dispatches the equipment within the system so as to respond to the uncertainty. In other words, in this equation the battery, the HFC, the CHP, the EL, the ASHP, and the curtailed WT and PV power jointly “burden” the influence of . These coefficients act as the weights that reflect the extent of the response. Accordingly, all power adjustment coefficients in Equation (A11) are confined to the range .
The power balance constraints of the other forms of energy are likewise adjusted in a coupled manner according to the interdependencies among the corresponding energy carriers, and the corrective constraints are expressed as follows.
- (4)
- Thermal power balance corrective constraints
- (5)
- Gas power balance corrective constraints
- (6)
- Hydrogen power balance corrective constraints
Appendix B
To simplify the complex two-stage model of the original problem, the information contained in the ambiguity set is first equivalently transformed into the optimization problem shown in Equation (A15).
where the first constraint requires the uncertain vector to satisfy the Wasserstein-distance constraint. Moreover, because a joint distribution function is newly introduced, its marginal-distribution definition is appended as the second constraint.
According to the normalization property of distribution functions, Equation (8) shows that each data sample satisfies
On the basis of Equation (A16) and the multiplication rule for conditional probabilities, the following derivation can be obtained.
Substituting the result of Equation (A17) into Equation (A15), the joint distribution can be equivalently replaced and rewritten in the following form.
where the second constraint is the normalization condition of the distribution function of the substituted joint distribution. Let the dual variable of the first-row constraint be and that of the second-row constraint be . For the convenience of the subsequent simplification, the reciprocal of the sample number N is taken as the constant coefficient. The corresponding Lagrangian function is constructed and rearranged to yield:
It can be proved that Equation (A19) and Equation (A18) are identical. If the expressions inside the square brackets multiplied by the dual variables and are respectively and , then they are exactly the two constraints of Equation (A18). Since the inner minimization problem in Equation (A19) takes only and as decision variables, it follows that:
Since there is no decision variables in , its minimum value is exactly itself. When , the expression is positive, and taking yields the minimum value 0. When , the expression is negative, and if trying to take the minimum, it becomes negative infinity, i.e., there is no optimal value. The same applies to .
After combining like terms in Equation (A19) and rearranging, we obtain:
Since the distribution is non-negative, if , then taking as the decision variable in the maximization would force it to converge to an impulse function, causing the objective to tend to infinity. Therefore, the maximum value of the maximization problem can be attained only when is less than or equal to 0. Hence, Equation (A21) can be further equivalently reformulated as:
References
- Zhang, J.; Liu, Z. Low carbon economic scheduling model for a park integrated energy system considering integrated demand response, ladder-type carbon trading and fine utilization of hydrogen. Energy 2024, 290, 130311. [Google Scholar] [CrossRef] [Scilit]
- Zhang, Z.; Hu, G.; Mu, X.; Kong, L. From low carbon to carbon neutrality: A bibliometric analysis of the status, evolution and development trend. J. Environ. Manag. 2022, 322, 116087. [Google Scholar] [CrossRef] [Scilit]
- Zhou, J.; Zhang, D.; Zhu, J.; Shen, X.; Zhang, L.; Yin, Y.; Luo, Q.; Chen, Z. Electricity-Carbon Coordinated Optimal Dispatch for Multiple Industrial Parks Considering Life Cycle Carbon Emissions on the Power Generation Side. IEEE Trans. Ind. Appl. 2026, 62, 4307–4321. [Google Scholar] [CrossRef] [Scilit]
- Rong, F.; Yu, Z.; Zhang, K.; Sun, J.; Wang, S. Performance evaluation and multi-objective optimization of hydrogen-based integrated energy systems driven by renewable energy sources. Energy 2024, 313, 133698. [Google Scholar] [CrossRef] [Scilit]
- Zhou, S.; Sun, K.; Wu, Z.; Gu, W.; Wu, G.; Li, J. Optimized operation method of small and medium-sized integrated energy system for P2G equipment under strong uncertainty. Energy 2020, 199, 117269. [Google Scholar] [CrossRef] [Scilit]
- He, J.; Wu, Y.; Yong, X.; Tan, Q.; Liu, F. Bi-level optimization of a near-zero-emission integrated energy system considering electricity-hydrogen-gas nexus: A two-stage framework aiming at economic and environmental benefits. Energy Convers. Manag. 2022, 274, 116434. [Google Scholar] [CrossRef] [Scilit]
- Amirkhalili, S.A.; Zahedi, A.; Ghaffarinezhad, A. Design and evaluation of a hybrid wind/hydrogen/fuel cell energy system for sustainable off-grid power supply. Int. J. Hydrog. Energy 2025, 100, 1456–1482. [Google Scholar] [CrossRef] [Scilit]
- Tariq, A.H.; Anwar, M.; Kazmi, S.A.A.; Hassan, M.; Bahadar, A. Techno-economic and composite performance assessment of fuel cell-based hybrid energy systems for green hydrogen production and heat recovery. Int. J. Hydrog. Energy 2025, 104, 444–462. [Google Scholar] [CrossRef] [Scilit]
- Rismanchi, B.; Saidur, R.; Boroumandjazi, G.; Ahmed, S. Energy, exergy and environmental analysis of cold thermal energy storage (CTES) systems. Renew. Sustain. Energy Rev. 2012, 16, 5741–5746. [Google Scholar] [CrossRef] [Scilit]
- Chen, L.; Liu, K.; Zhao, K.; Hu, L.; Liu, Z. Optimal Scheduling of Electricity-hydrogen-thermal Integrated Energy System with P2G for Source-load Coordination Under Carbon Market Environment. Energy Rep. 2025, 13, 2269–2276. [Google Scholar] [CrossRef] [Scilit]
- Yan, L.; Zhang, X.; Ullah, Z.; Hasanten, H.M. Optimal Scheduling of Hydrogen Storage in Integrated Energy System Including Multi-source and Load Uncertainties. Alex. Eng. J. 2025, 114, 266–278. [Google Scholar] [CrossRef] [Scilit]
- Gao, C.; Lu, H.; Chen, M.; Chang, X.; Zheng, G. A Low-carbon Optimization of Integrated Energy System Dispatch Under Multi-system Coupling of Electricity-heat-gas-hydrogen Based on Stepwise Carbon trading. Int. J. Hydrog. Energy 2025, 97, 362–376. [Google Scholar] [CrossRef] [Scilit]
- Li, Y.; Lu, Z.; Zhang, J.; Guo, X.; Li, X.; Kong, X.; Zhang, J. Low-carbon Joint Planning for Distribution Network Considering Carbon Emission Flow and Uncertainties from Photovoltaic Power Generation. CSEE J. Power Energy Syst. 2026, 12, 411–423. [Google Scholar] [CrossRef] [Scilit]
- Chen, W.; Zhu, R.; Chen, J.; Ma, Y. Impacts of Carbon Tax Policies on Low-Carbon Technology Investment in the Electricity Supply Chain Under Peak–Valley Pricing. IEEE Trans. Eng. Manag. 2025, 72, 3151–3165. [Google Scholar] [CrossRef] [Scilit]
- Liang, S.; Lou, S.; Wu, Y.; Peng, Y. Generation Expansion Planning for Solvent-Storaged Carbon Capture Power Plants Considering the Internalization of the Carbon Emission Effects. IEEE Trans. Power Syst. 2024, 39, 2653–2667. [Google Scholar] [CrossRef] [Scilit]
- Xiao, Y.; Qian, B.; Ou, J.; Lin, W.; Hu, H.; Lin, X.; Deng, X.; Tng, J. Optimized Scheduling of Integrated Energy Systems Considering Electric Vehicles and Carbon Emission Trading. IEEE Access 2025, 13, 74147–74162. [Google Scholar] [CrossRef] [Scilit]
- Hua, L.; Xia, J.; Xiang, G.; Lei, Z.; Jing, D.; Zhang, X.; Guo, L. Scenario-based stochastic optimization on the variability of solar and wind for component sizing of integrated energy systems. Renew. Energy 2024, 237, 121543. [Google Scholar] [CrossRef] [Scilit]
- Ju, L.; Tan, Z.; Yuan, J.; Tan, Q.; Li, H.; Dong, F. A bi-level stochastic scheduling optimization model for a virtual power plant connected to a wind-photovoltaic-energy storage system considering the uncertainty and demand response. Appl. Energy 2016, 171, 184–199. [Google Scholar] [CrossRef] [Scilit]
- Qiu, H.; Gu, W.; Xu, Y.; Yu, W.; Pan, G.; Liu, P. Tri-Level Mixed-Integer Optimization for Two-Stage Microgrid Dispatch With Multi-Uncertainties. IEEE Trans. Power Syst. 2020, 35, 3636–3647. [Google Scholar] [CrossRef] [Scilit]
- Lin, Z.; Wu, Q.; Chen, H.; Ji, T.; Xu, Y.; Sun, H. Scenarios-Oriented Distributionally Robust Optimization for Energy and Reserve Scheduling. IEEE Trans. Power Syst. 2023, 38, 2943–2946. [Google Scholar] [CrossRef] [Scilit]
- Ma, M.; Long, Z.; Liu, X.; Lee, K. Distributionally robust optimization of electric–thermal–hydrogen integrated energy system considering source–load uncertainty. Energy 2025, 316, 134568. [Google Scholar] [CrossRef] [Scilit]
- Shen, H.; Zhang, H.; Xu, Y.; Chen, H.; Zhang, Z.; Li, W.; Su, X.; Xu, Y.; Zhu, Y. Two stage robust economic dispatching of microgrid considering uncertainty of wind, solar and electricity load along with carbon emission predicted by neural network model. Energy 2024, 300, 131571. [Google Scholar] [CrossRef] [Scilit]
- Gamboa, C.A.; Valladao, D.M.; Street, A.; Homem-de-Mello, T. Decomposition methods for Wasserstein-based data-driven distributionally robust problems. Oper. Res. Lett. 2021, 49, 696–702. [Google Scholar] [CrossRef] [Scilit]
- Hanasusanto, G.A.; Kuhn, D. Conic Programming Reformulations of Two-Stage Distributionally Robust Linear Programs over Wasserstein Balls. Oper. Res. 2017, 66, 849–869. [Google Scholar] [CrossRef] [Scilit]
- Abdollahi, A.; De Tuglie, E.E.; Amato, G.; Savastio, L.P.; Rasolomampionona, D.D.; Zagrajek, K. Deep reinforcement learning-based hydrogen energy storage arbitrage within risk-aware social welfare optimization. Int. J. Hydrogen Energy 2026, 278, 157725. [Google Scholar] [CrossRef] [Scilit]

Disclaimer/Publisher’s Note: The statements, opinions and data contained in all publications are solely those of the individual author(s) and contributor(s) and not of MDPI and/or the editor(s). MDPI and/or the editor(s) disclaim responsibility for any injury to people or property resulting from any ideas, methods, instructions or products referred to in the content. |
© 2026 by the authors. Licensee MDPI, Basel, Switzerland. This article is an open access article distributed under the terms and conditions of the Creative Commons Attribution (CC BY) license.