


Abstract
Planned feeder maintenance in radial distribution networks requires an alternative supply path when no usable mechanical tie line is available or energized AC loop closing is prohibited. This paper proposes a three-stage quasi-steady-state assessment and coordinated dispatch method using a feeder-reconfigurable soft open point (R-SOP) and heterogeneous distributed generation (DG). No active load shedding is scheduled. Stage I uses full-period forecasts to select connection points and assign asymmetrically rated voltage-source converters (VSCs). Stage II progressively transfers the receiving-area demand to the R-SOP while the maintenance branch remains closed. Opening eligibility is assessed from residual branch current, inter-step voltage variation, and power-flow feasibility before and after opening. Stage III assigns the receiving-side VSC the V/f reference role and updates dispatch through rolling optimization and event triggering. In the modified IEEE 33-bus system, the equal-rated fixed SOP has a receiving-side capacity deficit, whereas the 3.0-MVA R-SOP retains a positive continuous margin. In the main case, the maximum steady-state voltage difference across branch opening is below 0.002 p.u., and all monitored operating constraints are satisfied. With DG available, 27 maintenance branches satisfy the complete operating sequence with the R-SOP, compared with 20 with the fixed SOP. These results establish sequential feasibility at the modeled operating points; switching-scale voltage continuity remains to be validated.
1. Introduction
Planned maintenance of distribution equipment must isolate the maintenance branch while preserving supply to unaffected areas. When a backup tie path is available, utilities commonly close the tie switch before opening the original supply branch; temporary closed-loop operation can also reduce load interruption during restoration [1]. Voltage magnitude, phase angle, and equivalent impedance may differ across sources or feeders, however, and direct paralleling can produce high circulating and inrush currents. Proposed remedies include dual rotary phase-shifting transformers [2], series compensation for control-mode handover closed-loop transfer in radial networks [3], zonal planning of low-voltage loop-closing devices [4], and mobile loop-transfer prototypes with dedicated controls [5]. Probabilistic power-flow analysis further indicates that distributed generation (DG) and load uncertainty alter loop-closing current and voltage-security boundaries, requiring pre-operation risk assessment [6]. These methods assume an available mechanical tie path or temporary AC loop and are inapplicable when the tie line is absent, undersized, or prohibited for energized loop closing.
Uninterrupted transfer for planned maintenance differs from post-fault service restoration. Restoration studies begin with de-energized loads and use network reconfiguration, microgrid formation, distributed-energy scheduling, and demand response to increase restored load and reduce outage duration; a recent bi-level model, for example, coordinates grid and user decisions through a symmetrical incentive mechanism [7]. Robust community-microgrid scheduling also addresses renewable-output and flexible-load uncertainties [8]. Reviews cover renewable-assisted restoration [9] and distribution planning and restoration using microgrids and soft open points (SOPs) [10]. End-to-end optimization and acceleration improve computational performance for large restoration problems [11], while multiperiod dynamic models coordinate Volt/VAR devices, distributed energy resources, and storage [12]. Direct maintenance transfer instead requires continuous supply before, during, and after branch opening; it must therefore represent both post-opening power-flow feasibility and the continuous takeover trajectory and control-mode handover of the alternative path.
An SOP comprises back-to-back or multiport voltage-source converters (VSCs) linked by a common DC bus. It enables bidirectional active-power transfer and independent reactive-power control while keeping AC feeders electrically decoupled. SOPs have been applied to feeder load balancing, voltage regulation, loss reduction, DG accommodation, and service restoration [13]. Joint SOP-DG and network-reconfiguration optimization can reduce losses and improve load balancing and voltage profiles [14]. Operational studies include multistage Volt/VAR coordination of SOPs and inverter-based DG [15], two-timescale robust scheduling under source–load uncertainty and three-phase imbalance [16], and real-time coordination of SOPs, charging stations, and active distribution networks [17]. Planning studies address two-stage multicentric SOP siting and sizing [18] and coordinated placement of SOPs and remote-controlled switches for resilience [19]; a recent Energies configuration model further co-optimizes SOP capacity with DG and other reactive-power sources [20]. Network-constrained multigrid transactions [21] and data-driven multimode control under bad measurements [22] further extend SOP operation. Most studies nevertheless treat physical connection points as fixed and optimize only device ratings or operating set points.
Several studies combine mechanical switches and power converters to improve connection flexibility and converter utilization. A hybrid open point uses a parallel mechanical switch for low-cost bulk transfer and a converter for controlled power regulation [23]. A hybrid multi-terminal SOP with feeder-selection switches can reassign its connection points among feeders [24], while converter-sharing schemes reduce installed capacity [25]. Recent work integrates connection-point reconfiguration, grid-forming control, and dynamic restoration through a reconfigurable grid-forming SOP for cold-load pickup [26] and a reconfigurable SOP (R-SOP) resilience model with connection selection and voltage-security constraints [27]. These studies establish the technical basis for feeder reconfiguration, asymmetric converter ratings, and grid-forming control. They do not, however, determine an R-SOP configuration from directional transfer requirements over an entire maintenance period or link that configuration sequentially to branch opening and sustained supply.
SOP-DG coordination can increase restored load and improve post-restoration voltages and power flows [28]. Multisource restoration models use two-stage acceleration to determine SOP supply areas and controls [29], and sequential restoration models describe SOP-assisted cold-load pickup [30]. Reconfigurable grid-forming SOPs can establish voltage and frequency references during restoration [26]; studies of grid-forming converters and dynamic microgrids also support self-organizing inverter participation in black start and islanded restoration [31]. These models target de-energized areas after fault isolation. Direct maintenance transfer instead requires continuous supply throughout the opening sequence. Before opening, it must coordinate alternative-path takeover and opening-eligibility assessment. It must then execute branch isolation and control-role handover and sustain post-opening supply.
Source–load variability also requires maintenance-period control across timescales. Two-timescale robust SOP scheduling [16] and real-time coordination in active distribution networks [17] support rolling set-point updates. Event-triggered online scheduling adds unscheduled optimizations when deviations cross a threshold, reducing unnecessary periodic computation [32]. Data-driven predictive voltage control [33] and chance-constrained model predictive control [34] further show that a rolling horizon can coordinate distributed resources with updated operating information. These methods focus on routine scheduling or voltage control and do not integrate physical configuration, pre-opening transfer, topology switching, and sustained post-opening supply through inherited states.
Two related lines of work provide the implementation basis for the proposed sequence. Seamless closed-loop transfer studies show that uninterrupted transfer can be achieved by establishing an alternative supply path and regulating transfer current before the original path is removed [3]. At the converter level, B2B-VSC SOPs have been demonstrated in both power-flow and supply restoration modes, with voltage synchronization supporting mode transition [35]. System-level R-SOP restoration models further assign V/f operation as a restoration role [26]. Accordingly, this study focuses on pre-opening network-state conditioning and sequential feasibility rather than converter switching transients.
Table 1 compares representative studies relevant to the proposed method. Existing work establishes the foundations for SOP–DG coordination, reconfigurable connections, asymmetric converter ratings, and event-triggered scheduling. The present study builds on these capabilities to assess a specific operating sequence for planned maintenance: configuring the alternative path, unloading the maintenance branch before opening, checking the assumed open state, and sustaining supply throughout the maintenance period. Its contribution lies in coupling these decisions through sequential feasibility checks and state inheritance.
Table 1.
Comparison with representative related studies.
This paper develops a three-stage quasi-steady-state feasibility assessment and coordinated dispatch method for direct load transfer during planned feeder maintenance. The method integrates feeder-connection reconfiguration, asymmetric VSC ratings, heterogeneous DG coordination, pre-opening branch unloading, and maintenance-period rolling operation. Its contributions are as follows.
- A three-stage sequential framework is developed for planned feeder maintenance. It integrates full-period R-SOP configuration, pre-opening state conditioning, the Transition Event, and post-opening rolling operation. The alternative path is established and progressively loaded before the maintenance branch is opened, enabling supply responsibility to be transferred without scheduled load shedding.
- A stage-coupled R-SOP–DG coordination model with state inheritance and sequential feasibility gating is formulated. Stage I determines the connection points, VSC-to-bus assignments, and port roles. Stage II transfers the receiving-area net demand to the R-SOP, reduces the residual branch current, enforces intermediate-state and assumed post-opening constraints. Stage III inherits the feasible open-topology state for rolling and event-triggered updates. This formulation excludes solutions that are feasible only after opening but cannot be implemented through the complete operating sequence.
- A branch-wise feasibility assessment based on complete three-stage validation is established to identify load-transfer boundaries under different maintenance periods and DG availability conditions. It distinguishes limitations imposed by topological access, port capacity, opening conditions, and sustained operation, and quantifies how connection reconfiguration, asymmetric port ratings, and DG support affect the transferable branch set.
2. Direct Load Transfer Framework
Consider planned feeder maintenance in a radial distribution network with heterogeneous DG, where no usable mechanical tie line is available or energized AC loop closing is prohibited. The operating requirement is to establish an alternative R-SOP path and transfer the receiving-area demand to it before opening the maintenance branch, without scheduling active load shedding. Feasibility is assessed at successive quasi-steady-state operating points, with all loads represented at their specified demands. PV and small-hydropower units support local active and reactive power, while the R-SOP transfers power between areas and regulates port reactive power without directly paralleling the AC feeders [9,13].
A conventional multi-terminal SOP has fixed physical connection points and equal-rated ports tied to a specific feeder topology [13]. A change in the maintenance branch, receiving area, or source–load distribution can prevent fixed points from covering both the main-grid and receiving areas, while equal ratings may not match directional transfer demand. Direct maintenance transfer also requires progressive pre-opening transfer and continued adaptation throughout the maintenance period, not merely a feasible post-opening operating point. The method must address three features.
- (1)
- Receiving-side capacity limitation of an equal-rated SOP. During maintenance, power flows mainly from the main-grid area through the SOP to the receiving area. One receiving-side port must cover the area’s net demand and source–load deviations, whereas several main-grid-side ports can share the input. The receiving-side rating therefore limits continuous supply even when other ports retain unused capacity. Assigning the largest VSC to the receiving side and smaller VSCs to the main-grid side better matches this directional flow and motivates the port-rating constraints below.
- (2)
- Spatial coupling between maintenance topology and port connections. A maintenance branch partitions the network into main-grid and receiving areas whose buses, loads, and DG vary by task. Ports must connect to both areas to create a transfer path, and the same bus may serve as a voltage-reference or power-controlled point under different topologies. Fixed connections can therefore exclude some maintenance tasks. Connection points, area assignments, and port ratings must be selected jointly.
- (3)
- Multitimescale constraints during opening and maintenance. Before opening, the branch current must decrease progressively, and inter-step voltage changes must remain bounded. At opening, the voltage change is checked, and the receiving-side reference port undergoes a P–Q-to-V/f control-mode handover. Thereafter, varying loads and DG affect power balance, bus voltages, and port loading. The model separates discrete configuration, progressive transfer, and rolling operation while enforcing common network and device constraints across all stages.
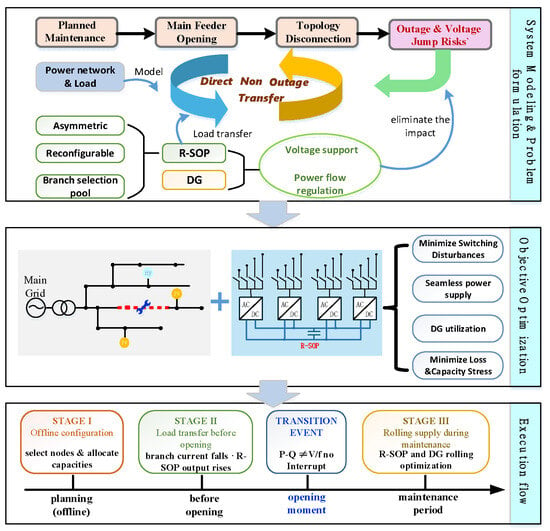
Figure 1 summarizes the three-stage R-SOP-DG framework. Asymmetric VSC ratings, connection reconfiguration, and multi-time-scale control coordinate power transfer, branch opening, and maintenance-period operation without increasing total SOP capacity.
Figure 1.
Overall framework of the proposed three-stage R-SOP–DG load transfer method.
Stage I: Port prescreening and configuration assessment. Candidate R-SOP connections are screened using maintenance duration, DG capacity, and load variation. Feasible configurations are scored, and the highest-ranked VSC-to-bus assignment is selected.
Stage II: Power transfer and opening control. R-SOP and DG progressively unload the maintenance branch to its allowable level. The branch is then opened as the receiving-side VSC transfers from P–Q to V/f control.
Stage III: Rolling maintenance-period supply. Under fixed connections and the open topology, rolling optimization updates R-SOP and DG set points and verifies bus voltage, branch capacity, VSC rating, and DG constraints.
3. Three-Stage R-SOP Coordinated Optimization Model
Direct maintenance transfer is not a single-point power-flow problem. Connection configuration sets the physical capability of the alternative path, pre-opening transfer determines whether the branch can be removed safely, and post-opening rolling control sustains supply. The model therefore follows Stage I, Stage II, the Transition Event, and Stage III in operational order. No active load-shedding variable is introduced, and all loads are supplied at their specified demands. All stages are evaluated using a quasi-steady-state AC power-flow model. VSC inner-loop dynamics and P–Q-to-V/f switching transients are outside the scope of this study, and the VSC is assumed to possess the required lower-level mode-switching capability. Accordingly, the Transition Event evaluates sequential electrical feasibility before and after branch opening rather than dynamic switching stability.
Active and reactive power injected by the R-SOP into the AC network are positive, as is load consumption. Let the bus, branch, and VSC-port sets be , , and , respectively; the receiving-area and main-grid-area bus sets be and ; the PV and small-hydropower sets be and . The stage index is .
3.1. Common R-SOP, Network, and DG Model
- (1)
- R-SOP Connection Configuration and Port Roles
R-SOP ports have unequal ratings, so the VSC-to-bus assignment affects available transfer capacity and control margin even for the same connection-point set. Stage I therefore selects both the points and their port assignments. Binary variable equals one if VSC is connected to candidate bus . The assignment constraints are
where is the candidate bus set, and and indicate whether VSC lies in the receiving and main grid areas, respectively. Constraint (1) connects each VSC to one bus and assigns at most one VSC to each candidate bus.
The highest-rated receiving area port becomes the post-opening reference because it balances the area’s net demand and losses in real time. The highest-rated main-grid-area port uses control to maintain dc-side active-power balance. The port roles are
where is the rated apparent power of the VSC ; is the receiving-area reference port that switches to control after opening. Port is the main grid-area port under control. Function gives priority to the lower-indexed port when ratings are equal. Equation (2) assigns the largest control margins to the ports responsible for area and dc-side balance.
Port is only the designated reference and remains under P–Q control until the maintenance branch opens. It switches to after breaker opening is confirmed. Assigning the highest-rated ports to the V/f and roles provide margin for source–load variation and dc-side imbalance.
- (2)
- VSC Ratings and DC-Side Power Balance
Each asymmetrically rated VSC requires an individual capacity constraint because the total installed rating does not determine the capability of each port. A stage-dependent utilization limit preserves a larger capacity margin during sustained operation and permits higher utilization during the brief transfer interval. Each port satisfies
where is the utilization limit in stage . Stages I and III use the continuous limit, whereas Stage II and the Transition Event use the short-term limit.
Under the normal transfer direction, the R-SOP delivers active power from the main-grid area to the receiving area. DC-side balance and equivalent conversion losses are represented by
where is the fixed conversion efficiency, and is derived from dc-side balance rather than treated as an independent variable. Equation (4) applies to main-grid-to-receiving-area transfer. Bidirectional operation requires a piecewise efficiency model.
- (3)
- Distribution-Network Power Flow and Security Constraints
The topology is fixed within each stage, allowing a radial AC power-flow operator. The net complex-power injections and power-flow equations are
where denotes the standard DistFlow equations solved by backward/forward sweep. Before opening, only the main grid slack bus provides the reference; afterward, the bus connected to provides the receiving area’s voltage and frequency reference. Bus voltages and branch transfers satisfy
Here, and denote the complex powers at the sending and receiving ends of branch , and is its assigned static apparent-power limit. Equation (6) represents line thermal capacity through a static loading constraint applied to every energized branch at each evaluated operating point. It does not model conductor-temperature dynamics or weather-dependent ratings. Branch losses are obtained from the power-flow solution. Equations (5) and (6) jointly define network feasibility throughout the transfer sequence.
- (4)
- Heterogeneous DG Constraints
DG reduces R-SOP loading and supports voltage but remains limited by its primary resource and equipment rating. PV active power follows available irradiance, while reactive power uses residual inverter capacity:
Small-hydropower units satisfy active-power, apparent-power, power-factor, and ramping limits:
when PV active power approaches zero, and night-time reactive-power operation is disabled, set . Small hydropower is restricted to nonnegative reactive-power injection. Its active-power command remains fixed during Stage II, while limited reactive-power adjustment is permitted.
- (5)
- Receiving-Area Power Balance and Common Feasible Set
After the maintenance branch opens, the original AC feeder no longer balances the receiving area. The output of port is derived from area sources, loads, and losses:
where is the set of DG units in the receiving area, and and are its branch losses. Joint solution of (9) and the power-flow equations makes port supply the area’s residual balance. Equation (4) makes port supply the residual dc-side active power. Neither balancing output is an independent decision variable.
The common feasible set comprises (3)–(9) and the DG constraints. The only distinction between the pre-opening mode and post-opening mode is that port changes from P–Q to control.
- (6)
- Operating Metrics
Voltage deviation, loss, and utilization have different units and are normalized by security-related bases. Let voltage deviation, total loss, maximum port utilization, and DG regulation cost be , , , and , with normalized values , , , and , respectively. The loss base is 5% of the current total load, and the utilization base is the stage-specific limit.
3.2. Stage I: Connection Configuration over the Entire Maintenance Period
Stage I selects the R-SOP connections and port assignments that remain fixed throughout maintenance. A capacity prescreen removes clearly infeasible configurations before full-period operating assessment.
- (1)
- Capacity Prescreening
Prescreening tests basic supply capability and conservatively excludes adjustable DG reactive power from the capacity credit. The receiving-area demand and required main-grid-side active-power input are
A candidate configuration must satisfy
Prescreening does not replace full AC power-flow validation. A fixed-connection equal-rated SOP is obtained by fixing and setting all values equal.
- (2)
- Full-Period Assessment and Configuration Selection
Each configuration that passes prescreening is optimized sequentially over time. The single-period objective is
Problem minimizes over the common feasible set . Independent controls are small-hydropower active and reactive power, the PV reactive-power coefficient, active power of P–Q ports, and reactive power of ports other than . Variables , , and are derived from (4) and (9). A configuration is discarded if any period is infeasible.
For configurations feasible in every period, define the aggregate score
and select . Here, is the set of configurations feasible in all periods, is cumulative loss energy, and is worst-case port utilization. Stage I does not optimize the entire horizon jointly. Periods are solved sequentially, with small-hydropower states linked by ramping constraints.
3.3. Stage II: Pre-Opening State Conditioning Through Progressive Power Transfer
Stage I establishes that the selected path can support the maintenance-period demand, but it does not determine whether the current operating state can reach an opening-eligible state without violating constraints. Stage II therefore serves as a pre-opening state-conditioning stage. While the maintenance branch remains closed, the R-SOP progressively takes over the receiving-area demand, reducing the original branch to a low-current state while maintaining feasibility at every intermediate quasi-steady-state point.
Let Stage II contain discrete control points. Controls vary linearly between their initial and terminal targets:
where . Small-hydropower active power and source–load inputs remain fixed. The linear path reduces online variables and permits direct validation of each intermediate point; it is not claimed to be the unique optimal physical transient trajectory.
Define the maximum inter-step voltage variation , terminal branch-current ratio , and predicted steady-state nodal-voltage difference associated with branch opening as
To separate preferred performance from hard limits, introduce soft penalties and . These are squared positive exceedances of the internal design targets, normalized by the corresponding target-to-hard-limit intervals. The five-term Stage II objective is
Problem enforces the common feasible set under both the closed and assumed open topologies, together with hard constraints , , and . Opening is authorized only when is feasible and all hard constraints are satisfied.
The Transition Event executes branch opening, control-mode handover, and state inheritance in the following order: opening-eligibility confirmation, breaker operation, open-state confirmation, and activation of control. The inheritance map retains the small-hydropower state, PV reactive-power coefficient, and independent P–Q-port commands. After opening, the output of is derived from (9).
3.4. Stage III: Rolling Power Balance During Maintenance
Actual source–load conditions deviate from forecasts after opening, and fixed commands may degrade operation. Stage III recomputes controls at scheduled and event-triggered updates. Each update produces one control command and evaluates it over future prediction points. The problem is
where the single-point objective has the same structure as (13). Constraints include the common feasible set and (3)–(9). The optimal command is held until the next update.
At non-update monitoring points, the previous command and PV reactive-power coefficient are retained, while actual reactive power is recalculated from currently available active power.
Event triggering initiates an extra optimization between scheduled updates. Source–load forecast errors require persistent confirmation, whereas security indices trigger immediately when an index crosses its threshold in the adverse direction. Specifically, an update occurs when the aggregate relative load or PV error exceeds its threshold for consecutive intervals, or when minimum voltage, maximum port utilization, or PV-inverter utilization first crosses its trigger threshold. Each signal invokes one .
4. Solution and Implementation
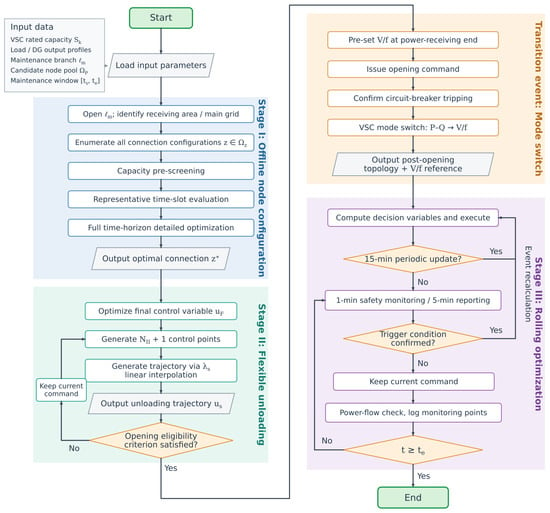
The proposed method is divided into offline configuration and online operation. Stage I selects and validates the physical R-SOP connections before maintenance. Stage II prepares an opening-eligible operating state, the Transition Event performs branch isolation and control-mode handover, and Stage III updates the operating commands during maintenance. Figure 2 summarizes the workflow and sequential feasibility gates.
Figure 2.
Hierarchical solution and sequential implementation of the proposed three-stage method.
4.1. Offline Stage I Screening and Full-Period Assessment
For each maintenance branch, the post-opening network is divided into the main-grid and receiving areas. Candidate connection points are classified accordingly. All admissible VSC-to-bus assignments are enumerated subject to three conditions: each area contains at least one R-SOP port, each VSC is connected to one bus, and each candidate bus accommodates at most one VSC.
The candidate set is reduced in three steps. Capacity prescreening first removes assignments with insufficient receiving-side or main-grid-side capability. A heuristic power-flow check then filters out infeasible cases and provides initial points for continuous optimization. Finally, representative-period optimization evaluates the remaining assignments under high-PV, rising-load, and high-net-load conditions.
The highest-ranked assignments undergo assessment over the entire maintenance period. Network, VSC, and DG constraints are checked at every period. The selected connection is the feasible assignment with the lowest aggregate objective.
Let , , and denote the numbers of admissible assignments, assignments entering representative-period optimization, and assignments retained for full-period assessment, respectively. Let and denote the numbers of representative and full-period time points. The main number of continuous optimizations is
An exhaustive assessment would require optimizations. The proposed screening procedure therefore reduces the computational burden. Because only a subset of assignments receives full-period assessment, is the best configuration identified under the specified screening rules rather than a guaranteed global optimum. The representative periods and retention settings are given in Section 5.
4.2. Online Sequential Execution and State Inheritance
Stage II retains the connection selected in Stage I. The measured source–load conditions and current commands define the initial state. The terminal command is solved first, and the transfer rule in Section 3.3 generates operating points between and . Each point is checked against the network and device constraints, together with the maintenance-branch current and inter-step voltage limit.
After the transfer path is validated, an assumed post-opening power flow is solved using the same source–load conditions and terminal commands. The terminal command is revised if any intermediate or post-opening state violates a hard constraint. The Transition Event is authorized only when the complete path is feasible, and the terminal branch current, inter-step voltage variation, and steady-state nodal-voltage difference associated with branch opening satisfy their limits. This procedure evaluates the entire transfer path rather than the terminal state alone.
The Transition Event introduces no additional numerical optimization. At the system level, it represents opening authorization, breaker operation, open-state confirmation, and reassignment of the receiving-side port from P–Q to V/f control. The underlying VSC controller is assumed to execute this mode handover. The terminal Stage II commands and the assumed post-opening state initialize Stage III.
Stage III operates under the fixed connection and the open topology. Scheduled or event-triggered updates solve a finite-horizon optimization using the current feasible command as the initial point. Between updates, the independent commands are retained, and the power-flow state is refreshed using the latest measurements. All monitoring points are checked against the hard operating constraints.
Only configurations feasible throughout Stage I proceed to Stage II, and only opening-eligible schemes enter Stage III. The same sequential gating logic is used in the multi-branch assessment in Section 5.
4.3. Planned Isolation, Reconnection, and Protection Interfaces
The branch opening considered here is an authorized maintenance operation. The residual-current and voltage criteria determine opening eligibility within the operating model; they do not replace fault detection or protection coordination. Practical execution would require protective actions to take precedence over dispatch commands, with the transfer sequence inhibited when fault or interlocking conditions are present.
Protection settings would need to be checked for both the closed topology and the receiving area supplied through the V/f port. Relevant factors include network grounding, fault location, DG fault contribution, converter current limiting, and relay directionality and sensitivity. Previous SOP fault studies demonstrate that converter controls and operating points affect the network fault response [36]. The present power-flow model therefore cannot establish relay operating times, selectivity, or substation protection performance. Moreover, an R-SOP transfers power between areas and does not provide an independent energy source; loss of the supplying grid would require a separate assessment of available generation and load balance.
Reconnection after maintenance is not simulated in this study. Its implementation would require confirmation of maintenance completion and protection readiness, synchronization of voltage magnitude, frequency, and phase angle across the open branch, and coordinated breaker closing and converter-mode handover. Voltage synchronization is also relevant to SOP control-mode transitions [35]. The two independent power-flow reference assignments used here do not demonstrate such synchronization. Where utility rules prohibit temporary parallel operation, the return-to-normal sequence would require a separately approved operating scheme. Neither successful protection operation nor uninterrupted reconnection is inferred from the present quasi-steady-state results.
5. Results and Discussion
5.1. Test Setup
Validation has three levels: the complete transfer sequence for branch 6–26, controlled comparisons of device structure, DG coordination and event-triggered updates, and multi-branch assessment under different source–load conditions. A four-structure comparison separates connection reconfiguration from asymmetric converter ratings. An additional economic assessment compares the R-SOP with diesel generation for the same planned maintenance duty.
- (1)
- Test System and Device Parameters
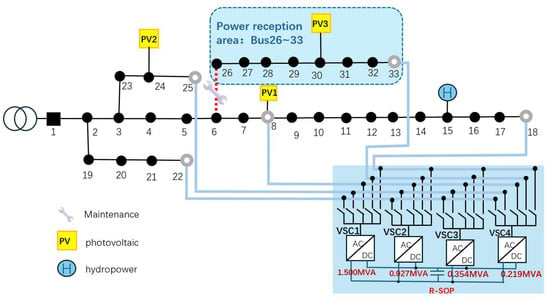
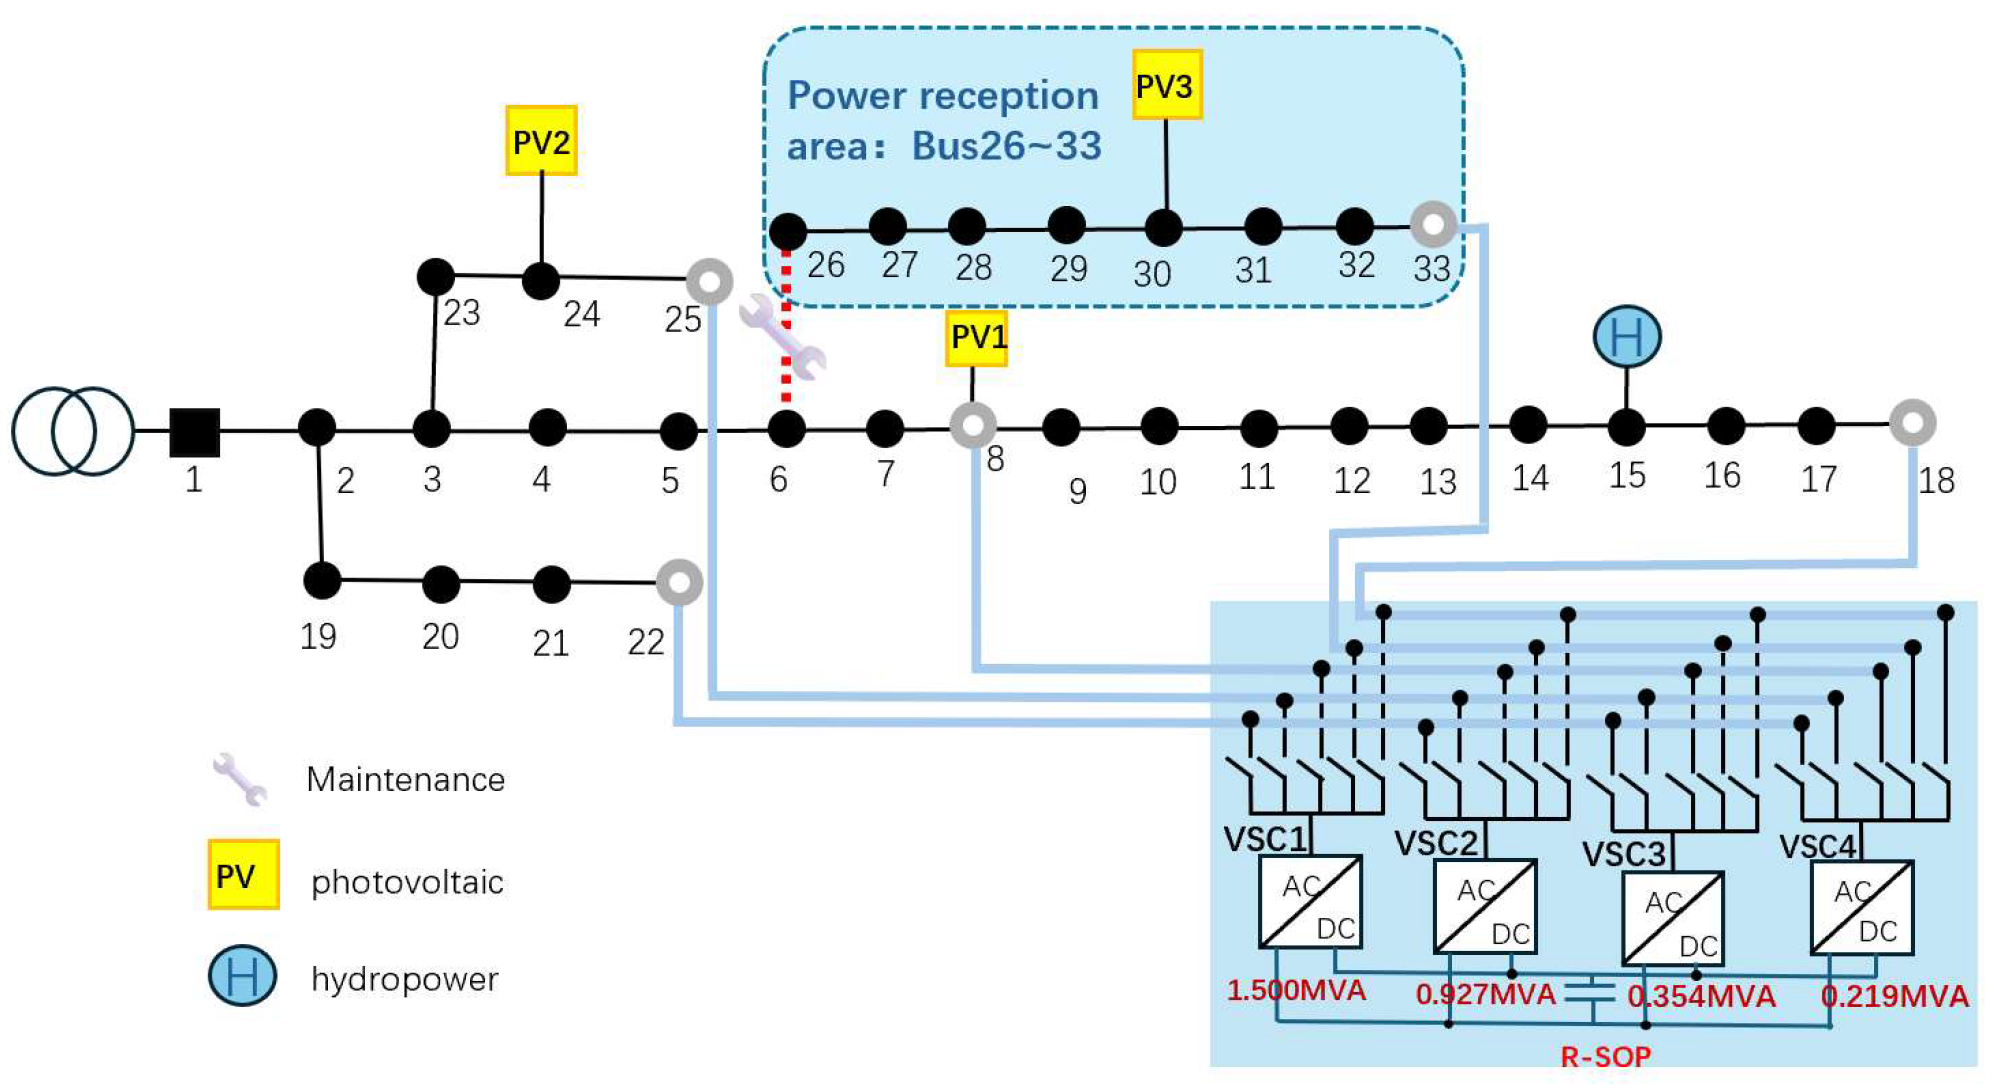
The modified IEEE 33-bus radial distribution system has 33 buses and 32 radial branches, with no mechanical backup tie line. Main scenario S1 schedules maintenance of branch 6–26 from 12:00 to 20:00. Opening this branch creates a receiving area comprising Buses 26–33; all other buses form the main-grid area. Figure 3 shows the topology, DG locations, R-SOP candidate points, and maintenance branch. Stage I selects four of five candidates and assigns the VSCs to them.
Figure 3.
Modified IEEE 33-bus test system with the R-SOP and heterogeneous DG.
The fixed SOP and R-SOP both have 3.0 MVA of total converter capacity. The fixed SOP connects to Buses 18, 22, 25, and 33 with four equal-rated ports. The R-SOP uses the Golden sizing strategy for asymmetric ratings and selects its physical points from the candidate pool. PV units are connected to Buses 8, 24, and 30, and a small-hydropower unit is connected to Bus 15. Their inverter ratings are 1.00, 0.80, and 0.50 MVA. PV apparent power is limited to 0.98 p.u. of rating in Stages I and III, while Stage II permits the full rating briefly. Nighttime reactive-power support is disabled when available PV active power is zero. Small-hydropower active power ranges from 0.25 to 0.50 MW, with a minimum power factor of 0.80 and reactive-power injection only. Table 2 lists the main parameters.
Table 2.
Test-system, device, and stage parameters.
The transition criteria address three operational requirements: smooth voltage changes during power migration, limited voltage differences across branch opening, and sufficient unloading of the maintenance branch before isolation. As an engineering benchmark, the TNB Connection Guidelines specify voltage-step limits at the point of common coupling of 1% for frequent load switching or disconnection and 3% for infrequent single events [37]. The adopted inter-step limit of 0.010 p.u. matches the former magnitude, while the opening-voltage limit of 0.020 p.u. is below the latter. Here, these benchmarks provide context for the selected quasi-steady-state voltage criteria. The residual-current limit is a study-specific unloading requirement set at 20% of the branch rating and applied jointly with the voltage criteria and post-opening power-flow constraints.
The current target of 18% and the opening-voltage evaluation target of 0.018 p.u. are both 90% of their corresponding hard limits, providing a consistent 10% relative margin. The VSC utilization limits of 0.90 and 0.95 retain capacity headroom for sustained and short-duration operation, respectively. For numerical implementation, the solver uses an internal opening-voltage target of 0.0178 p.u. to retain numerical margin against the reported evaluation target of 0.018 p.u.
All objective terms are normalized before weighting; the weights rank feasible solutions without changing hard network, VSC, or DG constraints. The Stage I single-period weights for voltage deviation, loss, maximum port utilization, and DG regulation are 0.35, 0.40, 0.15, and 0.10. Full-period connection comparison uses 0.30, 0.20, 0.45, and 0.05 for average voltage deviation, cumulative loss, worst-case port utilization, and average DG regulation, prioritizing capacity margin. Stage II uses 0.25, 0.20, 0.15, 0.25, and 0.15 for maximum inter-step voltage variation, maximum port utilization, control adjustment, branch-current penalty, and opening-voltage penalty. Stage III uses 0.30, 0.30, 0.15, 0.10, and 0.15 for voltage deviation, loss, maximum port utilization, DG regulation, and control smoothness.
- (2)
- Stress Event and Stage III Update Settings
Stage III monitors security every 1 min, records operating results every 5 min, and performs scheduled optimization every 15 min. Cases 1–4 use identical source–load inputs and routine deviation sequences in each comparison.
A deterministic stress event from 15:18 to 15:48 tests the response to persistent deviations between scheduled updates. It changes active and reactive loads at Buses 9–18 and available active power of PV1 at Bus 8, but not the Bus 26–33 receiving area. A PCHIP-generated nonflat envelope gives a 14% peak load increment, while available PV1 power falls by at most 28%. The error crosses the threshold at 15:18; after 2 min of confirmation, an unscheduled optimization runs at 15:20. With scheduled updates only, the 15:15 command remains active until 15:30.
Case 4 reuses the Case 1 state after the 15:15 scheduled update and the subsequent source–load trajectory, and is simulated independently until 16:05. The cases differ only in whether the 15:20 event-triggered optimization is executed. Table 3 summarizes the main, comparison, and multi-branch conditions.
Table 3.
Validation cases and operating conditions.
PV forecast errors are addressed operationally through deviation monitoring and feedback updates. The optimization uses point forecasts, while Stage III refreshes the operating state with available measurements and recomputes commands at scheduled or event-triggered updates. The prescribed PV reduction tests the response to a sustained forecast deviation; it does not constitute a probabilistic uncertainty assessment. No forecast-error distribution, chance constraint, or robust uncertainty set is introduced. Moreover, the stress event affects main-grid-side PV1, so the reported results do not establish robustness to forecast errors at receiving-area PV3 or to correlated errors across multiple PV units.
Fast screening reduces the computational burden, while the feasibility classifications reported in Section 5.4 are determined by sequential validation through Stage I, Stage II, the Transition Event, and Stage III.
5.2. Three-Stage Transfer in the Main Case
- (1)
- Stage I Connection Configuration and Weight Sensitivity
For maintenance of branch 6–26, Bus 33 is the only candidate in the receiving area, so the receiving-side connection is fixed there. The other three ports are selected from main-grid-side Buses 8, 18, 22, and 25. Stage I generates 96 VSC-to-bus configurations that satisfy the assignment rules. Capacity and heuristic power-flow screening retain 24; representative-period continuous optimization retains six, and detailed full-period assessment evaluates the top two.
Under nominal weights, VSC1–VSC4 connect to Buses 33, 22, 8, and 25, yielding the best score of 0.5178. The second-ranked assignment, Buses 33, 22, 25, and 18, scores 0.5180, a difference below 0.1%. Equal, voltage-focused, and utilization-focused weights select Buses 33/22/25/18, whereas loss-focused weights select Buses 33/22/25/8.
Across all five weight sets, VSC1 remains at Bus 33 and VSC2 at Bus 22, with worst-case port utilization of 0.8464. Only the assignments of VSC3 and VSC4 among Buses 8, 18, and 25 change. The top-two objective differences range from 0.02% to 0.46%. Thus, the large receiving-side port and main-grid-side dc-voltage port are weight-robust, while several nearly equivalent locations exist for the two small P–Q ports. Stage I therefore provides a preferred configuration under specified operating priorities, not a unique weight-independent solution.
At the worst period, the receiving area’s maximum apparent-power requirement, including a 5% reserve, is 1.317 MVA. Connecting the largest port, VSC1, to Bus 33 provides continuous receiving capability of
and a receiving-side capacity margin of
Table 4 lists the nominal-weight configuration and port roles before and after the Transition Event. Because Stage II reduces branch 6–26 flow to nearly zero, steady-state port complex powers remain almost unchanged under identical source–load conditions and references. The principal system-level change is the control-mode handover of VSC1 from P–Q to V/f; all other port roles remain unchanged.
Table 4.
R-SOP port configuration and control roles in the main scenario.
- (2)
- Stage II Pre-Opening State Conditioning and Transition Event
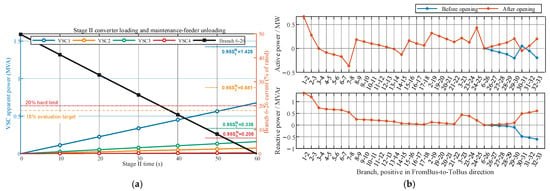
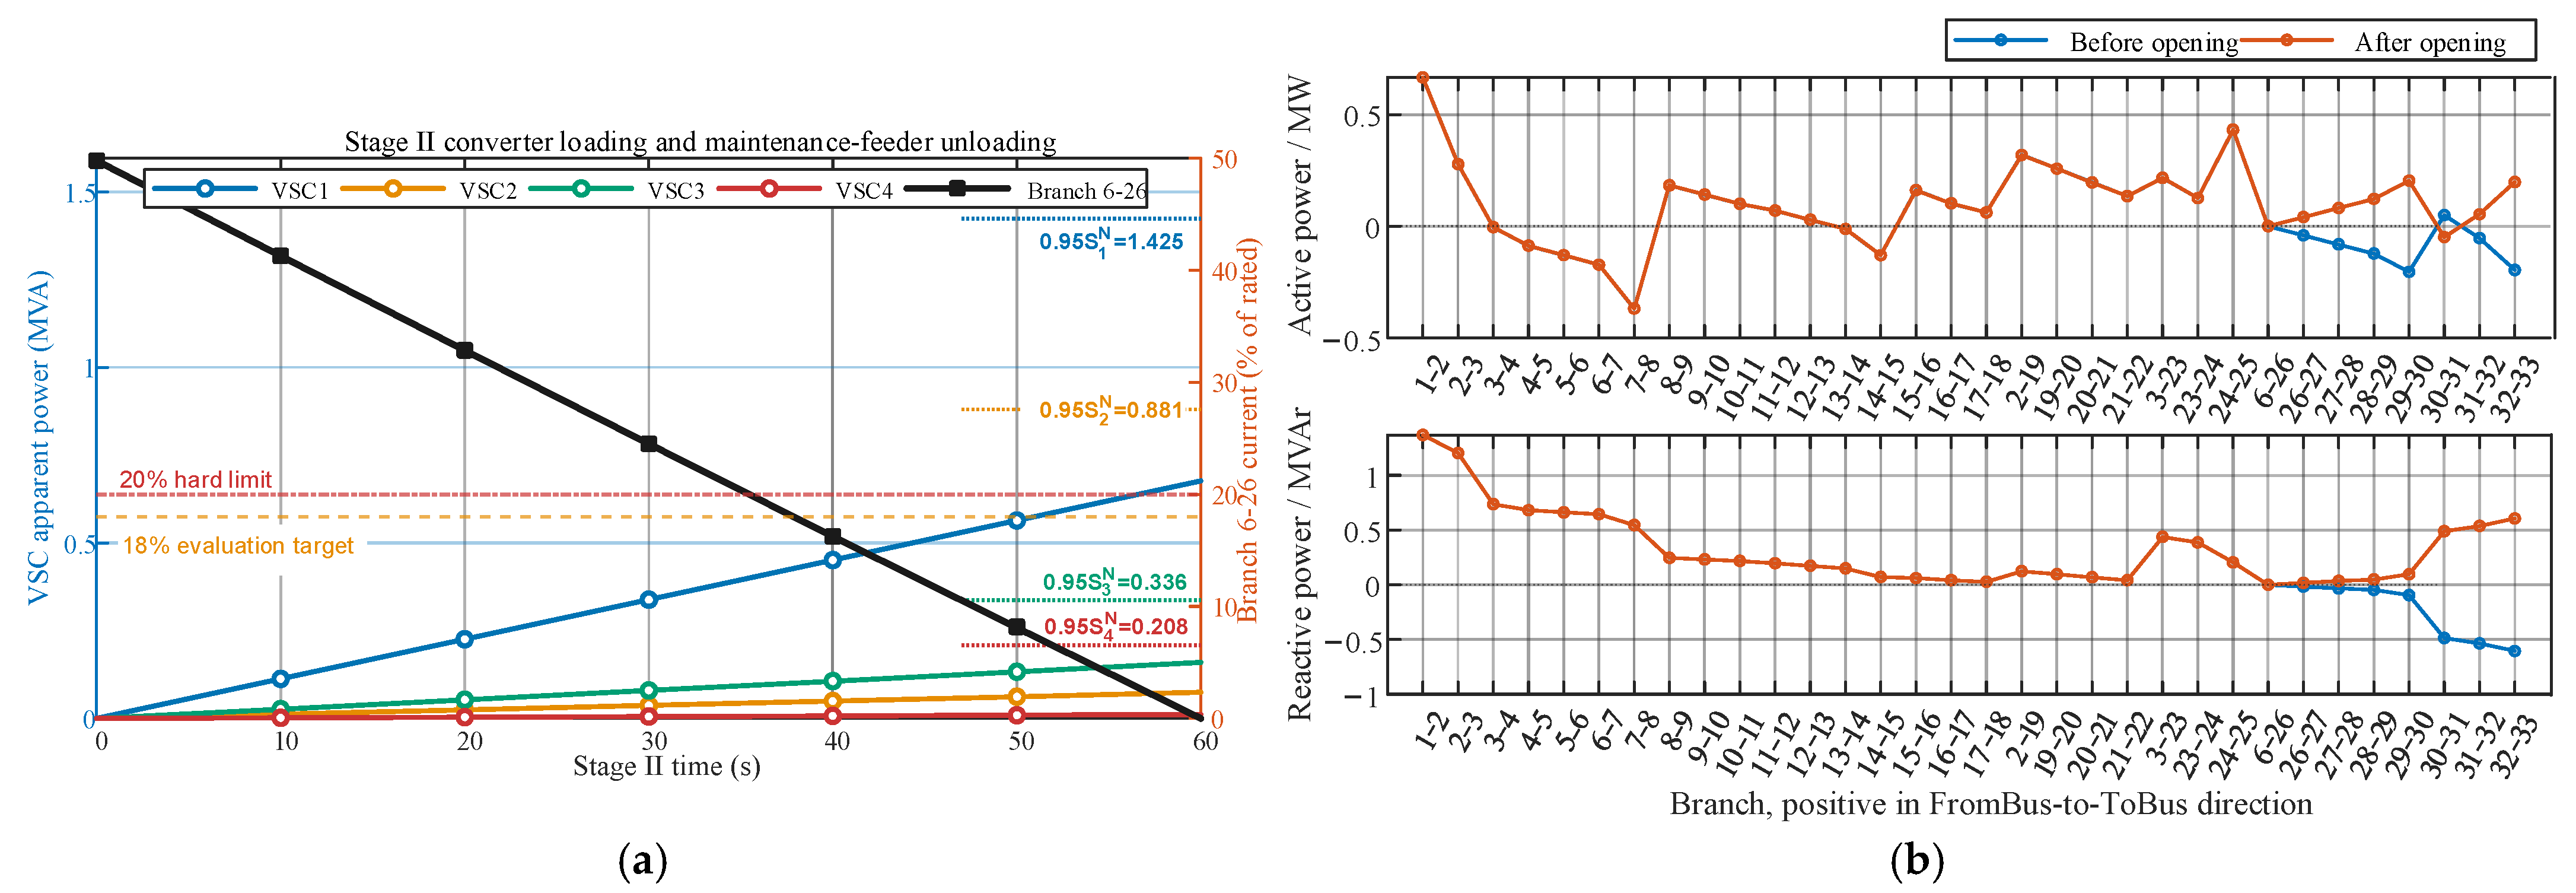
Stage II uses seven steady-state control points from 11:59:00 to 12:00:00. Figure 4a shows the apparent powers of the four VSCs and the current of the maintenance branch during Stage II. As VSC1 progressively supports the receiving area, the R-SOP takes over the branch’s active-power transfer. VSC2–VSC4 absorb power from the main-grid area according to dc-side balance.
Figure 4.
Stage II: (a) VSC loading and Branch 6–26 current; (b) Active and reactive power of branches before and after opening.
After 60 s, branch 6–26 current falls from 40.87 A to approximately 0.001 A, well below the 18% evaluation and 20% hard limits. Maximum port utilization is 0.4511, below the 0.95 short-term limit, and maximum inter-step voltage variation is 0.0056 p.u., below 0.010 p.u. All seven evaluated control points satisfy the power-flow and operating constraints.
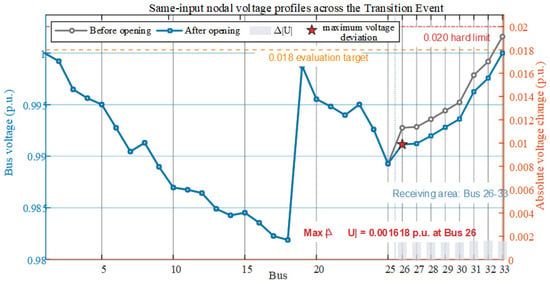
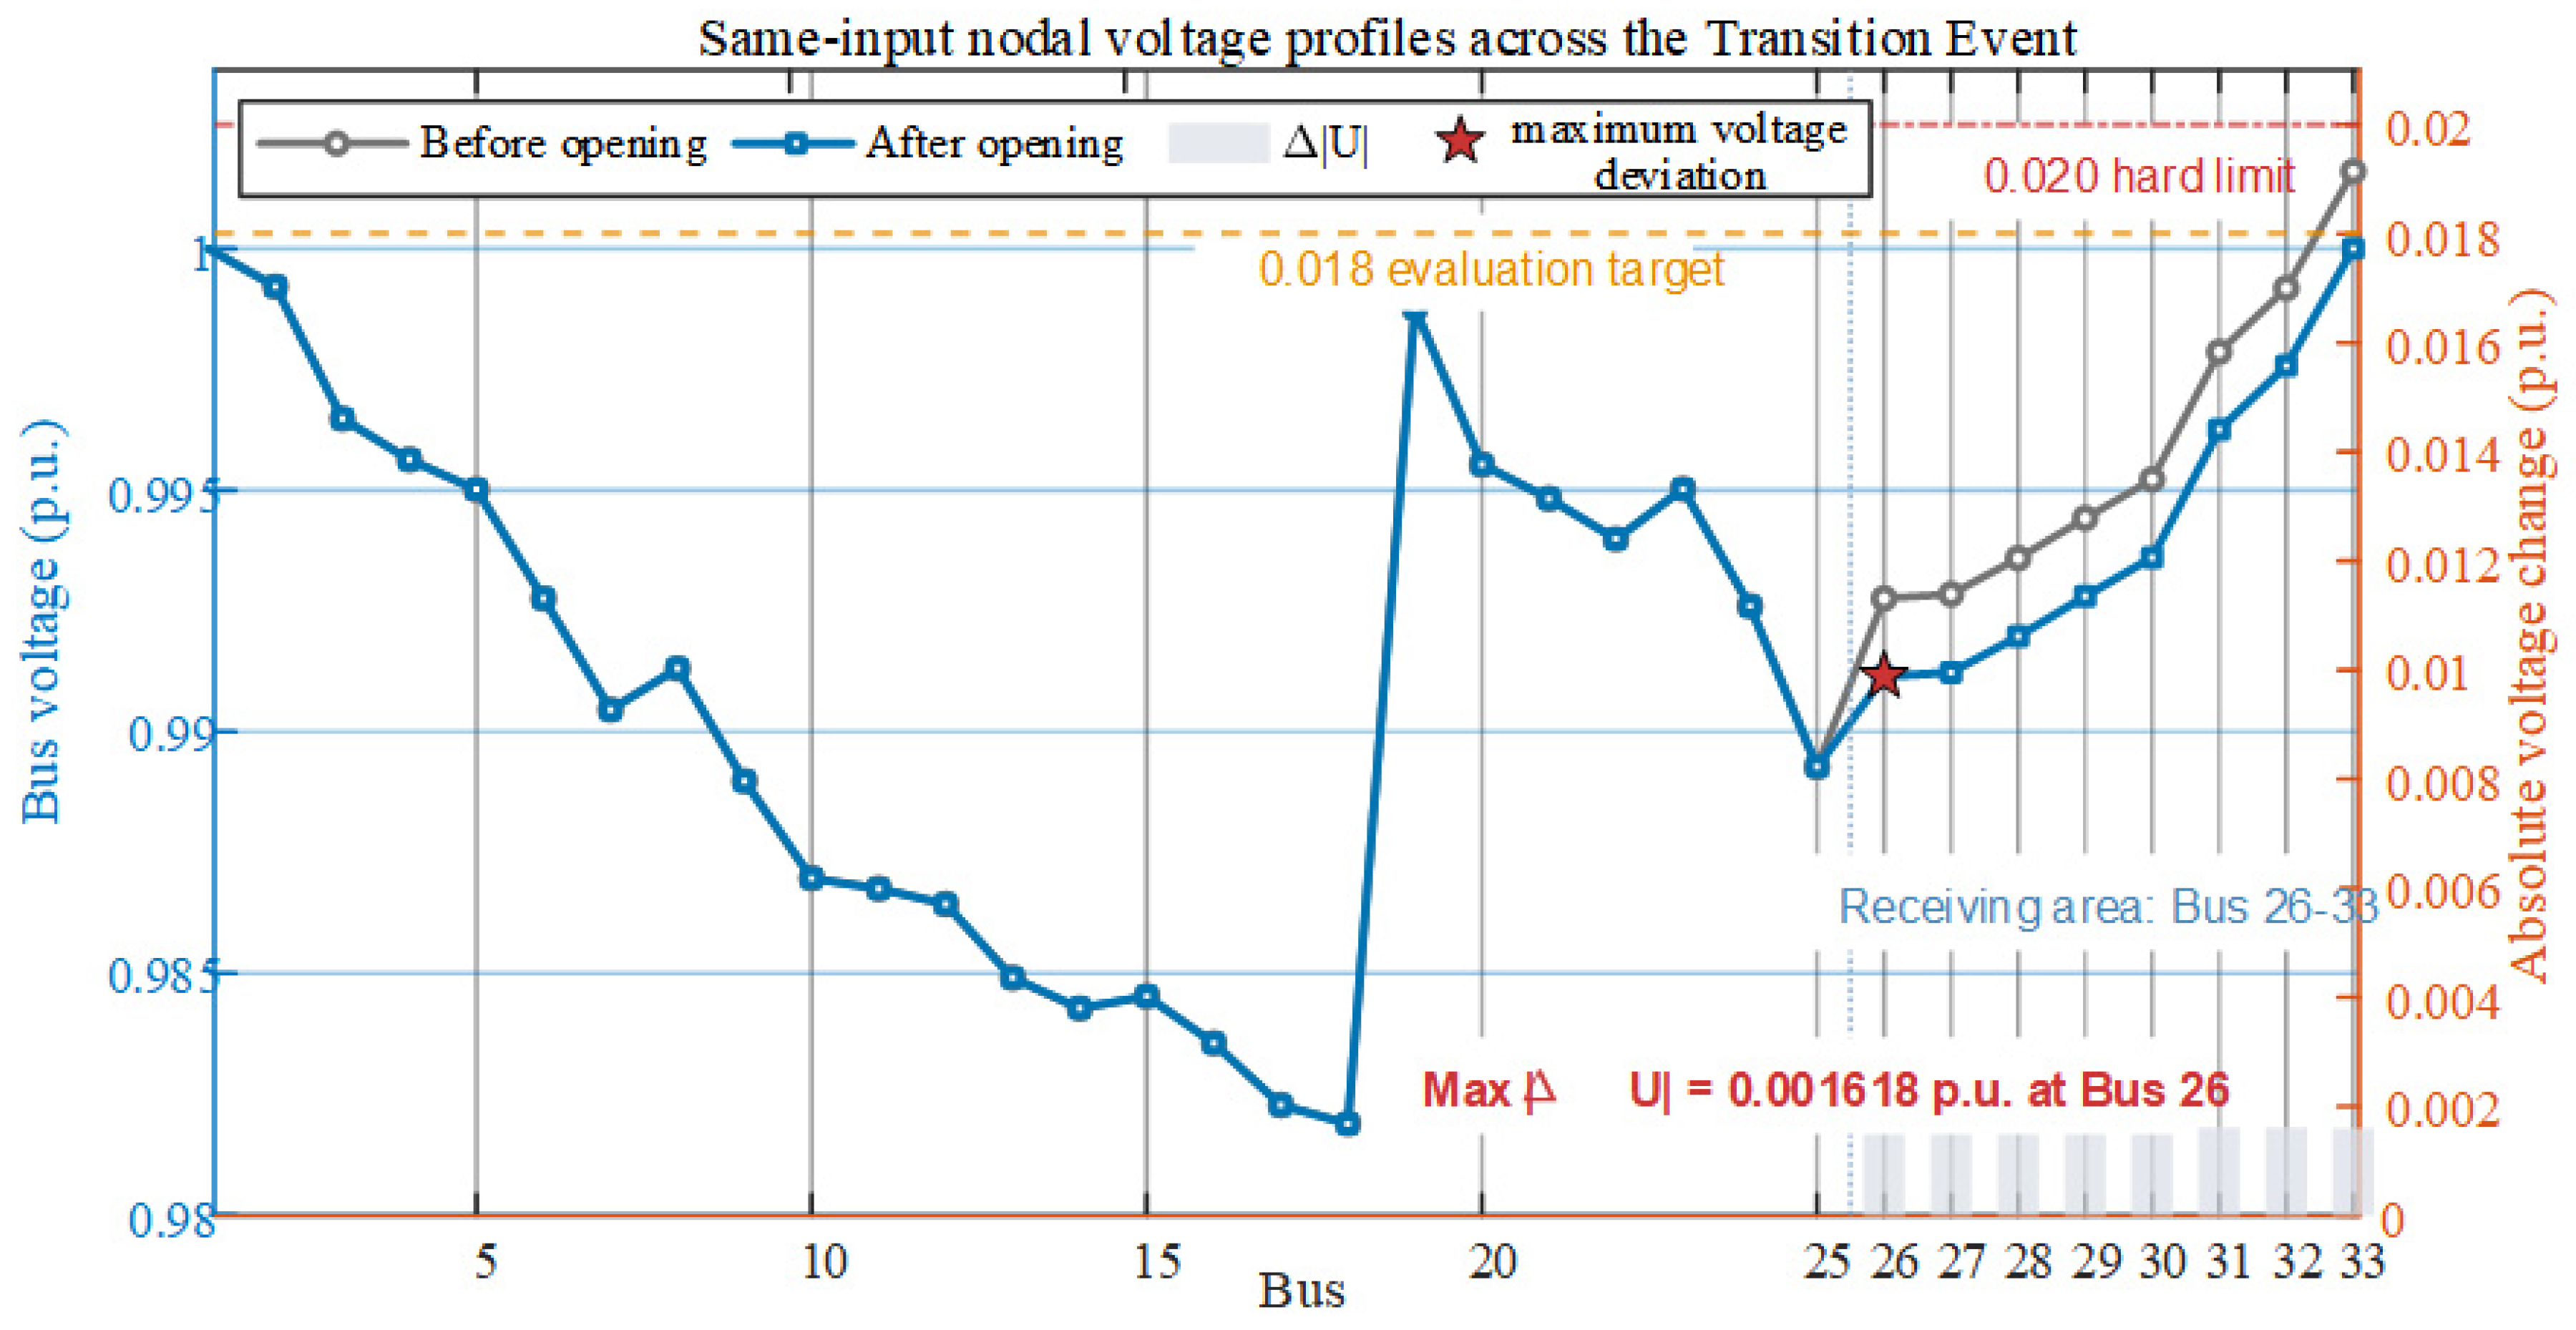
To assess the effect of branch opening on network power flows, the terminal closed-topology state is compared with the assumed post-opening state under identical source–load inputs. Independent control commands are retained, while balancing-port outputs are determined by the corresponding power-flow solutions. Figure 4b presents the active and reactive powers of all branches, with positive values defined in the listed FromBus-to-ToBus direction. The main grid-branch flows remain nearly unchanged, and the maintenance branch carries negligible power before opening and zero power after isolation. Figure 5 presents the corresponding bus voltage profiles and their differences, providing the voltage assessment for opening eligibility.
Figure 5.
Bus voltages before/after opening and absolute differences (red star: maximum difference at Bus 26).
Under the assumed post-opening topology, bus voltages remain within 0.9819–1.0000 p.u. The maximum steady-state nodal-voltage difference between the closed and assumed open solutions is 0.0016 p.u. at Bus 26, below the 0.018 p.u. evaluation target and the 0.020-p.u. hard limit. The post-opening power flow converges, and all ports, DG units, and branches satisfy common constraints. The operating point therefore satisfies the quasi-steady-state opening criteria. Branch 6–26 can be isolated, after which VSC1 is assigned the V/f role in the post-opening formulation.
Figure 4 and Figure 5 show that Stage II transfers supply responsibility to the R-SOP and prepares a low-current, constraint-satisfying operating state for branch isolation.
- (3)
- Rolling Stage III Operation During Maintenance
After the Transition Event, Stage III monitors security every 1 min from 12:00 to 20:00, records states every 5 min, and optimizes every 15 min. The 480 monitoring points include 33 optimizations: one on entry, 31 subsequent scheduled updates, and one event-triggered update at 15:20.
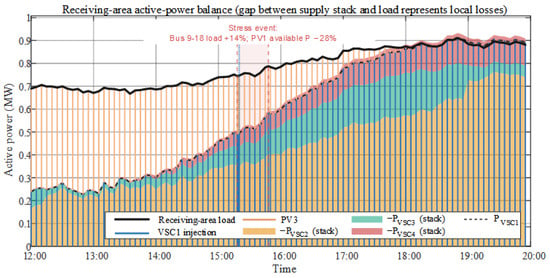
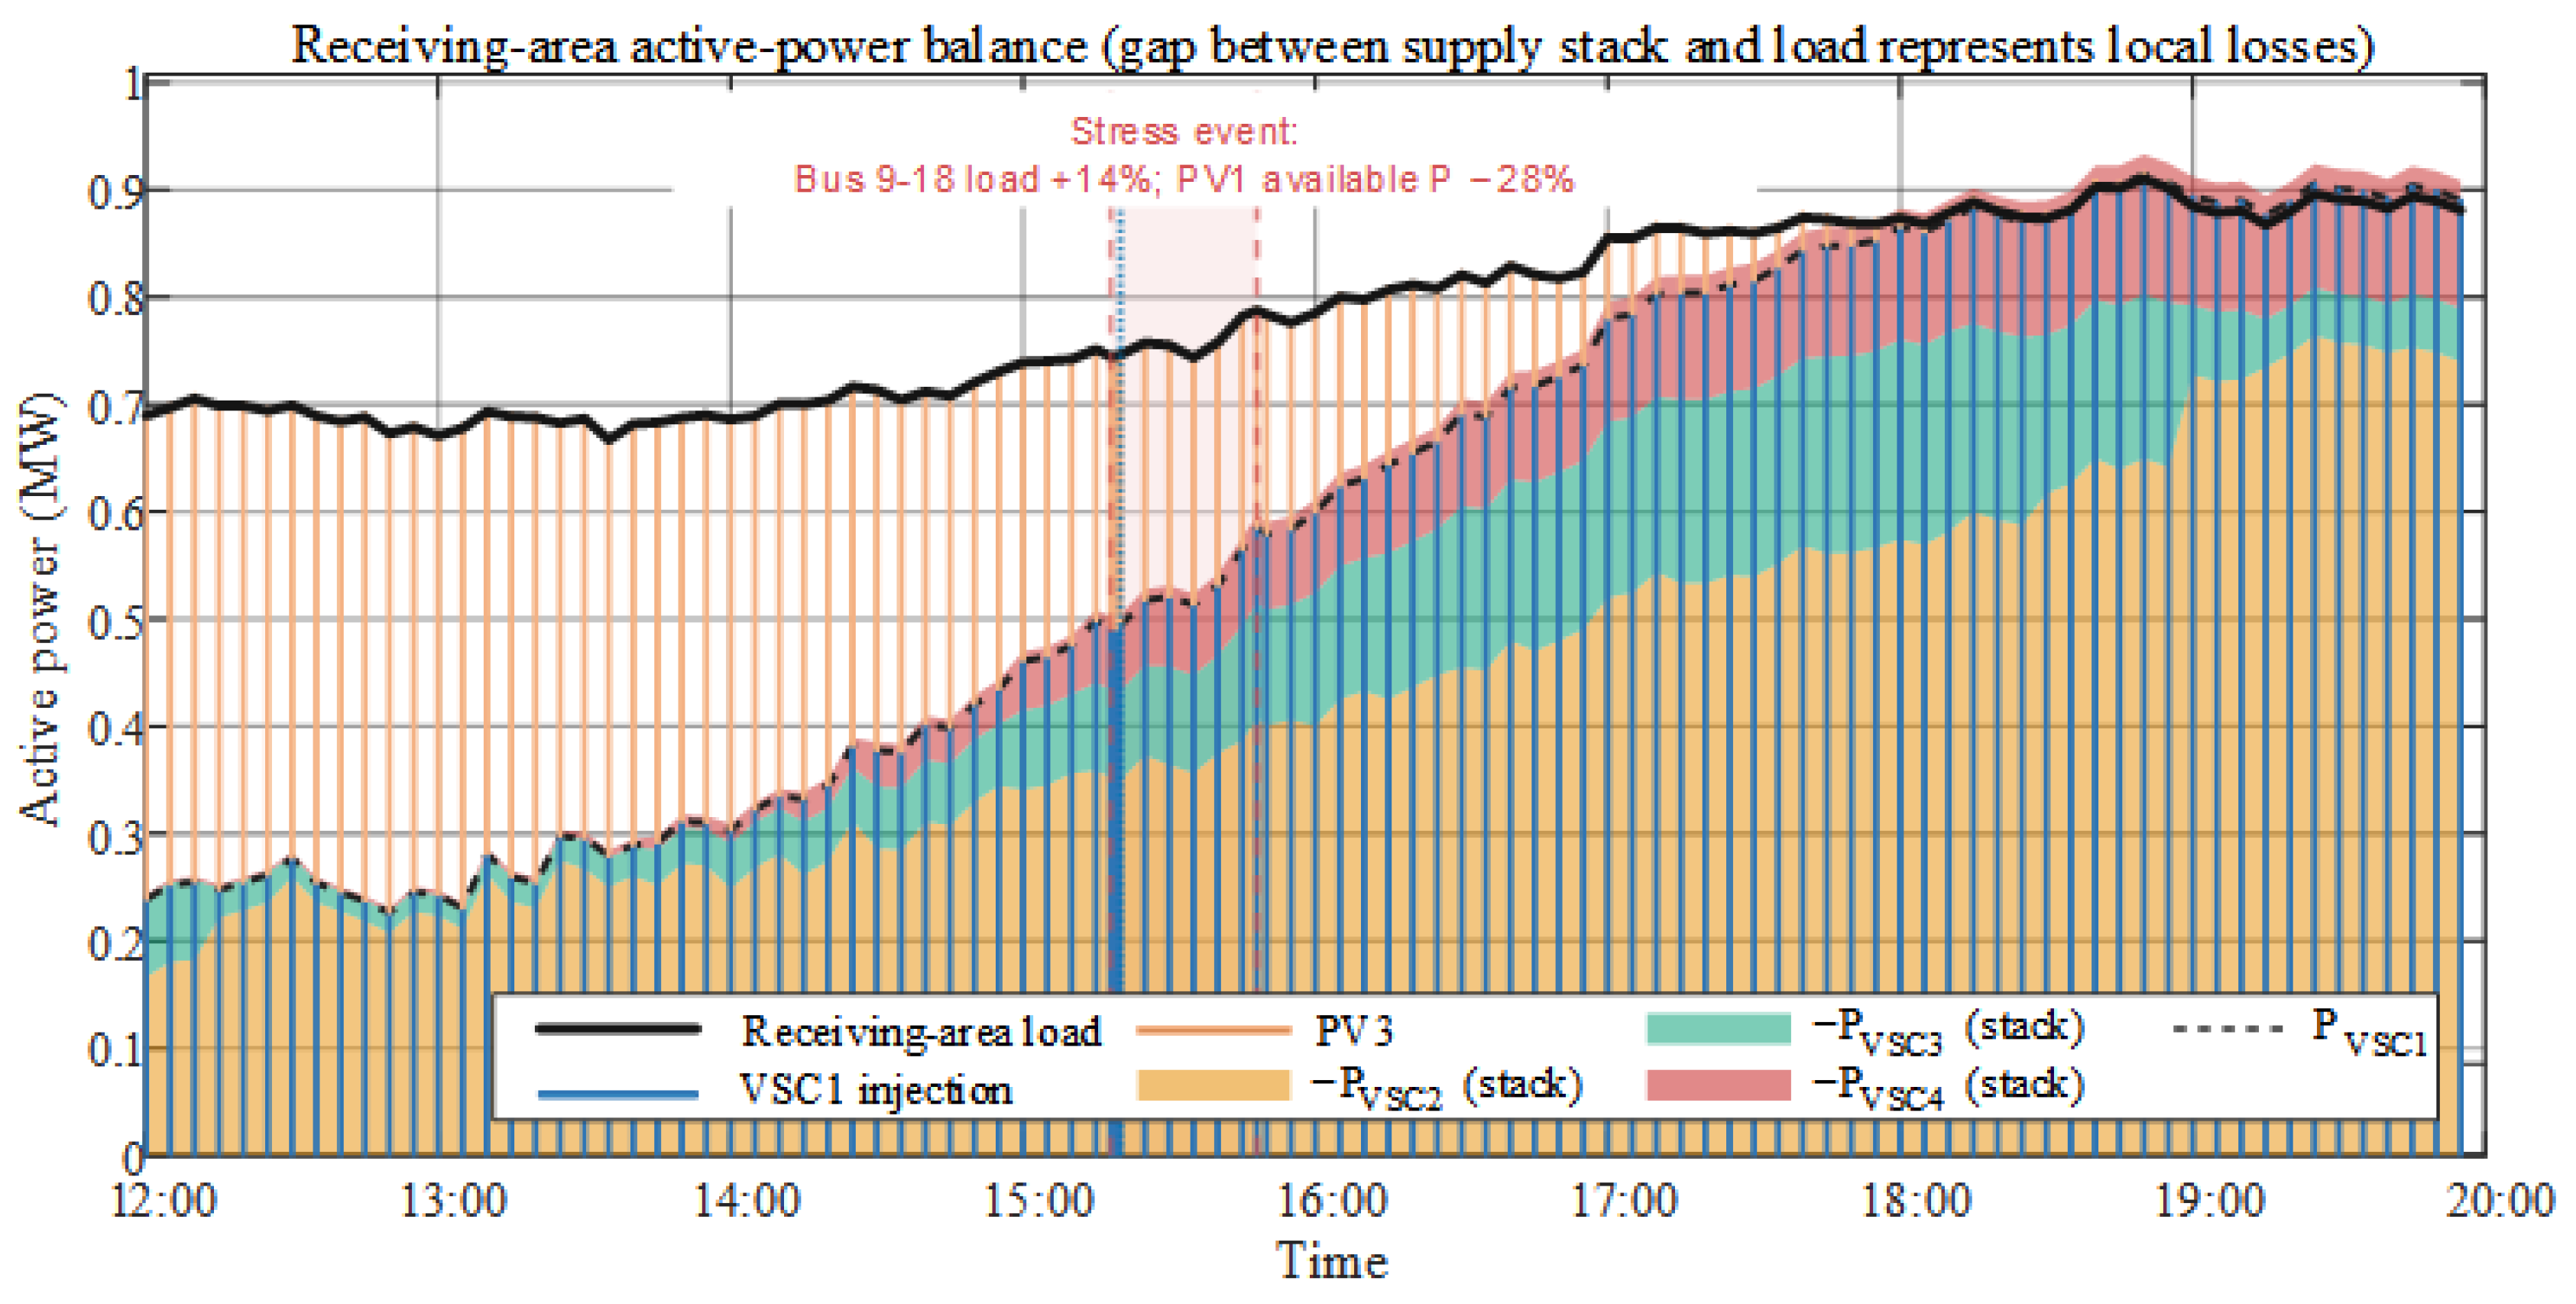
Figure 6 shows receiving-area active load, PV3 output, and R-SOP port powers. Around noon, PV3 supplies part of the local load, and VSC1 covers the remainder and network losses. VSC1 injection rises as PV3 output falls. VSC2–VSC4 draw power from the main-grid area and transfer it through the DC link to VSC1. After PV3 reaches zero at 19:00, the R-SOP supplies most of the receiving-area deficit.
Figure 6.
Stage III receiving-area power balance (gap: losses; red dashed: stress interval; blue dotted: event-triggered update).
The stress-event marker in Figure 6 aligns the time axes across Stage III figures. Because the event affects the Bus 9–18 main-feeder monitoring area, it changes main-grid-side port allocation and system voltages but not the plotted receiving-area load.
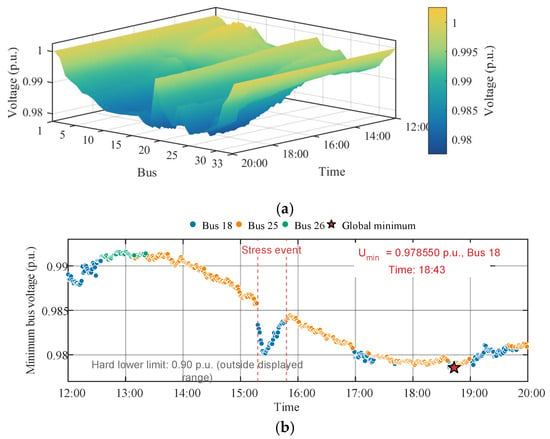
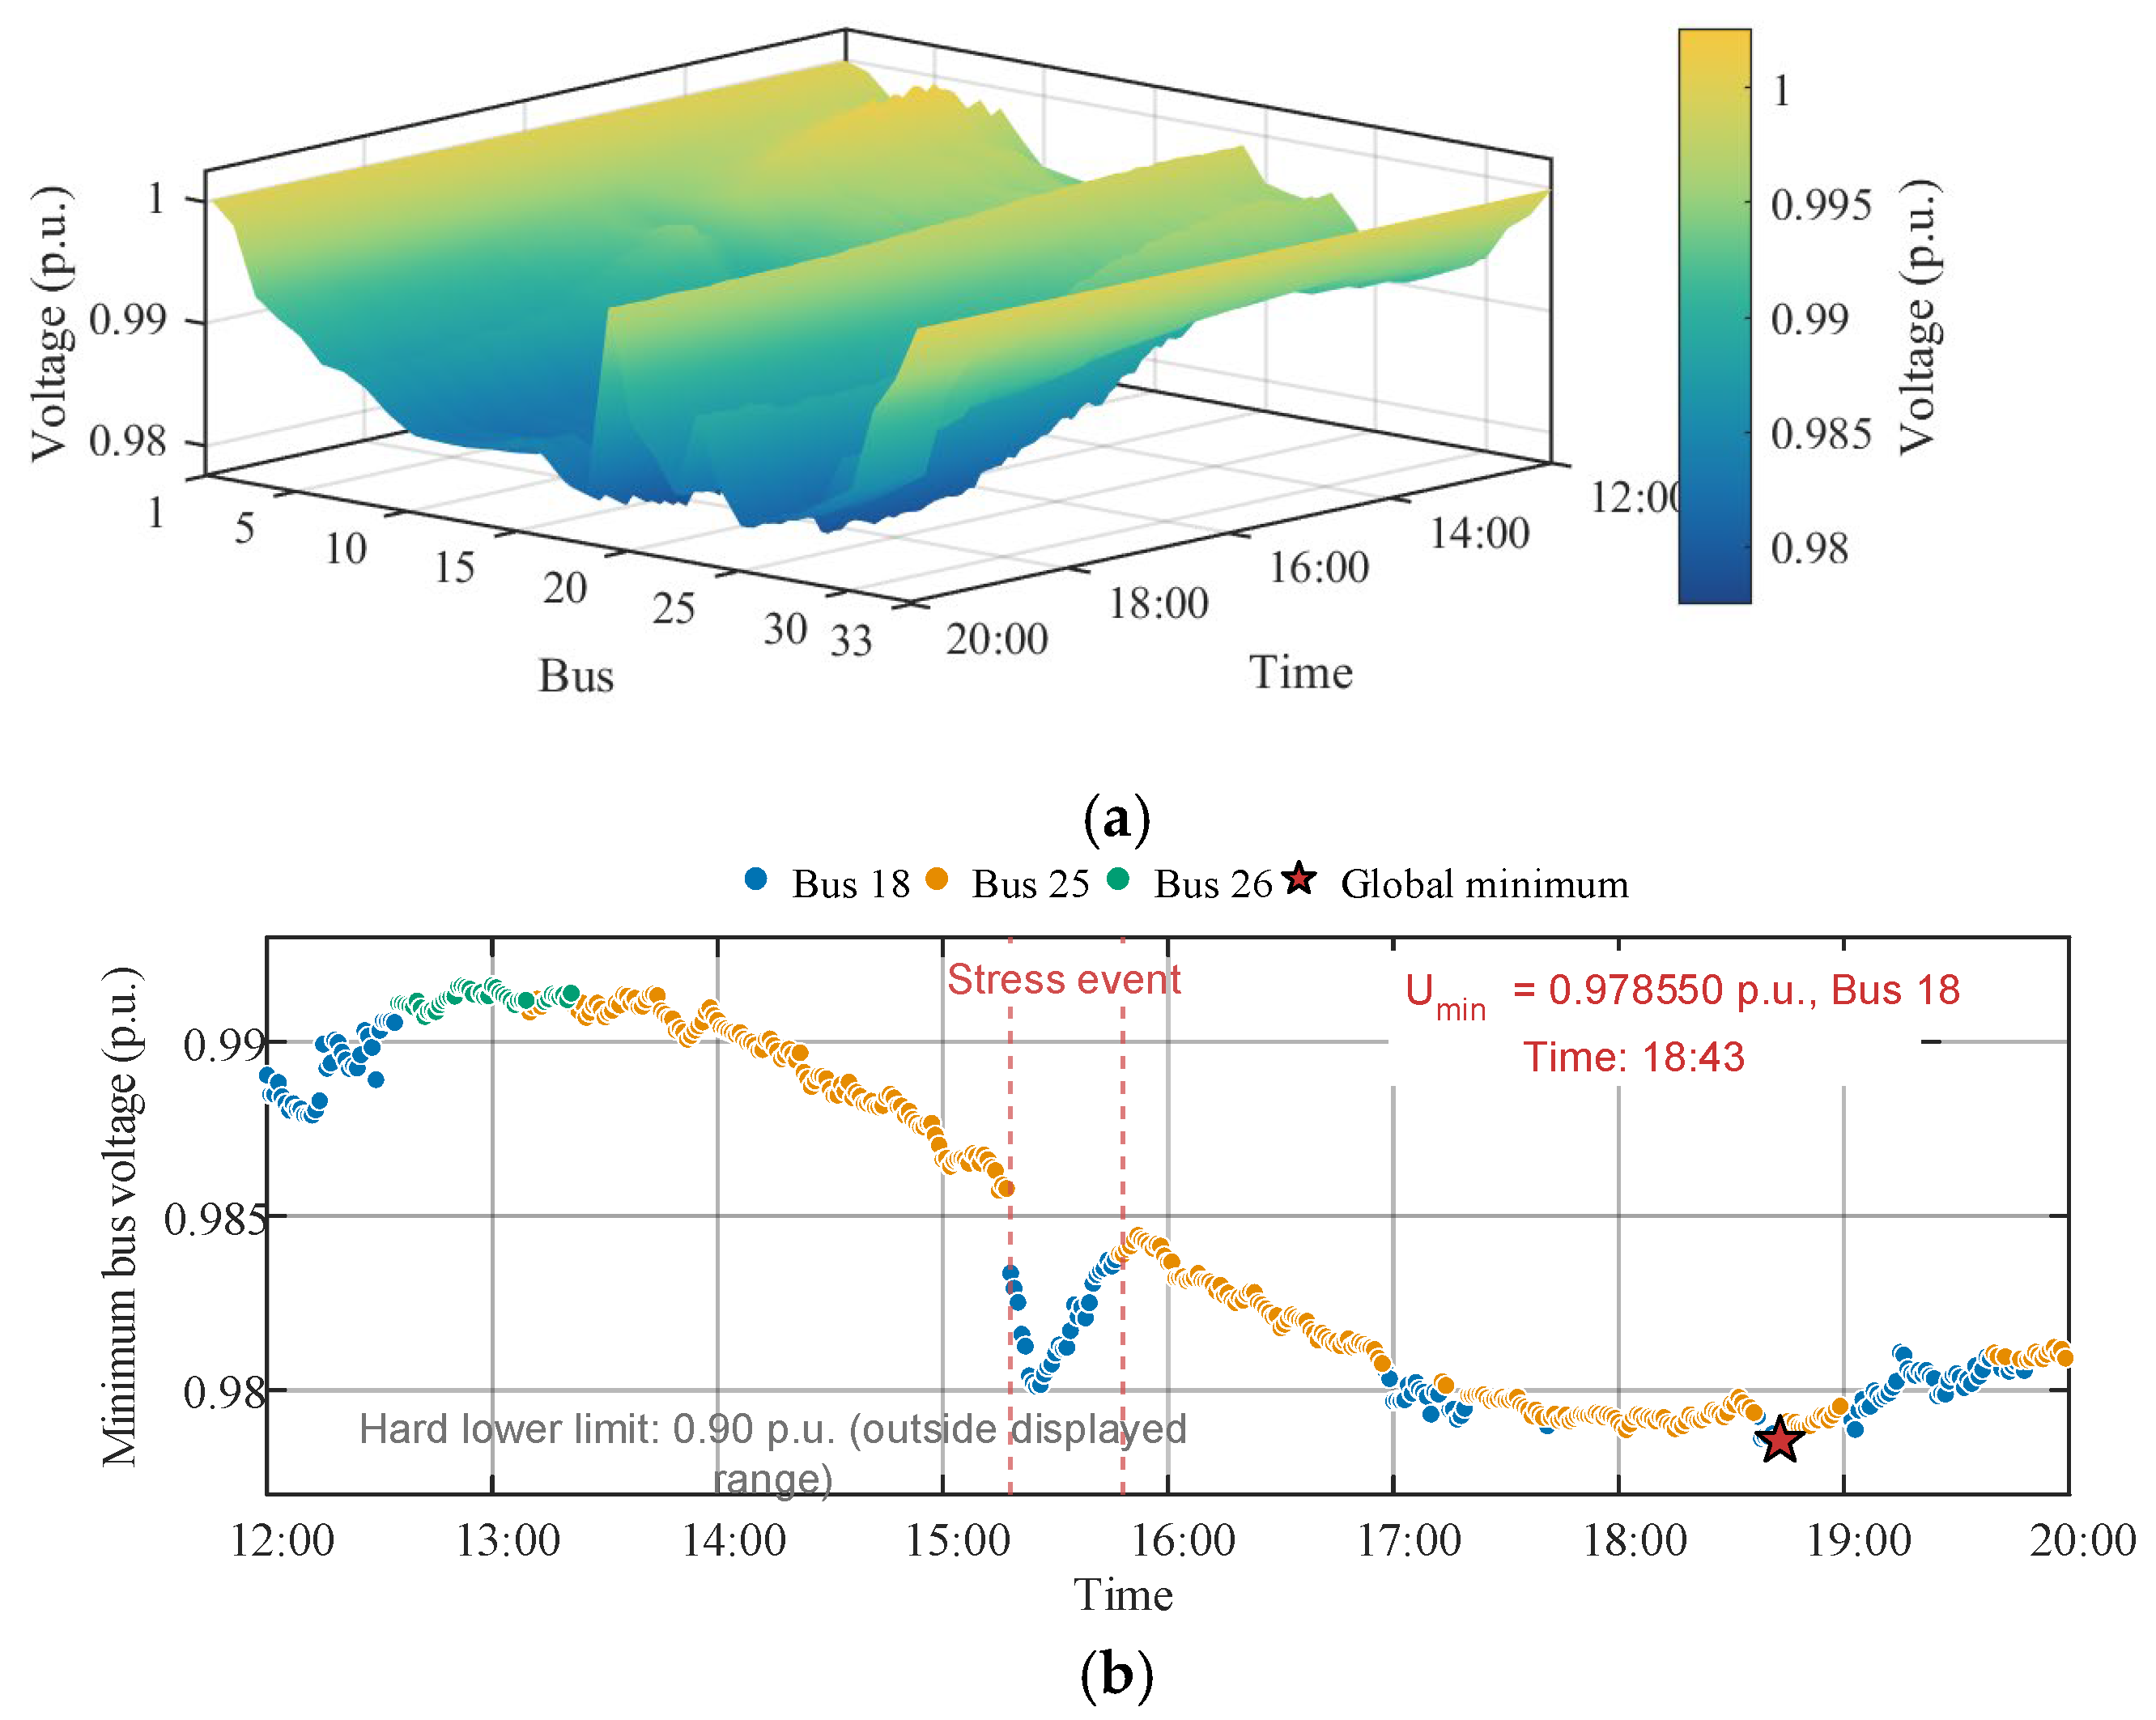
Figure 7 shows the spatiotemporal bus-voltage profile and system minimum. The monitored voltages vary with source–load conditions. The minimum declines during the stress event and then decreases gradually to 0.9786 p.u. at Bus 18, remaining above the 0.90-p.u. limit. Rolling operation therefore preserves post-opening steady-state voltage feasibility under the fixed R-SOP configuration.
Figure 7.
Stage III voltages: (a) bus-voltage surface; (b) minimum voltage and bus.
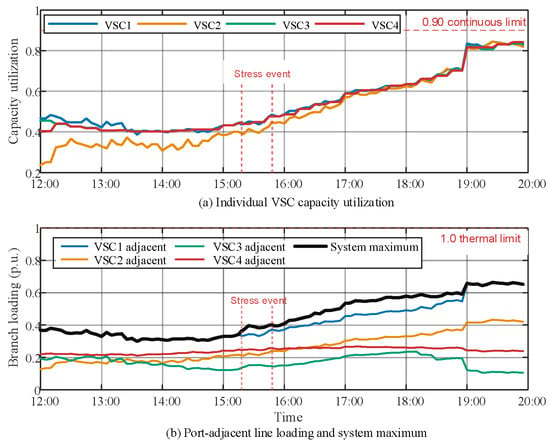
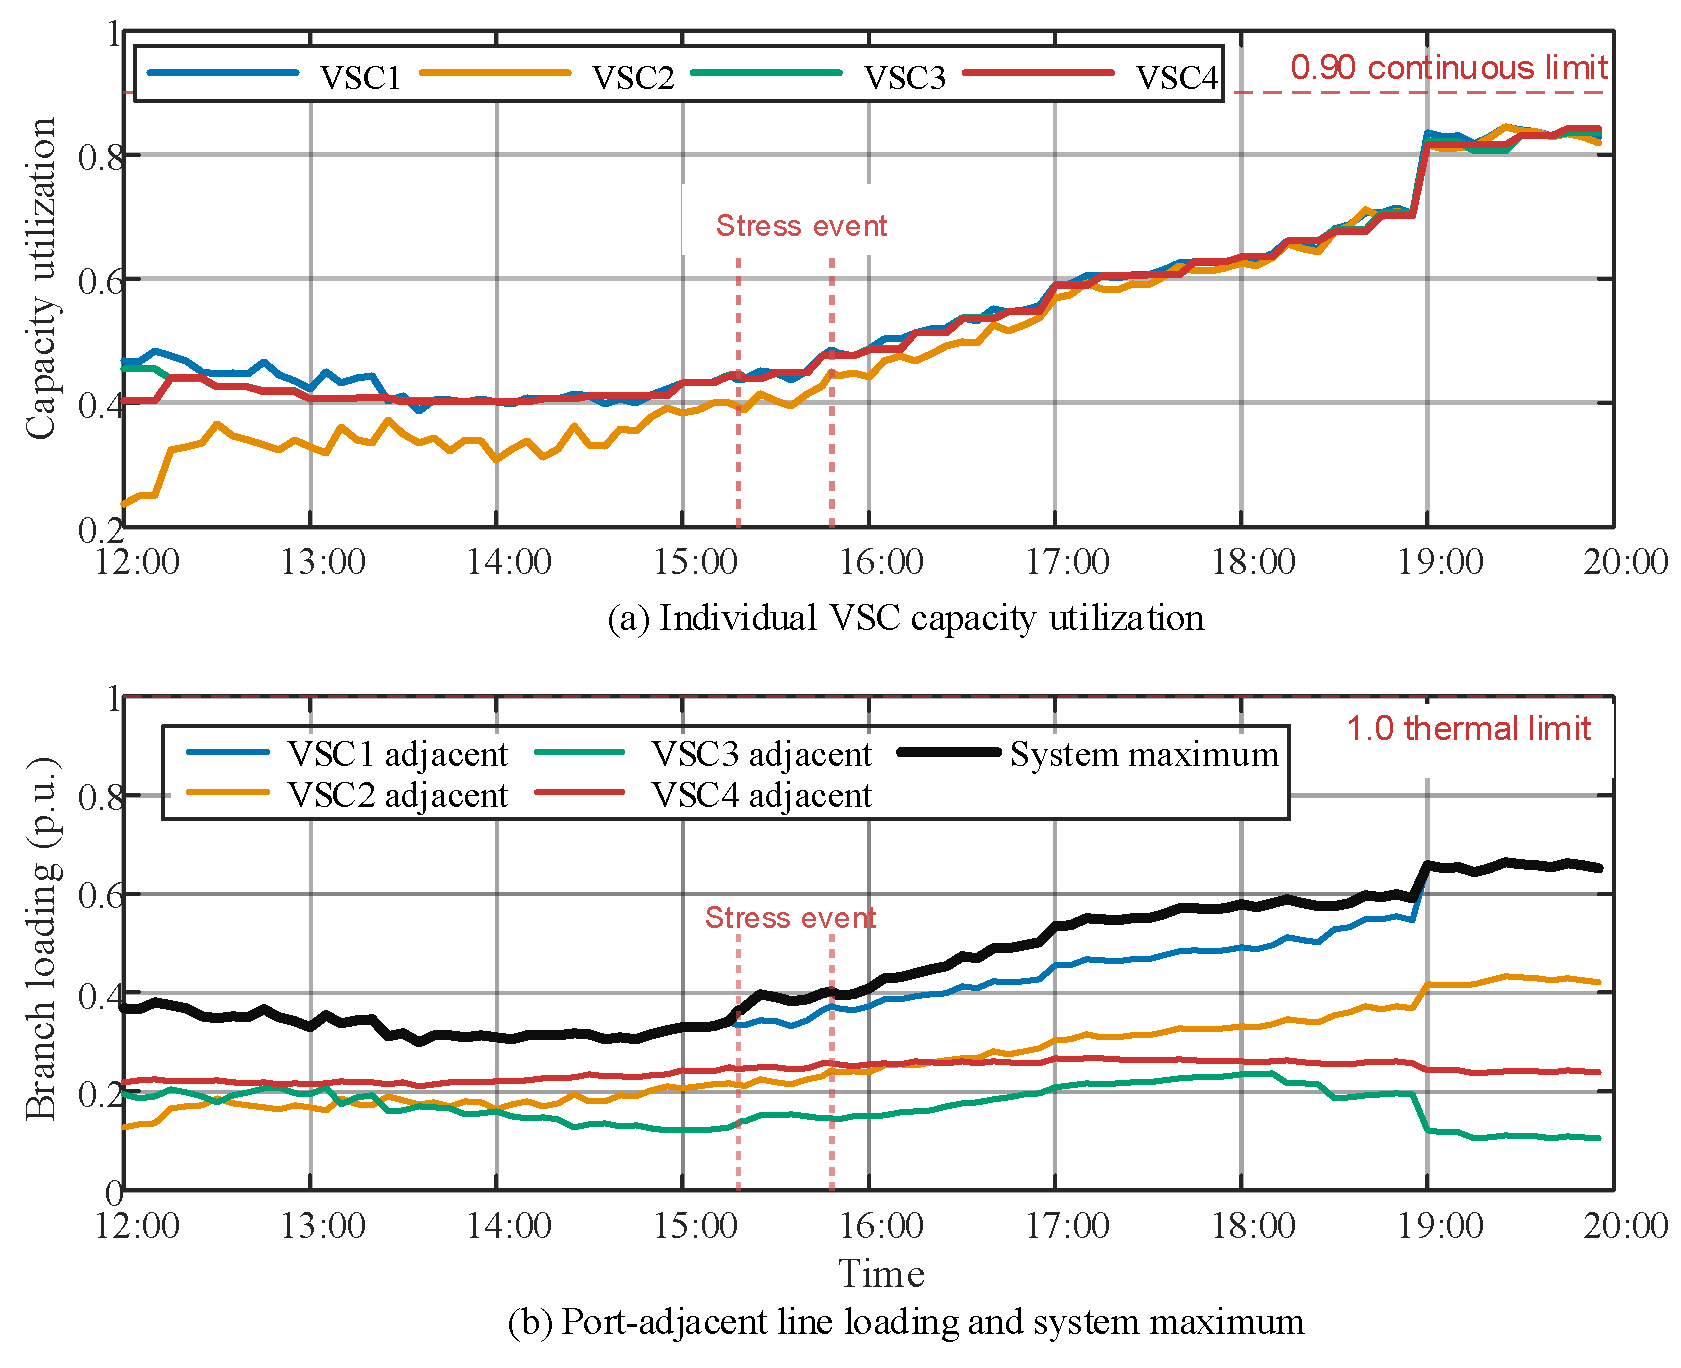
Figure 8 shows continuous VSC utilization, loading of branches adjacent to the ports, and maximum system branch loading. R-SOP transfer and several branch loadings rise as PV output falls and net load increases. All VSCs remain below the 0.90 continuous limit, and all branches remain within the static branch-capacity limits in (6) throughout maintenance and the stress event.
Figure 8.
VSC utilization and loading of port-adjacent branches in Stage III.
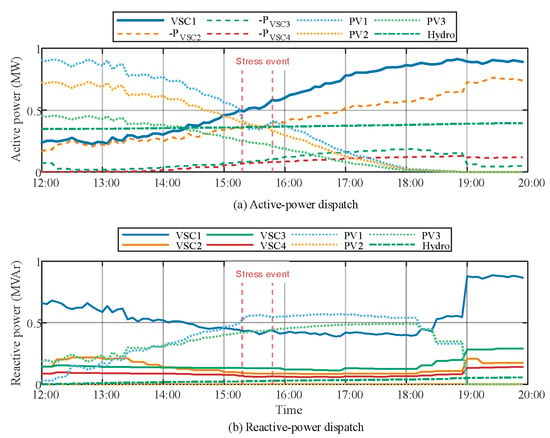
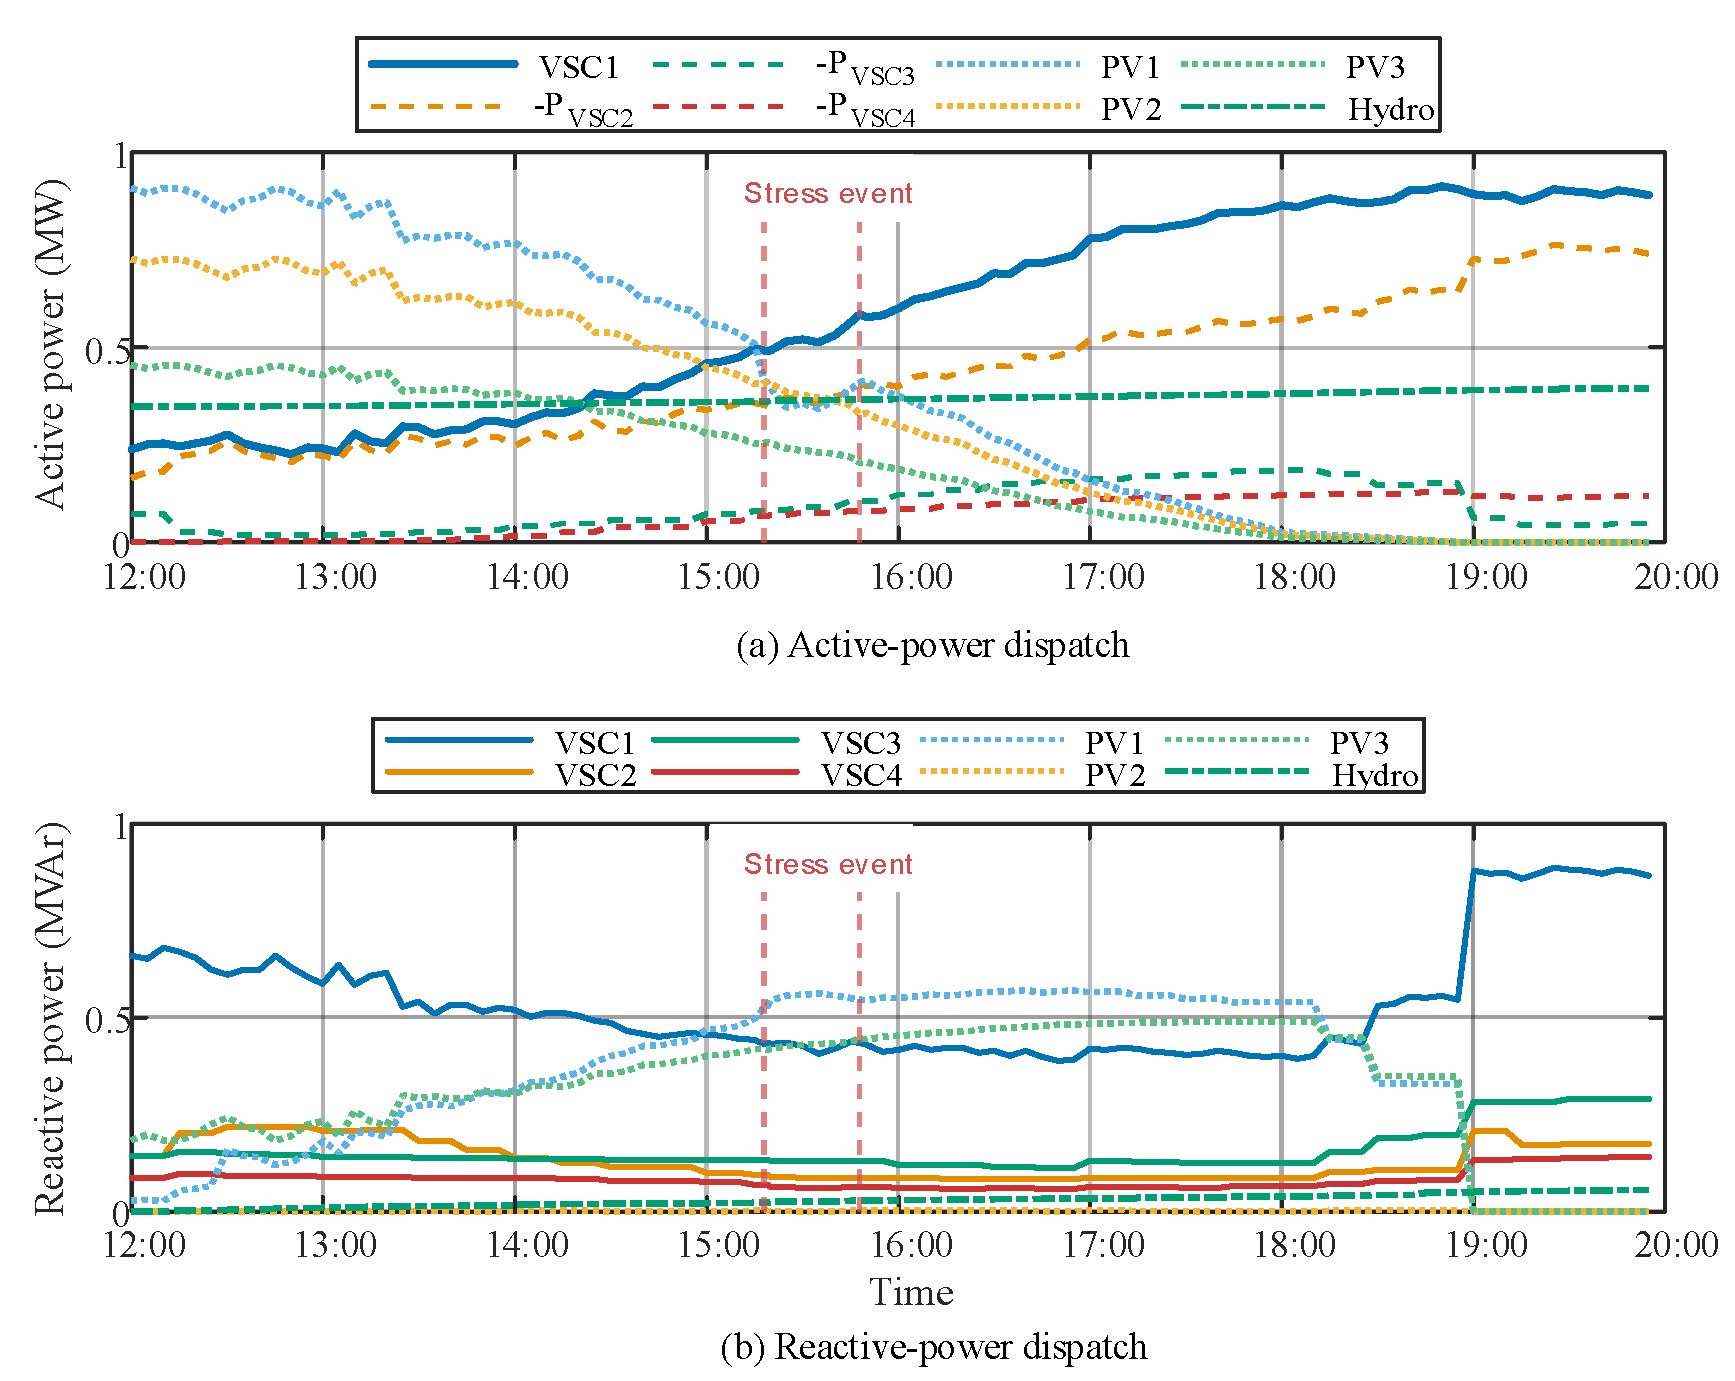
Figure 9 presents R-SOP and DG active- and reactive-power trajectories. Maximum PV-inverter utilization is 0.9800. Small-hydropower active and reactive powers remain within 0.350–0.396 MW and 0–0.055 MVAr, respectively, with apparent power near 0.4 MVA. The PV inverters, small hydropower, and R-SOP ports jointly regulate reactive power without violating DG ratings or ramp limits. Maintenance-period loss energy is 0.341 MWh.
Figure 9.
R-SOP and DG active- and reactive-power dispatch in Stage III.
Figure 6, Figure 7, Figure 8 and Figure 9 confirm that rolling optimization updates R-SOP and DG commands under the fixed Stage I connections while every monitored state satisfies steady-state constraints.
- (4)
- Event-Triggered Update Under the Stress Event
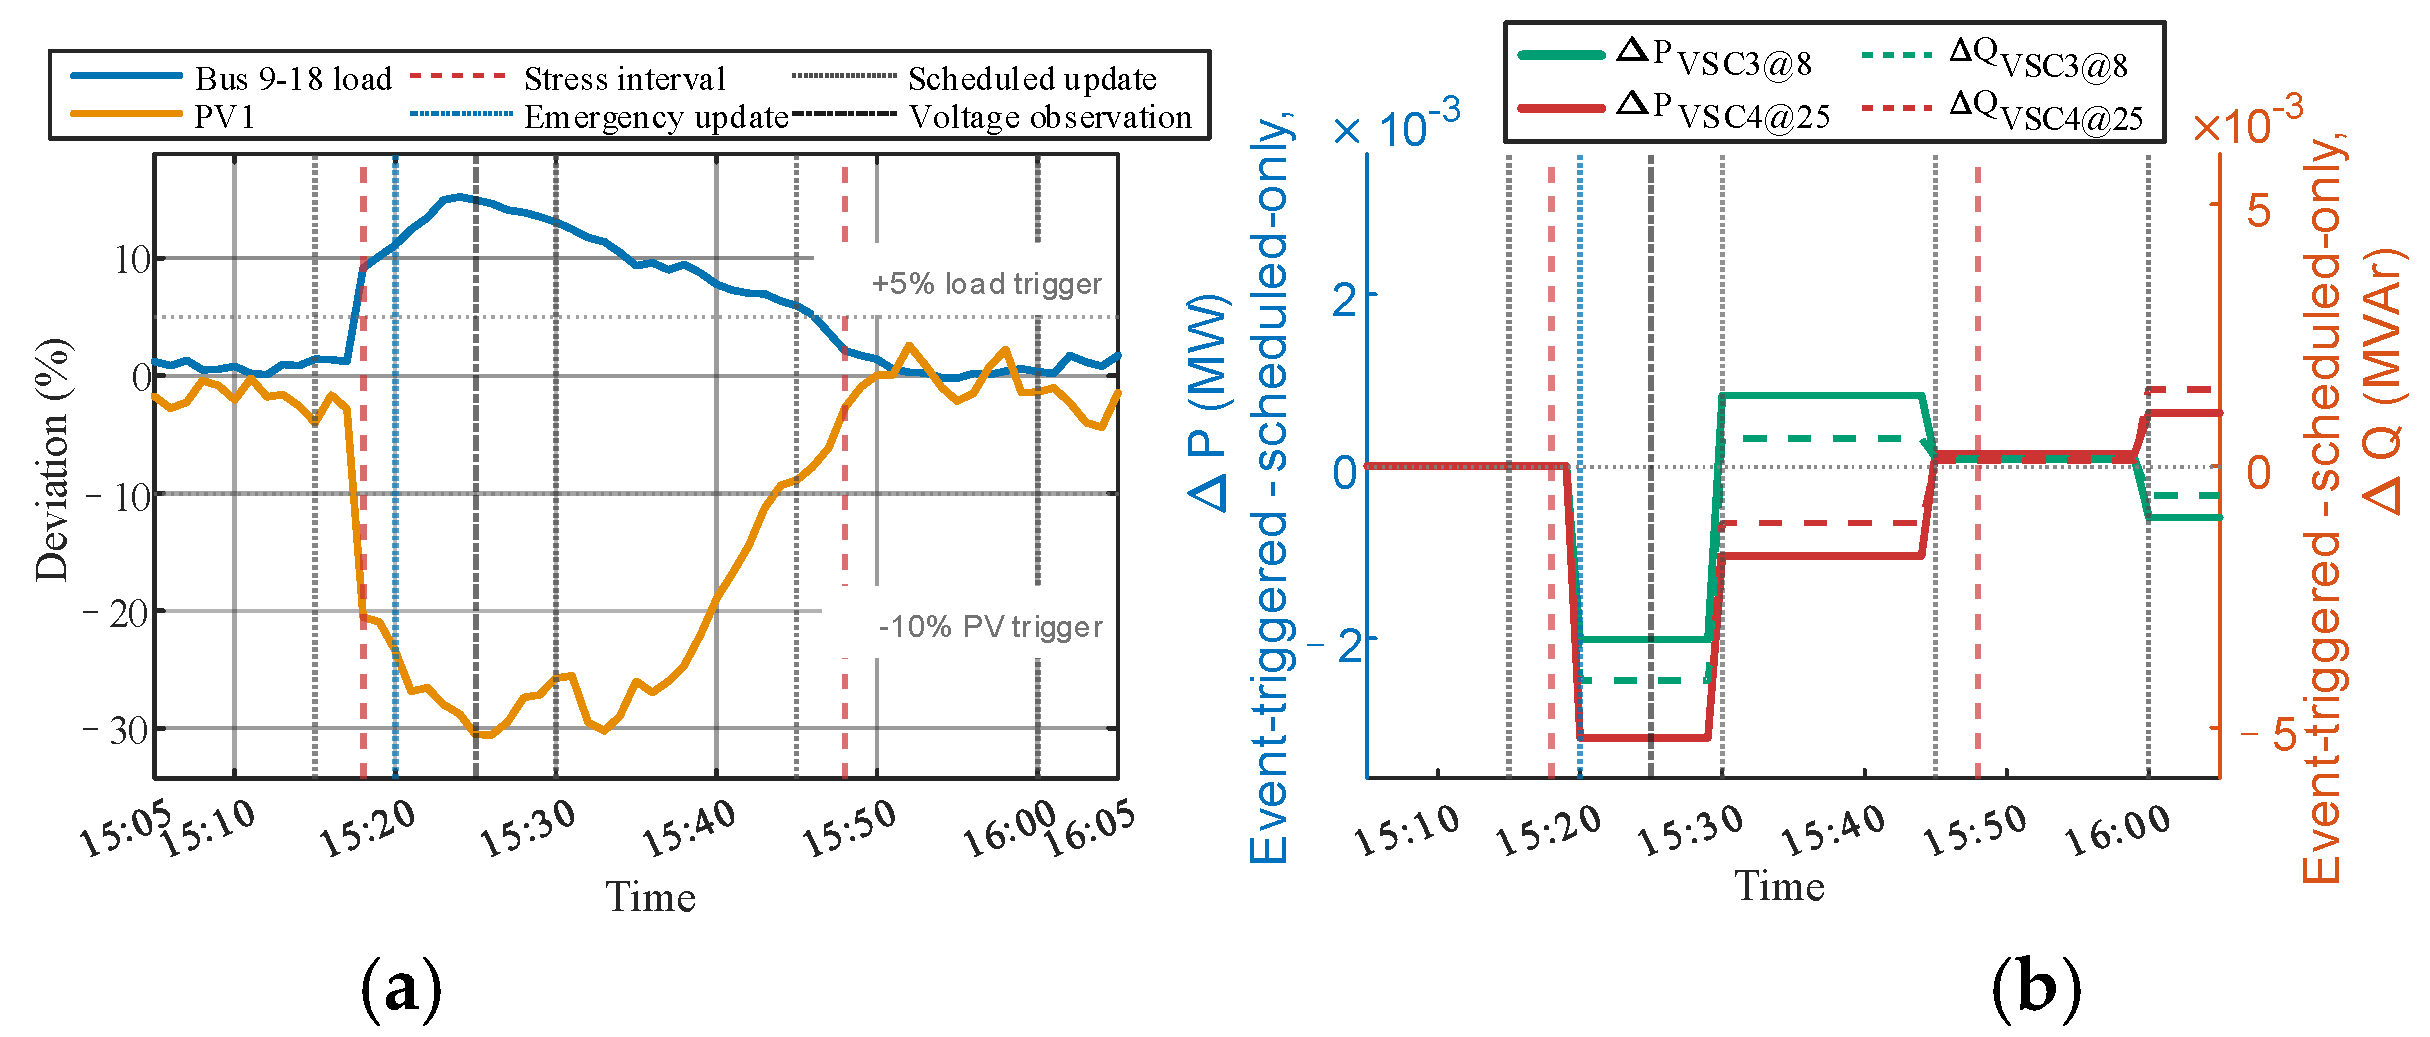
The stress event from 15:18 to 15:48 increases load at Buses 9–18 by up to 14% and reduces available PV1 power at Bus 8 by up to 28%. To isolate the update effect, Case 4 starts from the same 15:15 operating snapshot as Case 1 and uses identical subsequent source–load inputs but disables event-triggered optimization.
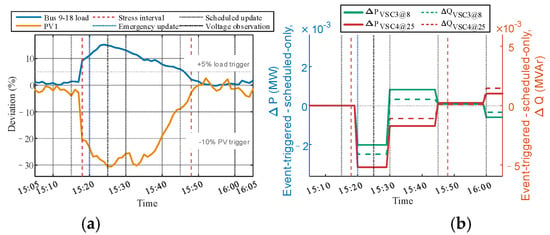
Figure 10 compares the disturbance trajectories and P–Q-port command differences. After the forecast deviation persists beyond its threshold for 2 min, event-triggered control updates the commands at 15:20, whereas scheduled-only control retains the previous commands until 15:30.
Figure 10.
Disturbance trajectories and P–Q-port command differences for the two update strategies. (a) Main feeder disturbance; (b) P–Q port command differences.
The update waiting time decreases from 12 to 2 min, an 83.3% reduction. This scheduling response excludes communication delay and converter settling time. Table 5 shows that the earlier correction requires one additional optimization and produces small improvements in minimum voltage, maximum branch loading, and loss energy; maximum VSC utilization is unchanged. Both strategies remain feasible, so this case demonstrates earlier adaptation to persistent deviations without establishing a reduction in constraint violations.
Table 5.
Quantitative comparison of scheduled-only and event-triggered control.
The early response window contains ten one-minute samples and excludes the update at 15:30. The common window includes both endpoints. Violations refer to voltage, VSC utilization, and branch loading. Optimization counts exclude the shared initial snapshot at 15:15.
5.3. Effects of Device Structure and DG Coordination
The fixed equal-rated SOP and the proposed R-SOP differ in both their connections and converter ratings. To distinguish these effects, four structures are compared at the same total rating of 3.0 MVA: fixed connections with equal ratings, F–E; reconfigurable connections with equal ratings, R–E; fixed connections with asymmetric ratings, F–A; and reconfigurable connections with asymmetric ratings, R–A. Both fixed structures connect to Buses 18, 22, 25, and 33. F–A assigns 0.219, 0.927, 0.354, and 1.500 MVA to these buses, respectively. This assignment comes from the existing main-case Stage I assessment and remains fixed across maintenance tasks. Both reconfigurable structures select four distinct buses from the same five-bus pool. Source–load inputs, DG coordination, and operating limits are identical within each comparison.
Table 6 separates the main-case capacity effect from adaptation across maintenance locations. For branch 6–26, Bus 33 is the only receiving-area candidate. Both equal-rated structures therefore fail the receiving-side capacity prescreen, whereas both asymmetric structures retain a 0.033-MVA continuous margin. The existing full-period Stage I scores differ only slightly between F–A and R–A. Thus, the larger receiving-side converter provides the main-case capacity benefit, while connection selection offers a small additional objective improvement for this branch.
Table 6.
Four-structure comparison using capacity prescreening and existing Stage I assessments.
Across maintenance branches, a fixed asymmetric allocation can leave insufficient capacity in other receiving areas. In S1, F–A passes the capacity prescreen for 14 branches, versus 20 for F–E; allowing the same asymmetric converters to change connections raises the count to 27. With equal ratings, reconfiguration increases the S2 and S3 counts from 18 to 20. Asymmetric ratings therefore address directional capacity requirements, while reconfiguration adapts their placement and regional allocation. These screening results explain the structural mechanisms; complete sequential feasibility is assessed separately in Section 5.4.
Table 7 retains the original comparison of Cases 1–3. Case 2 fails the main-case capacity prescreen, so subsequent operating results are unavailable. Cases 1 and 3 evaluate the effect of DG coordination under their respective Stage I-selected R-SOP configurations.
Table 7.
Comparison of device structure and DG coordination.
Compared with Case 3, the coordinated case reduces Stage I loss energy by 15.59% and Stage III loss energy by 9.24%, while lowering maximum port utilization by 2.21% and maximum branch loading by 2.40%. Both cases satisfy the voltage limits. This comparison shows the benefit of DG coordination together with its associated Stage I configuration, whereas Table 6 distinguishes the two device-structure effects.
5.4. Multi-Branch Applicability and Exact Operating Boundaries
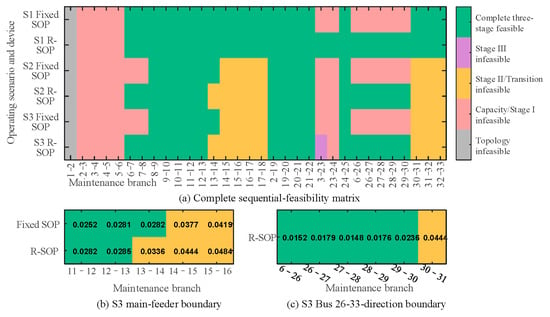
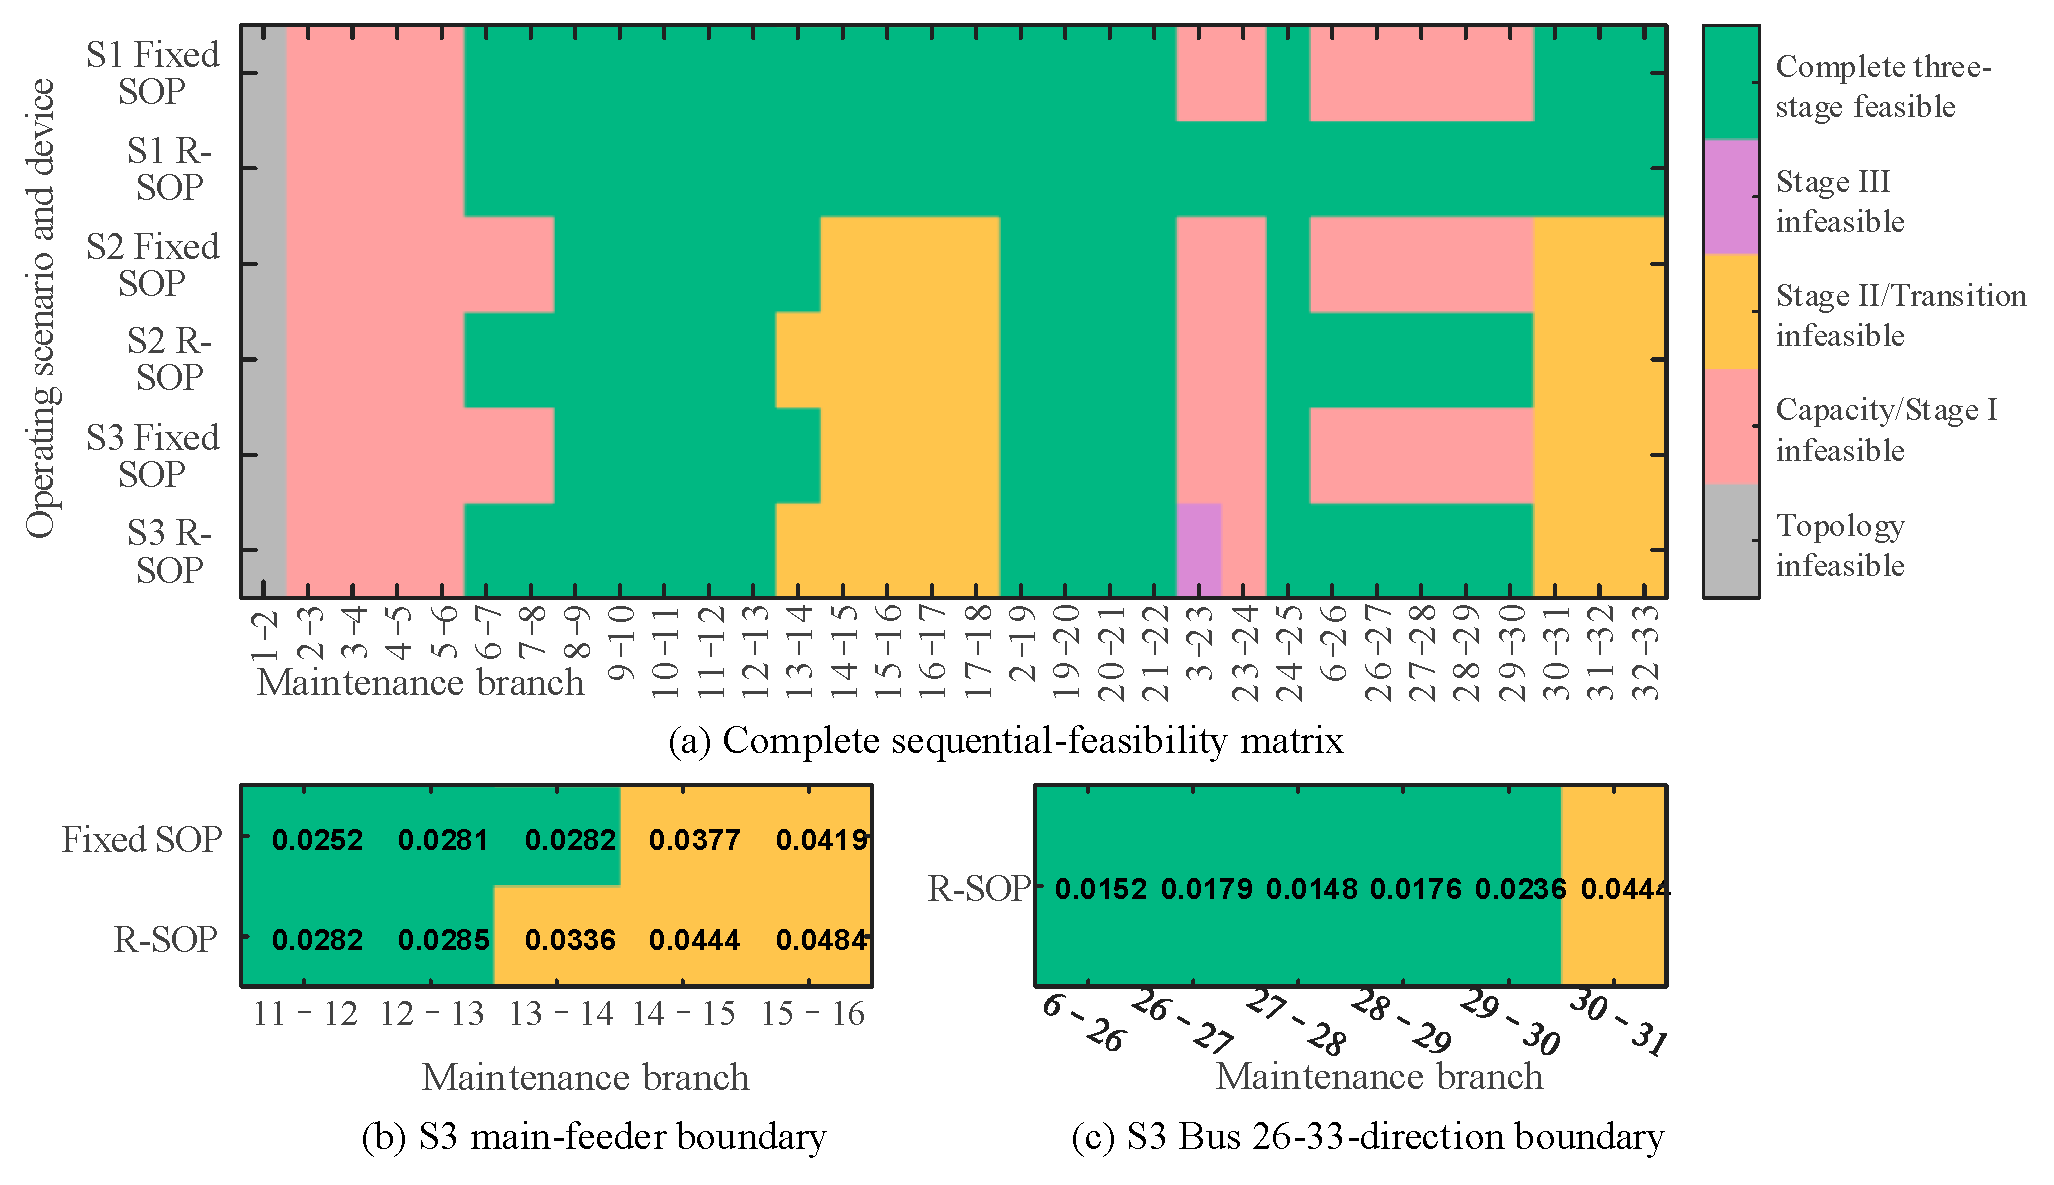
Having validated the complete transfer process for the main case, its applicability must be examined across maintenance locations and source–load conditions. The multi-branch assessment therefore considers three scenarios: S1 represents the base condition from 12:00 to 20:00 with coordinated DG; S2 uses the same interval without DG; and S3 represents the evening high-net-load condition from 16:00 to 24:00 without DG. Event triggering is disabled to isolate the effects of topology, port rating, and source–load conditions.
All 32 radial branches are tested with both the fixed SOP and R-SOP, yielding 192 branch–scenario–device combinations. Each combination undergoes topology and capacity screening, exact Stage I optimization, Stage II progressive unloading, and Transition Event assessment. Only combinations satisfying the opening criteria proceed to Stage III, which contains 480 one-minute monitoring points. Complete feasibility requires all network, VSC, and DG constraints to be satisfied throughout the sequence. Figure 11 summarizes the resulting feasibility matrix and highlights the direction-dependent boundaries under S3.
Figure 11.
Multi-branch applicability based on complete three-stage validation.
Among the 192 branch–scenario–device combinations, 103 satisfy all sequential constraints. Compared with the fixed SOP, the R-SOP increases the number of feasible maintenance branches from 20 to 27 in S1 and from 11 to 17 in both S2 and S3. These results indicate that connection reconfiguration and asymmetric port allocation can substantially expand the feasible transfer range, particularly when DG support is unavailable.
However, this improvement is direction-dependent. Under S3, the fixed SOP extends farther along the main feeder, whereas the R-SOP remains feasible through branch 29–30 in the Bus 26–33 direction. The relative advantage of the R-SOP therefore depends on the consistency between port allocation, transfer direction, and maintenance-area demand.
Notably, one R-SOP combination satisfies the opening criteria but violates the continuous VSC limit at 56 of the 480 Stage III monitoring points. This case shows that opening eligibility does not guarantee feasible operation throughout the maintenance period. Applicability boundaries should therefore be established from complete sequential feasibility rather than topology, capacity screening, or a single post-opening power-flow solution alone.
5.5. Applicability to Larger Distribution Networks
The three-stage formulation is expressed in terms of network, device, and candidate-connection sets and can therefore be adapted to larger radial networks, such as the Taiwan 83-node system studied in [14]. Such an application would require its branch parameters, capacity limits, source–load profiles, source locations, and admissible R-SOP connection points. The availability of mechanical ties and restrictions on energized loop closing must also be specified to identify maintenance scenarios consistent with the problem considered here.
For each maintenance branch, the supply areas and power-flow references would be reassigned, and port ratings would be checked against the receiving-area demand and network constraints. Differences in impedance, load distribution, and DG location could change both the preferred configuration and the binding feasibility constraints; the 3.0-MVA rating and transfer boundaries obtained here should not be directly extrapolated. Computational demand would increase with the candidate assignments and network size. The screening procedure in Section 4.1 could reduce the number of detailed evaluations, but computation times would still need to be measured against the online update intervals. An unbalanced application would additionally require a three-phase power-flow model. Validation of these extensions remains future work.
5.6. Indicative Economic Comparison with Diesel Generation
The economic assessment compares two ways of supplying Buses 26–33 during the same eight-hour maintenance task. The R-SOP imports power from the energized main-grid area, whereas a diesel generator supplies the receiving area locally. Both retain the same available PV generation and are assumed to have suitable connection, reactive-power, and transfer-control provisions. The diesel alternative is a cost benchmark; its synchronization and switching performance are not simulated. This comparison applies to feeder isolation while the upstream grid remains available.
The eight hourly Stage I input blocks give 6.179 MWh of receiving-area load and 4.343 MWh of net demand after PV generation. A common assumed 3% delivery-loss allowance gives 4.473 MWh at the supply interface, with the R-SOP additionally subject to its 0.98 efficiency. A 1.5-MVA/1.2-MW diesel unit is sized against this receiving-area requirement, rather than the sum of R-SOP converter ratings. Table 8 distinguishes literature benchmarks from study assumptions; the values are indicative reference USD, not current project quotations.
Table 8.
Reference costs and assumptions for the economic comparison.
Diesel fuel use is calculated from manufacturer rates of 96.1, 160.2, 229.5, and 304.8 L/h at 25%, 50%, 75%, and 100% rated active load [40]. Piecewise-linear interpolation is used, with the lowest segment extended to the approximately 20–25% loading encountered in the reference profile. This gives approximately 1226 L per event. The resulting variable event costs are USD 456 for the R-SOP and USD 1214 for diesel generation.
Initial investment and recurring expenses must be compared over the same service life. The annualized cost of alternative j is therefore defined as
where Iⱼ is initial investment, Cⱼ,OM is fixed annual O&M, cⱼ is variable cost per event, N is the annual number of equivalent events, r is the discount rate, and L is the evaluation life. R-SOP variable cost includes purchased energy and conversion losses; diesel variable cost includes fuel and energy-based O&M.
Table 9 compares new installations at three illustrative utilization levels. At ten equivalent events per year, the R-SOP has an annual cost of USD 67,560, versus USD 125,769 for diesel generation. With the remaining inputs fixed, equal annual costs occur at an R-SOP investment of approximately USD 1.084 million, showing the importance of project-specific capital and integration costs.
Table 9.
Annual costs and break-even interruption values for new installations.
The benefit is measured against a no-transfer baseline without an available grid-forming source. In that baseline, grid-following PV cannot maintain the island and 6.179 MWh of load remains unserved per event. Annual net benefit equals the value of avoided unserved energy minus annualized cost. Rather than assume a customer interruption value, Table 9 reports the R-SOP break-even value obtained by dividing its annual cost by annual avoided unserved energy. Lower utilization raises this threshold. If a suitable diesel installation already exists and its capital and fixed O&M costs are sunk, its incremental cost for ten events is only about USD 12,139, below the cost of a new R-SOP. Rental options and benefits from year-round SOP operation require separate valuation.
6. Conclusions
This study presents a three-stage quasi-steady-state framework for planned feeder maintenance where no mechanical tie line is available or energized AC loop closing is prohibited. The framework coordinates an R-SOP and heterogeneous DG through connection configuration, pre-opening power transfer, opening assessment, and post-opening rolling dispatch. Sequential feasibility checks and state inheritance link these decisions throughout the maintenance period. The main conclusions are as follows.
Stage I matches converter connections and capacities to the maintenance task. The four-structure comparison shows that the larger receiving-side converter provides the main-case capacity improvement, while connection reconfiguration enables adaptation to different maintenance areas. Across the complete-sequence evaluation, 103 of 192 branch–scenario–device combinations were feasible. With DG available, the R-SOP increased the feasible branch count from 20 to 27 compared with the fixed-connection, equal-rated SOP. The resulting coverage depends on network topology, transfer direction, and DG availability.
Stage II progressively unloads the maintenance branch while maintaining the prescribed operating limits. In the main case, branch current decreased to approximately 0.001 A within 60 s, and the maximum inter-step voltage variation was 0.0056 p.u. The maximum predicted voltage difference between the closed and assumed open states was 0.0016 p.u., satisfying the opening criterion. These results demonstrate feasible power migration and opening eligibility within the evaluated quasi-steady-state sequence.
Stage III sustains maintenance-period operation through rolling R-SOP–DG coordination, with all 480 monitoring points satisfying the operating constraints. DG coordination, together with its associated configuration, reduced loss energy by 9.24% and lowered maximum VSC utilization and branch loading. Event-triggering advanced corrective dispatch by reducing the modeled update delay from 12 to 2 min with one additional optimization. Under the reference cost and utilization assumptions, the economic assessment also favored the R-SOP over a newly purchased diesel installation. Its economic attractiveness varies with utilization, integration cost, and the availability of existing generation.
Author Contributions
Conceptualization, W.L. and Z.W.; methodology, Y.H. and W.L.; software, X.H.; validation, Y.H., X.H., and Z.W.; formal analysis, Y.H.; investigation, Y.H.; data curation, Y.H.; writing—original draft preparation, Y.H.; writing—review and editing, X.H. and J.Y.; visualization, Y.H.; supervision, Z.W. All authors have read and agreed to the published version of the manuscript.
Funding
This research was funded by the Science and Technology Project of China Southern Power Grid Co., Ltd., grant number GDKJXM20240267, under the project “Research on Voltage Quality Enhancement for Distribution Network Load Transfer under Weak Support Conditions Based on Multi-Energy Coordination”.
Data Availability Statement
The data supporting the findings of this study are available from the corresponding author upon reasonable request. The source code is not publicly available because it forms part of an ongoing industrial research project.
Acknowledgments
During manuscript preparation and revision, the authors used OpenAI ChatGPT-5.6 Soul and Codex, accessed on 29 September 2026, for solely for auxiliary language polishing and manuscript formatting. All generated outputs have been reviewed and revised by the authors, who take full responsibility for the content of this publication.
Conflicts of Interest
Authors Yuchen Huang, Xuedong Hao, Jinwen Yang, and Wenjun Li were employed by Guangdong Power Grid Co., Ltd., a subsidiary of China Southern Power Grid Co., Ltd. The remaining author declares that the research was conducted in the absence of any commercial or financial relationships that could be construed as a potential conflict of interest. The authors declare that this study received funding from China Southern Power Grid Co., Ltd. The funder was not involved in the study design, collection, analysis, interpretation of data, the writing of this article, or the decision to submit it for publication.
References
- Vargas, R.; Macedo, L.H.; Home-Ortiz, J.M.; Romero, R. Optimal restoration of distribution systems considering temporary closed-loop operation. IEEE Syst. J. 2021, 15, 5483–5494. [Google Scholar] [CrossRef] [Scilit]
- Yan, X.; Peng, W.; Wang, Y.; Aslam, W.; Shao, C.; Li, T. Flexible loop closing control method for an active distribution network based on dual rotary phase shifting transformers. IET Gener. Transm. Distrib. 2022, 16, 4204–4214. [Google Scholar] [CrossRef] [Scilit]
- Li, J.; Wang, X.; Xie, C.; Han, J.; Mao, C.; Liu, X.; Wang, D.; Zhang, Y.; Guan, Z.; Zhang, X.; et al. A novel method for seamless closed-loop load transfer in radial distribution networks. IEEE Trans. Ind. Appl. 2023, 59, 2254–2265. [Google Scholar] [CrossRef] [Scilit]
- Li, J.; Li, J.; Wang, D.; Mao, C.; Guan, Z.; Liu, Z.; Du, M.; Qi, Y.; Wang, L.; Liu, W.; et al. Hierarchical and partitioned planning strategy for closed-loop devices in low-voltage distribution network based on improved KMeans partition method. Energy Rep. 2023, 9, 477–485. [Google Scholar] [CrossRef] [Scilit]
- Guan, Z.; Tang, P.; Mao, C.; Wang, D.; Wang, L.; Liu, W.; Du, M.; Li, J.; Wang, X. Control strategy and implementation of seamless closed-loop load transfer mobile prototype for 400 V distribution network. IEEE Access 2024, 12, 12279–12294. [Google Scholar] [CrossRef] [Scilit]
- Cai, W.; Gao, Y.; Zhang, X.; Si, Q.; Jia, J.; Li, B. Safety assessment of loop closing in active distribution networks based on probabilistic power flow. Energies 2025, 18, 2685. [Google Scholar] [CrossRef] [Scilit]
- Shi, X.; Sun, J.; Xiao, X.; Zhang, Y.; Lei, Y.; Yang, H.; Li, Z. A load restoration approach based on symmetrical demand response incentive mechanism. Energies 2025, 18, 2677. [Google Scholar] [CrossRef] [Scilit]
- Luo, Q.; Gao, C.; Zhang, J.; Zeng, Q.; Yi, Y.; Huang, C. Optimal scheduling with potential game of community microgrids considering multiple uncertainties. Energies 2025, 18, 4229. [Google Scholar] [CrossRef] [Scilit]
- Alobaidi, A.H.; Fazlhashemi, S.S.; Khodayar, M.; Wang, J.; Khodayar, M.E. Distribution service restoration with renewable energy sources: A review. IEEE Trans. Sustain. Energy 2023, 14, 1151–1168. [Google Scholar] [CrossRef] [Scilit]
- Liang, X.; Saaklayen, M.A.; Igder, M.A.; Shawon, S.M.R.H.; Faried, S.O.; Janbakhsh, M. Planning and service restoration through microgrid formation and soft open points for distribution network modernization: A review. IEEE Trans. Ind. Appl. 2022, 58, 1843–1857. [Google Scholar] [CrossRef] [Scilit]
- Wang, Y.; Yan, Z.; Sang, L.; Hong, L.; Hu, Q.; Shahidehpour, M.; Xu, Q. Acceleration framework and solution algorithm for distribution system restoration based on end-to-end optimization strategy. IEEE Trans. Power Syst. 2024, 39, 429–441. [Google Scholar] [CrossRef] [Scilit]
- Carrión, C.E.C.; Faria, W.R.; Macedo, L.H.; Romero, R.; Pereira, B.R. Dynamic service restoration of distribution networks with Volt-VAR devices, distributed energy resources, and energy storage systems. IEEE Trans. Sustain. Energy 2024, 15, 903–919. [Google Scholar] [CrossRef] [Scilit]
- Jiang, X.; Zhou, Y.; Ming, W.; Yang, P.; Wu, J. An overview of soft open points in electricity distribution networks. IEEE Trans. Smart Grid 2022, 13, 1899–1910. [Google Scholar] [CrossRef] [Scilit]
- Diaaeldin, I.M.; Abdel Aleem, S.H.E.; El-Rafei, A.; Abdelaziz, A.Y.; Zobaa, A.F. Optimal network reconfiguration in active distribution networks with soft open points and distributed generation. Energies 2019, 12, 4172. [Google Scholar] [CrossRef] [Scilit]
- Pamshetti, V.B.; Singh, S.; Thakur, A.K.; Singh, S.P. Multistage coordination Volt/VAR control with CVR in active distribution network in presence of inverter-based DG units and soft open points. IEEE Trans. Ind. Appl. 2021, 57, 2035–2047. [Google Scholar] [CrossRef] [Scilit]
- Sun, F.; Ma, J.; Yu, M.; Wei, W. Optimized two-time scale robust dispatching method for the multi-terminal soft open point in unbalanced active distribution networks. IEEE Trans. Sustain. Energy 2021, 12, 587–598. [Google Scholar] [CrossRef] [Scilit]
- Yang, X.; Xu, C.; Zhang, Y.; Yao, W.; Wen, J.; Cheng, S. Real-time coordinated scheduling for ADNs with soft open points and charging stations. IEEE Trans. Power Syst. 2021, 36, 5486–5499. [Google Scholar] [CrossRef] [Scilit]
- Saaklayen, M.A.; Shabbir, M.N.S.K.; Liang, X.; Faried, S.O.; Janbakhsh, M. A two-stage multi-scenario optimization method for placement and sizing of soft open points in distribution networks. IEEE Trans. Ind. Appl. 2023, 59, 2877–2891. [Google Scholar] [CrossRef] [Scilit]
- Yang, X.; Zhou, Z.; Zhang, Y.; Liu, J.; Wen, J.; Wu, Q.; Cheng, S. Resilience-oriented co-deployment of remote-controlled switches and soft open points in distribution networks. IEEE Trans. Power Syst. 2023, 38, 1350–1365. [Google Scholar] [CrossRef] [Scilit]
- Cheng, Q.; Li, X.; Zhang, M.; Fei, F.; Shi, G. Optimal configuration strategy of soft open point in flexible distribution network considering reactive power sources. Energies 2025, 18, 529. [Google Scholar] [CrossRef] [Scilit]
- Yang, X.; Song, Z.; Wen, J.; Ding, L.; Zhang, M.; Wu, Q.; Cheng, S. Network-constrained transactive control for multi-microgrids-based distribution networks with soft open points. IEEE Trans. Sustain. Energy 2023, 14, 1769–1783. [Google Scholar] [CrossRef] [Scilit]
- Gao, S.; Li, P.; Ji, H.; Zhao, J.; Yu, H.; Wu, J.; Wang, C. Data-driven multi-mode adaptive operation of soft open point with measuring bad data. IEEE Trans. Power Syst. 2024, 39, 6482–6495. [Google Scholar] [CrossRef] [Scilit]
- Deakin, M.; Sarantakos, I.; Greenwood, D.M.; Bialek, J.W.; Taylor, P.C.; Ming, W.; Patsios, C. Hybrid open points: An efficient tool for increasing network capacity in distribution systems. IEEE Trans. Power Del. 2022, 37, 1340–1343. [Google Scholar] [CrossRef] [Scilit]
- Deakin, M.; Taylor, P.C.; Bialek, J.W.; Ming, W. Design and operation of hybrid multi-terminal soft open points using feeder selector switches for flexible distribution system interconnection. Electr. Power Syst. Res. 2022, 212, 108516. [Google Scholar] [CrossRef] [Scilit]
- Deakin, M. Multiplexing power converters for cost-effective and flexible soft open points. IEEE Trans. Smart Grid 2024, 15, 260–271. [Google Scholar] [CrossRef] [Scilit]
- Yang, X.; Li, Z.; Ding, L.; Hu, Z.; Fang, H.; Sun, W.; Wu, Q.; Wen, J. Reconfigurable converter-formed soft open point-assisted dynamic restoration for distribution systems with cold-load pickup. IEEE Trans. Sustain. Energy 2025, 16, 2271–2285. [Google Scholar] [CrossRef] [Scilit]
- Hu, Z.; Yang, X.; Ding, L.; Li, Z.; He, Y.; Wu, Q.; Wen, J. Measurement-correlated resilience enhancement for R-SOP-integrated distribution systems with voltage security. IEEE Trans. Smart Grid 2025, 16, 4517–4533. [Google Scholar] [CrossRef] [Scilit]
- Saaklayen, M.A.; Liang, X.; Faried, S.O.; Martirano, L.; Sutherland, P.E. Soft open point-based service restoration coordinated with distributed generation in distribution networks. IEEE Trans. Ind. Appl. 2024, 60, 2554–2566. [Google Scholar] [CrossRef] [Scilit]
- Zhang, T.; Yu, X.; Mu, Y.; Jia, H.; Hou, K.; Jin, X. Multiple sources restoration for soft open points in distribution networks with a two-stage accelerated algorithm. IEEE Trans. Sustain. Energy 2023, 14, 892–905. [Google Scholar] [CrossRef] [Scilit]
- Wang, Y.; Su, X.; Song, M.; Jiang, W.; Shahidehpour, M.; Xu, Q. Sequential load restoration with soft open points and time-dependent cold load pickup for resilient distribution systems. IEEE Trans. Smart Grid 2023, 14, 3427–3438. [Google Scholar] [CrossRef] [Scilit]
- Du, Y.; Tu, H.; Lu, X.; Wang, J.; Lukic, S. Black-start and service restoration in resilient distribution systems with dynamic microgrids. IEEE J. Emerg. Sel. Top. Power Electron. 2022, 10, 3975–3986. [Google Scholar] [CrossRef] [Scilit]
- Yang, X.; Zhang, Y.; Wu, H.; Wen, J.; Cheng, S. Enabling online scheduling for multi-microgrid systems: An event-triggered approach. IEEE Trans. Smart Grid 2021, 12, 1836–1852. [Google Scholar] [CrossRef] [Scilit]
- Huo, Y.; Li, P.; Ji, H.; Yu, H.; Zhao, J.; Xi, W.; Wu, J.; Wang, C. Data-driven predictive voltage control for distributed energy storage in active distribution networks. CSEE J. Power Energy Syst. 2024, 10, 1876–1886. [Google Scholar] [CrossRef] [Scilit]
- Dar, M.R.; Ganguly, S. Voltage regulation and loss minimization of active distribution networks with uncertainties using chance-constrained model predictive control. IEEE Trans. Power Syst. 2025, 40, 2737–2749. [Google Scholar] [CrossRef] [Scilit]
- Cao, W.; Wu, J.; Jenkins, N.; Wang, C.; Green, T. Operating principle of Soft Open Points for electrical distribution network operation. Appl. Energy 2016, 164, 245–257. [Google Scholar] [CrossRef] [Scilit]
- Aithal, A.; Li, G.; Wu, J.; Yu, J. Performance of an electrical distribution network with soft open point during a grid side AC fault. Appl. Energy 2018, 227, 262–272. [Google Scholar] [CrossRef] [Scilit]
- Berhad, T.N. Connection Guidelines. Electricity Supply Application Handbook, Section 2.1.3.2, Table 1–4. Available online: https://www.tnb.com.my/esah/connection-guidelines (accessed on 30 September 2026).
- de Oliveira, R.; de Oliveira, L.W.; de Oliveira, E.J. Optimization Approach for Planning Soft Open Points in a MV-Distribution System to Maximize the Hosting Capacity. Energies 2023, 16, 1035. [Google Scholar] [CrossRef] [Scilit]
- Oddleifson, T.; Duwadi, K.; Pohl, E.; Gibbs, P.; Ghosh, S.; Scarpitti, C.; Weber, L. Prefeasibility Analysis of Behind-the-Meter Distributed Energy Resources in Highland Park, MI: Highland Park Pathways to Power. National Renewable Energy Laboratory, DOE/GO-102024-6115. 2024. Available online: https://docs.nlr.gov/docs/fy24osti/87988.pdf (accessed on 29 September 2026).
- Caterpillar, 3512B: 1200 ekW/1500 kVA, 50 Hz, Technical Spec Sheet, TSS-EM2697-00-GS-EPG-11440891. 22 June 2021. Available online: https://emc.cat.com/pubdirect.ashx?media_string_id=TSS-EM2697-00-GS-EPG-11440891.pdf (accessed on 29 September 2026).

Disclaimer/Publisher’s Note: The statements, opinions and data contained in all publications are solely those of the individual author(s) and contributor(s) and not of MDPI and/or the editor(s). MDPI and/or the editor(s) disclaim responsibility for any injury to people or property resulting from any ideas, methods, instructions or products referred to in the content. |
© 2026 by the authors. Licensee MDPI, Basel, Switzerland. This article is an open access article distributed under the terms and conditions of the Creative Commons Attribution (CC BY) license.