


Abstract
Open-pit lignite mines contain high-power converter-fed drives whose operating state strongly affects current harmonics and internal power-quality conditions. The primary objective of this study is to experimentally characterize load-dependent voltage and current harmonic regimes in an operating open-pit lignite mining electrical system and to use a simplified MATLAB/Simulink R2021b inverter-motor model only as a trend-interpretation tool. In situ measurements were obtained on the E05 SRS 1300-26/3.5 bucket-wheel excavator and associated conveyor systems. The measurements show low voltage distortion at the monitored internal points (the Total Harmonic Distortion of Voltage (THDU) below 1.5% in the reported cases) and strongly load-dependent current distortion, including high relative the Total Harmonic Distortion of Current (THDI) during low-current operation. The simulation reproduces selected qualitative drive-side trends but does not represent the upstream network, feeder impedances, transformer behavior, capacitor-bank interaction, or background supply distortion; it is therefore not presented as an independently validated network model. A separate Battery Energy Storage System (BESS) calculation is retained only as an illustrative resilience scenario based on an assumed four-hour duty profile and is not used as evidence for the measured harmonic findings. The main contribution is an experimentally supported case study of load-dependent harmonic behavior in an operating lignite-mine electrical system, complemented by simulation-assisted physical interpretation and clearly separated prospective modernization implications.
1. Introduction
Mining is an integral part of modern economies that contributes the raw material necessary for energy production, building infrastructure, transportation, and industry [1]. With regard to current trends in renewable energy and complex industry logistics, growing demand for minerals emphasizes the crucial importance of mining in modern economies. Yet, mining has always been an energy-intensive process requiring vast amounts of energy resources and causing emissions of greenhouse gases [2].
Among different types of mining, open-pit mining is an energy-intensive process that requires the continuous operation of excavation machinery, belt conveyor systems, pumping stations, and auxiliary installations. Recent studies have addressed both energy-recovery solutions for excavator systems and the specific energy consumption of belt conveyor systems in continuous surface mines [3,4].
Harmonic distortion from converter-driven bucket-wheel excavator motors has been reported in mining substations [5], while broader studies on converter-dominated electrical systems confirm that nonlinear drive loads contribute to voltage distortion, current harmonics, additional losses, and thermal stress in electrical equipment [6,7,8,9].
Moreover, recent research on electric drives and motor-driven systems has shown that advanced power electronics, variable-frequency control, and optimized startup strategies can improve energy efficiency and reduce mechanical and electrical stress [10,11].
In open-pit lignite mining, bucket-wheel excavators and belt conveyor systems form the core of the continuous excavation and transport process. These installations concentrate high installed power, operate under variable mechanical loading, and are supplied through extended medium-voltage networks.
As a result, their electrical behavior cannot be evaluated only from an energy-consumption perspective. Converter-fed drives behave as nonlinear loads, generating nonsinusoidal currents that may produce voltage distortion, modify reactive power distribution, and increase the probability of resonance in mining substations and long feeder networks [1,12].
Power-quality assessment is therefore directly connected to energy performance. Harmonic currents increase RMS current values and contribute to additional Joule losses, transformer heating, and electromagnetic stress in rotating machines [7,8].
These effects are particularly relevant in mining systems, where load profiles change with excavation intensity, material flow, conveyor loading, and the operational state of the technological line. Consequently, harmonic mitigation and power-quality monitoring should be treated as part of the energy-management strategy, rather than as isolated compliance actions [12,13].
The modernization of mining electrical infrastructures is increasingly influenced by digital monitoring and the prospective integration of renewable generation and battery energy storage systems [14,15,16,17]. In the present work, however, these topics are treated as prospective implications rather than as the primary evidence base. The core analysis focuses on the measured power-quality behavior of the operating mining network and on the load-dependent harmonic regimes of the investigated converter-fed equipment.
Figure 1 depicts the functional architecture of a typical bucket-wheel excavator, emphasizing the principal mechanical subsystems and associated drive mechanisms.
Figure 1.
Functional structure of a bucket-wheel excavator (BWE), illustrating the main mechanical subsystems and associated drive mechanisms: 1, crawler travel drive; 2, superstructure slewing mechanism; 3, bucket wheel; 4, boom-hoisting mechanism; 5, operator-cab actuation mechanism; 6, 10 t slewing crane; 7, conveyor hoisting and movement mechanism [5]. The zero mark indicates the ground reference level. Black lines depict the excavator structure and dimensional annotations. Blue dashed outlines indicate an alternative raised position of the bucket-wheel boom and wheel. Red auxiliary lines indicate geometric reference axes and movement arcs.
1.1. Energy Performance Challenges in Open-Pit Lignite Mining
Energy-performance improvement in open-pit lignite mining cannot be achieved only through isolated equipment replacement. The electrical network, converter-fed drives, transformers, belt conveyors, and excavation equipment operate as an interconnected system, and their interactions influence both energy consumption and power quality [1,8]. Continuous material transport through extended belt conveyor systems is one of the main contributors to site-level electricity use, while dynamic material flow produces variable loading of motors, transformers, and feeders [4,18].
Variable-frequency drives improve controllability and reduce mechanical stress in pumps, fans, conveyors, and excavation-related motors [11]. However, higher penetration of converter-based drives also increases the importance of harmonic distortion, voltage quality, resonance sensitivity, and reactive-power management at substation level [11,12]. These effects are not only electrical compliance issues. Under distorted operating conditions, conductors, contacts, transformers, and rotating machines may experience additional losses and thermal stress, with consequences for insulation aging, derating, and maintenance planning [7,8,9,19].
In Romania and other European lignite regions, mining electrical infrastructures are increasingly influenced by decarbonization policies, energy-cost pressure, safety constraints, and the need for improved resilience [20,21,22,23,24,25]. For this reason, energy performance, power quality, and protection strategies should be considered together when modernizing mining electrical systems.
1.2. Harmonic Distortion as a Determinant of Energy Performance
The large-scale use of motors supplied by Variable-Frequency Drives (VFDs) has changed the current profiles observed in mining electrical systems. Six-pulse rectifier front ends, multi-pulse converter structures, and modern modulation strategies generate low-order harmonics, higher-order components, and interharmonics whose magnitudes depend on converter topology, load level, duty cycle, and supply impedance [1,7]. When several converters operate simultaneously, their harmonic currents may superimpose and interact with feeder and transformer impedances, producing voltage distortion across the local network.
From an energy-performance perspective, harmonic distortion is relevant because it increases Root Mean Square (RMS) currents and additional losses in conductors, transformer windings, and rotating machines [7,9]. In induction motors, distorted voltage and current waveforms may generate parasitic torque components, vibration, acoustic noise, and additional electromagnetic stress [8]. In extended mining networks, the presence of capacitor banks, long feeders, and changing substation configurations may also create resonance conditions, leading to local amplification of harmonic currents and voltages [7,26].
Accordingly, the primary research question addressed here is how harmonic voltage and current indicators change with the operating regime of converter-fed excavation and conveyor equipment in an actual open-pit lignite mine. Field measurements provide the core evidence. The numerical model is used only to interpret selected converter- and load-dependent trends, while loss mechanisms and modernization options are discussed qualitatively where the available data do not support direct quantification.
1.3. Related Work, Research Gap, and Contributions
Previous research on mining energy systems has addressed power-quality disturbances, electric-drive efficiency, harmonic mitigation, monitoring architectures, and renewable-energy integration, but these directions are often analyzed separately [7,8,12,13,14,15,16,17,26,27]. Studies on active and hybrid filtering confirm the effectiveness of compensation strategies for converter-dominated systems [13,26,27], while investigations on motor-driven systems show that variable-speed operation and optimized control can reduce energy use under variable loading [11,28,29]. In parallel, smart monitoring and data-driven methods improve observability and support predictive maintenance in complex industrial networks [16,17,30,31]. More broadly, monitoring architectures based on the Internet of Things (IoT) demonstrate how low-cost distributed sensing systems can support environmental and operational observability in sustainability-oriented applications [32].
Although the simultaneous operation of multiple harmonic sources in industrial power systems, including interactions with capacitor banks, cable capacitances, and frequency-dependent network impedances, has been investigated for several decades [7,12], the present study does not claim novelty for these phenomena or for routine power-quality monitoring. The contribution is an experimentally supported characterization of load-dependent harmonic regimes in an operating open-pit lignite mining network. Field measurements from the excavation and conveyor systems constitute the primary evidence, while a simplified converter-drive model is used only for qualitative trend interpretation. Prospective photovoltaic (PV) systems and BESS implications are treated separately and are not part of the validation of the measured harmonic findings.
The investigated network is supplied through the ST-7 and ST-7A substations, whose single-line diagrams are presented in Figure 2 and Figure 3, respectively. Each substation is connected to the 20 kV overhead network and comprises two 4 MVA, 20/6 kV power transformers, one 40 kVA, 20/0.4 kV auxiliary-services transformer, sectionalized 6 kV busbars, a bus coupler, and outgoing feeders supplying excavation and conveyor-drive installations. The ST-7A substation additionally includes a capacitor bank connected to the 6 kV busbar. Its rated reactive power and capacitance were not available in the dataset used for this study; consequently, its frequency-dependent or resonant interaction is not quantified here, and the bank is shown only as part of the actual network topology.
Figure 2.
Single-line diagram of the ST-7 substation at the E.M. Roșia open-pit lignite mine, SNLO, comprising two 4 MVA, 20/6 kV power transformers and one 40 kVA, 20/0.4 kV auxiliary-services transformer.
Figure 3.
Single-line diagram of the ST-7A substation at the E.M. Roșia open-pit lignite mine, SNLO, comprising two 4 MVA, 20/6 kV power transformers, one 40 kVA, 20/0.4 kV auxiliary-services transformer, and a capacitor bank connected to the 6 kV busbar.
The investigated installations include the E05 SRS 1300-26/3.5 bucket-wheel excavator, whose bucket-wheel drive is rated at 500 kW, and the associated conveyor drives, which are rated at up to 630 kW. The measured regimes M1–M9 denote distinct field-recorded operating conditions ranging from tramming and no-load operation to nominal excavation and simultaneous high-load operation. The simulated scenarios S1–S4 represent four corresponding model conditions: no-load operation, tramming or low-load operation, nominal excavation with loaded conveyors, and simultaneous high-load operation. The analysis considers RMS voltage and current values, total harmonic distortion of voltage THDU, total harmonic distortion of current THDI, individual low-order harmonics, the weighted distortion coefficient Dw, and the order-weighted harmonic factor Fw.
The study is organized around the field characterization of load-dependent harmonic regimes in the operating mining network. The main contributions are as follows:
- Experimental characterization of voltage and current distortion on the E05 bucket-wheel excavator and associated conveyor systems under representative operating regimes.
- Identification and interpretation of the load dependence of current distortion, including the distinction between relative THDI and absolute harmonic-current magnitude during low-current operation.
- Simulation-assisted interpretation of selected converter-drive harmonic trends using a simplified MATLAB/Simulink inverter-motor model, without claiming independent validation of the complete mining network.
- A clearly separated, illustrative BESS resilience scenario and discussion of prospective modernization implications, presented as future-design context rather than as an experimentally validated outcome.
2. State of the Art in Power Quality for Industrial and Mining Applications
Open-pit lignite mining networks combine converter-fed drives, extended medium-voltage feeders, variable load profiles, and reactive-power compensation equipment. In these systems, harmonic behavior depends on converter topology, equipment loading, feeder and transformer impedances, network configuration, and capacitor-bank operation [6,7,8,9,12,26]. Recent investigations of electrical parameters in mining distribution systems further confirm the relevance of system-level voltage, current, and harmonic assessment under actual operating conditions [33]. Field measurements in converter-dominated industrial and mining installations show that aggregate waveform distortion contributes to additional electrical losses and thermal stress, particularly in transformers and rotating machines [6,7,9]. Harmonic currents increase copper, eddy-current, stray-load, and thermal losses, while distorted voltages may generate parasitic torque components and additional electromagnetic stress [7,8,9]. In extended open-pit networks, substation relocation, feeder reconfiguration, transformer impedance, and compensation capacitors modify the frequency-dependent network response and may create resonance-sensitive conditions at specific buses [7,8,26]. Unlike comparatively fixed industrial networks, open-pit mining systems are subject to recurrent feeder reconfiguration, substation relocation, long cable routes, and large load variations, which can modify the effective network impedance and harmonic response. Consequently, harmonic-mitigation measures designed for a single nominal topology or operating point should be verified under representative network configurations and loading conditions. Power-quality assessment in these systems relies on standardized indicators such as total harmonic distortion of voltage and current, individual harmonic ratios, interharmonic components, RMS values, and harmonic spectra. Compatibility levels for low-frequency conducted disturbances in industrial power distribution systems are evaluated according to the International Electrotechnical Commission (IEC) standard 61000-2-4 [34], while harmonic emission limits for distorting installations connected to Medium-Voltage (MV), High-Voltage (HV), and Extra-High-Voltage (EHV) power systems are assessed according to IEC TR 61000-3-6 [35]. Power-quality measurement methods are defined in IEC 61000-4-30 [36], while harmonic and interharmonic measurement and grouping procedures follow IEC 61000-4-7 [37]. Requirements related to adjustable-speed electrical power drive systems are defined in IEC 61800-3 [38], and general voltage characteristics are described in EN 50160 [39]. Together, these standards provide the broader measurement, compatibility, and interpretation framework relevant to power-quality assessment in industrial and mining electrical systems. In the present study, these indicators are used to interpret measured and simulated harmonic spectra, with particular attention to the low-order components commonly associated with converter-fed drive systems. Beyond power-quality compliance, mining installations require coordinated protection and safety strategies. In potentially explosive atmospheres, intrinsically safe electrical design, thermal behavior, and protection coordination are essential for safe operation and long-term system sustainability [24,40].
Thermal modeling of mining electromechanical assemblies, including braking systems, further illustrates the relevance of multiphysics assessment for reliability and safety evaluation in mining equipment [41]. ATEX-compliant motor protection further illustrates the need to integrate electrical protection with harmonics-aware operation and energy-performance considerations [25].
Recent research also emphasizes the importance of system-level operational coordination in open-pit mining. Production scheduling, conveyor load–speed control, and simultaneous operation of high-power drives directly influence motor loading, converter operating points, and the aggregate current drawn from the medium-voltage network [42,43,44].
These operational variables are relevant to the present study because changes in drive loading and equipment simultaneity affect RMS currents, harmonic-current emission, and the resulting voltage distortion at substation level. Therefore, digitally supported coordination of excavation and conveying processes may contribute not only to energy-efficiency improvement but also to the management of distorted operating regimes in converter-dominated mining networks.
Renewable generation and BESS may become relevant in future mining and post-mining electrical systems [14,15,16,45,46,47]. Because these technologies add converter interfaces and may alter network impedance, their harmonic implications require dedicated system-level studies [7,8,30]. In the present article, this topic is retained only as prospective context and is not used to support the experimentally derived harmonic conclusions.
Beyond electrical and energy-management considerations, simulation-based studies have also addressed the structural reliability of bucket-wheel excavators, including the prediction of material failure in boom structures [48]. Although these mechanical aspects are outside the scope of the present study, they highlight the broader importance of condition assessment for large mining equipment.
Overall, the reviewed literature confirms that aggregate harmonic distortion in converter-dominated industrial systems is well established. The application-specific contribution of this study is therefore the measured characterization of the ST-7/ST-7A mining network under actual operating conditions, with an emphasis on load-dependent voltage and current distortion in the E05 excavator and associated conveyor drives. Representative simulations are used as an explanatory aid rather than as an independently validated reproduction of the network, and the BESS discussion is kept separate from the core power-quality evidence.
3. Materials and Methods
This section describes the methodology used to characterize distorted operating regimes in the electrical system of the Roșia open-pit lignite mine. The workflow is deliberately measurement-centered: representative operating states are identified from field data, standardized harmonic indicators are calculated, and a simplified MATLAB/Simulink R2021b drive model is then used to interpret selected trends under controlled conditions. The model-to-measurement comparison is qualitative and calibration-supported; it is not treated as independent validation of the complete network.
3.1. Studied System and Investigated Installations
This study addresses power-quality phenomena in the medium-voltage electrical network supplying the technological line of the Roșia open-pit lignite mine. The investigated installations include the bucket-wheel excavator E05 and the associated conveyor drive systems. These loads are supplied from substations ST-7 and ST-7A through medium-voltage feeders and long cable routes, reflecting the electrically extended structure typical of open-pit mining facilities.
Power-quality assessment is conducted at the 6 kV busbars of substations ST-7 and ST-7A, where voltage and current waveforms capture the aggregated electrical behavior of the investigated technological line. These measurement points are appropriate for system-level analysis because they reflect the combined effect of the connected drive systems and the upstream network impedance. The main investigated installations and their nominal electrical ratings are summarized in Table 1.
Table 1.
Main investigated installations and nominal electrical ratings.
3.2. Power-Quality Measurement Setup and Protocol
Field measurements were performed to characterize the steady-state distorted operating regimes generated by the investigated converter-fed installations. Voltage and current waveforms were recorded using a Hioki 3197 power-quality analyzer (Hioki E.E. Corporation, Ueda, Japan), compliant with EN 61326-1:2013 [49] Class A electromagnetic-compatibility requirements, enabling time-domain acquisition and frequency-domain harmonic assessment under realistic industrial loading conditions. The available manufacturer documentation does not specify an IEC 61000-4-30 Class A or Class S measurement-performance classification.
Measurements were carried out over representative operating intervals covering the normal operation of the E05 excavator and the associated conveyor drives. The acquired datasets include phase voltages, phase currents, and derived power-quality indices, together with harmonic spectra used for subsequent analysis. For each operating regime, harmonic distortion indicators were computed and stored for correlation with energetic metrics and for comparison with simulation outputs.
For methodological consistency, the Hioki 3197 datasets were evaluated using the analyzer-reported RMS and harmonic quantities associated with representative steady-state intervals. The analyzer uses a 10.24 kHz sampling rate per channel and a 200 ms evaluation window at 50 Hz for the reported quantities considered here.
Harmonic grouping and interpretation follow IEC 61000-4-7 and the general measurement principles of IEC 61000-4-30. The plots later referred to as reconstructed waveforms are illustrative visualizations assembled from available analyzer-reported magnitudes and selected spectral information over 50 ms display intervals; they are not raw, simultaneously sampled three-phase waveform records and are not used as independent evidence.
According to the calculation procedures implemented in the Hioki 3197 [50], the active power reported for each measurement channel was calculated over the 200 ms evaluation window as the average instantaneous product of the sampled voltage and current:
where M is the number of samples in the evaluation window and c denotes the measurement channel. Apparent power was calculated as , using the total RMS voltage and current values. Reactive power was derived by the analyzer as , where represents the leading or lagging polarity determined from the fundamental-frequency reactive-power component. Consequently, the reported P, Q, and S values are total-waveform quantities and are not restricted exclusively to the fundamental-frequency components. By contrast, the displacement power factor, DPF, is calculated from the phase difference between the fundamental voltage and current components [50].
The Hioki 3197 was connected through the secondary circuits of the installed voltage and current transformers associated with the 6 kV busbars of substations ST-7 and ST-7A. Accordingly, the analyzer input quantities were low-voltage secondary signals representing the corresponding medium-voltage busbar quantities and capturing the aggregated electrical behavior of the investigated technological line.
The investigated 6 kV distribution network is a three-phase, three-wire system operated with an isolated neutral and does not include a distributed medium-voltage neutral conductor. All current-related conclusions are based exclusively on the three documented phase-current channels (instrument labels I1, I2, and I3). Here, I1, I2, and I3 refer to instrument channel labels; in the harmonic-analysis equations, denotes the fundamental RMS current component.
3.3. Numerical Modeling Approach and Simulation Environment
To complement the field measurements and support physical interpretation of the observed load-dependent trends, a simplified numerical model of a converter-fed induction-motor drive was developed in MATLAB/Simulink. Its purpose is limited to controlled trend analysis at the inverter/motor side. It is not intended to reproduce the complete upstream mining network or to provide an independently validated grid-side harmonic model.
The software-implemented topology represents a three-phase pulse-width modulation (PWM), voltage-source inverter (VSI) feeding an asynchronous motor. The front-end stage, typically implemented as a six-pulse diode rectifier, and the DC-link capacitor dynamics are not represented explicitly; instead, both are replaced by a constant equivalent DC source feeding the inverter block.
To replicate actual variable-frequency industrial operational conditions, the machine drive is regulated via an open-loop scalar Volts per Hertz (V/f) control algorithm, directly modifying both base voltage amplitude and output frequency matching the specific mechanical torque-speed regimes.
The numerical model does not impose the measured three-phase bus voltages as independent sources. The upstream 20 kV/6 kV network, source short-circuit impedance, transformer impedance, feeder impedances, capacitor-bank interaction, rectifier stage, and DC-link dynamics are not represented explicitly; the inverter is supplied by a constant equivalent DC source. Measured fundamental voltage levels are used only as reference quantities for scaling and operating-point comparison, and measured background voltage harmonics are not injected.
Consequently, the model isolates converter-drive behavior and cannot predict harmonic propagation, resonance, or voltage distortion at the 6 kV busbars. A Thevenin network was not added because the required site-specific short-circuit and frequency-dependent impedance data were not available for this study; introducing assumed values would create unsupported numerical precision.
The practical implementation of three-phase induction-motor operation also requires coordinated power, control, command, and wiring circuits, particularly when sequential or automated operating states are involved [51].
The complete simulation model is presented in Figure 4. It represents a PWM-based three-phase voltage source inverter supplying a voltage-fed induction motor, together with dedicated voltage and current signal-processing subsystems used for waveform analysis and harmonic evaluation.
Figure 4.
Numerical model of the PWM inverter-fed induction motor drive with voltage, current, and mechanical subsystems.
The rectifier and DC-link dynamics are omitted and replaced by the constant DC supply of the inverter block, which emulates the operating conditions of a typical high-power mining drive.
The model is organized in modular form to separate the power-electronic conversion stage, induction-machine model, mechanical-load subsystem, and signal-processing blocks. Controlled changes in inverter-output frequency and load torque are used to examine their influence on the simulated drive-side voltage and current spectra. This structure supports qualitative interpretation of converter- and load-dependent tendencies only; it does not reproduce the complete field installation, its protection system, distributed cable effects, or network resonance.
For clarity, the main functional blocks are shown separately in Figure 5.
Figure 5.
Main functional blocks of the simulated system: (a) PWM voltage source inverter; (b) abc–dq transformation; (c) voltage-fed induction motor; (d) voltage and current signal-processing subsystem.
As illustrated in Figure 5a, the PWM voltage source inverter generates three-phase voltages with controlled amplitude and frequency, introducing switching harmonics that are subsequently visible in the frequency-domain analysis. Figure 5b depicts the abc–dq transformation block, which converts the three-phase quantities into the rotating dq reference frame; this transformation simplifies the mathematical description of the drive and facilitates the analysis of electromagnetic variables under dynamic operating conditions.
The core component of the system is the voltage-fed induction motor, shown in Figure 5c. The motor model includes the electrical dynamics of the stator and rotor circuits as well as the mechanical dynamics of the rotor, taking into account inertia and the applied load torque. A separate mechanical-dynamics block and a load-torque profile are used to emulate the operating conditions relevant for the E05 excavator and associated conveyor drives. This structure enables the simulation of realistic operating regimes and their influence on the resulting current and voltage waveforms.
Finally, Figure 5d highlights the voltage and current signal-processing subsystem used for steady-state extraction and Fourier-based harmonic analysis. The same definitions of RMS quantities, harmonic ratios, and Total Harmonic Distortion (THD) are applied where possible to facilitate trend-level comparison with the field indicators. Because the physical network and evaluation windows are not identical, this comparison is interpretive rather than a numerical model-validation test.
3.4. Simulation Scenarios and Data-Processing Workflow
Representative simulation scenarios were defined from the operating regimes observed in the E05 excavator and conveyor measurements. The field data are used to parameterize the model operating points; therefore, the simulated cases provide calibration-supported trend reproduction rather than independent validation. The scenarios differ in mechanical load and operating state and are used to examine whether the simplified drive model reproduces the direction of the load-dependent harmonic changes observed experimentally.
The following scenarios are considered in this study:
- S1—No-load operation (excavator line energized): the supply line and the drive system are energized while the excavator operates without cutting material and the main conveyors are unloaded. This regime reproduces the low-torque conditions observed during idle and standby periods of E05.
- S2—Marching/low-load regime: the excavator operates in marching mode or with limited cutting, and the conveyor drives operate at partial load, corresponding to moderate current and active-power levels in the measured data.
- S3—Nominal excavation with loaded conveyors: the bucket-wheel drive and the main conveyors T-500 and T-501 operate close to their nominal loading, representing the typical continuous excavation regime that dominates the recorded operating intervals.
- S4—High-load/simultaneous-drive regime: several conveyor drives and auxiliary motors operate simultaneously at elevated loading, emulating peak-demand conditions identified in the substation measurements.
The field measurements used for scenario calibration comprised two distinct datasets: nine selected operating records for the E05 bucket-wheel excavator, denoted M1–M9, and five selected records for the conveyor-belt supply line, denoted M1–M5. The selection was case-based rather than statistical: a record was retained when the archived campaign information allowed the operating condition to be identified, and a complete set of analyzer-reported RMS, power, and harmonic quantities was available for that same record. The selected points were chosen to span the documented low-load, no-load, nominal-load, and higher-demand conditions; they should therefore be interpreted as representative operating cases rather than as a random or exhaustive sample.
For the E05 excavator, M1 represents tramming or low-load operation and M2 energized no-load operation; M3–M5 were used to parameterize a nominal-load scenario, while M6–M9 represent higher-demand conditions. The conveyor-belt M1–M5 records form a separate case dataset and are ordered according to their measured loading levels. The retained archive does not provide a reliable one-to-one operating-state label for every 1 s trend point, nor does it preserve repeated 200 ms harmonic records grouped by operating state. Consequently, the number of independent windows per state and within-regime statistics such as mean, standard deviation, or range cannot be reconstructed without introducing assumptions. The field results are therefore explicitly framed as a case-based characterization of selected operating points. Because these same measurements inform the simulation parameters, the later measurement–simulation comparison remains a qualitative trend comparison rather than independent validation.
For each scenario, inverter-output frequency and mechanical load torque are adjusted to represent the corresponding operating state derived from the field observations. Field and simulation processing use different evaluation windows: the Hioki quantities correspond to 200 ms windows at 50 Hz, whereas the simulation uses frequency-synchronized Fourier windows.
These differences, together with the simplified electrical topology, preclude a quantitative validation claim.
For both datasets, THD and individual harmonic ratios use the same definitions and the same upper harmonic order, N = 50, where the data permit.
This provides a common descriptive basis for comparing the direction and relative character of the spectral changes while explicitly recognizing that the measurement and simulation datasets were neither acquired nor processed under identical conditions.
The overall workflow adopted in this study consists of the following steps:
- Selection of representative mining installations and measurement points in the medium-voltage network.
- Acquisition of voltage and current waveforms under real operating conditions for the E05 excavator and the associated conveyor systems.
- Computation of standardized harmonic indicators and identification of dominant spectral components from the measured datasets.
- Development and parameterization of the MATLAB/Simulink drive model representative of the investigated converter-fed installations.
- Simulation of the operating scenarios S1–S4 and extraction of the corresponding harmonic spectra and distortion indices.
- Comparative interpretation of measured and simulated indicators at the trend level, without treating the calibrated drive model as an independently validated representation of the complete mining network.
This workflow establishes the measured operating regimes as the primary evidence in Section 4. The simulation results are presented separately as a controlled interpretation aid, and prospective BESS implications are separated from both the field findings and the drive-model analysis.
3.5. Power-Quality Indicators and Qualitative Energetic Context
In this work, waveform distortion is quantified using harmonic-based power-quality indicators computed from the measured and simulated voltage and current signals. The analysis includes total harmonic distortion of voltage and current, individual integer-order harmonic components, the weighted distortion coefficient Dw, and the order-weighted harmonic factor Fw.
Although interharmonic phenomena are relevant to converter-dominated power systems and were acknowledged in the general discussion, they were not quantified separately in the present measurement campaign. The Hioki 3197 datasets provide conventional THD indices and integer-order harmonic spectra but do not contain a consistent set of interharmonic spectral groups for all investigated operating intervals. Consequently, the reported indices do not represent True Total Harmonic Distortion (TTHD), and TTHD could not be calculated reliably for the complete dataset. The comparison between measured and simulated results is therefore restricted to the harmonic components consistently available in both datasets [7,8,37].
3.5.1. Harmonic Distortion Indicators
For the line-side currents of ideal six-pulse rectifier front ends, the dominant characteristic harmonic orders are commonly expressed as follows:
where k is a positive integer, and h denotes the harmonic order. Thus, the first characteristic harmonic orders are the 5th, 7th, 11th, and 13th. These components are relevant to the interpretation of the measured spectra of converter-fed installations [7]. The same harmonic orders are also tracked in the simulated inverter-side spectra for comparative spectral characterization; however, because the six-pulse rectifier stage is not explicitly represented in the numerical model, the simulated components are not attributed to line-side rectifier harmonics.
Total harmonic distortion of voltage (THDU) and current (THDI) are used as global indicators of waveform distortion. For each analyzed operating regime, THD is computed from the RMS values of harmonic components as
where U1 and I1 denote the fundamental RMS values, while Un and In represent the RMS values of the n-th harmonic components, respectively [37]. In this study, the upper harmonic order was set to N = 50 for both voltage and current distortion calculations, corresponding to the harmonic range available in the Hioki 3197 measurement datasets. The same upper harmonic order was applied to the simulated spectra to ensure consistency between the measured and simulated results. For the conveyor records for which I1 was retained, the aggregate RMS magnitude of the harmonic currents over orders 2–50 was calculated directly from the THDI definition as .
In addition to global THD values, individual harmonic distortion factors are computed in order to identify dominant spectral components and to support the interpretation of harmonic propagation and resonance sensitivity:
Two additional dimensionless spectral descriptors were calculated from the individual harmonic components: the weighted distortion coefficient Dw and the order-weighted harmonic factor Fw. For a generic electrical quantity X, representing either voltage U or current I, they are defined as
where X1 and Xn denote the RMS values of the fundamental component and the n-th harmonic component, respectively, and N = 50.
The coefficient Dw emphasizes higher-order harmonic components, whereas Fw reduces their relative contribution through the 1/n weighting. Both are dimensionless descriptors used here only to compare the spectral distribution among operating regimes. They are not standardized compliance indices, transformer K-factor substitutes, or validated predictors of electrical loss or thermal stress.
THD and the individual harmonic ratios remain the primary power-quality quantities. Dw and Fw are retained as supplementary descriptive indices derived from the same harmonic magnitudes. Because a per-harmonic measurement-uncertainty budget was not available for the archived dataset, no independent uncertainty is assigned to Dw or Fw; accordingly, they are not used to support quantitative energetic conclusions.
3.5.2. Harmonic Measurement and Grouping Procedure
To ensure comparability between measured and simulated results, the same harmonic-indicator definitions and the same upper harmonic order, N = 50, were used, whereas the evaluation-window procedures differed as described in Section 3.2 and Section 3.4. Harmonic measurement and grouping procedures for the field data were based on IEC 61000-4-7, while the general power-quality measurement principles followed IEC 61000-4-30 [36,37].
Measurements were performed at the internal 6 kV busbars of substations ST-7 and ST-7A, as shown in Figure 2 and Figure 3. These locations are internal points of the mine distribution network and do not represent the point of common coupling with the upstream distribution system operator.
Consequently, the reported indicators characterize the internal power-quality conditions of the investigated installations and are not used for formal compliance assessment at the Point of Common Coupling (PCC) or electricity-settlement assessment. Compatibility levels relevant to the industrial distribution network are interpreted according to IEC 61000-2-4 [34].
3.5.3. Qualitative Energetic Context and Study Limitations
The established literature shows that harmonic currents and voltages can contribute to additional conductor, transformer, and machine losses [7,8,9]. The present study, however, does not directly measure losses, efficiency, temperature rise, equipment derating, or harmonic-dependent resistance.
Therefore, the reported harmonic indicators are treated as power-quality descriptors rather than as measured energetic-loss metrics. Quantitative loss or thermal assessment would require equipment-specific impedances, conductor geometry, thermal conditions, and absolute harmonic-current spectra together with an uncertainty budget; such an assessment is outside the present dataset.
Accordingly, the measured and simulated harmonic indicators are used in this work to achieve the following:
- Quantify the severity of distorted operating regimes under representative mining load profiles;
- Identify dominant harmonic components relevant for mitigation and resonance analysis;
- Identify operating regimes for which a dedicated loss, thermal, resonance, or mitigation assessment may be warranted;
- Provide consistent descriptors for comparative spectral characterization across the investigated operating regimes.
This framework supports the power-quality results in Section 4 while keeping the experimentally supported findings distinct from qualitative energetic implications and prospective modernization options.
4. Results and Discussion
4.1. Measured Operating Regimes and Harmonic Indicators
4.1.1. Measurements on the E05 Bucket-Wheel Excavator
In this sub-section, operating regimes M1–M9 of the excavation technological line are characterized based on the in situ power-quality datasets. Regimes M1 and M2 represent the tramming (marching) and no-load idling states, respectively, which are reproduced in the simulation framework by scenarios S2 and S1.
As illustrated in Figure 6, the phase-to-neutral RMS voltages (URMS) recorded on the low-voltage measurement channels corresponding to the monitored supply point exhibit only minor variations across phases and operating conditions. Specifically, during the higher-load tramming regime (Figure 6a), phase voltages lie within the 244–247 V range, whereas under no-load idling conditions (Figure 6b), they increase slightly to approximately 249–251 V. In all cases, the analyzer-reported RMS voltage magnitudes remain close to their expected operating level, with only limited variation between phases and operating conditions.
Figure 6.
Analyzer-reported phase-to-neutral RMS voltage magnitudes obtained from the instrument-transformer secondary measurement channels associated with the monitored 6 kV E05 feeder for two representative operating regimes: (a) tramming (marching) regime; (b) no-load idling regime.
The values presented in Figure 6 are the total phase-to-neutral RMS voltage magnitudes reported by the analyzer for representative 200 ms evaluation windows, corresponding to 10 cycles at 50 Hz. The analyzer-reported order-1 components were used separately as the fundamental quantities U1 and I1 in the THD and spectral calculations.
The small differences among the reported total RMS voltage values indicate relatively stable phase-voltage magnitudes during the selected measurement windows; however, these values are not used as a formal assessment of fundamental-frequency voltage unbalance. Such an assessment would require a clearly defined voltage-unbalance factor based on positive- and negative-sequence components. The measured RMS values and fundamental components provide the electrical reference for the subsequent spectral characterization and for the parameterization of the MATLAB/Simulink drive model described in Section 3.3.
Figure 7 compares the three measured phase-current channels for the two representative E05 operating states. The phase currents are approximately 2 A during tramming and approximately 1.1–1.2 A during no-load idling on the instrument-transformer secondary channels. The comparison is used only to characterize phase-current demand under the two operating conditions. Current waveform distortion is therefore assessed using the available phase-current THDI values, individual harmonic information, and the dimensionless spectral descriptors reported for the documented measurement channels.
Figure 7.
Phase RMS currents for two representative E05 operating regimes: (a) tramming (marching); (b) no-load idling.
To complement the RMS-based characterization of the operating regimes, voltage distortion levels were quantified in terms of total harmonic distortion (THDU) for each measurement channel over the available frequency range of the analyzer.
Figure 8 summarizes the resulting THDU values obtained from the instrument-transformer secondary measurement channels associated with the monitored 6 kV E05 feeder for the operating states described in Section 4.1.1. In all cases, the voltage distortion remains below 1.5%, indicating a mildly distorted operating regime at the monitored internal measurement point.
Figure 8.
Total harmonic distortion of phase-to-neutral voltages (THDU) across the three measurement channels: (a) Measurement 1 (tramming regime); (b) Measurement 2 (no-load idling regime).
The power quantities presented in Figure 9 are the analyzer-reported values evaluated over representative 200 ms windows according to the definitions provided in Section 3.2.
Figure 9.
Phase active (P), reactive (Q), and apparent (S) power components under distinct loading conditions: (a) tramming (march) regime; (b) no-load idling regime.
They represent total-waveform active, reactive, and apparent power quantities and are not restricted exclusively to the fundamental-frequency components. Figure 9 provides a comparative representation of these quantities for the two investigated operating states.
During the tramming regime (Figure 9a), the apparent power per phase ranges from 0.467 to 0.487 kVA. The analyzer reports an active-power value of −0.447 kW on phase L1, while phases L2 and L3 exhibit positive active-power values of 0.440 and 0.463 kW, respectively.
Conversely, during the lower-load idling interval (Figure 9b), although the apparent power decreases to a 0.268–0.294 kVA range, the negative active power on phase L1 persists (P = −0.277 kW) alongside a positive reactive power (Q = 0.058 kVAr). These discrepancies in the signs of P and Q across phases highlight the complexity of the distorted operating regimes characteristic of mining electrical networks. Notably, the similar apparent-power magnitudes across the phases, despite variations in active power, indicate that the monitored channels remain electrically loaded even when the net active-power demand is comparatively low (Figure 9).
To provide a comparative view of the spectral behavior of the E05 bucket-wheel excavator (type SRS 1300-26/3.5), nine representative field-measurement records, denoted M1–M9, were selected for operating conditions including idling, tramming, excavation under load, and bucket-wheel-boom pivoting.
The analyzer trend record associated with the measurement campaign contained 429 values acquired at 1 s intervals, corresponding to an overall trend-monitoring duration of approximately 7.1 min. The M1–M9 entries are selected case records linked to documented operating conditions, not nine equal-duration or statistically sampled segments. Because the archive does not preserve a complete state label and repeated 200 ms harmonic record for every trend point, per-regime sample counts and within-regime mean/standard deviation statistics cannot be recovered reliably.
For each entry, the reported RMS, power, and harmonic quantities correspond to a representative 200 ms analyzer evaluation window.
The harmonic quantities for voltage and current reported for the E05 excavator in this subsection were calculated for analyzer channel CH1, corresponding to phase L1. Based on the recorded voltage and current waveforms and the spectral captures obtained during field measurements, the harmonic distortion indices and order-weighted spectral descriptors were calculated to characterize the investigated operating regimes. Table 2 summarizes the resulting quantities: THDU, THDI, Dw,U, Dw,I, Fw,U, and Fw,I.
Table 2.
RMS quantities, calculated harmonic distortion indices, and voltage- and current-based order-weighted spectral descriptors for the E05 excavator operating regimes.
The variation in the calculated RMS voltage and current demand across these regimes is illustrated in Figure 10. While the voltage remains remarkably stable (within a 2% band), the current profile exhibits significant fluctuations dictated by the mechanical load.
Figure 10.
Variation in calculated RMS voltage (Urms) and current (Irms) across E05 operating regimes M1–M9.
To further evaluate the spectral behavior of the E05 excavator throughout its operational cycle, the harmonic distortion indices and order-weighted spectral descriptors (THDU, THDI, Dw,U, Dw,I, Fw,U, and Fw,I) were calculated from the field-measurement datasets, and are presented as comparative trends in Figure 11. These quantities provide a comparative characterization of the voltage- and current-harmonic regimes in the 6 kV mining network.
Figure 11.
Comparison of calculated harmonic distortion indices and order-weighted spectral descriptors for the E05 excavator: (a) voltage-based quantities (THDU, Dw,U × 100, Fw,U × 100); (b) current-based quantities (THDI, Dw,I × 10, Fw,I × 10). The scaling factors are applied solely to improve graphical visibility; the corresponding unscaled values are reported in Table 2.
The field measurements showed that the supply voltages were not perfectly sinusoidal, although their distortion remained low, with measured THDU values below 1.5%.
Integer-order voltage-harmonic components up to the 50th order were available in the Hioki 3197 datasets and were used for the experimental spectral characterization and the measurement-based waveform reconstructions. However, these measured voltage harmonics were not imposed as an external source-voltage spectrum in the numerical model.
As shown in Figure 11a, the voltage-based quantities remain comparatively low across the investigated regimes. Figure 11b presents the corresponding current-side quantities reported in the dataset. The supplementary descriptors Dw,I, and Fw,I reach their highest reported values at the low-current operating point M4.
Because these supplementary descriptors are not used here as standardized compliance, thermal-stress, or loss metrics, no quantitative physical inference is drawn from their absolute values.
The low-current character of M4 is independently established by the RMS current reported in Table 2, while the principal current-distortion interpretation relies on THDI and the measured harmonic spectra.
Figure 12 is an illustrative reconstruction of operating regime M1. It was assembled from analyzer-reported RMS quantities and available spectral information to visualize the approximate waveform character over a 50 ms interval.
Figure 12.
Illustrative measurement-based reconstruction for E05 regime M1 over a 50 ms display interval: (a) phase-voltage waveforms (U1, U2, and U3); (b) phase-current waveforms (I1, I2, and I3). The plot is not a raw synchronized waveform record.
It is not a raw synchronized three-phase waveform record and is not used as independent evidence. The measured conclusion for M1 is instead based on the analyzer-reported THDU and THDI values and available phase-current harmonic data.
For regime M1, the analyzer-reported quantities indicate low overall waveform distortion, with THDU approximately 0.8% and THDI = 1.70% for the reported channel, consistent with Table 2. Owing to the limited synchronized phase-resolved spectral information, no specific nonfundamental component is assigned to a unique physical source.
Accordingly, Figure 12 is used only as a visual aid. The power-quality conclusion for M1 is based on the measured harmonic indices and spectra, not on phase relationships inferred from the reconstruction.
Figure 13 provides the corresponding illustrative reconstruction for regime M2. As for Figure 12, the displayed profiles combine analyzer-reported magnitudes with available spectral information and should not be interpreted as a directly acquired synchronized waveform set.
Figure 13.
Illustrative measurement-based reconstruction for E05 regime M2 over a 50 ms display interval: (a) phase-voltage waveforms (U1, U2, and U3); (b) phase-current waveforms (I1, I2, and I3). The plot is not a raw synchronized waveform record.
For regime M2, the analyzer-reported results indicate low overall voltage and current distortion. The voltage THD remains approximately 1.2–1.3% across the reported channels, while the available current-harmonic data indicate only small nonfundamental components relative to the fundamental. The interpretation is based on these measured quantities; the reconstructed plot is not used as an independent validation or source-attribution tool.
4.1.2. Measurements on the Conveyor Belts of the E05 Excavator (T-500, T-501, MAN-1)
To complement the E05 measurements, power-quality parameters were recorded on the channels associated with the conveyor-belt supply system comprising T-500, T-501, and MAN-1. Figure 14 summarizes the phase-to-neutral RMS voltage magnitudes for light-load and partial-load conditions. The reported phase-voltage values remain closely grouped, ranging from 241.8 to 244.2 V during light-load operation and from 239.9 to 242.4 V under partial-load conditions. This small spread is used only as a voltage-magnitude observation and not as a formal sequence-component voltage-unbalance assessment.
Figure 14.
Phase-to-neutral RMS voltage magnitudes obtained from the measurement channels associated with the conveyor-belt supply system for two representative operating states: (a) light-load conditions; (b) partial-load conditions.
Figure 15 compares the three documented phase-current channels of the conveyor-belt supply system under light-load and partial-load conditions.
Figure 15.
Phase RMS current magnitudes for the conveyor-belt supply system under (a) light-load and (b) partial-load conditions.
The conveyor current-distortion assessment is therefore based on the documented phase-current channels, THDI values, and available harmonic spectra.
To characterize the voltage-distortion levels at the monitored conveyor-supply measurement channels, Figure 16 compares the total harmonic distortion of the phase voltages (THDU) under the same representative operating conditions. Under light-load operational conditions (Figure 16a), the individual phase voltage distortion factors (THD1, THD2, THD3) settle between 0.7% and 0.9%, whereas during partial-load states (Figure 16b), the distortion values decrease marginally, remaining within a narrow 0.6–0.8% range.
Figure 16.
Phase-to-neutral voltage total harmonic distortion (THDU) on the conveyor belt supply line for two distinct operating states: (a) light-load conditions; (b) partial-load conditions.
These voltage-distortion indicators remain comparatively stable and are of the same order as the values reported for the monitored 6 kV E05 feeder, which range from approximately 0.8% to 1.3%. The measured values therefore indicate low voltage distortion at the monitored internal measurement points. Because these locations are internal points of the mine distribution network rather than the point of common coupling with the upstream distribution system operator, the results are not interpreted as a formal grid-code or PCC-compliance assessment. Moreover, the available measurements do not permit the incremental contribution of the conveyor drives to the busbar voltage distortion to be separated from the background distortion associated with the shared network and other connected loads. The results are therefore used only for comparative characterization of the investigated internal operating conditions. The corresponding active, reactive, and apparent power profiles are evaluated next.
The low and narrowly distributed THDU values shown in Figure 16 indicate limited voltage distortion under the monitored operating conditions. Although the connected conveyor drives may generate nonsinusoidal currents, the measured voltage distortion remains low at the investigated internal measurement point. However, short-circuit power was not determined as part of the present measurement campaign; therefore, the measured THDU values are not used to derive a quantitative grid-stiffness indicator, short-circuit ratio, or renewable-energy hosting-capacity limit. A topology-dependent assessment of short-circuit power and frequency-dependent network impedance would be required for a quantitative evaluation of harmonic propagation and future PV/BESS hosting capacity. This distinction is important because current distortion may be locally present even when voltage THD remains low; therefore, voltage-based indicators alone cannot fully describe the harmonic stress imposed by converter-fed conveyor drives. Consequently, the following analysis of power components and current-related indicators is required to complete the assessment of the electrical loading conditions.
To establish a comprehensive comparative baseline with the primary excavation infrastructure, Figure 17 details the multi-phase active (P), reactive (Q), and apparent (S) power components recorded at the conveying line substation busbars under the same operational intervals. Under light-load operational conditions (Figure 17a), the apparent power S per phase displays a remarkably uniform distribution bounded between 0.378 and 0.388 kVA. In this state, the active power demand remains lower in scale compared to the main excavator unit, reaching a positive peak of 0.373 kW on Phase L2, while phase L3 exhibits a reported negative value of −0.244 kW.
Figure 17.
Phase active (P), reactive (Q), and apparent (S) power components on the conveyor belt supply line for two distinct operating states: (a) light-load conditions; (b) partial-load conditions.
A matching structural trend is sustained under partial-load conditions (Figure 17b), where the apparent power scales slightly to a tight 0.418–0.428 kVA range. Concurrently, while the positive active power on Phase L2 rises to 0.406 kW, the reported negative active-power value on Phase L3 reaches −0.296 kW.
The reactive-power components remain within the range −0.408 to −0.062 kVAr across the two operating states. The analyzer-reported power quantities therefore exhibit differences in both magnitude and sign among the three measurement channels.
These values are interpreted according to the analyzer definitions provided in Section 3.2. However, the observed sign differences are not used here to infer reverse power flow or to attribute the behavior quantitatively to harmonic distortion, phase-angle shifts, or load asymmetry without additional directional and phase-resolved measurements.
The apparent-power values nevertheless provide a useful indication of the electrical loading of the monitored channels under the two operating conditions. Accordingly, the combined examination of active, reactive, and apparent power is retained for comparative characterization of the investigated operating regimes, without assigning a specific physical cause to the observed channel-to-channel sign differences.
To complement the results obtained for the E05 bucket-wheel excavator, the same harmonic distortion indices and order-weighted spectral descriptors were evaluated for the five selected conveyor-belt operating records M1–M5. These case records span the documented loading conditions from low-current operation to higher demand. For these records, the analyzer-reported order-1 current component I1 was retained, allowing the aggregate RMS magnitude of harmonics 2–50 to be reported together with THDI. The resulting quantities are summarized in Table 3.
Table 3.
Fundamental current, calculated harmonic distortion indices, voltage- and current-based order-weighted spectral descriptors, and aggregate harmonic-current magnitude for the selected conveyor-belt operating records M1–M5.
To synthesize the global operational behavior of the conveyor-belt supply line across the selected operating records, Figure 18 maps the variation in RMS voltage and fundamental RMS current I1 across regimes M1–M5. Similar to the primary excavation node, the medium-voltage profile remains within a narrow and stable range, between 6002 V and 6052 V (approximately 1% variation).
Figure 18.
Variation in calculated RMS voltage (URMS) and fundamental RMS current (I1) across the selected conveyor-belt operating records M1–M5.
The current profile is strongly load-dependent. The fundamental RMS current I1 is 158.59–176.43 A for M1, M2, M4, and M5, whereas the low-current regime M3 decreases to 9.17 A. In M3, THDI reaches 94.40%, but the corresponding aggregate RMS magnitude of harmonics 2–50 is 8.66 A.
The high percentage is therefore primarily a relative normalization effect associated with the small fundamental-current denominator and should not be read as 94.40% of rated current or as direct evidence of severe thermal stress.
To evaluate the spectral behavior of the conveyor-belt supply line, Figure 19 compares the calculated harmonic distortion indices and order-weighted spectral descriptors across operating regimes M1–M5.
Figure 19.
Comparison of calculated harmonic distortion indices and order-weighted spectral descriptors for the conveyor-belt operating regimes M1–M5: (a) line-to-neutral voltage-based quantities (THDU, Dw,U × 100, Fw,U × 100); (b) phase-current-based quantities (THDI, Dw,I × 10, Fw,I × 10). The scaling factors are applied solely to improve graphical visibility.
Figure 19a presents the voltage-based quantities THDU, Dw,U, and Fw,U, whereas Figure 19b presents the corresponding current-based quantities THDI, Dw,I, and Fw,I. The voltage-based indicators remain comparatively low throughout the investigated regimes, with THDU remaining below 1%.
The weighted distortion coefficient Dw,U reaches its highest value in regime M4, indicating a comparatively greater contribution of higher-order voltage harmonics under this operating condition.
Using , the aggregate absolute harmonic-current RMS values for M1–M5 are 13.62, 10.30, 8.66, 12.35, and 13.69 A, respectively. Thus, M3 has the highest relative THDI but an absolute harmonic-current magnitude lower than those of M1, M4, and M5. This comparison makes the denominator effect explicit and confirms that percentage distortion and absolute harmonic-current magnitude must be interpreted together.
THD is the primary standardized relative distortion indicator used here, whereas Dw and Fw are supplementary dimensionless descriptors of spectral distribution. They are not treated as standardized compliance indices or as validated thermal- or loss-stress metrics. In particular, the energetic significance of any regime requires the absolute harmonic-current spectrum and equipment-specific loss parameters.
Figure 20 provides an illustrative reconstruction of the conveyor-system waveforms for regime M1 over a 50 ms display interval. The visualization was assembled from analyzer-reported magnitudes and available spectral information and is not a raw synchronized waveform record. The measured harmonic-spectrum data, rather than the reconstructed phase relationships, constitute the evidence for the reported distortion pattern.
Figure 20.
Illustrative measurement-based reconstruction for conveyor regime M1 over a 50 ms display interval: (a) phase-voltage waveforms (U1, U2, and U3); (b) phase-current waveforms (I1, I2, and I3). The plot is not a raw synchronized waveform record.
The available spectral records for the documented phase-current channels show pronounced higher-order components, particularly around the 17th and 19th orders, with additional components at the 23rd and 25th orders. Figure 20 is used only to visualize the approximate waveform character.
Accordingly, the conclusion that voltage and current quality differ under the monitored conveyor operating regime is based on the measured THDU, THDI, and harmonic spectra. The reconstructed waveform is not used as evidence for additional physical mechanisms.
Figure 21 provides an analogous illustrative reconstruction for conveyor regime M2 under partial load. It is intended only to visualize the approximate waveform character using analyzer-reported magnitudes and available spectral information; it is not a directly acquired synchronized three-phase waveform set.
Figure 21.
Illustrative measurement-based reconstruction for conveyor regime M2 under partial load over a 50 ms display interval: (a) phase-voltage waveforms (U1, U2, and U3); (b) phase-current waveforms (I1, I2, and I3). The plot is not a raw synchronized waveform record.
The measured phase-current spectra for this operating condition contain both low-order and higher-order components, with the 17th and 19th orders among the prominent reported components. These measured spectral quantities, rather than the reconstructed phase relationships, are used for the power-quality interpretation.
The interpretation is restricted to the documented phase-current channels and measured spectral quantities.
4.2. Numerical Simulation Results and Harmonic Trend Interpretation
To support physical interpretation of the measured load-dependent tendencies, the simplified MATLAB/Simulink drive model was evaluated under variable frequency and variable load conditions. Because the operating points were parameterized using the field regimes and the upstream mining network is not represented, the results are presented as calibration-supported trend analysis rather than as theoretical or independent validation of the measurements.
The results indicate that the inverter-output frequency directly modifies the amplitude distribution of the low-order voltage harmonics. However, increasing or decreasing the mechanical shaft load torque does not significantly alter the voltage harmonic profile. This finding is qualitatively consistent with the field measurements discussed in Section 4.1.2, where the measured voltage-distortion levels remained low and the reported phase-voltage RMS magnitudes varied only slightly between the analyzed operating conditions.
By contrast, the current-side response exhibits a stronger dependence on the simulated operating condition. This is used only for qualitative interpretation of the load-sensitive current behavior observed in the field. For example, conveyor record M3 has I1 = 9.17 A, THDI = 94.40%, and IH,2–50 = 8.66 A, illustrating how a small fundamental-current denominator can produce a high relative THDI without a proportionally large absolute harmonic current. The simulated scenarios are therefore compared with the measurements only at the trend level, not as one-to-one matched operating points.
4.2.1. Reference Inverter-Output Waveforms at Nominal Frequency
Before examining the effects of operating frequency and mechanical loading on the simulated motor-current harmonics, a reference operating point was established at a fundamental output frequency of 50 Hz and a constant simulation load-torque parameter of 5 N·m in the simplified drive model. The voltage and current quantities presented in this subsection are evaluated at the inverter output and motor terminals. They characterize the internal drive-side waveforms produced by the PWM inverter and are not used as direct indicators of voltage quality at the 6 kV supply busbar.
The upstream AC network, rectifier stage, and DC-link capacitor dynamics are not represented explicitly in the present model; instead, the inverter is supplied from a constant equivalent DC source. Consequently, the simulation does not reproduce grid-side voltage distortion, input-current harmonics, or the influence of DC-link capacitance. The inverter-output voltage spectrum is retained only as a reference for interpreting the voltage excitation applied to the motor and the resulting stator-current response.
The voltage response was examined in both the time domain and the frequency domain. The time-domain waveform highlights the switching nature of the inverter output, while the frequency-domain spectrum separates and quantifies the dominant harmonic components. This dual representation is used solely to characterize the drive-side voltage excitation at the motor terminals. It is not interpreted as evidence of voltage distortion or harmonic injection at the upstream 6 kV busbar.
As shown in Figure 22a, the simulated phase voltage waveform exhibits the characteristic stepped profile generated by PWM switching in the voltage-source inverter. These rapid switching transitions produce steep voltage rise times dv/dt, which may increase dielectric stress on the induction motor winding insulation, promote partial discharge phenomena, and generate high-frequency bearing currents through parasitic capacitive paths.
Figure 22.
Simulated inverter voltage response for the simplified drive model at a constant 5 N·m mechanical load torque: (a) output phase voltage waveform at 50 Hz; (b) corresponding normalized Fourier harmonic spectrum.
The corresponding Fourier spectrum in Figure 22b confirms the presence of dominant low-order characteristic harmonics, particularly the 5th at 250 Hz, 7th at 350 Hz, 11th at 550 Hz, and 13th at 650 Hz. The nonsinusoidal phase voltage can therefore be represented through the Fourier expansion:
where U1 is the peak value of the fundamental voltage component, ωs is the stator angular frequency, θ1 is the phase angle of the fundamental component, Un represents the peak amplitude of the n-th harmonic component, θn is its phase angle, and H = {5, 7, 11, 13} denotes the set of selected harmonic orders considered in the analysis.
This spectral decomposition characterizes the voltage waveform generated internally by the PWM inverter at the motor terminals. It provides a reference for interpreting the corresponding motor-current spectrum but does not represent the voltage spectrum at the upstream 6 kV busbar. The simulated spectrum establishes a reference drive-side harmonic pattern under the adopted idealized DC-supply and PWM conditions.
These inverter-side spectra are used only for qualitative trend interpretation; direct harmonic propagation into the upstream 6 kV network is outside the scope of the simplified drive model.
4.2.2. Frequency-Dependent Inverter-Output Voltage Harmonic Evolution
To improve graphical readability, the harmonic-amplitude trajectories are displayed over representative 300 ms portions of the simulated records. These displayed intervals are distinct from the spectral-analysis windows. The harmonic amplitudes were obtained using the frequency-synchronized, one-cycle Fourier procedure described in Section 3.4, with the Fourier-analyzer fundamental-frequency parameter set equal to the corresponding inverter-output frequency for each operating case.
Accordingly, the analysis-window durations were 25 ms at 40 Hz, 20 ms at 50 Hz, and approximately 16.67 ms at 60 Hz. The stabilized portions of the resulting trajectories were used for comparative interpretation.
To characterize the frequency-dependent spectral behavior of the converter-fed mining drive system, the parameterized MATLAB/Simulink model was analyzed under nominal and non-nominal frequency conditions around the reference operating point. In this analysis, the mechanical load torque was kept at the value associated with scenario S3 (nominal excavation with loaded conveyors), while the constant equivalent DC-supply condition remained unchanged, so that only the inverter-output frequency was varied. Figure 23 shows the time evolution of the amplitudes of the fundamental voltage component and the selected harmonic components of orders 5, 7, 11, and 13 at (a) f = 40 Hz, (b) f = 50 Hz, and (c) f = 60 Hz.
Figure 23.
Simulated evolution of the selected inverter-output voltage harmonic amplitudes over representative 300 ms display intervals at three fundamental frequencies: (a) 40 Hz, (b) 50 Hz, and (c) 60 Hz. The interpretation focuses on the stabilized harmonic levels and frequency-dependent amplitude trends.
At the nominal operating frequency of 50 Hz (Figure 23b), the selected voltage-harmonic trajectories settle rapidly after the initial transient and remain comparatively stable over the displayed interval.
The 5th- and 7th-order components are the most prominent among the selected higher-order harmonics, while the 11th- and 13th-order components remain lower. The fundamental component likewise reaches a comparatively stable post-transient level. This behavior indicates a comparatively stable inverter-output spectral pattern under the adopted 50 Hz operating condition.
At 40 Hz and 60 Hz (Figure 23a,c), the selected harmonic trajectories exhibit stronger time variation and amplitude modulation than in the 50 Hz case. The relative amplitudes and temporal behavior of the selected components differ between the three frequency cases, demonstrating that the inverter-output spectral distribution is frequency-dependent under the adopted control and switching conditions. These differences are interpreted as drive-side behavior and not as a representation of harmonic propagation through the upstream mining network.
The frequency-dependent variation in the simulated inverter-output harmonic amplitudes is associated with the combined influence of the V/f control law and the changing carrier-to-fundamental frequency ratio. In the present model, the PWM carrier frequency is kept constant at fc = 1000 Hz, whereas the fundamental output frequency f1 is varied between 40, 50, and 60 Hz.
Consequently, the carrier-to-fundamental frequency ratio decreases from 25 at 40 Hz to 20 at 50 Hz and approximately 16.7 at 60 Hz. The V/f controller simultaneously adjusts the commanded voltage reference according to the selected operating frequency. These combined effects modify the PWM switching pattern relative to each fundamental cycle and therefore influence the amplitudes and temporal behavior of the selected spectral components shown in Figure 23.
Accordingly, Figure 23 is used primarily for qualitative comparison of frequency-dependent inverter-output harmonic patterns. No quantitative correspondence between the selected simulated amplitudes and the measured voltage-distortion levels at the monitored 6 kV network points is inferred from these trajectories.
In addition to the harmonic-amplitude trends, Figure 23 shows that the simulated trajectories remain bounded after the initial electromagnetic transient. This observation is used only as a numerical-consistency check of the implemented drive model and is not presented as validation against the field network.
The comparison among the three simulated frequency cases shows that the selected harmonic trajectories remain bounded after the initial transient and exhibit distinct frequency-dependent amplitude patterns. This behavior provides an internal numerical-consistency check of the implemented MATLAB/Simulink drive model under the analyzed operating conditions. It should not be interpreted as validation of the complete mining electrical network or as evidence of harmonic propagation at the upstream 6 kV busbars.
From a practical perspective, the time-domain tracking of individual harmonic amplitudes complements the steady-state spectral analysis by showing how the selected components evolve during the simulated operating interval. Figure 23 is therefore used to characterize the drive-side sensitivity of the inverter-output voltage spectrum to changes in fundamental frequency under controlled model conditions. The resulting trends are used only for qualitative interpretation of the simulated converter-drive behavior and are not treated as a quantitative reproduction of the field measurements.
When the fundamental component is plotted together with the higher-order harmonics, it is divided by 10 solely for graphical visibility and is identified in the legend as “harmonic 1/10”. This graphical scaling does not affect the underlying harmonic calculations.
4.2.3. Current-Side Harmonic Response and Frequency Sensitivity
To evaluate the current-side distortion generated by the conversion stage under nominal loading, Figure 24 illustrates the simulated current response under a constant mechanical shaft load of 5 N·m. This analysis comprises the simulated output phase current waveform at 50 Hz (Figure 24a) and its corresponding normalized Fourier harmonic spectrum (Figure 24b) up to 650 Hz.
Figure 24.
Simulated inverter current response for the simplified drive model at a constant 5 N·m mechanical load torque: (a) output phase current waveform at 50 Hz; (b) corresponding normalized Fourier harmonic spectrum.
The time-domain phase current waveform (Figure 24a) exhibits a quasi-sinusoidal profile that is superimposed with periodic ripples and jagged transitions. These high-frequency ripples are the direct result of the high-frequency switching commutations of the inverter’s IGBTs, which inject dv/dt voltage transitions into the inductive stator circuits. The severity of these ripples is governed by the ratio between the inverter’s carrier frequency fc = 1000 Hz and the fundamental stator frequency 50 Hz, which determines the number of pulses per cycle.
The normalized Fourier spectrum contains pronounced harmonic components, particularly at the 5th and 7th orders, with additional components at the 11th and 13th orders. In the present model, these components characterize the inverter–motor-side response under the adopted PWM and V/f operating conditions and should not be interpreted as grid-side characteristic harmonics of a six-pulse rectifier, since the rectifier stage is not represented explicitly. For a given harmonic voltage component, the corresponding stator-current harmonic amplitude can be approximated as
where Vh is the harmonic voltage amplitude, Rs is the stator resistance, Lσ is the total leakage inductance, ω1 is the fundamental angular frequency, and h is the harmonic order.
While the simulation model in Figure 24 represents a localized drive configuration with an idealized short-cable connection, comparison with the in situ measurements highlights important system-level differences. In the field measurements associated with the conveyor-belt supply line (Figure 20 and Figure 21), the phase-current spectra contain pronounced higher-order harmonic components, particularly at the 17th (850 Hz) and 19th (950 Hz) orders, with additional peaks at the 23rd (1150 Hz) and 25th (1250 Hz) orders.
This difference in spectral content is consistent with the influence of the extended network between the converter-fed drives and the measurement locations. In the physical open-pit lignite mining network of E.M. Roșia, the medium-voltage cable runs linking substations ST-7 and ST-7A to the conveyor drives range from approximately 350 m to 5700 m. At higher frequencies, these long cable routes exhibit distributed electrical behavior associated with series inductance and shunt capacitance. Together with the motor input impedance and the surrounding network, these parameters can modify the frequency-dependent response and may contribute to the amplification or attenuation of particular higher-order current components. Because these network effects are not represented explicitly by the localized drive model, they are not assigned here as a unique cause of the measured 17th–25th-order spectral components.
The higher-order components observed in the field measurements are consistent with the combined influence of converter operation, motor impedance, cable characteristics, and the surrounding network. These effects are not reproduced explicitly by the localized drive model. The comparison therefore highlights the importance of network parameters for field harmonic behavior without claiming a unique propagation or resonance mechanism.
To characterize the current-side harmonic response under variable-frequency operation, Figure 25 presents the simulated evolution of the selected current harmonic amplitudes for three fundamental frequencies: (a) 40 Hz, (b) 50 Hz, and (c) 60 Hz. To avoid excessive graphical density, the plotted trajectories show representative portions of the 300 ms simulation records, whereas the harmonic amplitudes were obtained using the frequency-synchronized one-cycle Fourier procedure described in Section 3.4.
Figure 25.
Simulated evolution of the selected current harmonic amplitudes over representative portions of the 300 ms simulation records at three fundamental frequencies: (a) 40 Hz, (b) 50 Hz, and (c) 60 Hz. The figure highlights the frequency-dependent behavior of the fundamental, 5th-, 7th-, 11th-, and 13th-order current components.
At 50 Hz (Figure 25b), the selected current-harmonic trajectories settle rapidly after the initial transient and remain comparatively stable over the displayed interval. The fundamental current component, displayed as I1/10 for graphical visibility, remains dominant, while the selected 5th-, 7th-, 11th-, and 13th-order components exhibit substantially lower post-transient amplitudes.
At 40 Hz and 60 Hz (Figure 25a,c), the selected current components exhibit stronger time variation and amplitude modulation than in the 50 Hz case. The relative amplitudes and temporal behavior of the fundamental and higher-order components differ among the three frequency cases, indicating a frequency-dependent current-side response of the simplified inverter–motor model. Figure 25 is therefore interpreted qualitatively rather than as a precise quantitative ranking of individual harmonic amplitudes among the three operating frequencies.
The frequency dependence of the simulated current-harmonic response is influenced by both the inverter-output voltage pattern and the electrical impedance of the induction-motor model. For a spectral component of frequency f, the leakage reactance associated with the total leakage inductance may be expressed as
where f is the frequency of the considered spectral component, and is the total leakage inductance of the stator and rotor circuits.
Accordingly, changes in fundamental operating frequency modify both the frequencies of the corresponding spectral components and the impedance encountered by those components. Together with the adopted V/f control law, fixed-carrier PWM strategy, and transient electromagnetic response of the motor model, these effects contribute to the different current-harmonic trajectories observed in Figure 25. No single impedance mechanism is therefore used here to explain the complete amplitude variation among the three simulated cases.
The field data provide a complementary case comparison rather than validation of the frequency-dependent simulation. For conveyor record M3, I1 = 9.17 A and THDI = 94.40% correspond to IH,2–50 = 8.66 A; the result is therefore interpreted as high relative distortion during low-current operation, not as proportionally high absolute harmonic injection.
The initial portions of the simulated trajectories also contain transient oscillations associated with the dynamic interaction among the inverter, the induction-motor equivalent circuit, and the imposed operating condition. After this initial interval, the harmonic trajectories remain bounded for all three analyzed frequencies. This bounded behavior is used only as an internal numerical-consistency check of the implemented MATLAB/Simulink model and does not constitute validation against the complete field network.
From an operational perspective, Figure 25 shows that the current-side spectral response of the simplified drive model changes with the imposed fundamental frequency. The selected harmonic components exhibit different post-transient amplitude patterns and degrees of temporal variation across the 40, 50, and 60 Hz cases.
These results are therefore interpreted as frequency-dependent drive-side behavior and are not used to establish a quantitative relationship between mechanical loading and current distortion.
The distinction between relative current distortion and absolute harmonic-current magnitude remains important when interpreting the field measurements. High THDI values during low-current operating regimes do not necessarily imply proportionally high absolute harmonic-current stress. Conversely, lower relative distortion under higher-current conditions does not by itself imply lower thermal loading.
Practical equipment sizing, protection coordination, loss estimation, and filter design would require absolute field harmonic-current spectra together with network- and equipment-specific parameters, which are outside the scope of the present simplified model.
4.2.4. Voltage and Current Harmonic Amplitude Evolution
After evaluating the influence of inverter-output frequency on the voltage and current harmonic spectra, the temporal evolution of the selected harmonic components was further examined under the adopted simulation conditions. This analysis is relevant because the field measurements showed comparatively stable voltage-distortion levels, whereas the current-side quantities exhibited a stronger dependence on the operating condition.
Figure 26 compares the simulated voltage- and current-side harmonic amplitudes over a representative 300 ms interval. The purpose of this comparison is to illustrate the different dynamic responses of the inverter-output voltage and motor current rather than to reproduce a specific sequence of measured operating regimes.
Figure 26.
Simulated evolution of selected voltage and current harmonic amplitudes over a representative 300 ms interval: (a) inverter-output voltage harmonic amplitudes; (b) motor-current harmonic amplitudes. The fundamental component is displayed as harmonic 1/10 for graphical visibility.
Figure 26a shows that, following the initial transient, the fundamental voltage component U1 and the selected 5th, 7th, 11th, and 13th harmonic components remain within comparatively narrow amplitude ranges.
Under the adopted constant equivalent DC-supply and fixed-PWM assumptions, the simulated inverter-output voltage spectrum therefore exhibits a comparatively stable post-transient behavior.
Figure 26b shows a different current-side response. The fundamental current component I1 exhibits a pronounced initial transient and subsequently evolves gradually over the analyzed interval, whereas the selected higher-order current-harmonic components I5, I7, I11, and I13 remain comparatively lower and exhibit more limited post-transient variation.
This behavior reflects the dynamic interaction between the inverter, the induction-motor equivalent circuit, and the imposed mechanical operating condition.
The comparison therefore highlights a qualitative difference between the voltage- and current-side responses of the simplified drive model. The voltage harmonic amplitudes remain comparatively stable after the initial transient, whereas the motor-current components exhibit a more pronounced dynamic evolution.
The simulated trajectories are interpreted only in terms of post-transient drive-side harmonic behavior and do not establish a quantitative relationship between mechanical load and field THDI.
4.2.5. Synthesis of Numerical–Experimental Comparison
The numerical–experimental comparison is restricted to qualitative trend consistency because the simulated operating points are parameterized from the field regimes and the upstream mining network is not represented. Its purpose is only to determine whether the simplified converter-drive model reproduces the direction of selected measured tendencies.
Both datasets show comparatively stable voltage-side behavior and a stronger operating-state dependence of current-side quantities. Quantitative differences in the current spectra are expected because the actual installation includes transformer and feeder impedances, long-cable effects, distributed capacitances, multiple loads, and possible resonance conditions that are absent from the simplified model. The model is therefore retained as a drive-side interpretation tool, not as a predictor of the ST-7/ST-7A network.
4.3. Illustrative BESS Resilience Scenario
The BESS analysis is retained only as an illustrative resilience-sizing scenario and is kept separate from the experimentally supported harmonic findings. The total installed electrical capacity of excavator E05, Pinst = 2540 kW, is used as a conservative reference. An assumed four-hour duty profile comprising four equal one-hour intervals at 25%, 50%, 75%, and 100% of this reference power is considered solely for preliminary energy sizing; it does not represent a measured emergency-load sequence. These assumed load fractions correspond to power demands of 635, 1270, 1905, and 2540 kW, respectively.
The net Alternating Current (AC) energy required by this assumed duty profile is therefore calculated as
The assumed battery discharge efficiency is ηbat = 0.95, while the assumed PCS-plus-transformer discharge efficiency is ηPCS+tr = 0.926. The aggregate one-way discharge-path efficiency, ηdis, is therefore calculated as
The operational discharge window is limited to DoD = 0.85, corresponding to a minimum SoC of 15%. These efficiency and DoD values are scenario assumptions rather than site- or vendor-validated performance data.
The additional 15% factor is defined strictly as a simple additive beginning-of-life engineering contingency margin, M = 0.15, and not as mathematical compensation for a specified 15% end-of-life capacity loss. The illustrative installed BESS energy capacity is therefore obtained by correcting the required AC energy for the aggregate one-way discharge efficiency and the usable depth-of-discharge window, followed by application of the additive engineering contingency margin:
The principal assumptions and resulting sizing value are summarized in Table 4.
Table 4.
Summary assumptions and results for the illustrative BESS resilience-sizing scenario.
If the design requirement instead specified an exact 15% end-of-life capacity loss, the corresponding beginning-of-life capacity requirement would be obtained by dividing the pre-margin capacity requirement by 0.85, yielding approximately 9.99 MWh. This end-of-life derating model is not used in the present illustrative scenario.
The resulting 9.76 MWh value should therefore be interpreted only as an order-of-magnitude resilience-sizing result for the assumed duty profile. It does not demonstrate actual four-hour blackout autonomy, black-start capability, harmonic filtering, voltage support, renewable-energy integration, or economic viability. A site-specific BESS design would require measured high-resolution critical-load profiles, manufacturer-specific battery and PCS characteristics, auxiliary-load and thermal-derating data, protection and islanding studies, degradation modeling, and techno-economic assessment.
5. Conclusions
The primary contribution of this study is a case-based field characterization of selected load-dependent harmonic operating points in the E.M. Roșia open-pit lignite mining electrical system. The measurements show comparatively low voltage distortion at the monitored internal points and marked operating-state dependence of current distortion. In particular, high relative THDI during low-current operation must be interpreted together with the fundamental current and the absolute harmonic-current magnitude.
The MATLAB/Simulink inverter-motor model provides simulation-assisted physical interpretation of selected converter- and load-dependent trends. Because the model is calibrated from the measured regimes and omits the upstream source, transformer and feeder impedances, distributed capacitances, multiple nonlinear loads, capacitor-bank interaction, background distortion, and DC-link dynamics, the measured-simulated comparison is limited to qualitative trend consistency. The model is not presented as an independently validated representation of the ST-7/ST-7A network.
The separate BESS subsection is an illustrative resilience scenario based on an assumed four-hour staged load profile. Its 9.76 MWh result uses an 88% assumed one-way discharge-path efficiency, an 85% DoD constraint, and a 15% additive beginning-of-life engineering contingency margin. The 15% multiplier is not an end-of-life capacity-loss correction, and the scenario does not demonstrate actual blackout autonomy or power-quality benefits.
Future work should therefore prioritize a network model parameterized with measured 20 kV short-circuit data, transformer and feeder impedances, cable capacitances, and capacitor-bank ratings; independent validation cases; synchronized waveform acquisition; equipment-specific loss/thermal calculations; and measured emergency-load profiles for any BESS design. These additions would enable quantitative harmonic-propagation, resonance, loss, and resilience assessments beyond the measurement-centered scope of the present study.
Author Contributions
Conceptualization, G.P., F.G.P. and S.D.R.; methodology, I.U., M.D.M. and G.M.H.; software, F.G.P. and S.D.R.; validation, S.M.R., I.U., M.D.M. and R.S.; formal analysis, G.P., F.G.P. and I.S.S.; investigation, G.P., M.D.M., R.S. and S.D.R.; resources, I.U., M.D.M., G.M.H., M.G.S.P. and R.S.; data curation, G.P. and S.D.R.; writing—original draft preparation, G.P., F.G.P. and S.D.R.; writing—review and editing, I.U., M.D.M., F.G.P. and D.C.L.; visualization, F.G.P., S.D.R. and D.C.L.; supervision, S.M.R. and F.G.P.; project administration, F.G.P. and I.U. All authors have read and agreed to the published version of the manuscript.
Funding
This research received no external funding.
Data Availability Statement
The original contributions presented in this study are included in the article; further inquiries can be directed to the corresponding author.
Conflicts of Interest
The authors declare no conflicts of interest.
Abbreviations
The following abbreviations are used in this manuscript:
| ACC | Alternating Current Contactor |
| ASCR | Aluminum Conductor Steel Reinforced |
| BC | Bus Coupler |
| BESS | Battery Energy Storage System |
| BWE | Bucket-Wheel Excavator |
| CT | Current Transformer |
| DoD | Depth of Discharge |
| EoL | End of Life |
| FFT | Fast Fourier Transform |
| FL | Fuse Link |
| GS | Grounding Switch |
| HRC | High Rupturing Capacity Fuse |
| IEC | International Electrotechnical Commission |
| IBD | Indoor Busbar Disconnector |
| IEEE | Institute of Electrical and Electronics Engineers |
| KF | K-Factor |
| LiFePO4 | Lithium Iron Phosphate |
| MOCB | Minimum Oil Circuit Breaker |
| OHL | Overhead Line |
| ONAN | Oil Natural Air Natural (oil-immersed, naturally cooled) |
| OLTC | On-Load Tap Changer |
| OPL | Overhead Power Line |
| PCC | Point of Common Coupling |
| PCS | Power Conversion System |
| PWM | Pulse-Width Modulation |
| RMS | Root Mean Square |
| SoC | State of Charge |
| SRC | Static Rotor Converter |
| THD | Total Harmonic Distortion |
| THDI | Total Harmonic Distortion of Current |
| THDU | Total Harmonic Distortion of Voltage |
| V/f | Volts per Hertz |
| VFD | Variable Frequency Drive |
| VT | Voltage Transformer |
| WRIM | Wound-Rotor Induction Motor |
| 3P OD_ES | Three-Pole Outdoor Disconnector with Earthing Switch |
References
- Siostrzonek, T.; Wójcik, J.; Dutka, M.; Siostrzonek, W. Impact of power quality on the efficiency of the mining process. Energies 2024, 17, 5675. [Google Scholar] [CrossRef] [Scilit]
- Aramendia, E.; Brockway, P.E.; Taylor, P.G.; Norman, J. Global energy consumption of the mineral mining industry: Exploring the historical perspective and future pathways to 2060. Glob. Environ. Change 2023, 83, 102745. [Google Scholar] [CrossRef] [Scilit]
- Li, J.; Zhao, J.; Zhang, X. A Novel Energy Recovery System Integrating Flywheel and Flow Regeneration for a Hydraulic Excavator Boom System. Energies 2020, 13, 315. [Google Scholar] [CrossRef] [Scilit]
- Kawalec, W.; Suchorab, N.; Konieczna-Fuławka, M.; Król, R. Specific Energy Consumption of a Belt Conveyor System in a Continuous Surface Mine. Energies 2020, 13, 5214. [Google Scholar] [CrossRef] [Scilit]
- Popescu, F.G.; Pasculescu, D.; Marcu, M.D.; Pasculescu, V.M. Analysis of current and voltage harmonics introduced by the drive systems of a bucket wheel excavator. Min. Miner. Depos. 2020, 14, 40–46. [Google Scholar] [CrossRef] [Scilit]
- Bellan, D. Three-Phase Distortion Analysis Based on Space-Vector Locus Diagrams. WSEAS Trans. Power Syst. 2023, 18, 467–473. [Google Scholar] [CrossRef] [Scilit]
- Heydt, G.T. Identification of harmonic sources by a state estimation technique. IEEE Trans. Power Deliv. 1989, 4, 569–576. [Google Scholar] [CrossRef] [Scilit]
- Gudiño-Ochoa, A. Analysis of interharmonics generation in induction motors and their effects on performance. Energies 2023, 16, 5538. [Google Scholar] [CrossRef] [Scilit]
- Costa, M.C.; Fortes, M.Z.; Sotelo, G.G.; França, B.W. Thermal effects due to harmonics on dry-type transformers: Impact of filters and phase angles. Meas. Energy 2025, 6, 100045. [Google Scholar] [CrossRef] [Scilit]
- Rihar, A.; Nemec, M.; Lavrič, H.; Zajec, P.; Vončina, D.; Nedeljković, D.; Ambrožič, V.; Drobnič, K. Emerging technologies for advanced power electronics and machine design in electric drives. Appl. Sci. 2024, 14, 11559. [Google Scholar] [CrossRef] [Scilit]
- Ibrahim, M.; Nashed, M.N.F.; Eskander, M.N. Comparing Methods to Mitigate the Effect of Grid Voltage Sag and Frequency Variation on the Operation of Variable Speed Drives. WSEAS Trans. Power Syst. 2024, 19, 11–17. [Google Scholar] [CrossRef] [Scilit]
- Swamy, M.M.; Rossiter, S.L. Harmonic interaction between 1500-kVA supply transformer and VFD load at an industrial plant. IEEE Trans. Ind. Appl. 1998, 34, 897–903. [Google Scholar] [CrossRef] [Scilit]
- Zaro, F. Shunt Active Power Filter for Power Quality Improvement of Renewable Energy Systems: A Case Study. WSEAS Trans. Power Syst. 2023, 18, 241–247. [Google Scholar] [CrossRef] [Scilit]
- Giedraityte, A.; Rimkevicius, S.; Marciukaitis, M.; Radziukynas, V.; Bakas, R. Hybrid renewable energy systems—A review of optimization approaches and future challenges. Appl. Sci. 2025, 15, 1744. [Google Scholar] [CrossRef] [Scilit]
- Onaolapo, A.K.; Akindeji, K.T.; Adefarati, T.; Moloi, K. A Comprehensive Review of the Smart Microgrids’ Modeling and Control Methods for Sustainable Developments. WSEAS Trans. Power Syst. 2024, 19, 285–306. [Google Scholar] [CrossRef] [Scilit]
- Enemuo, M.; Ogunmodimu, O. Transitioning the mining sector: A review of renewable energy integration and decarbonization strategies. Appl. Energy 2025, 384, 125484. [Google Scholar] [CrossRef] [Scilit]
- Rojas Valdivia, L.; Peña, Á.; García Conejeros, J. AI-driven predictive maintenance in mining: A systematic literature review on fault detection, digital twins, and intelligent asset management. Appl. Sci. 2025, 15, 3337. [Google Scholar] [CrossRef] [Scilit]
- Pana, L.; Grabara, J.; Pasculescu, D.; Pasculescu, V.M.; Moraru, R.I. Optimal quality management algorithm for assessing the usage capacity level of mining transformers. Pol. J. Manag. Stud. 2018, 18, 233–244. [Google Scholar] [CrossRef] [Scilit]
- Andras, A.; Popescu, F.D.; Radu, S.M.; Pasculescu, D.; Brinas, I.; Radu, M.A.; Peagu, D. Numerical simulation and modeling of mechano–electro–thermal behavior of electrical contact using COMSOL multiphysics. Appl. Sci. 2024, 14, 4026. [Google Scholar] [CrossRef] [Scilit]
- Rezmerița, E.; Radu, S.M.; Călămar, A.-N.; Lorinț, C.; Florea, A.; Nicola, A. Urban Air Quality Monitoring in Decarbonization Context; Case Study—Traditional Coal Mining Area, Petroșani, Romania. Sustainability 2022, 14, 8165. [Google Scholar] [CrossRef] [Scilit]
- Lazar, M.; Faur, F.; Apostu, I.-M. Stability conditions in lignite open pits from Romania, case study: Oltețu open pit. Appl. Sci. 2022, 12, 9607. [Google Scholar] [CrossRef] [Scilit]
- Petrilean, D.C.; Fîță, N.D.; Vasilescu, G.D.; Ilieva-Obretenova, M.; Tataru, D.; Cruceru, E.A.; Mateiu, C.I.; Nicola, A.; Darabont, D.-C.; Cazac, A.-M.; et al. Sustainability Management Through the Assessment of Instability and Insecurity Risk Scenarios in Romania’s Energy Critical Infrastructures. Sustainability 2025, 17, 2932. [Google Scholar] [CrossRef] [Scilit]
- Nikologiannis, M.; Mozakis, I.; Iliadis, I.; Katsigiannis, Y. Financial Assessment of Microgrid’s Independence using RES and Hydrogen-Based Energy Storage. WSEAS Trans. Power Syst. 2024, 19, 307–321. [Google Scholar] [CrossRef] [Scilit]
- Zhao, Y.; Li, M.; Wang, Q. Optimal Design Method for Inner-Intrinsically Safe Buck-Boost Converters Based on Ignition Capability. Math. Probl. Eng. 2021, 2021, 6678566. [Google Scholar] [CrossRef] [Scilit]
- Pană, L.; Popescu, F.G.; Roșca, S.D. ATEX thermistor motor protection relays in on-board electrical installations. Ann. Univ. Petroșani Electr. Eng. 2024, 26, 107–114. [Google Scholar]
- Zaro, F. Power Quality Improvement Using Shunt Active Power Filter: An Industrial Zone Case Study. WSEAS Trans. Power Syst. 2023, 18, 179–185. [Google Scholar] [CrossRef] [Scilit]
- Illa, V.R.; Senapati, R.; Swain, S.C. Implementation of UPQC Alleviating Power Quality Issues in a Hybrid Grid Integrated System. WSEAS Trans. Power Syst. 2021, 16, 316–335. [Google Scholar] [CrossRef] [Scilit]
- Alahmad, A.; Kacar, F.; Uzunoglu, C.P.; Mastorakis, N. Enhancing Power Grid System Analysis with Medium Voltage Cascaded H-Bridge Motor Driver Dynamic Model. WSEAS Trans. Power Syst. 2023, 18, 460–466. [Google Scholar] [CrossRef] [Scilit]
- Konieczna-Fuławka, M. Energy-saving solutions applied in belt conveyors: A literature review. Energies 2025, 18, 3019. [Google Scholar] [CrossRef] [Scilit]
- Hernández-Mayoral, E.; Jiménez-Román, C.R.; Enriquez-Santiago, J.A.; López-López, A.; González-Domínguez, R.A.; Ramírez-Torres, J.A.; Rodríguez-Romero, J.D.; Jaramillo, O.A. Power quality analysis of a microgrid-based on renewable energy sources: A simulation-based approach. Computation 2024, 12, 226. [Google Scholar] [CrossRef] [Scilit]
- Parvizi, P.; Jalilian, M.; Amidi, A.M.; Zangeneh, M.R.; Riba, J.R. Technical losses in power networks: Mechanisms, mitigation strategies, and future directions. Electronics 2025, 14, 3442. [Google Scholar] [CrossRef] [Scilit]
- Bogdanffy, L.; Lorinț, C.R.; Nicola, A. Development of a Low-Cost Traffic and Air Quality Monitoring Internet of Things (IoT) System for Sustainable Urban and Environmental Management. Sustainability 2025, 17, 5003. [Google Scholar] [CrossRef] [Scilit]
- Karpov, A.S.; Yaroshevich, V.V.; Gubskaya, E.I. Research on electrical energy parameters in the distribution system of a mining facility. Appl. Sci. 2025, 15, 11355. [Google Scholar] [CrossRef] [Scilit]
- IEC 61000-2-4:2024; Electromagnetic Compatibility (EMC)—Part 2–4: Environment—Compatibility Levels in Power Distribution Systems in Industrial Locations for Low-Frequency Conducted Disturbances. International Electrotechnical Commission: Geneva, Switzerland, 2024.
- IEC TR 61000-3-6:2008; Electromagnetic Compatibility (EMC)—Part 3–6: Limits—Assessment of Emission Limits for the Connection of Distorting Installations to MV, HV and EHV Power Systems. International Electrotechnical Commission: Geneva, Switzerland, 2008.
- IEC 61000-4-30; Electromagnetic Compatibility (EMC)–Part 4–30: Power Quality Measurement Methods. IEC: Geneva, Switzerland, 2015.
- IEC 61000-4-7; Electromagnetic Compatibility (EMC)–Part 4–7: General Guide on Harmonics and Interharmonics Measurements and Instrumentation. IEC: Geneva, Switzerland, 2002.
- IEC 61800-3; Adjustable Speed Electrical Power Drive Systems–Part 3: EMC Requirements and Specific Test Methods. IEC: Geneva, Switzerland, 2017.
- EN 50160; Voltage Characteristics of Electricity Supplied by Public Distribution Networks. CENELEC: Brussels, Belgium, 2010.
- Pasculescu, V.M.; Radu, S.M.; Pasculescu, D.; Niculescu, T. Dimensioning the Intrinsic Safety Barriers of Electrical Equipment Intended to Be Used in Potentially Explosive Atmospheres Using the SimPowerSystems Software Package. In Proceedings of the SGEM 2013, Albena, Bulgaria, 16–22 June 2013; Volume 1, pp. 417–422. [Google Scholar] [CrossRef] [Scilit]
- Andraș, A.; Brînaș, I.; Radu, S.M.; Popescu, F.D.; Popescu, V.; Budilică (Andrei), D.I. Investigation of the thermal behavior for the disc-pad assembly of a mine hoist brake using COMSOL multiphysics. Acta Tech. Napoc. Ser. Appl. Math. Mech. Eng. 2021, 64, 227–234. [Google Scholar]
- Liu, K.; Mei, B.; Li, Q.; Sun, S.; Zhang, Q. Collaborative Production Planning Based on an Intelligent Unmanned Mining System for Open-Pit Mines in the Industry 4.0 Era. Machines 2024, 12, 419. [Google Scholar] [CrossRef] [Scilit]
- Jurdziak, L.; Bajda, M. Balancing Load and Speed: A New Approach to Reducing Energy Use in Coal Conveyor Systems. Energies 2025, 18, 4716. [Google Scholar] [CrossRef] [Scilit]
- Rzazade, U.; Deryabin, S.; Temkin, I.; Agabubaev, A. Stochastic Frontier-Based Analysis of Energy Efficiency in Russian Open-Pit Mining Enterprises. Energies 2025, 18, 3257. [Google Scholar] [CrossRef] [Scilit]
- Onaolapo, A.K.; Abe, B.T. An Extensive Assessment of the Energy Management and Design of Battery Energy Storage in Renewable Energy Systems. WSEAS Trans. Power Syst. 2024, 19, 146–170. [Google Scholar] [CrossRef] [Scilit]
- SolarPower Europe. European Market Outlook for Battery Storage 2025–2029; SolarPower Europe: Brussels, Belgium, 2025. [Google Scholar]
- Ghahramani, M.; Habibi, D.; Ghamari, S.; Aziz, A. Addressing Uncertainty in Renewable Energy Integration for Western Australia’s Mining Sector: A Robust Optimization Approach. Energies 2024, 17, 5679. [Google Scholar] [CrossRef] [Scilit]
- Andraș, A.; Radu, S.M.; Brînaș, I.; Popescu, F.D.; Budilică, D.I.; Korozsi, E.B. Prediction of material failure time for a bucket wheel excavator boom using computer simulation. Materials 2021, 14, 7897. [Google Scholar] [CrossRef] [Scilit]
- EN 61326-1:2013; Electrical Equipment for Measurement, Control and Laboratory Use—EMC Requirements—Part 1: General Requirements. CENELEC: Brussels, Belgium, 2013.
- Hioki E.E. Corporation. 3197 Power Quality Analyzer: Instruction Manual, Revised ed. 7; Hioki E.E. Corporation: Nagano, Japan, 2012. [Google Scholar]
- Pană, L.; Dragomir, E.; Chiriac, A. Automatic sequential operations of three-phase electrical induction motors—Power, control, command and wiring circuits. Sci. Bull. Nav. Acad. 2025, 28, 230–238. [Google Scholar] [CrossRef] [Scilit]
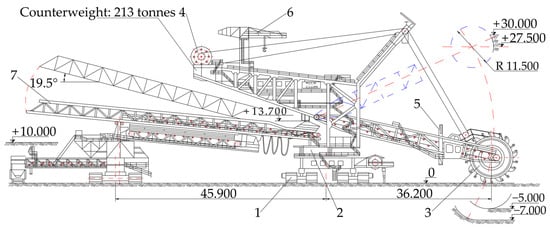
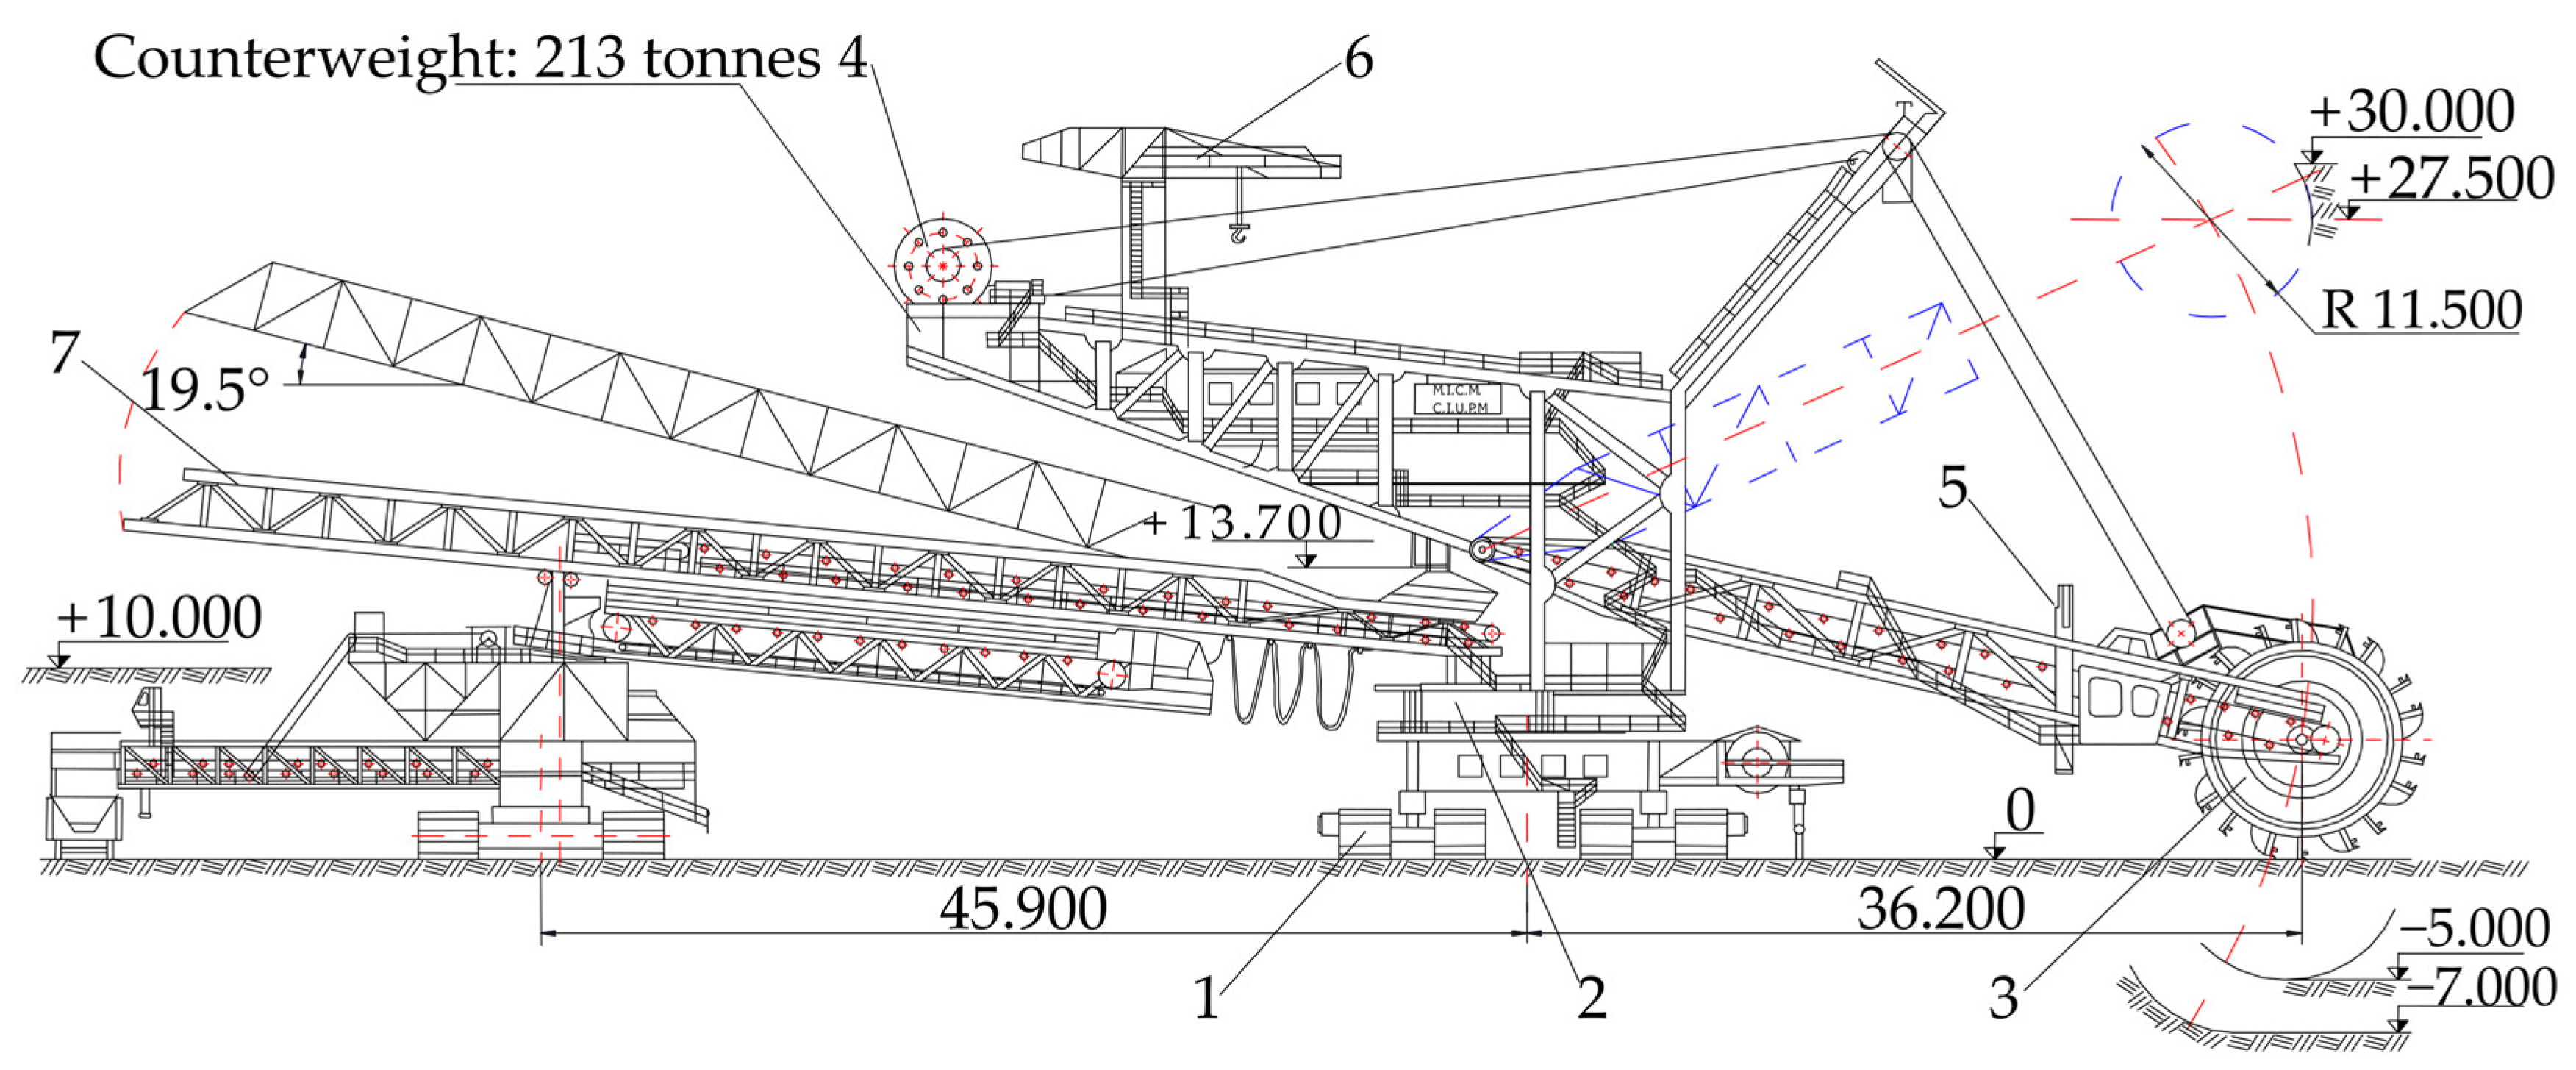
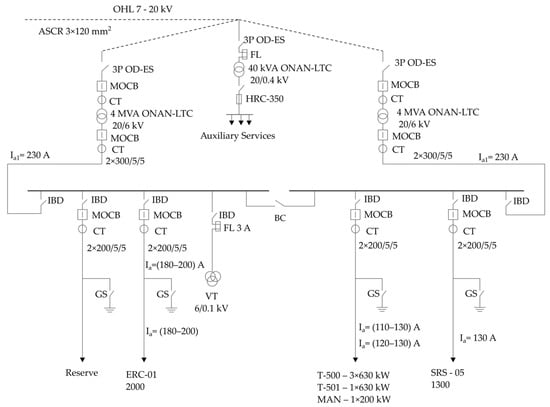
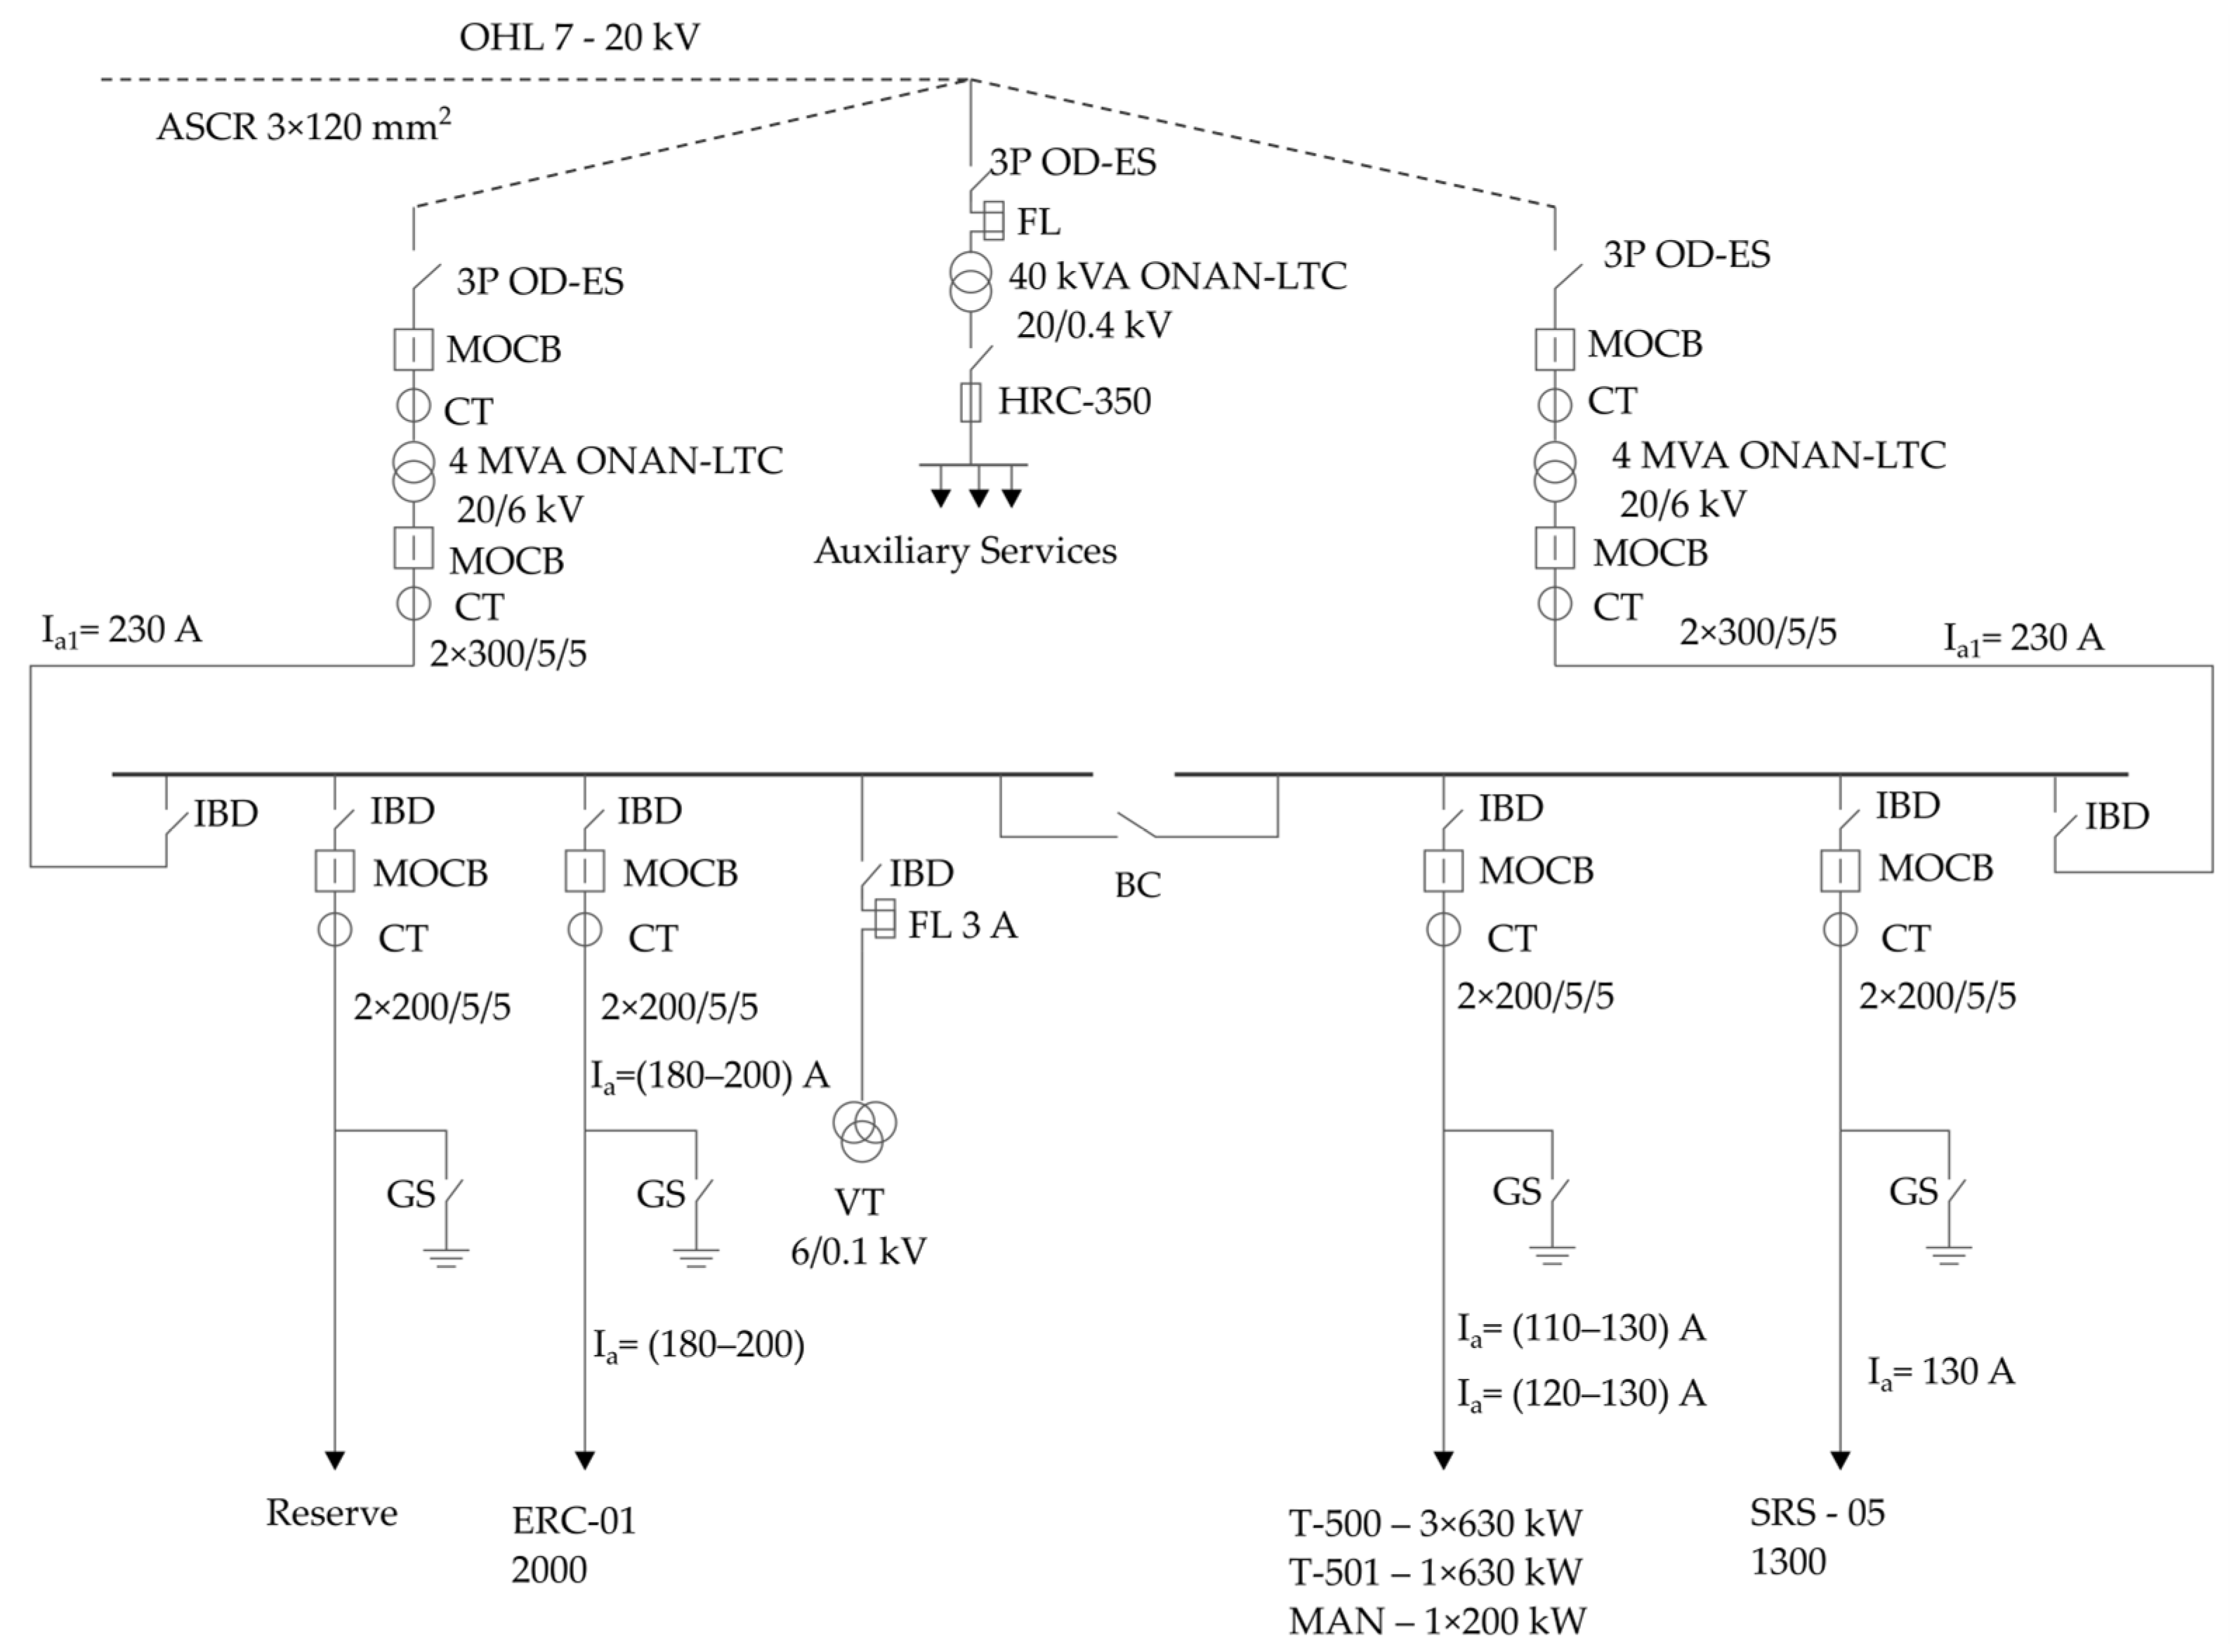
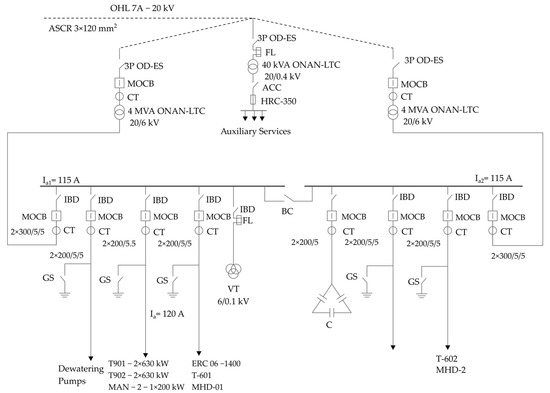
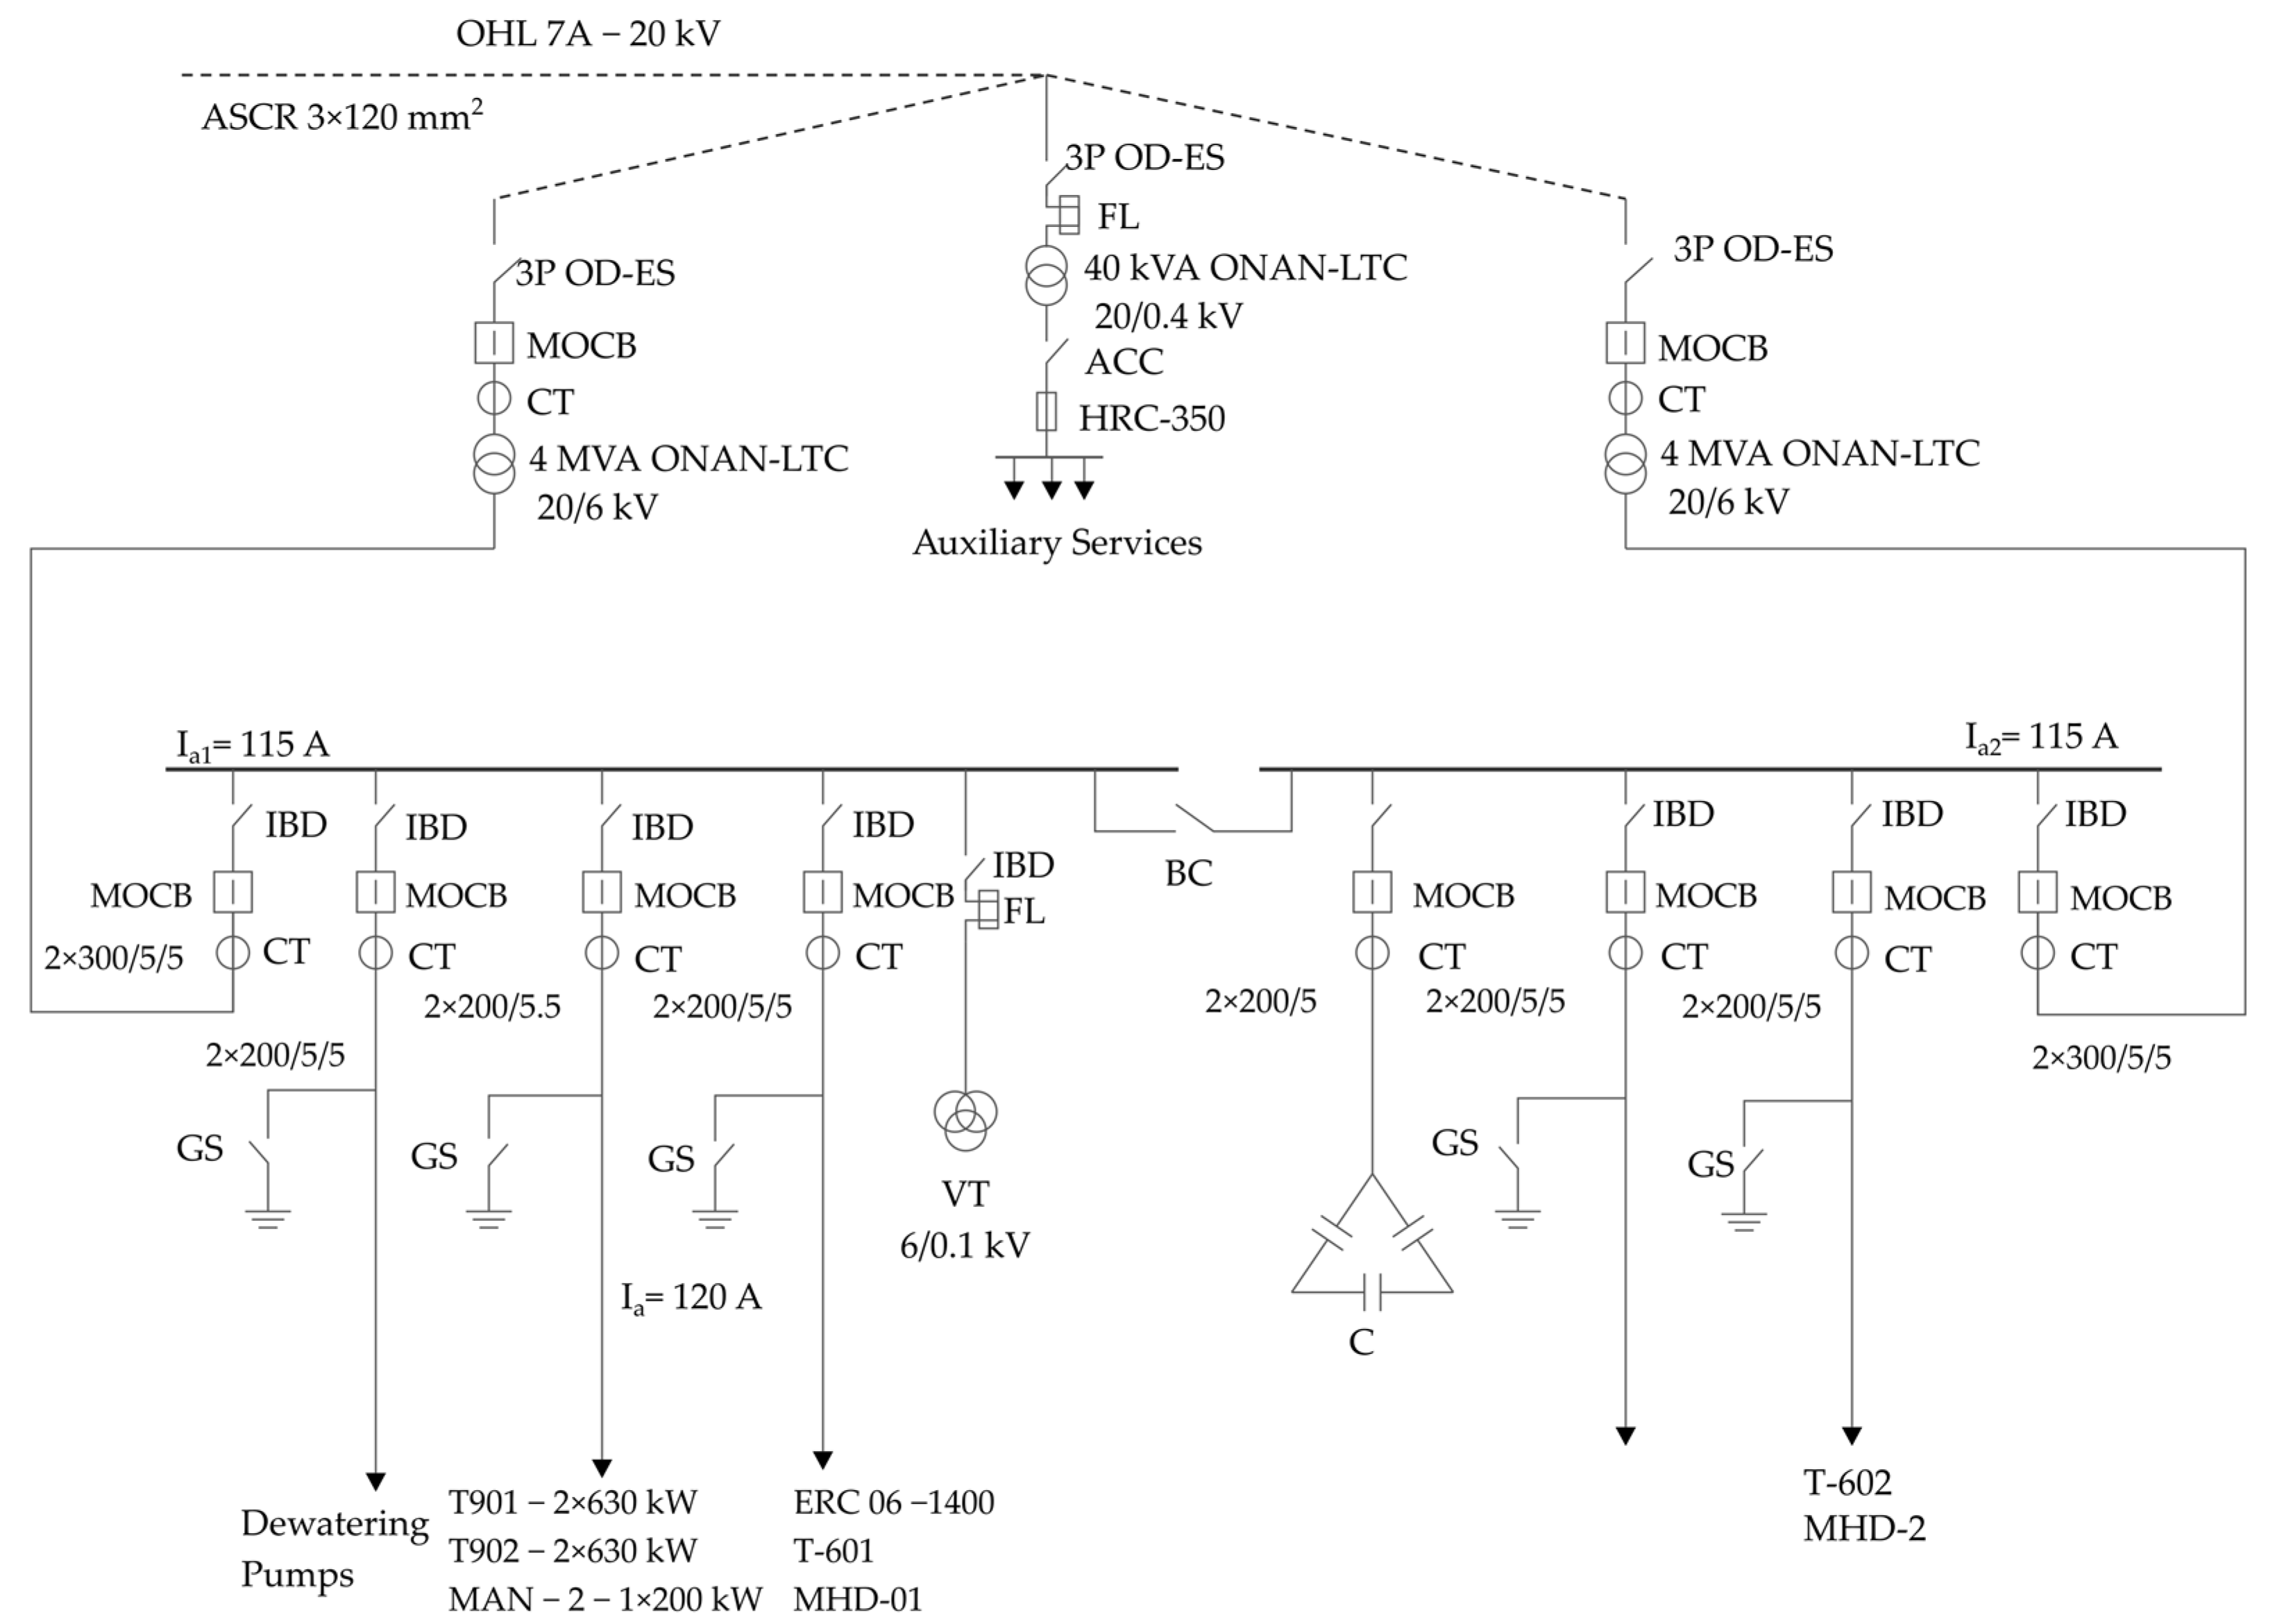
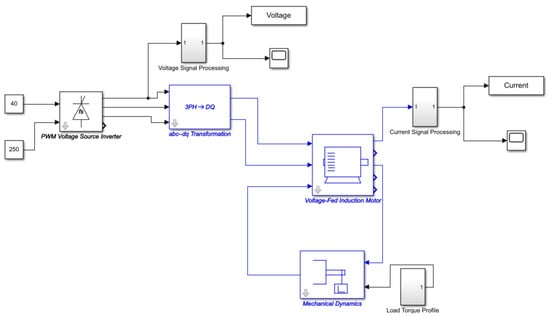
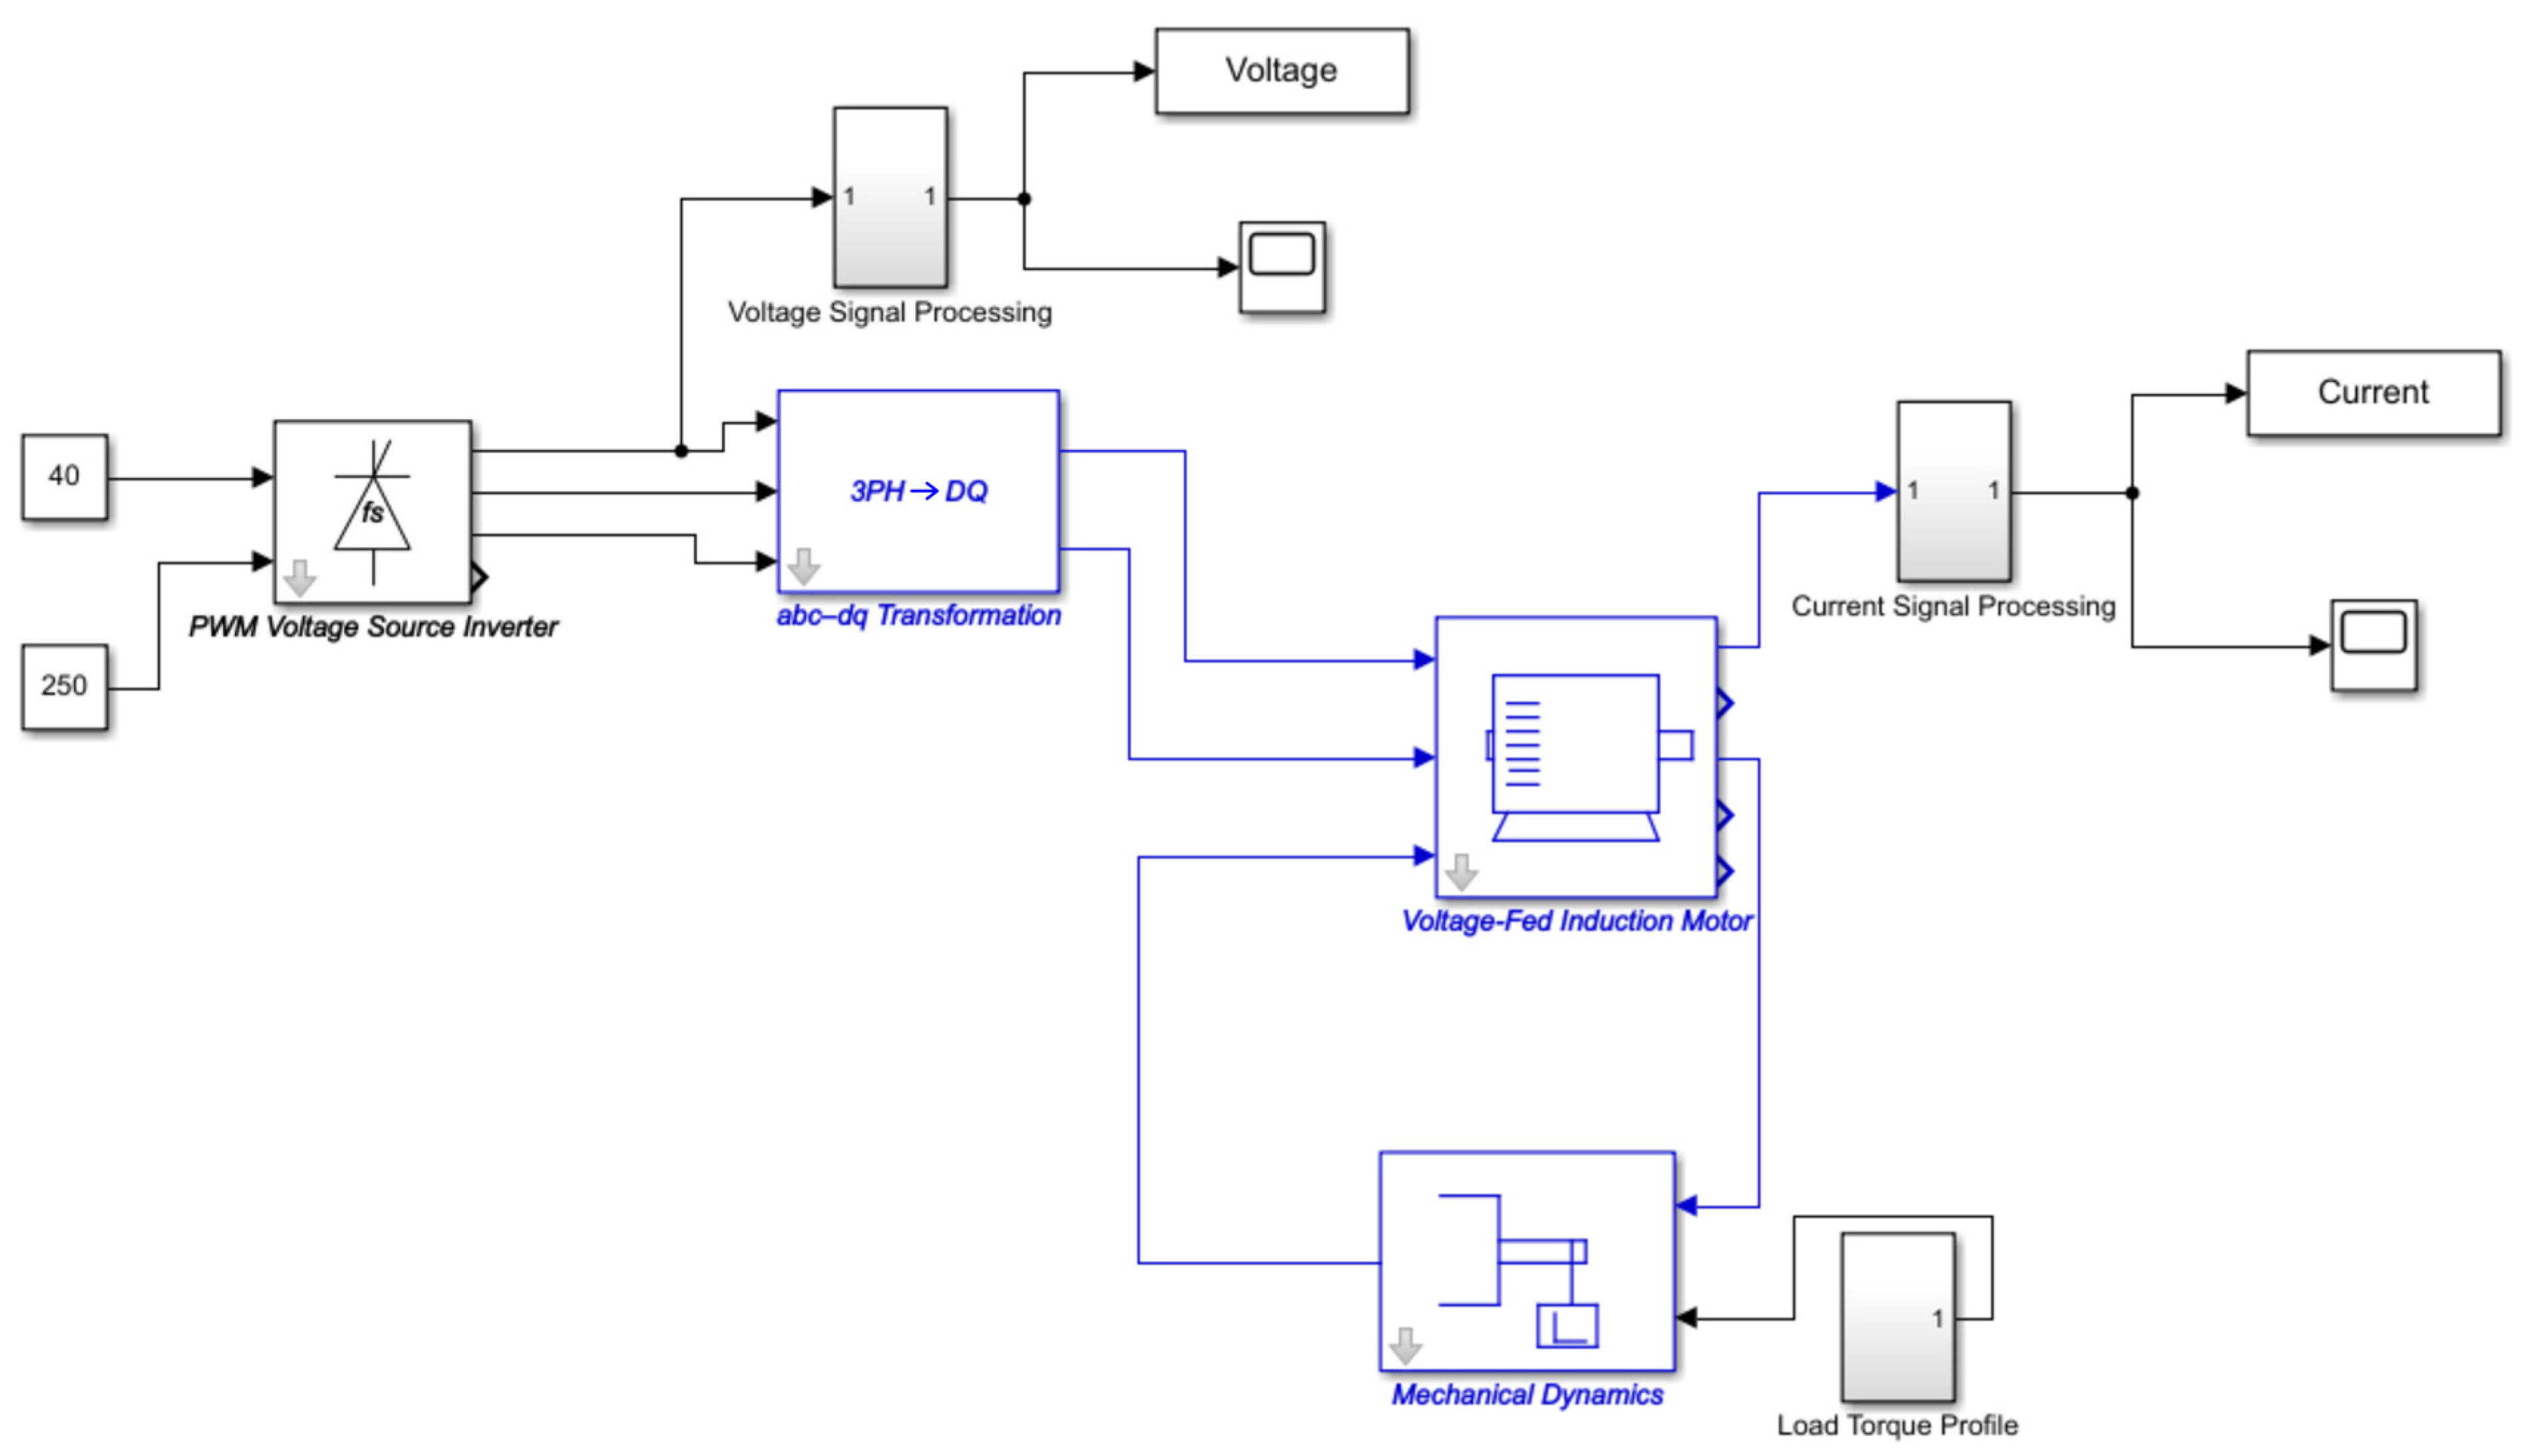
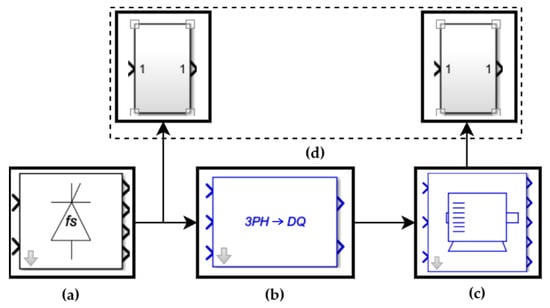
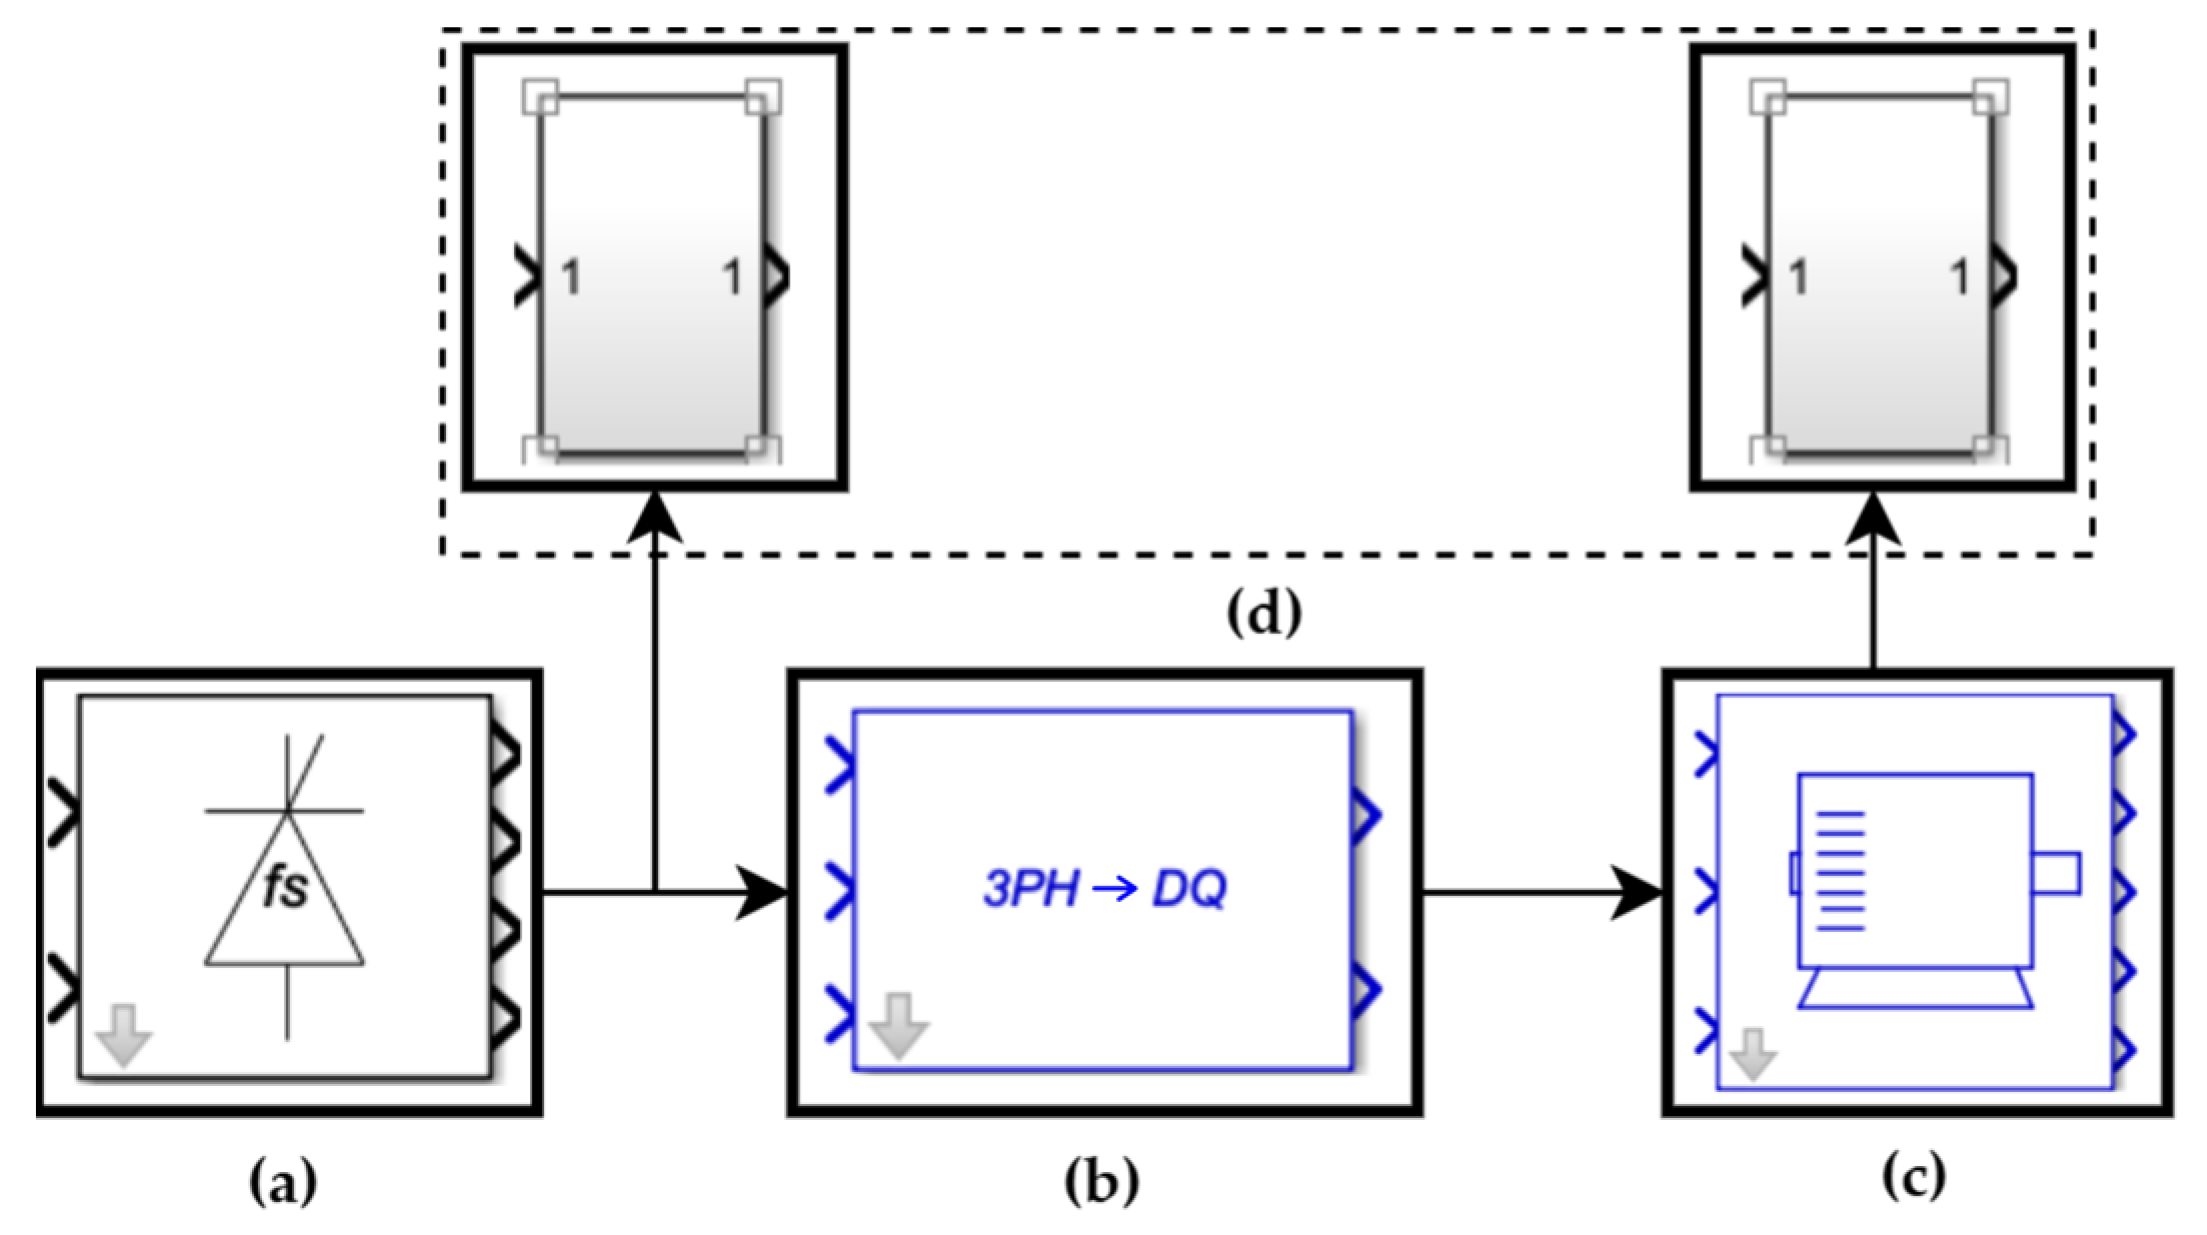
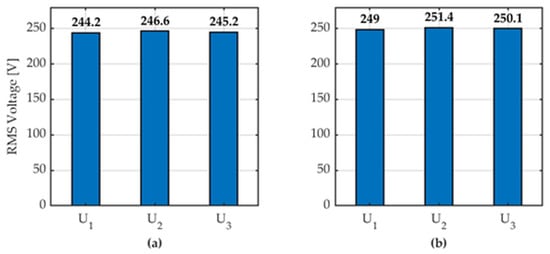
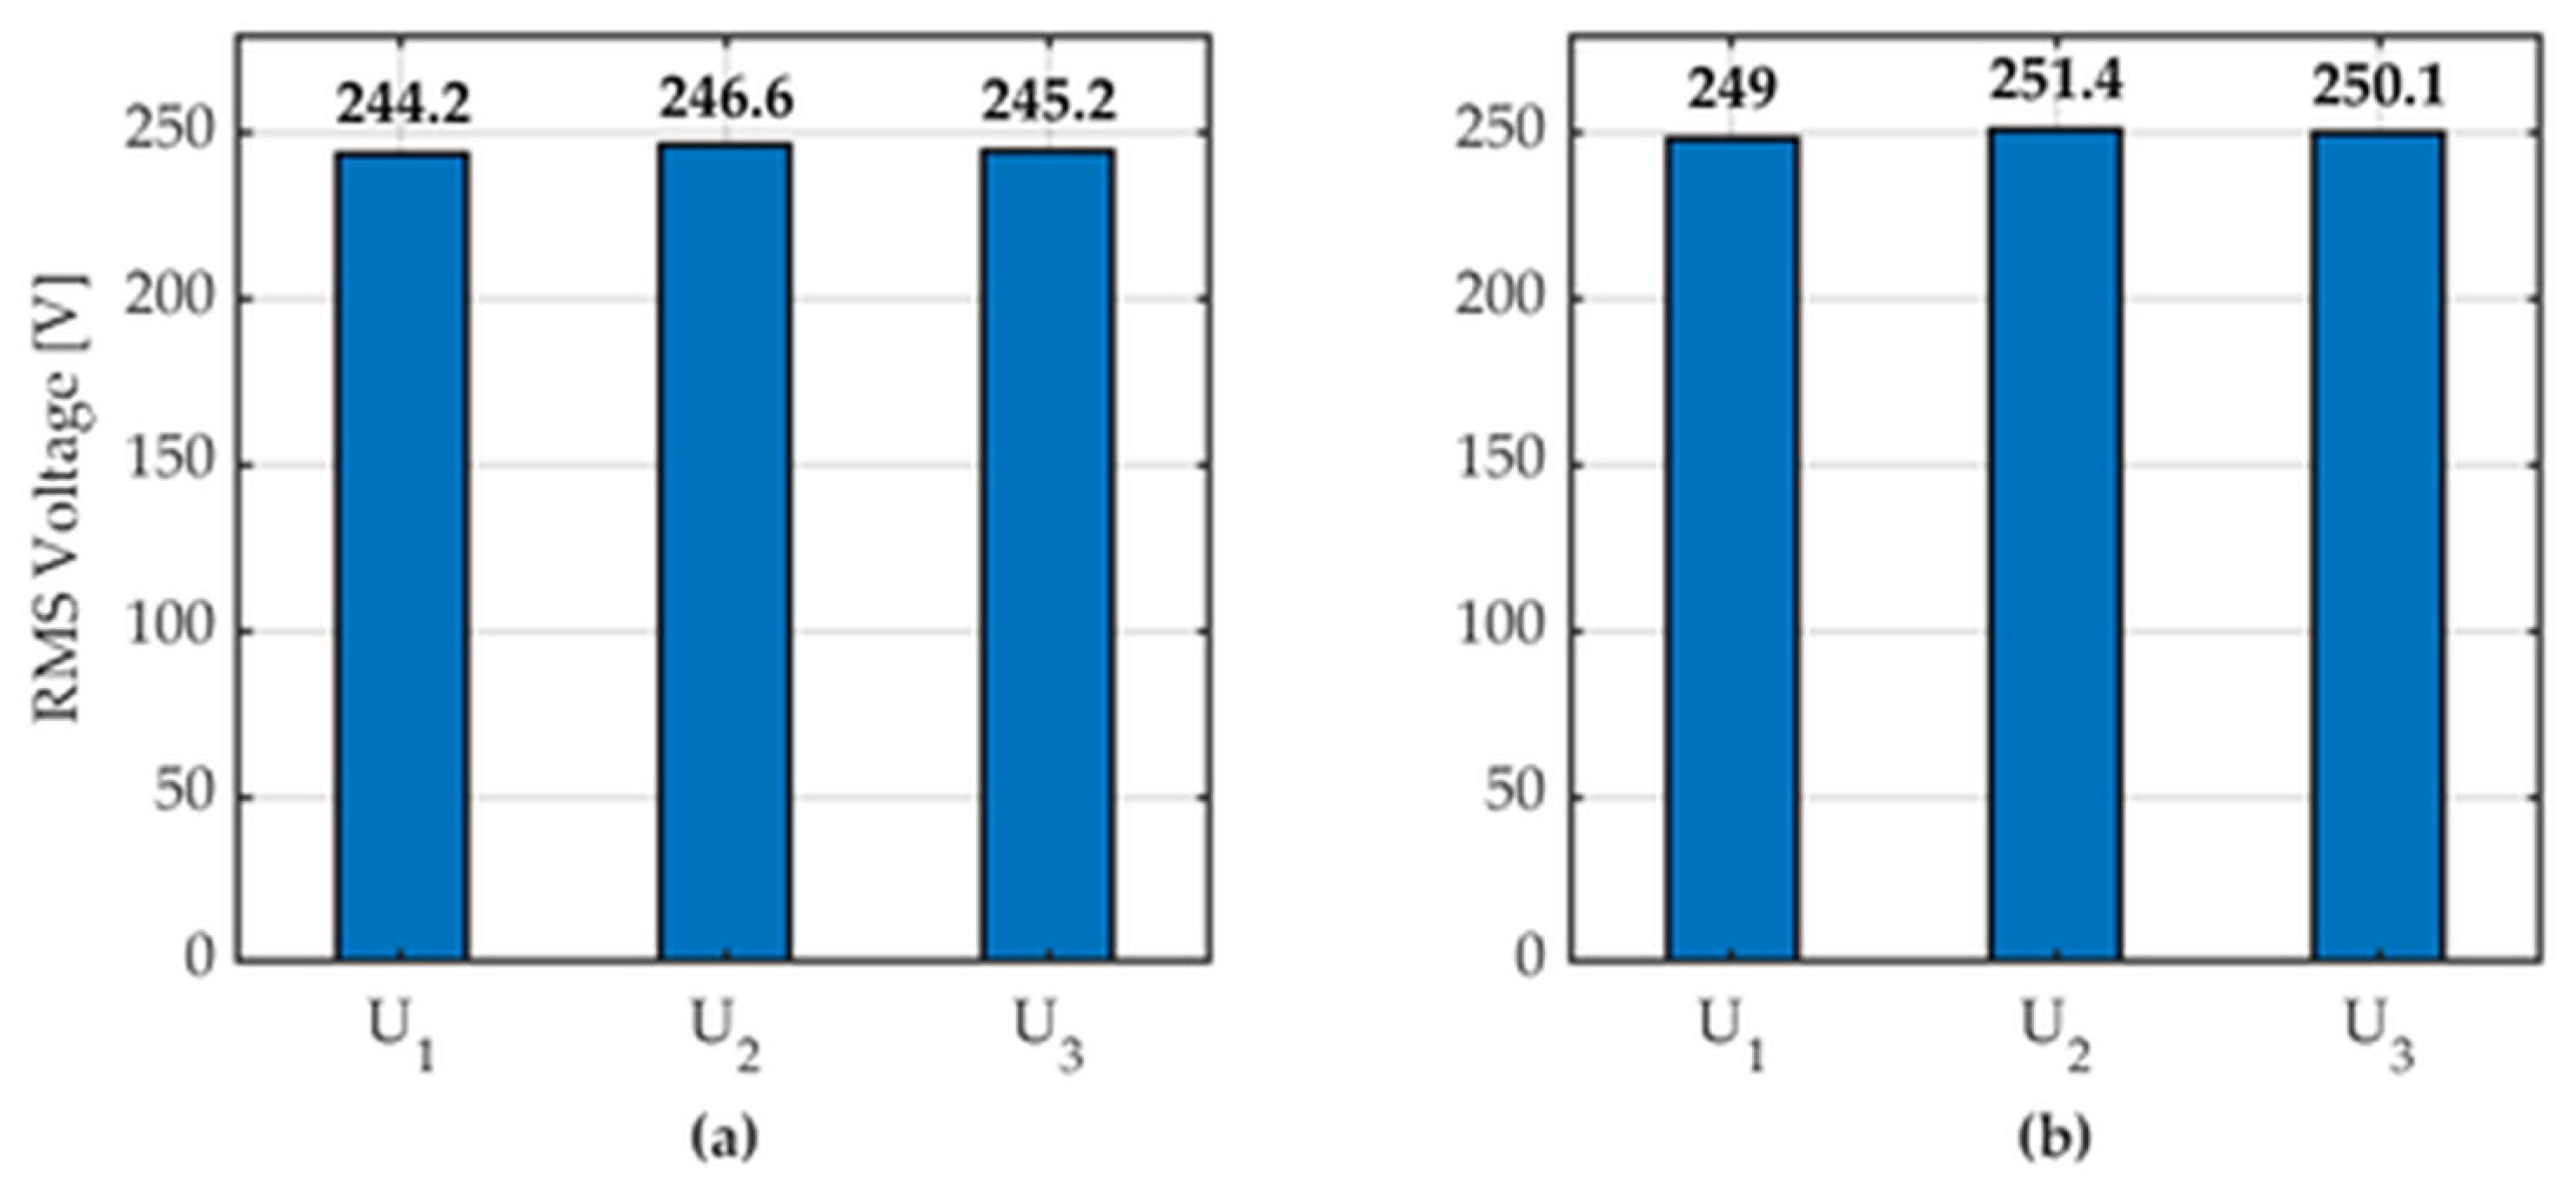
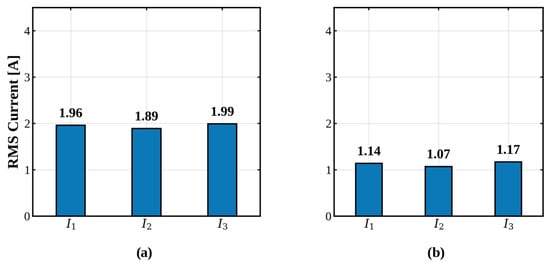
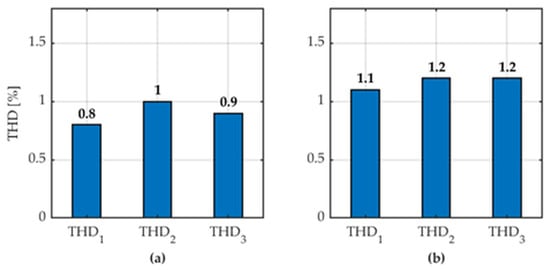
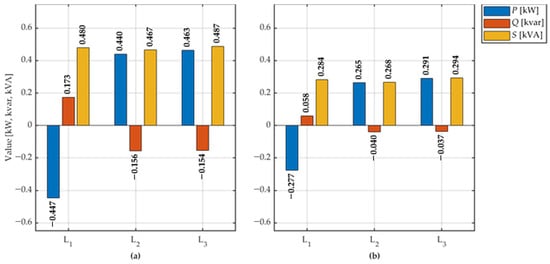
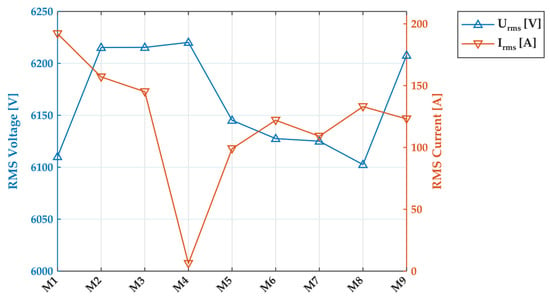
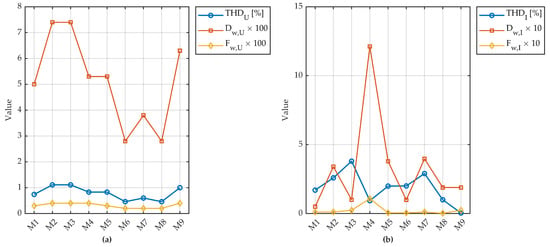
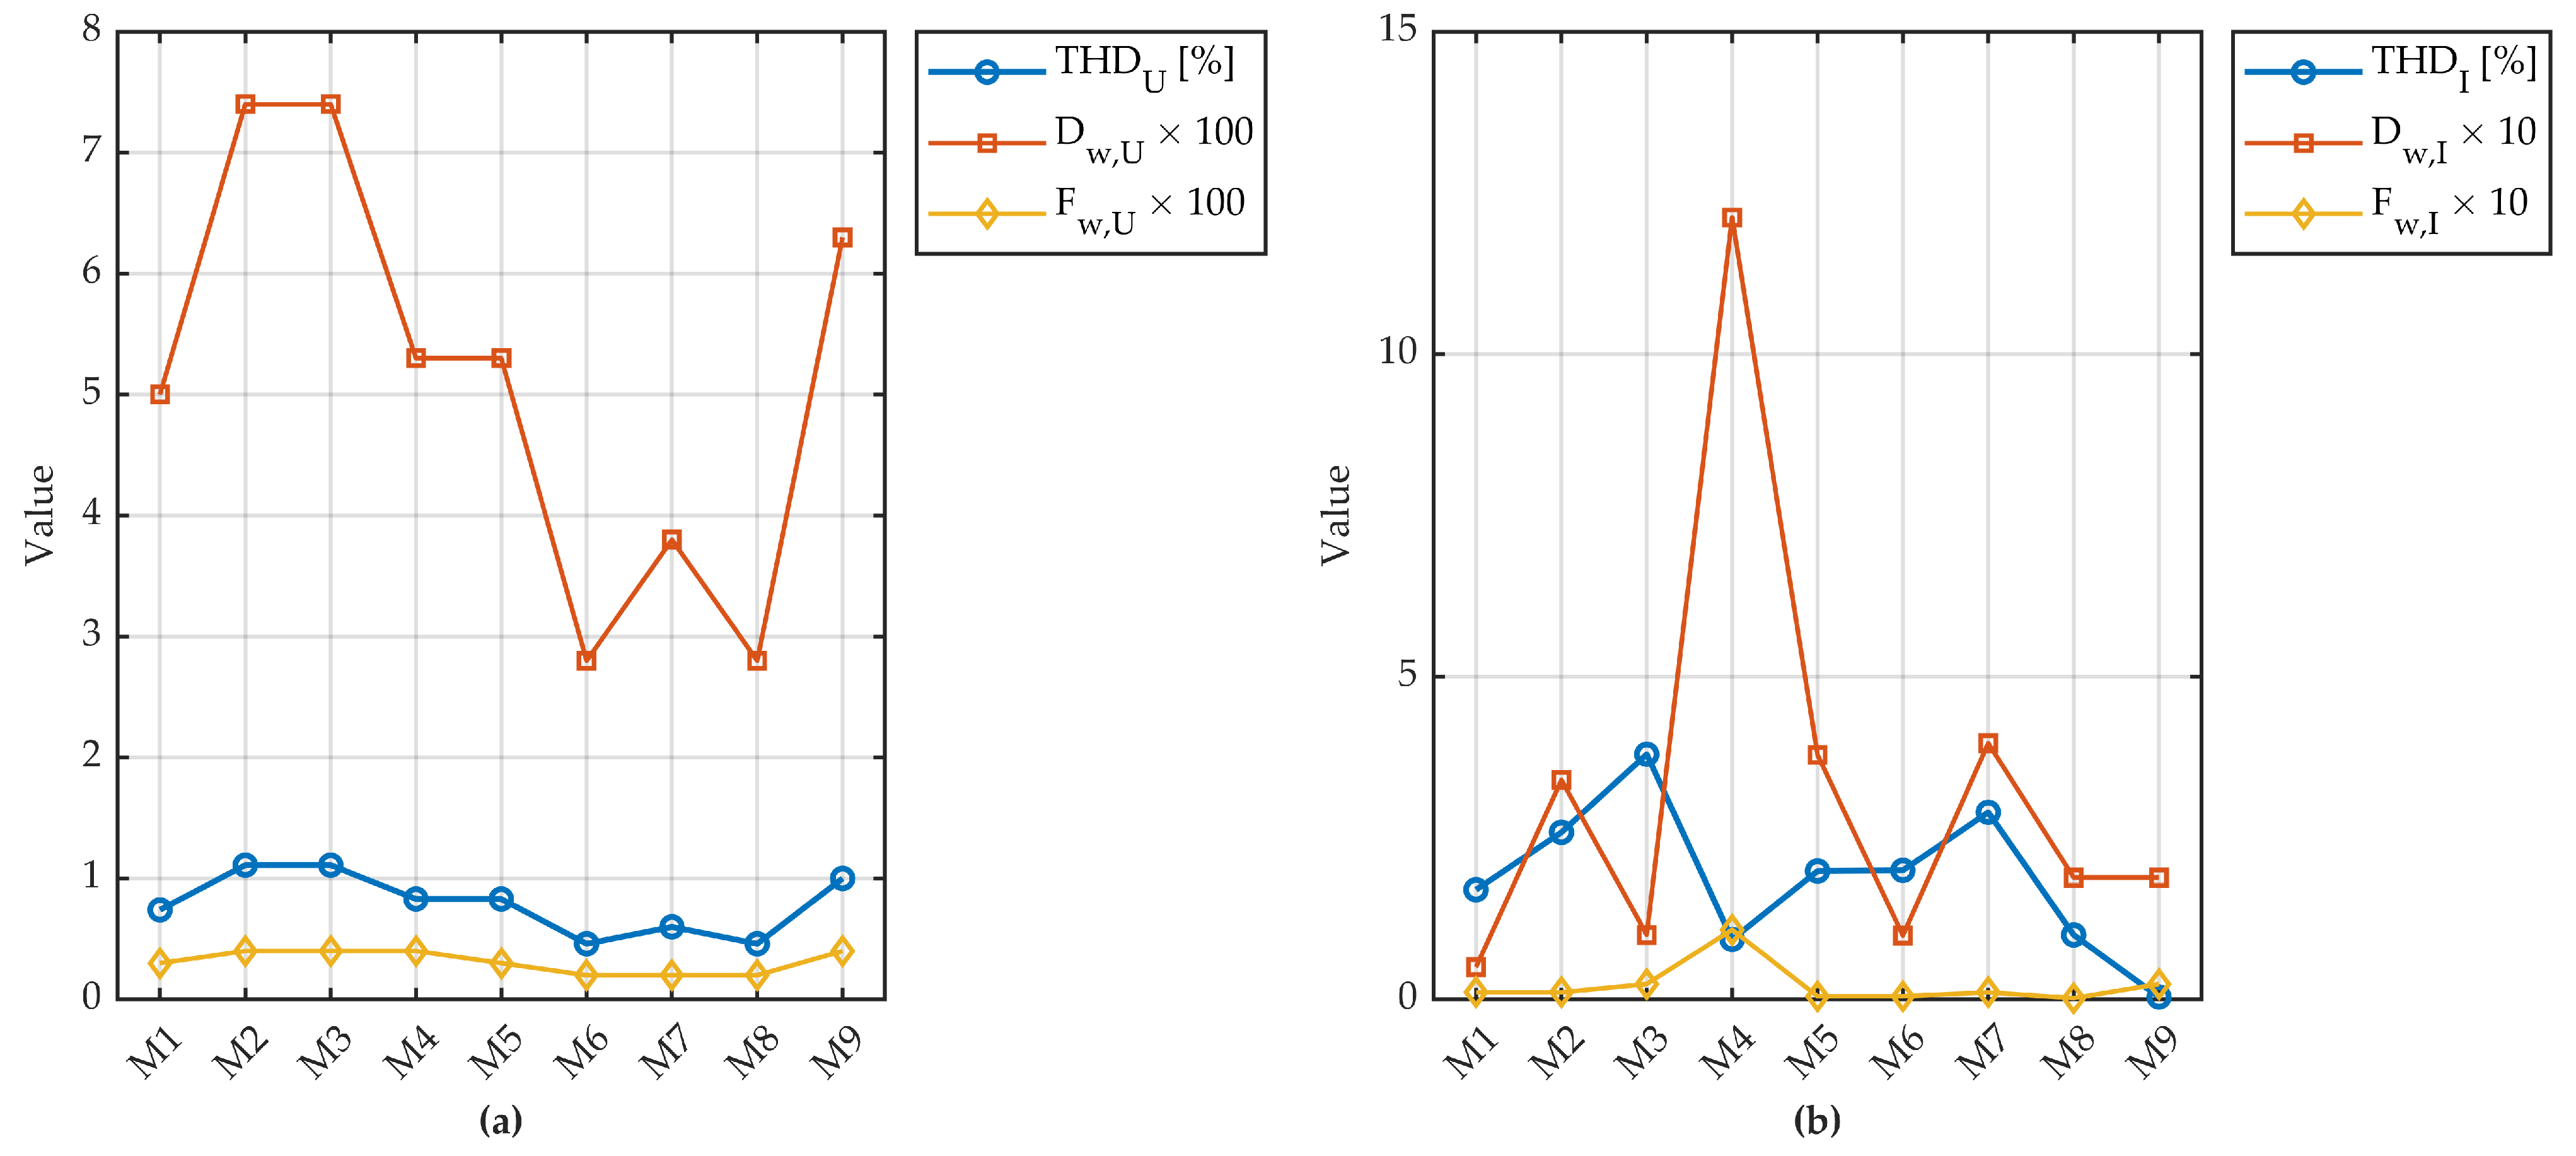
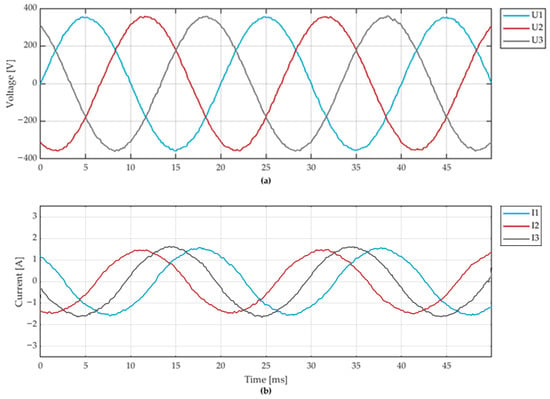
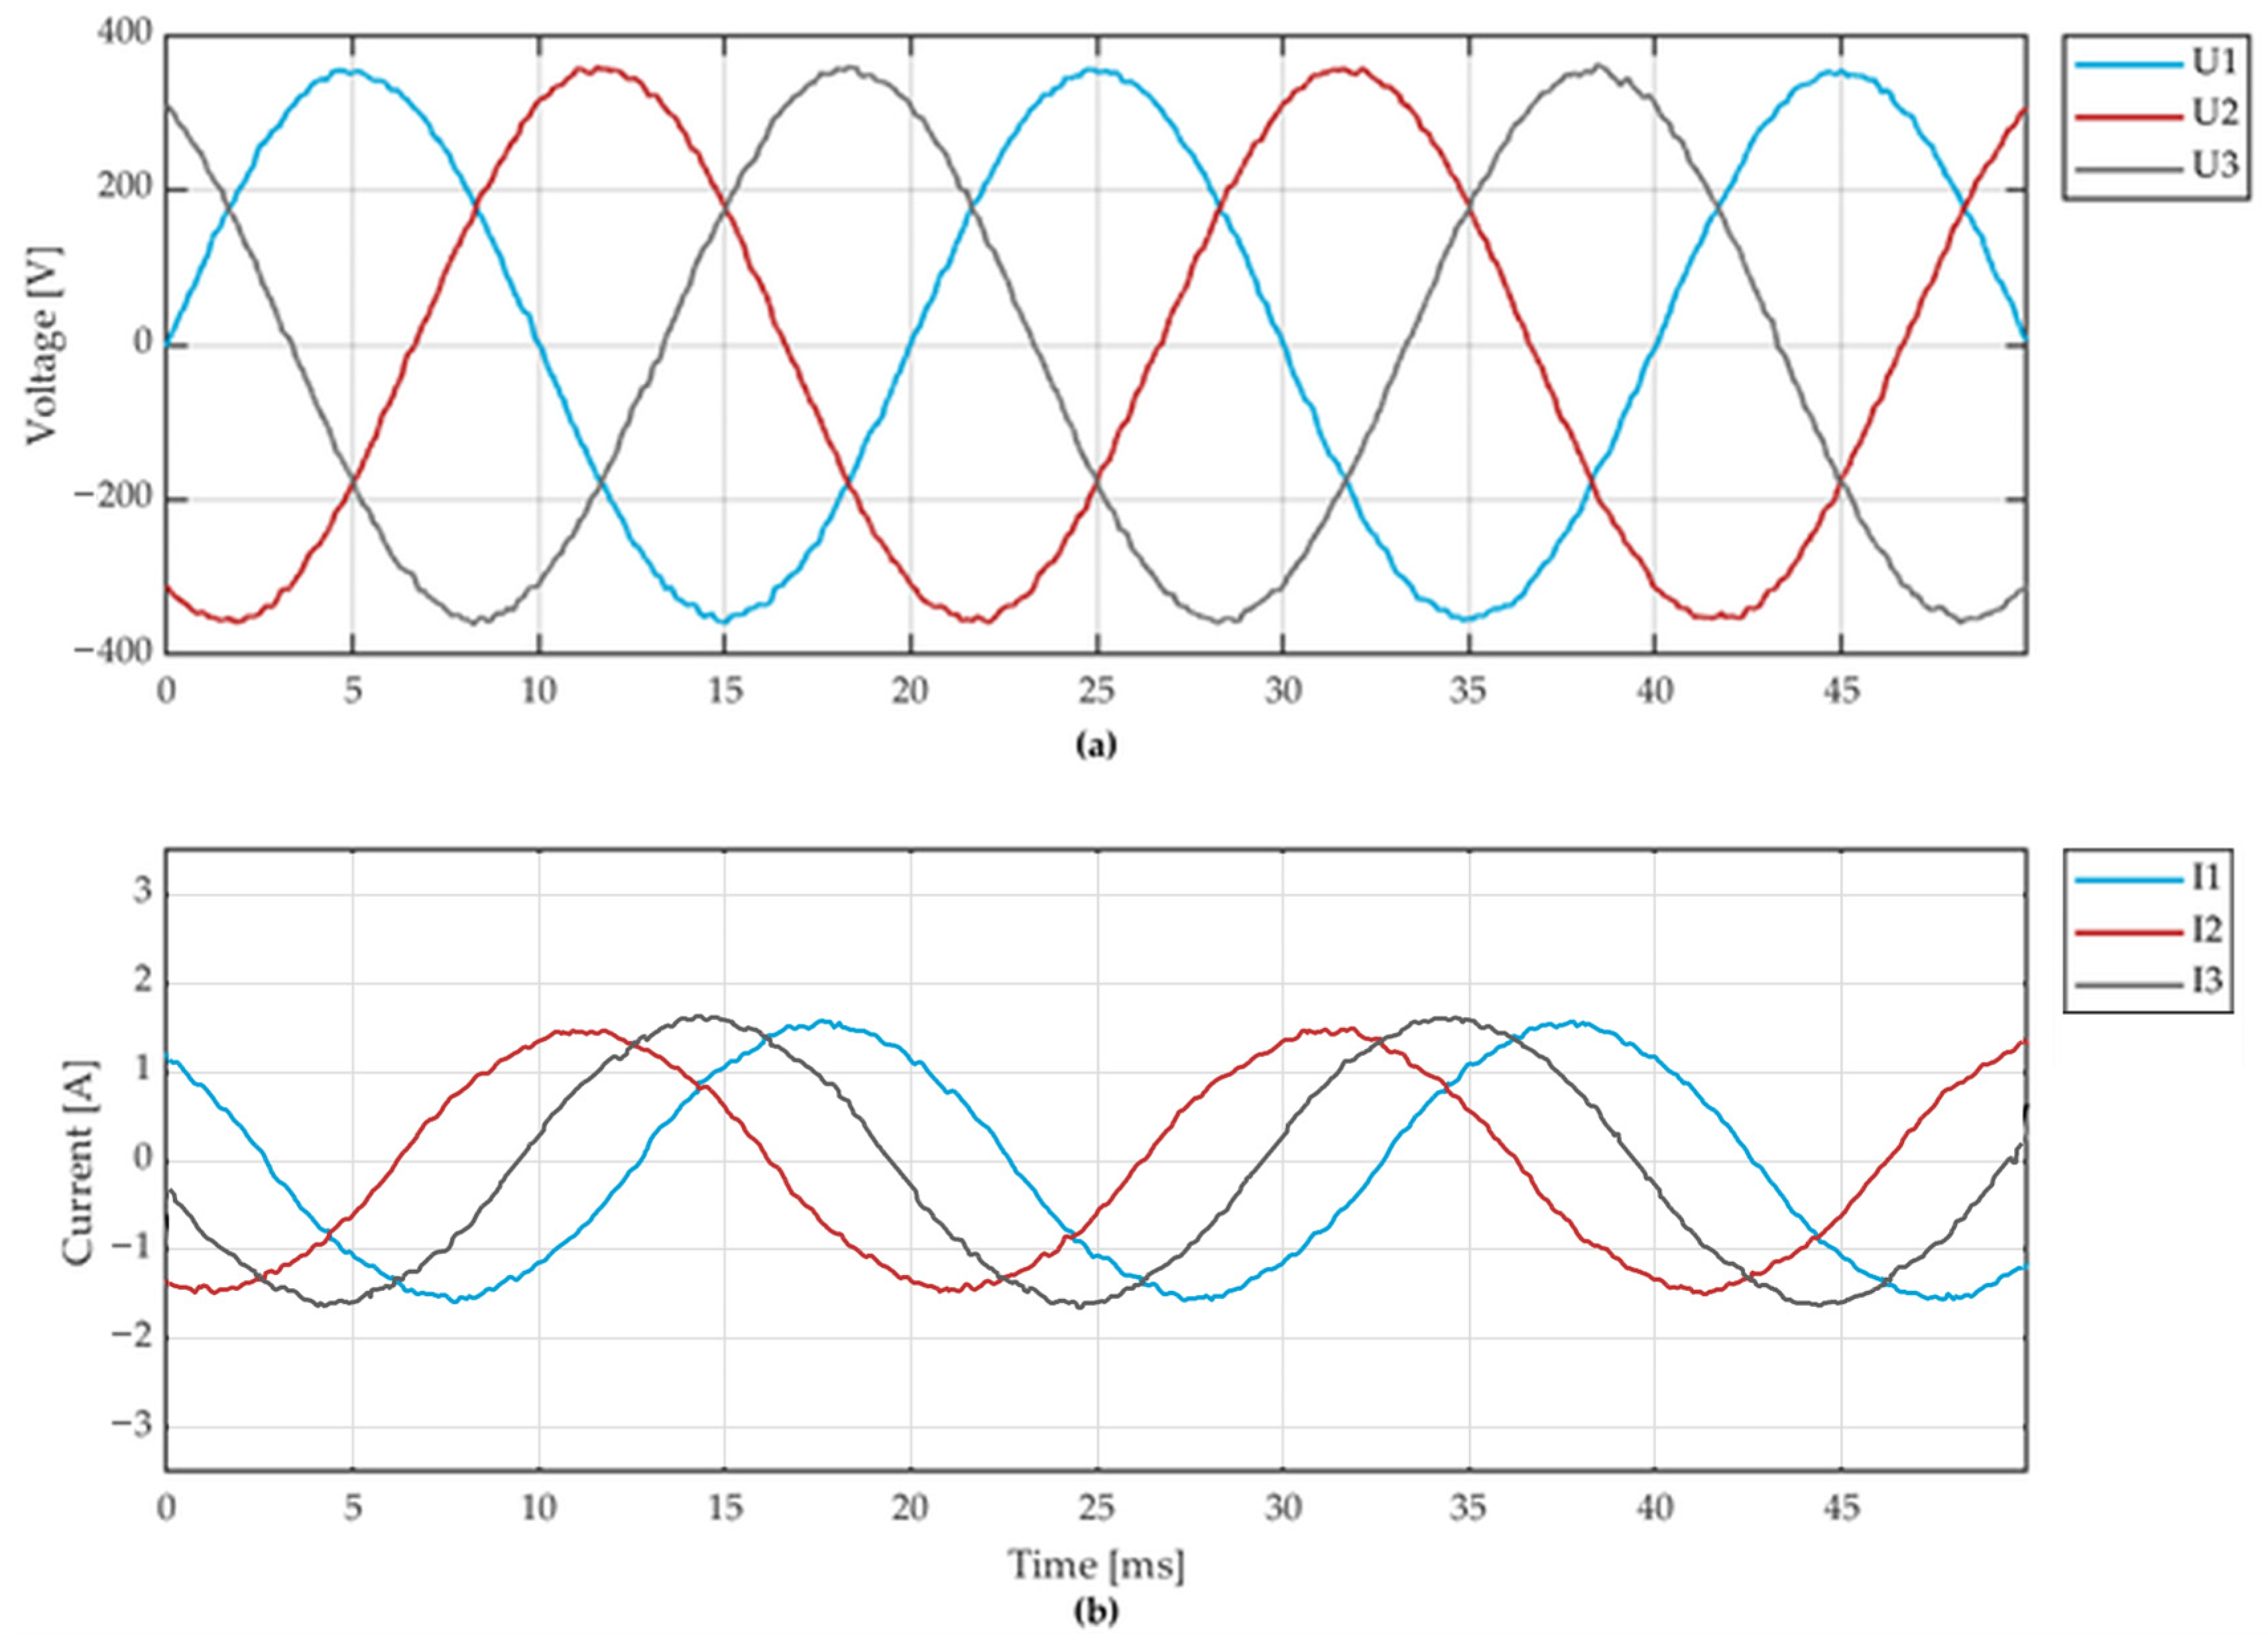
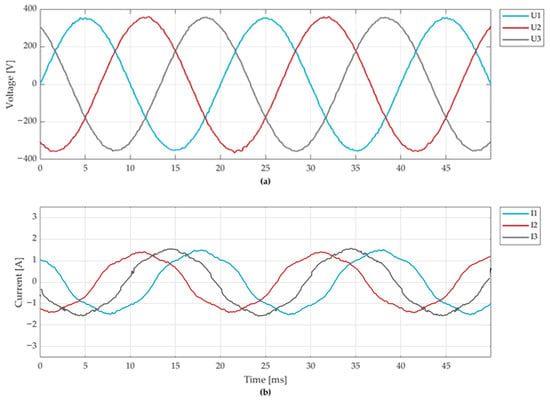
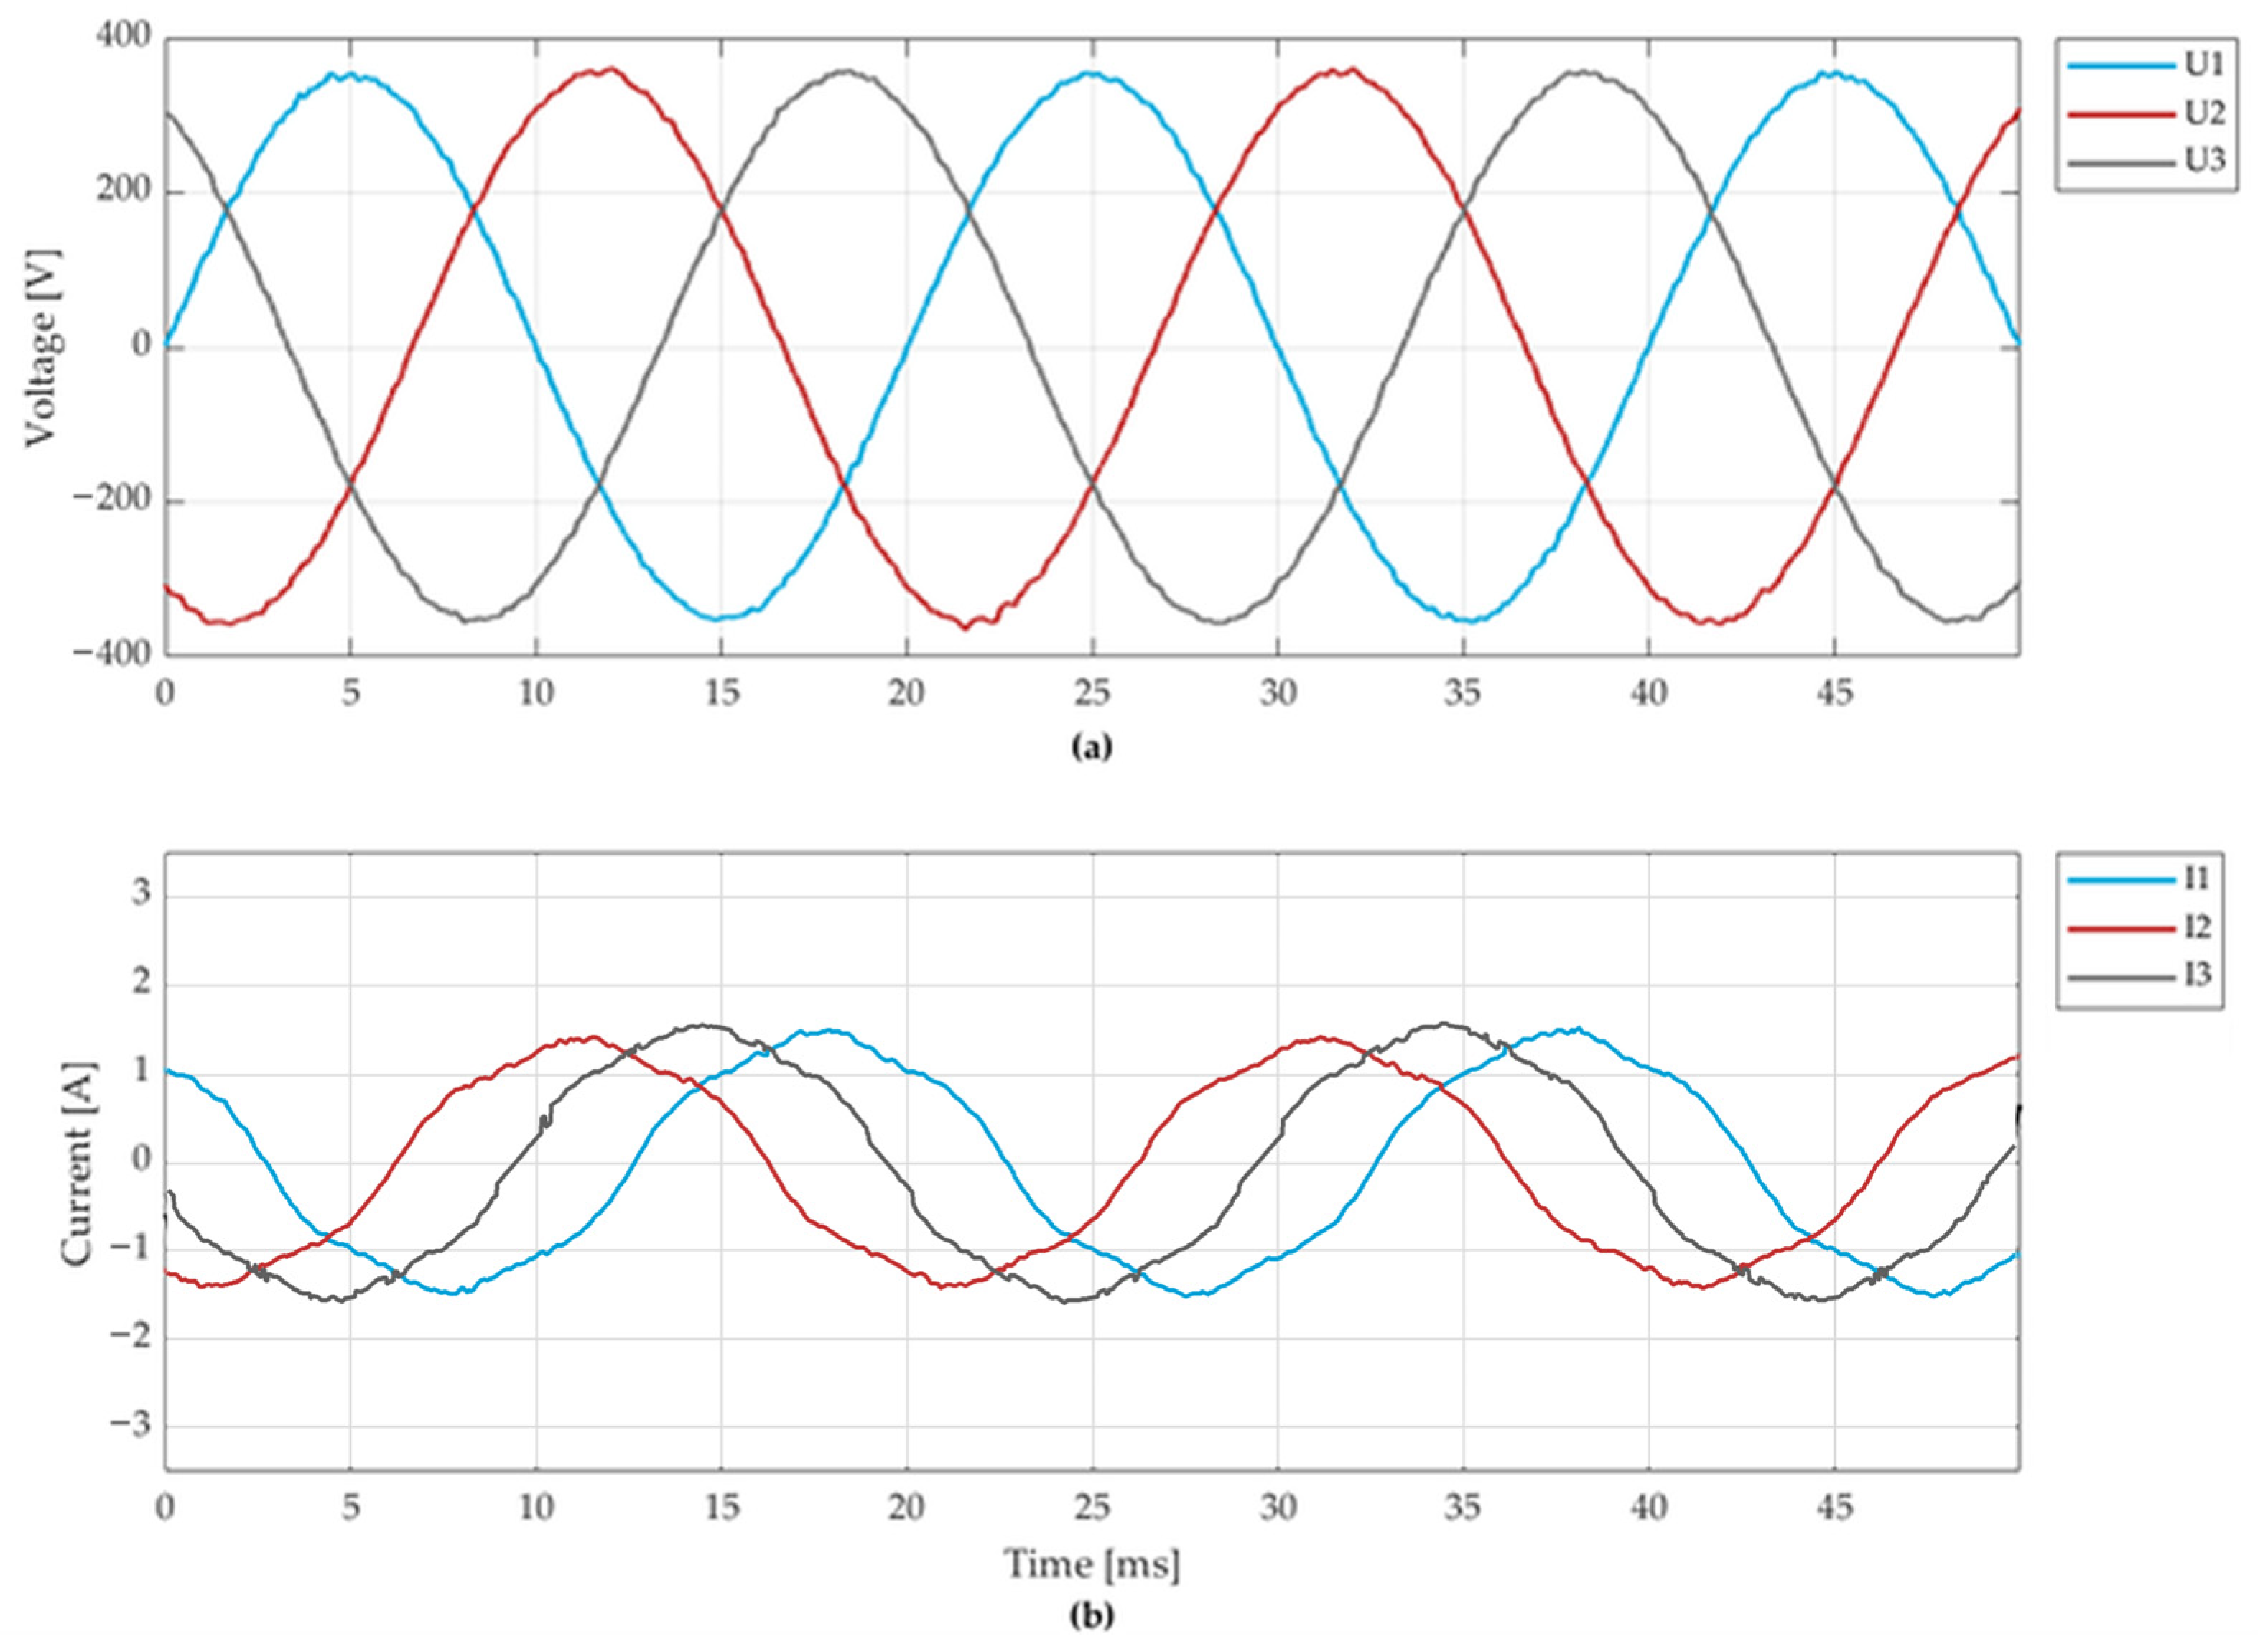
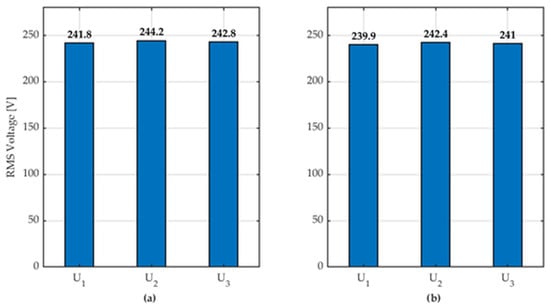
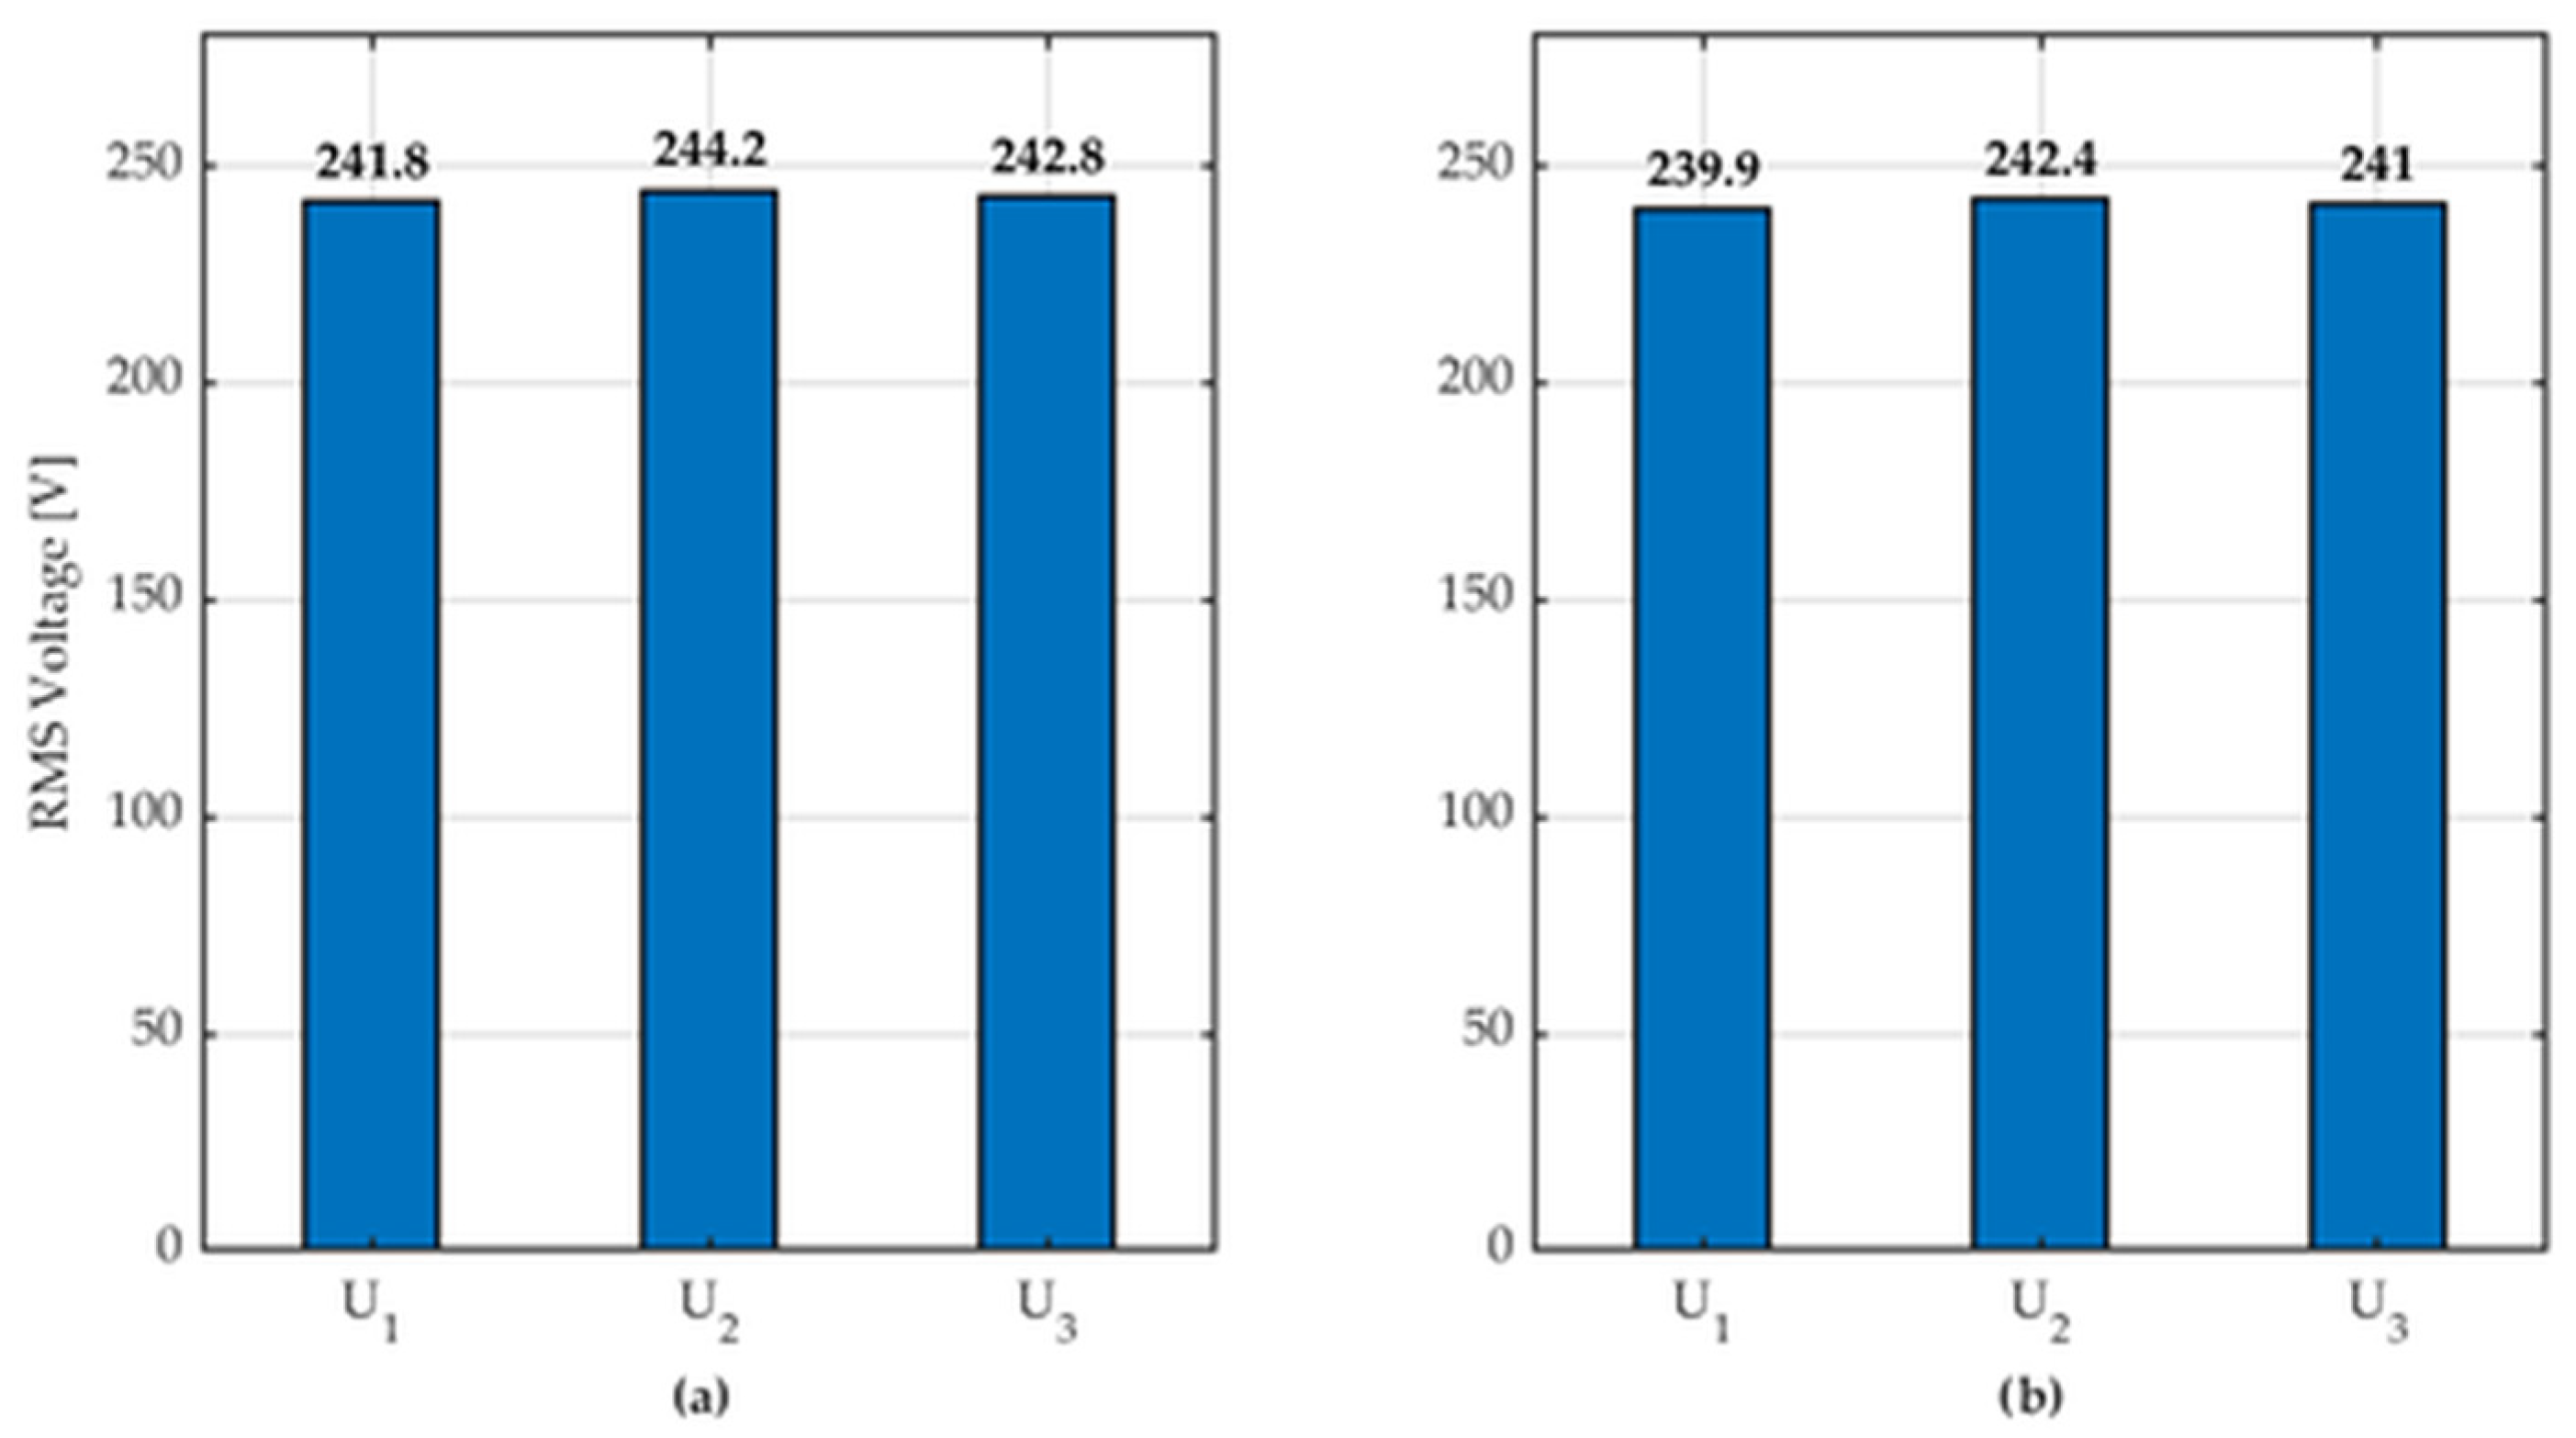
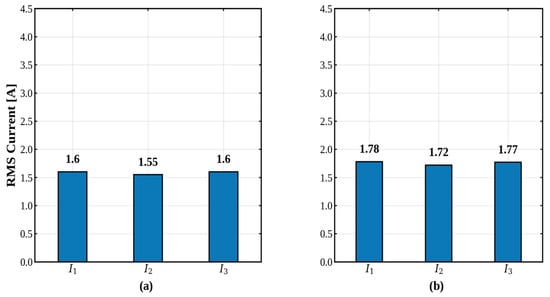
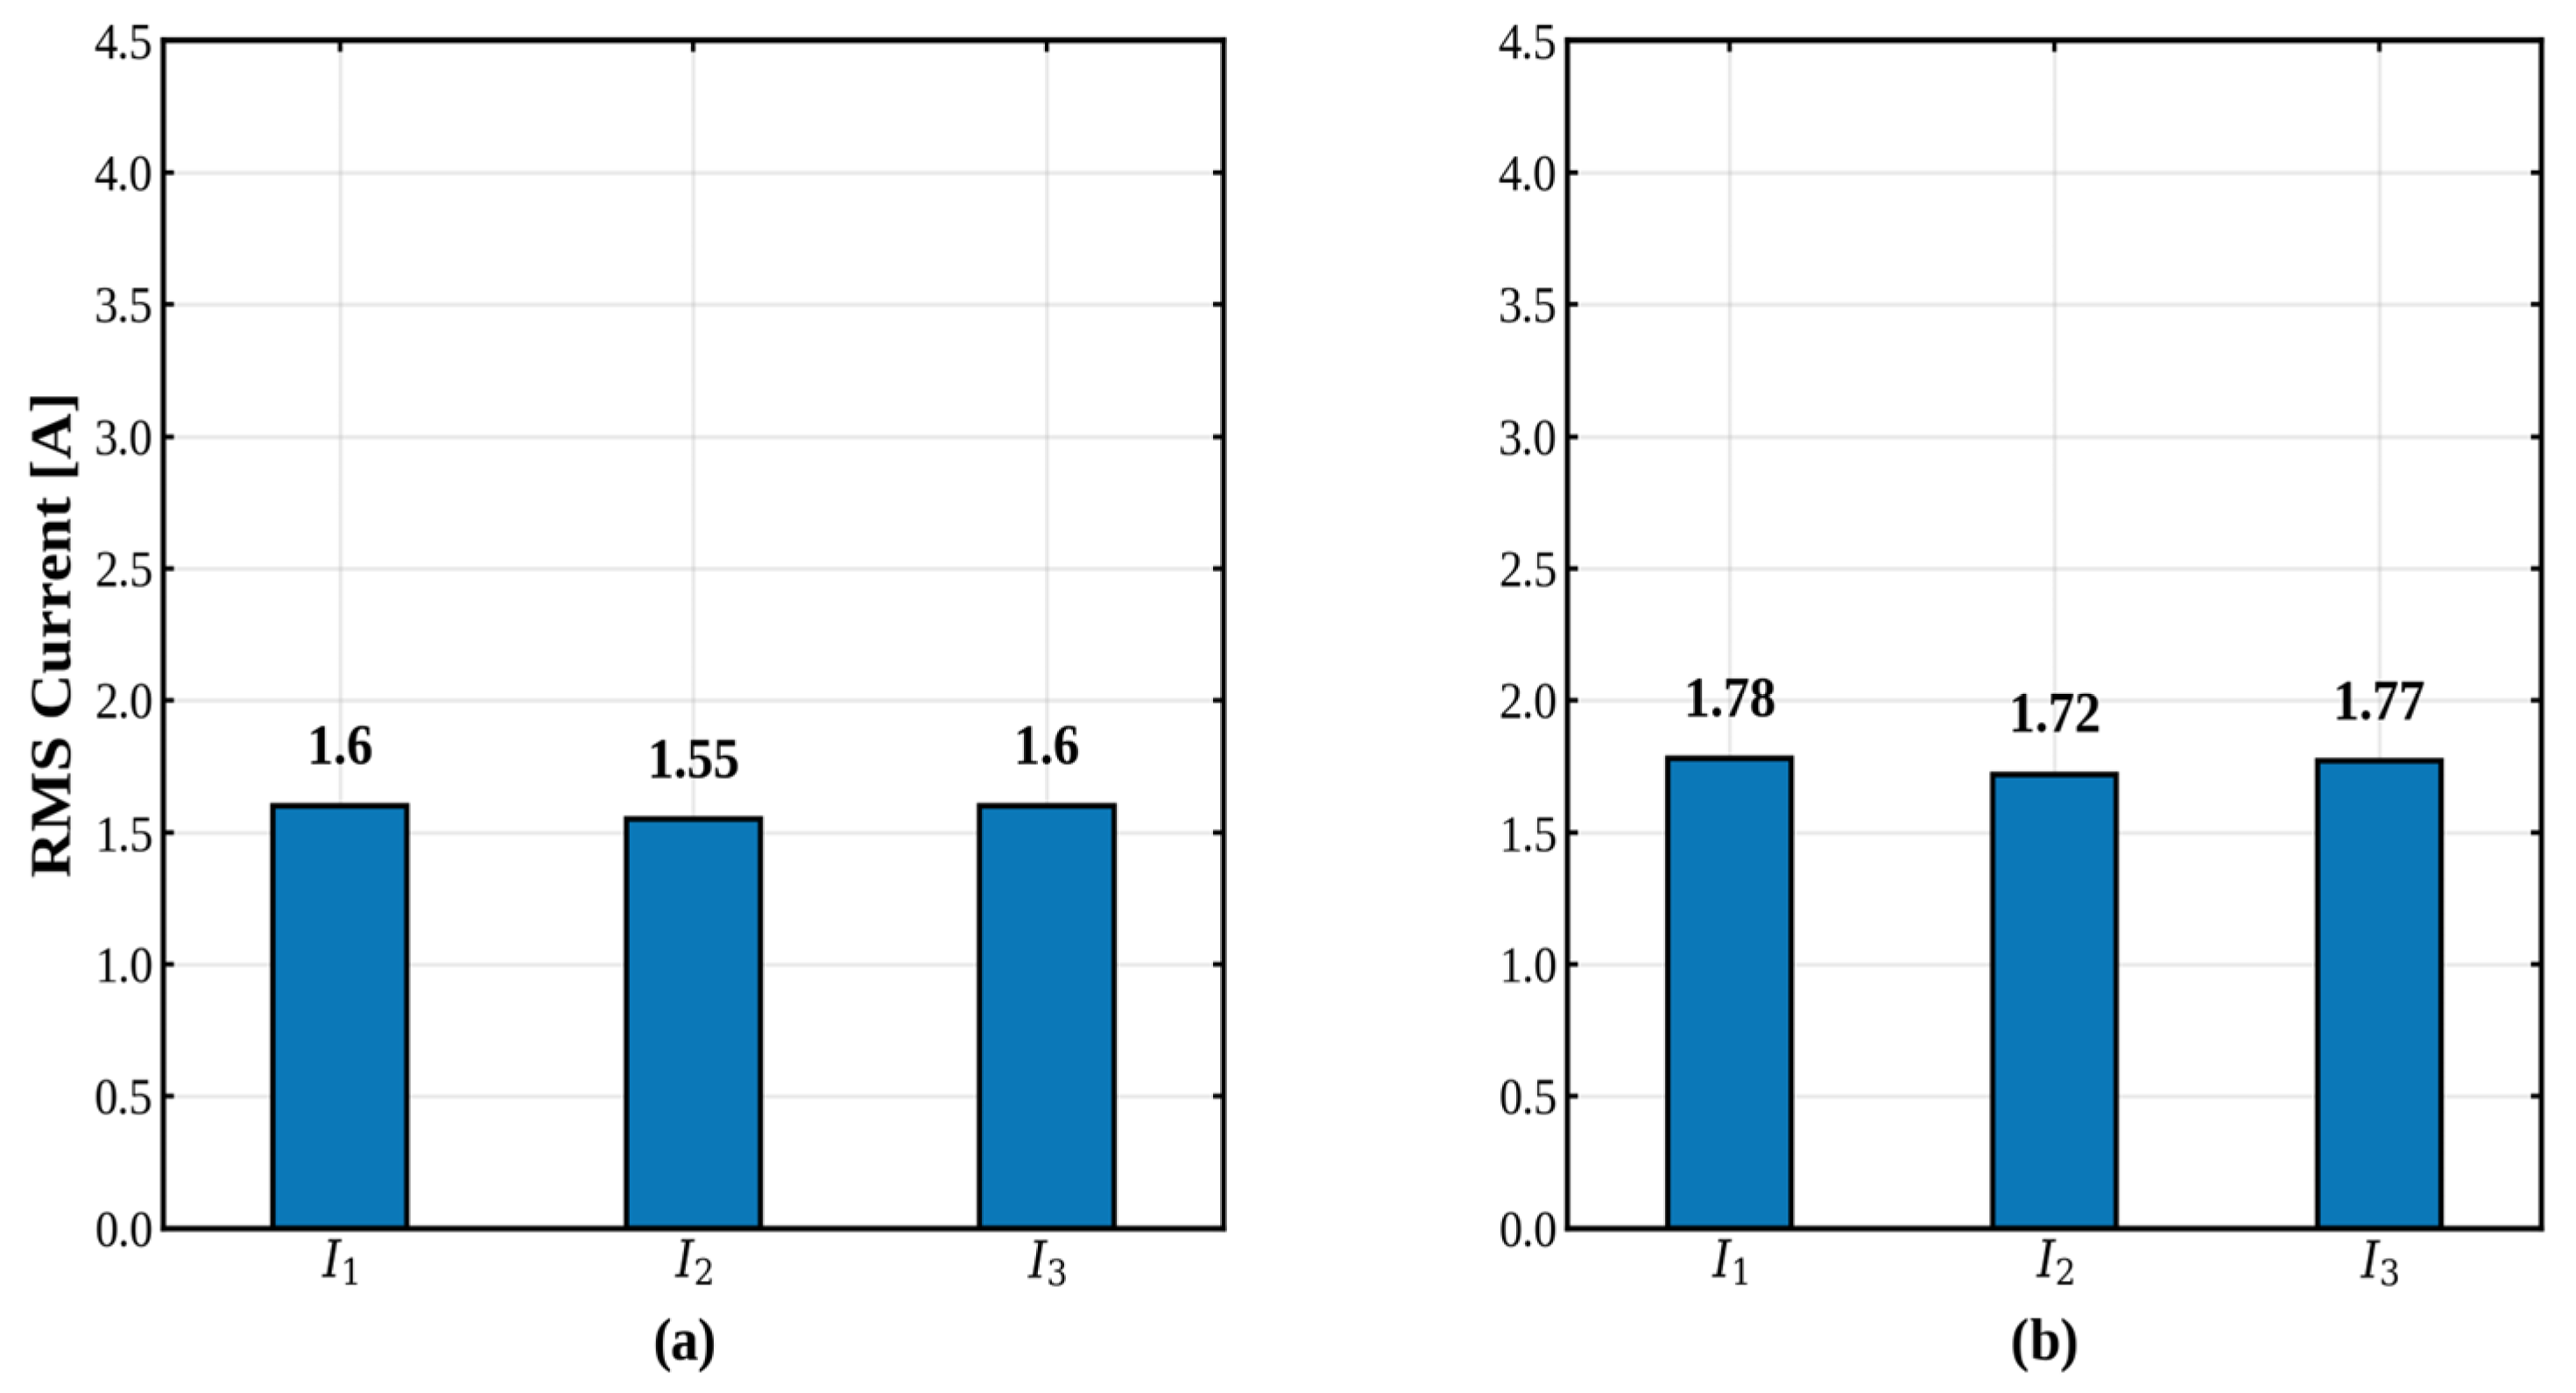
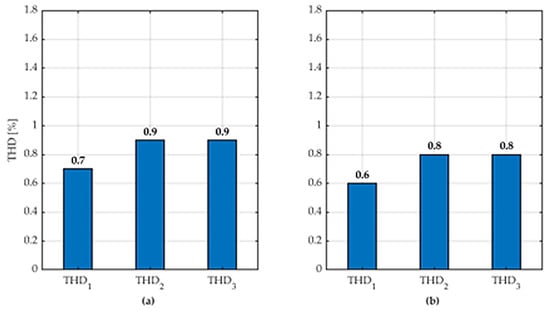
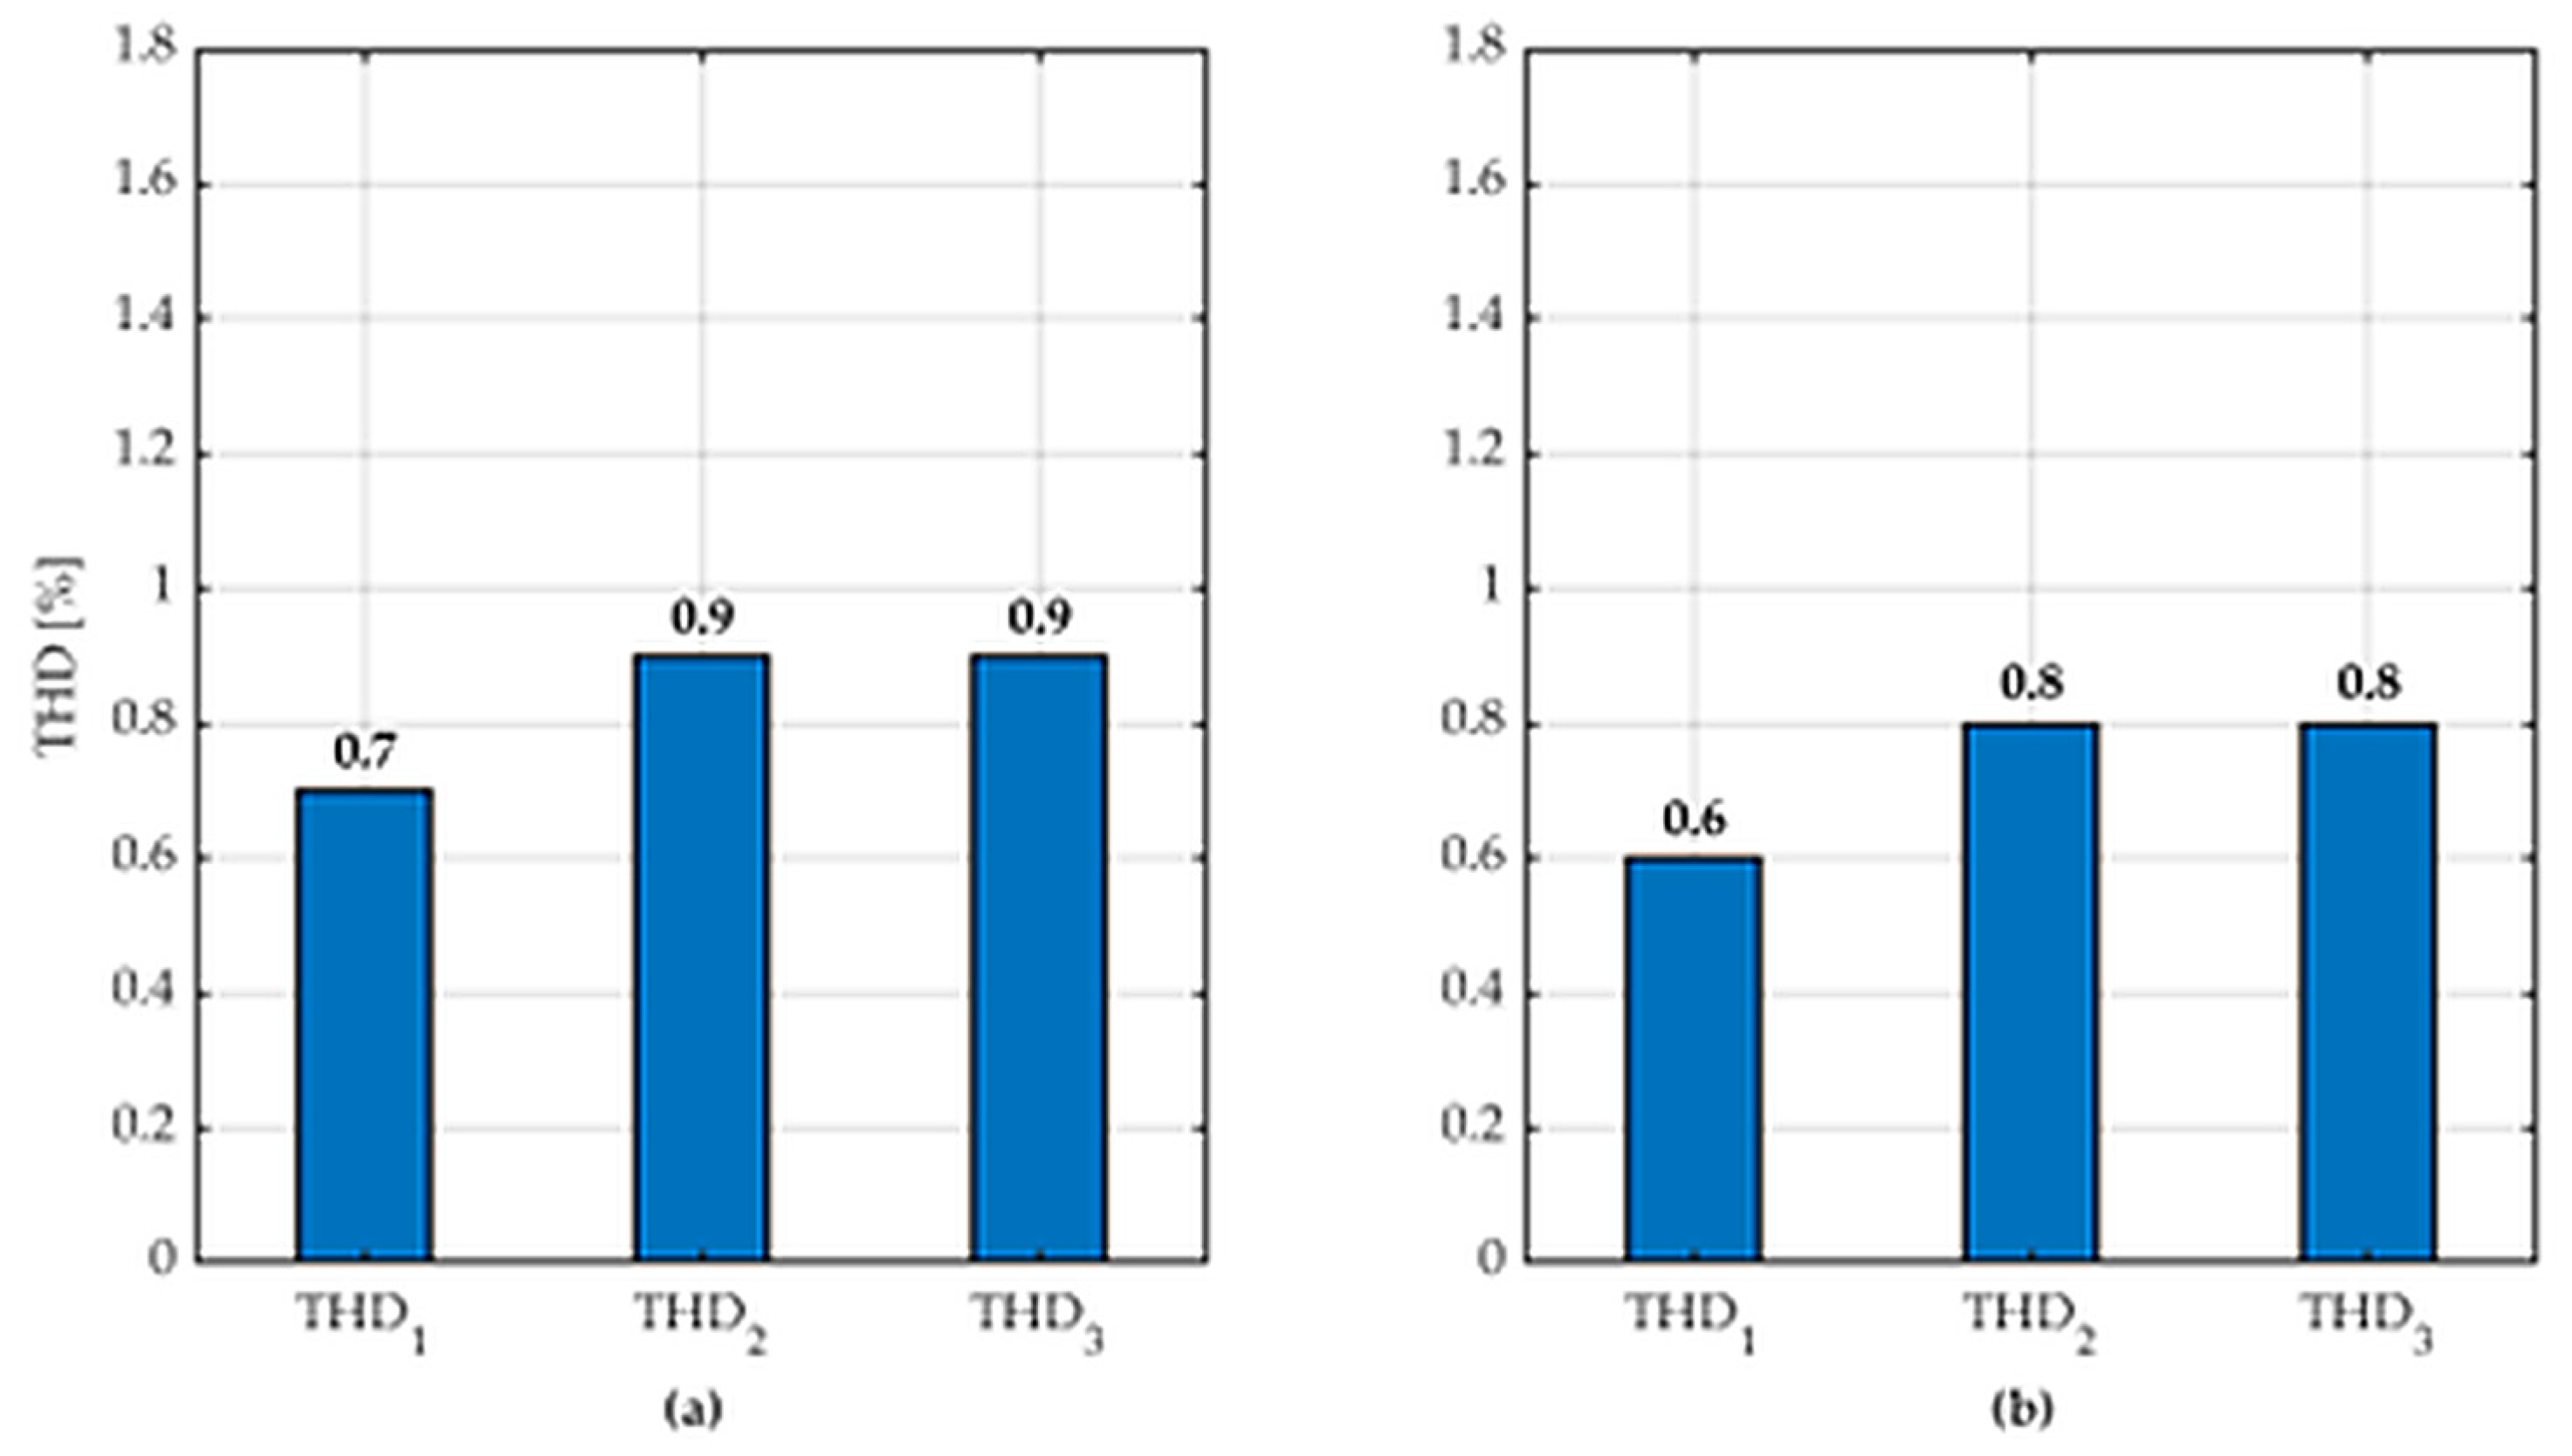
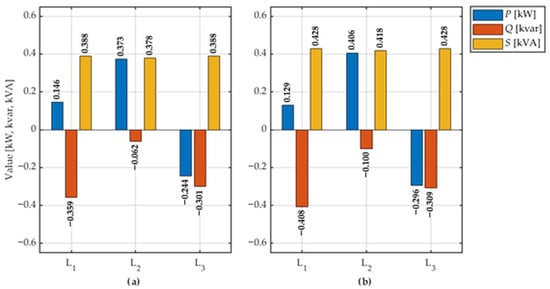
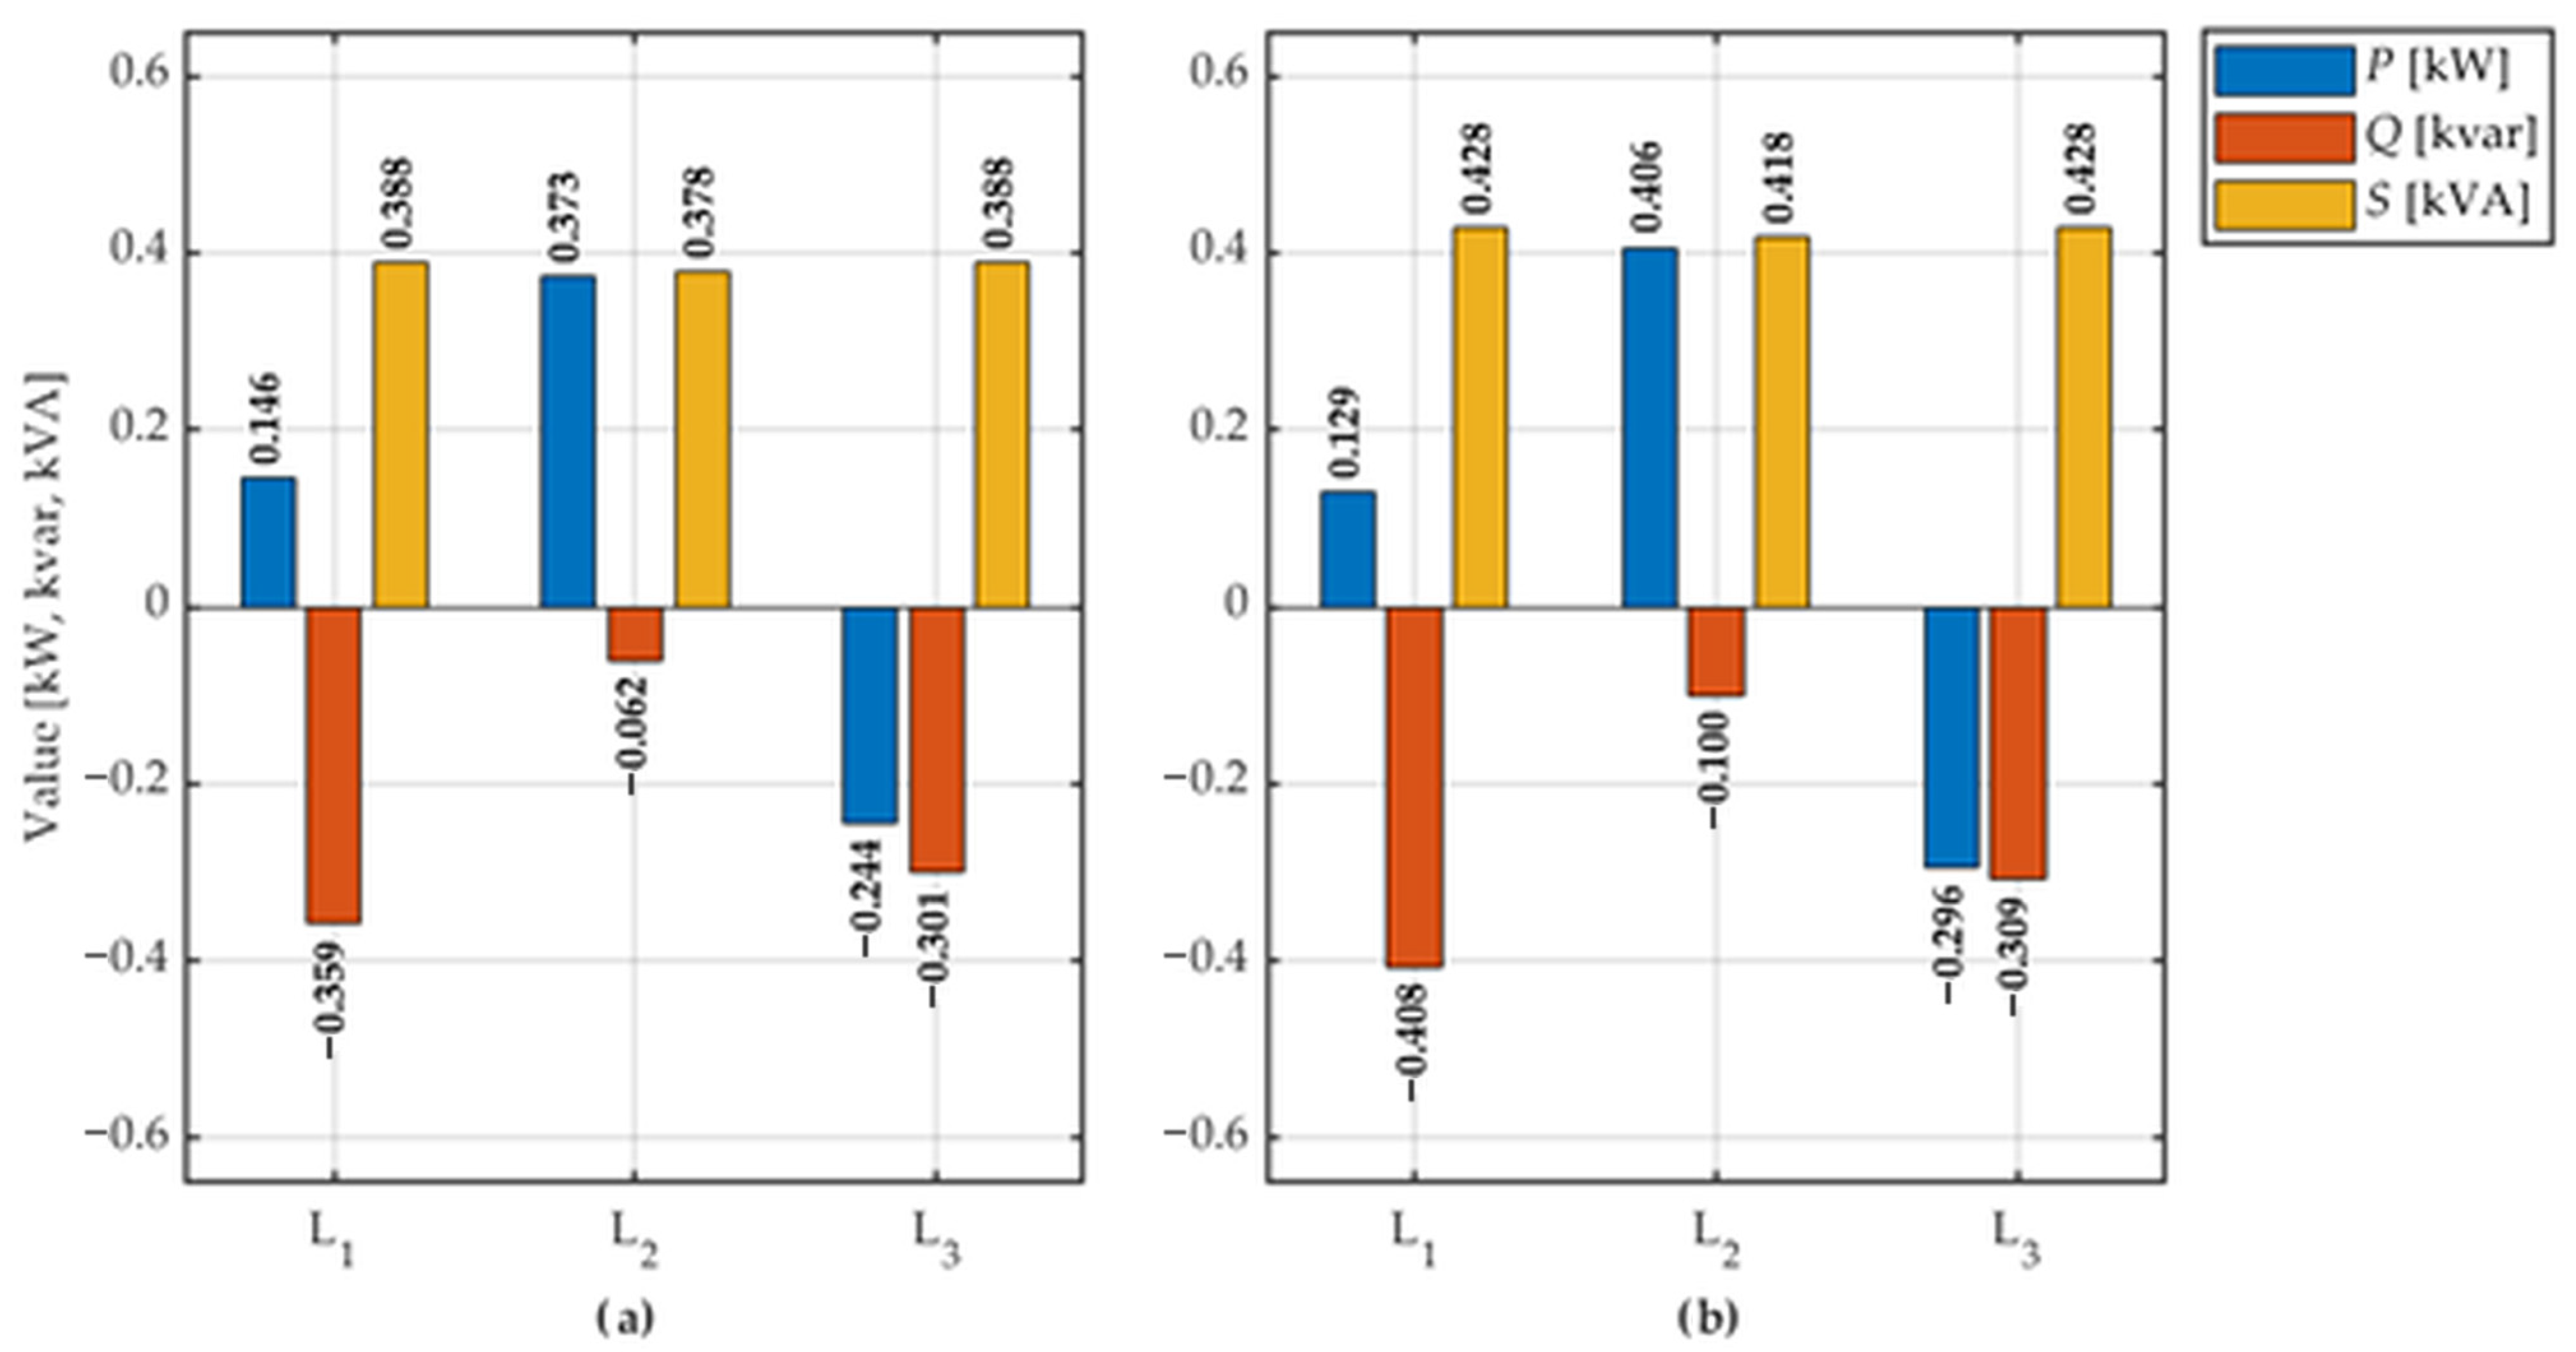
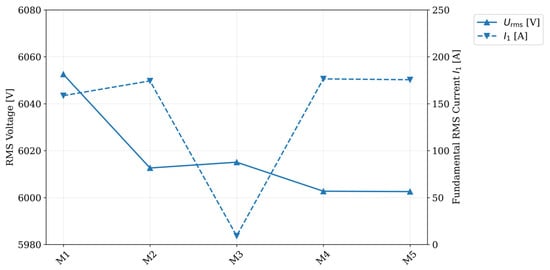
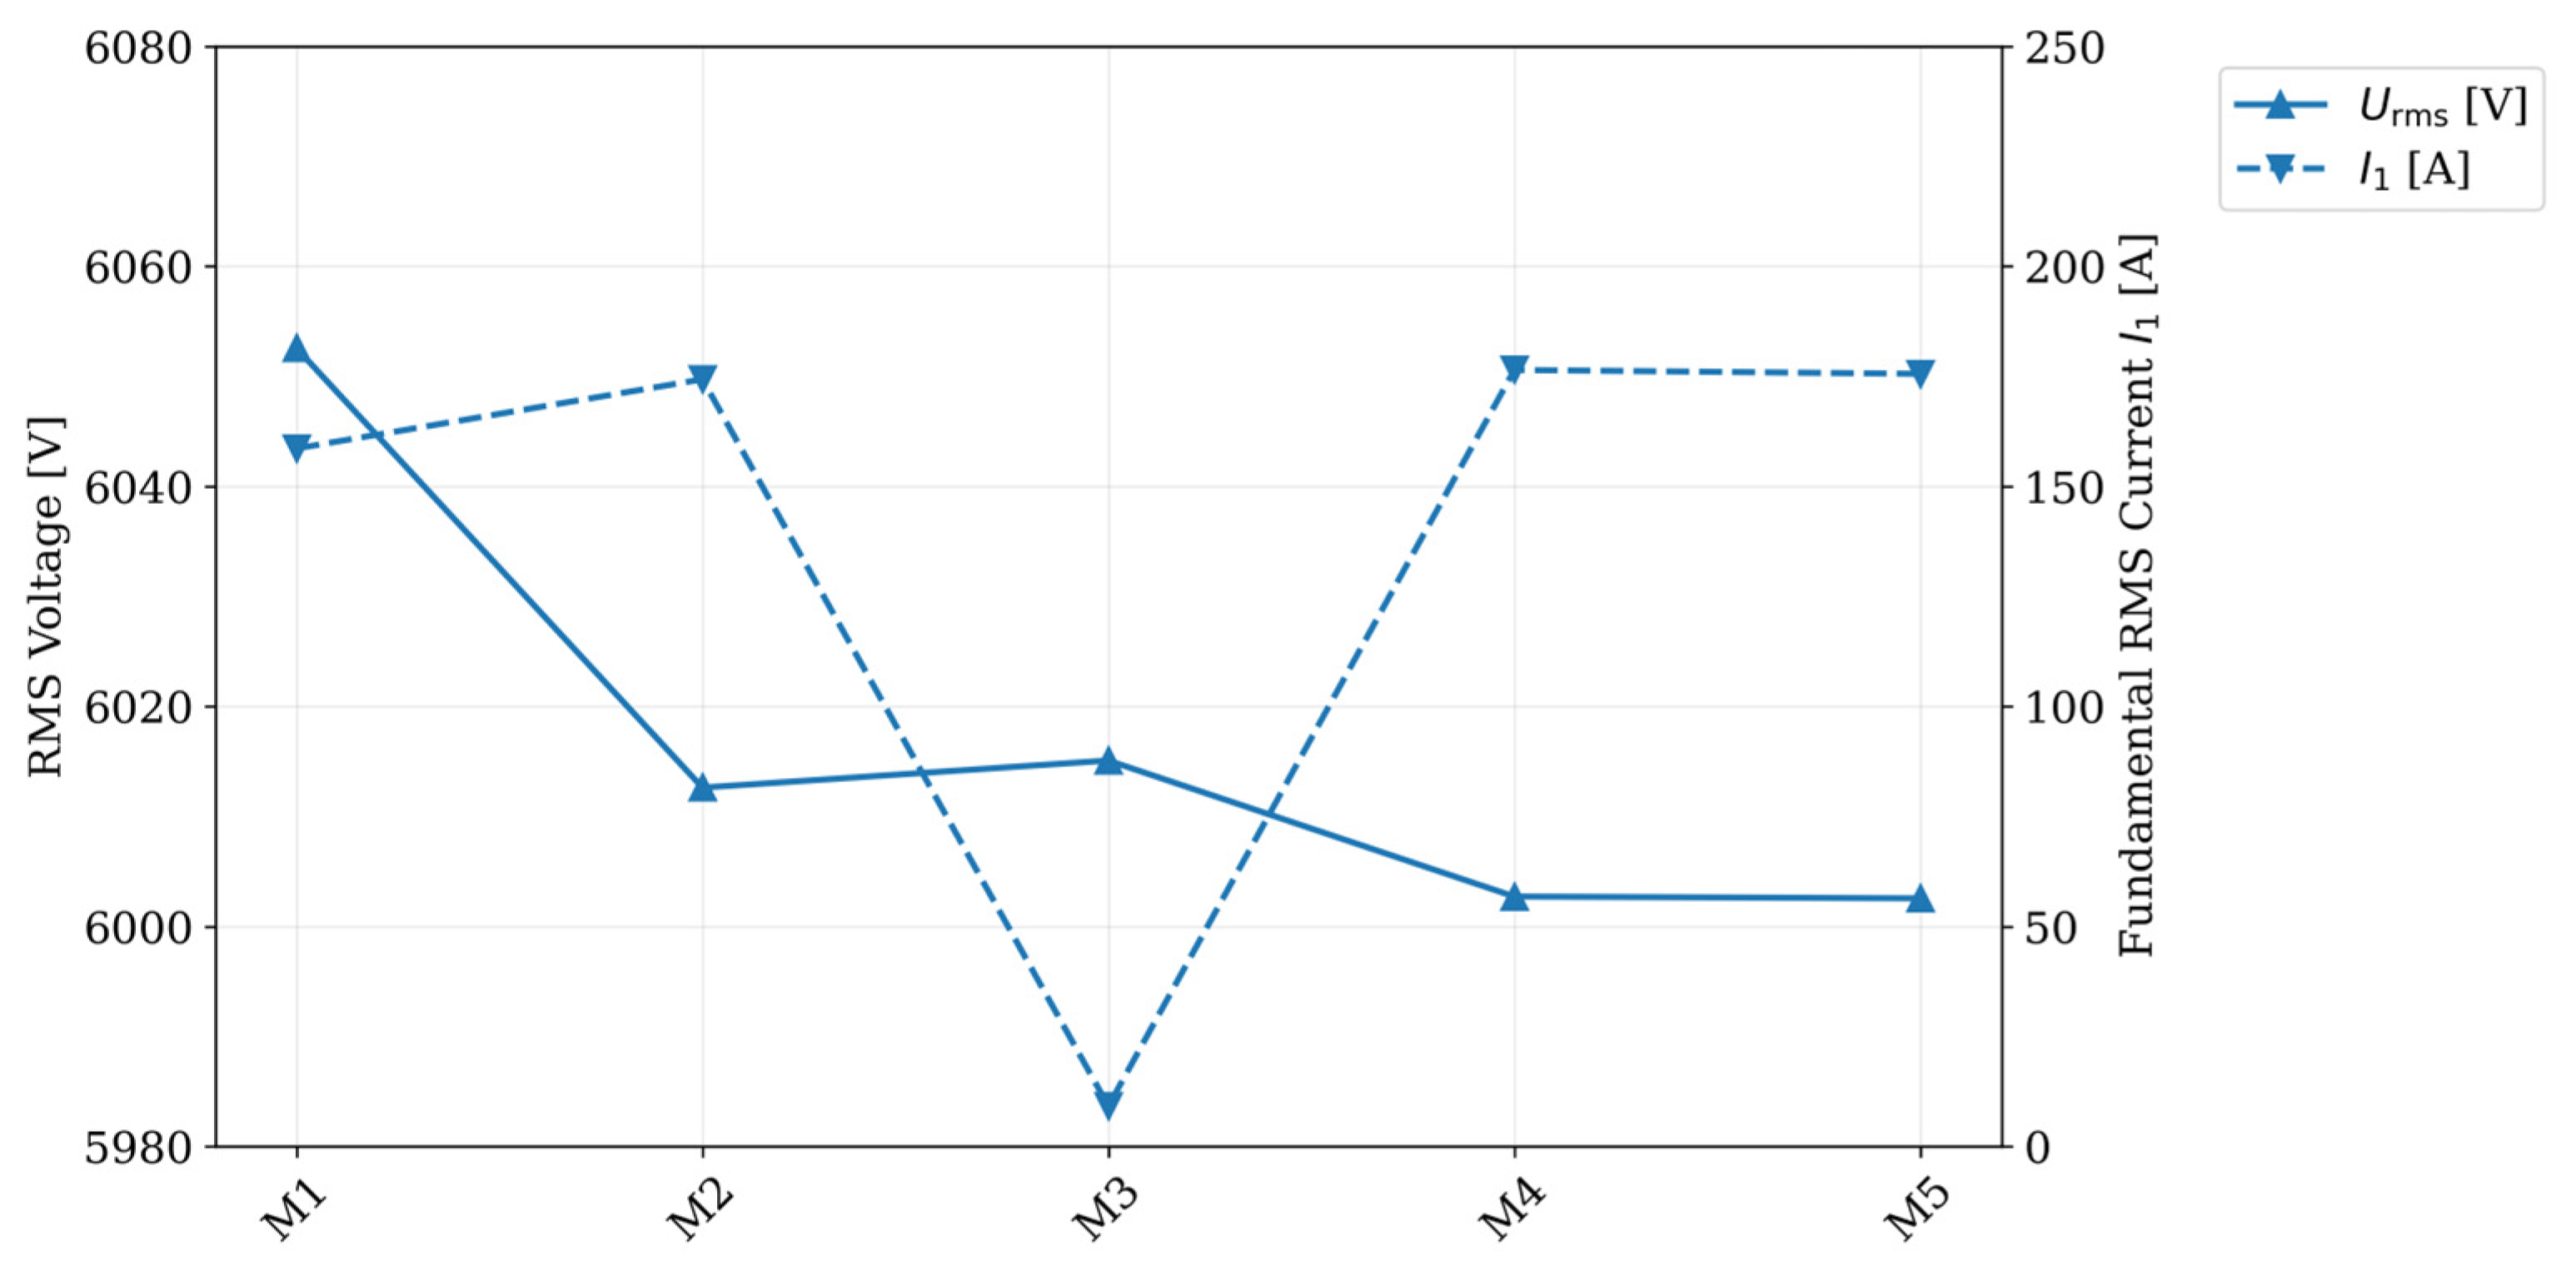
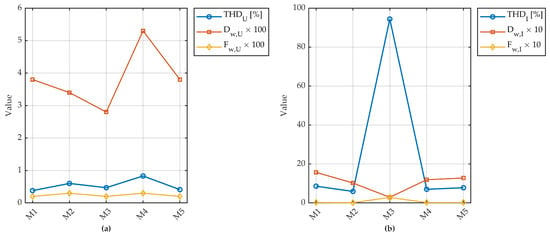
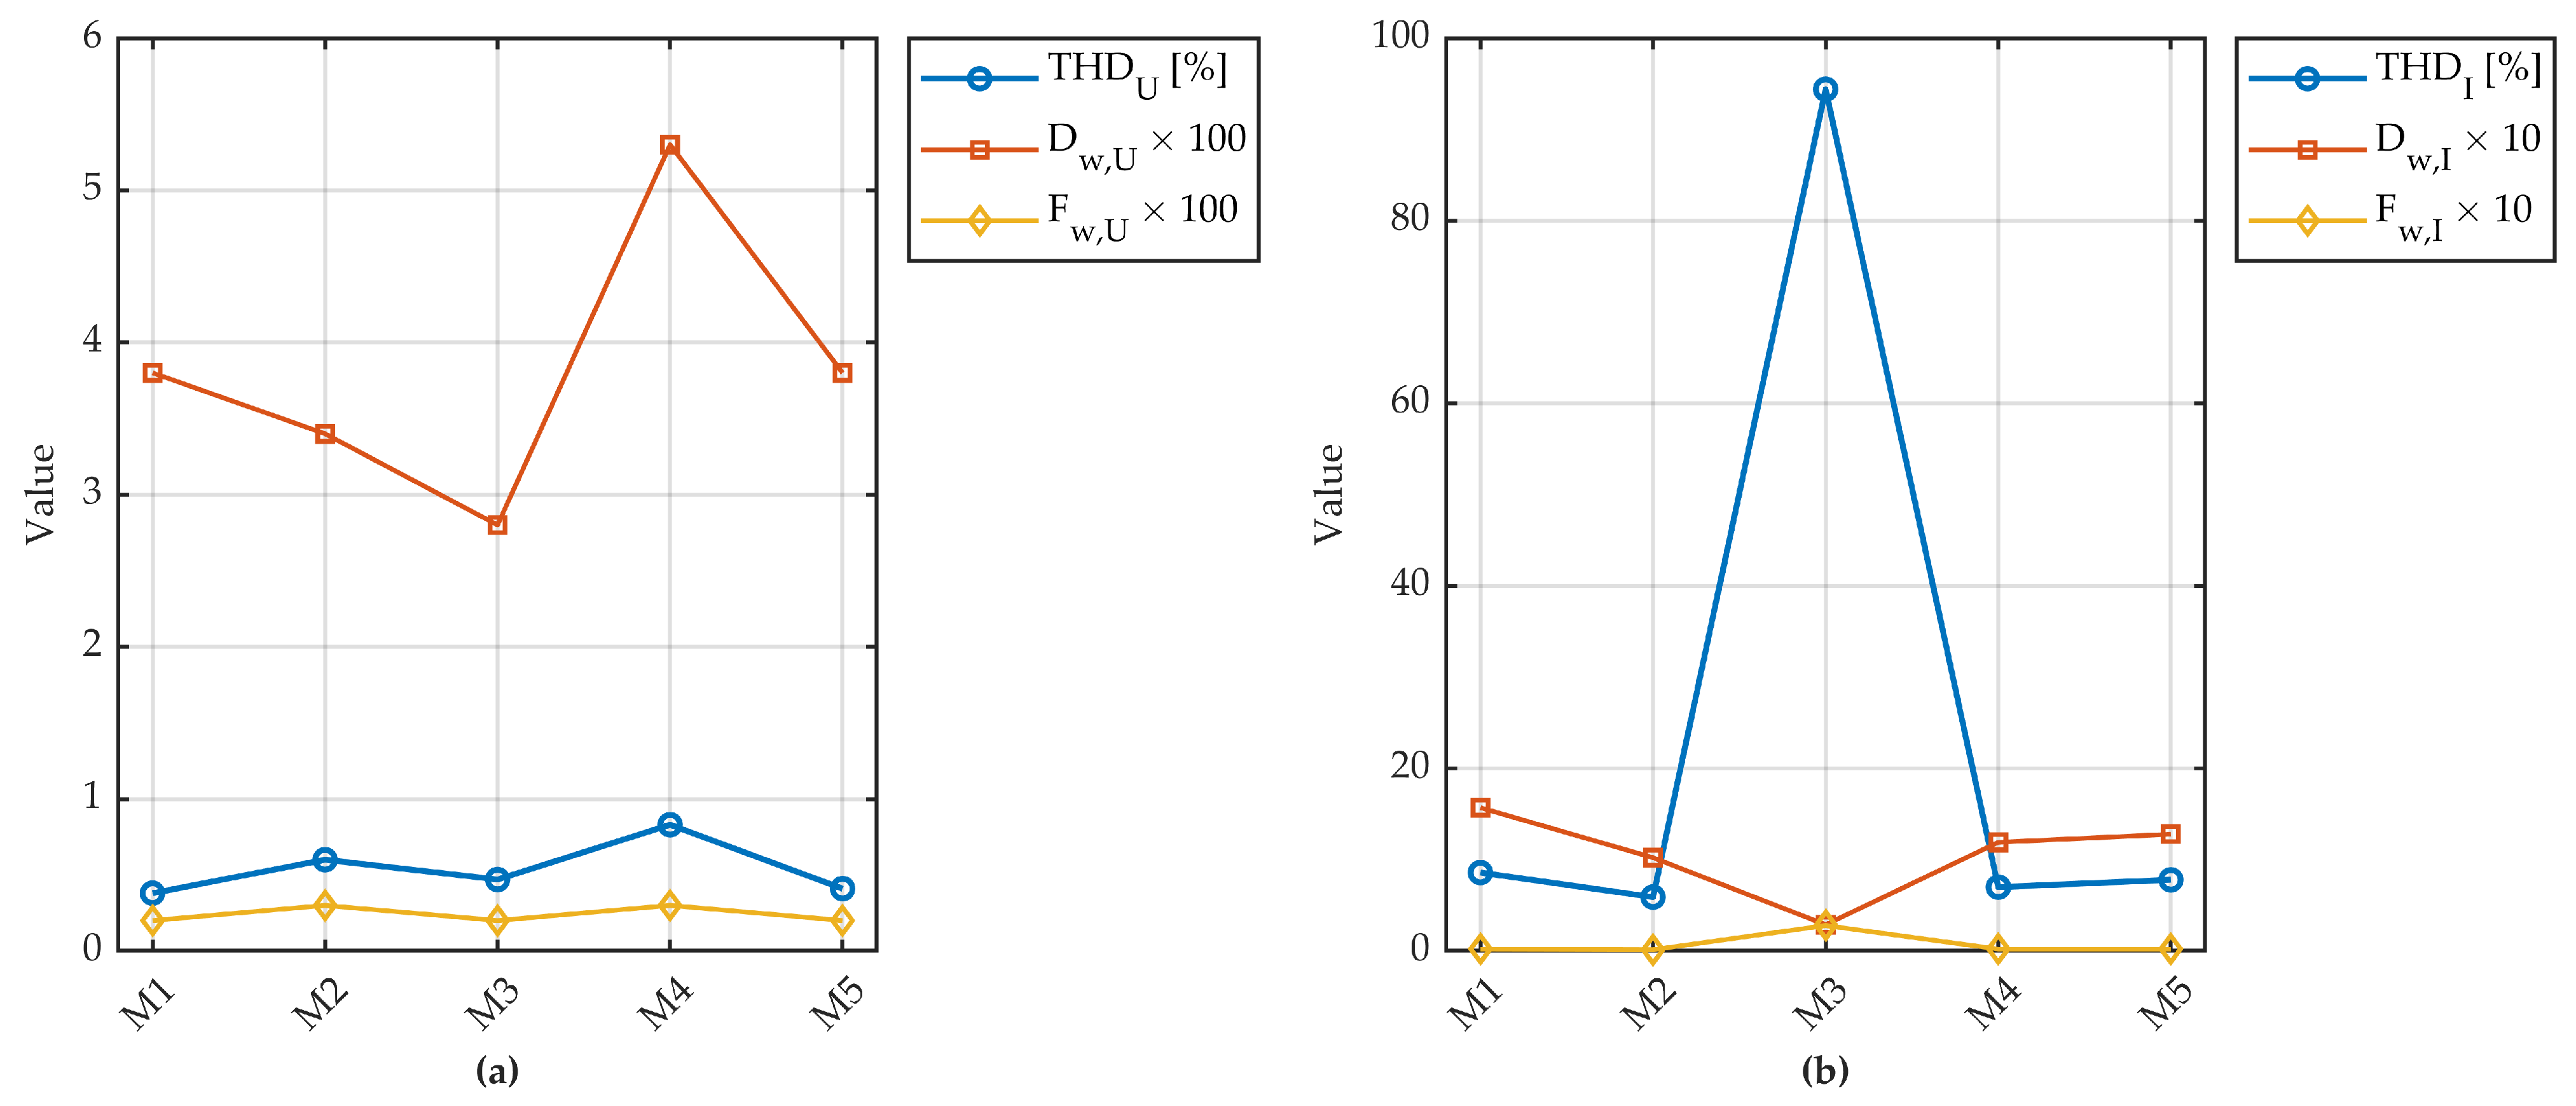
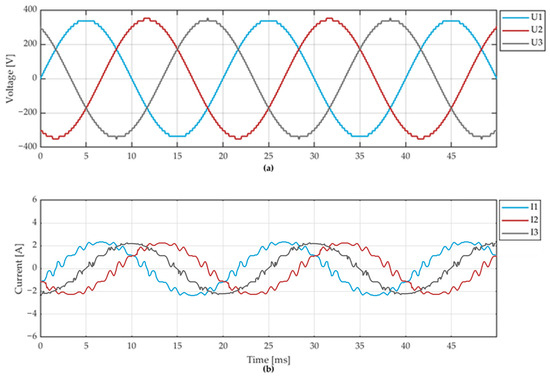
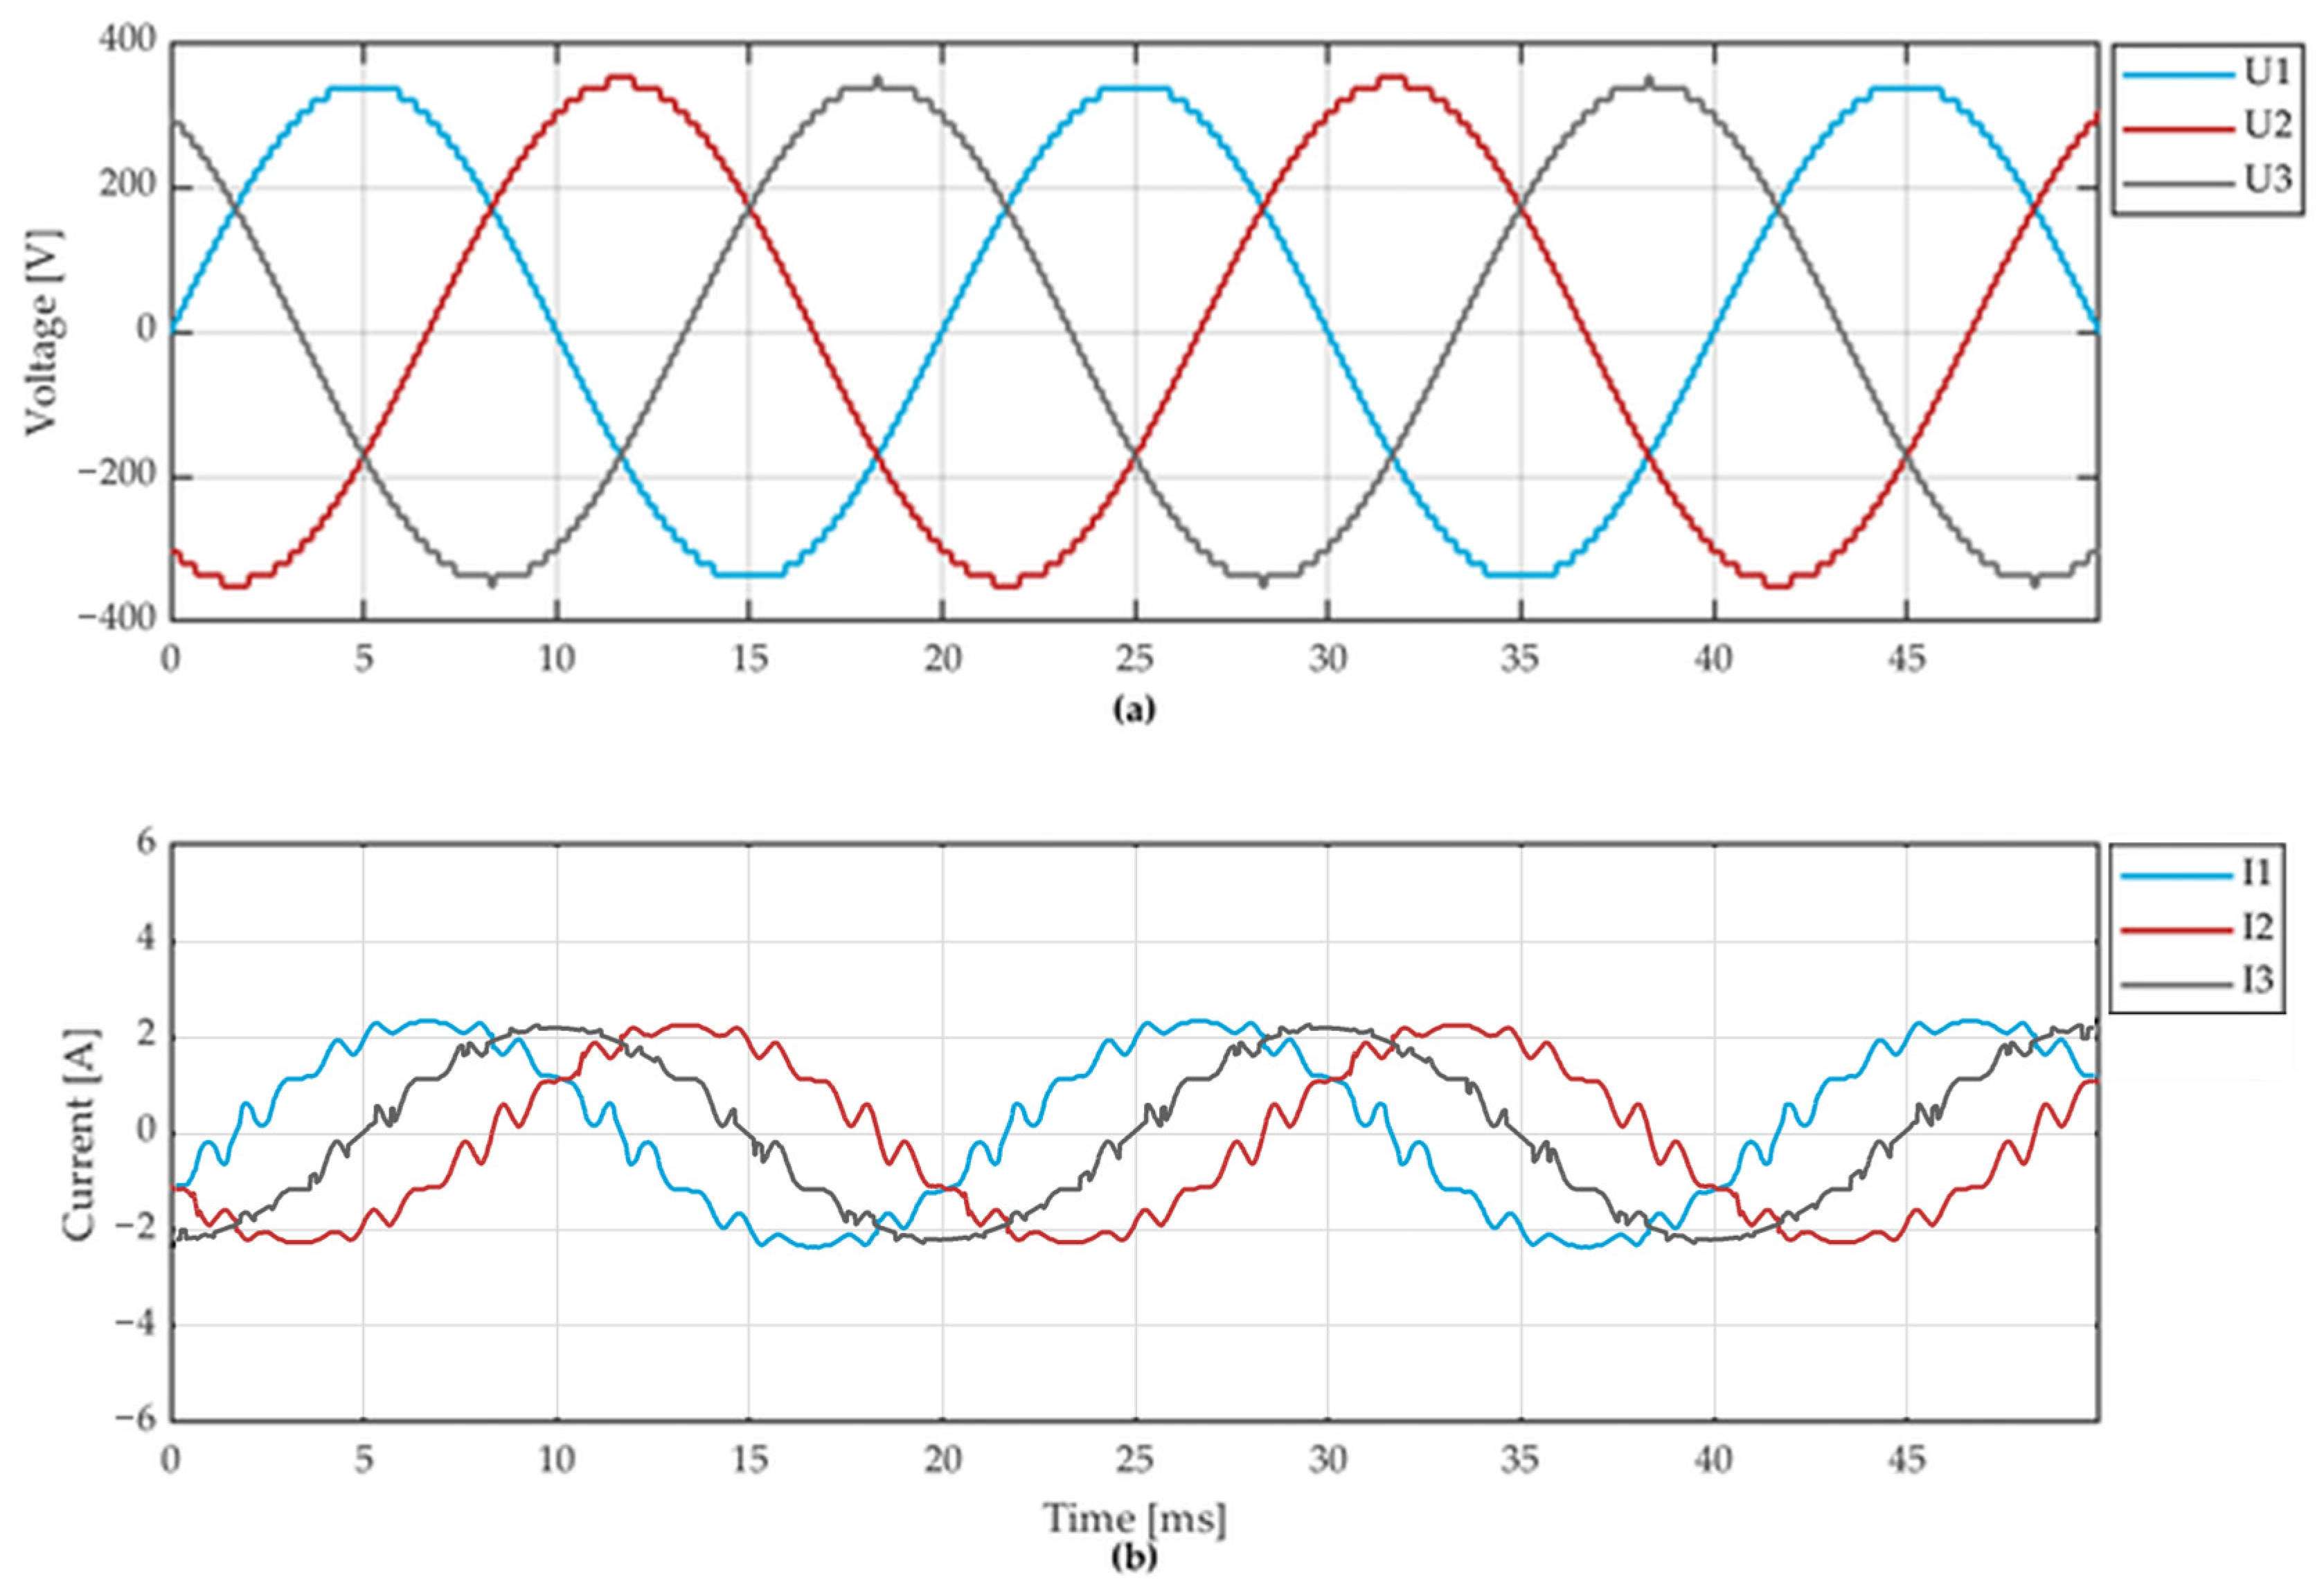
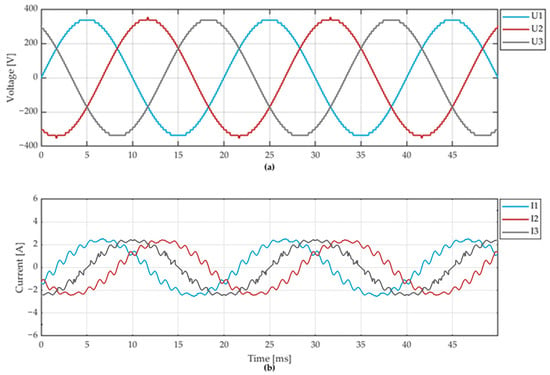
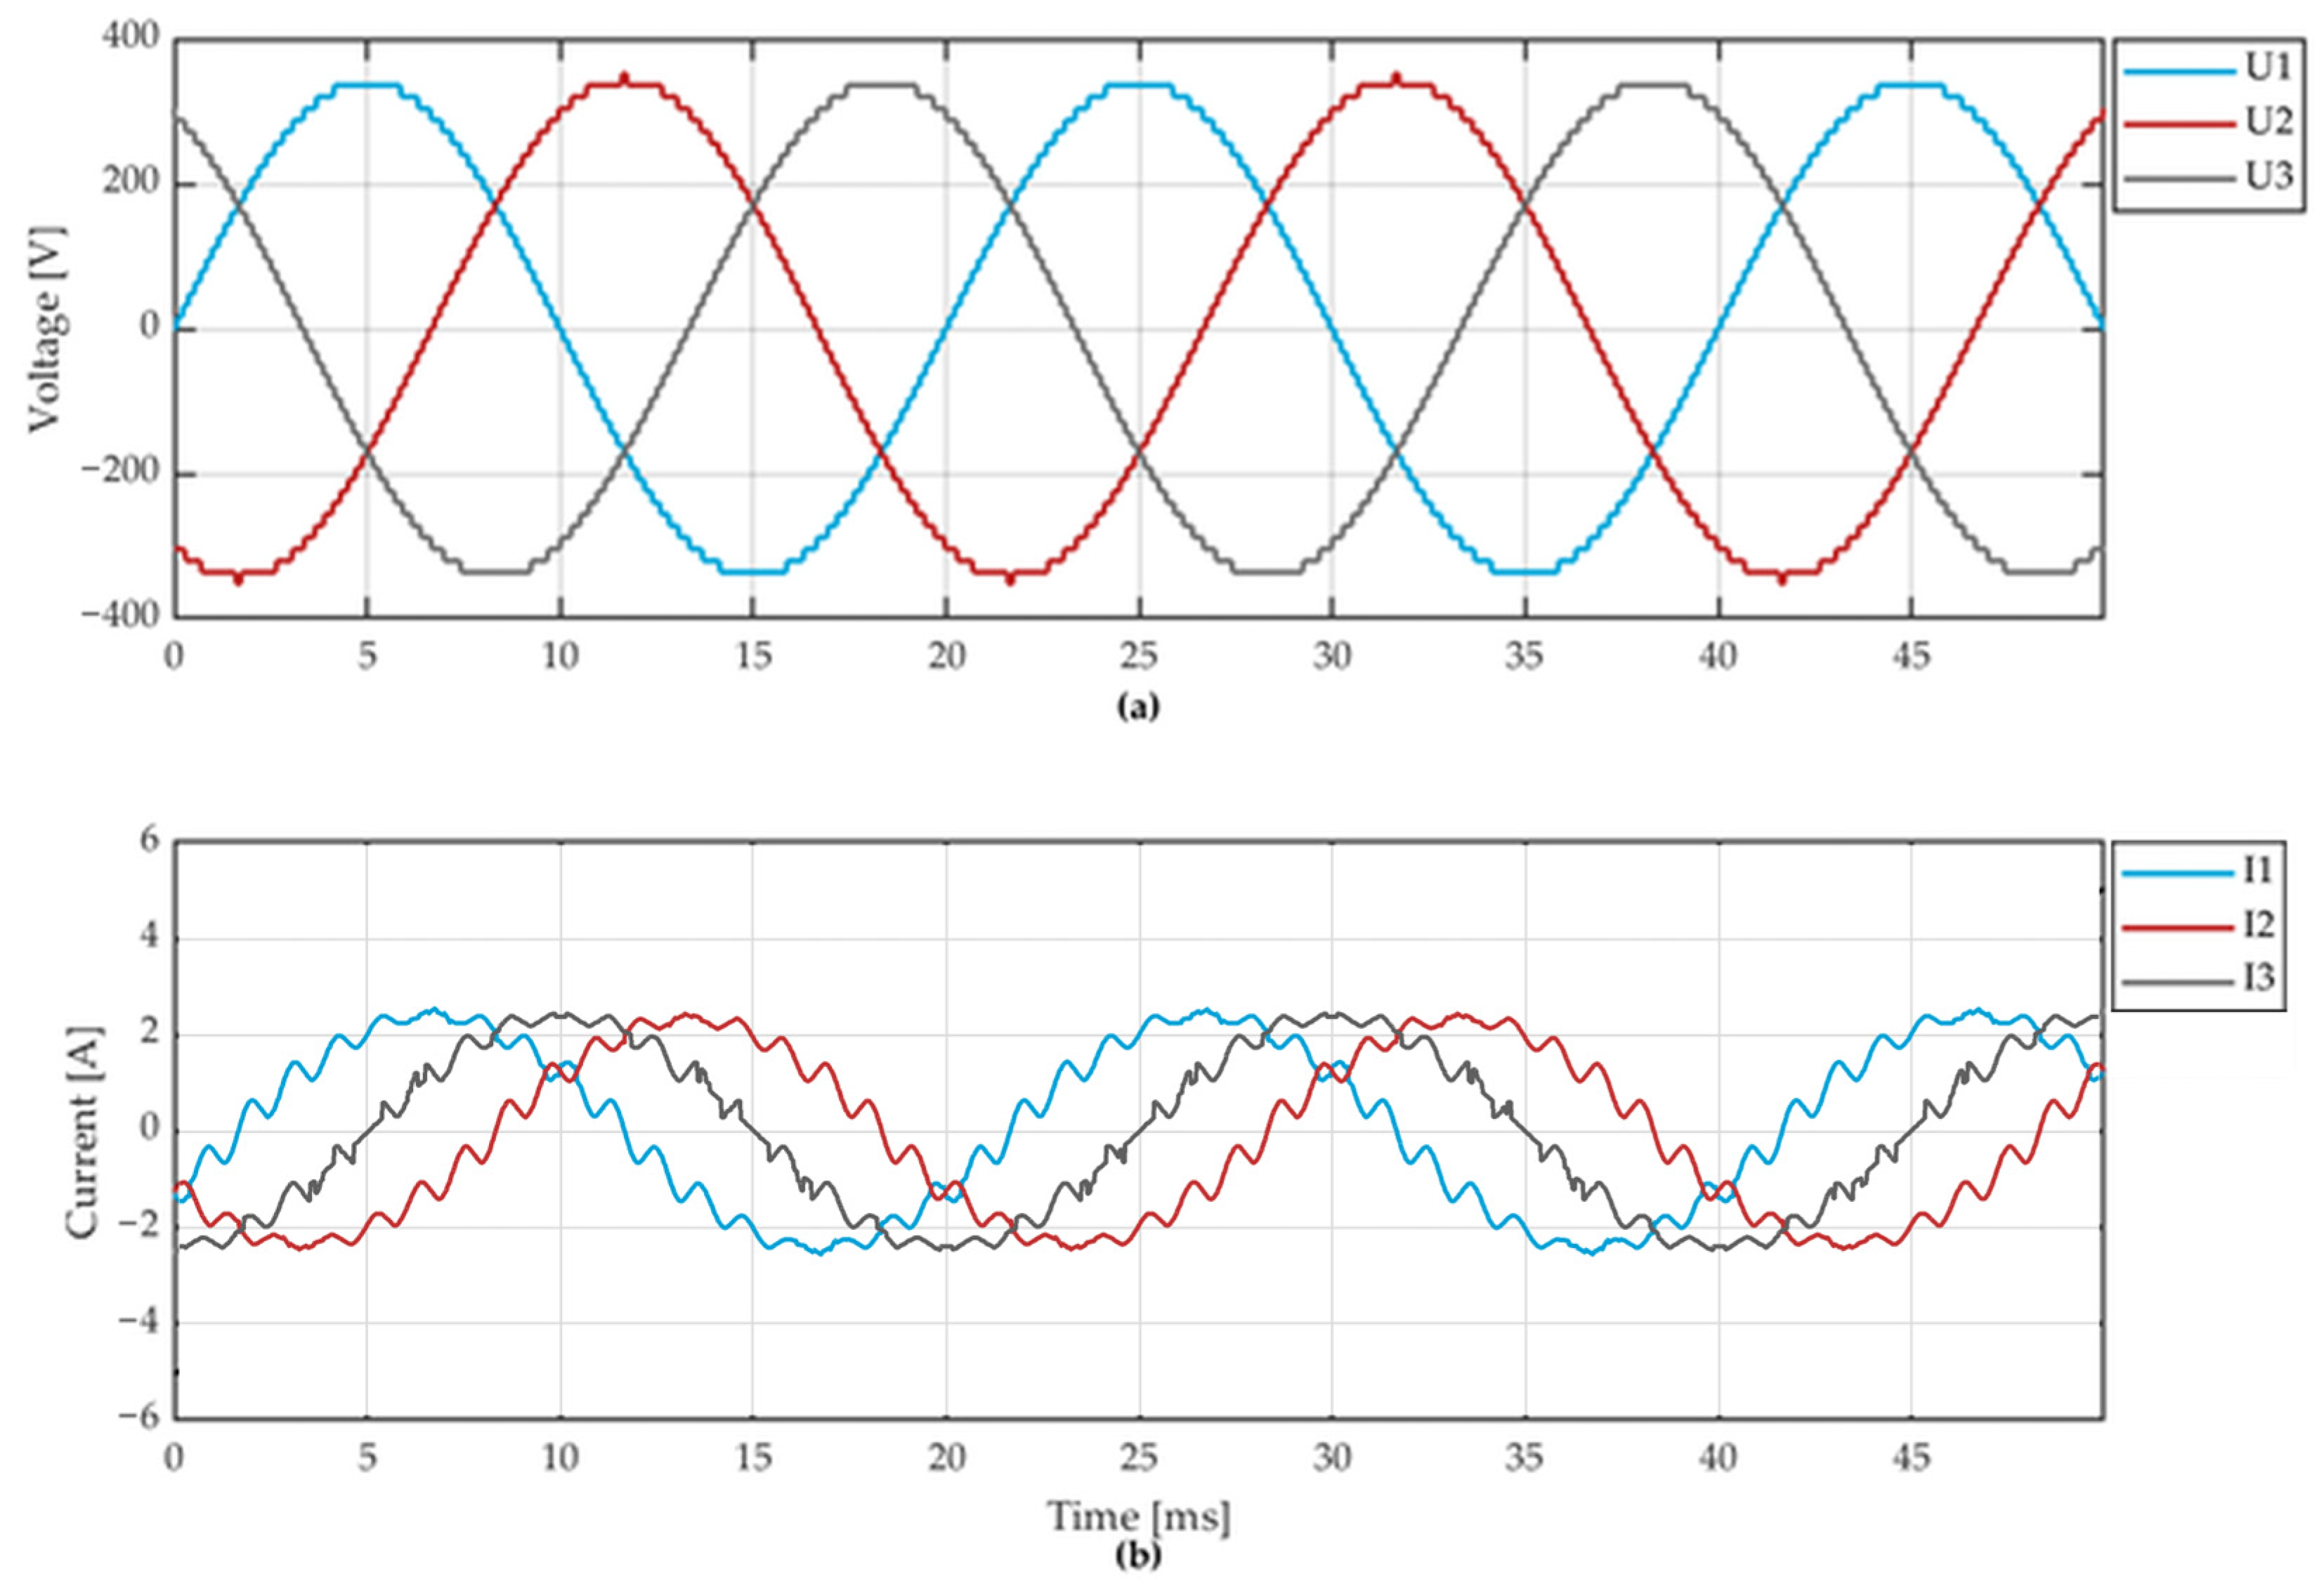
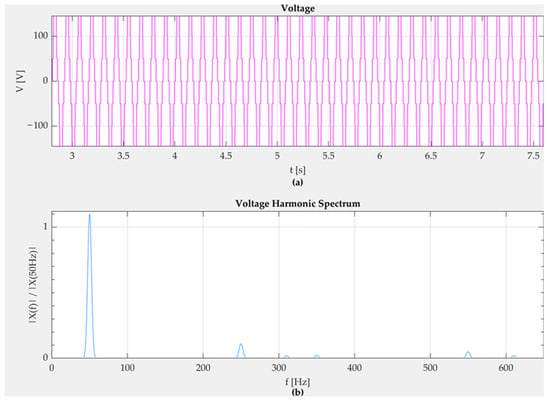
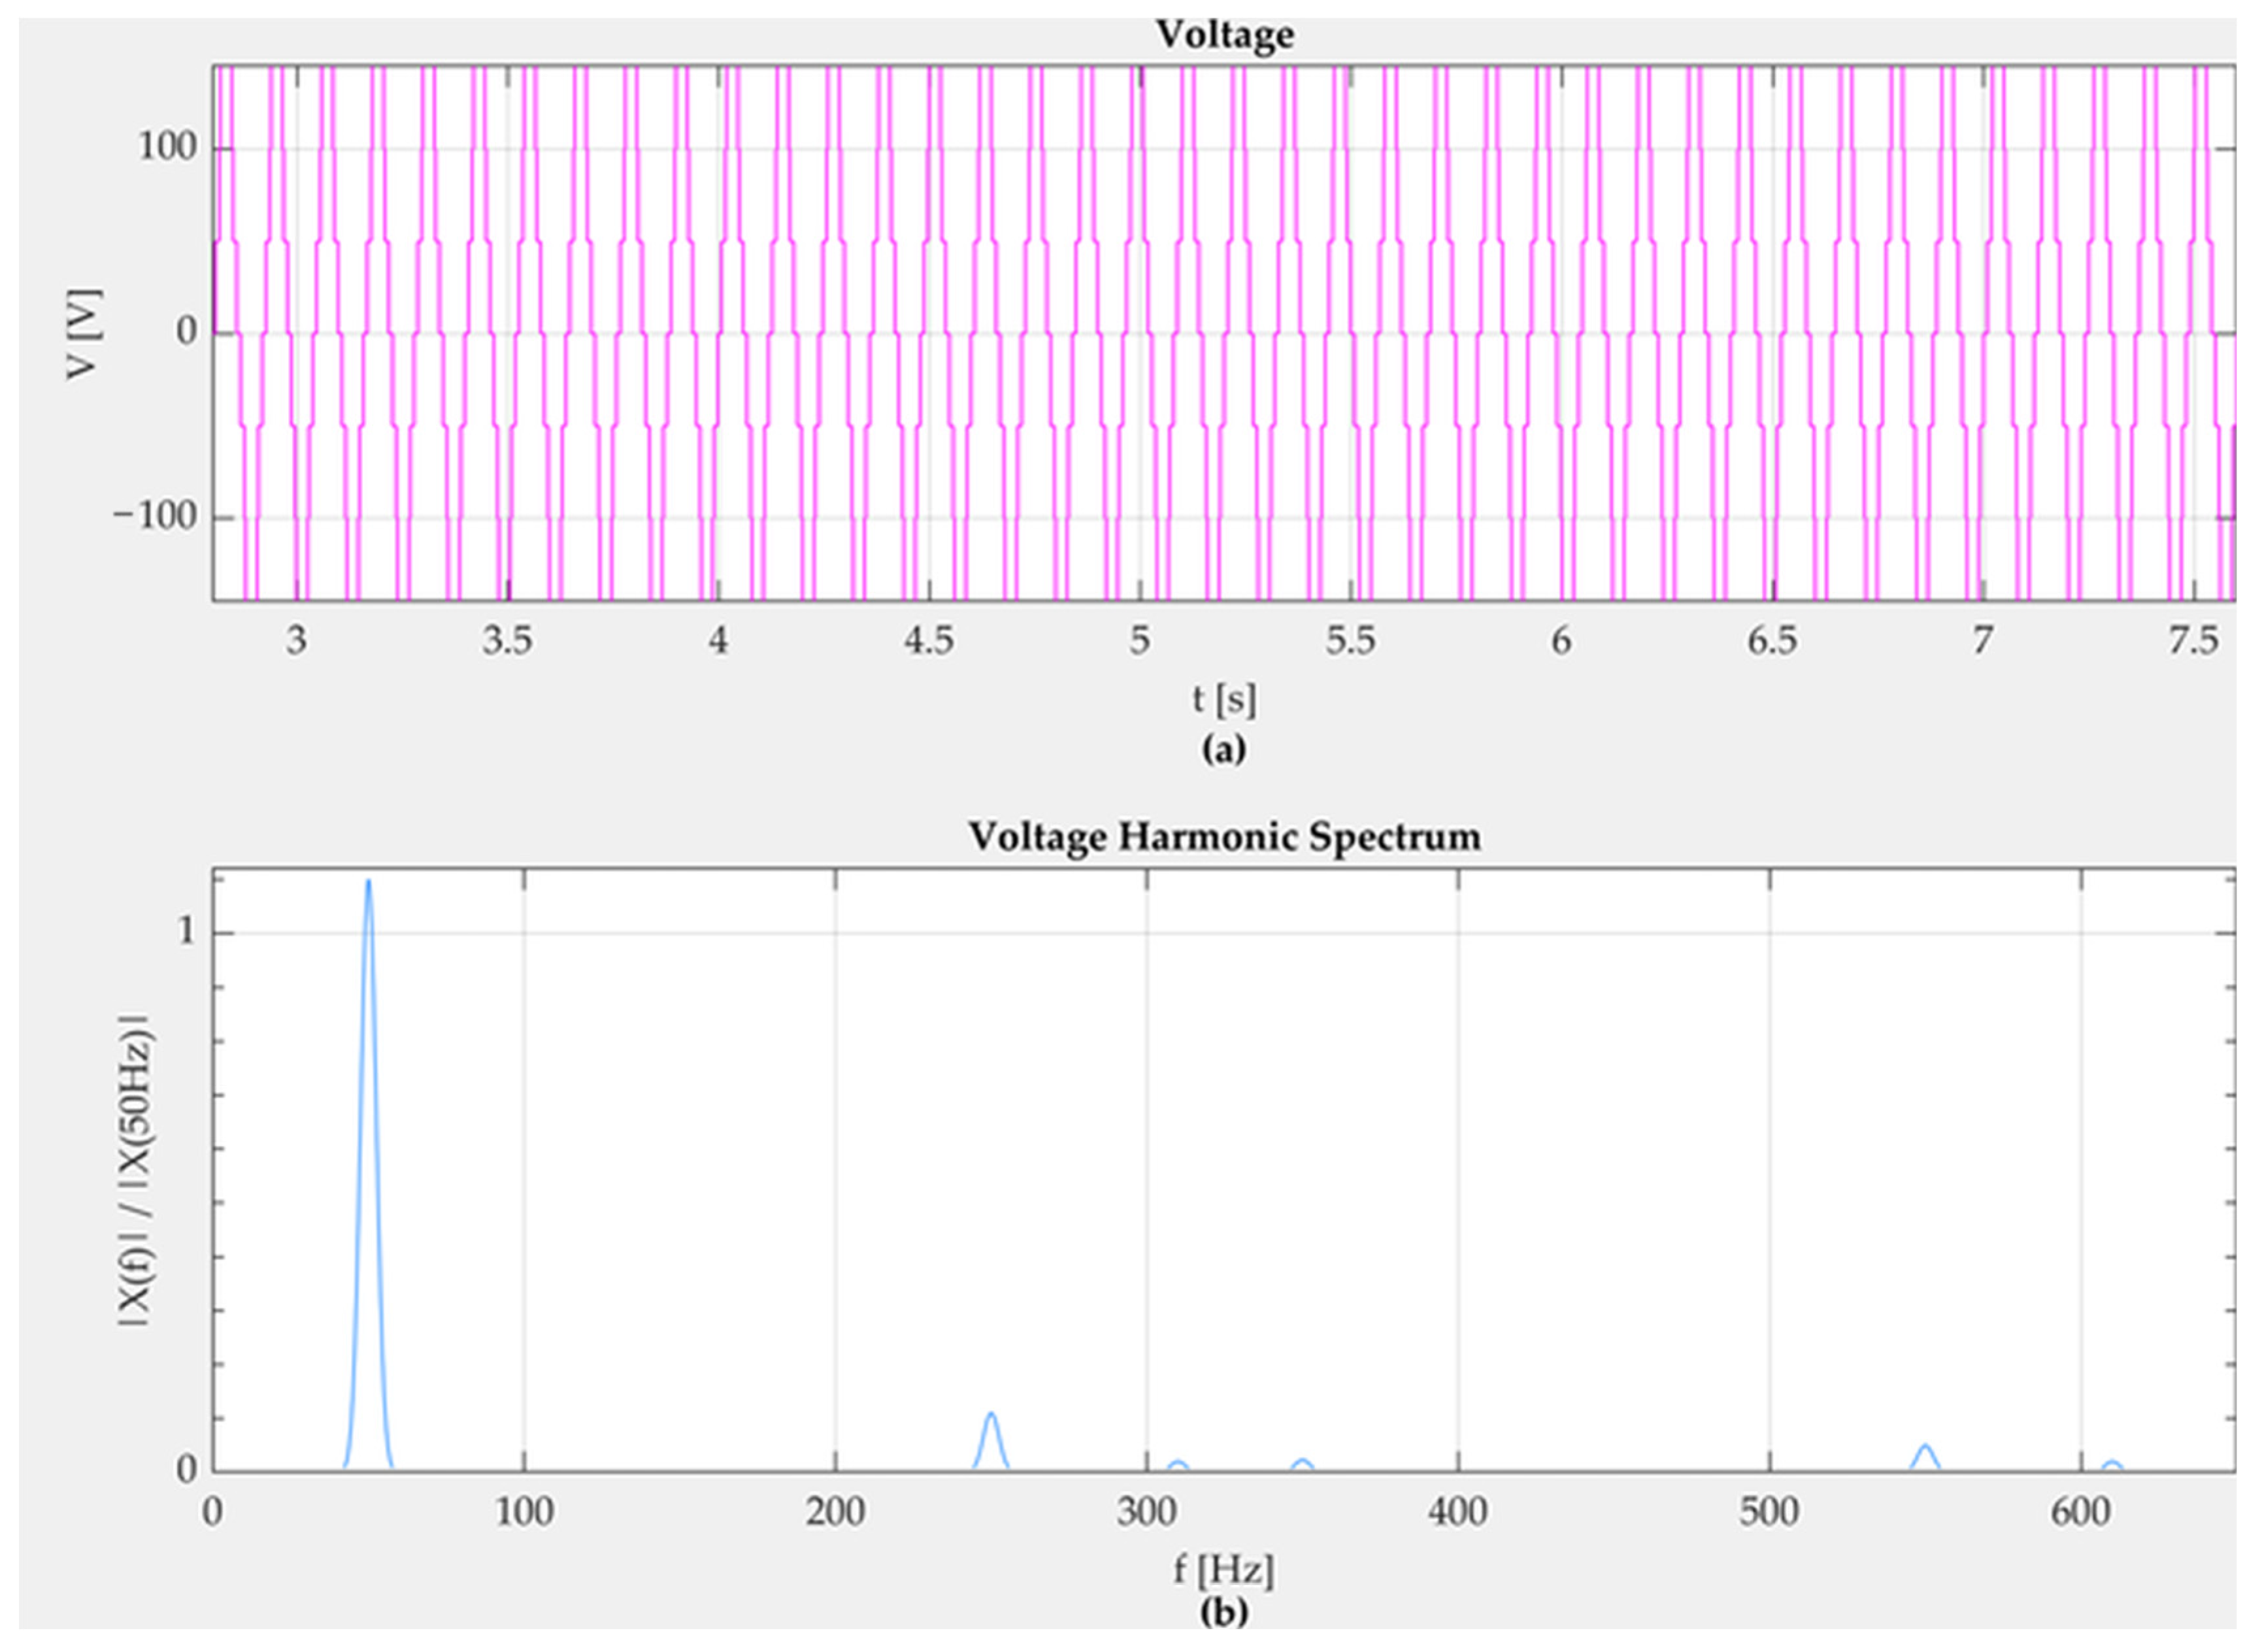
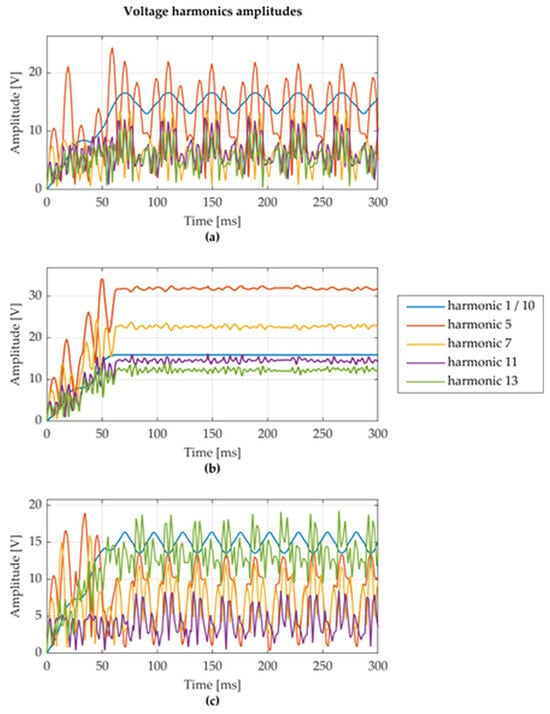
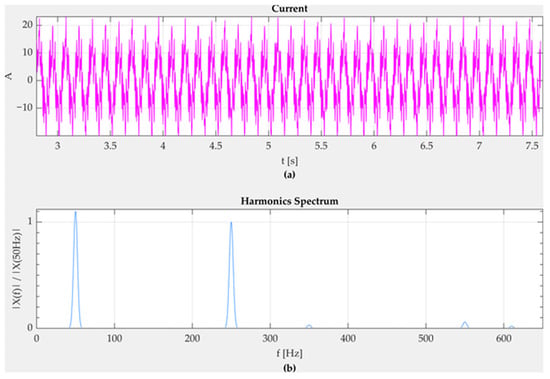
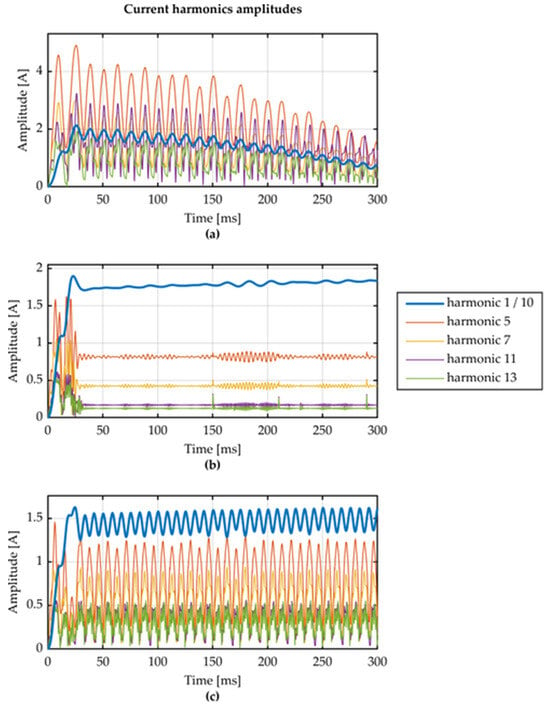
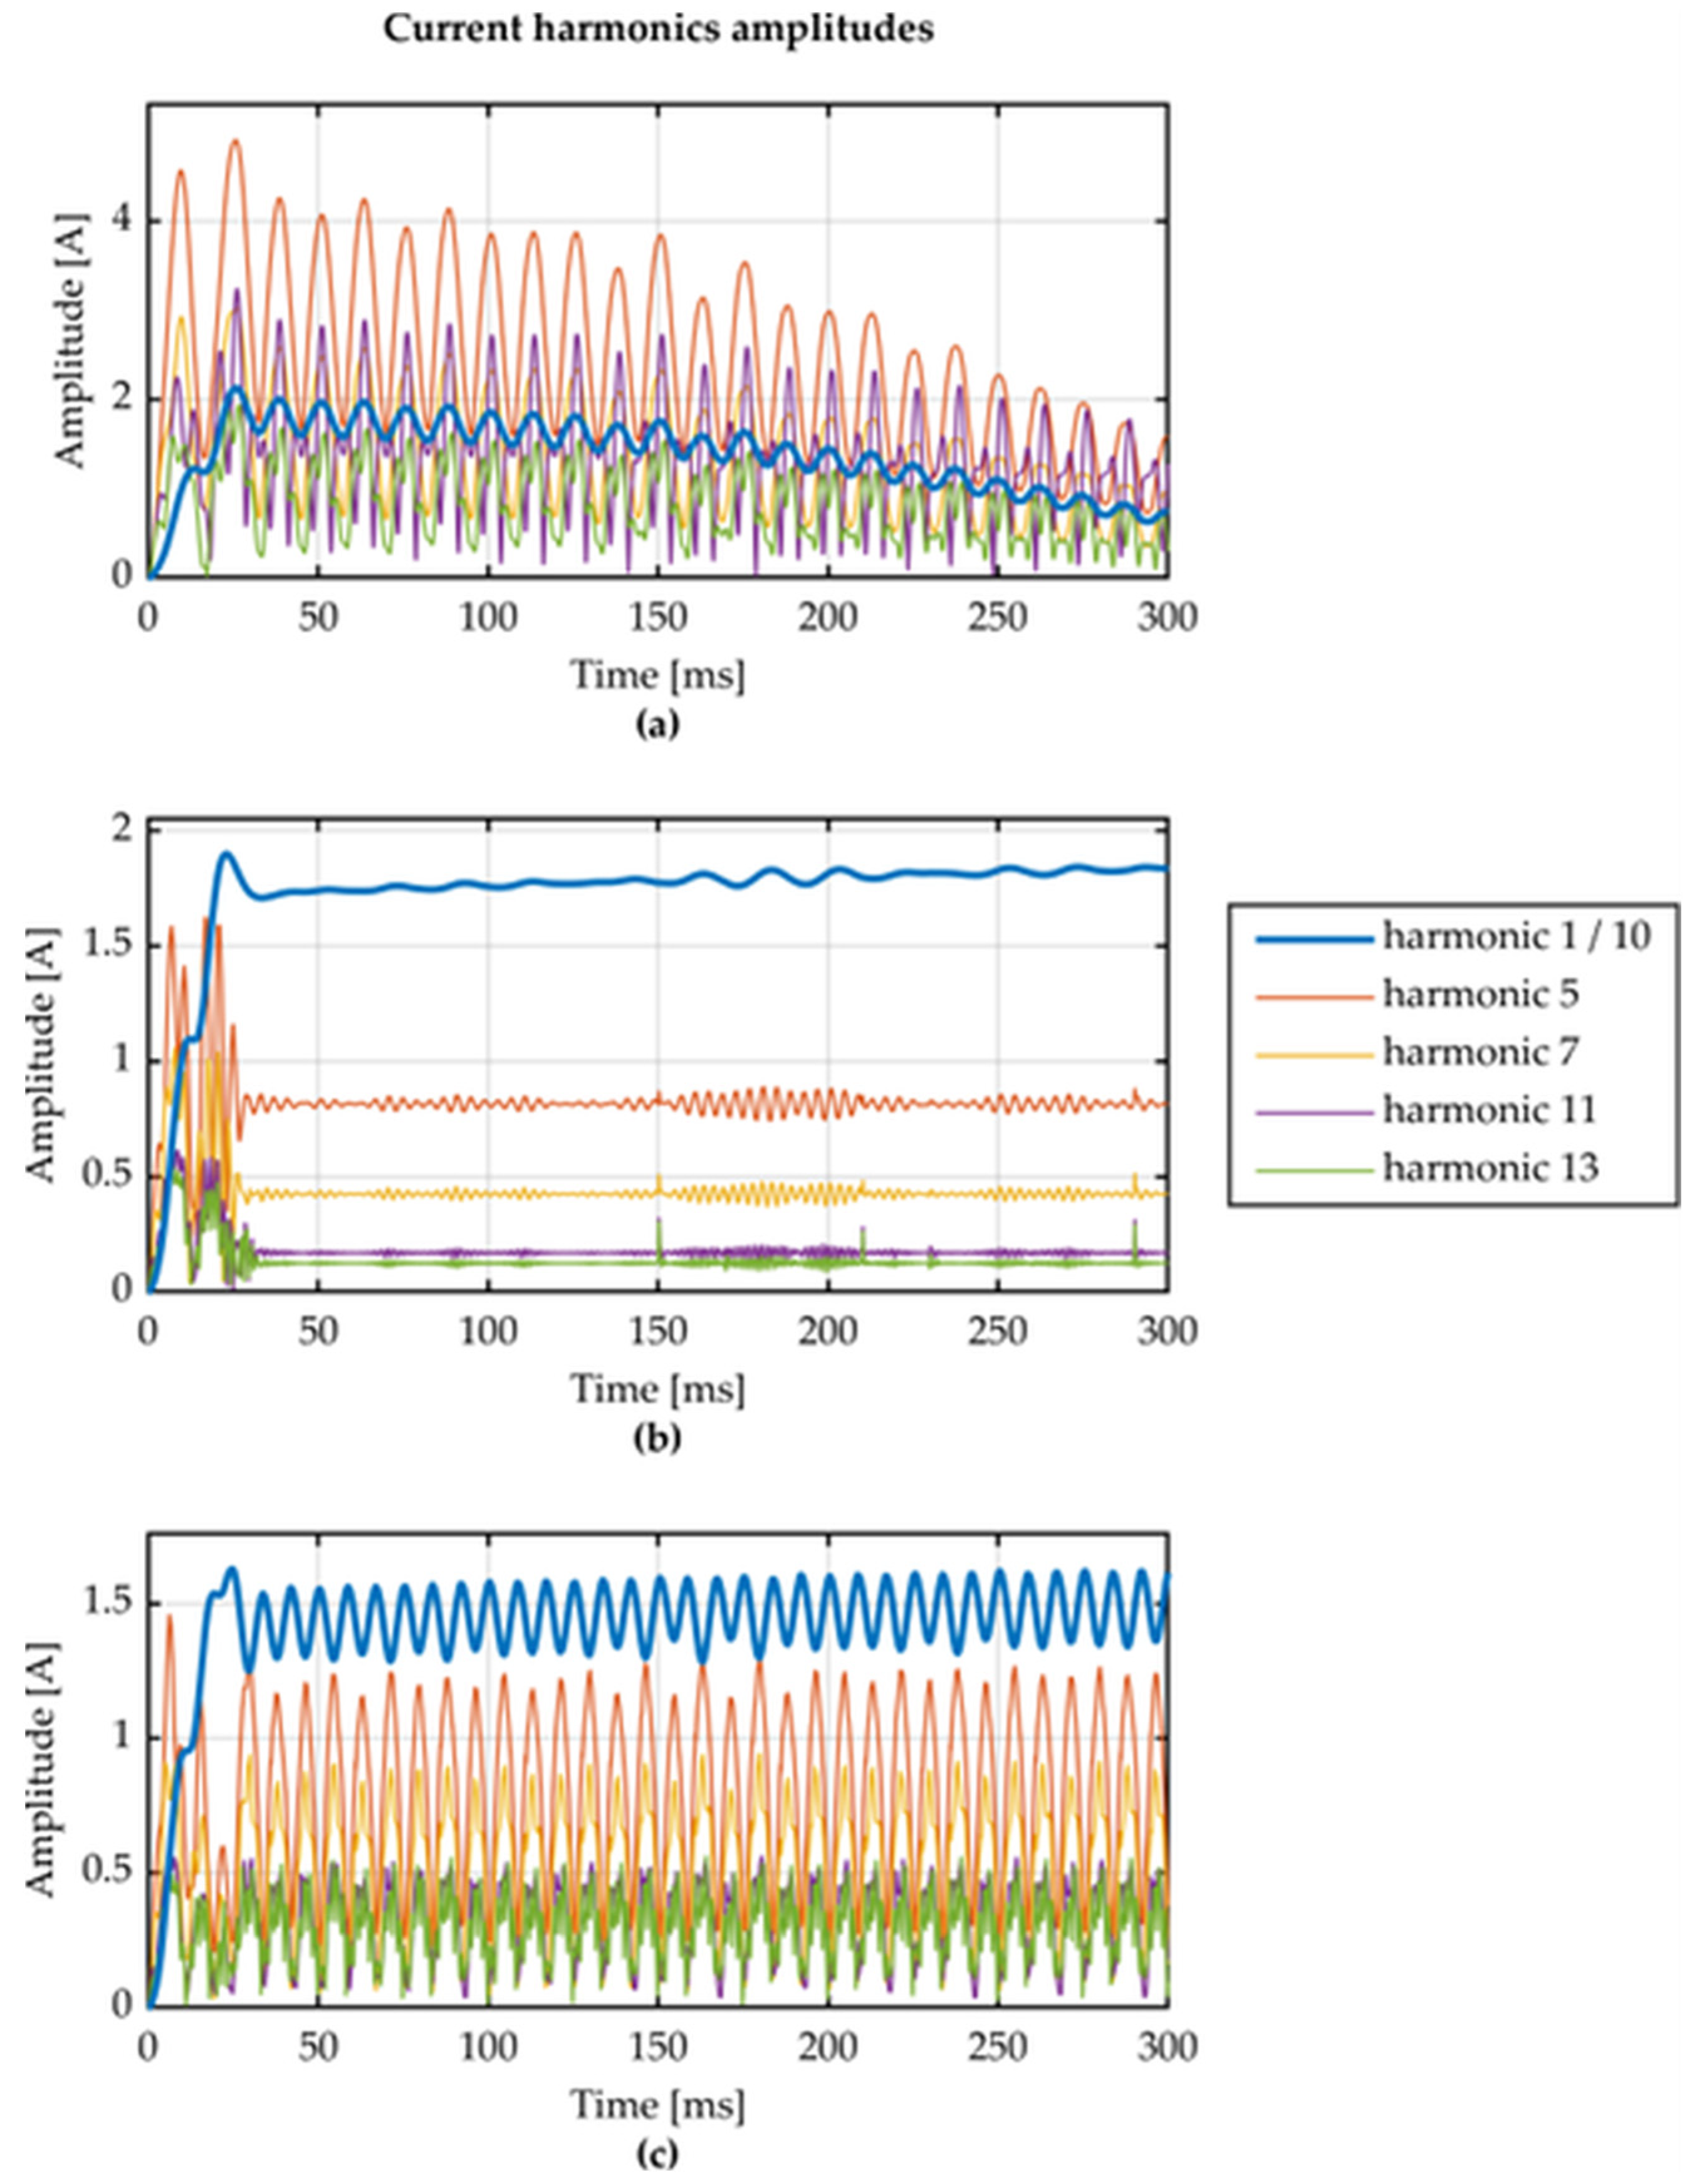
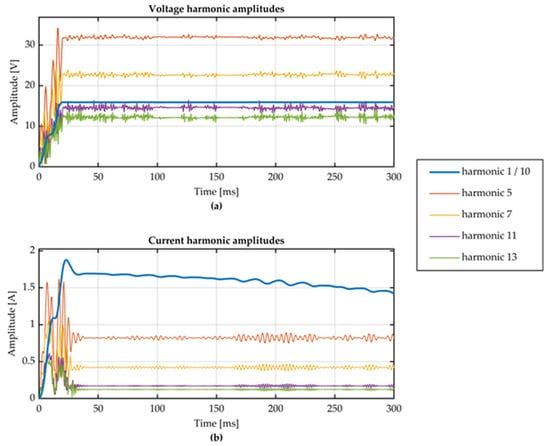
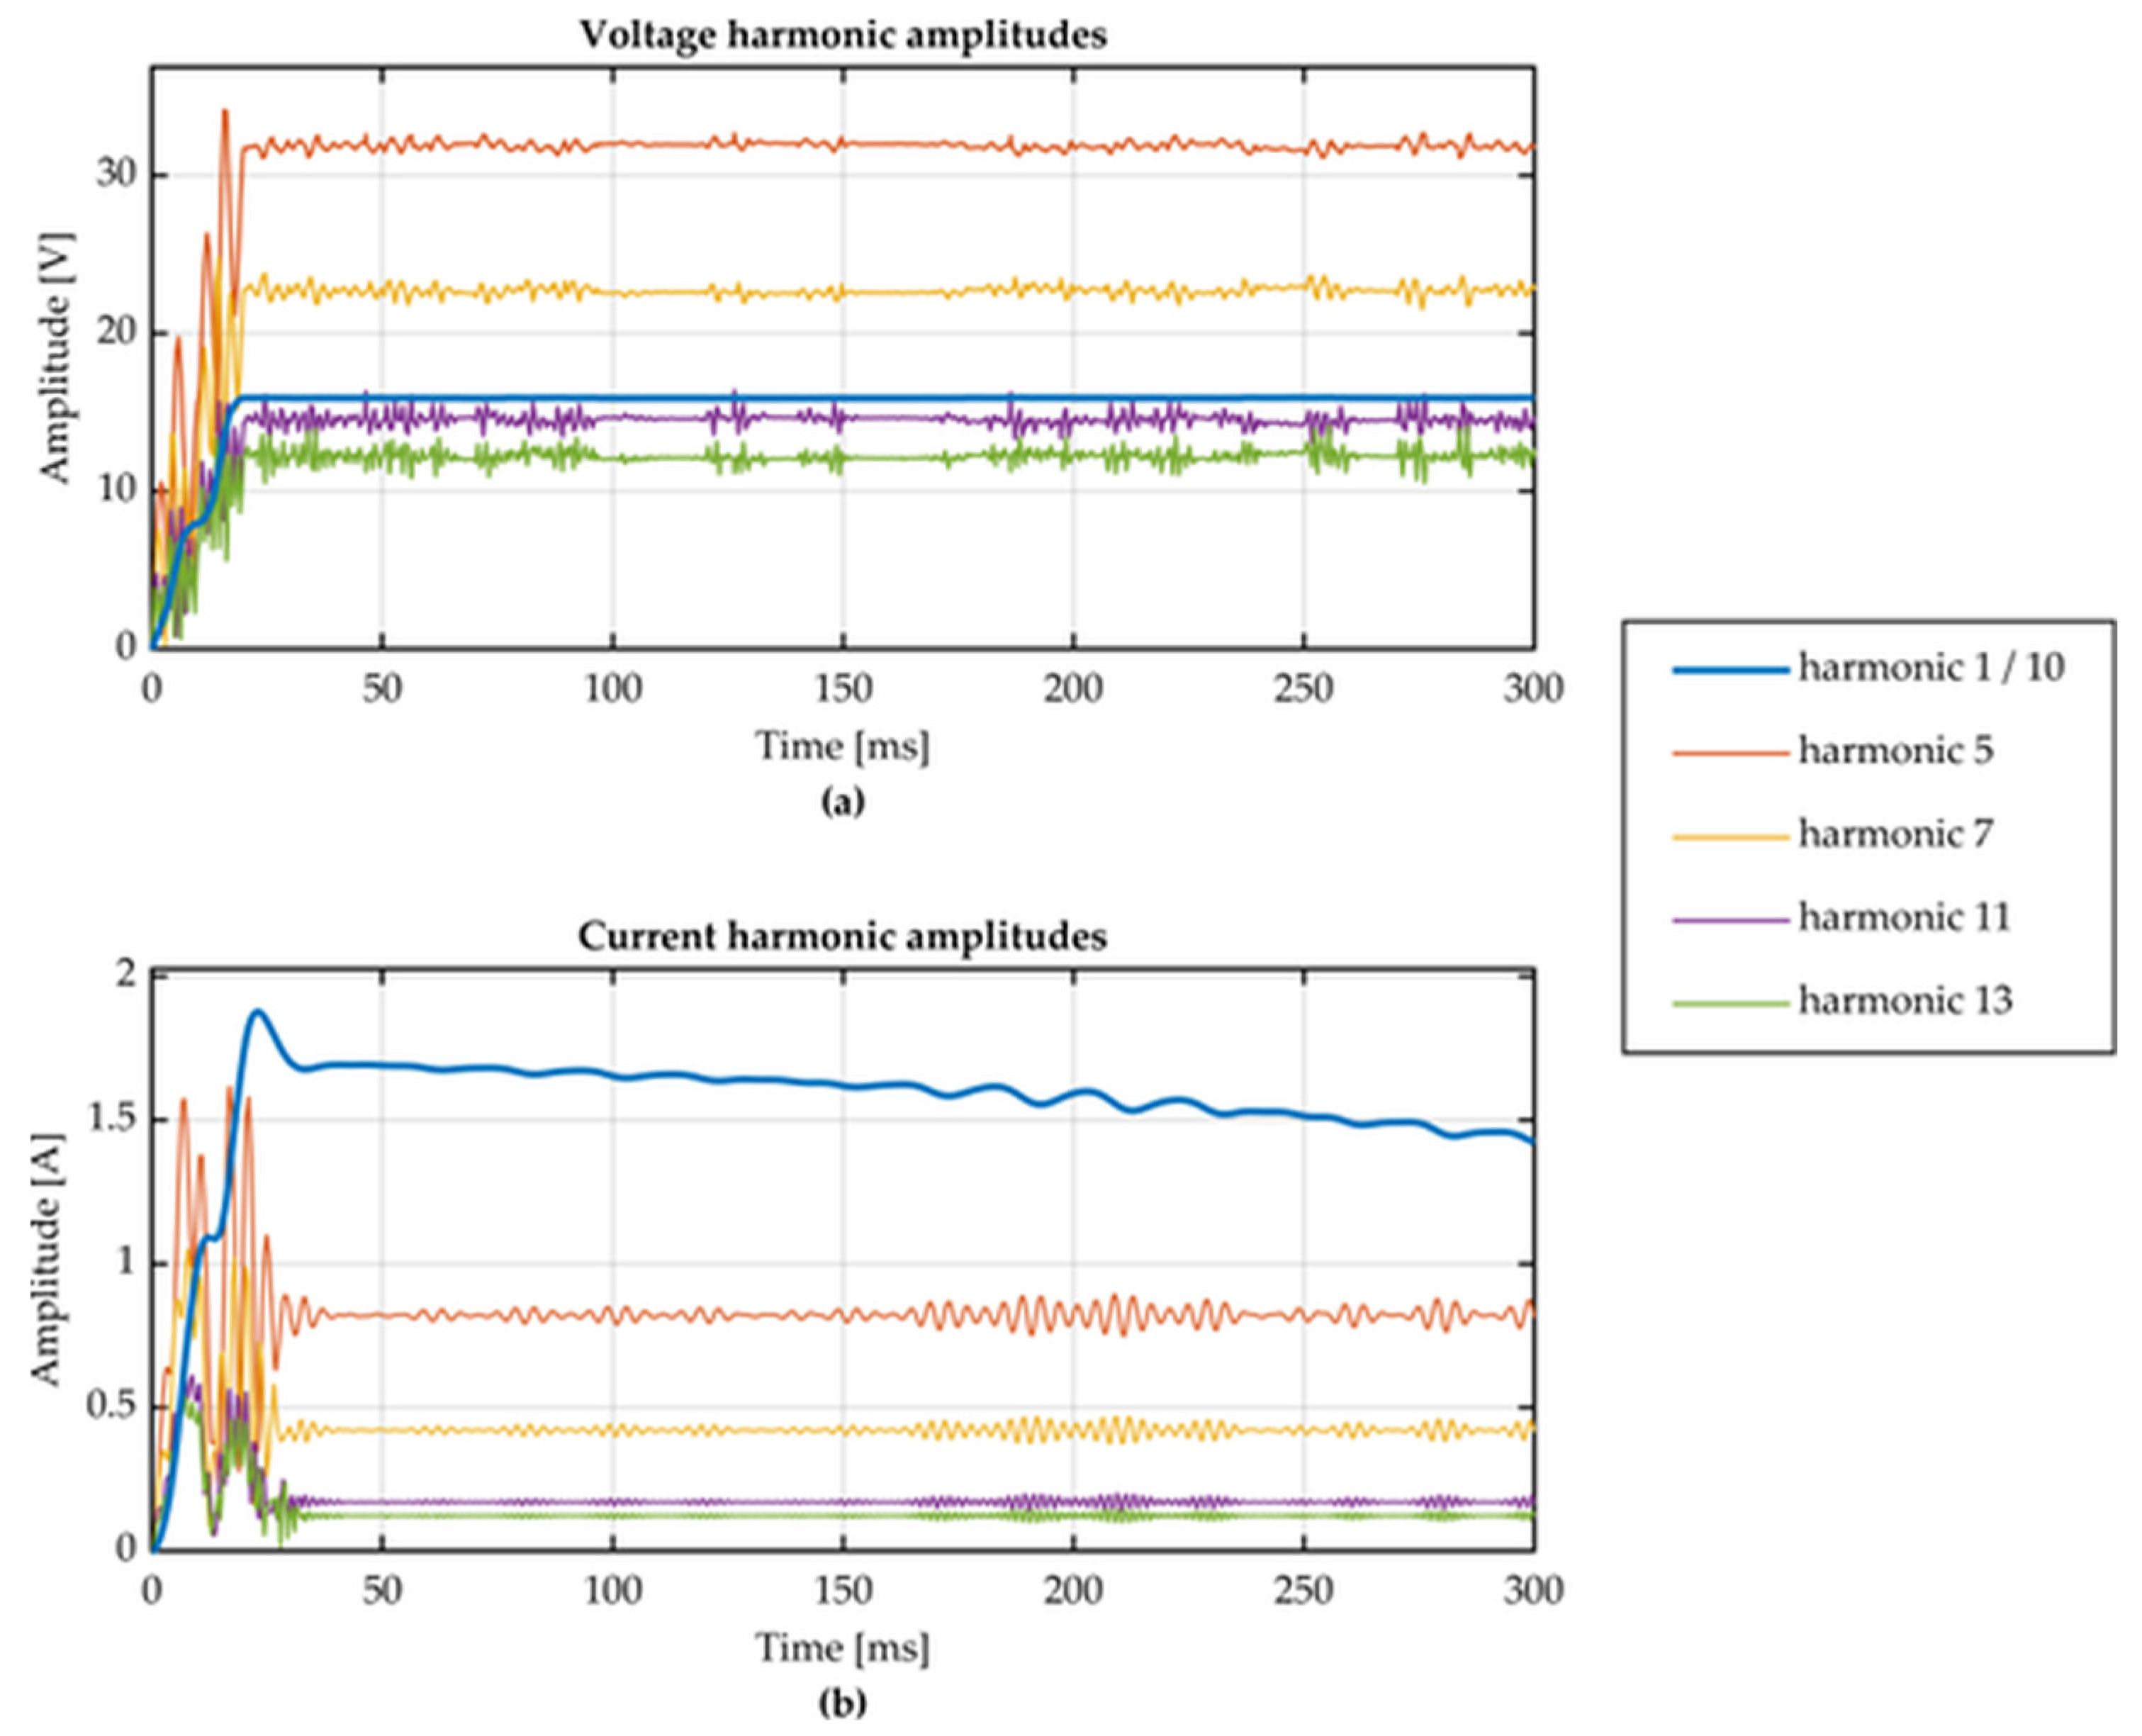

Disclaimer/Publisher’s Note: The statements, opinions and data contained in all publications are solely those of the individual author(s) and contributor(s) and not of MDPI and/or the editor(s). MDPI and/or the editor(s) disclaim responsibility for any injury to people or property resulting from any ideas, methods, instructions or products referred to in the content. |
© 2026 by the authors. Licensee MDPI, Basel, Switzerland. This article is an open access article distributed under the terms and conditions of the Creative Commons Attribution (CC BY) license.