


Abstract
Power flow analysis is fundamental to power system planning, but repeated full-network solutions become increasingly demanding as system size and scenario volumes grow with distributed energy resources. This paper develops and validates a partitioned power flow framework built around PSS®E, which is treated as a closed commercial solver without access to its Jacobian or internal solver state. The framework comprises three stages: network partitioning, automated case decomposition, and iterative boundary coordination. Spectral clustering based on real power flow, inverse reactance, and Z-bus electrical distance is compared with METIS multilevel graph partitioning using solver-independent graph metrics, quantifying the trade-off between regional balance and interface size. The resulting bus-to-zone allocation is automatically converted into independently solvable regional cases in which the far end of every inter-zone tie-line is represented by a virtual reference bus. A master–worker scheme then solves the regional cases in parallel and reconciles the voltage magnitude and phase angle of every duplicated interface bus through a relaxed boundary-consensus update, which is accelerated by Aitken extrapolation or Anderson acceleration. The framework is validated against the centralized PSS®E Newton–Raphson solution on the IEEE 30-bus, IEEE 300-bus and 6717-bus Texas synthetic systems. Both solutions are obtained under the same controls-locked conditions: transformer taps, phase shifters and switched shunts are held at their case settings and generator reactive-power limits are not applied. The comparison covers bus voltage magnitudes and angles, active and reactive power at both ends of every tie-line, total network losses, and the power-balance residual of the reassembled solution. Under these conditions, every configuration converged from a flat start with both accelerators; the largest voltage-magnitude and angle deviations from the centralized solution are p.u. and , and tie-line active power agrees to within 0.12% of the largest tie-line flow of each system (at most 0.49 MW). Coordinating discrete controls and reactive-power limits across regions is left to future work. The partitioned implementation does not provide a wall-clock speed-up on the workstation (14 logical processors). Instead, the results demonstrate the feasibility of a fully automated domain-decomposed power flow workflow around an unmodified commercial solver and quantify the accuracy and computational trade-offs of boundary-based regional coordination.
1. Introduction
1.1. Background
Power flow analysis is a foundational tool in power system planning. It determines the steady state voltage at every bus, the loading on every branch, and whether a proposed operating point is feasible under a specified set of network and operating conditions. Planners rely on it to test network reinforcements, screen contingencies, and assess the integration of new generation, loads, and distributed energy resources. Most other steady state studies take a solved power flow as their starting point. The calculation is therefore repeated extensively across planning, operational, and scenario-based studies. Industrial practice generally relies on full network solvers such as Siemens PSS®E. These tools assemble the complete system Jacobian, factorize it, and iterate to a converged solution. The approach is accurate, mature, and well understood. It remains the benchmark against which any alternative must be measured. However, conventional solution workflows are typically monolithic: the complete network model is processed as a single numerical problem for each study condition. Consequently, even when changes are concentrated within a limited part of the system, the global power flow problem is generally re-solved in its entirety.
1.2. Motivation
Power flow studies are no longer run one at a time. Distributed energy resources are making the systems that must be modeled more complex [1]. Planning, contingency, and hosting capacity studies now sweep increasingly large sets of operating conditions, contingencies, connection scenarios, and control settings. Every one of those cases is typically evaluated through a complete network solution. The workload is therefore not only larger than it once was but also naturally divisible. Network decomposition provides an alternative computational structure in which the original system is divided into electrically connected regions that can be solved separately while exchanging information only at their interfaces. The network is split into zones. Each zone is solved independently in its own process, and the zones iteratively reconcile the voltage magnitudes and angles at their shared boundaries. This decomposition has several potential structural advantages. Once regional models have been generated, each worker operates only on its assigned subnetwork, and the regional power flow solutions can be executed independently within each coordination iteration. This structure provides a basis for parallel execution and can, in principle, be extended from multiprocess computation on a single workstation to physically distributed computing environments. The practical benefit, however, depends on the trade-off between reduced regional problem size and the additional computational overhead introduced by case management, interface exchange, and iterative boundary reconciliation.
The obstacle is the solver itself. Many distributed power flow formulations in the literature assume access to solver internals, including Jacobian blocks, sensitivities, and iteration state. Industrial practice runs on closed commercial tools that expose none of these. PSS®E is representative: it is driven through a public Python API and its Newton–Raphson engine is compiled inside a binary and does not expose the Jacobian or internal nonlinear solver state that is required by many conventional domain decomposition formulations. This creates a practical implementation gap between domain decomposition methods that are developed in research environments and their use with established commercial power system software. Addressing this gap requires network partitioning, regional case generation, local power flow execution, and boundary reconciliation to operate using only quantities that are available through the external solver interface. Accordingly, this paper develops and evaluates an automated network-decomposition framework in which PSS®E is treated as an unmodified black-box power flow solver. The proposed workflow combines graph-based partition allocation, automated construction of independently solvable regional cases, parallel regional Newton–Raphson solutions, and a relaxed boundary-consensus procedure that iteratively reconciles interface voltage magnitudes and angles without requiring access to the solver Jacobian or internal iteration state.
1.3. Organization
The paper is organized around the three stages of the framework. Section 2 reviews the related work and identifies the research gaps. Section 3 defines the proposed framework and states the contributions. Section 4 introduces the test systems. Section 5, Section 6 and Section 7 then present the three stages in turn: the partition allocation study and the selected method, the automated case splitting pipeline, and the parallel boundary-consensus coordinator. Section 8 reports the end-to-end validation of the assembled framework against the centralized solver. It covers convergence behavior, computational performance, memory requirements, and solution accuracy relative to the centralized Newton–Raphson reference. Section 9 concludes the paper and identifies opportunities for extending the framework to larger systems and distributed computing environments.
The central research question that is addressed in this work is whether a commercial power flow solver can be embedded within a fully automated domain-decomposed workflow without access to its internal Jacobian or nonlinear solver state while retaining acceptable agreement with the corresponding centralized solution. The study therefore evaluates not only the feasibility of automated decomposition and coordination but also the resulting trade-offs among partition quality, convergence behavior, computational overhead, and solution accuracy.
2. Literature Review
2.1. Power Flow Analysis and the Cost of Repeated Solutions
The steady state power flow problem and its solution by Newton–Raphson iteration are long established and treated definitively in the standard references on load flow analysis [2,3]. The robust numerical characteristics of the method have contributed to its widespread use in commercial tools such as Siemens PSS®E [4], supported by the optimally ordered sparse factorization techniques that keep each iteration computationally feasible on large networks [5] and approximate variants such as fast decoupled load flow, which trade some modeling fidelity and convergence robustness for speed [6]. The cost of a centralized solve is nevertheless influenced by the size, sparsity, and conditioning of the global system equations, and the complete network solution is generally repeated for each operating scenario [3,7].
The rapid penetration of distributed energy resources (DERs) has increased the number and diversity of operating conditions that must be assessed. Rooftop solar already supplies more than ten percent of Australia’s electricity [8], and connection volumes continue to grow [9], so operators must screen increasing numbers of candidate scenarios for planning, contingency, and hosting capacity studies. Reviews of high-performance computing applied to power flow analysis identify the linear system solve as a major computational component of power flow analysis [1]. Repeated across large scenario sets, this cost motivates the investigation of alternative computational structures that can exploit parallelism or regional decomposition. Interest has therefore shifted towards distributed and partitioned formulations in which the network is divided into independently solvable zones whose shared boundaries are iteratively reconciled to recover a network-wide solution.
2.2. Network Partitioning of Power Systems
Decomposing a large network into separately solvable pieces predates modern parallel hardware. Kron’s diakoptics established the principle that a large system may be solved piecewise provided that the interconnection variables are correctly accounted for [10]. The same idea underpins modern domain decomposition treatments of sparse linear systems [11]. Contemporary work recasts the task as graph partitioning, where partition quality strongly influences the computational characteristics of the resulting regional solution: few tie-lines reduce the boundary information that must be exchanged, and zones of similar size distribute work evenly. Because a parallel solver is affected by workload imbalance between zones, both properties matter.
Spectral clustering is a widely used family of methods in power system studies that is applied to controlled islanding, voltage zone identification, and decomposition for distributed computation. The approach rests on the graph Laplacian, whose low-order eigenvectors expose the dominant connectivity structure of the network [12,13]. Its objective is often formulated through spectral relaxations of graph cut objectives such as the normalized cut introduced by Shi and Malik [14], which scores a partition by the cut weight between zones relative to the volume of each zone and thereby avoids the degenerate solutions that a raw minimum cut admits. The earlier spectral ratio cut method of Hagen and Kahng addresses the same degeneracy in circuit partitioning [15], and guarantees for spectral partitioning have been established on structured graphs such as planar graphs and finite element meshes [16]. What distinguishes applications is the edge weight. Weighting branches by real power flow treats heavily loaded corridors as strongly coupled [17,18], whereas parameter-based weights such as inverse reactance or impedance-derived electrical distance avoid any dependence on the operating point [19,20]. Sensitivity-based electrical distance has a long history in secondary voltage control zoning [21] and remains the subject of comparative study [22]. The recognized weakness of the family is that good electrical separation does not necessarily guarantee balanced region sizes. Depending on the graph weighting and clustering procedure, the resulting partitions may contain significantly different numbers of buses, which can reduce computational balance in a parallel implementation [12].
Multilevel graph partitioning approaches the same problem from the combinatorial side. The scheme coarsens the graph through successive vertex matchings, partitions the smallest graph directly, and then projects the partition back while refining it at each level [23,24]; the refinement step derives from the Kernighan–Lin boundary exchange heuristic [25] and its linear time reformulation by Fiduccia and Mattheyses [26]. Because multilevel approaches can explicitly constrain partition balance while reducing edge cuts, the resulting regions can be better suited to parallel workloads where similar regional problem sizes are desirable. The method runs in near linear time using topology alone, and the METIS has consequently become a widely used tool for decomposing large sparse graphs in parallel scientific computing [24].
Partition quality is assessed with solver-independent graph measures. Newman modularity compares intra-zone connectivity against a degree-preserving random graph [27] and is standard in the wider community detection literature [28], while the normalized cut and the tie-line count capture boundary size and inter-regional coupling. Network partitioning also remains active for goals that share these tools but differ in objective, including the coordination of networked microgrids [29], constrained k-way normalized cut formulations [30], and the aggregation of distribution grid flexibility [31]. That work confirms the maturity and breadth of partitioning but also illustrates that the preferred partition depends strongly on the downstream application. In the present work, the partition must balance electrical separation, regional size, and the number of interfaces that must subsequently be reconciled during the distributed power flow solution.
2.3. Distributed Power Flow Coordination and Boundary Reconciliation
Once a network is partitioned, the zones must be brought into agreement on their shared boundary variables. Surveys of distributed optimization and control for electric power systems catalogue the available coordination schemes and, importantly, the information that each one requires from its sub-solvers [32]. The Alternating Direction Method of Multipliers is an established approach for coordinating decomposed optimization problems [33]. Its convergence behavior is characterized both classically [34] and through more recent continuous time analyses [35]. Within power systems it has been applied to optimal power flow [36,37], distributed OPF for microgrids [38], and state estimation, demand response, and market coordination [39]. Parallel and asynchronous variants relax the global synchronization barrier in order to exploit multicore hardware [40,41], learning-based schemes have been proposed to accelerate convergence [42], and related decomposition methods such as ALADIN provide alternative distributed optimization strategies at the cost of requiring derivative information from each sub-solver [43]. Closer to the present work, Benato and Gardan proposed a multi-area power flow algorithm in which each area is first solved as an independent power flow problem with its own slack bus using any power flow solver and the area solutions are then iteratively composed into the overall solution through a generalization of Thevenin’s theorem and a tie-line admittance matrix [44]. That study also supports parallel solution of the areas and validates the method numerically against the commercial software DIgSILENT PowerFactory. It therefore shows that independently solved regional power flows can be combined into a network-wide solution without a monolithic global solve. In that formulation, however, the areas are predefined control areas and the composition step is carried out through an explicit tie-line matrix procedure. The commercial tool is used as an independent reference rather than the embedded area solver. These methods provide important context for distributed coordination; however, their information requirements are not necessarily compatible with a commercial power flow solver treated as a numerical black box. In particular, the conventional ADMM and related optimization-based decomposition methods are formulated around explicit local optimization variables, consensus constraints, penalty terms, and, in many cases, derivative or dual-variable information. The problem addressed in this work is different in that each regional subproblem is solved directly using the existing PSS®E Newton–Raphson power flow engine. The coordinator has access to solved network quantities through the public API but does not access the internal Jacobian, sensitivities, or nonlinear solver state. Coordination must therefore be performed through externally accessible interface quantities. Accordingly, the current framework uses virtual boundary reference buses and iteratively updates their set-points through a relaxed boundary-consensus procedure. The regional power flow problems remain independent Newton–Raphson solutions, while the outer coordination process drives their interface voltage magnitudes and angles towards consistency. The method is therefore more appropriately characterized as a relaxed boundary reconciliation or domain decomposition procedure rather than a conventional ADMM optimization algorithm. Section 7 develops this coordination procedure in detail.
Two further differences separate the multi-area algorithm of Benato and Gardan [44] from the present framework. First, its composition step requires the network matrices of every area: each area is represented at its boundary buses by a Ward equivalent, which is obtained by inverting the admittance matrix of the area and reducing it to those buses. The freedom to choose the solver therefore applies to the solution within each area, whereas the present framework coordinates the regional cases using only the solved bus voltages returned by the solver’s public interface. Second, that algorithm is implemented in MATLAB and demonstrated on three interconnected WSCC 9-bus areas with predefined control areas, and PowerFactory provides the reference solution after the network is reconfigured to a single slack bus. The present framework instead uses the commercial solver as the regional engine, automates partitioning and regional case generation, and is evaluated on systems of 30 to 6717 buses. The two contributions are therefore complementary.
2.4. Parallel and High-Performance Power Flow Computation
A parallel body of literature addresses the acceleration of power flow, OPF, and dynamic simulation through multicore and distributed computation, including domain decomposition of the network equations and the distribution of independent cases across processors; representative work demonstrates parallel processing of combined transmission–distribution dynamic simulation [45]. Of particular relevance here, recent studies have examined how the choice of grid partitioning algorithm affects combined distributed AC optimal power flow and parallel power grid simulation, confirming that partition quality and the resulting coordination overhead materially shape the achievable computational performance [46]. This body of work establishes both the opportunity (since modern planning workloads are highly parallelizable) and the obstacles, chiefly coordination overhead and the memory duplication incurred when each worker holds an independent copy of the solver and its data. Decomposition therefore does not inherently guarantee a wall-clock speed-up. Process creation, case loading, synchronization, boundary exchange, and repeated regional solver calls introduce additional overhead that must be offset by the computational benefit of smaller regional problems. Classical parallel computing bounds provide a useful interpretation: the serial fraction of a workload limits the attainable speed-up for a fixed problem size [47], while the achievable benefit can increase when problem size and available parallel resources are scaled together [48].
A further practical consideration arises when the underlying commercial solver requires each worker to initialize a separate software instance. Although each worker may contain only a regional network case, solver runtime and process-level data structures can be replicated across workers. Consequently, memory use and process management overhead must be considered alongside solution time when evaluating the practical value of a distributed implementation. For this reason, the framework in this paper is evaluated not only in terms of solution accuracy but also with respect to convergence behavior, wall-clock execution time, and memory requirements.
2.5. Research Gaps
Much of the work above is implemented in open research codes such as MATPOWER [49] or purpose-written prototypes and is evaluated on openly available benchmark archives [50] and synthetic networks that were built to reproduce the structural characteristics of real systems [51]. Such environments typically give direct access to the network equations and solver variables, Jacobians, sensitivities, or algorithmic state. This enables decomposition strategies that are difficult to reproduce when the power flow engine is embedded in closed commercial software. PSS®E exposes a more restricted interface. Network data and solved bus quantities can be read and written through its public Python API, but the Newton–Raphson Jacobian and the nonlinear iteration state cannot. Multi-area algorithms that allow each area to be solved by an arbitrary power flow solver exist [44], but their coordination step still relies on each area’s network matrices.
The contribution of this paper is therefore not a new power flow engine, a new graph partitioning algorithm, or the first use of a commercial solver in a distributed workflow. It is a capability: an automated end-to-end domain-decomposed power flow workflow in which every regional problem is solved by an unmodified commercial Newton–Raphson solver and the regions are coordinated exclusively through quantities that are available from its public interface. Specifically, the study develops and evaluates:
- Automatic partitioning of a complete PSS®E network model and its conversion into independently solvable regional cases;
- Reconciliation of the regional solutions through relaxed consensus on boundary-voltage magnitude and angle without access to the global or regional Jacobians;
- Validation of the assembled framework against the centralized reference on bus voltages and angles, tie-line power flows, network losses and power-balance residuals. The evaluation also covers the associated trade-offs in partition balance, interface size, convergence and execution time and reports the memory use of the partitioned framework.
These aspects define the technical scope of the framework that is presented in the following sections.
3. Proposed Framework
The proposed framework addresses the research gaps by assembling a complete partitioned power flow workflow on top of an unmodified commercial solver. Its governing constraint is that PSS®E is treated strictly as a black box: it is driven only through its public Python API, no internal solver data is requested, and no attempt is made to alter or replace its Newton–Raphson engine. The resulting framework is therefore designed around quantities that can be accessed or modified externally, principally network topology, bus and branch data, regional case files, and solved bus voltage quantities. This constraint distinguishes the proposed implementation from decomposition methods that require direct manipulation of Jacobian blocks, derivative information, or internal nonlinear solver states.
The workflow is organized as three sequential stages that together carry a single monolithic case file through to coordinated regional power flow solution.
- Network partition allocation: The bus-branch topology of the master case is treated as a graph and divided into k zones. Because the allocation fixes both the distribution of network buses across regional workers and the volume of boundary data that must later be exchanged, it is treated as an explicit selection stage rather than a fixed choice: four candidate partitioning approaches—real power flow-weighted spectral clustering, inverse reactance-weighted spectral clustering, Z-bus electrical distance clustering, and METIS multilevel graph partitioning—are implemented under a common workflow and compared using consistent graph-based metrics. The selected allocation is subsequently passed to the automated case generation stage.
- Automated case splitting: The abstract bus-to-zone map is realized as k structurally complete PSS®E cases, each solvable in isolation. Inter-regional connections are identified and represented within each regional case through virtual boundary reference buses. These buses provide externally controllable voltage boundary conditions that represent the electrical influence of the neighboring regions omitted from the local model. The resulting regional cases preserve their internal network topology while exposing the interface quantities required by the coordination stage.
- Parallel boundary-consensus coordination: A master coordinator dispatches the regional cases to a pool of worker processes, each hosting its own PSS®E instance, and coordinates the regional solutions through iterative exchange of their boundary-voltage quantities. During each outer coordination iteration, the regional cases are solved independently using the PSS®E Newton–Raphson engine. The solved interface voltages are returned to the master process and used to update the corresponding virtual boundary conditions through a relaxed consensus rule. The process is repeated until the duplicated representations of every interface voltage agree in magnitude and angle to within a specified convergence tolerance. Importantly, the coordination procedure operates outside the PSS®E power flow engine and does not modify its local Newton–Raphson formulation. It therefore acts as an outer domain decomposition layer around a set of conventional regional power flow solutions.
Therefore, the contributions are threefold. First, the study provides a consistent comparison of four network partitioning approaches (flow-weighted, reactance-weighted, electrical distance and multilevel graph partitioning) across test systems ranging from 30 to 6717 buses. The comparison evaluates partition balance, interface size, graph separation, and computational cost using metrics that are independent of the downstream power flow solver. Second, an automated case decomposition pipeline is developed to transform a full PSS®E network model into independently solvable regional cases while retaining controllable electrical representations at the inter-regional boundaries. This demonstrates that regional power flow models can be generated programmatically around an unmodified commercial solver. Third, a relaxed boundary-consensus coordinator is developed that requires only quantities that are available through the public PSS®E interface. The framework therefore demonstrates that multiple independent commercial solver instances can be coordinated without access to their Jacobians or internal nonlinear iteration states while permitting the resulting regional solution to be quantitatively compared against the corresponding centralized Newton–Raphson reference.
The scope of the claims made in this study is deliberately limited. The primary objective is to establish the technical feasibility of the complete decomposition and coordination workflow and to quantify its agreement with the centralized reference solution. Computational behavior is reported as a secondary observation, and no wall-clock speed-up is claimed: all the power flow experiments run on a single 14-core workstation, and the partitioned framework was slower than the centralized solver on all three test systems. The computational results are therefore interpreted as an assessment of implementation behavior rather than evidence of parallel acceleration. The present contribution lies primarily in the automated architecture: partition allocation, regional model generation, independent commercial solver execution, and iterative boundary reconciliation are integrated into a single reproducible workflow. The framework is thus positioned as complementary to existing multi-area power flow algorithms such as that of Benato and Gardan [44]. Its focus is not a new mathematical composition of area solutions but the end-to-end automation and evaluation of a decomposed workflow in which a closed commercial engine itself serves as the regional solver. The accuracy, convergence, timing, and memory characteristics of this architecture are evaluated in Section 8.
4. Test Systems
Three standard systems were used throughout the study, chosen to span a broad range of network sizes and to evaluate the behavior of the proposed framework from small benchmark systems to an interconnection-scale synthetic network, the 6717-bus Texas synthetic grid [52]. Each system is partitioned into k zones, where k is the only user-supplied parameter of the partitioning stage. It fixes the number of standalone regional cases the splitter produces and therefore the number of independent local solves the coordinator dispatches in every outer iteration; the average zone therefore contains roughly of the system’s n buses. Increasing k generally reduces the size of each regional subproblem but can also increase the number of inter-regional boundaries that must be reconciled during the coordination process. The selected values of k were therefore increased with network size to provide multiple regional subproblems while retaining a manageable number of interfaces for the present validation study. A systematic optimization of k is outside the scope of this work and is identified as an area for future investigation. Table 1 summarizes the test systems and the partition counts used in the experiments.
Table 1.
Test systems used for validation. Network statistics are counted directly from the PSS®E v33 RAW case files used in this study.
5. Stage 1: Network Partition Allocation
The boundary-consensus coordination framework is flexible regarding how buses are assigned to zones, but that assignment directly influences the computational characteristics of the subsequent regional solution: balanced zones reduce workload imbalance between workers, and few tie-lines reduce the number of inter-regional interfaces that must be represented and reconciled. Network partition allocation is therefore treated here as an explicit preprocessing and method selection stage. Four candidate methods were implemented behind a common interface and run under identical conditions on the test systems to compare their balance, separation quality, interface size, and computational requirements before selecting one method for the downstream decomposition workflow.
5.1. Candidate Methods
Three of the four candidates are spectral methods sharing a common core. Each builds a weighted graph whose vertices are buses and whose edges are branches, constructs the graph Laplacian from the weighted adjacency matrix W and the corresponding degree matrix D, and uses a low-dimensional spectral embedding to represent the dominant connectivity structure of the network. The embedded bus representations are subsequently grouped into k zones using the same clustering procedure for all three spectral variants, so their principal difference is the definition of electrical coupling assigned to each graph edge. The partitioning objective is related to spectral graph cut formulations such as the normalized cut (NCut) [14],
where are the zones, is the complement of , is the total weight of the branches between and and is the total weight of the branches incident on the buses of . Every spectral variant therefore aims to group electrically well-connected buses into the same zone while keeping inter-zone coupling comparatively small. What distinguishes the three is only the edge weight , that is, the definition of electrical closeness [12,19].
The MW flow method defines as the magnitude of real power flow on branch under a solved base case operating point. The underlying idea is that heavily loaded corridors are strongly coupled and should remain within the same zone. Its main limitation is that, because the flow pattern depends on the operating point, the resulting partition can change with dispatch and loading conditions. As a result, a solved base case power flow solution is required before partitioning can be performed.
The other two spectral methods are parameter-based and do not require a prior power flow solution. The method assigns each branch a weight equal to the inverse magnitude of its series reactance, so lines with small series reactance indicate strong electrical coupling and tend to keep buses together in the same zone. Because the weighting is derived from branch parameters rather than a solved power flow state, the resulting graph is independent of the particular active-power dispatch that is used in the MW-weighted method. The Z-bus method takes a more global electrical view by defining the distance between buses as
where Z is the Moore–Penrose pseudoinverse of the bus admittance matrix Y. The resulting impedance-derived distance provides a system-level measure of electrical separation and is related to electrical distance measures that are used in voltage-control zoning and network aggregation. However, directly clustering the raw Z-bus distance can isolate the radial buses. To address this, the implementation clusters a restricted topology graph whose edges are weighted by , combining electrical distance with structural connectivity. The main computational cost arises from computing the pseudoinverse, a dense operation of complexity in standard direct implementations [11], which becomes significant for large systems. All the electrical distance calculations are performed on a common per-unit network representation before the resulting weights are mapped to the topology restricted graph.
The METIS method differs from the spectral methods, partitioning by multilevel refinement in three phases. A coarsening phase repeatedly collapses matched vertex pairs to build a sequence of progressively smaller graphs; the coarsest graph is partitioned directly; and an uncoarsening phase projects the partition back level by level, applying a Kernighan–Lin/Fiduccia–Mattheyses style boundary search to refine it at each step [25,26]. The refinement minimizes the edge cut subject to a balance tolerance, which, in the configuration used here, allows the largest zone to exceed the average size by about 3% (Section 5.2). The multilevel partitioning procedure explicitly favors balanced vertex counts while reducing the edge cut, making it suitable for parallel workloads in which substantial differences in regional size can create worker imbalance. In the implementation considered here, the METIS uses only the unweighted network topology (no power flow and admittance matrix are needed) and runs in near linear time, which is why it is widely used for partitioning large graphs in parallel scientific computing [23,24]. Table 2 summarizes the four configurations.
Table 2.
Configuration of the four candidate partitioners.
5.2. METIS Implementation
Producing the METIS allocation requires a topology reader and the METIS bindings: pymetis, the Python interface to the METIS C library, together with networkx, NumPy, SciPy and pandas. Pre-built pymetis packages are distributed through conda-forge, and the METIS results reported in this paper were produced in a conda-forge Python 3.11 environment with pymetis 2025.2.2, which wraps METIS 5.1.0. No PSS®E license, power flow solution, or admittance matrix is required at this stage. Given a PSS®E RAW case and a zone count k, the procedure returns a bus-to-zone allocation (Algorithm 1).
| Algorithm 1 Generate a METIS partition for parallel power flow zoning |
| Inputs: PSS®E RAW case file; number of zones k (); random seed ; imbalance tolerance (largest zone up to about ) |
| Output: bus-to-zone allocation map ; partition quality metric set M |
| 1: Read the PSS®E RAW case file |
| 2: Extract all bus numbers from the BUS section and store them as graph nodes V |
| 3: Extract all AC branches from the BRANCH section and store them as graph edges E |
| 4: Extract transformer connections from the TRANSFORMER section |
| 5: For a two winding transformer, add one edge between its terminal buses |
| 6: For a three winding transformer, represent all three winding terminals in the graph using a topology preserving equivalent representation |
| 7: Construct an undirected graph , where buses are nodes and branches/transformers are edges |
| 8: Remove self loops and merge parallel circuits into single graph edges |
| 9: Convert G into the adjacency list format required by METIS |
| 10: Set the METIS options: k-way scheme (recursive bisection disabled), contiguous zones (contig = 1), seed s, imbalance tolerance ufactor = u |
| 11: Apply METIS k-way partitioning to divide G into k zones |
| 12: Convert the METIS label vector into a bus-to-zone mapping |
| 13: For each zone, check whether the assigned buses form a connected subgraph |
| 14: If a zone is disconnected: keep the largest connected component in its original zone and reassign each smaller disconnected fragment to the neighboring zone with the highest number of connecting edges |
| 15: End if |
| 16: Repeat the connectivity check until every zone forms a connected subnetwork |
| 17: Compute the quality metrics M: (1) zone sizes; (2) tie-lines; (3) boundary buses; (4) modularity; (5) normalized cut; (6) connected components |
| 18: Export the final bus-to-zone allocation file and partition map |
The method depends only on the case file and the assigned number of zones k. First, the RAW file is parsed to extract the bus and branch lists. An undirected unweighted graph is then constructed with parallel branches merged into a single edge and self loops removed. Bus identifiers are relabeled to contiguous 0-based indices and converted into the adjacency list format required by the METIS. The graph is partitioned using pymetis.part_graph, which performs multilevel coarsening, partitioning, and refinement. Four METIS options are set explicitly. Recursive bisection is disabled because pymetis otherwise selects recursive bisection whenever ; the multilevel k-way scheme is therefore used for all three test systems. Contiguity is enforced (contig = 1) so that the METIS itself returns connected zones. The random seed is fixed at . The imbalance tolerance is set to ufactor = 30, the METIS default for the k-way scheme, which allows the largest zone to exceed by about 3%. Finally, a connectivity repair step reassigns any disconnected components to neighboring zones until every zone forms a single connected component, preventing disconnected regional islands before downstream case generation. Because contiguity is already enforced inside the METIS, this step acts only as a safeguard: for all three test systems, the zones returned by the METIS were connected and the repair moved no buses. Topological connectivity alone does not mathematically guarantee non-singularity or Newton–Raphson convergence; the solvability of every generated regional case is therefore verified separately during Stage 2. The resulting partition is written as a simple (BusID, ZoneID) table for the Stage 2 network splitter.
5.3. Evaluation Metrics
Partitions are scored on solver-independent measures computed on the common network topology so that the candidate methods can be compared on a consistent basis. Separation quality is captured by Newman modularity [27], where larger values indicate a stronger concentration of connections within zones than in a degree-preserving random graph, and the normalized cut value in which lower is better. Boundary size is captured by the tie-line count (the number of branches whose endpoints lie in different zones) and the number of buses incident on those inter-zone connections. Balance is captured by the size coefficient of variation, , of the zone sizes, so closer to 0 is better. A connectedness check requires exactly one connected component per zone, and the wall-clock runtime of the partitioning step is recorded.
5.4. Comparison Results
The quantitative comparison of the four methods across the three test systems is given in Table 3, and the corresponding allocation maps are shown in Figure 1, Figure 2 and Figure 3. The maps were generated in Python with the NetworkX library, which computes a force-directed (spring) layout of the network with a fixed random seed, so the bus positions are identical for all four methods of a given system, and they were drawn with Matplotlib 3.11.2. Node color indicates the zone, gray lines are internal branches and red dashed lines are tie-lines. The full IEEE 300-bus and Texas 7k maps are too dense to read at page size, so, for these two systems, each map is shown with three numbered boxes whose contents are enlarged in the accompanying panels. The enlargements were prepared manually in Microsoft PowerPoint by cropping the full-resolution map image; nothing was redrawn.
Table 3.
Comparison of the four partitioning methods on the three test systems. Higher modularity (↑) and lower NCut (↓) are better.
Figure 1.
Partition allocation maps for the IEEE 30-bus system, : (a) METIS; (b) spectral ; (c) spectral MW; (d) Z-bus distance. Node color indicates the zone, gray lines are internal branches, and red dashed lines are tie-lines. Maps drawn in Python with NetworkX and Matplotlib.
Figure 2.
Partition allocation maps for the IEEE 300-bus system, : (a) METIS; (b) spectral ; (c) spectral MW; (d) Z-bus distance. In each panel, the full map (top left) marks three areas with numbered boxes, and the numbered panels show these areas enlarged about seven times. Node color indicates the zone, gray lines are internal branches, and red dashed lines are tie-lines. Maps drawn in Python with NetworkX and Matplotlib; the enlargements were cropped from the full-resolution map in Microsoft PowerPoint without redrawing.
Figure 3.
Partition allocation maps for the Texas 7k synthetic grid, : (a) METIS; (b) spectral ; (c) spectral MW; (d) Z-bus distance. Layout, colors and preparation as in Figure 2; the boxed areas are enlarged about nine times.
The identical comparison was conducted on the larger IEEE 300-bus system, where the disparities between approaches were more pronounced (Figure 2). The spectral MW approach yielded a less equitable split, whereas the METIS preserved a more appropriate zone configuration for parallel computation.
The partitioning approaches were finally applied to the Texas 7k synthetic grid to evaluate performance at the interconnection scale (Figure 3).
Table 3 summarizes the performance of the four partitioning methods across the three test systems. For the IEEE 30-bus system, the four approaches do not produce a single dominant solution. The METIS divides the network into three equal zones of ten buses (size CoV of 0) and has the lowest partitioning runtime, the spectral method yields the highest modularity, and the Z-bus method produces the fewest tie-lines and the lowest NCut. The METIS therefore does not outperform the spectral approaches on all graph quality measures. The methods diverge as the network grows.
On the IEEE 300-bus system, the METIS provides by far the most balanced allocation with a largest zone of 17.3% and a size CoV of 0.063 (compared with 29.0–59.3% and 0.510–1.171 for the other methods) together with the highest modularity (0.749). This balance is obtained with a larger interface: the METIS cuts 34 branches compared with 15–25 for the other methods and has the highest NCut of the four (0.491). The MW-weighted spectral method produces only 15 inter-zone branches, but this occurs together with a highly unbalanced allocation in which approximately 59% of the buses are assigned to a single zone. The result illustrates why tie-line count should not be interpreted independently of regional balance.
At the 6717-bus scale, the METIS produces the most balanced allocation by a wide margin: the largest zone contains 8.6% of the buses against an ideal of 8.3% for , and the size CoV is 0.021 compared with 0.734–0.991 for the other methods. It also achieves the highest modularity (0.890) and the lowest NCut (0.314) of the four methods and completes the partitioning step in approximately 0.3 s compared with 5.4–150 s for the spectral and Z-bus methods. Its interface nevertheless remains the largest: the METIS cuts 265 branches compared with 171–234 for the other methods. The Z-bus implementation requires approximately 150 s because of the computational cost associated with constructing the dense electrical distance representation.
Across the three systems, the METIS kept the largest zone within 4% of the average zone size (Table 4). Because contiguity was enforced inside the METIS, the zones it returned were already connected, so the connectivity repair (Algorithm 1, steps 13–16) moved no buses and the balance reported in Table 3 is the balance produced by the METIS itself. Enforcing contiguity matters because the repair keeps the largest part of each zone in place and reassigns every smaller fragment to the neighboring zone with the most connecting edges regardless of zone size: it cannot remove a zone, but it can enlarge one. With the pymetis default options, which do not enforce contiguity, two IEEE 300-bus zones and one Texas 7k zone were returned in two parts, and the repair moved 16 and 11 buses, respectively, raising the largest IEEE 300-bus zone from 17.0% to 21.7% of the buses.
Table 4.
Zone sizes of the METIS partitions (configuration of Section 5.2). All zones returned by the METIS were connected, so the connectivity repair moved no buses.
For the downstream experiments in this study, three properties were prioritized: regional size balance, low partition generation cost, and independence from a previously solved operating point. On these criteria, the METIS provides the most suitable allocation, although this advantage is obtained at the expense of a larger inter-regional interface. The METIS is therefore selected as the default partitioning method for Stages 2 and 3. This selection should not be interpreted as demonstrating that the METIS is universally optimal; rather, it reflects the priorities of the present parallel regional power flow implementation. Table 5 shows an example allocation file from the study. The comparison therefore shows that no single partitioning method dominates all the metrics. Spectral and electrical distance approaches can produce smaller interfaces, whereas the METIS provides substantially stronger regional balance and lower partition generation time at every tested scale. Because the subsequent master–worker implementation is sensitive to worker imbalance and the selected partition must be generated without requiring a prior solved operating point, the METIS is adopted for the remainder of the study. The impact of its larger interface size is evaluated implicitly through the convergence and computational results reported in Section 8.
Table 5.
Example bus-to-zone allocation output in the format read by the case splitter (IEEE 30-bus, ).
6. Stage 2: Automated Case Splitting
The selected allocation is an abstract bus-to-zone map; before it can be used, each zone must be realized as a self contained PSS®E case that can be solved in isolation. An automated case generation pipeline takes the allocation map A produced in Stage 1 and converts the original network into k regional PSS®E cases. The decomposition is performed through three main steps: identification of inter-regional connections, extraction of the regional network topology, and construction of controllable boundary representations for the omitted neighboring regions.
6.1. Decomposition Procedure
Boundary tie-line identification. The pipeline first sweeps every branch in the master case and isolates the tie-lines whose terminals fall in different zones,
where is the global edge set and the circuit identifier.
The resulting set defines the inter-regional electrical interfaces used in the subsequent case-generation and coordination stages. For each inter-regional connection, the terminal buses associated with the two participating regions are recorded together with the corresponding circuit identifier so that the physical interface can be reconstructed consistently within the regional cases.
Topological subsystem extraction. For each zone Z, the regional case retains every bus allocated to Z (its internal buses) together with the far-end bus of each tie-line incident on Z (its mirrored boundary buses). A mirrored bus appears once regardless of how many tie-lines connect to it. A branch or transformer is retained when both of its terminals are retained and at least one is internal. Each tie-line therefore appears in both of the regional cases it connects. The remote terminal is mirrored in each. All the other network elements are removed. Retained branch and transformer records are copied from the master case rather than recreated. Series impedance, line charging, line-end shunts, off-nominal tap ratios and phase-shift angles are therefore identical in the regional and master cases, and the same holds for loads, fixed and switched shunts, and generators at internal buses. Bus type codes of internal buses are not altered, so the PV/PQ classification, scheduled voltages and reactive-power limits of the original case are preserved. The control actions applied during solution are set by the solution options given in Section 7.2.
Virtual boundary reference buses. Each mirrored bus is converted into a reference bus whose voltage magnitude and angle are imposed by the coordinator: its bus type is changed to 3 (swing), and a virtual machine is attached to it through its own plant record. A region therefore contains one virtual reference bus per mirrored boundary bus. A region with several interfaces contains several Type 3 buses, which PSS®E accepts in a single case. Each holds its own voltage magnitude, set by the scheduled voltage of its plant, and its own angle, set by its bus angle, at the set-points supplied by the coordinator. Together these buses supply or absorb the power carried by the severed tie-lines, which is how neighboring regions enter each regional solution. The following conventions complete the definition.
- Original reference bus. The region containing the system slack bus retains it as a Type 3 bus alongside its virtual references; the other regions contain virtual references only. After convergence the reassembled angles are rotated so that the system slack bus is at , restoring the global angle reference (Section 7.2).
- Injection limits. The active and reactive limits of the virtual machines are left non-binding ( MW and Mvar). This is deliberate: the injection at a virtual reference bus represents the flow on the severed tie-lines at the imposed boundary voltage, and a binding limit would alter the interface condition rather than represent a physical constraint. Because the bus is a reference bus, the initial output assigned to the virtual machine has no effect on the solution.
- Elements at mirrored buses. Any original machine, load or shunt at a mirrored bus has no effect on the regional solution because the voltage and angle of that bus are fixed by the coordinator. These elements are modeled only in the region that owns the bus.
Each zone is then exported as a structurally complete standalone case (Zone_Z.raw). The splitter that generated all the regional cases reported here filters the RAW case file directly. It therefore needs no PSS®E license and can generate regional cases even when the full master case exceeds the bus limit of the available license. A second implementation of the splitter, which works through the PSS®E API, is also available but was not used for the reported results. The complete pipeline is shown in Figure 4.
Figure 4.
Automated case splitting pipeline.
6.2. Output and Validation
The pipeline outputs one standalone case per zone, each loadable and solvable independently in PSS®E; Figure 5 illustrates the decoupling schematically. The splitter processes the inter-regional connections identified from the allocation map and exports one regional case for each zone. Successful loading and convergence of every generated case in PSS®E verify that the automated decomposition pipeline produces executable regional power flow models from the original network allocation. The connectivity constraint enforced during Stage 1 is retained during regional case generation, preventing disconnected internal bus groups from being introduced by the partitioning process. However, connectivity alone does not guarantee numerical power flow solvability; consequently, each exported regional case is independently loaded and solved in PSS®E as an explicit validation step before being passed to the Stage 3 coordinator.
Figure 5.
Schematic, drawn in draw.io (diagrams.net), of how the METIS partition of the IEEE 30-bus system (, Figure 1a) is decoupled into regional cases: (a) the centralized network solved as one case; (b) the three zones after decoupling. Dashed lines are the eight tie-lines cut by the partition, and filled circles are the 11 buses at their ends. In the regional case of each zone, every tie-line incident on the zone is retained and the bus at its far end is represented by a virtual reference bus (Section 6.1). The figure is a conceptual illustration prepared by hand, not output generated by the splitter.
Two levels of validation apply to the decomposition stage. The first is structural. An independent checking script re-reads the master case and every regional case file with its own parser and verifies that:
- The internal buses of the regional cases together reproduce the bus set of the master case exactly, with every bus internal to exactly one region, and each regional case contains exactly its internal buses and mirrored boundary buses;
- Every mirrored bus is a Type 3 bus with exactly one added virtual machine with non-binding limits and is otherwise identical to the master record, while the records of internal buses are unchanged;
- Every line, two-winding transformer and two-terminal DC link of the master case is copied unchanged into exactly one regional case or, for a tie-line, into exactly the two regional cases it connects, and no other branch is present;
- The loads, fixed and switched shunts and generators at internal buses are unchanged and in their original order;
- Each regional case forms a single connected network containing a reference bus, and the region containing the system slack bus retains it as a Type 3 bus.
It also confirms that no generator or transformer regulates the voltage of a bus outside its own region, and no switched shunt regulates a remote bus. The check passes for all three test systems with the allocations used here. It was also confirmed to detect deliberately introduced faults, such as a removed tie-line, an altered bus record or a changed bus type. The second level is solvability: before the coordination is started, every regional case is loaded and solved in PSS®E, and a configuration is not run unless all of its regional cases solve. Both checks are performed automatically. The agreement of the coordinated solution with the centralized solution, which is electrical equivalence proper, is evaluated in Section 8.5.
7. Stage 3: Parallel Relaxed Boundary-Consensus Coordination
7.1. Selection of the Coordination Method
The regional cases must be reconciled so that, at convergence, the zones agree on their shared boundary voltages and together reproduce the global solution. Domain decomposition methods provide this coordination by solving the subproblems locally and exchanging boundary variables iteratively [45], but the choice among them is tightly constrained by the closed PSS®E API, which exposes solved bus voltage arrays yet no internal solver data. Each candidate family was assessed against this constraint.
Schur-complement decomposition is a well-established way to reduce coupled network equations to an interface problem, but it requires direct access to the subdomain Jacobian blocks to form the reduced interface system [11,45]. In PSS®E the Jacobian is internal to the compiled solver and is not exposed through the public API, which makes this approach infeasible. ALADIN is an alternative distributed optimization framework with strong local convergence properties, but it requires each sub-solver to supply gradient, Hessian and constraint-Jacobian information [43], which the API likewise does not provide. Approximating even the first-order sensitivities by finite differences would require one additional regional solution per boundary set-point in every coordination iteration. A region with mirrored boundary buses would need extra solutions, one per voltage magnitude and one per angle, before any second-order information is formed. For the Texas 7k allocation used here () with 430 mirrored buses in total, this amounts to 860 additional regional solutions per iteration against 12 for the adopted procedure. Gauss–Seidel-style decompositions in which zones are updated sequentially using the latest neighboring values are simple, but they serialize the regional solutions and thus forfeit the concurrency the framework is designed to exploit. ADMM-based coordination is another important class. Conventional ADMM formulations, however, require an explicit separable optimization or feasibility problem with consensus constraints and dual-variable updates [33]. Their parallel and asynchronous variants [40,41] likewise exchange primal and dual quantities that a power flow solver does not produce. The present implementation instead retains PSS®E as an unchanged nonlinear power flow solver and coordinates only externally accessible boundary quantities.
On this basis, a synchronous relaxed boundary-consensus procedure is adopted as the coordination layer. Each boundary bus is mirrored as a virtual reference bus in every neighboring region (Section 6.1). The coordinator exchanges only boundary-voltage magnitudes and angles with the regional solvers, quantities that are directly accessible through the public API, so no Jacobian, derivative, or internal Newton–Raphson iteration information is required. The procedure is synchronous. In each coordination iteration all the regional solutions use set-points from the same previous iteration and run concurrently, and the coordinator updates the set-points only after every regional result has been received. Structurally, it is a relaxed block-Jacobi iteration on the boundary voltages: the parallel counterpart of the Gauss–Seidel scheme above. Each PSS®E instance is thereby treated as an independent black-box regional solver. It communicates with the coordinator only through inter-process message queues, which carry boundary set-points to the solver and solved bus voltages back.
7.2. Parallel Coordination Procedure
The master coordinator drives a pool of worker processes towards a globally consistent solution, as illustrated in Figure 6. It launches one worker process per zone, so the pool size equals the zone count k. When k exceeds the number of processor cores, the operating system time-shares the workers. Each worker initializes its own PSS®E instance with terminal output suppressed and reads its regional case once. The case then remains resident in the worker for the whole run, so no case is reloaded during the coordination iterations.
Figure 6.
Master–worker coordination loop (Section 7.2). Each round is synchronous: the master sends every zone its boundary set-points through a message queue, the zones are solved concurrently by their resident PSS®E instances, and the set-points are updated and accelerated only after every result has been received. Equation numbers refer to Section 7.2.
For zone a, let be its set of mirrored boundary buses. For each , the coordinator holds the set-points and imposed at the virtual reference bus of j in zone a. The zone that owns j computes the actual voltage magnitude and angle . A bus is mirrored in every zone it neighbors, so it can carry several set-point pairs, one per neighboring zone. Coordination iteration r proceeds in three steps. First, the master sends each zone its current set-points. Second, each worker writes them into its resident case: the magnitude as the scheduled voltage of the virtual plant and the angle as the bus angle of the Type 3 bus. It then runs a full Newton–Raphson solution and returns the solved voltage magnitude and angle of its internal buses. Third, once every result has been received, the master updates every set-point,
where wraps an angle difference into , and is the relaxation factor. Collecting all set-points in a vector and writing for the corresponding values solved by the owning zones, Equations (4) and (5) form the relaxed fixed-point iteration . With this is the plain block-Jacobi iteration, and damps it. The procedure involves no objective function and no dual variables, which is why it is described as relaxed boundary consensus rather than the ADMM. The relaxation factor was set per system (Table 6): undamped updates on the two IEEE systems and mild damping on Texas 7k. It was not tuned, and the sensitivity of the iteration count to was not studied.
Table 6.
Coordinator settings used for all reported results. Every system is solved with Aitken extrapolation and Anderson acceleration using the METIS allocation of Table 3.
At a fixed point, every virtual reference bus holds exactly the voltage computed by the zone that owns it. Each tie-line then carries the same flow in both regional cases that contain it. The power balance of every boundary bus within its owning region is therefore also its power balance in the complete network. Because every bus is internal to exactly one region, the reassembled solution then satisfies the power flow equations of the complete network. A fixed point of the coordination is therefore a power flow solution of the original case under the same solution options. Convergence to it is not guaranteed in general and is assessed empirically in Section 8.
The iteration stops when both boundary residuals fall below their tolerances:
Each residual compares the voltage a zone was given with the voltage its neighbor computed in the same iteration, so it measures the remaining boundary inconsistency directly.
Acceleration. Near convergence the boundary errors of the relaxed iteration decay geometrically but slowly. Two accelerators were evaluated, and every system was solved with each of them. Both act on the set-points after the relaxed update and never on a regional solution, so a converged result satisfies Equation (6) exactly as it would without acceleration.
Aitken extrapolation. The dominant error mode alternates in sign from one iteration to the next. Aitken’s extrapolation [53] is therefore applied to each set-point sequence separately on its subsequence of every second iterate. After every five consecutive iterations in which all regional solutions succeed, each set-point x with iterates , and is replaced by
with angle differences wrapped by w. The replacement is made only when the subsequence is contracting () and the extrapolation step does not exceed 0.1 p.u. in magnitude or in angle; otherwise the relaxed value is kept.
Anderson acceleration. Anderson acceleration [54] instead combines the recent history of all set-points. It treats the relaxed update as a map g on the stacked set-point vector, . From the sixth iteration onwards it replaces by , where minimizes over the last differences of the residuals , and holds the corresponding differences of g. The resulting step in each component is capped at 0.1 p.u. in magnitude and in angle. The least-squares problem has at most five columns, so its cost is negligible beside that of the regional solutions.
With the METIS allocations used here, both accelerators converged on all three systems. Anderson acceleration needed fewer coordination iterations than Aitken extrapolation on every system: 37 against 58 on the IEEE 30-bus system, 78 against 405 on the IEEE 300-bus system and 173 against 1140 on Texas 7k (Table 7). On Texas 7k, Aitken extrapolation reached the tolerance only after a long slowly decaying oscillation of the boundary residuals (one run), so its iteration count indicates robustness rather than a convergence rate. Both stop at the same tolerances, and their accuracy is of the same order (Section 8.5); Aitken extrapolation gave the smaller angle deviations on all three systems. In an earlier test on a different 18-zone allocation of Texas 7k, which is not used for the reported results, Aitken extrapolation did not reach the tolerance within the 1500-iteration limit (one run), whereas Anderson acceleration converged in 686 iterations.
Table 7.
Convergence iteration counts from a flat start. Centralized: PSS®E full Newton–Raphson iterations, identical in all ten runs. Partitioned: outer consensus iterations and the number of iterations in which the accelerator updated the set-points (Aitken: every fifth iteration; Anderson: every iteration from the sixth). The partitioned counts were identical in every run; Texas 7k with Aitken extrapolation was run once.
Local solution options. Every regional solution uses the PSS®E full Newton–Raphson method with tap, phase-shift and switched-shunt adjustment disabled, area interchange control disabled, DC converter tap adjustment left enabled, and generator reactive-power limits not applied. The Newton–Raphson iteration limit is raised to 300, and the mismatch tolerance is the PSS®E default of 0.1 MW/Mvar. The boundary set-points are initialized to a flat profile (1.0 p.u., ), and the first solution of each zone starts from a flat profile, so no part of the result is inherited from the solution stored in the case. Every later solution of a zone starts from that zone’s previous solution.
Robustness. If a regional solution does not converge, the worker continues it once from its current state rather than restarting from a flat profile since a flat restart of a large zone can diverge. A regional solution that converges with any internal bus voltage below 0.7 p.u. is taken to have reached the low-voltage branch of the power flow equations and is likewise continued once. If the voltage remains low, the solution is reported as failed. A failed solution in any iteration suspends acceleration and clears its history (for either accelerator), and the number of such iterations is reported with the results.
Unchanged zones. A zone is not re-solved when none of its set-points has changed by more than one tenth of the stopping tolerance ( in magnitude; in angle) since its last solution. Its previous solution is reused.
On convergence, the master collects the solved voltage magnitude and angle of every internal bus and rotates all the angles so that the system slack bus is at . It then stops the workers and records the iteration count, timings and memory use.
8. Results and Discussion
The partitioned boundary-consensus framework was evaluated against the centralized PSS®E Newton–Raphson solver on convergence, wall-clock time and solution accuracy, and the memory use of the partitioned framework is reported. All the runs started from a flat start and were executed on a single multicore workstation with three, six and twelve worker processes for the IEEE 30-bus, IEEE 300-bus and Texas 7k systems, respectively. The workstation and software that were used for all the power flow experiments, centralized and partitioned, are listed below.
| Processor | Intel Core Ultra 5 235, 14 cores (14 logical processors), 3.40 GHz base clock; |
| Memory | 16 GB (15.4 GB usable); |
| Operating system | Windows 11 (build 26200); |
| Power flow solver | PSS®E 36.5; |
| Solver scripting | Python 3.14.2 (psspy interface), NumPy 2.5.3. |
The partitioning study of Section 5 was run on the same workstation, separately from these experiments, in a conda-forge Python 3.11 environment (NumPy 2.4.6, SciPy 1.17.1, scikit-learn 1.9.1, NetworkX 3.6.1 and pymetis 2025.2.2), and its runtimes are reported in Table 3.
8.1. Benchmarking Set-Up
Both methods were run on the same network cases and workstation in the same test session. Every configuration was repeated ten times except Texas 7k with Aitken extrapolation, which was run once, and the tables report the mean and standard deviation over the converged runs. The coordination is deterministic: in every configuration, the repeated runs gave identical iteration counts and solution files, so the repeats measure only the variation in timing. All the times are wall-clock times; CPU time was not measured. The timing boundaries are defined as follows. For the centralized solver, the load time covers reading the case and setting the solution parameters, the solve time covers the Newton–Raphson solution, and their sum is the centralized total. The PSS®E process is initialized once before the timed runs, so its initialization is not included in the centralized times. The first of the ten controls-locked centralized runs of each system, which is the first solution in the PSS®E session, includes one-off start-up effects and is excluded from the centralized means as a warm-up run; the controls-active means include all ten runs. For the partitioned framework, the set-up time covers worker-process creation, PSS®E initialization in every worker and reading of the regional cases until every worker is ready. The coordination time covers all the consensus iterations, including the regional solutions, boundary exchange and set-point updates. The time to solution is the sum of set-up and coordination, that is, the wall-clock time from launching the workers to the converged boundary solution. It therefore excludes the start-up of the master process and the initial parsing of the network topology by the master, which was not timed separately, just as the centralized times exclude the initialization of the PSS®E process. The worker processes are then stopped. The remaining wall-clock time of a run, 8.8 to 9.0 s in every configuration, is mostly spent while the PSS®E worker processes exit; a PSS®E process takes about 9 s to terminate after its last computation independently of the case solved. Because this shutdown time (total minus set-up and coordination, which also contains the topology parsing) follows the solution, it is reported separately and not included in the time to solution. Set-up is reported separately because per-worker initialization is intrinsic to the distributed design, whereas the centralized solver initializes only once. Partitioning (Stage 1) and regional case generation (Stage 2) are performed once per network and allocation before the timed runs and are not included in these times; the partitioning runtimes are given in Table 3. Peak memory is the largest total resident set size of the master and all worker processes. It is sampled every 0.25 s. It was measured for the partitioned framework only. Iteration counts are compared only within each method since a Newton–Raphson iteration and an outer consensus iteration are different units of work.
8.2. Convergence Behavior
The centralized reference is solved from a flat start in which every bus other than the swing bus, including the generator (PV) buses, starts at 1.0 p.u., the swing bus starts at its scheduled voltage, and every angle starts at . It is solved with the PSS®E full Newton–Raphson method under two sets of options. The first has controls locked: tap, phase-shift and switched-shunt adjustment disabled and reactive-power limits not applied. These options are used for the regional solutions, so this solution is the reference for the accuracy results of Section 8.5. The second has controls active: switched-shunt adjustment enabled and generator reactive-power limits applied from the first iteration with tap and phase-shift adjustment still disabled. In both sets, area interchange control is disabled and DC converter tap adjustment is enabled. The iteration limit is raised to 300 for the first set and 400 for the second, and the mismatch tolerance is the PSS®E default of 0.1 MW/Mvar in both. With controls active, every switched-shunt step and generator reaching a reactive limit perturbs the solution, after which the Newton–Raphson method re-converges. The iteration count with controls active therefore includes control settling, whereas the count with controls locked measures the Newton–Raphson iterations alone.
The centralized iteration counts were identical in all ten runs (Table 7): two and three for the IEEE 30-bus system, four and six for the IEEE 300-bus system, and nine and 210 for Texas 7k with controls locked and active, respectively. The Texas 7k count with controls active is dominated by two switched shunts. Within eight iterations the largest mismatch falls to about 5 Mvar. Two single-step 69 kV switched shunts (25.8 and 15.4 Mvar) then repeatedly switch in and out. One step changes the voltage at their buses by 0.036 to 0.040 p.u., more than the 0.03 p.u. width of their control band (1.02 to 1.05 p.u.), so they cannot settle within it. After iteration 204, on reaching its limit of 99 adjustments, PSS®E stops adjusting them, and the solution converges at iteration 210 with both shunts reported as control violations. A reactive mismatch of about 5 Mvar also persists through these iterations at a 345 kV bus whose voltage is regulated remotely by a generator. The Texas 7k count with controls active therefore reflects this interaction of discrete controls, not the convergence of the Newton–Raphson method on the network equations. The two option sets also lead to different operating points: on Texas 7k, the voltage magnitudes of the two solutions differ by up to 0.12 p.u. and more than 0.01 p.u. at 64 buses.
The partitioned framework converged from a flat start in every run of every configuration, and no regional solution failed, so acceleration was never suspended. With Anderson acceleration the coordinator needed 37, 78 and 173 outer consensus iterations for the IEEE 30-bus, IEEE 300-bus and Texas 7k systems; with Aitken extrapolation it needed 58, 405 and 1140 (Table 7). Anderson acceleration therefore needed 1.6, 5.2 and 6.6 times fewer iterations. The outer iteration count grows with the system: between the IEEE 30-bus system and Texas 7k by a factor of 4.7 with Anderson acceleration and 20 with Aitken extrapolation. Because only one allocation was evaluated per system, this growth cannot be attributed separately to network size, zone count, interface size (eight, 34 and 265 tie-lines) or relaxation factor, and no scaling law is inferred from it. Each outer iteration contains up to k regional Newton–Raphson solutions and a boundary update, whereas a centralized Newton–Raphson iteration is one global nonlinear update, so the two counts are compared only within each method.
8.3. Wall-Clock Time
The centralized solver was faster than the partitioned framework on every system (Table 8). With controls locked, loading and solving took 0.038, 0.123 and 1.99 s for the IEEE 30-bus, IEEE 300-bus and Texas 7k systems, of which the Newton–Raphson solution itself took 0.001, 0.002 and 0.052 s. With controls active, the centralized Texas 7k solution took 2.64 s, of which 0.88 s was the 210-iteration solve. The time to solution of the partitioned framework was 1.42 to 1.43 s, 2.09 to 2.15 s, and 4.26 s with Anderson acceleration or 7.69 s with Aitken extrapolation (one run). Two effects account for the difference. First, set-up dominates on the smaller systems: starting the workers, initializing PSS®E in each and reading the regional cases took 1.34 s of the 1.42 s on the IEEE 30-bus system and 3.26 s of the 4.26 s on Texas 7k with Anderson acceleration, whereas the centralized solver initializes PSS®E once, outside the timed interval. Second, the coordination needs many more outer iterations than the centralized solver needs Newton–Raphson iterations. On Texas 7k with Anderson acceleration an outer iteration took 5.7 ms on average, about as long as one centralized Newton–Raphson iteration (0.052 s for nine iterations), but 173 outer iterations were needed against nine. The relative gap narrows with system size from a factor of 37 on the IEEE 30-bus system to 2.1 on Texas 7k with Anderson acceleration because the centralized load time grows from 0.037 to 1.94 s between these two systems whereas the partitioned set-up grows from 1.34 to 3.26 s. These ratios compare totals measured on different boundaries: the partitioned set-up includes starting PSS®E in every worker, which the centralized times exclude. The coordination alone took 0.99 s on Texas 7k with Anderson acceleration against 0.052 s for the centralized Newton–Raphson solve. The workstation has 14 logical processors, so the number of workers never exceeded the number of logical processors. The shutdown, 8.8 to 9.0 s after every run and mostly the exit of the worker processes, follows the solution and is not included in the time to solution. CPU time was not measured, so no statement is made about processor utilization. These results are an implementation and feasibility benchmark and do not show a parallel speed-up or computational acceleration [47].
Table 8.
Wall-clock time (s), mean ± standard deviation. Centralized: controls locked and load + solve excluding PSS®E initialization; mean over runs 2–10, the first run being excluded as a warm-up. Partitioned: time to solution = set-up + coordination excluding the master’s topology parsing (not timed separately); mean over ten runs except Texas 7k with Aitken extrapolation (one run). Shutdown (total minus set-up and coordination) is mostly the exit of the PSS®E worker processes after the solution is complete; it also contains the master’s topology parsing. It is reported separately and is not part of the time to solution. Definitions in Section 8.1.
8.4. Memory Results
The peak memory of the partitioned framework was 547 and 593 MiB for the IEEE 30-bus system (Aitken extrapolation and Anderson acceleration), 1093 and 1166 MiB for the IEEE 300-bus system and 2223 and 2364 MiB for Texas 7k. It is almost proportional to the number of workers: divided by the number of workers, it is 182 to 198 MiB on all three systems, although the largest regional case grows from 16 to 613 buses. Each worker hosts a separate PSS®E instance with its own case and data structures, so the fixed per-process overhead of the solver dominates the footprint, and the memory use of the framework is governed mainly by the number of worker processes rather than the size of the regional cases. A detailed separation of solver runtime memory from network data memory was not performed. The peak memory of the centralized solver was not measured in this study, so the two are not compared.
8.5. Solution Accuracy Validation
Electrical equivalence is assessed on the quantities that define an AC operating point rather than voltage magnitude alone. For each system, the reassembled distributed solution is compared with the centralized solution on four groups of quantities:
- The voltage magnitude and angle of every bus with the angles of both solutions referred to the system slack bus;
- The active and reactive power at both ends of every inter-zone tie-line;
- The total network active and reactive losses;
- The bus power-balance residual of the distributed solution evaluated on the complete network. This is the difference between the scheduled injection and the injection implied by the solved voltages, taken for active power at every non-slack bus and reactive power at every PQ bus.
Branch flows and residuals are computed from the solved voltages with the same -equivalent branch model, including off-nominal tap ratios and phase shifts, that forms the network admittance matrix. The implementation verifies that the computed branch flows and shunt injections reproduce the bus injections of that matrix. The residual in item 4 is the direct test of tie-line consistency: if the two regions adjacent to a tie-line disagreed on its flow, Kirchhoff’s current law would be violated at its boundary buses. Per-bus residuals can be individually small yet share a sign. Their sum, the net imbalance, is absorbed by the system slack bus. It is therefore reported as the difference between the slack-bus active-power injections of the two solutions (the net boundary imbalance in Table 9).
Table 9.
Electrical equivalence of the distributed and centralized (controls locked) solutions for every configuration of Table 7. denotes distributed minus centralized; residuals are those of the distributed solution on the complete network. Net boundary imbalance: difference between the slack-bus active-power injections of the two solutions. Repeated runs gave identical solutions (Texas 7k with Aitken extrapolation was run once), so each column describes a single solution.
The reference for each system is the centralized solution with controls locked (Section 8.2), which uses the same network model and solution options as the regional solutions. Three properties of PSS®E are accounted for. First, when PSS®E reads a case it moves the ratio of each tap-controlled transformer to its nearest discrete tap position (25 of the 105 transformers in the IEEE 300-bus case). Second, it models transformer magnetizing admittance. Third, at the start of a Newton–Raphson solution it moves each switched shunt whose initial susceptance lies between two of its steps to the nearest step and limits any that exceeds its capacity, even when switched-shunt adjustment is disabled. In the Texas 7k case, PSS®E reports moving 128 of the 429 switched shunts to their nearest step, and the initial susceptance of 11 more exceeds their capacity, so 139 switched shunts are modeled at a different value from the case file; the IEEE cases have none. Without this correction, the centralized Texas 7k solution itself would show a spurious reactive residual of 42.7 Mvar at one bus. Flows and residuals of PSS®E-produced solutions are therefore evaluated with the tap ratios PSS®E holds after reading the case with magnetizing admittance included and every switched shunt at the step PSS®E uses. Solutions are exchanged with seven decimal places. Residuals below the level implied by this rounding, determined by rounding an exact centralized solution in the same way, are not resolvable and are reported as such.
Table 9 gives the results for every configuration. On all three systems the reassembled solution agrees with the centralized solution to within p.u. in voltage magnitude and in angle, and no bus deviates by more than 0.01 p.u. Tie-line active and reactive power agree at both ends to within 0.49 MW and 0.12 Mvar, at most 0.12% of the largest tie-line flow of each system, and total losses agree to within 0.05 MW and 0.5 Mvar. The largest bus residuals are 0.03 to 0.14 MW and 0.01 to 0.07 Mvar, and the largest active-power residual lies at a boundary bus in every configuration. These residuals are of the same order as the 0.1 MW/Mvar mismatch tolerance of the regional solutions and the residuals of the centralized solution itself on the same model (up to 0.031 MW and 0.053 Mvar). On Texas 7k the reactive residuals (0.069 and 0.051 Mvar) are close to the rounding floor of 0.053 Mvar. The net boundary imbalance is at most 0.54 MW on the IEEE systems; on Texas 7k it is 1.45 MW with Anderson acceleration and 0.34 MW with Aitken extrapolation. The two accelerators give deviations of the same order, and Aitken extrapolation gives the smaller angle deviations on all three systems.
8.6. Discussion and Limitations
The experiments demonstrate that the proposed workflow can automatically partition, decompose, solve, and coordinate regional PSS®E cases across networks ranging from 30 to 6717 buses. The principal outcome is therefore the feasibility of performing regionalized power flow coordination around an unmodified commercial solver using only externally accessible interface quantities. The results also identify three important limitations. First, the partitioned implementation does not outperform the centralized PSS®E solution in wall-clock time on the employed workstation: its time to solution is 2.1 (Texas 7k and Anderson acceleration) to 37 (IEEE 30-bus) times the centralized load and solve time, although these totals are measured on different boundaries (Section 8.3). The process-based architecture adds worker start-up, per-worker solver initialization and case loading, and the coordination needs one to two orders of magnitude more outer iterations than the centralized solver needs Newton–Raphson iterations. Second, electrical equivalence was assessed on bus angles, tie-line active and reactive power, network losses and power-balance residuals, as well as voltage magnitude (Section 8.5). The largest active-power residuals lie at boundary buses. On Texas 7k the angle deviations all have the same sign, and their mean ( with Anderson acceleration) is three-quarters of their maximum (). They are mainly a common shift relative to the system slack bus, which is consistent with a small net boundary imbalance absorbed by the slack bus rather than local errors at the interfaces. This imbalance remains on Texas 7k at 1.45 MW with Anderson acceleration and 0.34 MW with Aitken extrapolation, although no bus residual exceeds 0.11 MW. Because the stopping test of Equation (6) bounds each boundary residual separately, residuals that are individually within tolerance can still accumulate across many interfaces. A tolerance on the aggregate imbalance or tie-line power residual would bound this directly. Third, the equivalence is established for fixed controls. In both the regional and centralized solutions, transformer taps, phase shifters and switched shunts are held at their case settings and generator reactive-power limits are not applied (Section 7.2 and Section 8.2). With these controls active the centralized operating point changes by up to 0.12 p.u. in voltage magnitude on Texas 7k, and the present framework does not coordinate discrete controls or reactive-power limits across regions. Accordingly, the present results establish implementation feasibility and quantified agreement with the centralized solution, not computational superiority. The current experiments also use one partition count and one fixed relaxation factor for each network. The observed convergence behavior therefore cannot yet be generalized to arbitrary network sizes, partition counts, or electrical couplings. Systematic evaluation of k, interface strength, relaxation factor, convergence tolerance, and initial boundary conditions would provide a more complete characterization of the proposed method.
9. Conclusions
This paper developed and evaluated an automated domain-decomposed power flow framework built around Siemens PSS®E and operated through its public Python interface. Four partitioning methods (spectral MW, spectral 1/X, Z-bus electrical distance and the METIS) were compared on solver-independent metrics, revealing a trade-off between regional balance and interface size that sharpens with network size. The METIS, which gave near-equal zones and the smallest regional cases on all three systems at the cost of the most tie-lines, was adopted for all the coordination experiments. An automated case-generation pipeline converted each allocation into independently solvable regional PSS®E cases in which every interface bus is represented by a virtual reference bus. This demonstrates that a commercial power flow model can be decomposed and coordinated without modifying its Newton–Raphson solver or accessing its Jacobian and iteration state.
The coordination layer reconciles boundary-voltage magnitude and angle through a relaxed consensus update, which is accelerated by Aitken extrapolation or Anderson acceleration, and a fixed point of this iteration is a power flow solution of the complete network. On the IEEE 30-bus, IEEE 300-bus and 6717-bus Texas synthetic systems, the reassembled solution was compared with the centralized PSS®E solution on bus voltages and angles, tie-line active and reactive power, network losses and power-balance residuals with controls locked in both solutions (transformer taps, phase shifters and switched shunts at their case settings and generator reactive-power limits not applied). From a flat start, the coordinator converged in every run, in 37, 78 and 173 outer iterations with Anderson acceleration and 58, 405 and 1140 with Aitken extrapolation, and repeated runs gave identical solutions. The largest deviations from the centralized solution were p.u. in voltage magnitude, in angle and 0.49 MW in tie-line active power, and no bus deviated by more than 0.01 p.u. On Texas 7k a small aggregate boundary imbalance remains: the slack bus of the distributed solution supplies 1.45 MW more than in the centralized solution with Anderson acceleration and 0.34 MW more with Aitken extrapolation, although no individual bus residual exceeds 0.11 MW.
On the workstation (14 logical processors), the framework was slower than the monolithic solution on every system, demonstrating times to solution of 1.4, 2.1 and 4.3 s with Anderson acceleration against 0.04, 0.12 and 2.0 s for the centralized load and solve, and its memory use grew with the number of worker processes, each of which hosts a separate PSS®E instance. The contribution is therefore architectural rather than computational: an automated pathway from network partitioning to regional model generation and independent commercial solver execution and iterative boundary reconciliation with the centralized PSS®E solution retained as the reference. Future work should quantify the sensitivity of the method to the relaxation factor, convergence tolerance and partition count and add a stopping criterion on the aggregate boundary power imbalance. It should also extend the coordination to discrete controls and generator reactive-power limits, which were held fixed and not applied, respectively, in all the solutions that were compared here. It should also evaluate the framework on larger multicore machines and across multiple machines before any claim of distributed scalability or wall-clock acceleration is made.
A further extension concerns systematic selection of the partition count k. The present study uses one value of k for each test network; therefore, the reported convergence and runtime behavior cannot yet be generalized across alternative decompositions. A systematic sweep of k should be used to quantify the trade-off between regional problem size, interface count, worker balance, convergence rate, solution accuracy, and total execution time.
Author Contributions
Conceptualization, W.A.R.G.D.A., D.J.S., D.D.H., T.M.R., G.S.T., M.S., S.M., M.M. and A.S.; methodology, W.A.R.G.D.A., D.J.S., D.D.H. and T.M.R.; software, W.A.R.G.D.A., D.J.S., D.D.H. and T.M.R.; validation, W.A.R.G.D.A., D.J.S., D.D.H., T.M.R., G.S.T., M.S., S.M., M.M. and A.S.; formal analysis, W.A.R.G.D.A., D.J.S., D.D.H. and T.M.R.; investigation, W.A.R.G.D.A., D.J.S., D.D.H. and T.M.R.; writing—original draft preparation, W.A.R.G.D.A., D.J.S., D.D.H. and T.M.R.; writing—review and editing, W.A.R.G.D.A., D.J.S., D.D.H., T.M.R., G.S.T., M.S., S.M., M.M. and A.S.; supervision, G.S.T., M.S., S.M., M.M. and A.S. All authors have read and agreed to the published version of the manuscript.
Funding
This research received no external funding.
Institutional Review Board Statement
Not applicable.
Informed Consent Statement
Not applicable.
Data Availability Statement
The IEEE 30-bus, IEEE 300-bus and Texas 7k synthetic grid test cases are publicly available standard benchmark systems.
Acknowledgments
The authors would like to acknowledge Swinburne University of Technology and the Siemens Swinburne Energy Transition Hub (SSETH) for providing access to the PSS®E software and the computing facilities used in this work.
Conflicts of Interest
The authors declare no conflicts of interest.
Abbreviations
The following abbreviations are used in this manuscript:
| ADMM | Alternating Direction Method of Multipliers |
| ALADIN | Augmented Lagrangian-Based Alternating Direction Inexact Newton |
| API | Application Programming Interface |
| CoV | Coefficient of Variation |
| DER | Distributed Energy Resource |
| METIS | Multilevel Graph Partitioning Library |
| NCut | Normalized Cut |
| NR | Newton–Raphson |
| OPF | Optimal Power Flow |
| p.u. | Per Unit |
References
- Alawneh, S.G.; Zeng, L.; Arefifar, S.A. A Review of High-Performance Computing Methods for Power Flow Analysis. Mathematics 2023, 11, 2461. [Google Scholar] [CrossRef] [Scilit]
- Glover, J.D.; Sarma, M.S.; Overbye, T.J. Power System Analysis and Design, 5th ed.; Cengage Learning: Stamford, CT, USA, 2012. [Google Scholar]
- Stott, B. Review of Load-Flow Calculation Methods. Proc. IEEE 1974, 62, 916–929. [Google Scholar] [CrossRef] [Scilit]
- Siemens Industry, Inc. PSS®E Program Application Guide; Siemens Power Technologies International: Schenectady, NY, USA, 2022. [Google Scholar]
- Tinney, W.F.; Walker, J.W. Direct Solutions of Sparse Network Equations by Optimally Ordered Triangular Factorization. Proc. IEEE 1967, 55, 1801–1809. [Google Scholar] [CrossRef] [Scilit]
- Stott, B.; Alsaç, O. Fast Decoupled Load Flow. IEEE Trans. Power Appar. Syst. 1974, PAS-93, 859–869. [Google Scholar] [CrossRef] [Scilit]
- Tinney, W.F.; Hart, C.E. Power Flow Solution by Newton’s Method. IEEE Trans. Power Appar. Syst. 1967, PAS-86, 1449–1460. [Google Scholar] [CrossRef] [Scilit]
- Clean Energy Council. Rooftop Solar Generates over 10 per Cent of Australia’s Electricity. Available online: https://cleanenergycouncil.org.au/news-resources/rooftop-solar-generates-over-10-per-cent-of-australias-electricity (accessed on 31 August 2026).
- Australian Energy Market Operator (AEMO). Quarterly Energy Dynamics Q2 2026; AEMO: Melbourne, VIC, Australia, 2026; Available online: https://www.aemo.com.au/energy-systems/major-publications/quarterly-energy-dynamics-qed (accessed on 31 August 2026).
- Kron, G. Diakoptics: The Piecewise Solution of Large-Scale Systems; Macdonald: London, UK, 1963. [Google Scholar]
- Saad, Y. Iterative Methods for Sparse Linear Systems, 2nd ed.; SIAM: Philadelphia, PA, USA, 2003. [Google Scholar] [CrossRef] [Scilit]
- von Luxburg, U. A Tutorial on Spectral Clustering. Stat. Comput. 2007, 17, 395–416. [Google Scholar] [CrossRef] [Scilit]
- Ng, A.Y.; Jordan, M.I.; Weiss, Y. On Spectral Clustering: Analysis and an Algorithm. In Advances in Neural Information Processing Systems 14; MIT Press: Cambridge, MA, USA, 2002; pp. 849–856. [Google Scholar]
- Shi, J.; Malik, J. Normalized Cuts and Image Segmentation. IEEE Trans. Pattern Anal. Mach. Intell. 2000, 22, 888–905. [Google Scholar] [CrossRef] [Scilit]
- Hagen, L.; Kahng, A.B. New Spectral Methods for Ratio Cut Partitioning and Clustering. IEEE Trans. Comput.-Aided Des. Integr. Circuits Syst. 1992, 11, 1074–1085. [Google Scholar] [CrossRef] [Scilit]
- Spielman, D.A.; Teng, S.-H. Spectral Partitioning Works: Planar Graphs and Finite Element Meshes. Linear Algebra Appl. 2007, 421, 284–305. [Google Scholar] [CrossRef] [Scilit]
- Jia, Y.; Xu, Z.; Lai, L.L.; Wong, K.P. A Novel Network Partitioning Approach in Smart Grid Environment. In Proceedings of the 2015 IEEE International Conference on Systems, Man, and Cybernetics (SMC), Hong Kong, China, 9–12 October 2015; pp. 641–646. [Google Scholar] [CrossRef] [Scilit]
- Jia, Y.; Lai, C.S.; Xu, Z.; Chai, S.; Wong, K.P. Adaptive Partitioning Approach to Self-Sustained Smart Grid. IET Gener. Transm. Distrib. 2017, 11, 485–494. [Google Scholar] [CrossRef] [Scilit]
- Cotilla-Sanchez, E.; Hines, P.D.H.; Barrows, C.; Blumsack, S.; Patel, M. Multi-Attribute Partitioning of Power Networks Based on Electrical Distance. IEEE Trans. Power Syst. 2013, 28, 4979–4987. [Google Scholar] [CrossRef] [Scilit]
- Blumsack, S.; Hines, P.; Patel, M.; Barrows, C.; Cotilla-Sanchez, E. Defining Power Network Zones from Measures of Electrical Distance. In Proceedings of the IEEE Power & Energy Society General Meeting, Calgary, AB, Canada, 26–30 July 2009; pp. 1–8. [Google Scholar] [CrossRef] [Scilit]
- Lagonotte, P.; Sabonnadière, J.C.; Léost, J.Y.; Paul, J.P. Structural Analysis of the Electrical System: Application to Secondary Voltage Control in France. IEEE Trans. Power Syst. 1989, 4, 479–486. [Google Scholar] [CrossRef] [Scilit]
- Mao, X.; Zhu, W.; Wu, L.; Zhou, B. Comparative Study on Methods for Computing Electrical Distance. Int. J. Electr. Power Energy Syst. 2021, 130, 106923. [Google Scholar] [CrossRef] [Scilit]
- Karypis, G.; Kumar, V. A Fast and High Quality Multilevel Scheme for Partitioning Irregular Graphs. SIAM J. Sci. Comput. 1998, 20, 359–392. [Google Scholar] [CrossRef] [Scilit]
- Karypis, G.; Kumar, V. Multilevel k-Way Partitioning Scheme for Irregular Graphs. J. Parallel Distrib. Comput. 1998, 48, 96–129. [Google Scholar] [CrossRef] [Scilit]
- Kernighan, B.W.; Lin, S. An Efficient Heuristic Procedure for Partitioning Graphs. Bell Syst. Tech. J. 1970, 49, 291–307. [Google Scholar] [CrossRef] [Scilit]
- Fiduccia, C.M.; Mattheyses, R.M. A Linear-Time Heuristic for Improving Network Partitions. In Proceedings of the 19th Design Automation Conference, Las Vegas, NV, USA, 14–16 June 1982; pp. 175–181. [Google Scholar] [CrossRef] [Scilit]
- Newman, M.E.J. Modularity and Community Structure in Networks. Proc. Natl. Acad. Sci. USA 2006, 103, 8577–8582. [Google Scholar] [CrossRef] [Scilit]
- Fortunato, S. Community Detection in Graphs. Phys. Rep. 2010, 486, 75–174. [Google Scholar] [CrossRef] [Scilit]
- Wang, J.; Yao, L.; Liang, J.; Wang, J.; Cheng, F. Distributed Optimization Strategy for Networked Microgrids Based on Network Partitioning. Appl. Energy 2025, 378, 124834. [Google Scholar] [CrossRef] [Scilit]
- Jia, J.; Lee, Y.J.; Ojeda-Ruiz, I. An Efficient k-Way Constrained Normalized Cut and Its Connection to the Algebraic Multigrid Method. IEEE Trans. Image Process. 2026, 35, 4453–4466. [Google Scholar] [CrossRef] [Scilit] [PubMed]
- Stark, L.; Hofmann, L. Comparison of Clustering Methods for Aggregation of Distribution Grid Flexibility at the Nodes of an Adjusted REI Equivalent. In Proceedings of the 2024 IEEE 34th Australasian Universities Power Engineering Conference (AUPEC), Sydney, Australia, 20–22 November 2024; pp. 1–7. [Google Scholar] [CrossRef] [Scilit]
- Molzahn, D.K.; Dörfler, F.; Sandberg, H.; Low, S.H.; Chakrabarti, S.; Baldick, R.; Lavaei, J. A Survey of Distributed Optimization and Control Algorithms for Electric Power Systems. IEEE Trans. Smart Grid 2017, 8, 2941–2962. [Google Scholar] [CrossRef] [Scilit]
- Boyd, S.; Parikh, N.; Chu, E.; Peleato, B.; Eckstein, J. Distributed Optimization and Statistical Learning via the Alternating Direction Method of Multipliers. Found. Trends Mach. Learn. 2011, 3, 1–122. [Google Scholar] [CrossRef] [Scilit]
- Eckstein, J.; Yao, W. Understanding the Convergence of the Alternating Direction Method of Multipliers: Theoretical and Computational Perspectives. Pac. J. Optim. 2015, 11, 619–644. [Google Scholar]
- Li, B.; Shi, B. Understanding the ADMM Algorithm via High-Resolution Differential Equations. arXiv 2024, arXiv:2401.07096. [Google Scholar]
- Magnússon, S.; Weeraddana, P.C.; Fischione, C. A Distributed Approach for the Optimal Power Flow Problem Based on ADMM and Sequential Convex Approximations. arXiv 2014, arXiv:1401.4621. [Google Scholar]
- Peng, Q.; Low, S.H. Distributed Optimal Power Flow Algorithm for Balanced Radial Distribution Networks. arXiv 2014, arXiv:1404.0700. [Google Scholar]
- Dall’Anese, E.; Zhu, H.; Giannakis, G.B. Distributed Optimal Power Flow for Smart Microgrids. IEEE Trans. Smart Grid 2013, 4, 1464–1475. [Google Scholar] [CrossRef] [Scilit]
- Maneesha, A.; Swarup, K.S. A Survey on Applications of Alternating Direction Method of Multipliers in Smart Power Grids. Renew. Sustain. Energy Rev. 2021, 152, 111687. [Google Scholar] [CrossRef] [Scilit]
- Chang, T.-H.; Hong, M.; Liao, W.-C.; Wang, X. Asynchronous Distributed ADMM for Large-Scale Optimization—Part I: Algorithm and Convergence Analysis. IEEE Trans. Signal Process. 2016, 64, 3118–3130. [Google Scholar] [CrossRef] [Scilit]
- Liu, Z.; Guo, F.; Wang, W.; Wu, X. A Distributed Parallel Optimization Algorithm via Alternating Direction Method of Multipliers. IET Control Theory Appl. 2023, 17, 896–905. [Google Scholar] [CrossRef] [Scilit]
- Biagioni, D.; Graf, P.; Zhang, X.; Zamzam, A.S.; Baker, K.; King, J. Learning-Accelerated ADMM for Distributed Optimal Power Flow. arXiv 2019, arXiv:1911.03019. [Google Scholar]
- Engelmann, A.; Jiang, Y.; Mühlpfordt, T.; Houska, B.; Faulwasser, T. Toward Distributed OPF Using ALADIN. IEEE Trans. Power Syst. 2019, 34, 584–594. [Google Scholar] [CrossRef] [Scilit]
- Benato, R.; Gardan, G. A New Algorithm for Multi-Area Power Flow. IEEE Access 2023, 11, 89921–89932. [Google Scholar] [CrossRef] [Scilit]
- Aristidou, P.; Van Cutsem, T. A Parallel Processing Approach to Dynamic Simulations of Combined Transmission and Distribution Systems. Int. J. Electr. Power Energy Syst. 2015, 72, 58–65. [Google Scholar] [CrossRef] [Scilit]
- Kyesswa, M.; Murray, A.; Schmurr, P.; Çakmak, H.; Kühnapfel, U.; Hagenmeyer, V. Impact of Grid Partitioning Algorithms on Combined Distributed AC Optimal Power Flow and Parallel Dynamic Power Grid Simulation. IET Gener. Transm. Distrib. 2020, 14, 6133–6141. [Google Scholar] [CrossRef] [Scilit]
- Amdahl, G.M. Validity of the Single Processor Approach to Achieving Large Scale Computing Capabilities. In Proceedings of the AFIPS Spring Joint Computer Conference, Atlantic City, NJ, USA, 18–20 April 1967; pp. 483–485. [Google Scholar] [CrossRef] [Scilit]
- Gustafson, J.L. Reevaluating Amdahl’s Law. Commun. ACM 1988, 31, 532–533. [Google Scholar] [CrossRef] [Scilit]
- Zimmerman, R.D.; Murillo-Sánchez, C.E.; Thomas, R.J. MATPOWER: Steady-State Operations, Planning, and Analysis Tools for Power Systems Research and Education. IEEE Trans. Power Syst. 2011, 26, 12–19. [Google Scholar] [CrossRef] [Scilit]
- Coffrin, C.; Gordon, D.; Scott, P. NESTA, The NICTA Energy System Test Case Archive. arXiv 2014, arXiv:1411.0359. [Google Scholar]
- Birchfield, A.B.; Xu, T.; Gegner, K.M.; Shetye, K.S.; Overbye, T.J. Grid Structural Characteristics as Validation Criteria for Synthetic Networks. IEEE Trans. Power Syst. 2017, 32, 3258–3265. [Google Scholar] [CrossRef] [Scilit]
- Texas A&M University Electric Grid Test Case Repository. Texas Synthetic Grid (Texas7k). Available online: https://electricgrids.engr.tamu.edu/texas7k/ (accessed on 31 August 2026).
- Aitken, A.C. On Bernoulli’s Numerical Solution of Algebraic Equations. Proc. R. Soc. Edinb. 1926, 46, 289–305. [Google Scholar] [CrossRef] [Scilit]
- Walker, H.F.; Ni, P. Anderson Acceleration for Fixed-Point Iterations. SIAM J. Numer. Anal. 2011, 49, 1715–1735. [Google Scholar] [CrossRef] [Scilit]
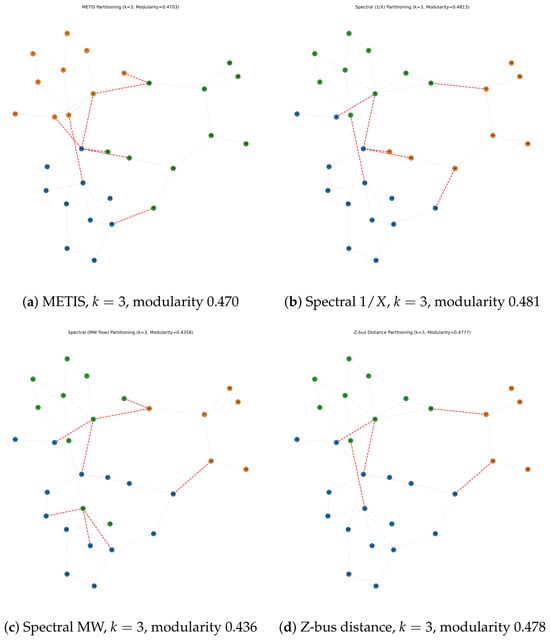
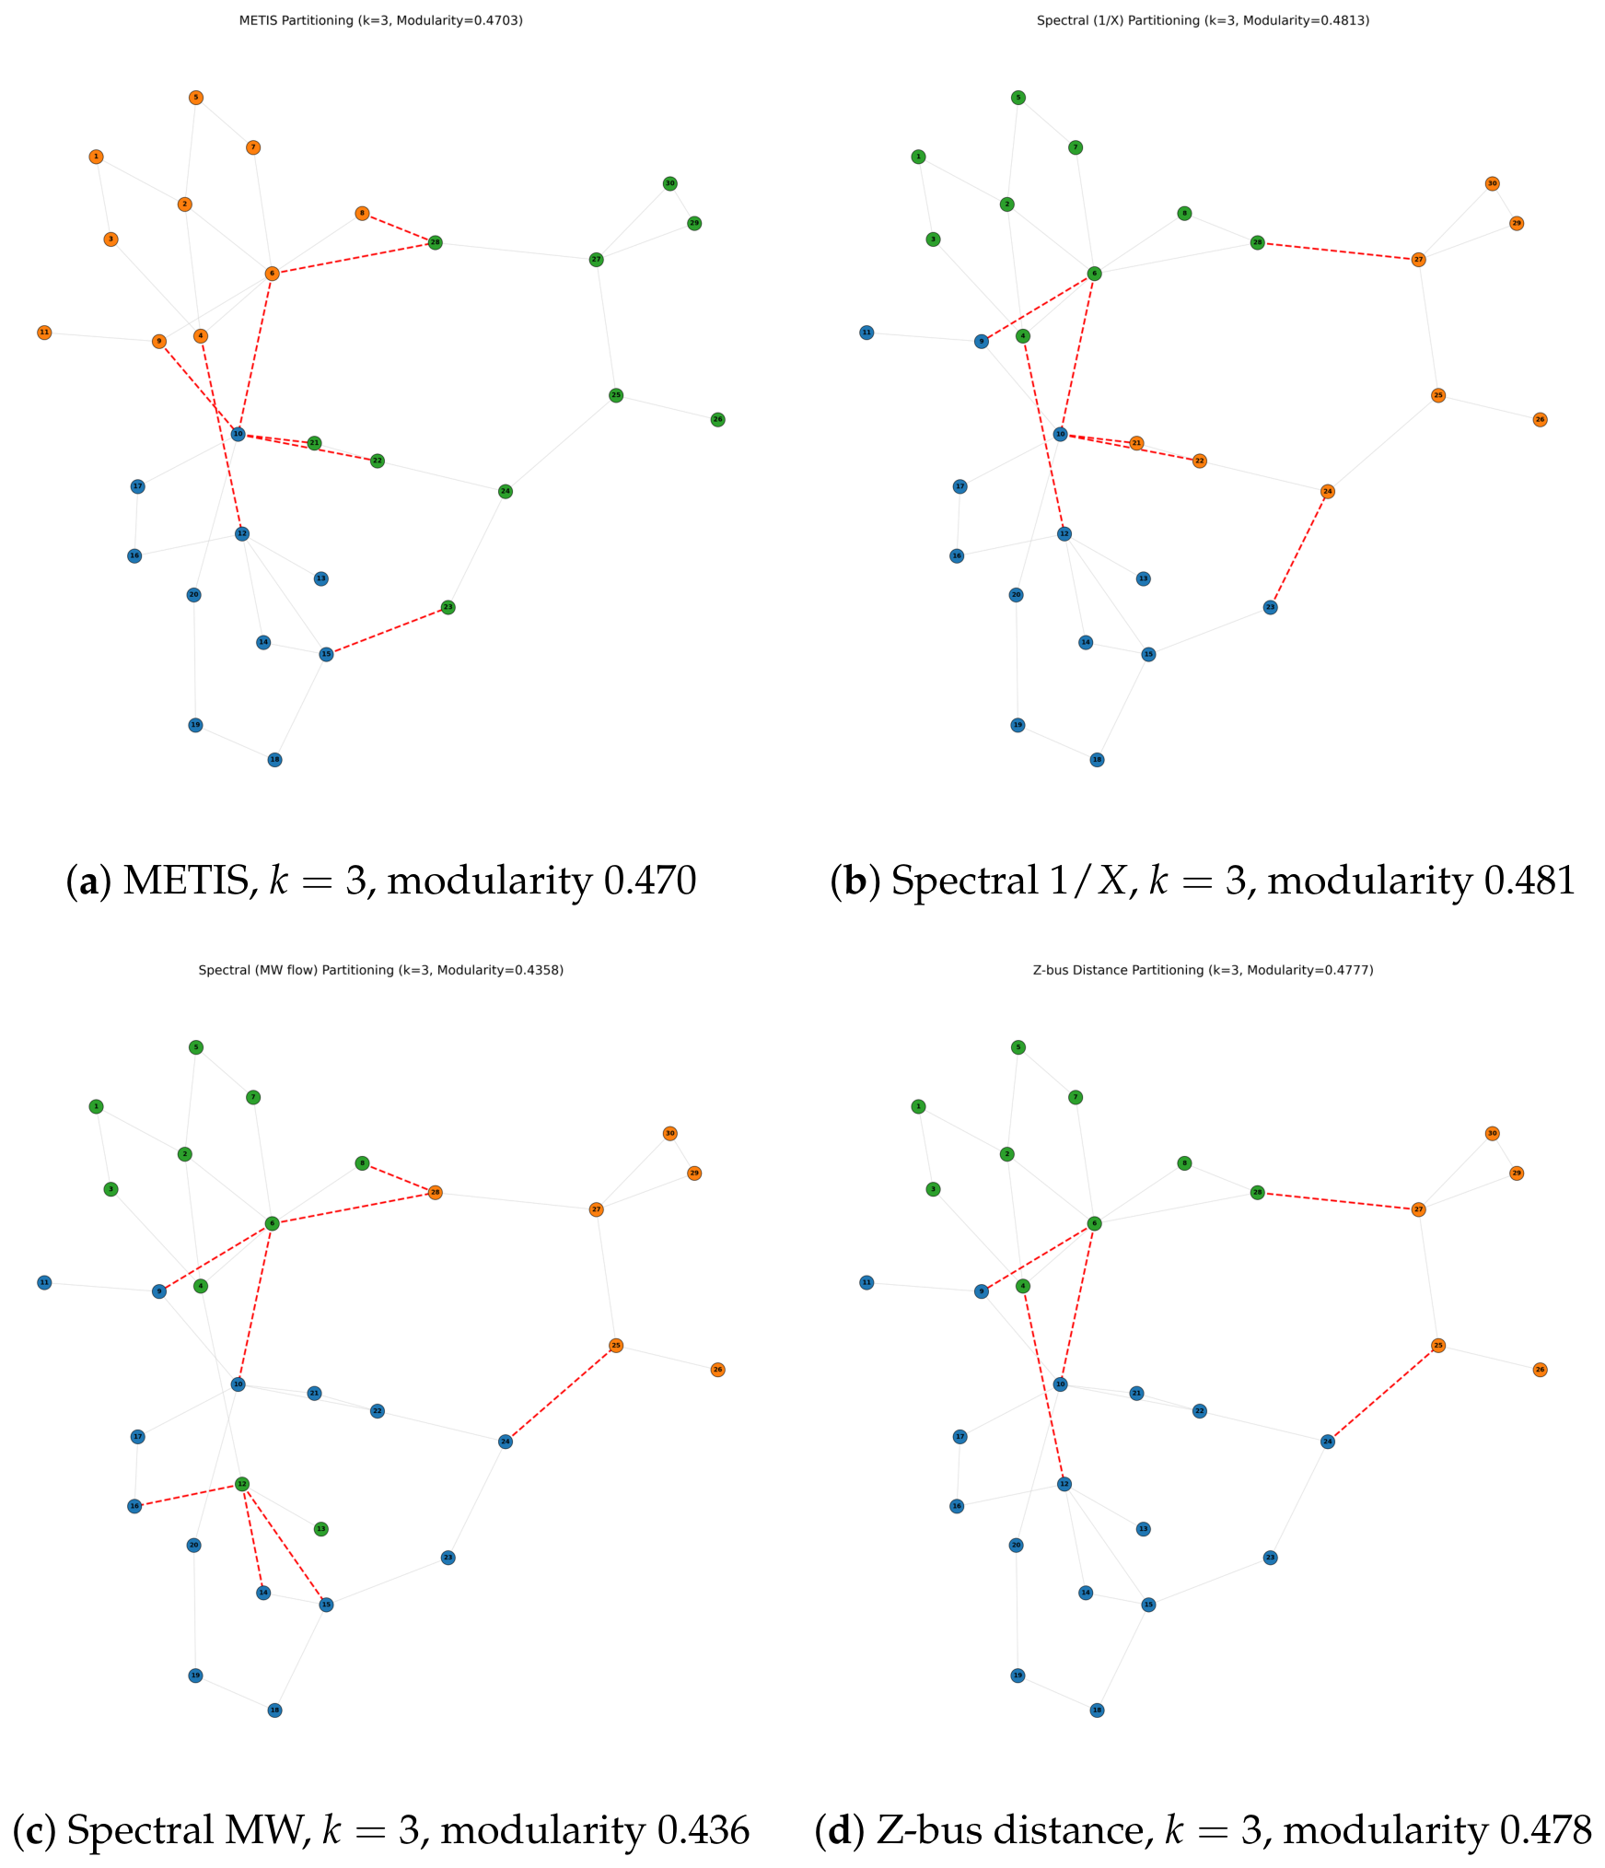
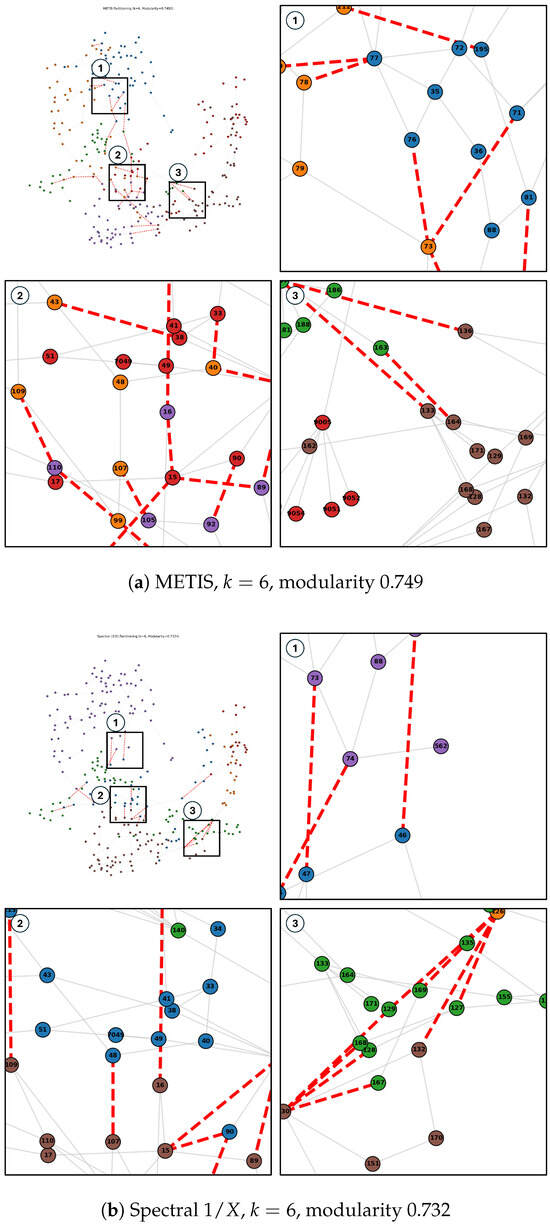
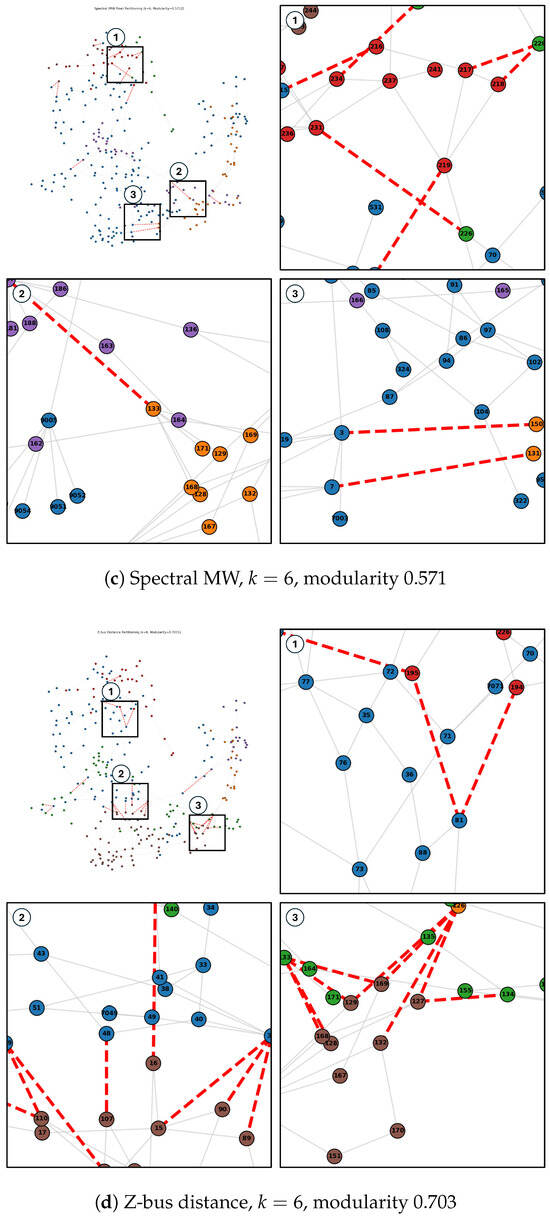
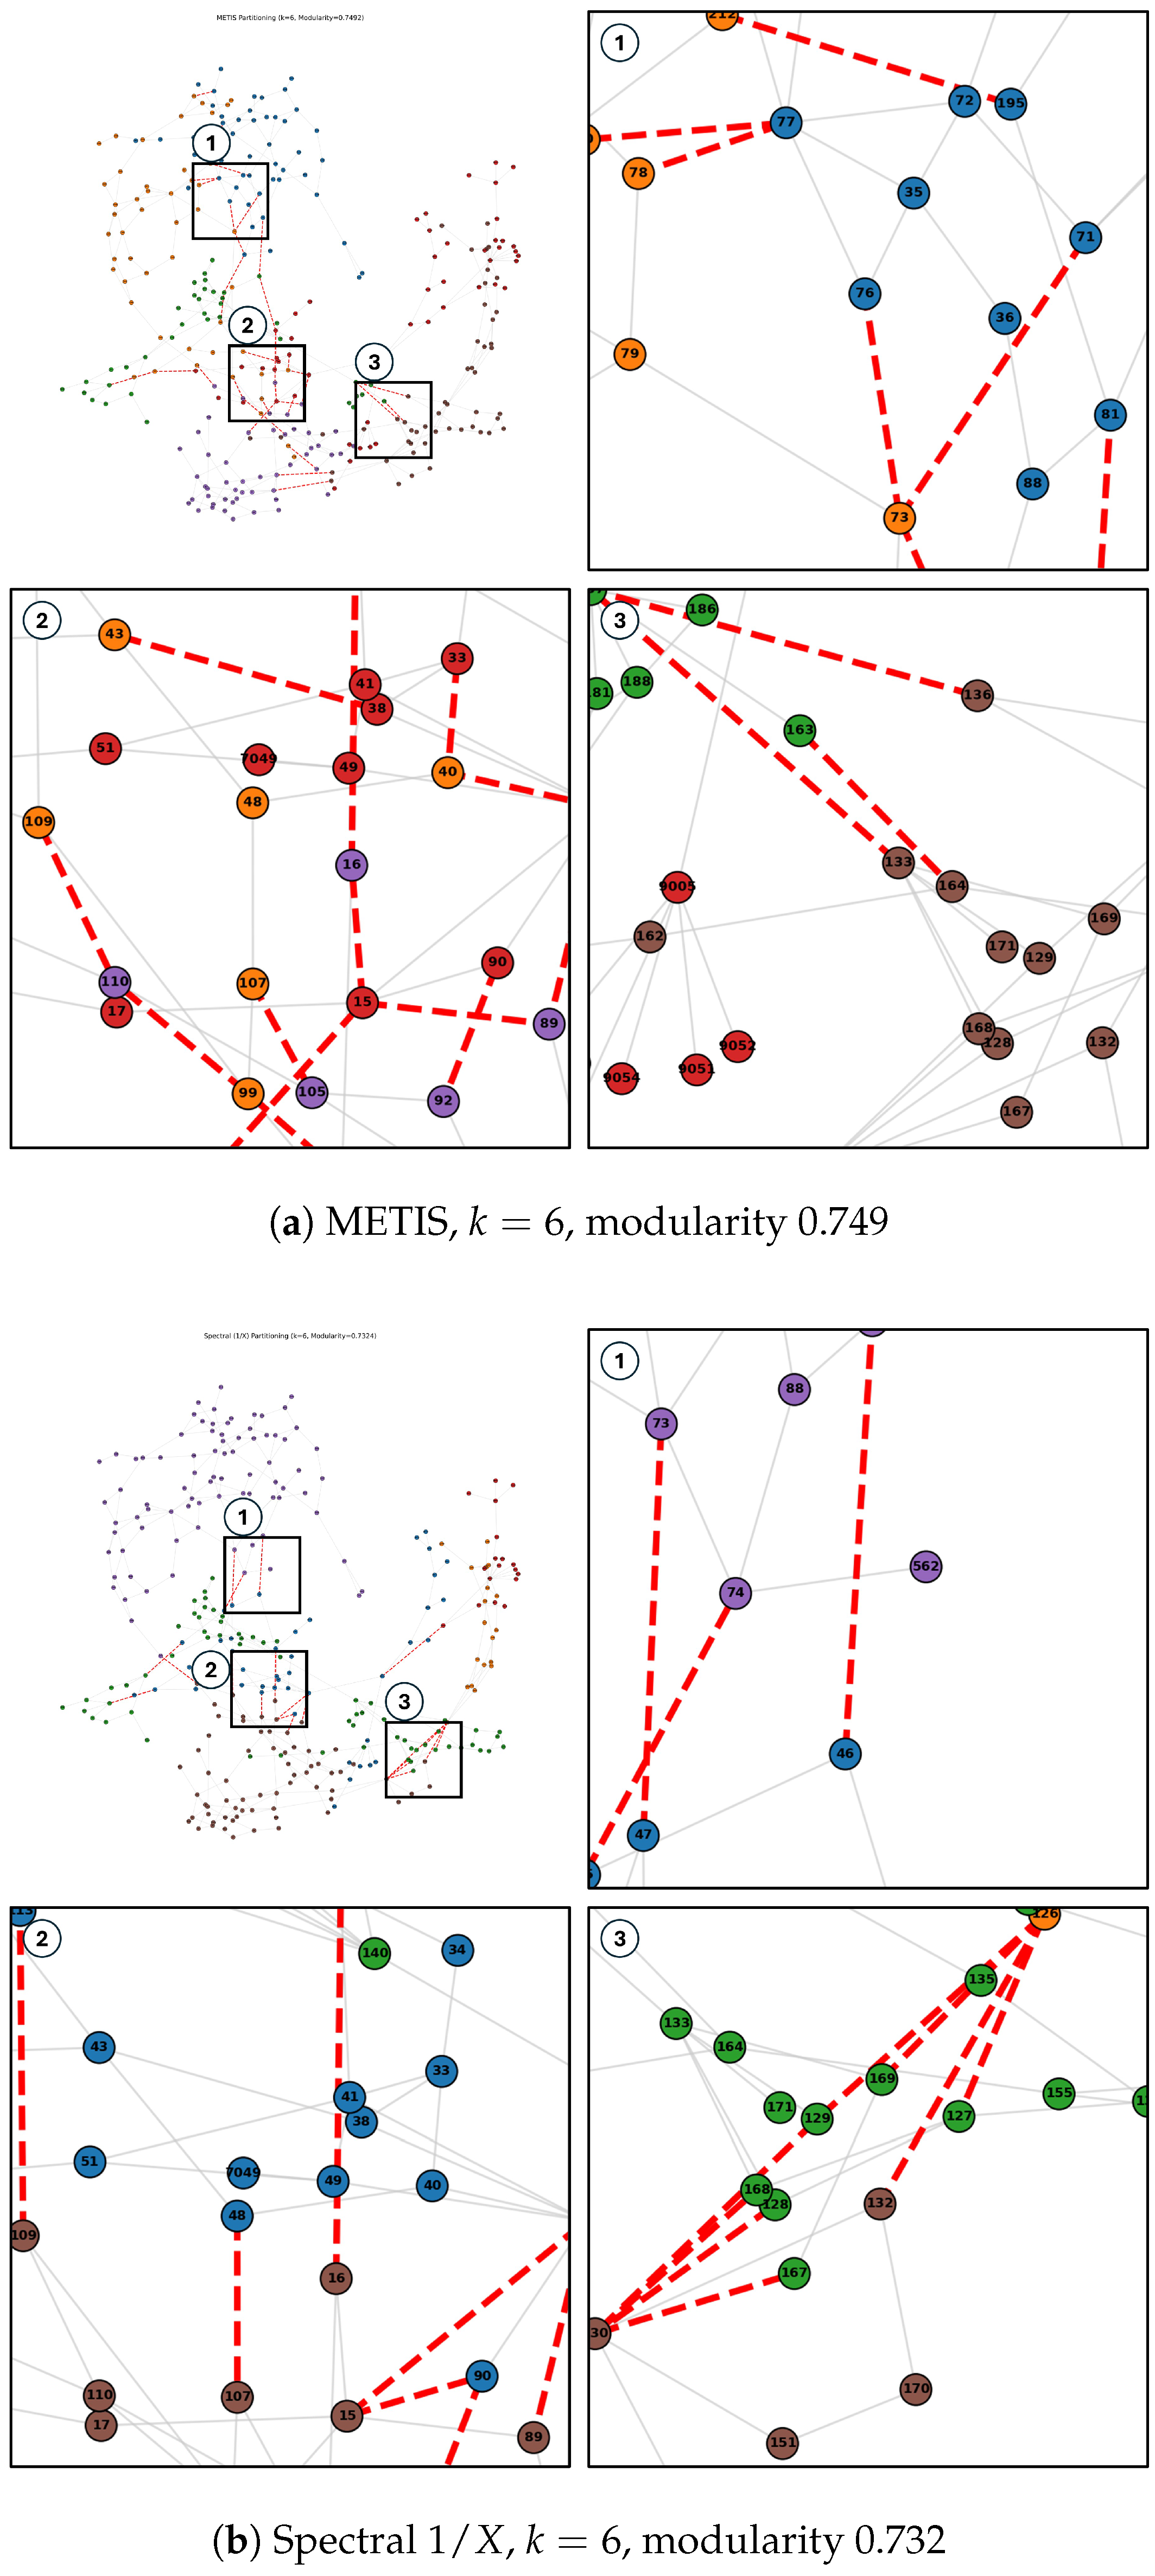
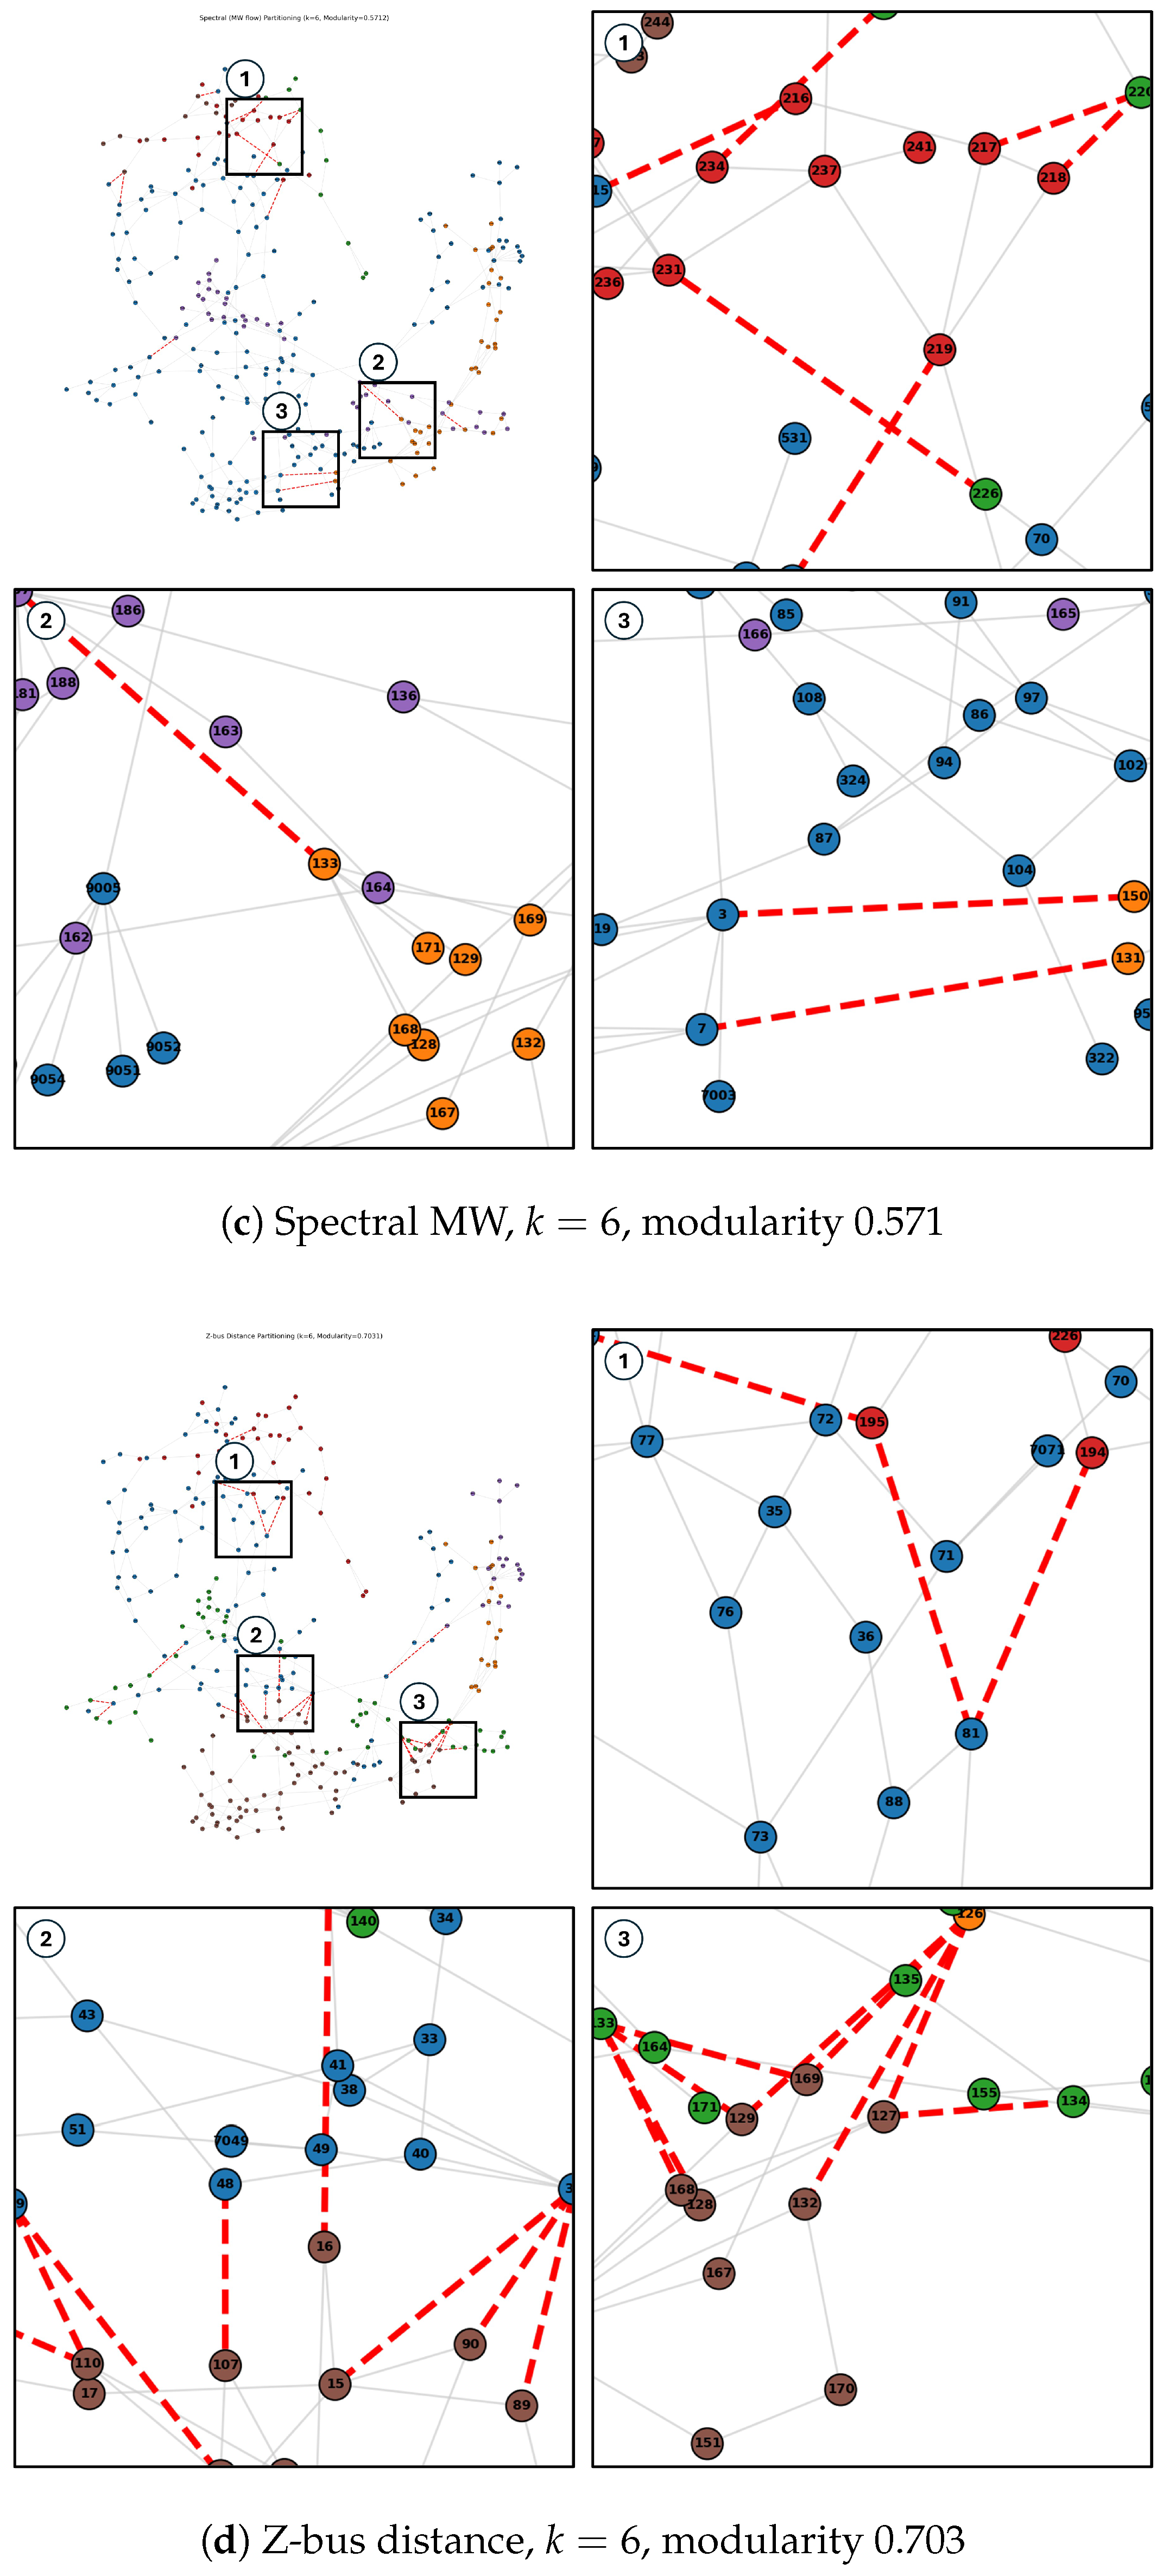
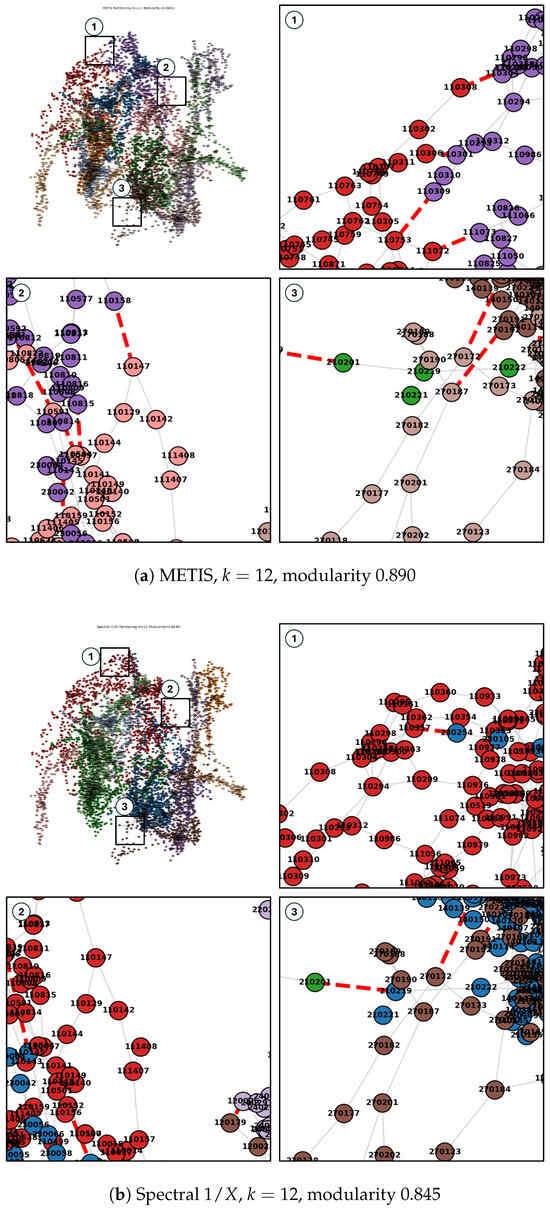
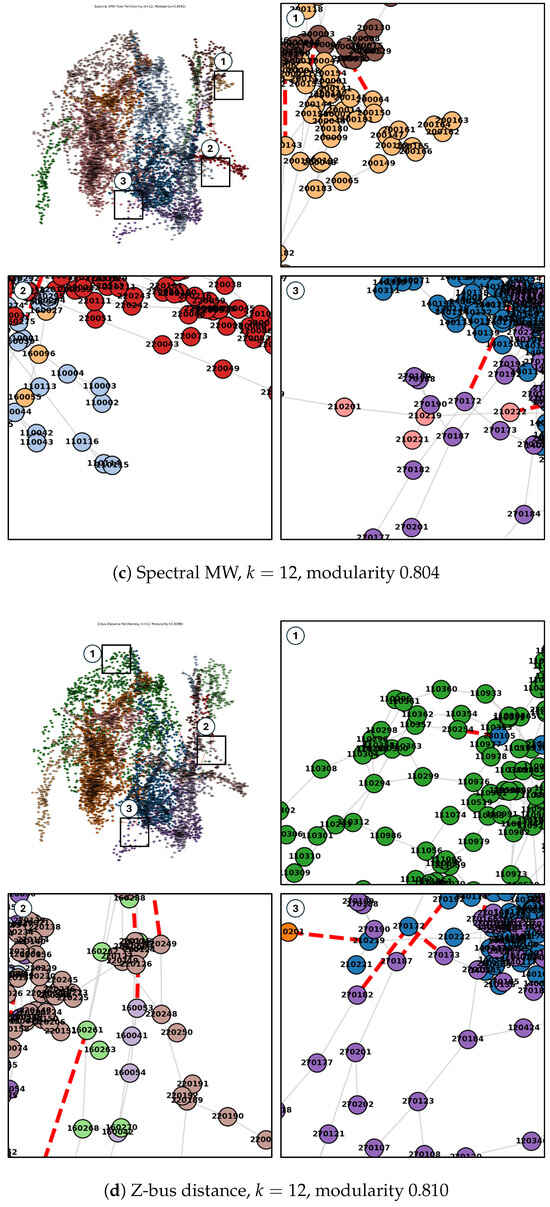
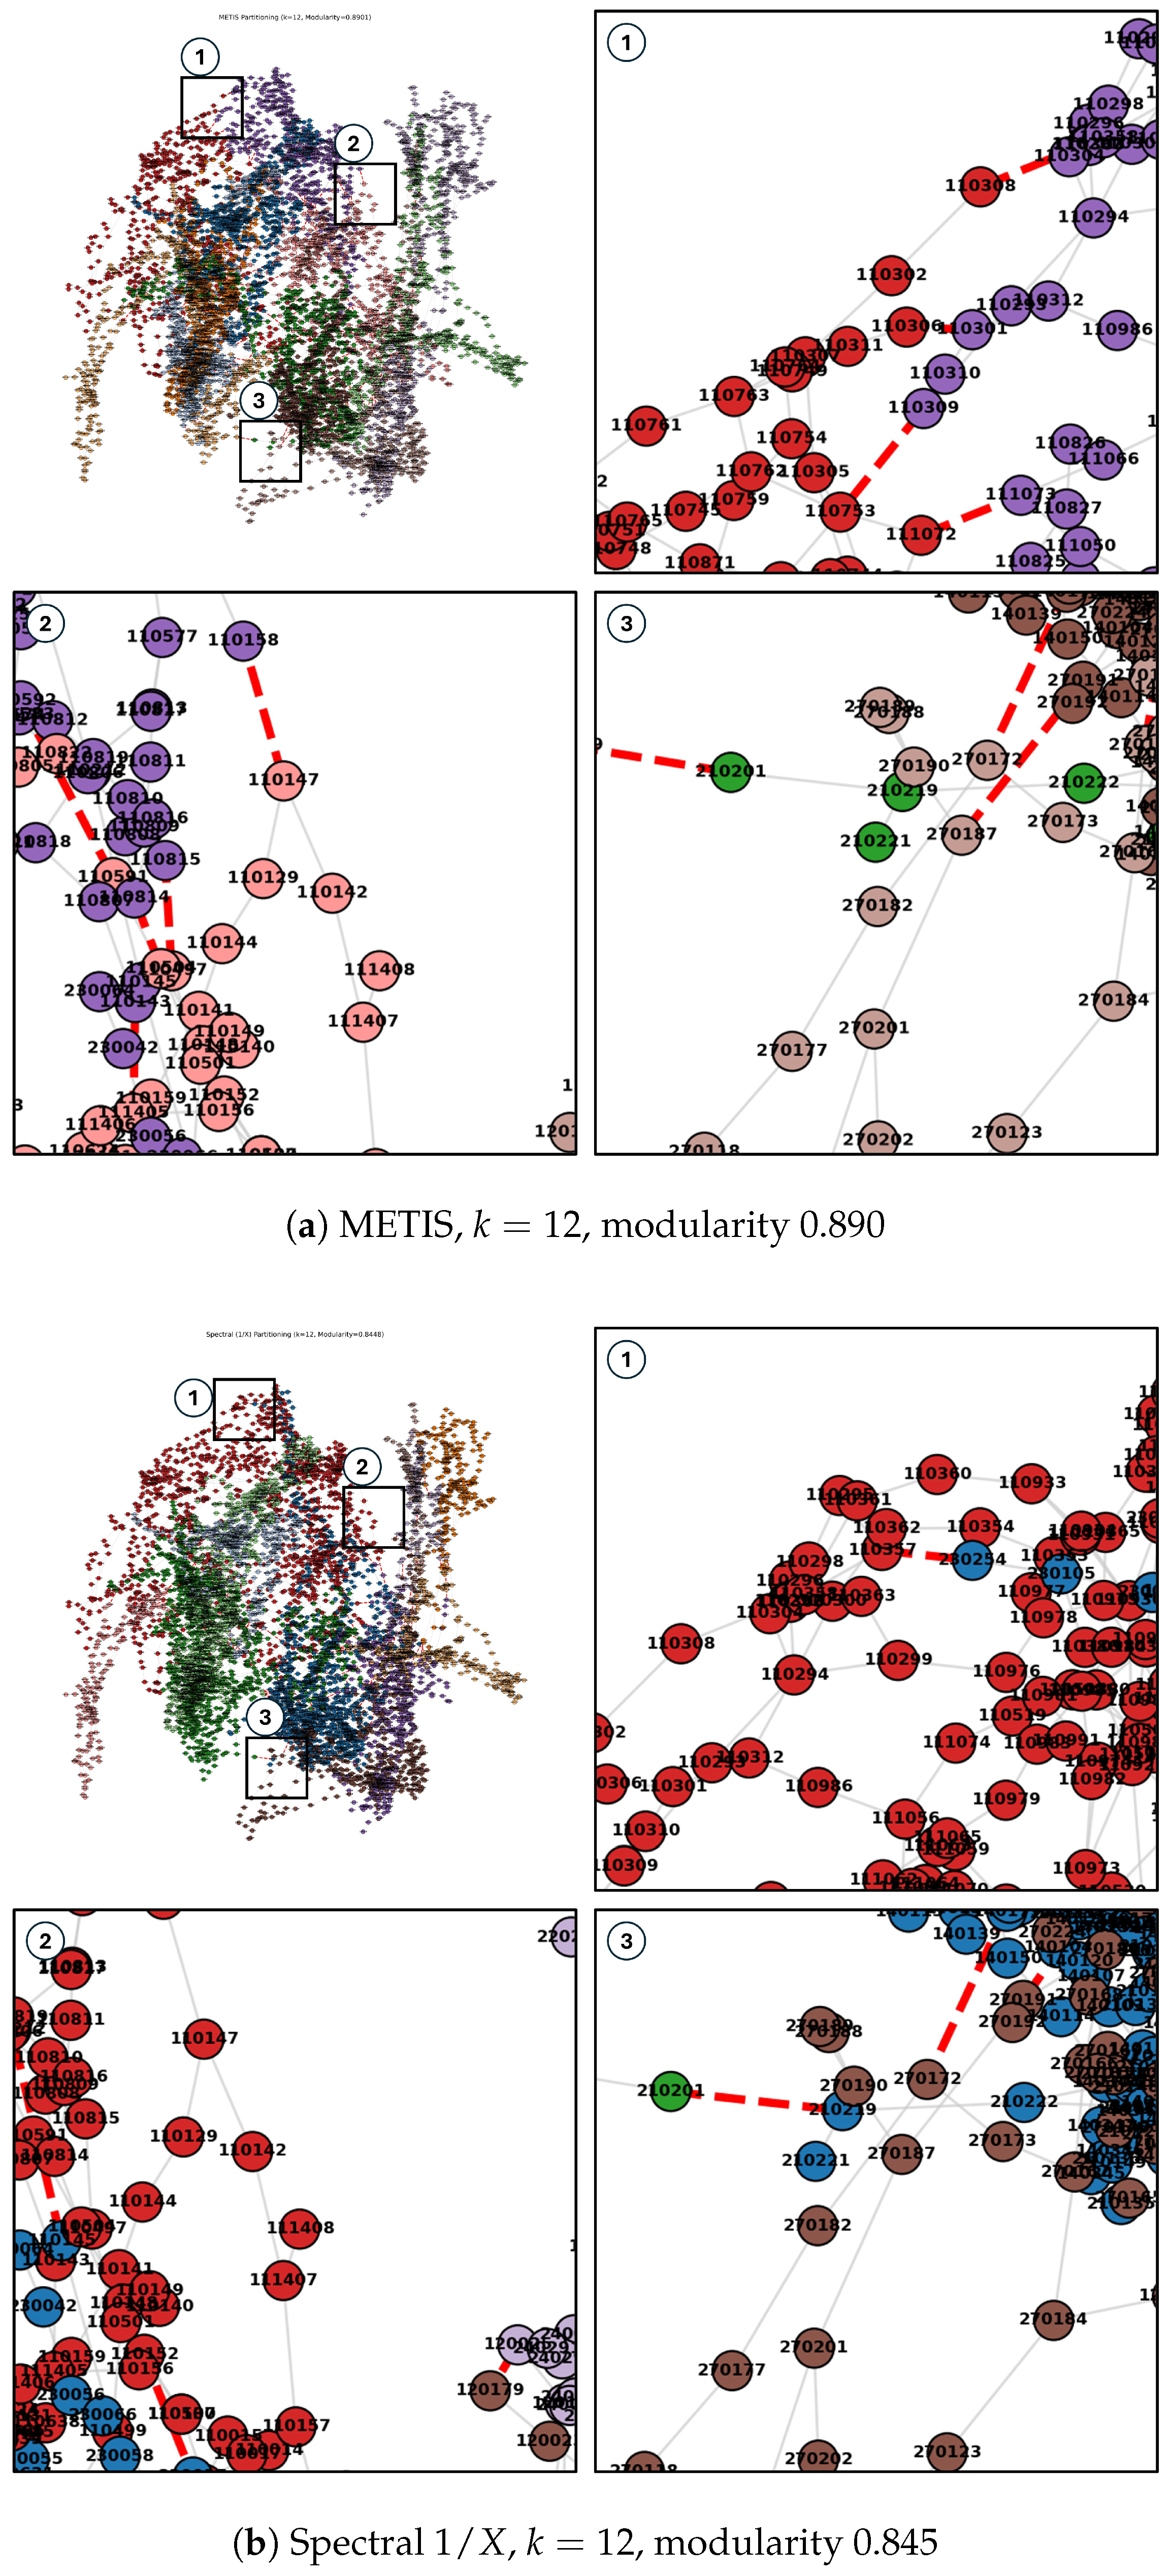
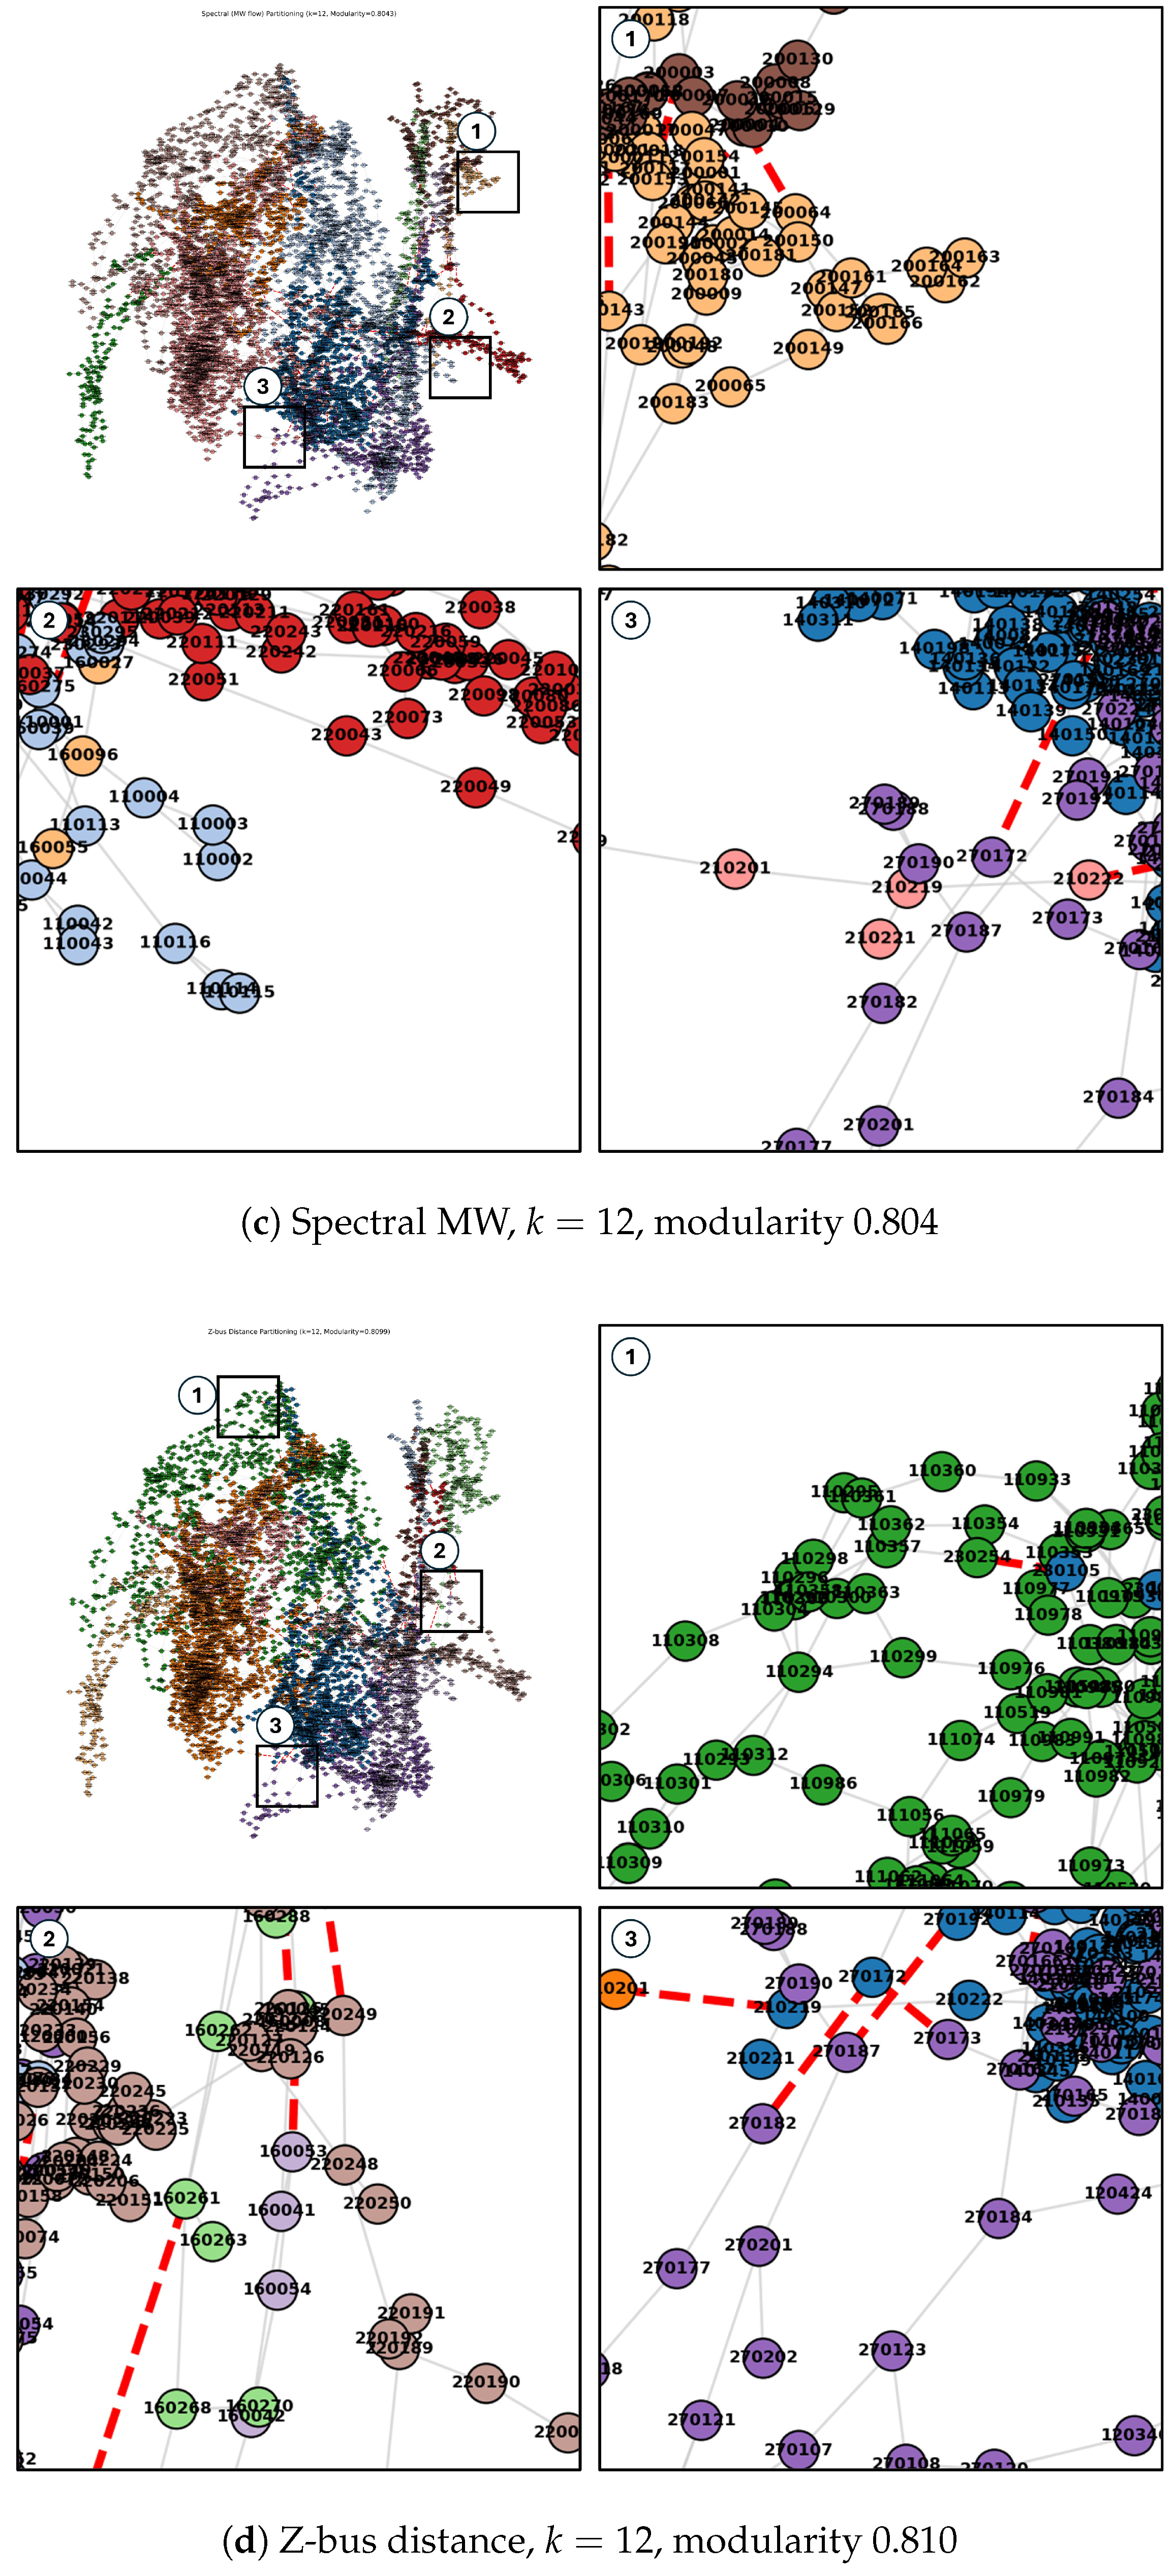
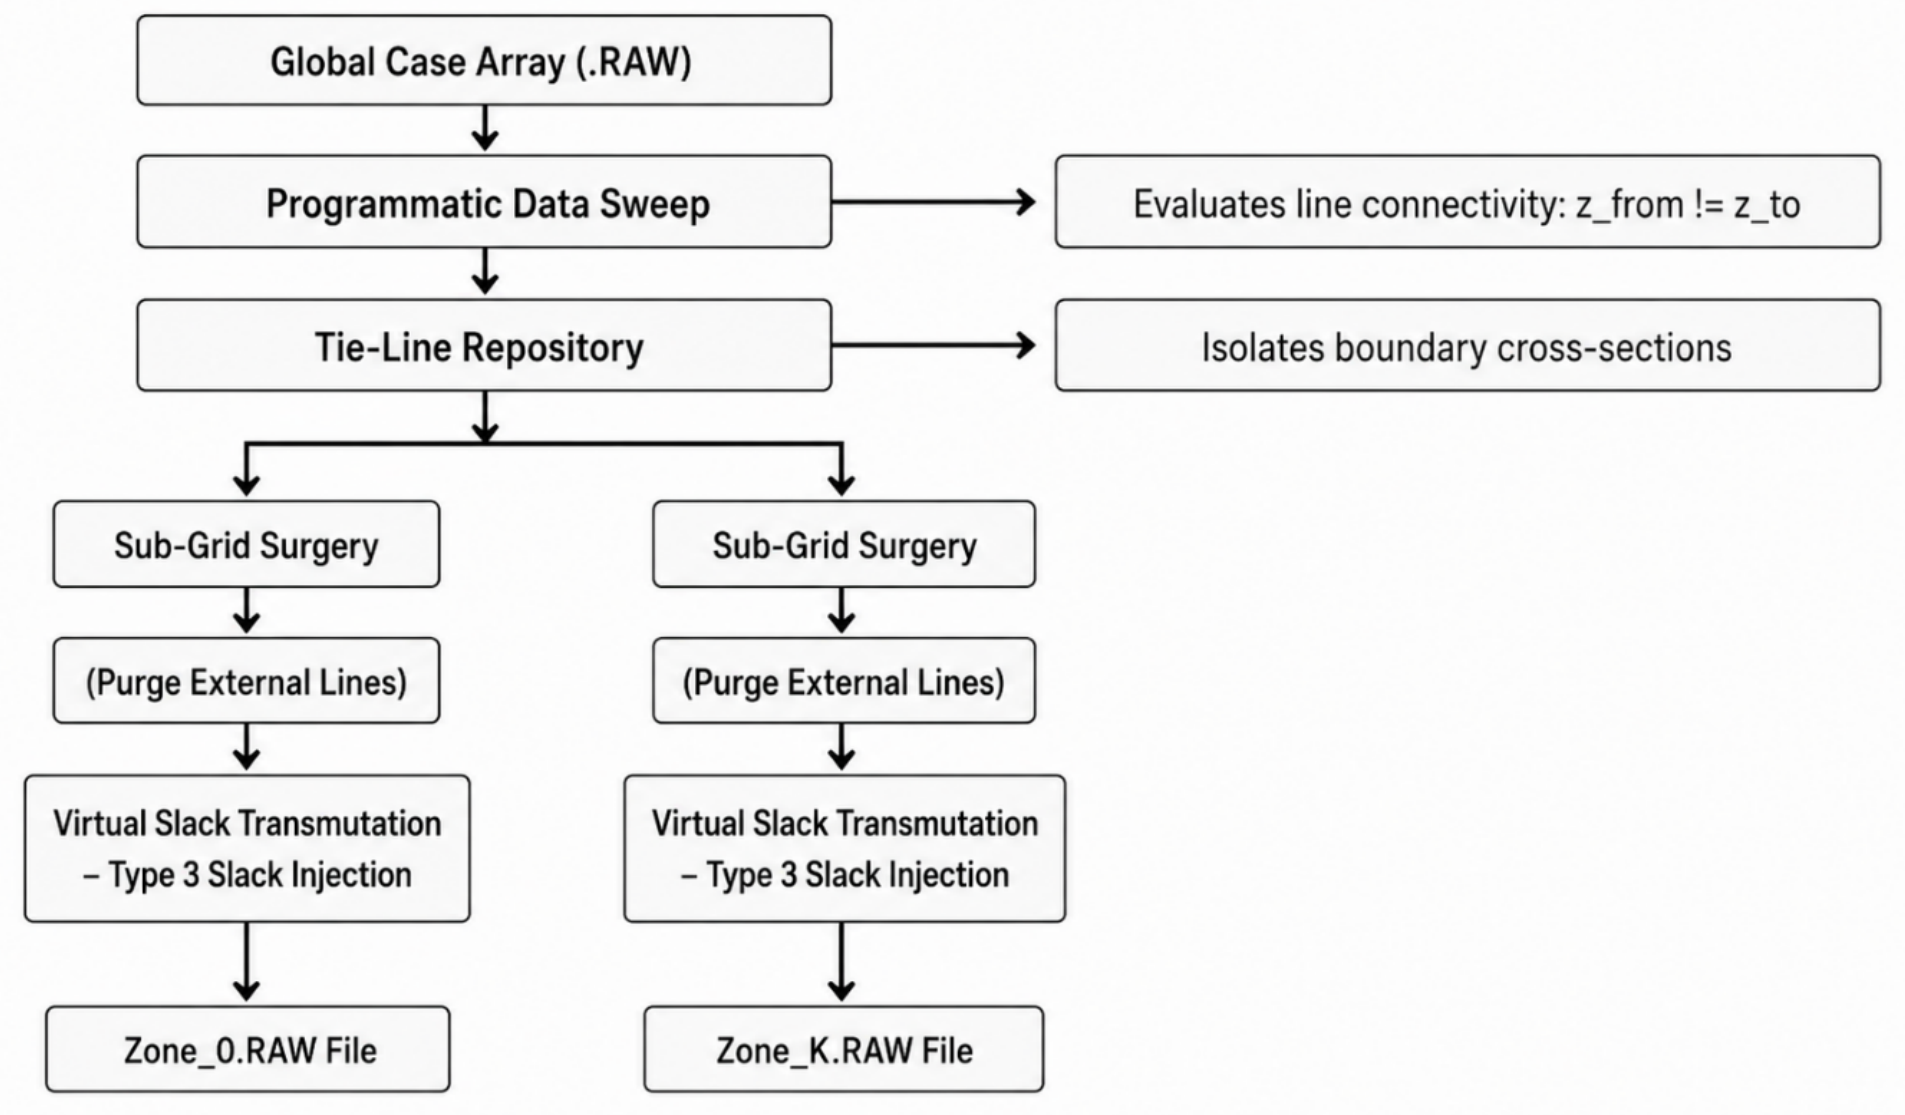
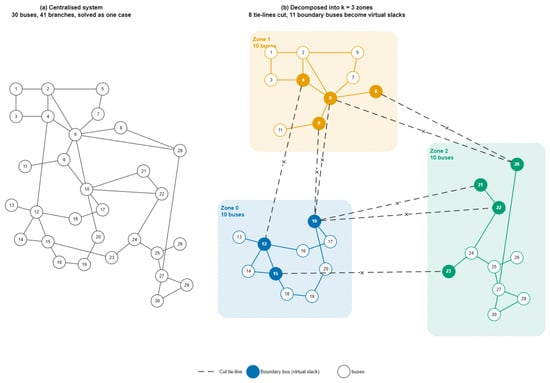
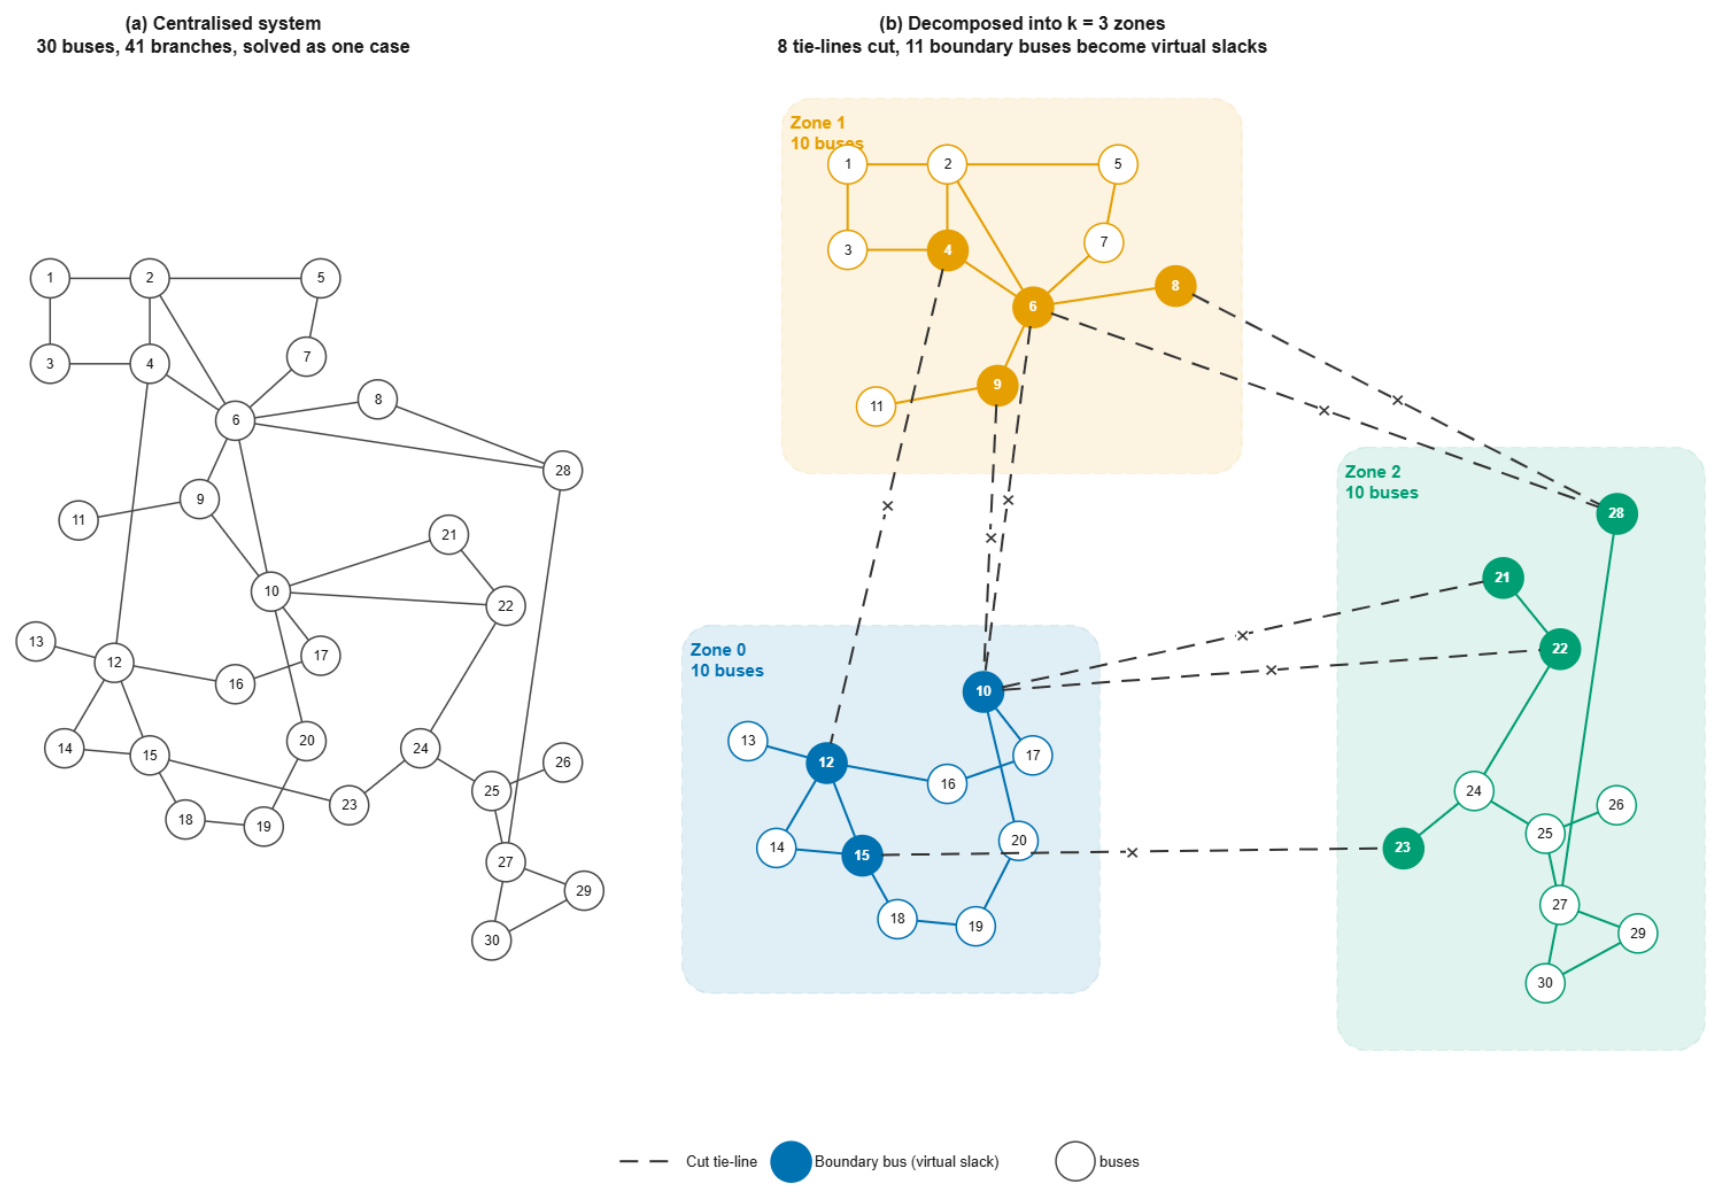
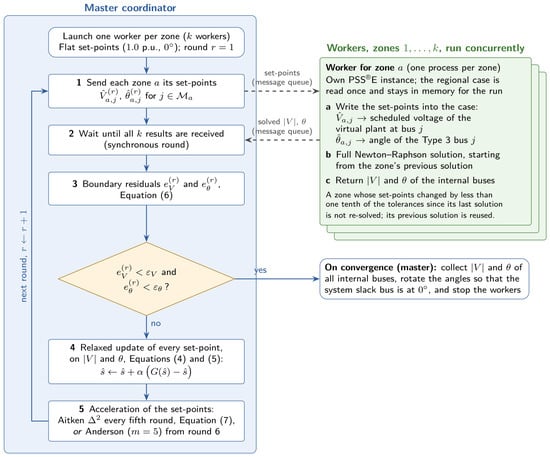
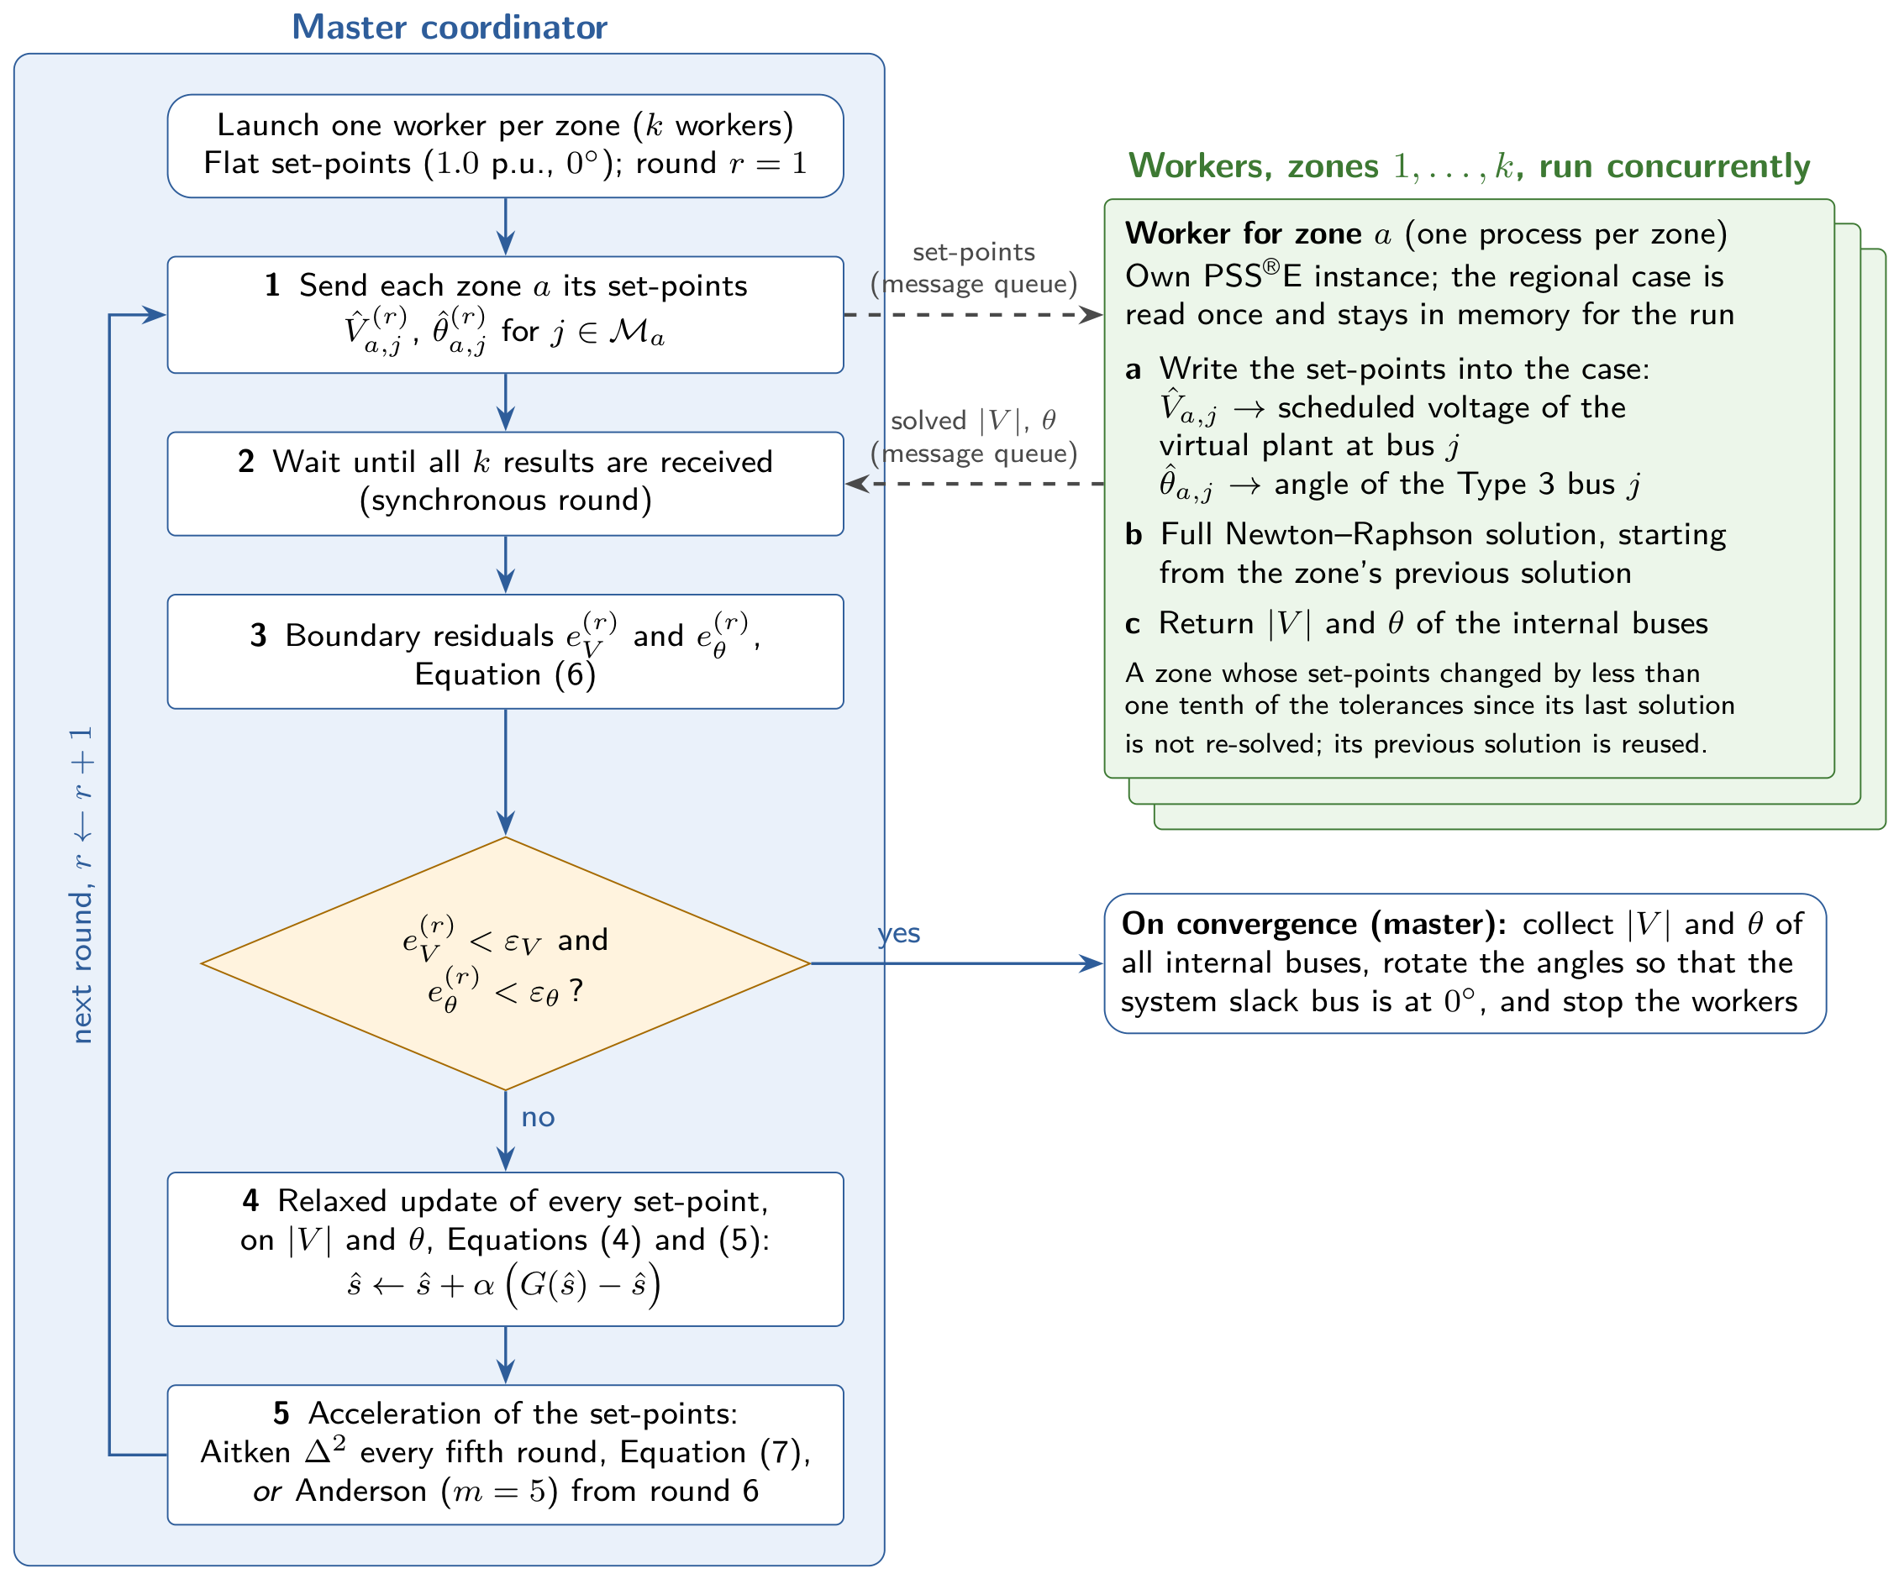

Disclaimer/Publisher’s Note: The statements, opinions and data contained in all publications are solely those of the individual author(s) and contributor(s) and not of MDPI and/or the editor(s). MDPI and/or the editor(s) disclaim responsibility for any injury to people or property resulting from any ideas, methods, instructions or products referred to in the content. |
© 2026 by the authors. Licensee MDPI, Basel, Switzerland. This article is an open access article distributed under the terms and conditions of the Creative Commons Attribution (CC BY) license.