


Abstract
The aim of the study was to conduct an energy and economic analysis of construction of a demand-driven biogas plant. Two capacity configurations, 0.249 MW and 0.499 MW, were analyzed using four demand-driven operating variants and a linear reference case. Revenues were calculated under the Feed-in Premium (FIP) system based on electricity prices on the Day-Ahead Market (DAM) in 2025. Among the analyzed variants, D4 was the most favorable, combining the predetermined curtailment schedule introduced by the recent amendment to the Polish Energy Law, with additional price-responsive operation during the remaining months. For D4, net present value (NPV) reached PLN 3.826 million, with an internal rate of return (IRR) of 12.87% and a discounted payback period (DPBP) of 9.93 years for the 0.249 MW configuration, and PLN 17.045 million, with an IRR of 20.61% and a DPBP of 6.21 years for the 0.499 MW configuration. Although D4 generated a higher NPV than the linear variants, its higher investment costs resulted in less favorable IRR and DPBP values. Increasing the reference price for demand-driven biogas plants to approximately 1100 PLN/MWh could reduce this profitability gap. An indicative comparison showed similar expenditure per unit of energy capacity for the additional infrastructure required for demand-driven operation and battery energy storage system (BESS); however differences between the technologies and the cost assumptions prevent a direct assessment of their economic competitiveness.
1. Introduction
Biogas produced through anaerobic digestion is one of the most stable and flexible renewable energy sources (RESs) [1,2]. It can be used for the production of electricity and heat in cogeneration or further upgraded to biomethane [3]. Due to the high costs of upgrading technologies, insufficiently developed gas infrastructure, and the limited capacity of distribution networks in rural areas, this sector is still at an early stage of development in Poland [4,5]. Currently, the country has only one operational biomethane plant, located in Strzelin [6].
Investments carried out to date have focused primarily on biogas plants, whose main source of revenue is the sale of electricity. According to the registry of agricultural biogas producers published by the National Support Centre for Agriculture, there are currently 213 agricultural biogas plants operating in Poland, with a total annual biogas production capacity exceeding 841 million m3 [7]. Due to the significant fragmentation of domestic agricultural production, with more than 80% of farms covering an area not exceeding 15 hectares, and the national average farm size amounting to 11.75 hectares [8], micro-biogas plants with a capacity of up to 50 kW represent an alternative for smaller farms [9]. At the end of 2025, their total number was 79 [10].
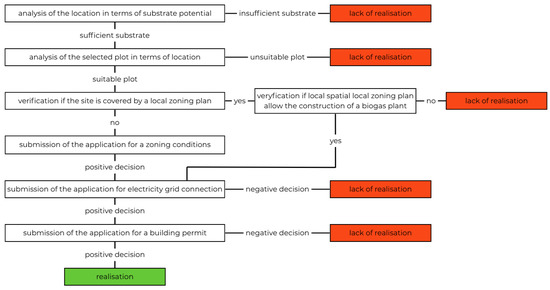
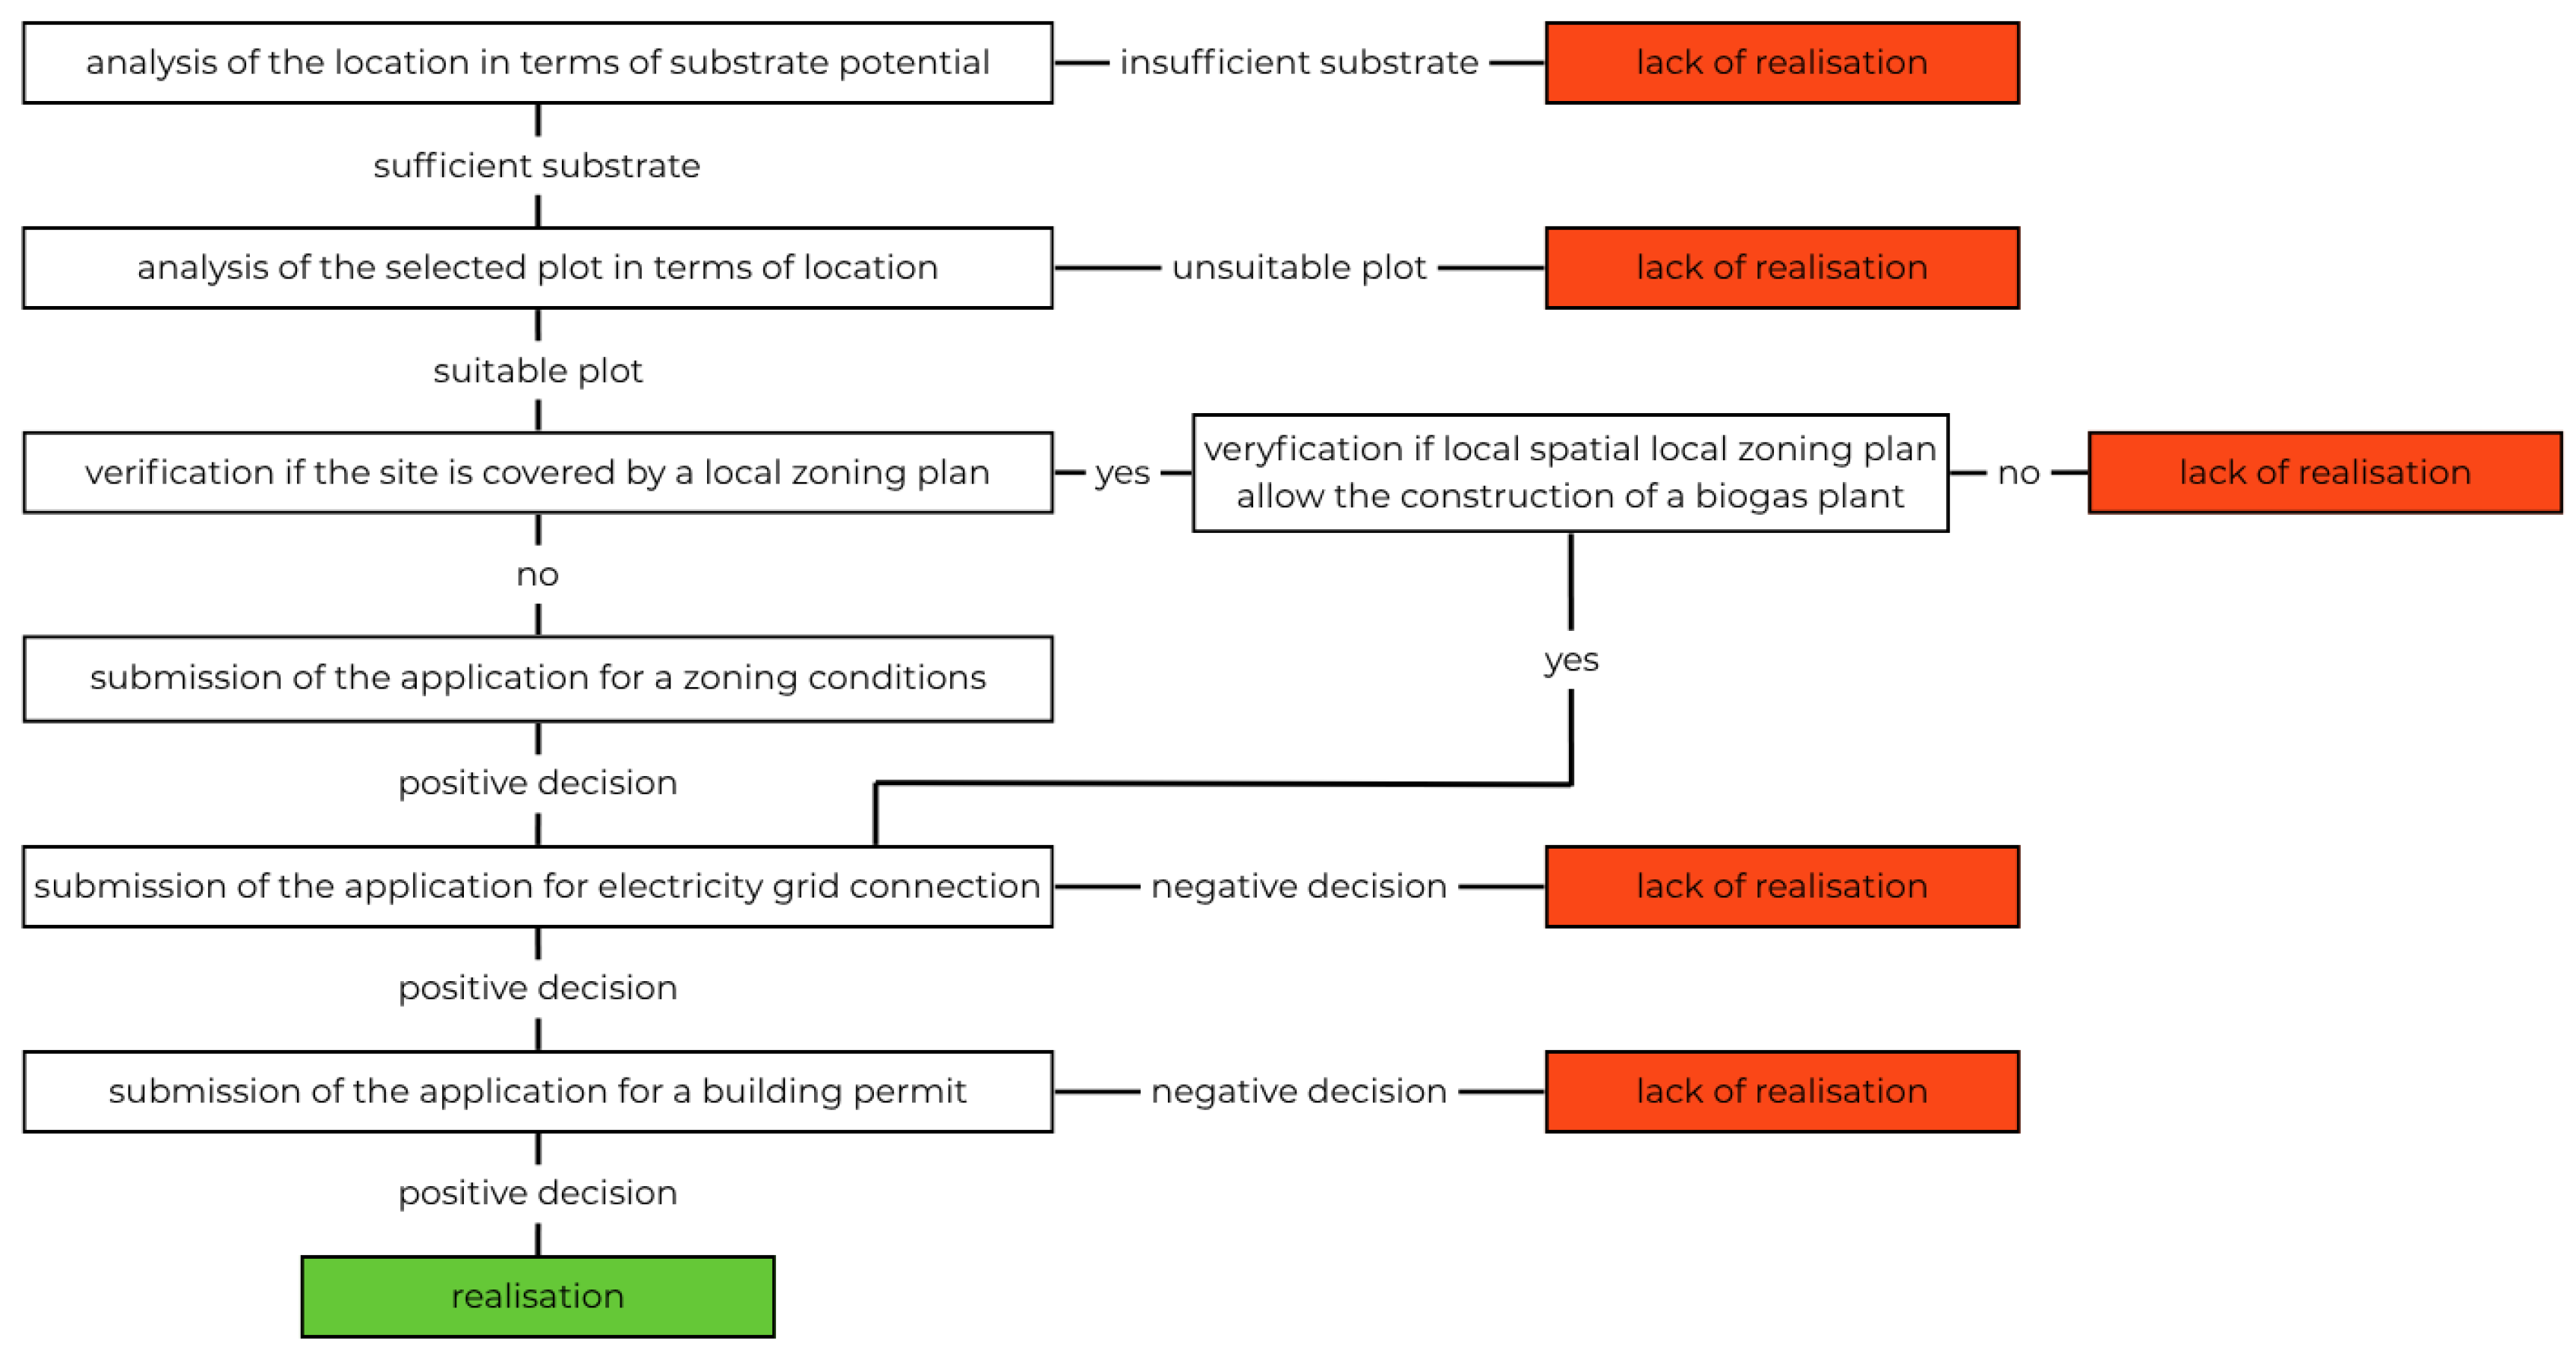
Considering the domestic biogas production potential, the level of its utilization remains limited [11,12]. Further development of the sector requires new investments, which are subject to the multi-stage investment process outlined in Figure 1 [13].
Figure 1.
Stages of the biogas plant investment process (authors’ own elaboration based on Pochwatka et al. [13]).
In recent years, the growing number of rejected grid connection applications has posed a significant barrier to the construction of new biogas plants [11,14]. The reasons for these refusals were discussed by Łukomska et al. [15], who indicated that they were mainly caused by the lack of available grid connection capacity, much of which had already been allocated to other RESs installations, particularly photovoltaic installations and, to a lesser extent, wind power plants. In 2025, total installed capacity of these sources in the Polish Power System (PPS) amounted to approximately 37 GW [16]. However, their dependence on weather conditions, the limited controllability of electricity generation, and insufficient energy storage capacity pose challenges to the stable operation of the PPS, while simultaneously increasing the importance of flexible and controllable energy sources [17,18].
Biogas plants, due to their ability to reduce electricity production at any time, and then restart it within a few minutes, can complement electricity production from other RESs [19,20]. In addition, they can actively support the stabilization of key power system parameters, particularly voltage and frequency [21]. Flexible active power control of Combined Heat and Power (CHP) units enables them to participate in system balancing and provide ancillary services, including reserves used to maintain system frequency. Hahn et al. [22] demonstrated the potential of biogas plants to provide both positive and negative balancing power, while Ishikawa et al. [23] confirmed their ability to provide power regulation corresponding, among others, to tertiary reserve requirements. In addition, the physical inertia of the power generation system may limit the rate of change frequency change and its maximum deviation following a disturbance [24]. The stabilizing effect of biogas plant on voltage was also confirmed by Skibko et al. [25], who demonstrated that while the generator was operating, the voltage in the local low-voltage grid was more stable, whereas shutting it down caused the voltage to drop from approximately 234 to 226 V.
However, the importance of biogas plants is not limited solely to their role in the energy sector. They also process high-emission organic waste, thereby contributing to the reduction in greenhouse gas emissions from agricultural sector, which remains an important environmental challenge in Poland [26,27]. The development of the biogas sector can also increase farm revenues, both through the sale of electricity generated from biogas and the sale of the substrates needed for its production [28,29,30]. At the same time, the use of digestate as fertilizer can reduce the consumption of some mineral fertilizers, yielding additional economic and environmental benefits [31,32].
The importance of biogas plants across multiple sectors has led to the introduction of preferential rules for their connection to the power grid by the Act of 28 July 2023 amending the Energy Law and certain other acts (item 1681). Under this legislation, grid connection conditions could be issued allowing temporary restrictions on biogas plant operation according to a predetermined schedule, without compensation for such curtailment. The assumptions of the act and its impact on the grid connection process were discussed by Łukomska et al. [33], who indicated that the schedules were overly restrictive and reduced investors’ willingness to develop demand-driven biogas plants. An important incentive for the construction of such facilities is provided by the Act of 13 March 2026, amending the Energy Law and certain other acts (item 516), which repealed the previously applicable schedules and increased the number of guaranteed hours of electricity offtake. According to the current regulations, electricity production from biogas plants may be suspended only from March to September and for a maximum of 10 h per day. Although such restrictions are not mandatory and biogas plants are to be curtailed last, the growing balancing needs of the PPS may increase the likelihood of such intervention [17].
The predetermined curtailment schedule for biogas plants differs from the approach used in Germany, where biogas plant operators decide when to reduce or suspend electricity generation in response to market signals [34,35]. In addition, the German biogas sector is currently undergoing a transformation associated with the phase-out of the Feed-in Tariff (FIT) system, which encourages biogas plants to shift towards demand-driven operation [36,37,38]. One of the main instruments supporting this transition is the EEG auction scheme, under which remuneration is limited to so-called eligible operating quarter-hours (förderfähige Betriebsviertelstunden), corresponding to the 11,680 quarter-hours per year with the highest electricity production for biogas plants above 350 kW. This approach replaced the previous model based on full-load hours and promotes demand-driven electricity generation [39]. An additional incentive is a flexibility bonus of 100 euros per kW of installed capacity per year [40].
Since the FIT system guarantees a fixed electricity selling price, independent of current market prices, throughout the entire support period, the implementation of demand-driven operation is more justified for installations operating under the FIP system [41]. Under this mechanism, electricity is sold at the market price, most commonly determined on the basis of the Fixing I index quoted on the DAM, while an additional premium is paid to cover the difference between 90% or 95% of the reference price specified in the regulation of the Minister of Climate and Environment and the average market electricity price determined on the basis of the TGeBase index, in accordance with the Act of 20 February 2015 on Renewable Energy Sources (item 68). Linking revenues to variable market prices makes it possible to increase them by reducing electricity production during periods of low or negative prices and shifting production to hours with higher prices. Both support systems are available in Poland, with eligibility depending on the installed capacity [42]. Installations with a capacity below 200 kW may benefit from either the FIT or FIP system, whereas installations with a higher capacity are eligible only for the FIP system, in accordance with the Act of 27 November 2024 amending the Act on Renewable Energy Sources and certain other acts (item 1847).
Previous studies have primarily focused on the technical feasibility of implementing demand-driven operation or on its effects on the operation of biogas plants in Germany. However, the findings of these studies do not provide a conclusive answer as to whether flexible operation is economically justified for newly designed biogas plants in Poland whose electricity production may be curtailed according to a predetermined schedule.
2. Aim and the Scope of Work
The aim of this study was to conduct an energy and economic analysis of the construction of a demand-driven biogas plant operating under four operational variants. To evaluate the current Polish regulations on biogas plant curtailment, two of the analyzed operational variants included the predetermined schedule specified in the recent act. Subsequently, the most favorable demand-driven variant was compared with the linear operation variant to determine whether the implementation of flexible operation actually leads to an increase in revenues, and whether this increase is sufficient to compensate for the higher investment costs associated with its implementation. The analysis was conducted for biogas plant with nominal capacities of 0.249 MW and 0.499 MW, selling electricity under the FIP system, which allowed for an assessment of the impact of biogas plant scale on differences in economic efficiency between demand-driven and linear operation. The analysis was complemented by a comparison of the possibility and cost of storing energy in the form of biogas with a BESS of equivalent capacity.
3. Material and Methods
3.1. Technical Assumptions of Analyzed Variants
The analysis focused on conducting the energy and economic efficiency of construction of demand-driven biogas plant with a nominal capacity of 0.249 MW (C249) and 0.499 MW (C499). To achieve annual electricity production at a level similar to that achieved under linear operation, the capacity available during peak periods was doubled by installing a second CHP unit with a capacity equal to that of the CHP unit operating in baseload mode [43]. For C249, the combined installed electrical capacity of the two CHP units was 0.498 MW, remaining below the 0.5 MW threshold and allowing the reference price of 1025 PLN/MWh for electricity generated from agricultural biogas in high-efficiency cogeneration to be applied, as specified in the Regulation of the Minister of Climate and Environment of 8 November 2023 on the reference price of electricity from renewable energy sources, the support periods applicable to generators who won auctions, and the reference volumes of electricity sales (item 2440). To apply the same reference price to C499, it was assumed that the additional CHP unit would be connected to a separate transformer station, providing each unit with a separate power export system [44]. Under this assumption, the two units were treated as separate RES installations, each with an installed electrical capacity of 0.499 MW.
The demand-driven operating concept was developed based on the Dynamic Biogas® technology developed by Dynamic Biogas Energy, a company based in Poznan in Poland. In this technology, biogas is stored under flexible membranes installed above the digestate storage tank. The storage capacity provided by this technology allows biogas to be stored for up to 12 h, assuming that hourly biogas production does not exceed 125 m3 for C249 and 250 m3 for C499. The storage fill level is monitored using an ultrasonic sensor, while continuous heat supply during shutdown periods is ensured by a hot-water thermal storage system.
The calculations used price data for 2025, a year characterized by a record number of hours with negative prices recorded on the DAM (Fixing I index) [44]. Due to the increasing frequency of negative prices on European electricity markets, this year was deemed appropriate for the analysis [45,46]. The complete set of price data used in the calculations is provided in Supplementary Materials File S1.
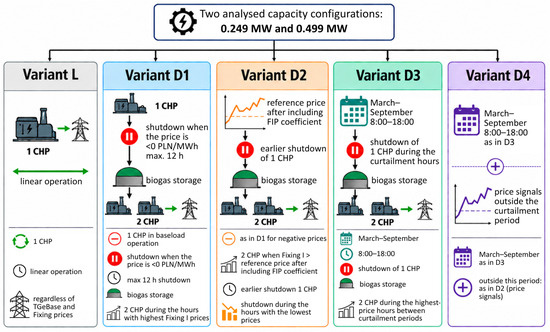
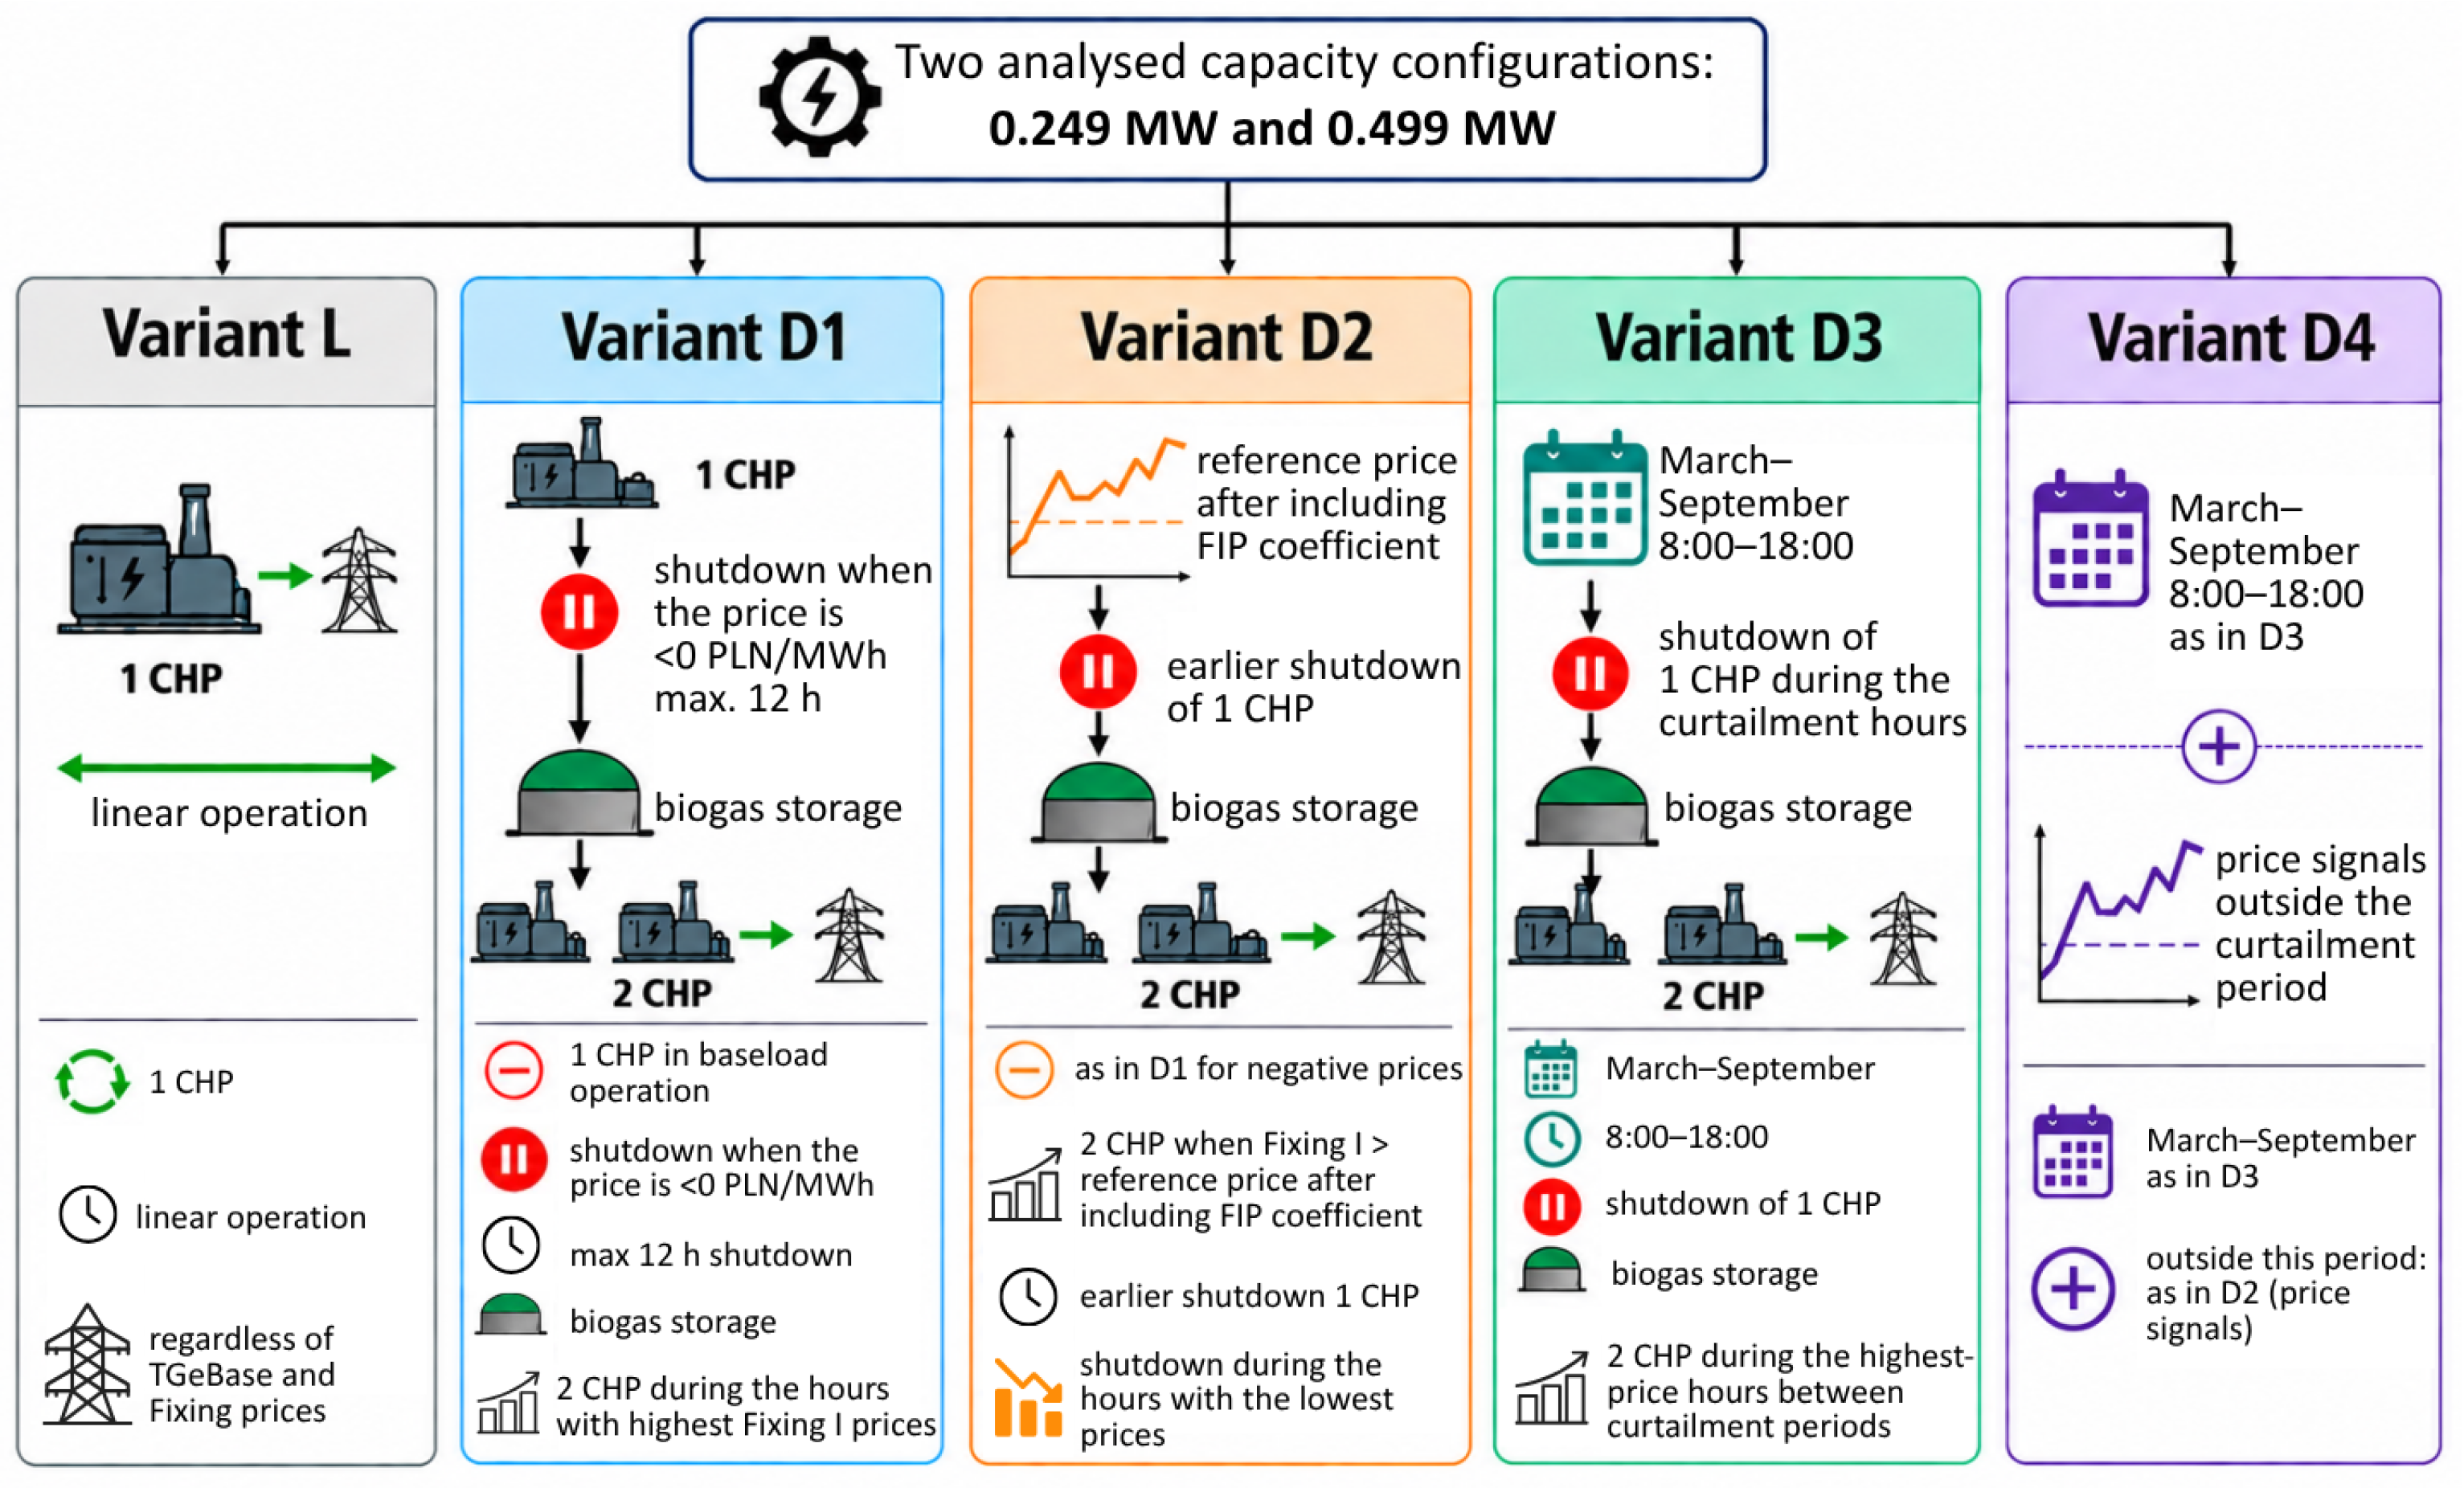
For each of the two capacity configurations, four demand-driven operational variants (D1–D4) and one linear operation variant (L) were analyzed. The variants differed in the method used to determine the operating schedule of the CHP units, as described below. The illustrative diagram of the analyzed operating variants was generated using ChatGPT-5.6 Sol and is presented in Figure 2. In Variant L, the CHP unit operates continuously, regardless of electricity prices on the TGeBase and Fixing I indices.
Figure 2.
Illustrative diagram of the analyzed operating variants.
- Variant D1. The biogas plant operates at a base capacity of 0.249 MW or 0.499 MW, using only one CHP unit. During hours when the electricity price on the TGeBase and/or Fixing I index falls below 0 PLN/MWh, the unit is shut down. Due to the assumed storage capacity, the total shutdown time cannot exceed 12 h. If the period of consecutive hours with negative prices is longer, the 12 h with the lowest prices are selected for shutdown. The biogas accumulated during the shutdown is then used to increase electricity production through the simultaneous operation of both units. The hours of increased production are selected from those with the highest recorded prices on Fixing I, occurring by the end of the following day. Once all stored biogas has been used, the additional CHP unit is shut down and the biogas plant returns to operation at nominal capacity;
- Variant D2. The rules for reducing production during hours with negative prices are analogous to those adopted in Variant D1. In addition, when the recorded Fixing I price exceeds the reference price after applying the FIP coefficient, the additional CHP unit is turned on. To accumulate the required amount of biogas before the period of increased production, the CHP unit is shut down. The number of shutdown hours corresponds to the number of hours during which operation at increased capacity is planned. The CHP unit is shut down during the hours with the lowest electricity prices occurring between the beginning of the previous day and the start of increased production;
- Variant D3. The CHP unit operating in the baseload mode is shut down according to the curtailment schedule from the recent act—from March to September between 08:00 and 18:00. The biogas accumulated during this shutdown period is subsequently used by both CHP units to generate electricity during ten hours with the highest forecast prices occurring between consecutive curtailment periods. During the remaining hours, the additional CHP unit remains shut down and the biogas plant operates at nominal capacity;
- Variant D4. From March to September, the CHP unit operating in the baseload mode is shut down according to the curtailment schedule, analogously to Variant D3. During the remaining months, operation of the CHP unit is determined based on price signals, according to the rules adopted in Variant D2.
The annual operating schedules for Variants D1–D4 for both capacity configurations are provided in Supplementary Materials File S2.
3.2. Energy Calculations
The analysis assumed that the biogas plant would operate using three substrates: cattle manure, cattle slurry, and chicken manure. The biogas yields and methane content for each substrate were based on studies by Pilarski et al. [47] and Dach [48], as shown in Table 1.
Table 1.
Physicochemical parameters of used substrates.
Energy calculations, including methane, electricity, and heat production, were performed using the methodology employed by Cieślik et al. [49] and Dach et al. [50] on the basis of which Equations (1)–(3) were formulated. The symbols used in the equations are explained in Table 2, while the values of the input parameters are listed in Table 3.
where i denotes the individual substrates in the substrate mixture.
Table 2.
Symbols and units used in Equations (1)–(3).
Table 3.
Input parameters used in the energy calculation.
The analysis assumes that the lower heating value of methane is 0.009968 MWh/m3 [51], while the electrical and thermal efficiencies of the CHP units are 40% and 45%, respectively. The annual biogas plant operational availability is determined by the time required for engine maintenance. According to information provided by the manufacturers, annual maintenance takes about 170 h, corresponding to nearly 2% of the year. Therefore, for C249-L and C499-L, 10 h maintenance shutdowns were assumed every 500 operating hours. For C249-D1–D4 and C499-D1–D4, maintenance was assumed to be carried out during scheduled shutdown periods; therefore, operational availability was assumed to be 100%. To assess whether the electricity consumed for the biogas plant’s own needs should be supplied from on-site generation or purchased from the grid, the cost of purchasing electricity was estimated and compared with the reference price after applying the FIP coefficient.
3.3. Economic Calculations
Based on the energy calculations and the determined operating schedules, the annual revenues of the biogas plant were calculated, including revenues from electricity sales, coverage of the negative balance, and the sale of Guarantees of Origin (GoO), in accordance with Equation (4). Since the assumed cost of purchasing electricity from the grid (744 PLN/MWh) was lower than the reference price after applying the FIP coefficient (973.75 PLN/MWh), it was assumed that the biogas plant’s own electricity consumption would be fully covered by electricity purchased from the grid and would not reduce the volume of electricity available for sale. The methodology used to determine the cost of electricity purchased from the grid is described at the end of this section. The symbols used in the equations are explained in Table 4, while the values of the input parameters are presented in Table 5.
Table 4.
Symbols and units used in Equations (4) and (5).
Table 5.
Input parameters for revenue calculation.
The individual revenue components were first calculated using the reference-year (2025) data as follows:
The reference-year values were indexed by the assumed inflation rate to determine the revenues for the first year of the economic analysis (2026). The resulting values were denoted as Rk,1. Revenues in the subsequent years were indexed as follows:
The reference price was adopted on the basis of the Regulation of the Minister of Climate and Environment of 8 November 2023. The value was then adjusted using the FIP coefficient to obtain the effective support level. Prices quoted on the Fixing I and TGeBase indices varied in accordance with the data presented in Supplementary Materials File S1.The operator distribution margin was adopted based on data from operating biogas plants constructed by Dynamic Biogas Energy company, while the GoO value was determined based on the average price recorded on the Polish Power Exchange (TGE) in 2025.
Revenues from the sale of digestate were not included in the analysis, as it was assumed that the digestate would be used directly by the farm that could potentially own the biogas plant or provided to nearby farmers in exchange for covering the costs of its transport and application to agricultural land. Revenues from heat sales were also excluded from the analysis, assuming that, after covering the biogas plant’s own heat consumption, any surplus heat would be used by the farm.
The resulting revenues were then reduced by operating costs (OPEX), determined as the sum of four cost categories and, where applicable, a one-off cost of a major overhaul of the CHP unit, in accordance with Equations (6)–(8). The symbols used in the equations are explained in Table 6, while the values of the input parameters are presented in Table 7.
OPEXt = Cm,t + Cs,t + Cx,t + Cl,t + Cr,t
Table 6.
Symbols and units used in Equations (6)–(8).
Table 7.
Input parameters for OPEX calculation.
The individual operating cost categories were first calculated using the reference-year (2025) data as follows:
The reference-year values were subsequently indexed to determine the operating costs for the first year of the economic analysis (2026). The resulting values were denoted as Ck,1 and Cl,1. Costs in the subsequent years were indexed as follows:
The major overhaul of the CHP engine was treated as a non-recurring operating expenditure occurring in a single year of the analysis period:
The analysis was carried out on a pre-tax basis, meaning that corporate income tax was excluded. Property tax remains part of the operating costs, as it is levied on the assets irrespective of the financial result of the installation.
Due to the wide availability of cattle manure and cattle slurry in Poland, these substrates were assumed to be available free of charge, while poultry manure was assumed to be purchased at a price of 50 PLN per tonne. The price of electricity purchased from the grid was based on the volume-weighted average price on the DAM in 2025, amounting to PLN 446.40/MWh. Taxes and other charges were assumed to account for nearly 40% of the final electricity price for industrial consumers in Poland [52]. Therefore, the volume-weighted average price was assumed to represent 60% of the actual electricity purchase cost, corresponding to 744 PLN/MWh.
It was also assumed that the biogas plant would be located on land owned by the farm; therefore, land purchase and lease costs were excluded from the analysis. Due to the lack of data from CHP unit manufacturers on the impact of demand-driven operation on maintenance costs, a conservative modeling assumption was adopted, increasing maintenance costs by 25% compared with the linear operation variant. This assumption accounts for the potential increase in wear of selected components resulting from the higher number of CHP unit start-up and shutdown cycles during flexible operation [53].
The capital expenditures (CAPEX) for C249-D1–D4 included, in addition to the basic biogas plant infrastructure, the costs of the additional CHP unit, biogas storage, heat storage, and the biogas storage fill-level sensor. For C499-D1–D4, the cost of an additional transformer station was also included.
3.4. Assessment of Economic Efficiency
Discounted methods accounting for the time value of money were used for the final assessment of economic efficiency [54,55]. Revenue and operating cost values determined based on 2025 data were adopted as reference values. These values were then indexed to determine revenues and costs for the first year (2026) of the 15-year analysis period, corresponding to the full support period under the FIP system. In the following years, revenues and operating costs, with the exception of labor costs, were indexed at an inflation rate of 2.5%, while labor costs were increased annually by 3.5%.
In addition, since the service life of the CHP unit specified by the manufacturers is approximately 70,000 operating hours, a major engine overhaul was included in the eighth year of operation, with a cost of PLN 430,000 for C249 and PLN 730,000 for C499. This cost was not included for C249-D1–D4 and C499-D1–D4, because the use of two CHP units allows alternating operation, so the total number of operating hours is distributed between both units. As a result, neither unit reaches the number of operating hours requiring a major overhaul within the adopted 15-year analysis period. The equations used in the analysis are presented as Equations (9)–(13), while the values of the input parameters are listed in Table 8.
where CFt is the net cash flow in year t [PLN], Rt is the annual revenue in year t [PLN] and OPEXt are the total operating costs in year t [PLN].
CFt = Rt − OPEXt
NPV = Σt = 1T [ CFt/(1 + r)t ] − CAPEX
Table 8.
Input parameters for the economic efficiency calculation.
The entire capital expenditure was assumed to be incurred in year 0 and was therefore not discounted. The residual value of the assets at the end of the analysis period was conservatively set to zero.
The discounted payback period was determined as the first year in which the cumulative discounted cash flow reaches the initial investment outlay, with the fractional part obtained by linear interpolation within that year:
n* = min { n : Σt = 1n [ CFt/(1 + r)t ] ≥ CAPEX }
DPBP = (n* − 1) + [ CAPEX − Σt = 1n* − 1 CFt/(1 + r)t ]/[ CFn*/(1 + r)n* ]
The internal rate of return was defined as the discount rate r* for which the net present value equals zero, determined numerically (MS Excel IRR function):
Σt = 1T [CFt/(1 + r*)t] − CAPEX = 0, IRR = r*
3.5. Comparison of Biogas Storage and Battery Energy Storage Systems
As part of the analysis, energy storage in the form of biogas was additionally compared with the storage of an equivalent amount of electrical energy in a BESS. The inclusion of BESS resulted from the dynamic development of this type of installation in Poland and their increasingly frequent identification as a key solution for power system stabilization [56,57,58]. The importance of BESS is further increased by the limited development potential of pumped-storage hydropower plants, the implementation of which depends on suitable geological and hydrological conditions [59]. These limitations have resulted in the installed capacity of pumped-storage hydropower plants in Poland remaining at a similar level for several years. Energy storage in the form of biogas can perform a function similar to that of BESS by temporarily shifting electricity generation from periods of low demand to periods when its generation is more desirable. However, the two solutions differ both in the form of stored energy and in their response time. In the case of BESS, the stored electrical energy can be made available almost instantaneously [60], whereas in demand-driven biogas plants, the time required to start the CHP unit and convert the stored biogas into electricity must be taken into account. Therefore, the comparison focused primarily on the ability of both solutions to shift energy availability over time rather than on their direct technological equivalence. For both analyzed capacity configurations, the amount of biogas that could be accumulated during the maximum 12 h shutdown period was determined, and the corresponding amount of electricity that could be generated from the stored biogas was then calculated according to Equation (14). This value was adopted as the equivalent energy capacity of the BESS. The investment expenditures required to implement demand-driven operation in the biogas plant were then compared with the expenditures required to purchase a BESS. The symbols used in the equation are presented in Table 9.
Table 9.
Symbols and units used in Equation (14).
4. Results and Discussion
Energy and Economic Performance of the Analyzed Variants
The energy calculations showed that the total annual mass of substrates required to supply the biogas plant amounted to 19,450 Mg for the 0.249 MW configuration and 39,000 Mg for the 0.499 MW configuration. The amounts of individual substrates were selected based on Dynamic Biogas® technology, in which the anaerobic digestion process is carried out at a maximum dry matter content of 16% in fermentation tank. Therefore, the substrate mass presented in Table 10 and Table 11 also included digestate recirculation, which was used to dilute the fermentation pulp. Substrate consumption and methane production in the C249 and C499 configurations were independent of the analyzed operating variant. Differences were observed in electricity and heat production, which were higher in the demand-driven variants due to the greater operational availability of the installations. The results in Table 10 and Table 11 are consistent with previous studies carried out by Spyridnidis et al. and Pochwatka et al. [13,61].
Table 10.
Methane, electricity, and heat production of the used substrates in C249.
Table 11.
Methane, electricity, and heat production of the used substrates in C499.
All economic results were expressed in Polish zloty (PLN). For reference, the average exchange rate as of 01/09/26 was 1 EUR = 4.3328 PLN according to the National Bank of Poland. Detailed results for the analyzed variants for both capacity configurations are presented in Table 12, Table 13, Table 14 and Table 15.
Table 12.
Annual revenue in the reference year for analyzed variants.
Table 13.
Detailed OPEX in the reference year for analyzed variants.
Table 14.
Annual net cash flow in the reference year for the analyzed variants.
Table 15.
Results of assessment of economic efficiency.
The reference-year net cash flows presented in Table 14 were calculated using Equation (9), as the difference between the total annual revenues reported in Table 12 and the total operating costs reported in Table 13.
Among all analyzed demand-driven operating variants, the highest annual revenue for the C249 configuration was obtained in Variant D4 and amounted to PLN 2.278 million. A similar result was observed for the C499 configuration, for which Variant D4 also generated the highest revenue, amounting to PLN 4.573 million. This result confirmed that the curtailment schedule predetermined by the recent act was well aligned with the DAM price profile, while the additional adjustment of electricity production to price signals outside the period covered by the schedule allowed the potential of demand-driven operation to be utilized more fully. The comparison of C249-D4 and C499-D4 with C249-L and C499-L further showed that demand-driven operation increased revenues from both electricity sales and coverage of the negative balance. The higher payment under the FIP system resulted mainly from changes in the settlement rules introduced by the Act of 27 November 2024 amending the Act on Renewable Energy Sources and certain other acts (item 1847). Under the new regulations, for installations that received FIP eligibility after 28 December 2024, electricity generated during hours with a negative TGeBase price is excluded from the volume eligible for covering the negative balance. In C249-D4 and C499-D4, electricity production was suspended during these hours, allowing a larger share of annual production to qualify for coverage of the negative balance. Ultimately, the increase in revenues exceeded the additional operating costs, and as a result, the annual cash flow in C249-D4 and C499-D4 was also higher than in the corresponding linear operation variants. Similar revenue effects were reported by Barchmann et al. [34], who showed that adjusting electricity production from biogas to changes in spot market prices can lead to higher revenues. However, in their study, demand-driven operation was achieved through flexible feeding, and the analysis excluded the investment costs required, among others, to expand CHP capacity.
The higher level of cash flow was also reflected in the NPVs. For C249-D4, NPV amounted to PLN 3.826 million compared with PLN 3.593 million for C249-L, while for C499-D4 it reached PLN 17.045 million compared with PLN 15.825 million for C499-L. At the same time, the higher investment expenditures required to implement demand-driven operation had an adverse effect on the payback period. For C249-D4, the DPBP was 9.93 years compared with 9.67 years for C249-L, while the corresponding IRR values were 12.87% and 13.42%. For the C499 configuration, the DPBP was 6.21 years for C499-D4 compared with 5.64 years for C499-L, with corresponding IRR values of 20.61% and 22.26%.
Although the difference in economic efficiency between the demand-driven and linear variants was smaller for the C249 configuration, the overall economic performance of the C499 installation was clearly more favorable, indicating that, under the adopted model assumptions, a larger plant scale supported better economic results. The impact of additional investment expenditures on the profitability of demand-driven operation was also analyzed by Lauer et al. [62], Lauven et al. [63], Hochloff et al. [35], and Saracevic et al. [19]. These studies indicated that the additional revenues obtained from selling electricity during periods of higher prices were insufficient to compensate for the additional costs and emphasized the need for support mechanisms dedicated to demand-driven operation.
Different results were reported by Pochwatka et al. [64], who demonstrated higher economic efficiency of demand-driven operation without the use of an additional support mechanism. The payback period obtained in their study was approximately 5 years for the demand-driven variant, compared with more than 8 years for the linear operation variant. The analyzed installation operated at a nominal capacity of 0.249 MW, while during periods of increased production its capacity increased to 0.499 MW, corresponding to the C249 configuration analyzed in the present study. It should be emphasized that this result was strongly influenced by the assumed selling price of the generated electricity. In the linear operation variant, a price of 166 EUR/MWh resulting from the FIT system was assumed, whereas in the demand-driven variant the assumed price was 269 EUR/MWh, corresponding to 1248.16 PLN/MWh at an exchange rate of 4.64 PLN/EUR. The assumed price reflected the exceptional market conditions in 2022, when very high prices were quoted on the DAM following the outbreak of the war in Ukraine. In the analyzed reference year, a price equal to or higher than 1248.16 PLN/MWh occurred only during 49 h.
The lack of additional remuneration for flexible production under the current support system in Poland was also identified by Łukomska et al. [44] as one of the main factors limiting the development of demand-driven biogas plants. It should be emphasized that their study concerned the conversion of an existing biogas plant from linear to demand-driven operation, which required additional investment in an already operating facility. In the present study, a new biogas plant is considered, with demand-driven operation incorporated already at the design stage in order to obtain grid connection conditions. Therefore, the less favorable DPBP and IRR values for Variant D4 in the C249 and C499 configurations do not indicate a lack of profitability. This is confirmed by the positive NPVs, IRRs of 12.87% and 20.61%, and DPBPs substantially shorter than the adopted 15-year analysis period.
Considering the importance of flexible biogas plant operation for the PPS, it nevertheless appears justified to reduce the difference in profitability between demand-driven and linear operation. One possible solution could be to increase the reference price for installations operating flexibly. The analysis showed that increasing the reference price to 1100 PLN/MWh would reduce the DPBP for C249-D4 to 8.74 years, while increasing the IRR to 14.71%, which would be higher than that obtained for C249-L. An analogous increase in the reference price for C499-D4 would reduce the DPBP to 5.61 years and increase the IRR to 22.68%, reaching a level similar to that obtained for the linear operation variant.
Another key solution could be to modify the rules used to determine the installed capacity of the biogas plant. In the C249 configuration, the lack of a need to construct an additional transformer station made the demand-driven variant more favorable relative to linear operation than in the C499 configuration, where such additional investment was required. An alternative instrument could be partial financial support for the infrastructure required to implement demand-driven operation, with part of the investment expenditure covered by external entities through grants or subsidies. Reducing the investment expenditure borne by the investor by PLN 240,000 for C249-D4 and PLN 1.4 million for C499-D4 would bring their discounted payback periods into line with those of the corresponding linear variants.
The need for support mechanisms promoting the development of demand-driven biogas plants is further justified by their ability to temporarily store energy in the form of biogas. Unlike BESS, energy is not stored directly as electricity, but as a gaseous fuel that can be used in a CHP unit at a selected time. This makes it possible to partially decouple the biological production of biogas from electricity generation and to shift electricity production from periods characterized by low demand or low electricity prices to hours when electricity has a higher market value.
A biogas plant equipped with sufficient storage capacity and increased installed CHP capacity can therefore perform some of the functions typically associated with BESS. However, it should be emphasized that biogas storage and electrochemical electricity storage differ in both technical and operational terms.
The importance of this feature was confirmed by Hahn et al. [22], who indicated that biogas storage enables its use for short-term balancing power generation. The authors also noted that solutions allowing electricity production to be temporarily suspended while biogas continues to be stored can provide negative balancing power, i.e., the ability to reduce generation during periods of electricity surplus. At the same time, the predictability of biogas production and the possibility of storing it represent an important advantage over non-dispatchable RESs, such as wind and photovoltaic power, whose instantaneous output is strongly dependent on weather conditions.
From an economic perspective, biogas storage may be particularly attractive for short-term shifting of electricity generation. Hahn et al. [65] showed that the additional costs of providing flexible biogas supply for a variant involving 8 h of biogas use per day amounted to approximately 2–11 EUR/MWh, depending on the plant configuration and size. For a much longer period of 72 h without biogas demand, the flexibility costs increased to approximately 9–19 EUR/MWh. The authors concluded that solutions based on biogas storage are particularly favorable for short-term flexibility, whereas for longer periods, approaches based on flexible control of biogas production itself may become more important.
The results obtained in the present analysis are consistent with this approach to the use of biogas storage. In the analyzed variants, the CHP unit was assumed to be shut down for a maximum of 12 h. The amount of biogas accumulated during this period subsequently allows approximately 3 MWh of electricity generation to be shifted in the C249 configuration and approximately 6 MWh in the C499 configuration. These values should be interpreted as the equivalent amount of electricity that can later be generated in the CHP unit from the stored biogas, rather than as the chemical energy content of the biogas itself.
With additional investment expenditures associated with the implementation of demand-driven operation amounting to PLN 1.78 million for C249 and PLN 3.30 million for C499, the specific investment cost per unit of equivalent storage capacity amounted to approximately 596 PLN/kWh and 550 PLN/kWh, respectively. The results also indicate a modest economy-of-scale effect, as the larger C499 configuration achieved a lower investment cost per unit of equivalent storage capacity.
BESS costs provide an interesting reference point in this context. According to a forecast by Clean Energy Associates [66], the average price of a 20-foot DC BESS container in the United States market in 2024 was expected to amount to approximately 148 USD/kWh, compared with approximately 180 USD/kWh in 2023. The value of 148 USD/kWh referred to a DC container based on lithium iron phosphate (LFP) cells, with a capacity of approximately 3.7 MWh and a discharge duration of 4 h, supplied from China.
Therefore, this value does not represent the full cost of a complete turnkey BESS, which would also include power conversion systems, other balance-of-system components, electrical infrastructure, system integration, and project implementation. Using the exchange rate adopted in this analysis, 1 USD = 3.75 PLN, the value of 148 USD/kWh corresponds to approximately 555 PLN/kWh. This level is very close to the specific investment costs obtained for the analyzed demand-driven biogas plants, i.e., 596 PLN/kWh for C249 and 550 PLN/kWh for C499.
The comparison indicates a similar order of magnitude of investment expenditure per unit of energy capacity for demand-driven biogas plants and BESS. However, differences in technical characteristics and the scope of included costs mean that these results should be interpreted only as an indicative CAPEX comparison, rather than as evidence of the relative economic competitiveness of the two technologies.
The technologies also differ in response time, round-trip efficiency, degradation characteristics, lifetime, operating costs, and the range of system services they can provide. Therefore, the presented comparison should be treated primarily as a comparison of investment expenditures per unit of capacity to shift electricity generation over time, rather than as a direct comparison of the total costs of the two technologies.
The literature nevertheless indicates that biogas storage can represent an economically competitive option for providing flexibility. Østergaard [67], comparing electricity, heat, and biogas storage in a system with a high share of RES, showed that electricity storage provided the greatest potential for increasing wind energy integration, but this effect was also associated with the highest costs among the analyzed storage technologies.
An even more direct comparison was presented by Diyono et al. [68] who compared systems using biogas as an energy buffer with battery-based solutions. In their analysis, configurations using biogas storage achieved an average LCOE of 0.42 USD/kWh, while configurations with BESS reached 0.53 USD/kWh, corresponding to an approximately 21% cost advantage for the biogas-based solution. The authors indicated that this difference resulted primarily from the possibility of using existing biogas infrastructure and the need to incur only additional expenditures associated with gas storage, whereas BESS require a dedicated electrochemical storage unit and additional balance-of-system components.
The results obtained therefore indicate that the economic justification for developing demand-driven biogas plants should not be assessed solely on the basis of the direct increase in revenues resulting from electricity sales during higher-price periods. Part of the additional investment expenditure can be interpreted as the cost of simultaneously obtaining energy storage capability and flexible generation capacity, both of which have value for the power system. From this perspective, mechanisms that reward not only renewable energy production itself, but also dispatchability, flexibility, and the ability to shift electricity generation over time, may constitute a justified complement to the existing support systems for agricultural biogas plants.
5. Conclusions
The analysis showed that demand-driven biogas plants can be economically justified under the current Polish regulatory framework. Variant D4, combining the predetermined curtailment schedule from March to September with price-responsive operation during the remaining months, achieved the best economic results among the demand-driven variants. Its NPV, IRR, and DPBP were PLN 3.826 million, 12.87%, and 9.93 years for C249, and PLN 17.045 million, 20.61%, and 6.21 years for C499, respectively.
Compared with linear operation, demand-driven biogas plants in variant D4 achieved higher NPV but a lower IRR and a longer DPBP due to higher investment requirements and lack of mechanisms rewarding production flexibility. These differences were more pronounced for C499, which required an additional transformer station. Consequently, demand-driven operation may support new biogas investments in areas with limited grid connection capacity, although it does not increase the profitability of biogas plants compared with linear operation.
Further development of demand-driven biogas plants therefore requires mechanisms that more fully account for their value to the power system and mitigate the economic impact of additional investment expenditures. Under the adopted assumptions, either increasing the reference price from 1025 to approximately 1100 PLN/MWh or providing infrastructure subsidies of PLN 240,000 for C249-D4 and PLN 1.4 million for C499-D4 could bring their economic performance closer or even higher to that of the corresponding linear variants.
An indicative comparison showed similar expenditure per unit of energy capacity for the additional infrastructure required for demand-driven operation and DC BESS container. However, differences between the technologies and the cost assumptions limit this finding to an indicative CAPEX comparison and prevent a direct assessment of their relative economic competitiveness.
Supplementary Materials
The following supporting information can be downloaded at: https://www.mdpi.com/article/10.3390/en19194654/s1, Supplementary S1: Hourly electricity prices for the Fixing I and TGeBase indices in 2025 used in the calculations as Excile file; Supplementary S2: Annual operating schedules for Variants D1–D4 for the C249 and C499 capacity configurations as Excile file.
Author Contributions
Conceptualization, A.Ł. and J.D.; methodology, A.Ł., J.D. and K.K.; software, A.Ł. and K.W.; validation, A.Ł., K.W. and J.D.; formal analysis, A.Ł. and J.D.; investigation, A.Ł., K.W. and J.D.; resources, A.Ł. and K.W.; data curation, A.Ł. and K.W.; writing—original draft preparation, A.Ł. and K.K.; writing—review and editing, K.W. and J.D.; visualization, A.Ł.; supervision, K.W. and J.D.; project administration, A.Ł. and K.W.; funding acquisition, A.Ł. All authors have read and agreed to the published version of the manuscript.
Funding
This research was funded by the Polish Ministry of Education and Science as part of the 6th edition of the Implementation Doctorate program DWD/6/0199/2022. Meanwhile, the publication was financed by the Polish Minister of Science and Higher Education as part of the Strategy of the Poznan University of Life Sciences for 2024–2026 in the field of improving scientific research and development work in priority research areas.
Data Availability Statement
The quotations from the Polish Power Exchange used in the analysis are publicly available at https://tge.pl/electricity-dam (accessed on 6 September 2026). However, archived data are available on the website only for the preceding three months. Therefore, all quotations used in this study are provided in Supplementary Materials File S1.
Acknowledgments
During the preparation of this study, the authors used ChatGPT-5.6 Sol for the purpose of generating Figure 2. The prompt used was: “Create a clean, publication-ready scientific flowchart summarizing five operating variants of a biogas plant for two analyzed capacity configurations: 0.249 MW and 0.499 MW. The figure should be suitable for a peer-reviewed energy engineering journal. Present five operating variants: L, D1, D2, D3 and D4. Variant L: linear operation of one CHP unit at nominal capacity, regardless of electricity prices. Variant D1: operate one CHP unit at baseload; shut it down when the electricity price on the TGeBase and/or Fixing I index falls below 0 PLN/MWh, with a maximum shutdown period of 12 h; store the biogas during shut-down and subsequently use it for simultaneous operation of two CHP units during the hours with the highest recorded Fixing I prices. Variant D2: apply the same negative-price rule as in D1 and additionally operate two CHP units when the recorded Fixing I price exceeds the refer-ence price after application of the FIP coefficient; accumulate the required biogas beforehand by shutting down one CHP unit during the hours with the lowest electricity prices. Variant D3: from March to September, shut down one CHP unit between 08:00 and 18:00 according to the curtailment schedule; store the biogas and subsequently operate two CHP units during ten hours with the highest recorded electricity prices between consecutive curtailment periods. Variant D4: from March to September apply the D3 curtailment strategy and during the remaining months apply the price-based strategy described for D2. Use a clear visual hierarchy, separate colourcoded panels for each variant, simple CHP, biogas storage, electricity grid, calendar and price-chart icons, arrows indicating energy and biogas flows, and minimal text suitable for a scientific publication.” The authors have reviewed and edited the output and take full responsibility for the content of this publication. The authors would like to also express their sincere gratitude to the Dynamic Biogas Energy company for providing operational data from the biogas plants constructed by the company.
Conflicts of Interest
Aleksandra Łukomska is employed by the Dynamic Biogas Energy company. The remaining authors declare that the research was conducted in the absence of any commercial or financial relationships that could be construed as a potential conflict of interest.
Abbreviations
The following abbreviations are used in this manuscript:
| FIP | Feed-in Premium |
| NPV | Net Present Value |
| IRR | Internal Rate of Return |
| DPBP | Discounted Payback Period |
| BESS | Battery Energy Storage System |
| RESs | Renewable Energy Sources |
| PPS | Polish Power System |
| CHP | Combined Heat and Power |
| FIT | Feed-in Tariff |
| DAM | Day-Ahead Market |
| GoO | Guarantee of Origin |
| TGE | Polish Power Exchange |
References
- Pilarski, K.; Pilarska, A.A.; Dach, J. Biogas as Renewable Energy Source: A Brief Overview. J. Ecol. Eng. 2025, 26, 408–416. [Google Scholar] [CrossRef] [Scilit]
- Mauky, E.; Weinrich, S.; Jacobi, H.-F.; Nägele, H.-J.; Liebetrau, J.; Nelles, M. Demand-Driven Biogas Production by Flexible Feeding in Full-Scale—Process Stability and Flexibility Potentials. Anaerobe 2017, 46, 86–95. [Google Scholar] [CrossRef] [Scilit] [PubMed]
- Mertins, A.; Wawer, T. How to use biogas?: A systematic review of biogas utilization pathways and business models. Bioresour. Bioprocess. 2022, 9, 59. [Google Scholar] [CrossRef] [Scilit] [PubMed]
- Sławczyk, D. Modern technologies in biogas plants—Practical applications and analysis of development prospects in the Polish context. Instal 2025, 12, 22–27. (In Polish) [Google Scholar] [CrossRef]
- Narloch, P.; Skrzyński, T. Towards enhancing Poland’s energy security. The use of biomethane, biogas and hydrogen in the Polish gas industry. Current situation and prospects for the future (systematic review). Zesz. Nauk. SGSP 2026, 98, 23–39. [Google Scholar] [CrossRef] [Scilit]
- European Biogas Association. Biomethane Map 2026. Available online: https://www.europeanbiogas.eu/publication/european-biomethane-map-2026/ (accessed on 4 September 2026).
- National Support Centre for Agriculture. Register of Agricultural Biogas Producers. Available online: https://www.gov.pl/web/kowr/rejestr-wytworcow-biogazu-rolniczego (accessed on 4 September 2026). (In Polish)
- Agency for Restructuring and Modernization of Agriculture. Report on the Activities of the Agency for Restructuring and Modernization of Agriculture for 2025. Available online: https://www.gov.pl/web/arimr/sprawozdania-z-dzialalnosci-agencji-restrukturyzacji-i-modernizacji-rolnictwa (accessed on 4 September 2026). (In Polish)
- Kochanek, A.; Ciuła, J.; Cembruch-Nowakowski, M.; Zacłona, T. Polish Farmers′ Perceptions of the Benefits and Risks of Investing in Biogas Plants and the Role of GISs in Site Selection. Energies 2025, 18, 3981. [Google Scholar] [CrossRef] [Scilit]
- National Support Centre for Agriculture. Data on the Current Situation in the Agricultural Biogas Market in Poland. Available online: https://www.energiazrolnictwa.pl/dane-dotyczace-aktualnej-sytuacji-na-rynku-biogazu-rolniczego-w-polsce/ (accessed on 4 September 2026). (In Polish)
- Bednarek, A.; Klepacka, A.; Siudek, A. Development Barriers of Agricultural Biogas Plants in Poland. Econ. Environ. 2023, 84, 229–258. [Google Scholar] [CrossRef] [Scilit]
- Ślusarz, G.; Gołębiewska, B.; Cierpiał-Wolan, M.; Gołębiewski, J.; Twaróg, D.; Wójcik, S. Regional Diversification of Potential, Production and Efficiency of Use of Biogas and Biomass in Poland. Energies 2021, 14, 742. [Google Scholar] [CrossRef] [Scilit]
- Pochwatka, P.; Kowalczyk-Juśko, A.; Sołowiej, P.; Wawrzyniak, A.; Dach, J. Biogas Plant Exploitation in a Middle-Sized Dairy Farm in Poland: Energetic and Economic Aspects. Energies 2020, 13, 6058. [Google Scholar] [CrossRef] [Scilit]
- Igliński, B.; Piechota, G.; Iwański, P.; Skarzatek, M.; Pilarski, G. 15 Years of the Polish agricultural biogas plants: Their history, current status, biogas potential and perspectives. Clean Technol. Environ. Policy 2020, 22, 281–307. [Google Scholar] [CrossRef] [Scilit]
- Łukomska, A.; Pulka, J.; Broński, M.; Dach, J. Demand-Driven Biogas Plants in Poland—Potential and Growth Perspectives. J. Ecol. Eng. 2024, 25, 236–248. [Google Scholar] [CrossRef] [Scilit] [PubMed]
- Polskie Sieci Elektroenergetyczne. Report on the Operation of the Polish Power System in 2025. Available online: https://www.pse.pl/dane-systemowe/funkcjonowanie-kse/raporty-roczne-z-funkcjonowania-kse-za-rok/raporty-za-rok-2025? (accessed on 22 April 2026). (In Polish)
- Wyrwa, A.; Pluta, M.; Wyrwa, E.; Raczyński, M. A simulation-based approach for assessing long-term curtailment levels in variable renewable sources in Poland. Polityka Energ.—Energy Policy J. 2025, 28, 5–20. [Google Scholar] [CrossRef] [Scilit]
- Sobik, B. Energy Security—The Case of Polish National Power System Facing Energy Transition’s Challenges. Energy Policy Stud. 2022, 10, 15–26. [Google Scholar] [CrossRef] [Scilit]
- Saracevic, E.; Theuretzbacher, F.; Woess, D.; Friedl, A.; Miltner, A. Economic and Technical Evaluation of Flexible Power Generation Scenarios for a Biogas Plant. J. Sustain. Dev. Energy Water Environ. Syst. 2020, 8, 328–343. [Google Scholar] [CrossRef] [Scilit]
- Heiker, M.; Kraume, M.; Mertins, A.; Wawer, T.; Rosenberger, S. Biogas Plants in Renewable Energy Systems—A Systematic Review of Modeling Approaches of Biogas Production. Appl. Sci. 2021, 11, 3361. [Google Scholar] [CrossRef] [Scilit]
- Szarka, N.; Scholwin, F.; Trommler, M.; Fabian Jacobi, H.; Eichhorn, M.; Ortwein, A.; Thrän, D. A Novel Role for Bioenergy: A Flexible, Demand-Oriented Power Supply. Energy 2013, 61, 18–26. [Google Scholar] [CrossRef] [Scilit]
- Hahn, H.; Krautkremer, B.; Hartmann, K.; Wachendorf, M. Review of Concepts for a Demand-Driven Biogas Supply for Flexible Power Generation. Renew. Sustain. Energy Rev. 2014, 29, 383–393. [Google Scholar] [CrossRef] [Scilit]
- Ishikawa, S.; O’Connell, N.; Lechner, R.; Hara, R.; Kita, H.; Brautsch, M. Load Response of Biogas CHP Systems in a Power Grid. Renew. Energy 2021, 170, 12–26. [Google Scholar] [CrossRef] [Scilit]
- Santra, S.B.; Ogungbe, B.T. A Cogeneration Scheme with Biogas and Improvement of Frequency Stability Using Inertia Based Control in AC Microgrid. Int. J. Emerg. Electr. Power Syst. 2021, 22, 675–691. [Google Scholar] [CrossRef] [Scilit]
- Skibko, Z.; Butkiewicz, M.; Borusiewicz, A.; Kuboń, M. The Effect of Biogas Generation and Fermenter Mixer Operation on Power Quality in a Local Power System. Energies 2026, 19, 3235. [Google Scholar] [CrossRef] [Scilit]
- Genstwa, N.; Zmyślona, J. Greenhouse Gas Emissions Efficiency in Polish Agriculture. Agriculture 2024, 14, 56. [Google Scholar] [CrossRef] [Scilit]
- Kowalczyk-Juśko, A.; Pochwatka, P.; Mazur, A. The Potential of Biogas from Animal Manure—The Role of Biogas Plants in Reducing Emissions from Polish Agriculture. Ecol. Eng. Environ. Technol. 2025, 26, 352–361. [Google Scholar] [CrossRef] [Scilit]
- Maruejols, L.; Höschle, L.; Yu, X. Energy independence, rural sustainability and potential of bioenergy villages in Germany: Machine learning perspectives. Int. Food Agribus. Manag. Rev. 2025, 28, 263–295. [Google Scholar] [CrossRef] [Scilit]
- Yang, X.; Liu, Y.; Thrän, D.; Bezama, A.; Wang, M. Effects of the German Renewable Energy Sources Act and Environmental, Social and Economic Factors on Biogas Plant Adoption and Agricultural Land Use Change. Energy Sustain. Soc. 2021, 11, 6. [Google Scholar] [CrossRef] [Scilit]
- Bartolini, F.; Gava, O.; Brunori, G. Biogas and EU’s 2020 Targets: Evidence from a Regional Case Study in Italy. Energy Policy 2017, 109, 510–519. [Google Scholar] [CrossRef] [Scilit]
- Kowalczyk-Juśko, A.; Pochwatka, P.; Mazurkiewicz, J.; Pulka, J.; Kępowicz, B.; Janczak, D.; Dach, J. Reduction of Greenhouse Gas Emissions by Replacing Fertilizers with Digestate. J. Ecol. Eng. 2023, 24, 312–319. [Google Scholar] [CrossRef] [Scilit] [PubMed]
- Nowak, M.; Czekała, W. Sustainable Use of Digestate from Biogas Plants: Separation of Raw Digestate and Liquid Fraction Processing. Sustainability 2024, 16, 5461. [Google Scholar] [CrossRef] [Scilit]
- Łukomska, A.; Witaszek, K.; Dach, J. Current State of Development of Demand-Driven Biogas Plants in Poland. Processes 2025, 13, 2369. [Google Scholar] [CrossRef] [Scilit]
- Barchmann, T.; Mauky, E.; Dotzauer, M.; Stur, M.; Weinrich, S.; Jacobi, H.F.; Liebetrau, J.; Nelles, M. Expanding the Flexibility of Biogas Plants—Substrate Management, Schedule synthesis and Economic Assessment. Landtechnik 2016, 71, 233–251. [Google Scholar] [CrossRef]
- Hochloff, P.; Braun, M. Optimizing Biogas Plants with Excess Power Unit and Storage Capacity in Electricity and Control Reserve Markets. Biomass Bioenergy 2014, 65, 125–135. [Google Scholar] [CrossRef] [Scilit]
- Scheftelowitz, M.; Becker, R.; Thrän, D. Improved Power Provision from Biomass: A Retrospective on the Impacts of German Energy Policy. Biomass Bioenergy 2018, 111, 1–12. [Google Scholar] [CrossRef] [Scilit]
- Park, H.; Grundmann, P. Institutional Work after Hype: The Case of Biogas in Germany. Energy Res. Soc. Sci. 2025, 119, 103820. [Google Scholar] [CrossRef] [Scilit]
- Schröer, D.; Latacz-Lohmann, U. Flexibilization or Biomethane Upgrading? Investment Preference of German Biogas Plant Operators for the Follow-up of Guaranteed Feed-in Tariffs. GCB Bioenergy 2024, 16, e13111. [Google Scholar] [CrossRef] [Scilit]
- Ishikawa, S.; O’Connell, N.; Lechner, R. Optimizing Biogas-to-Hydrogen Conversion Under the Feed-In Premium Scheme: A Comparative Analysis of Steam Reforming and Electrolysis in an Individual Biogas Plant. Energies 2026, 19, 1119. [Google Scholar] [CrossRef] [Scilit]
- Herbes, C.; Apfel, D. How Flexible Is the German Biogas Sector? Stakeholder Acceptance of Flexible Feeding Options to Support Better System Integration. Energy Policy 2025, 206, 114795. [Google Scholar] [CrossRef] [Scilit]
- Purkus, A.; Gawel, E.; Szarka, N.; Lauer, M.; Lenz, V.; Ortwein, A.; Tafarte, P.; Eichhorn, M.; Thrän, D. Contributions of Flexible Power Generation from Biomass to a Secure and Cost-Effective Electricity Supply—A Review of Potentials, Incentives and Obstacles in Germany. Energy Sustain. Soc. 2018, 8, 18. [Google Scholar] [CrossRef] [Scilit]
- Trupkiewicz, M. Commentary on Article 70a of the Act on Renewable Energy Sources [Sale of Unused Electricity Generated in a Renewable Energy Installation with a Capacity Below 500 kW and with a Capacity of at Least 500 kW but Not Exceeding 1 MW]. In Renewable Energy Sources. Capacity Market. Investments in Wind Power Plants. Promotion of Energy from High-Efficiency Cogeneration and Offshore Wind Farms; C.H. Beck Publishing House: Munich, Germany, 2023; Volume 2, pp. 228–242. (In Polish) [Google Scholar]
- Mauky, E.; Jacobi, H.F.; Liebetrau, J.; Nelles, M. Flexible Biogas Production for Demand-Driven Energy Supply—Feeding Strategies and Types of Substrates. Bioresour. Technol. 2015, 178, 262–269. [Google Scholar] [CrossRef] [Scilit] [PubMed]
- Łukomska, A.; Witaszek, K.; Dach, J.; Dudnyk, A.; Kharchenko, Y.; Batsiun, Y.; Trupkiewicz, M.; Kosiński, E. Analysis of Demand-Driven Operation in an Existing Biogas Plant Under Polish Electricity Market Conditions. Energies 2026, 19, 3119. [Google Scholar] [CrossRef] [Scilit]
- International Energy Agency. Electricity 2025: Analysis and Forecast to 2027. Available online: https://www.iea.org/reports/electricity-2025/ (accessed on 4 September 2026).
- Davi-Arderius, D.; Jamasb, T. Measuring a paradox: Zero-negative electricity prices. Util. Policy 2026, 98, 102108. [Google Scholar] [CrossRef] [Scilit]
- Pilarski, K.; Pilarska, A.A.; Warszewska, A.; Pietrzak, M. Economic Balance and Investment Profitabilty of the Case-Study Agricultural Biogas Plant (0.499 MW) in Poland. Econ. Environ. 2025, 94, 1131. [Google Scholar] [CrossRef] [Scilit]
- Dach, J. Energetic and Economic Efficiency of Agricultural Biogas Plant Working with Different Substrates. J. Res. Appl. Agric. Eng. 2016, 61, 72–76. [Google Scholar]
- Cieślik, M.; Dach, J.; Lewicki, A.; Smurzyńska, A.; Janczak, D.; Pawlicka-Kaczorowska, J.; Boniecki, P.; Cyplik, P.; Czekała, W.; Jóźwiakowski, K. Methane Fermentation of the Maize Straw Silage under Meso- and Thermophilic Conditions. Energy 2016, 115, 1495–1502. [Google Scholar] [CrossRef] [Scilit]
- Dach, J.; Boniecki, P.; Przybył, J.; Janczak, D.; Lewicki, A.; Czekała, W.; Witaszek, K.; Rodríguez Carmona, P.C.; Cieślik, M. Energetic Efficiency Analysis of the Agricultural Biogas Plant in 250 KWe Experimental Installation. Energy 2014, 69, 34–38. [Google Scholar] [CrossRef] [Scilit]
- Dach, J.; Pulka, J.; Janczak, D.; Lewicki, A.; Pochwatka, P.; Oniszczuk, T. Energetic Assessment of Biogas Plant Projects Based on Biowaste and Maize Silage Usage. IOP Conf. Ser. Earth Environ. Sci. 2020, 505, 012029. [Google Scholar] [CrossRef] [Scilit]
- Forum Energii. The Anatomy of High Energy Prices and the Recipe for the Future. Available online: https://www.forum-energii.eu/anatomia-wysokich-cen-energii-i-recepta-na-przyszlosc (accessed on 4 September 2026). (In Polish)
- Butemann, H.; Schimmelpfeng, K. Long-Term Electricity Production Planning of a Flexible Biogas Plant Considering Wear and Tear. J. Bus. Econ. 2020, 90, 1289–1313. [Google Scholar] [CrossRef] [Scilit]
- Kusz, D.; Nowakowski, T.; Kusz, B. The Capacity of Power of Biogas Plants and Their Technical Efficiency: A Case Study of Poland. Energies 2024, 17, 6256. [Google Scholar] [CrossRef] [Scilit]
- Klimek, K.; Kapłan, M.; Syrotyuk, S.; Bakach, N.; Kapustin, N.; Konieczny, R.; Dobrzyński, J.; Borek, K.; Anders, D.; Dybek, B.; et al. Investment Model of Agricultural Biogas Plants for Individual Farms in Poland. Energies 2021, 14, 7375. [Google Scholar] [CrossRef] [Scilit]
- Świrski, K.; Błach, P. Energy storage facilities are changing the energy system and already within a year they can become fully profitable in Poland. J. Power Technol. 2024, 104, 156–161. [Google Scholar]
- Bogacki, M.; Myślińska, K. Techno-Economic Analysis and Profitability Thresholds of Large-Scale Hybrid PV-Battery Storage Systems in Poland. Energies 2026, 19, 4005. [Google Scholar] [CrossRef] [Scilit]
- Sakib, S.; Hossain, M.B.; Zamee, M.A.; Hossain, M.J.; Habib, M.A. Role of battery energy storage systems: A comprehensive review on renewable energy zones integration in weak transmission networks. J. Energy Storage 2025, 128, 117223. [Google Scholar] [CrossRef] [Scilit]
- Kałuża, T.; Hämmerling, M.; Zawadzki, P.; Czekała, W.; Kasperek, R.; Sojka, M.; Mokwa, M.; Ptak, M.; Szkudlarek, A.; Czechlowski, M.; et al. The Hydropower Sector in Poland: Barriers and the Outlook for the Future. Renew. Sustain. Energy Rev. 2022, 163, 112500. [Google Scholar] [CrossRef] [Scilit]
- Safarzadeh, H.; Jahanbakhshi, M.; Di Maria, F.; Javani, N. Battery Energy Storage Systems in Power Systems: A Comprehensive Systematic Review of Technologies, Applications, and Challenges. Int. J. Energy Res. 2026, 2026. [Google Scholar] [CrossRef] [Scilit]
- Spyridonidis, A.; Vasiliadou, I.A.; Akratos, C.S.; Stamatelatou, Κ. Performance of a Full-Scale Biogas Plant Operation in Greece and Its Impact on the Circular Economy. Water 2020, 12, 3074. [Google Scholar] [CrossRef] [Scilit]
- Lauer, M.; Thrän, D. Flexible Biogas in Future Energy Systems—Sleeping Beauty for a Cheaper Power Generation. Energies 2018, 11, 761. [Google Scholar] [CrossRef] [Scilit]
- Lauven, L.-P.; Geldermann, J.; Desideri, U. Estimating the Revenue Potential of Flexible Biogas Plants in the Power Sector. Energy Policy 2019, 128, 402–410. [Google Scholar] [CrossRef] [Scilit]
- Pochwatka, P.; Rozakis, S.; Kowalczyk-Juśko, A.; Czekała, W.; Qiao, W.; Nägele, H.-J.; Janczak, D.; Mazurkiewicz, J.; Mazur, A.; Dach, J. The Energetic and Economic Analysis of Demand-Driven Biogas Plant Investment Possibility in Dairy Farm. Energy 2023, 283, 129165. [Google Scholar] [CrossRef] [Scilit]
- Hahn, H.; Ganagin, W.; Hartmann, K.; Wachendorf, M. Cost Analysis of Concepts for a Demand Oriented Biogas Supply for Flexible Power Generation. Bioresour. Technol. 2014, 170, 211–220. [Google Scholar] [CrossRef] [Scilit] [PubMed]
- Clean Energy Associates BESS Prices in US Market. Available online: https://www.energy-storage.news/bess-prices-in-us-market-to-fall-a-further-18-in-2024-says-cea/ (accessed on 24 September 2026).
- Østergaard, P.A. Comparing Electricity, Heat and Biogas Storages’ Impacts on Renewable Energy Integration. Energy 2012, 37, 255–262. [Google Scholar] [CrossRef] [Scilit]
- Diyono, D.; Onwuanaku, V.; Cappon, H.; Kujawa-Roeleveld, K.; Keesman, K.J. Optimized Design of a Hybrid Renewable Energy System with Biogas Energy Storage for Sustainable Rural Electrification: A Case Study in Sempu, East Java, Indonesia. Energy Rep. 2026, 15, 109288. [Google Scholar] [CrossRef] [Scilit]

Disclaimer/Publisher’s Note: The statements, opinions and data contained in all publications are solely those of the individual author(s) and contributor(s) and not of MDPI and/or the editor(s). MDPI and/or the editor(s) disclaim responsibility for any injury to people or property resulting from any ideas, methods, instructions or products referred to in the content. |
© 2026 by the authors. Licensee MDPI, Basel, Switzerland. This article is an open access article distributed under the terms and conditions of the Creative Commons Attribution (CC BY) license.