Article

Optimizing Urban and Industrial Vertical-Axis Wind Energy Systems: Aerodynamic Performance and Structural Reliability of a Darrieus H-Rotor Wind Turbine

1
MaSEEL, FST of Tangier, Abdelmalek Essaâdi University, Tangier 90000, Morocco
2
Laboratory of Systems, Control, and Decision (LSCD), School of New Sciences and Engineering (ENSI), Tangier 90000, Morocco
*
Author to whom correspondence should be addressed.
Energies 2026, 19(17), 4035; https://doi.org/10.3390/en19174035
Submission received: 15 June 2026 / Revised: 18 July 2026 / Accepted: 25 July 2026 / Published: 28 August 2026
(This article belongs to the Section A3: Wind, Wave and Tidal Energy)

Abstract

This paper aims to design and optimize a new type of Darrieus H-Rotor VAWT, specifically adapted to the conditions of urban and industrial environments, as a contribution to energy transition and the search for new sustainable solutions for decentralized electricity generation. It is designed to be a strong and efficient wind turbine capable of providing a nominal power of 2 kW at low and moderate wind speed. The methodology used is based on the analysis of wind resources (wind rose, Weibull distribution) and aerodynamic modelling using QBlade. The structural analysis with CATIA showed that the configuration of the third case (with 4 mm blade thickness and four supports of 2 mm) was an excellent compromise, with a reduced mass (13 kg) and a controlled maximum stress (0.854 MPa), far below the elastic limit of aluminum. From an aerodynamic point of view, CFD simulations in ANSYS Fluent 2023 R1 (k-ω SST model in transient regime) allowed us to visualize flow fields, pressure distribution and torque evolution. The results obtained showed a power coefficient (Cp) very close to 0.4, validating the configuration. This proves the chosen configuration to be effective. In this work, a suitable wind blade has been optimized with a strong and aerodynamically efficient design for operation in urban areas.

1. Introduction

Wind energy is now firmly established as one of the most reliable ways to decarbonize global electricity generation and its rapid growth since the early 2000s is indicative of a technological maturation that continues to gain momentum around the world. Wind turbines are broadly divided into horizontal axis wind turbines (HAWTs) and vertical axis wind turbines (VAWTs). Each type has different aerodynamic characteristics and is used in different settings. This feature makes them very appropriate for the production of electricity in large open grounds. However, in urban and semi-urban areas, where the wind is turbulent and changes its direction, the aerodynamic and manufacturing as well as maintenance capabilities of HAWTs are becoming more and more limited [1]. This conclusion was further confirmed by Bošnjaković et al. [2] in their review for 2025, who confirmed the decisive practical advantages of VAWTs in such settings, including omnidirectional wind capture without a yaw mechanism, lower noise emissions, ground-level drivetrain placement, and better architectural compatibility with the built environment. The Darrieus H-Rotor, in particular, is an increasingly attractive candidate for decentralized urban energy generation, given its lift-driven operating principle and broad scope for systematic performance optimization.
Over the past decade, computational fluid dynamics has fundamentally transformed Darrieus VAWT [3] research by enabling the resolution of complex unsteady aerodynamic phenomena that earlier analytical models could not capture, and studies have consequently concentrated on blade geometry, rotor solidity, tip speed ratio, dynamic stability, and self-starting capability. Fertahi et al. [4] mapped this evolution through a thorough review spanning 2014 to 2024, while Rezaeiha et al. [5] conducted a rigorous systematic CFD investigation showing that across solidities from 0.09 to 0.36 and 2-, 3-, and 4-bladed configurations, the power coefficient within the optimal operating regime is largely insensitive to blade count and derived a practical empirical correlation between optimal tip speed ratio and solidity. Michna and Rogowski [6] investigated the aerodynamic performance and flow phenomena of an H-type Darrieus VAWT using hybrid numerical and experimental approaches with a 2D URANS Transition SST model, showing that the variation in the angle of attack along the blade rotation cycle and its interaction with rotor solidity and pitch angle are the governing aerodynamic mechanisms determining turbine efficiency under low-speed turbulent urban conditions. Didane et al. [7] studied a contra-rotating architecture where the rotor is split into two counter-rotating sections on the same axis, which leads to more than double torque output and maximum efficiency of 40% and simultaneously improved self-starting behavior. In the context of passive flow augmentation, Qasemi and Azadani [8] optimized the geometry and position of a flat plate deflector placed upstream of the rotor by means of the Taguchi L16 method, achieving a gain in power coefficient of 16.42% by reducing the negative torque on the returning blades. Wong et al. [9] extended this line of work to fixed guiding-wall structures and reported torque coefficient increases up to 47.10%, but emphasized the crucial sensitivity of such devices to their placement. Following this trend, Ansaf et al. [10] carried out a design optimization of an H-type Darrieus VAWT with fixed guiding walls, based on metamodeling. The Kriging surrogate modelling was applied on a Design of Experiments sampling space and the Nelder–Mead downhill simplex technique was adopted to find the optimal wall geometry. The power coefficient was improved by a remarkable value of up to 177% at λ = 3, which is one of the highest augmentation values reported in literature for the passive flow control devices. Sanaye and Farvizi [11] further demonstrated the power of combined 3D CFD and Taguchi-based optimization by applying it to a helical-bladed VAWT configuration, showing that systematic multi-factor design of experiments can efficiently navigate the complex aerodynamic parameter space of vertical axis turbines and identify geometric combinations that significantly outperform conventional single-parameter optimization approaches.
In terms of blade geometry and its aerodynamic effects, Abdallah et al. [12] demonstrated a 142% gain in starting torque at λ = 0.2 and a 12.3% decrease in wake turbulence intensity at the optimal operating point using a 2D URANS model in ANSYS Fluent, and Celik et al. [13] confirmed that outward-facing J-profile openings progressively enhance self-starting capability based on dynamic start-up simulations with freely evolving rotor speed, and that this dynamic modelling approach is crucial for realistic low-TSR assessment. Miller et al. [14] experimentally tackled the solidity scaling problem using a compressed-air wind tunnel that can match full-scale Reynolds numbers, establishing universal performance-scaling relationships that provide a reliable benchmark for CFD validation over the broad parameter space relevant to urban turbine design. Li et al. [15] studied the effect of pitch angle at different tip speed ratios on the optimization of operational parameters with the CFD, and found that the power coefficient could be improved by 25% at the pitch angle of 5°. Chen et al. [16] further optimized five main design parameters of VAWT, including number of blades, angle of attack, NACA airfoil type, tip speed ratio and wind speed, using the Taguchi method combined with a modified additive model and ANOVA analysis, and concluded that wind speed and tip speed ratio are the most important factors, and the maximum mean power coefficient of 0.421 could be obtained with the optimal parameter combination. Ghafoorian et al. [17] showed that the dual-shaft hybrid Darrieus-Savonius configuration avoids the efficiency penalty of the single-shaft hybrids by providing a 35% power coefficient gain at low TSR and 25% at high TSR, thus effectively combining reliable self-starting and competitive efficiency over the entire operating range. Alexander and Santhanakrishnan [18] used 2D CFD to conclude that the ~10% power gain for side-by-side VAWT pairs is primarily the result of bypass flow reduction via opposing cross-stream velocities redirecting more wind mass through each rotor. Khedr et al. [19] offered an important methodological viewpoint, quantifying errors of up to 11.8% in blockage corrections and uncovering numerous inconsistencies in mesh resolution, domain sizing, and turbulence model selection among published simulations.
Hameed et al. [20] also used finite element analysis to show that replacing aluminum with glass–epoxy composite laminates with an optimized [45°/90°/0°/−45°] stacking sequence reduces the maximum bending stress from 74.9 to 54.6 MPa and the tip deflection from 4.86 to 4.493 mm, while maintaining structural safety at 8 m/s. The broader VAWT research landscape has been explored from a number of complementary points of view: Abhinav et al. [21] reviewed the aerodynamics of H-Darrieus in built environments specifically; Jang et al. [22] highlighted the indispensable role of experimental validation along with CFD predictions; Salvador-Gutiérrez et al. [23] identified global research trends and technological gaps through bibliometric analysis; Zhao et al. [24] reviewed the main approaches for improving lift-type VAWT performance covering blade geometry, flow control, power augmentation devices, and hybrid systems concluding that despite their omnidirectional advantages, these turbines still require systematic optimization to close the efficiency gap with HAWTs; Díaz et al. [25] highlighted a near-total absence of resilience analyses across 48 tropical wind energy studies; Bangga [26] provided a systematic performance analysis of H-Darrieus turbines equipped with four-digit NACA symmetric airfoils of varying thickness, confirming the aerodynamic superiority of symmetric profiles and establishing a clear justification for the selection of symmetric NACA profiles in H-Darrieus rotor design; and Gerrie et al. [27] conducted a fully three-dimensional CFD investigation showing that increasing rotor diameter and blade span progressively improves the power coefficient and that 3D simulations are essential for capturing tip loss effects that 2D models systematically overestimate. Beyond the traditional rotor types, Akash et al. [28] explored the design and performance of a 3D-printed Archimedes spiral wind turbine for renewable energy generation in Bangladesh, demonstrating the potential of locally adapted small-scale turbine designs to effectively address energy access challenges in developing urban contexts with wind conditions comparable to Moroccan cities. In a complementary direction, Calautit and Johnstone [29] studied the integration of an oscillating airfoil-based energy harvester into a building rooftop, showing that building-integrated wind energy conversion systems based on aerodynamic lift principles can generate meaningful power output from the accelerated flow that develops naturally around roof geometries, a result that strengthens the wider case for lift-driven wind-energy harvesting in the urban built environment.
Although significant progress has been reported in the literature, the small-scale Darrieus VAWTs remain virtually absent in the Moroccan energy scene. In Morocco, wind energy has been developed almost exclusively by means of large-scale HAWT farms in open terrain, leaving the significant urban wind resource largely untapped and unstudied. To fill this gap, the present work proposes a comprehensive and integrated design methodology for a Darrieus H-Rotor VAWT, specifically designed for the urban wind conditions of Tangier, Morocco, The installation site chosen is the roof top of an industrial building in the industrial zone of Tangier, near the Tangier Ibn Battouta Airport. This area is characterized by a high on-site electricity demand and limited installation space. Therefore, a compact, rooftop-compatible turbine such as the Darrieus H-Rotor VAWT is the only feasible option. The combination of these conditions creates a wind resource that is not well suited to large scale HAWT technology, but particularly appropriate for lift-driven VAWTs that can capture energy omni-directionally at low and moderate wind speeds. We based our study on three complementary axes: aerodynamic design and optimization using QBlade, structural integrity analysis using CATIA, and high-fidelity 2D and 3D CFD simulations. The study includes a detailed parametric study of the rotor solidity, angle of attack, pressure and velocity field distributions and dynamic stall behavior. A good prediction of the power coefficient Cp has been obtained for real wind conditions obtained from the statistical analysis of the measured wind data at the Tangier site. The present work aims to develop a technically sound, lightweight and mechanically robust turbine that meets the industrial requirements, and offers an appreciable contribution to the production of clean energy in the urban environment of Morocco.

2. Methodology

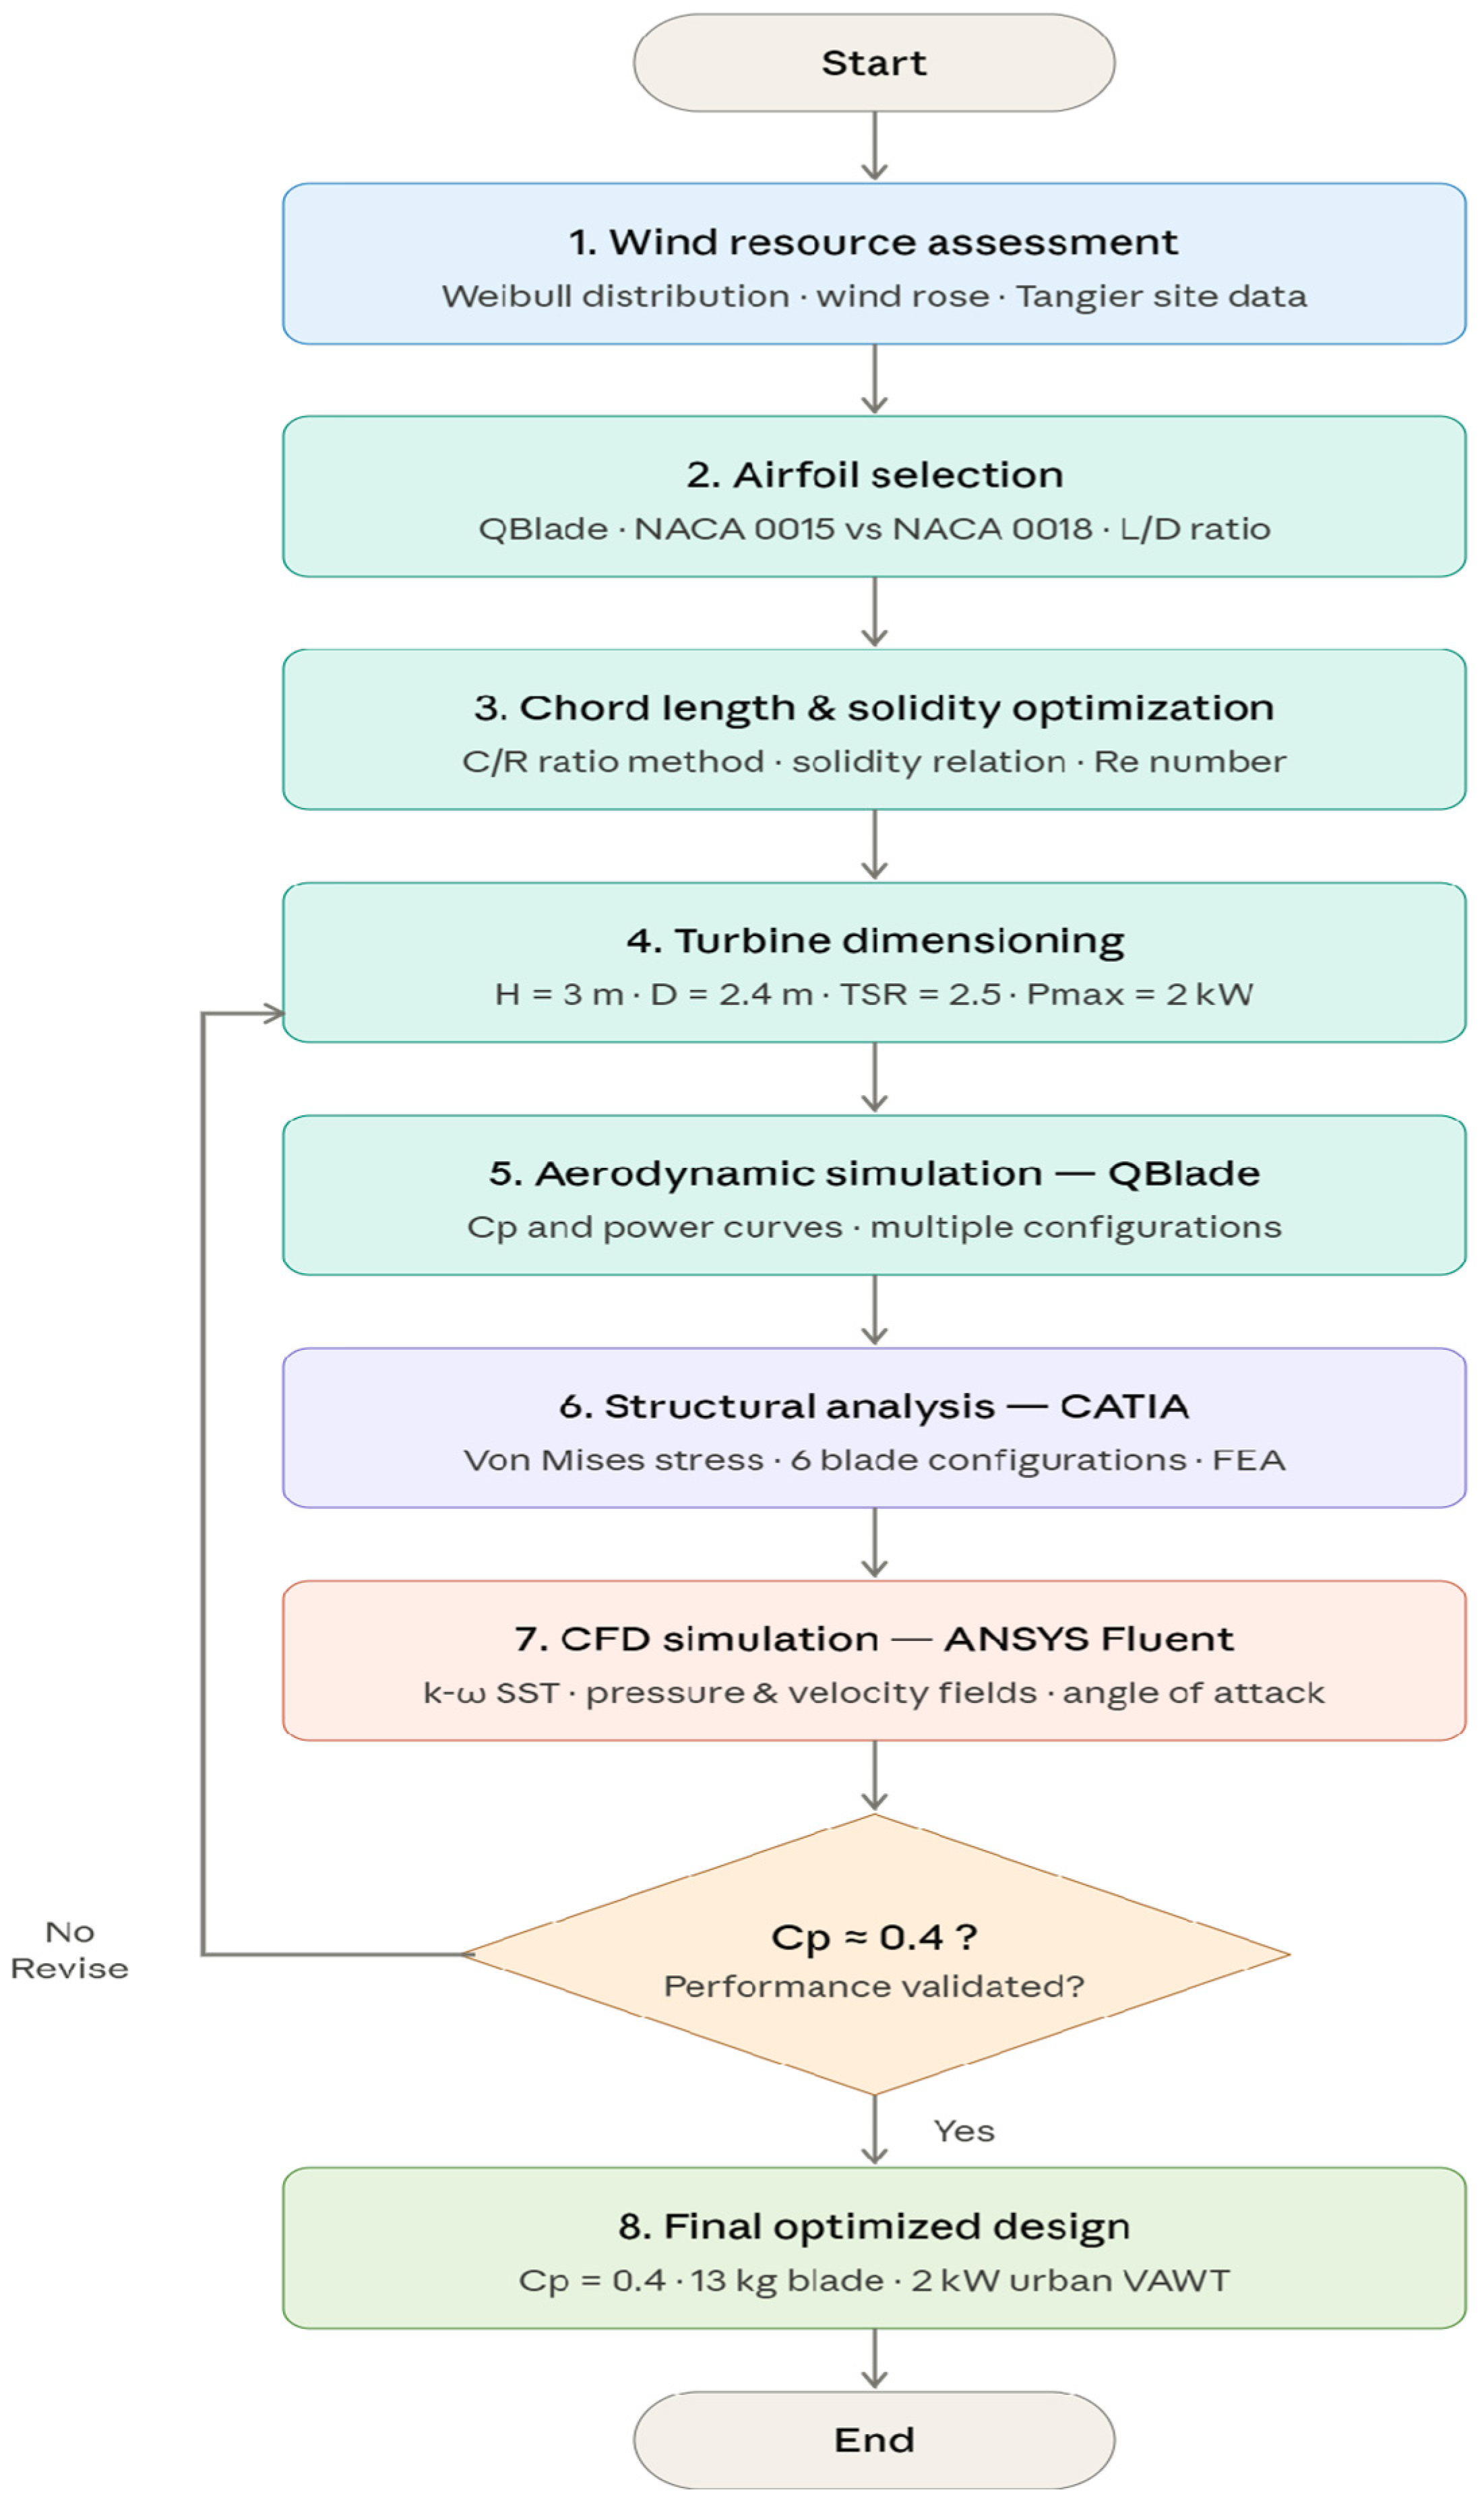
To provide a clearer picture of how this work was structured, Figure 1 summarizes the overall design methodology followed in this study, from the initial wind resource assessment at the Tangier site through to the final optimized turbine configuration. The design workflow adopted in this study is composed of three sequential simulation stages. Initially, QBlade V0.963 was used to perform a fast screening of airfoil geometries, solidity values and tip speed ratios using its aerodynamic models, and the best parameters found, NACA 0018 profile, chord length of 0.37 m and TSR = 2.5, were used as direct inputs for the following CFD simulations in ANSYS Fluent. The CFD study was then performed in two stages: a 2D simulation of the isolated NACA 0018 airfoil at angles of attack from 0° to 14° which allowed us to determine the optimal angle of attack and a detailed study of the pressure and velocity fields around the blade; and a full 3D simulation of the whole rotor that takes into account spanwise flow effects, tip vortex losses and blade–wake interactions which cannot be captured by the 2D model. The 2D results were used for aerodynamic validation of the airfoil behavior while the 3D results are the reference for the overall turbine performance evaluation including the final power coefficient Cp.

2.1. Wind Resource Assessment

In the previous study conducted [30], a statistical analysis of the wind resource at the target site was carried out using the Weibull probability distribution presented by Formula (1), which is widely recognized as the most appropriate model to characterize the wind speed variability in intertropical and urban regions. The two-parameter Weibull distribution was written as:
f v = k c ( v c ) k 1 × e ( v c ) k     w i t h :   { c = 1.125 V m / ( 1 B )   k =   1   +   0.482   ( V m 2 ) 0.51   B = 1 0.81   ( V m 1 ) 0.089 }
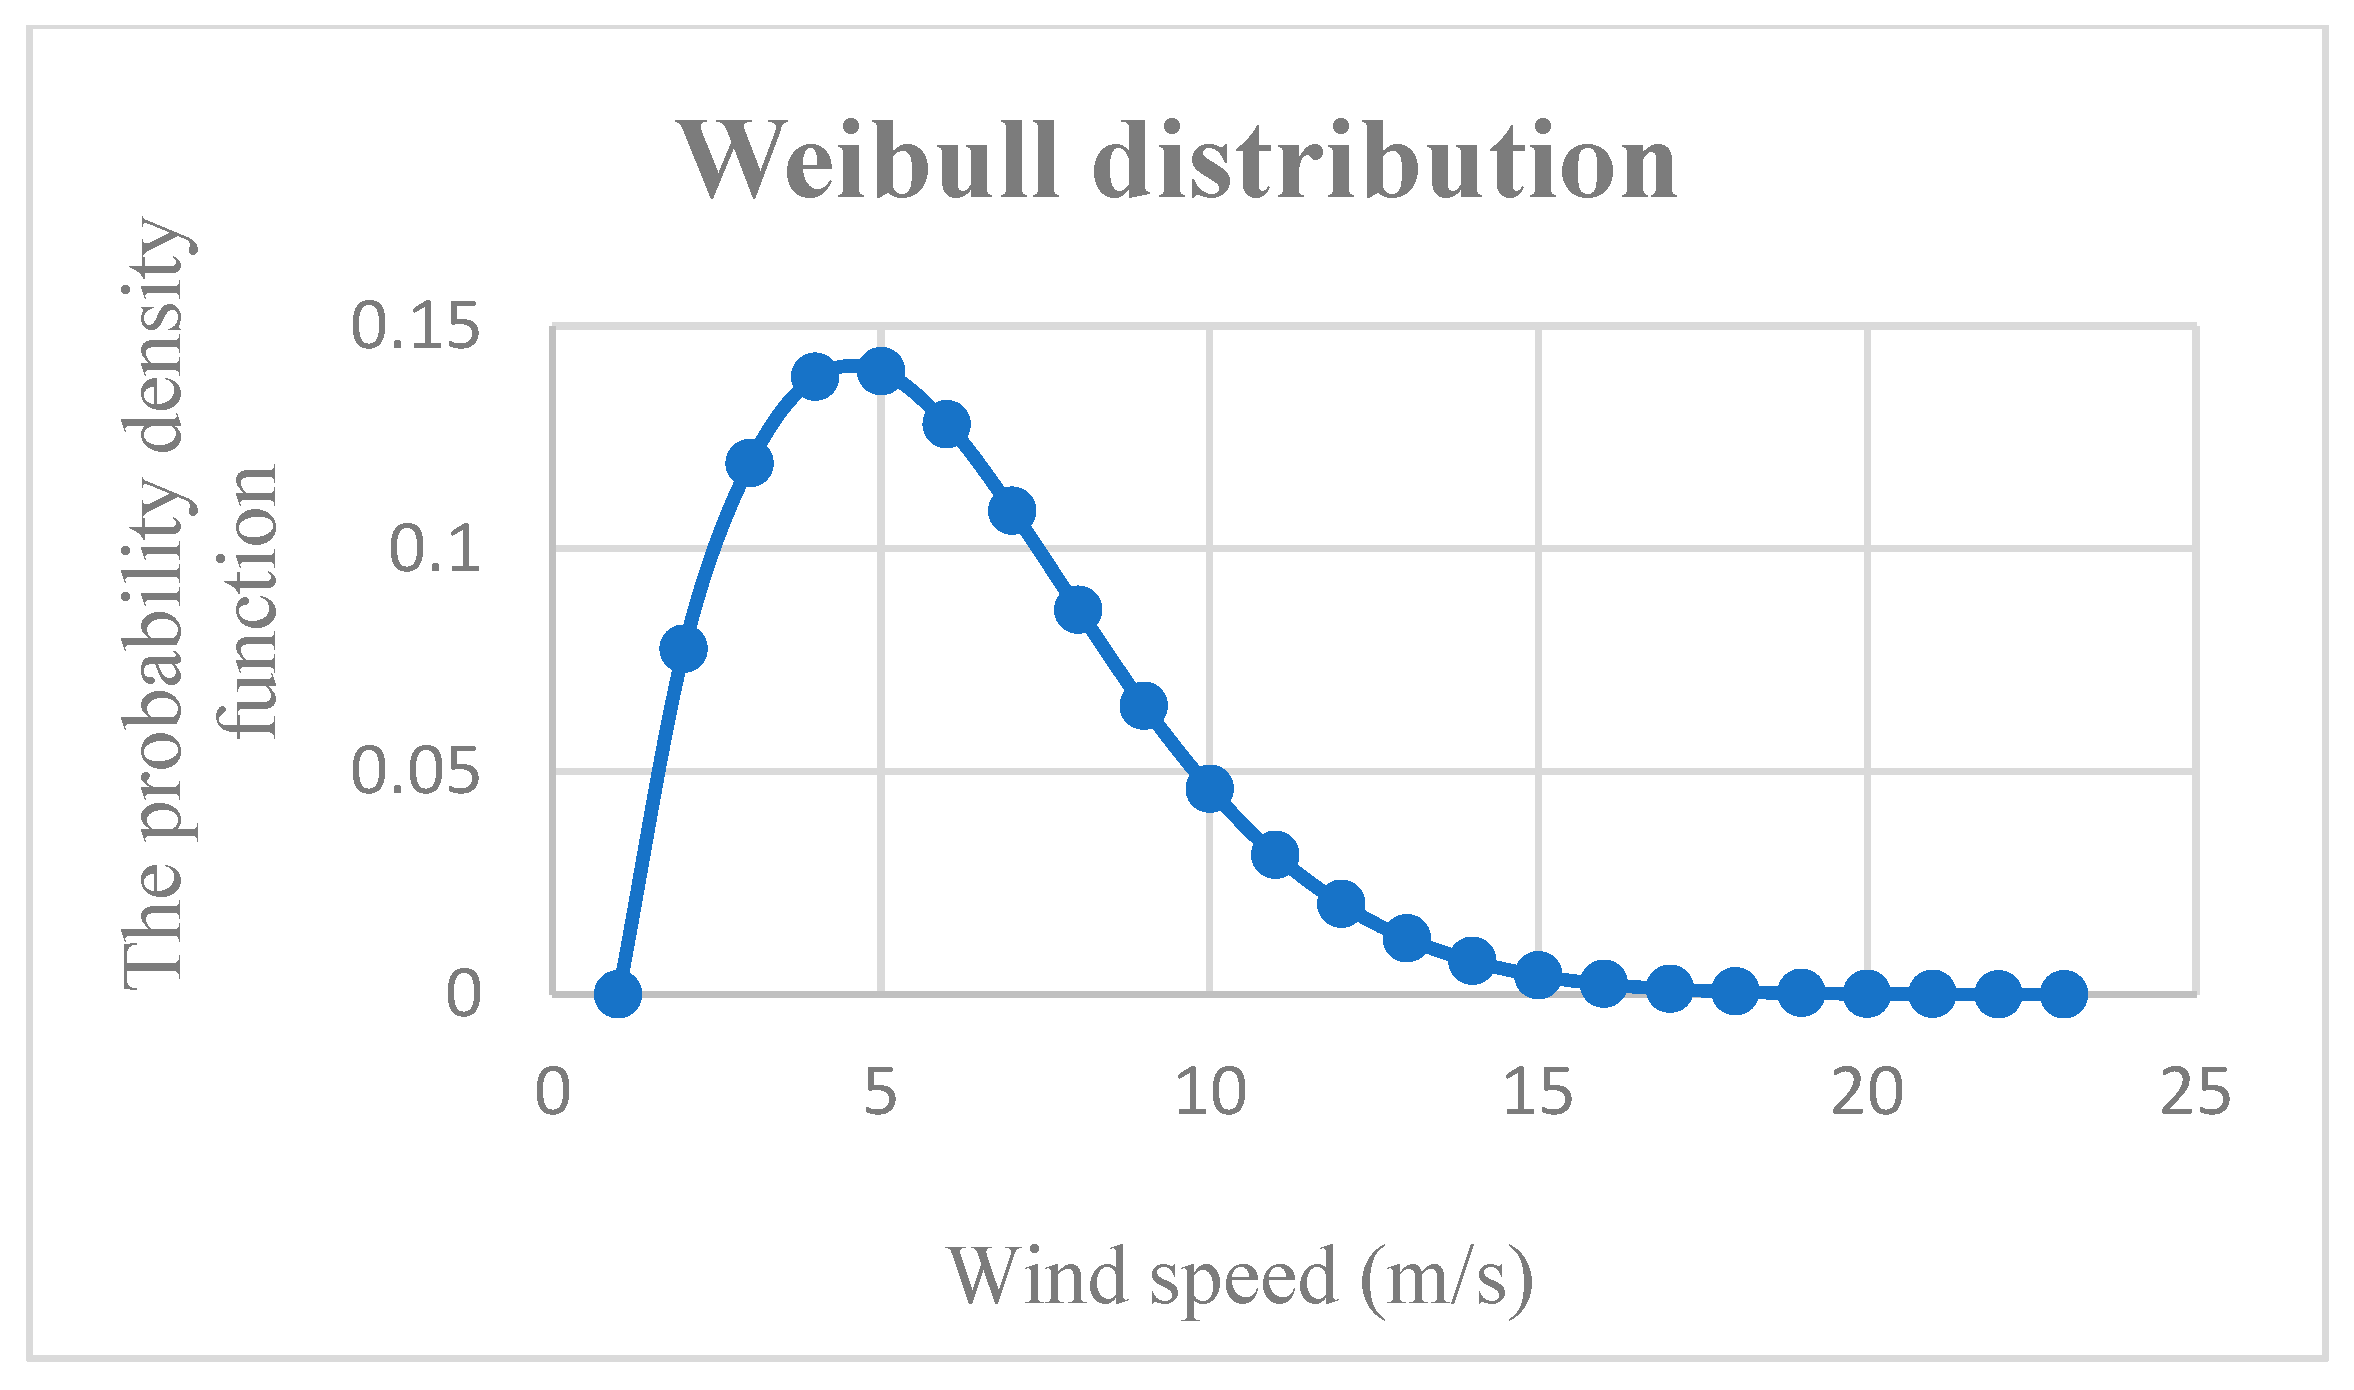
The scale parameter c and shape parameter k were derived from the mean wind speed Vm using the empirical correlations of Lysen, as explicitly shown in Equation (1). These correlations are widely used in the wind energy literature for sites where only mean wind speed data are available, and represent a standard and accepted estimation method in such contexts. The analysis showed a mean wind speed of Vm = 4.65 m/s at the site with Weibull parameters defined by B = 0.092886, c = 5.666 m/s and k = 1.780, typical of moderate and relatively steady wind conditions at the study location. As shown in Figure 2, the probability density function reveals a peak frequency at around 5 m/s, indicating that this speed is the most likely wind condition at the site, and thus must be considered as the reference design point for assessing turbine performance in the present study.
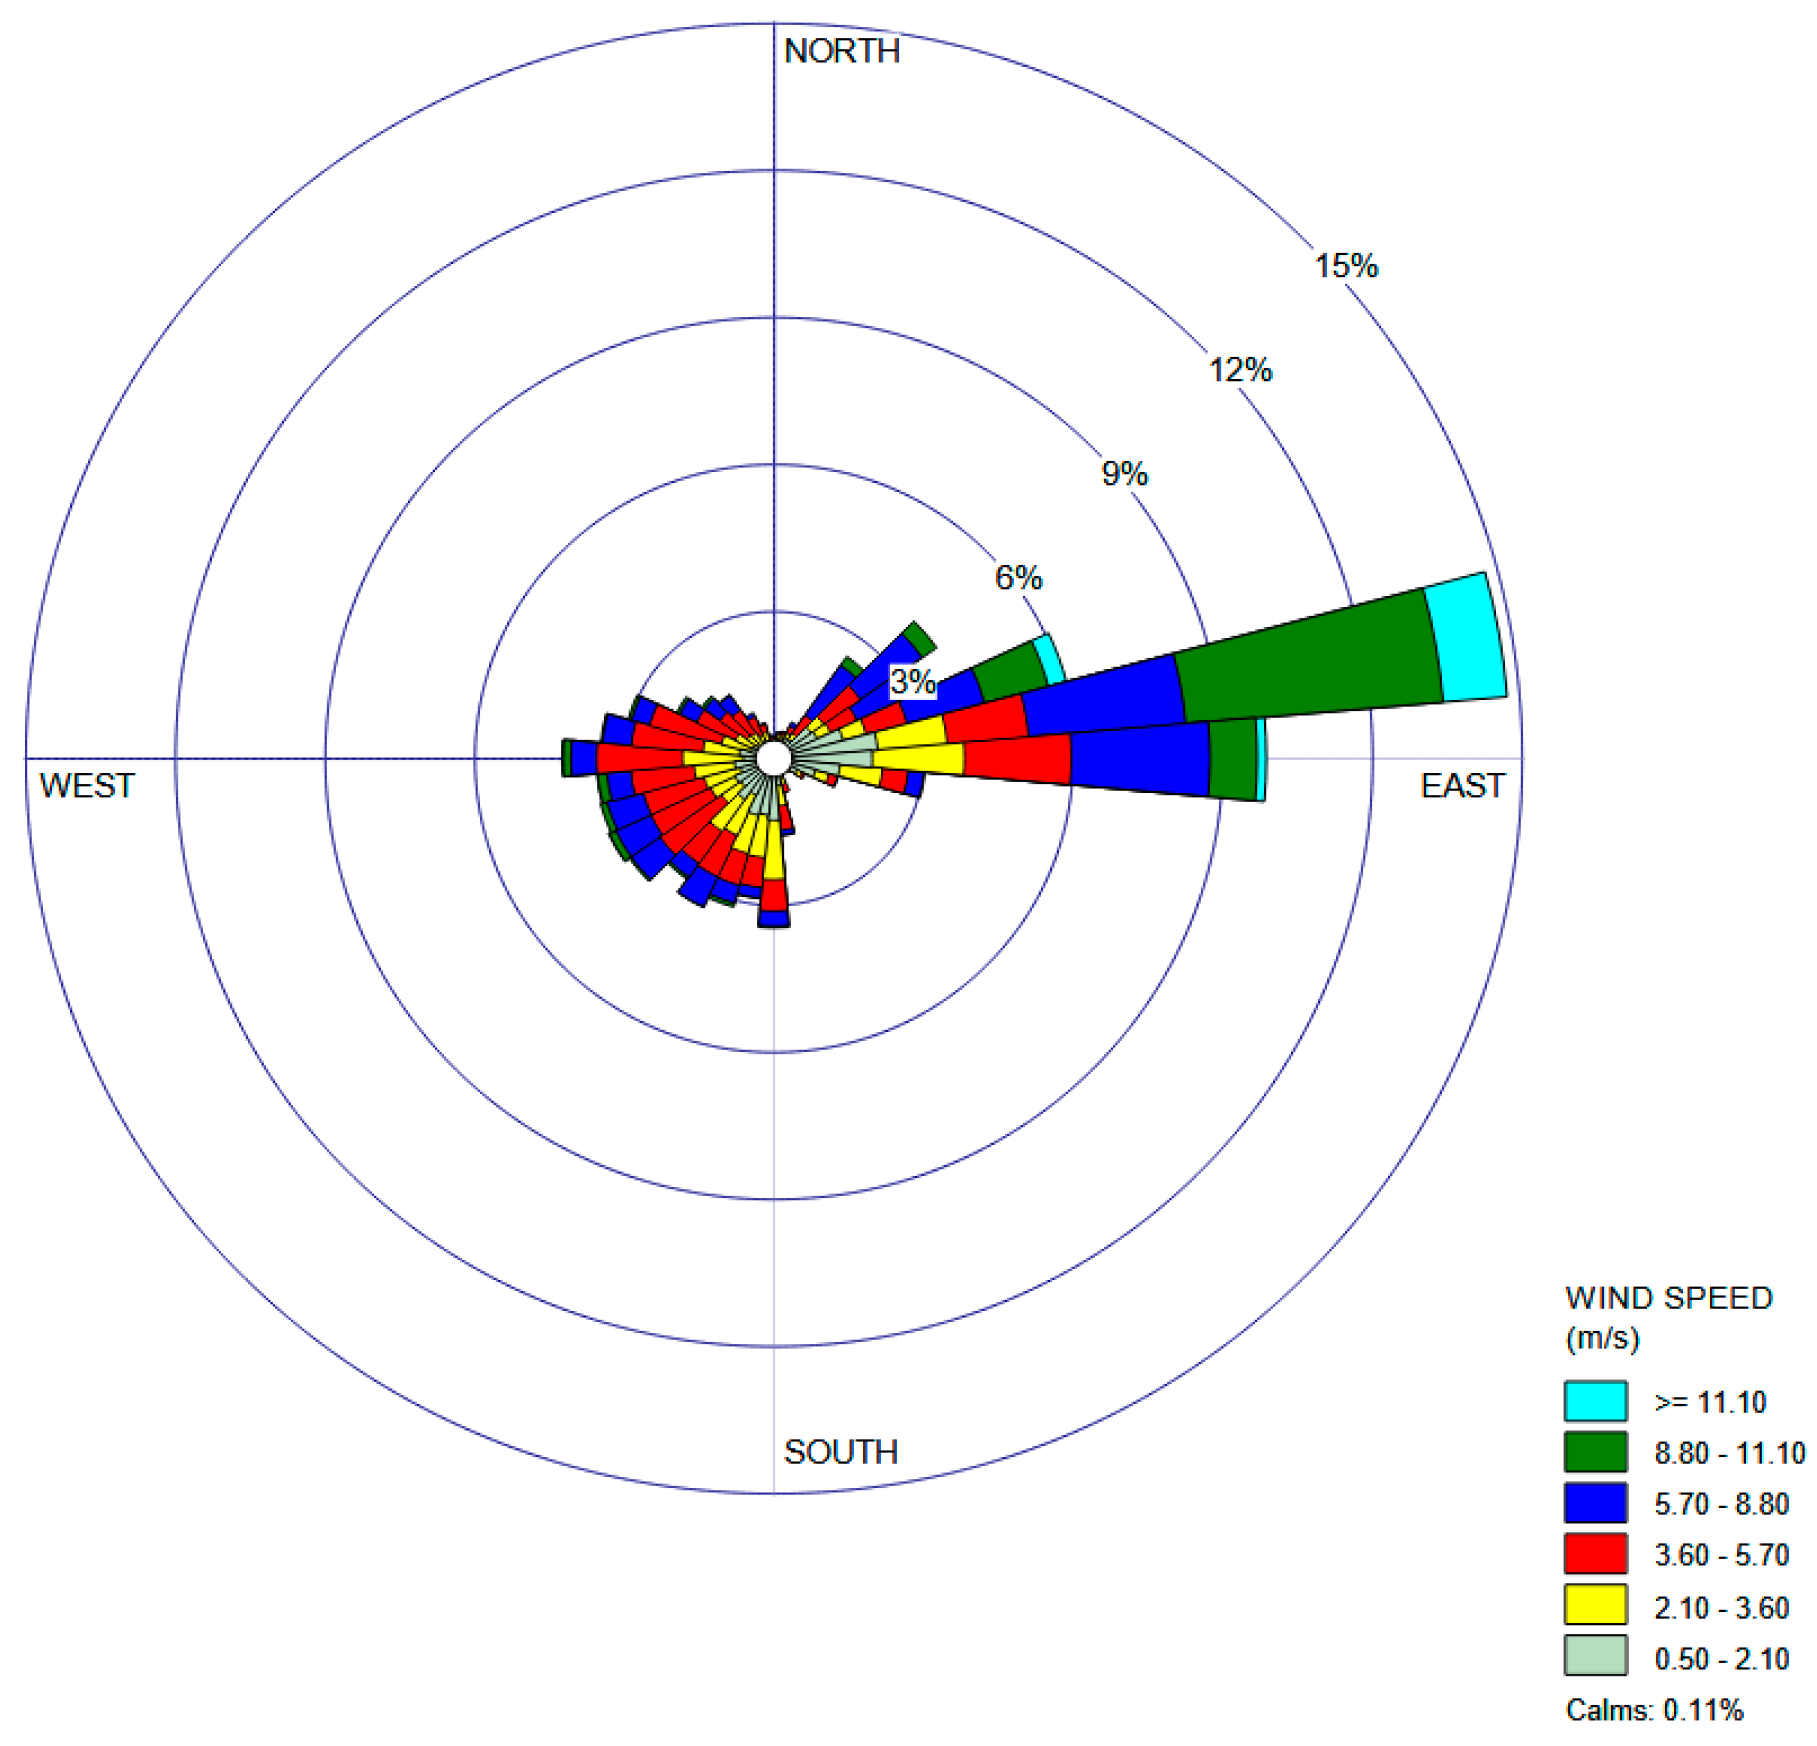
The wind analysis at the project site shows a dominant east and east-southeast direction with common speeds in the range of 3.6 m/s to 5.7 m/s and rare calm periods. The higher wind speeds of up to 11.1 m/s are mainly from the east, which indicates a steady and beneficial wind potential for vertical-axis turbines, and is suitable for urban and semi-urban areas such as Tangier, as can be seen in Figure 3.

2.2. Aerodynamic Design

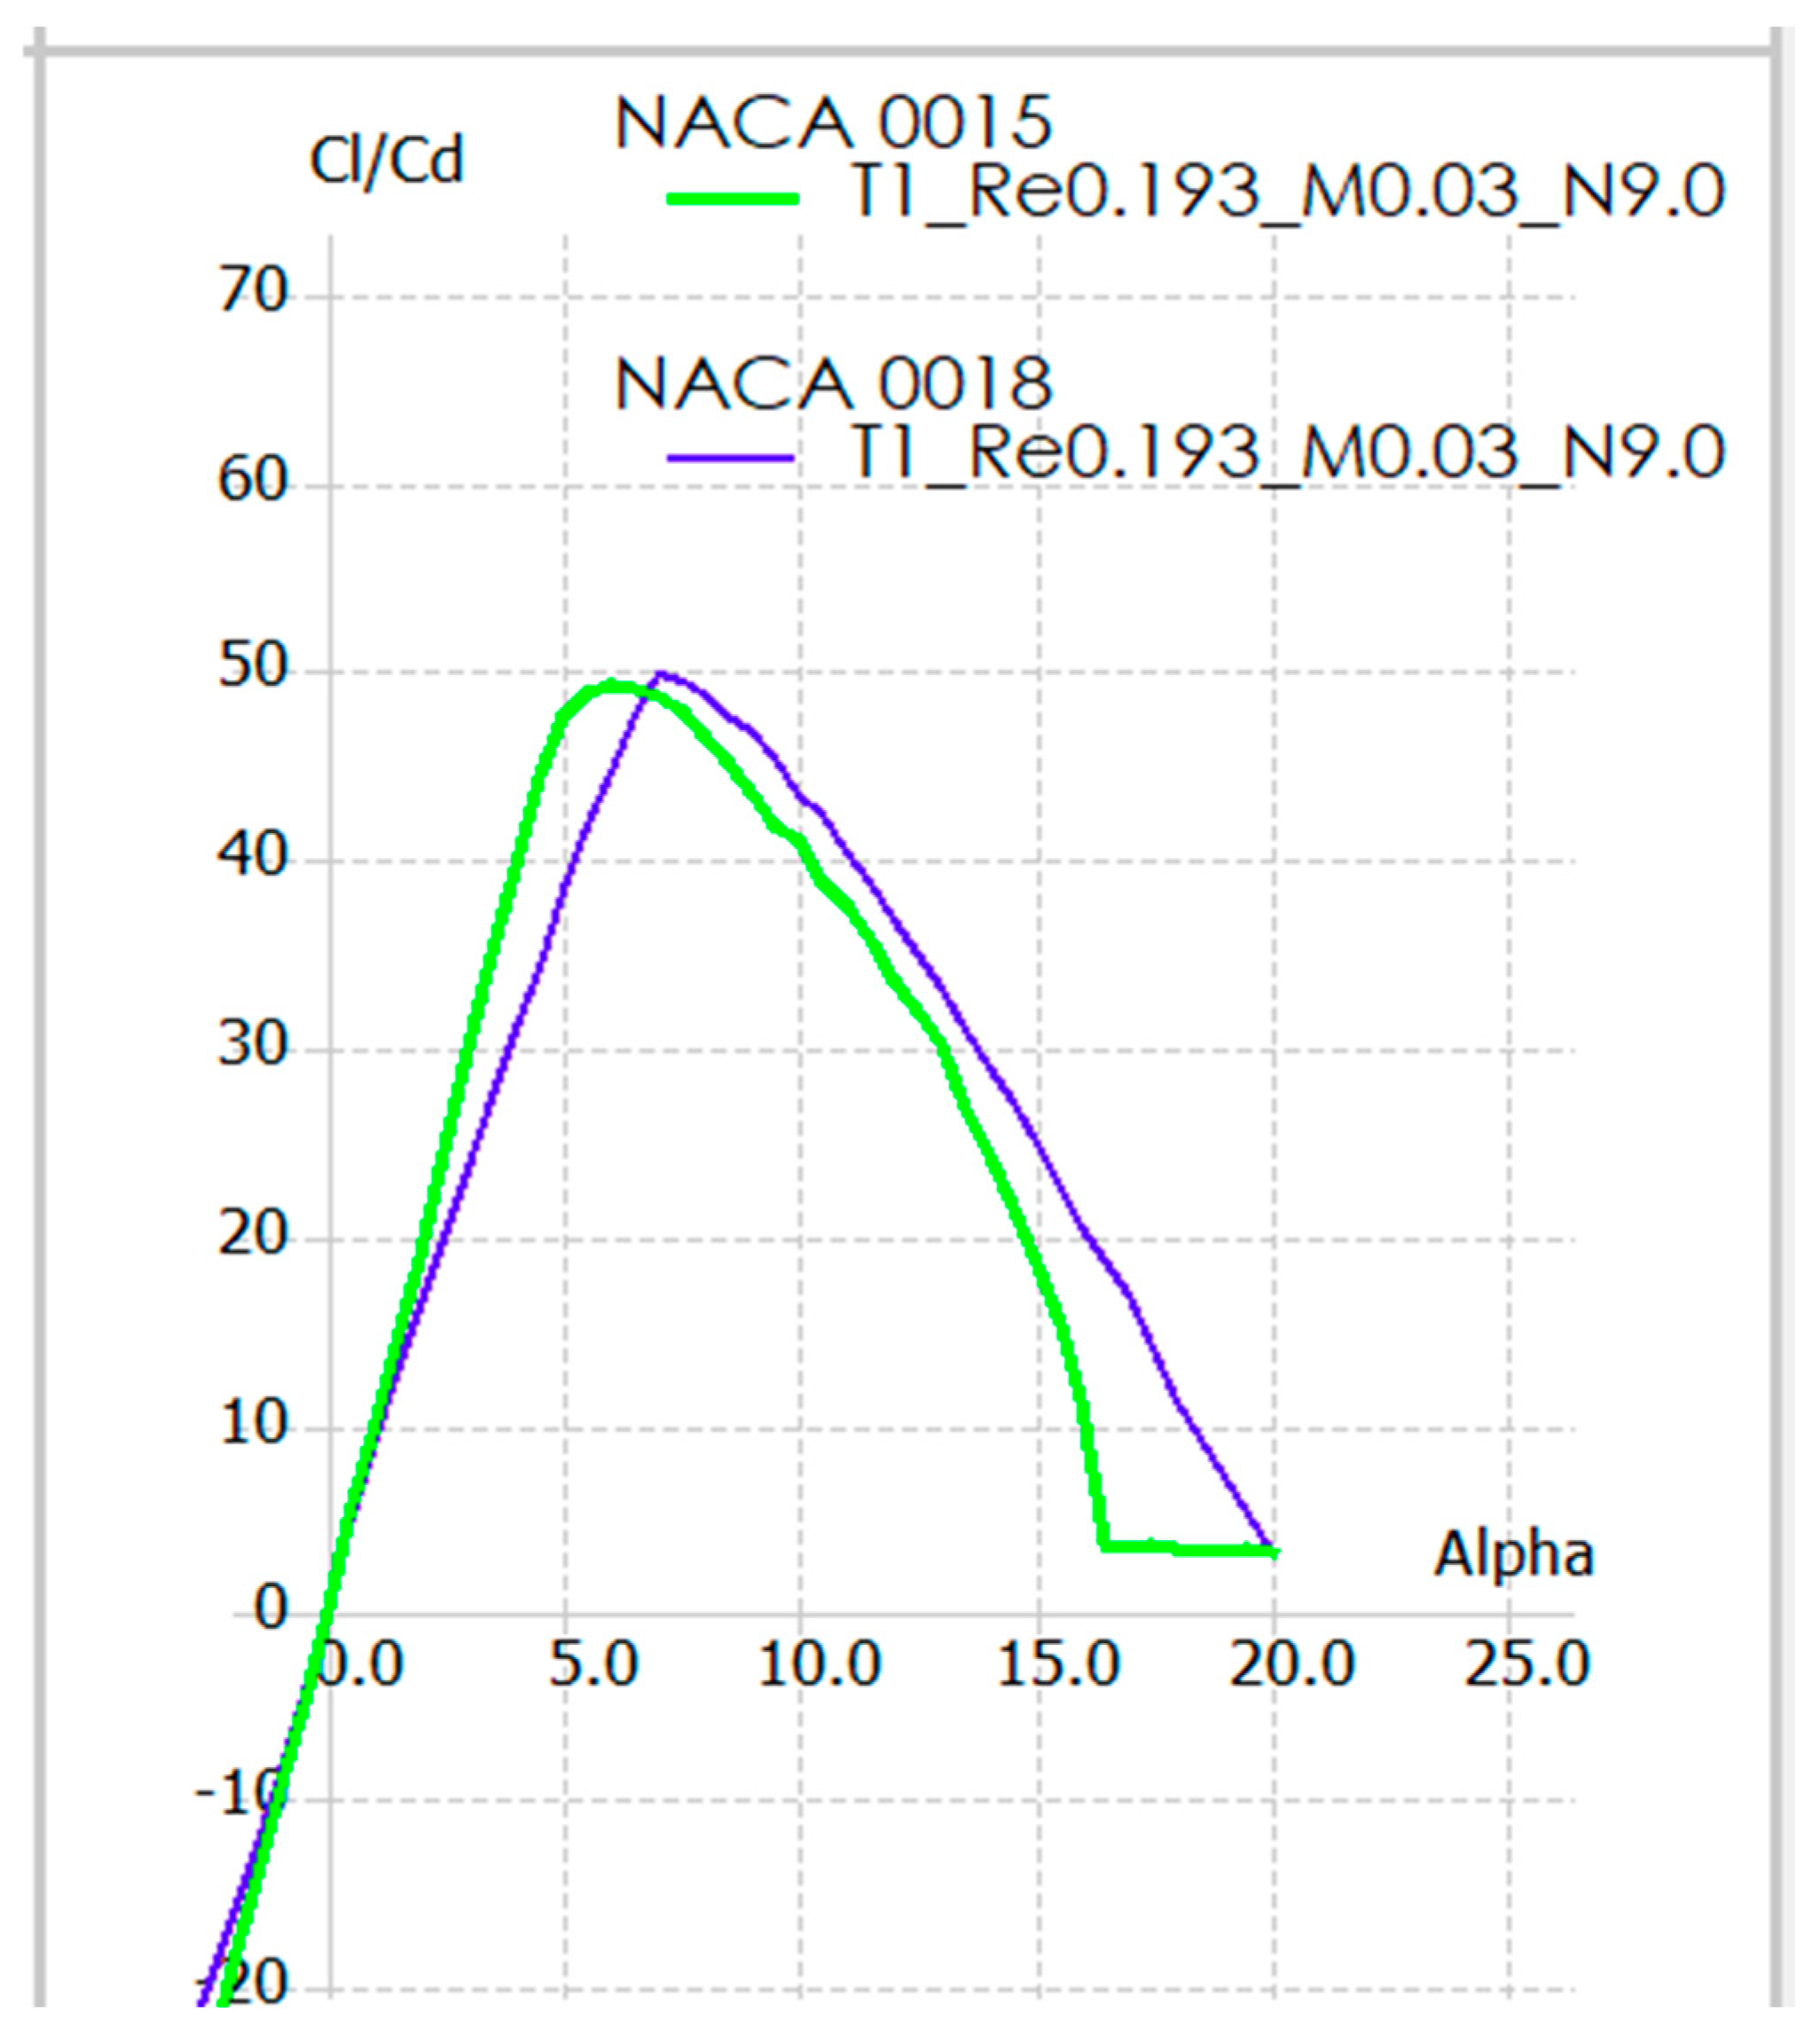
The QBlade simulations taking into account the moderate but gusty wind conditions of Tangier shown in Figure 4 confirmed that NACA 0018 is the best choice. Its greater thickness results in structural robustness, stable stall behavior and high lift-to-drag ratio: maximum L/D 50 at 7°, L/D > 30 up to = 12°, with a gradual stall starting at 8°. The QBlade simulations also revealed a more stable stall behavior and a higher maximum lift compared to NACA 0015 which further confirms its relevance for real world applications. On the other hand, NACA 0015 has good aerodynamic performance at low angles of attack but its thin profile makes it more prone to mechanical stress caused by gusts.
Surface Selection
The blade chord length was computed by two different methods, which converged to the same result and gave good confidence in the final value adopted. The first approach is based on the work of Liang et al. [30] where the influence of chord-to-radius ratio (C/R) on aerodynamic performance of straight-bladed VAWTs was studied. It was shown that by increasing the chord length, the lift-to-drag ratio is improved and the dynamic stall delayed by increasing the local Reynolds number, but this benefit reaches a plateau beyond a certain threshold. For the present turbine working at TSR of 2.5 with rotor radius of 1.2 m, the recommended compatible C/R ratio in [31] is 0.3 which directly gives the chord length as:
c R = 0.3   0.3 × 1.2 = 0.36   m
The second approach is based on the solidity relation which is defined as:
σ = B × c 2 π × R c = σ × 2 π × R B
where c is the blade chord, B the number of blades and R the radius of the rotor. Table 1 presents the chord lengths, Reynolds number and maximum power coefficients determined by investigating several solidity values (spanning a range from 0.10 to 0.20). The data clearly show an inverse relationship between solidity and power coefficient; as solidity increases aerodynamic efficiency decreases progressively. The most favorable configuration is σ = 0.15 which corresponds to the optimum chord length previously calculated, provides the highest Cp,max of 0.42, and the maximum power output of 2400 W.
The two approaches independently give a chord length of the order of 0.37 m, a convergence that validates the consistency and reliability of the sizing approach followed in this work. This value also agrees with the results of Maalouly et al. [32] who performed an extensive CFD parametric study of H-type Darrieus VAWTs using ANSYS Fluent for real and sinusoidal urban wind profiles and concluded that the chord length is the single most dominant geometric parameter controlling turbine behavior in both transient start-up and steady-state operation, a finding that supports the appropriateness of the chord length being retained as the final optimized configuration for the present design.
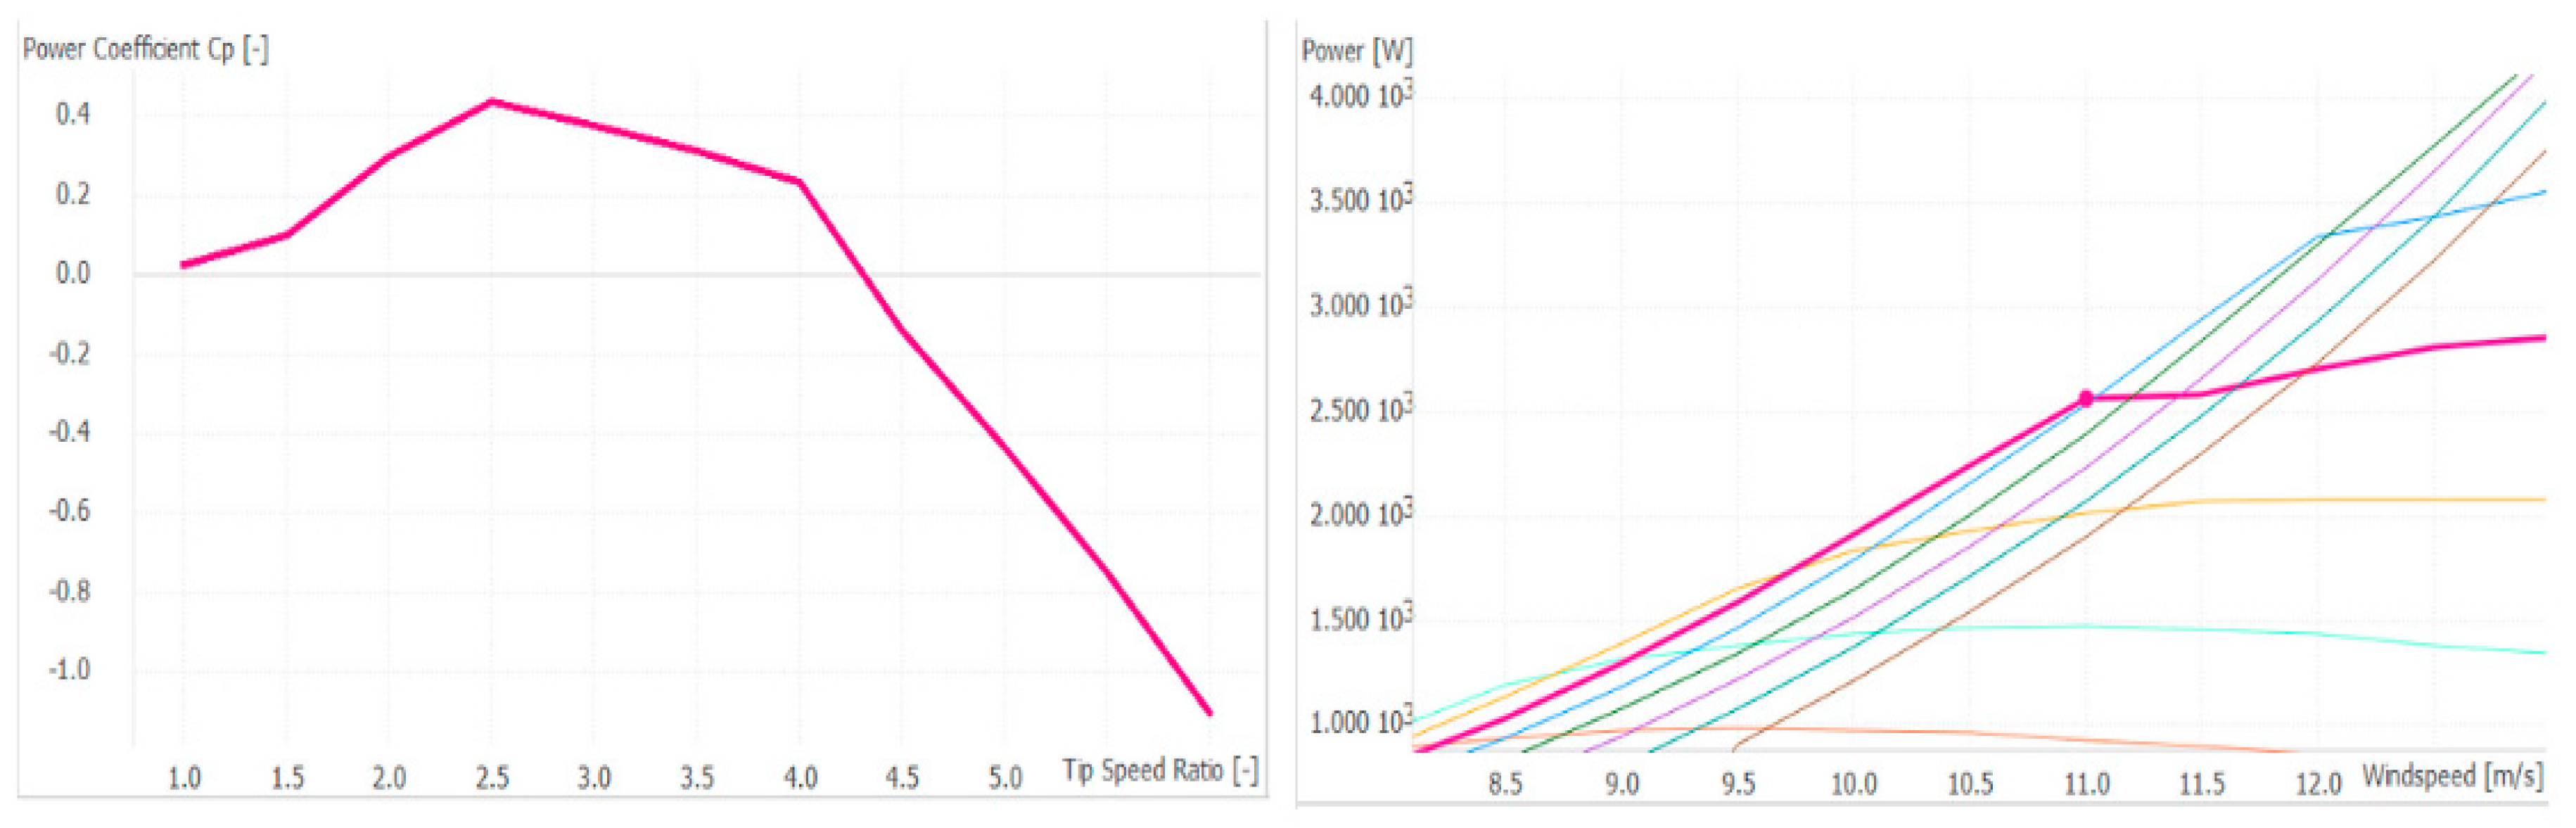
The turbine dimensions were optimized by simulating various configurations shown in Table 2 at a maximum wind speed of 11 m/s, TSR = 2.5 and chord of 0.37 m. These configurations were inspired by previous studies, especially Zamani et al. [33], where a power coefficient (Cp) of 0.4 was reported for a 3 kW H-rotor Darrieus turbine at wind speed of 12 m/s. However, due to the specific constraints of our present research project, the turbine geometry was limited to a blade height of 3 m and rotor diameter of 2.4 m. The design parameters were then used to estimate the theoretical maximum power output of the proposed system.
To better understand and compare the aerodynamic performance of the different turbine configurations, some simulations were performed by means of QBlade, allowing us to obtain more realistic estimations of both the power coefficient (Cp) and the generated power (P) for each case, supporting the theoretical calculations with detailed numerical results and providing a clearer evaluation of the influence of the turbine dimensions on the overall system performance. In order to perform a fair and objective comparison of the configurations studied, all the simulations were performed under the same operating conditions, i.e., maximum wind speed of 11 m/s, a fixed tip speed ratio (TSR) of 2.5 and a chord length of 0.37 m [30]. The selected TSR is the one corresponding to the maximum value of specific speed obtained during the different simulation campaigns, and it has been chosen as the reference operating condition during the project as it is the best compromise between aerodynamic efficiency and realistic operating conditions. Similarly, the chord length was chosen from a number of detailed aerodynamic analyses, which are presented in the following sections.
The simulation results show that the power generated increases significantly with the increase in the turbine height and diameter, due to the increase in the swept area and the improvement in the aerodynamic performance. However, even if the larger configurations were able to produce higher power outputs, the second configuration, which corresponds to a nominal power close to 2 kW, as reported in Figure 5, was finally adopted as final optimized design because it has the best compromise between energy performance, structural compactness and technical feasibility, while being compatible with the project constraints and manufacturing requirements.

2.3. Structural Design

For the blade reinforcement, six different configurations were studied, taking into account the mass and minimizing the stress, as shown in Table 3. The models will be simulated with CATIA V5R21 to evaluate the distribution of Von Mises stress and the total mass. The aim is to find a good compromise between mechanical strength and lightness, for dynamic applications.
The Von Mises stress is obtained by Formula (4).
σ v = 1 2 [ σ 1 σ 2 2 + σ 2 σ 3 2 + σ 3 σ 1 2 ]

2.4. CFD Simulations

In our recent CFD study in ANSYS using a structured mesh around the NACA airfoil, we have found a steady increase in the lift-to-drag ratio (Cl/Cd) with the angle of attack up to a maximum value of around 8.8 at 10°, which is the optimal aerodynamic operating condition for the studied airfoil, and the following decrease in the aerodynamic efficiency due to increased drag and flow separation [30].
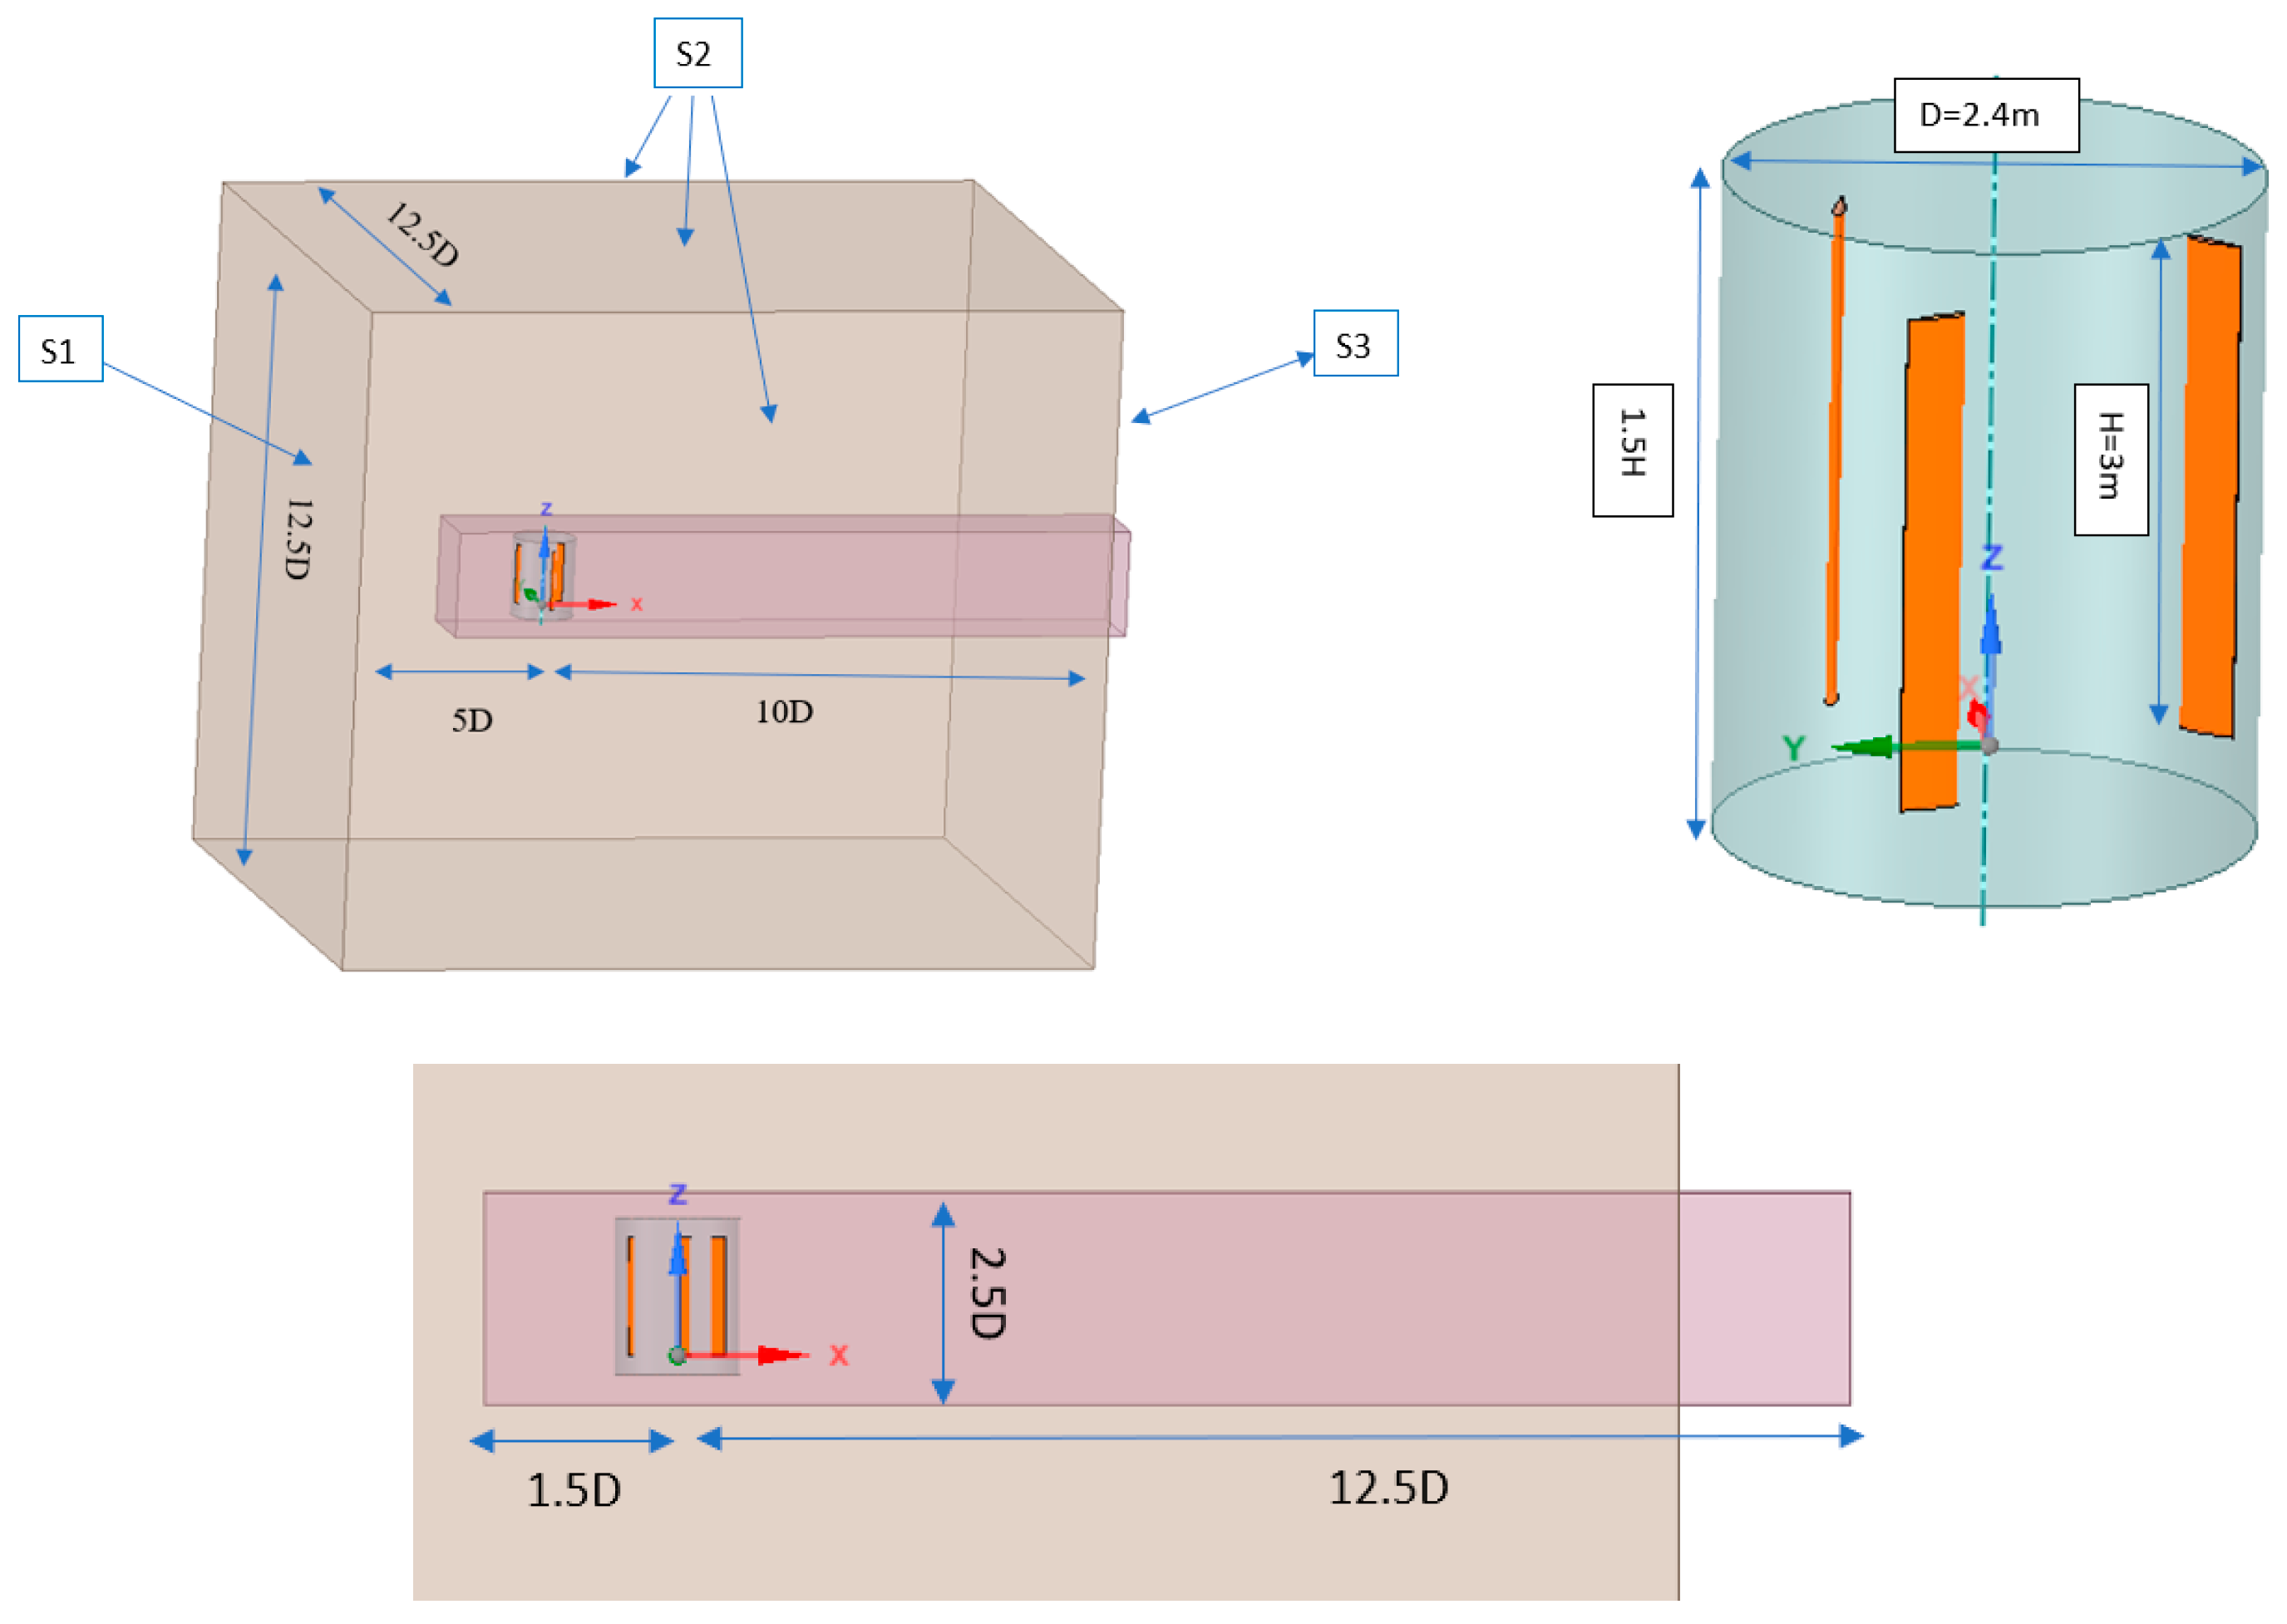
A computational domain was created to simulate the 3D as shown in Figure 6. The blades were placed inside a rotating cylindrical domain to simulate the rotation of the blades. The rotating cylindrical domain was then embedded inside a stationary rectangular domain to ensure proper interaction between the moving and stationary parts of the fluid. The whole system was embedded in a larger fluid box simulating the global computational domain and providing a realistic boundary condition far from the blades.
This set up enabled a more realistic analysis of the fluid–structure interaction including the pressure and velocity distribution on the rotating blades. The simulation also revealed important aerodynamic phenomena such as flow separation, vortices and pressure gradients that are very important for the evaluation of the performance and efficiency of the vertical axis wind turbine (VAWT).
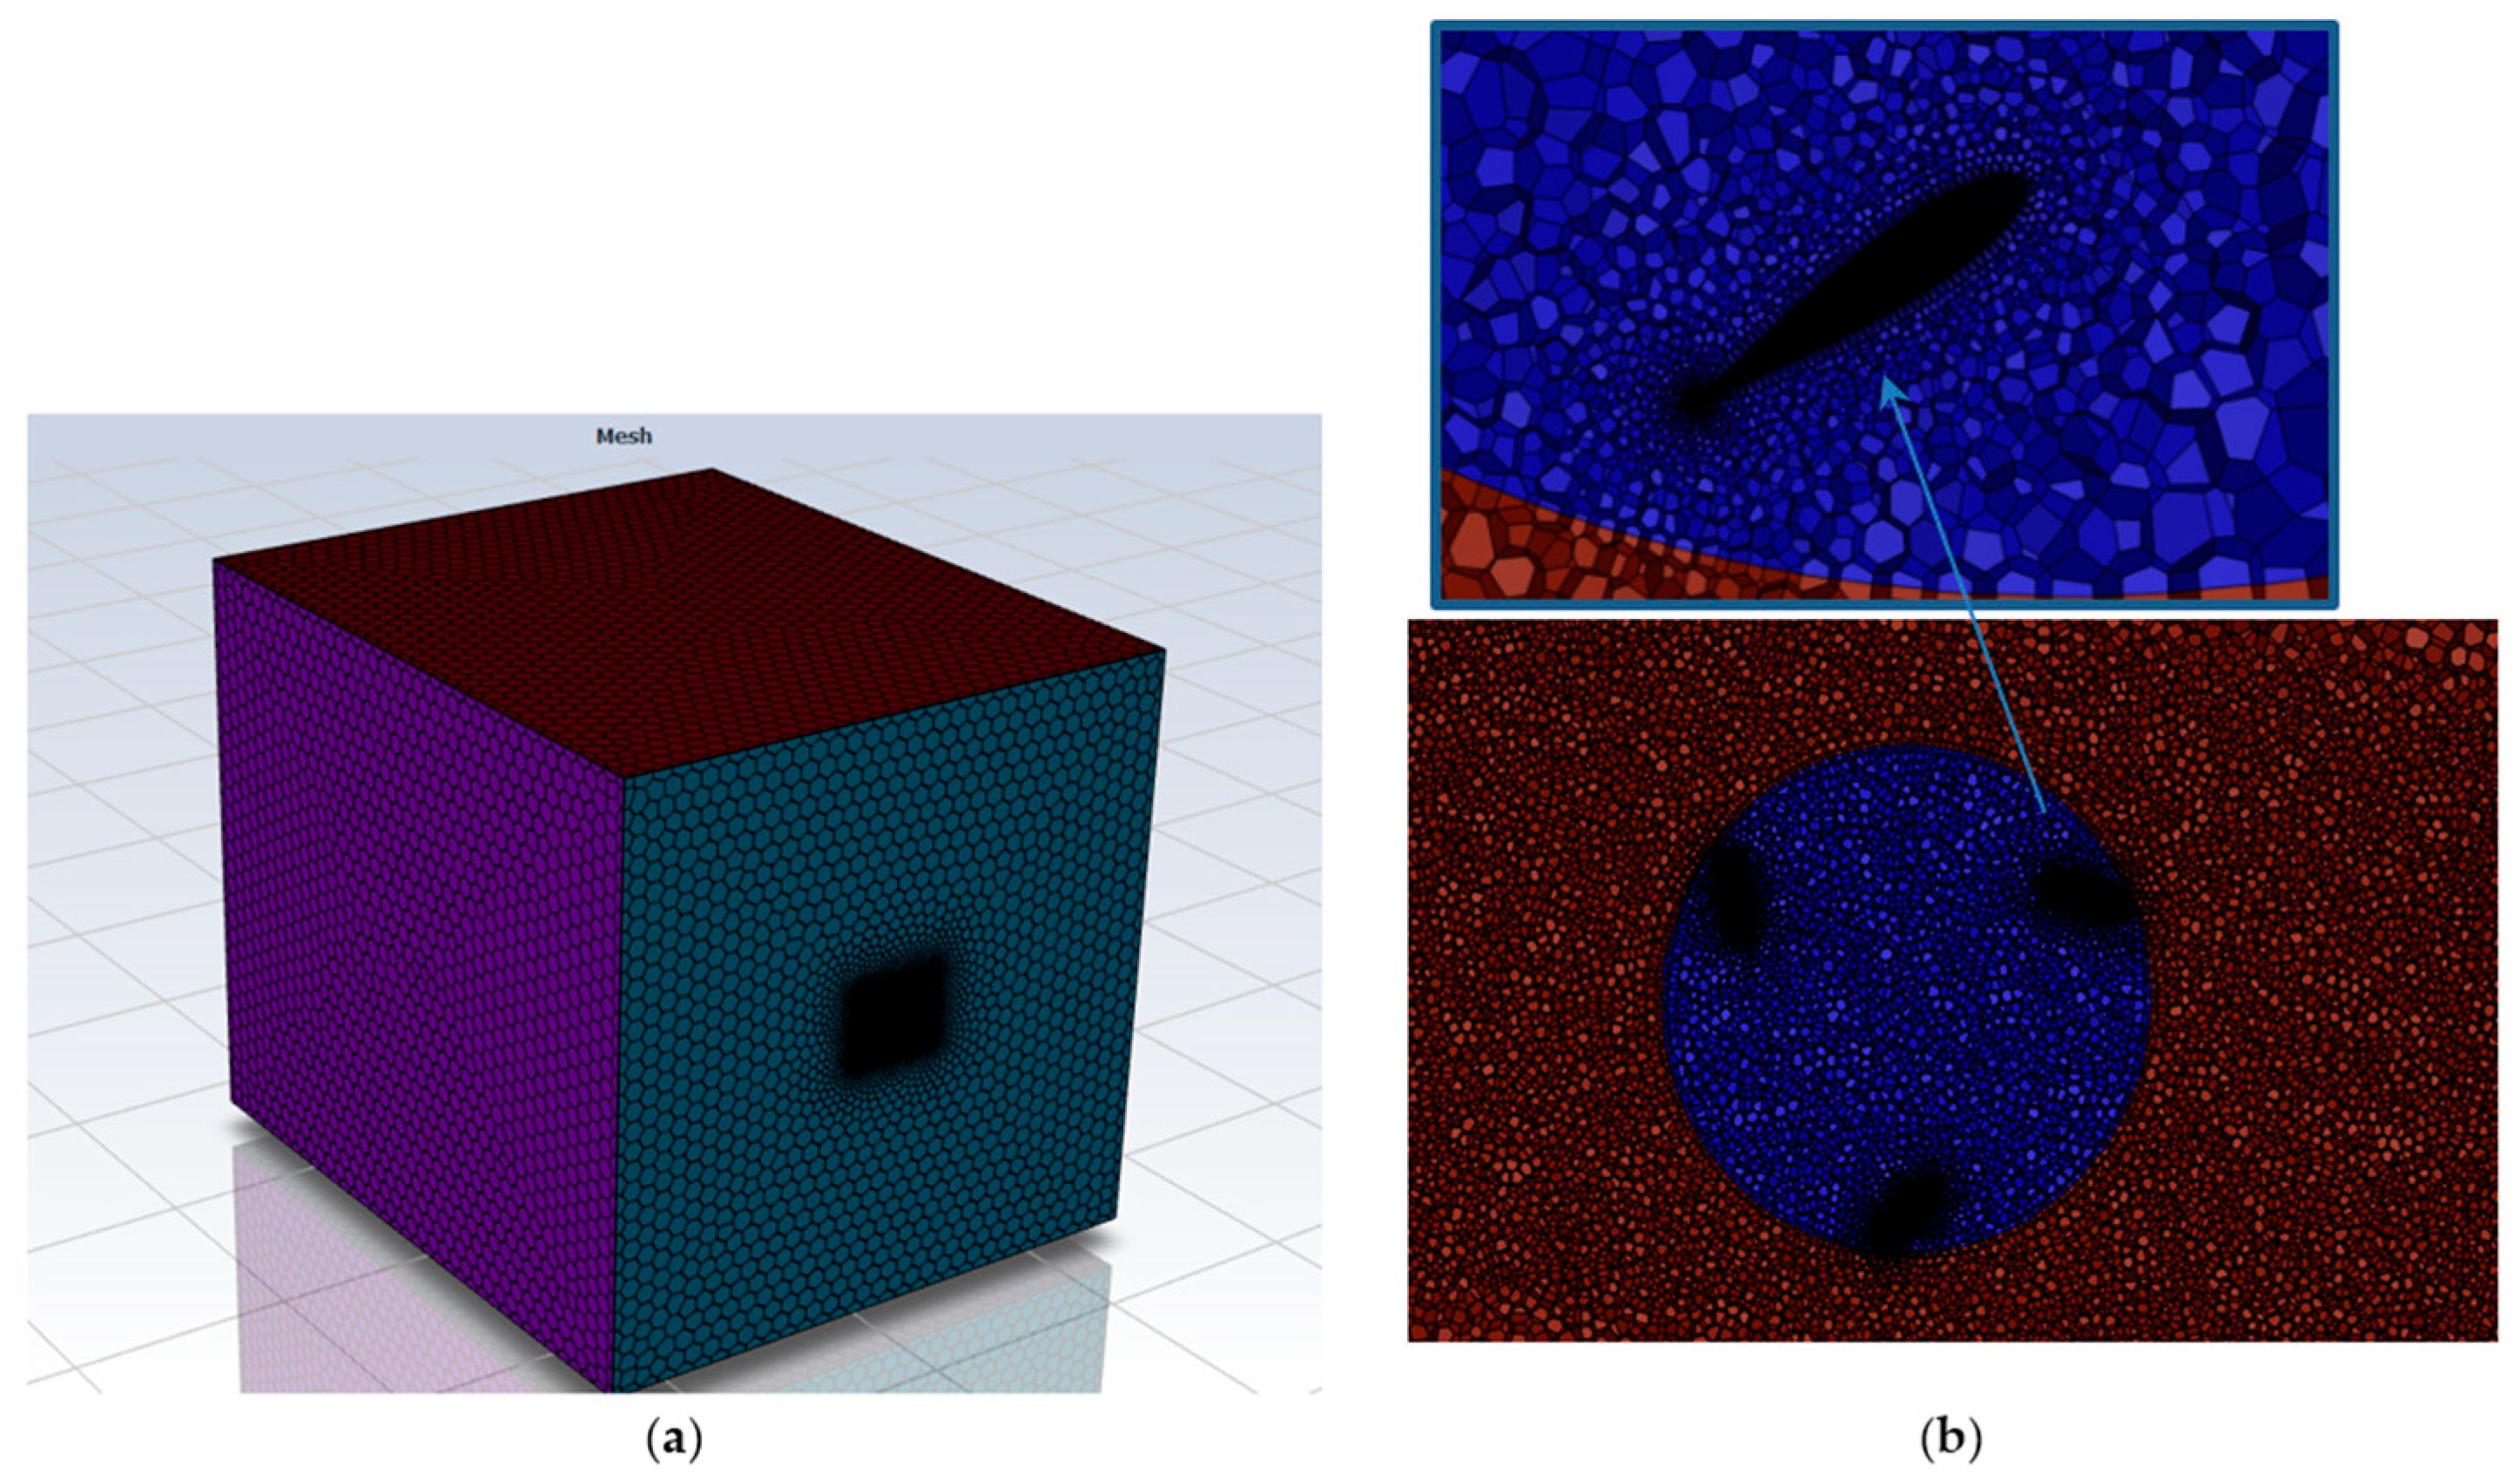
A multi-scale meshing strategy was employed to find a good compromise between accuracy and computational cost. The lateral edges of the NACA airfoil, the edges of the blade and the walls of the blade were fine-meshed with 0.001 m, 0.005 m and 0.01 m, respectively. Finally, the global influence region was considered with coarse mesh of 0.09 m. The result of this meshing phase is shown in Figure 7a. For the volumetric mesh, a polyhedral mesh was created with the fluent meshing module with a growth rate of 1.2 as shown in Figure 7b.
The k-ω turbulence model was chosen for the solver settings to model the viscous flow regime. The boundary conditions were velocity inlet of 5 m/s and pressure outlet. The transient simulation was carried out using time step (Δt) of 0.0001 s for a total of 5000 time steps with 50 iterations per time step to ensure numerical convergence. In an effort to validate the CFD model, the power coefficient predictions obtained from the present k-ω SST URANS simulations were compared to the experimental benchmark data utilized by Muñoz-Reja et al. [34] and Palacio-Caro [35] who performed 2D CFD simulations of an H-Darrieus VAWT using the same NACA 0018 airfoil and the same turbulence model, reporting deviations of less than 4% between their CFD predictions and published experimental data across the entire TSR range considered. The results of the present simulation agree with the same experimental data set within a similar margin, which validates the CFD set up adopted. The y+ value was kept below 1 for all blade surfaces in terms of mesh quality, as demanded by the k-ω SST model without wall functions, and residual convergence below 10−4 was reached for each time step after a periodic steady state was attained over the last rotor revolutions. These mesh characteristics are in agreement with the best practice guidelines reported by Palacio-Caro et al. [35] for Darrieus VAWT CFD simulations, where this level of near-wall resolution has been shown to lead to power coefficient variations below 0.2% with increased mesh refinement, confirming the adequacy and accuracy of the spatial discretization adopted in the present study. We acknowledge that no formal grid independence and time-step-sensitivity study was performed in this work, and this is a known limitation to be addressed in future work.

3. Results and Discussion

3.1. Structural Analysis of the Blades

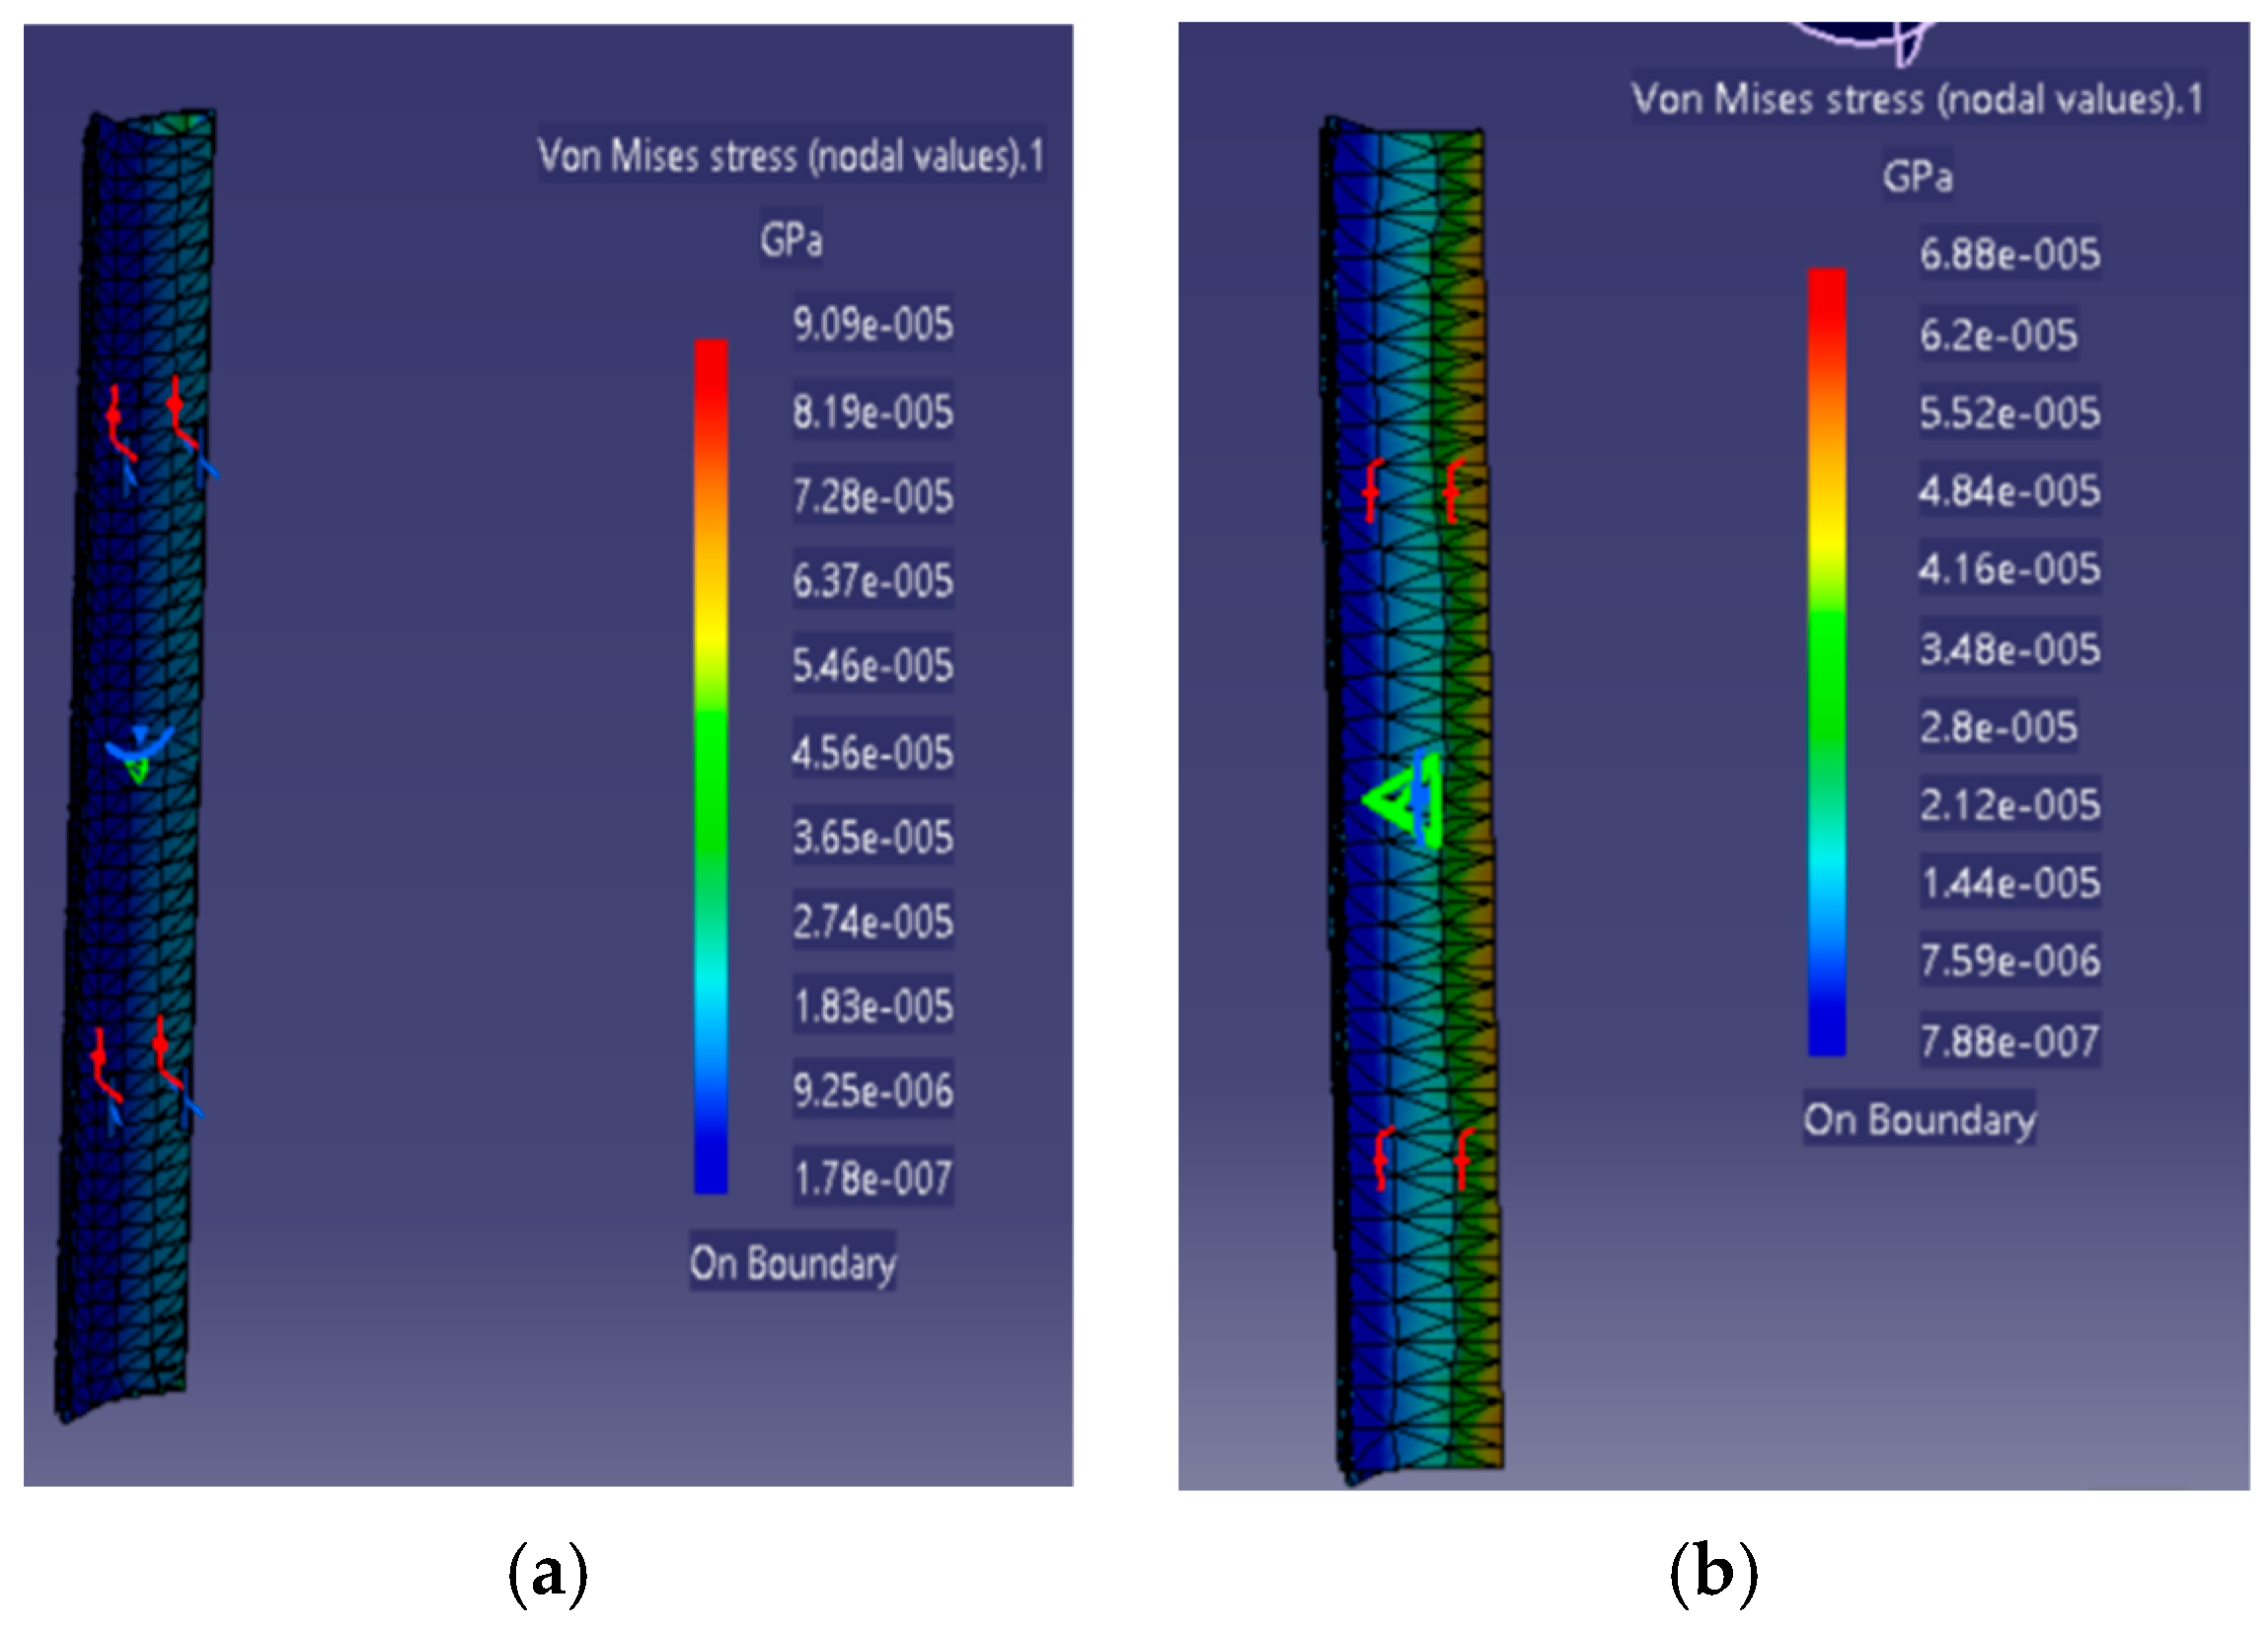
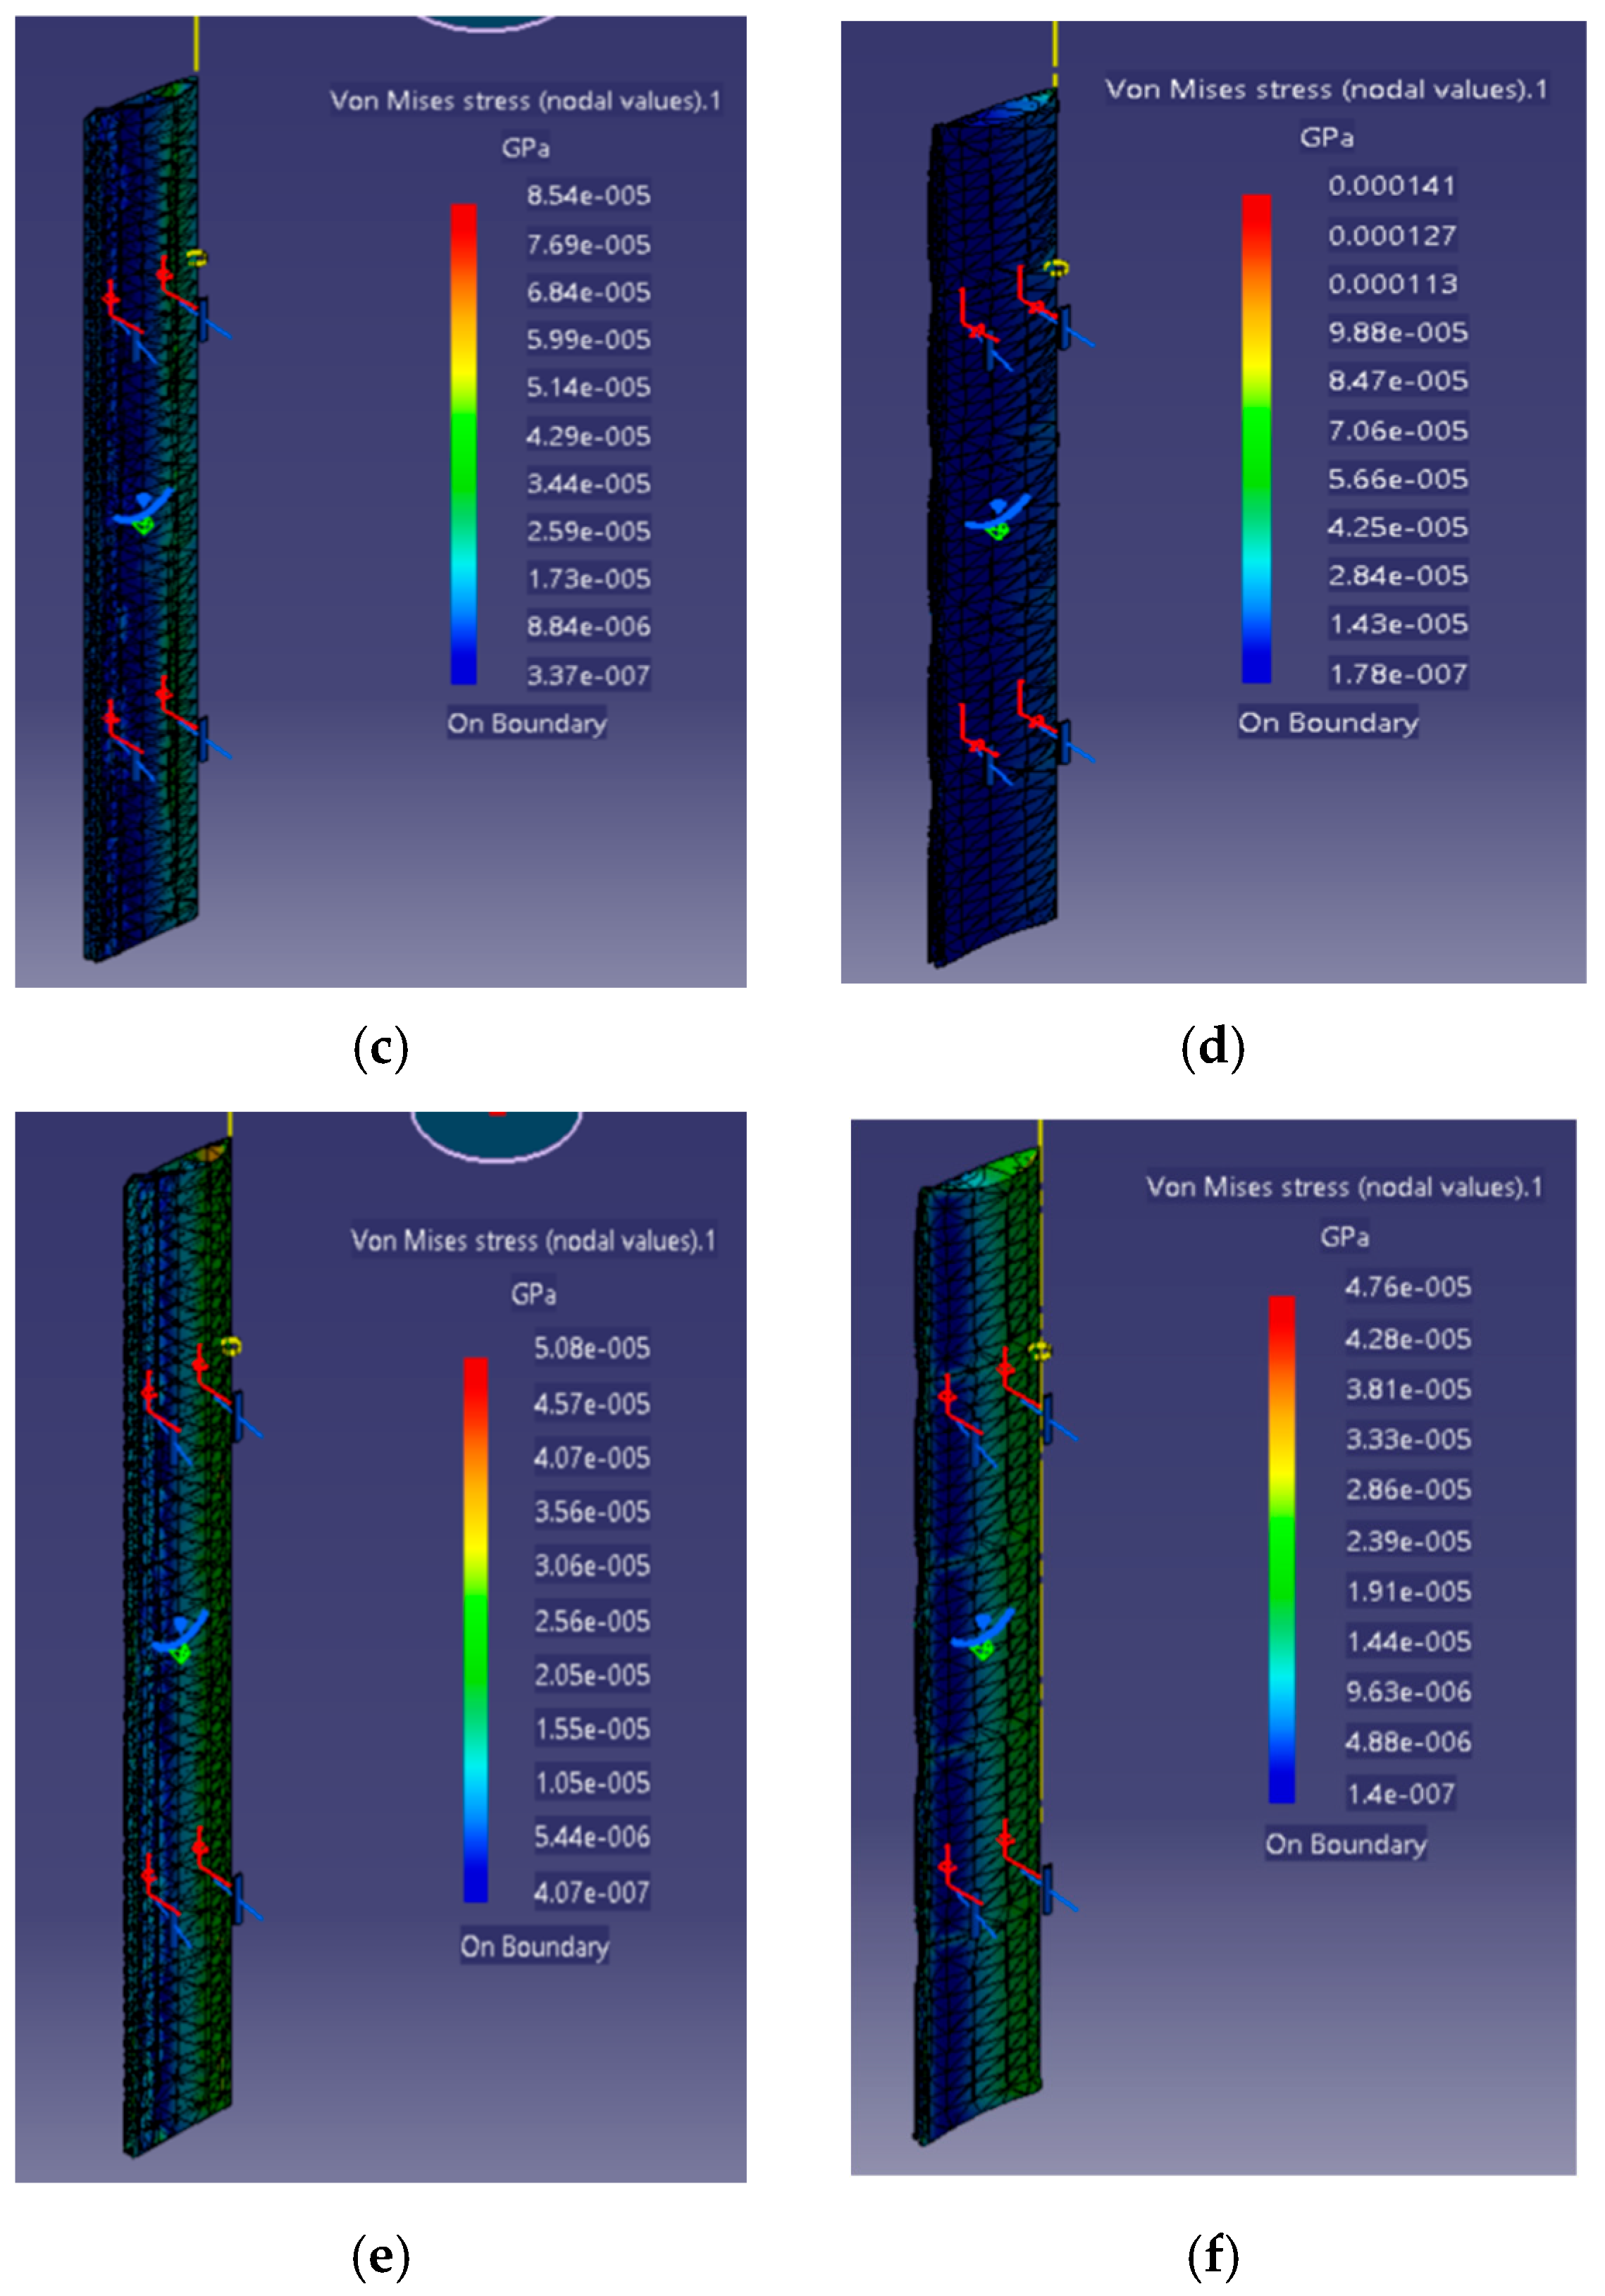
In this study, the distribution of Von Mises stress in the different blade configurations presented in Figure 7 was evaluated by using a finite element analysis (FEA) in CATIA. The blade geometry was meshed with an octree tetrahedral mesh in order to ensure correct stress prediction with a reasonable computational cost, and applies a rotational body force corresponding to the actual angular velocity of the turbine of 100 rpm with zero angular acceleration, which is a simulation of the centrifugal inertial loading of the blade under steady-state rotation as can be clearly seen in the simulation setup shown in the revised manuscript. This is a quasi-static rotational analysis, not a simple static load case, and accurately captures the dominant stress component centrifugal force that governs blade structural integrity during normal VAWT operation at the design wind speed. Nevertheless, we are fully aware that this approach does not account for the time-varying aerodynamic forces and fatigue loading induced by turbulent urban wind conditions. A complete transient fluid–structure interaction analysis would be necessary to evaluate dynamic fatigue life rigorously. As shown in Figure 8a, the first configuration has a mass of 12 kg and a maximum stress of 0.909 MPa, while the second configuration in Figure 8b has a higher mass of 18 kg, but a lower maximum stress of 0.688 MPa. The second configuration has a better distribution of stresses, but the first one is more suitable due to its lower weight and sufficient mechanical resistance. Figure 8c shows the third configuration, with a mass of 13 kg, presenting a maximum stress of 0.854 MPa, and a more uniform distribution. Figure 8d shows the fourth configuration, with a mass of 12.5 kg, reaching 1.41 MPa, compromising durability. Critical zones at the tips of the blades led to two more configurations. The fifth configuration in Figure 8e has a mass of 14.3 kg and a maximum stress of 0.508 MPa with a very uniform distribution, while the sixth configuration in Figure 8f has a mass of 14.1 kg and a maximum stress of 0.476 MPa but with a less uniform distribution, showing a trade-off between the weight, magnitude and distribution of stresses.
The third configuration was selected as the best solution after careful analysis of the six configurations, as it represents the best trade-off between lightness (13 kg) and mechanical strength with a maximum stress of 0.854 MPa, well below the aluminum yield strength (240 MPa). The blade structure is safe under the imposed rotational loading without any permanent deformation and good stress distribution and structural durability are attained. This leads to uniform stress distribution and enhanced durability avoiding permanent deformation and is an ideal choice for H-rotor wind turbine blades where structural performance and weight reduction are critical factors.

3.2. Results of 2D CFD Simulations

In this second set of results from the CFD simulation, the results of the distribution of pressure and velocity around the NACA airfoil for the different angles of attack studied are discussed. These visualizations allow a detailed analysis of the evolution of the flow field as a function of angle of attack.
In our previous work [30], we studied the pressure distribution over the NACA 0018 airfoil at angles of attack between 0° and 14°, and observed that at 10° a well-established low-pressure region is established on the upper surface while the lower surface is under relatively high pressure, with a large amount of lift being generated, and at the lower angles (2° to 6°) the lift is moderate and at the higher angles (12° to 14°) the flow starts to separate close to the trailing edge, suggesting that 10° is the best compromise between maximizing the lift coefficient and having a steady attached flow, and hence this was selected as the reference angle for the present work.
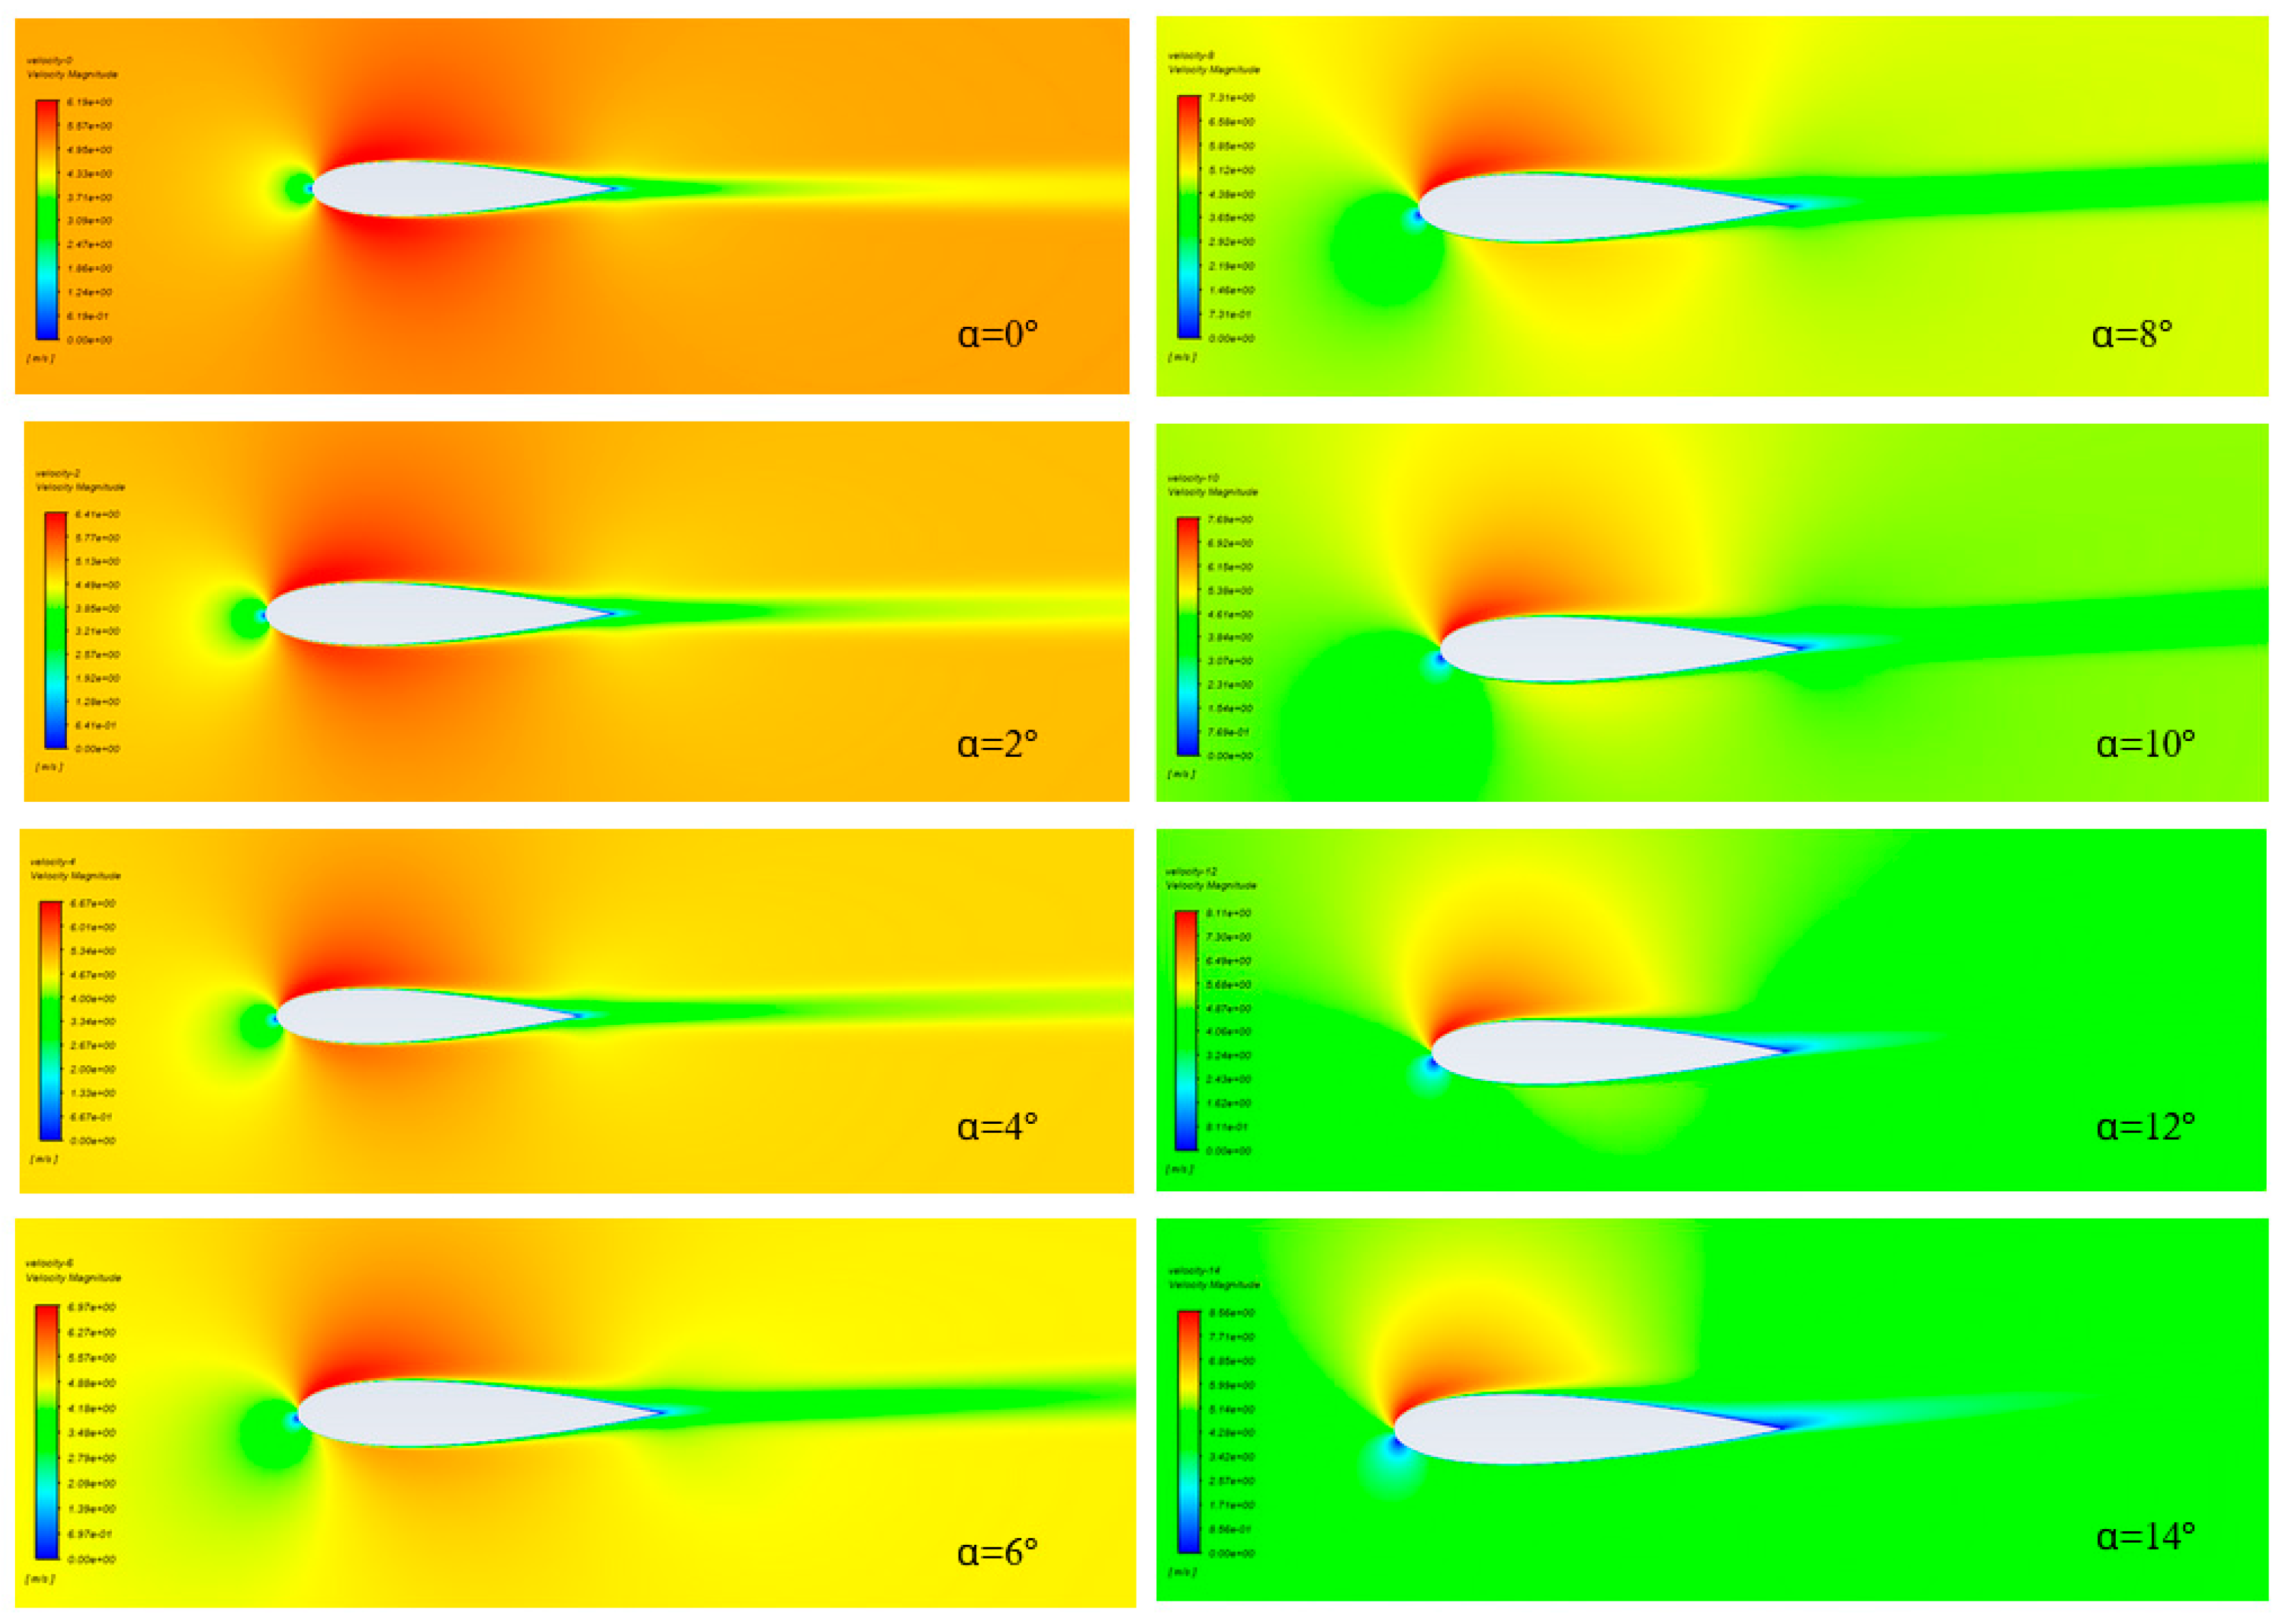
Based on these observations of the pressure field, the present study extends the analysis to the velocity field distribution around the same airfoil at the same operating conditions, as shown in Figure 9. The flow is completely symmetrical at 0° with moderate acceleration over both surfaces, but with an increasing angle of attack, the flow accelerates over the upper surface with increasing intensity, reaching maximum intensity at 8° and 10° where the lift generation is maximized with the boundary layer fully attached. At 10° the acceleration is optimum with no visible separation zone, confirming the aerodynamic efficiency found previously with the pressure analysis. For angles of attack larger than 12°, the development of flow disturbances is observed near the trailing edge, and at 14°, the inception of stall is clearly identified by the formation of a stagnation zone and a wake of detached flow, further confirming 10° as the reference configuration and assuring consistency between the pressure and velocity analyses for the entire range of angles studied.
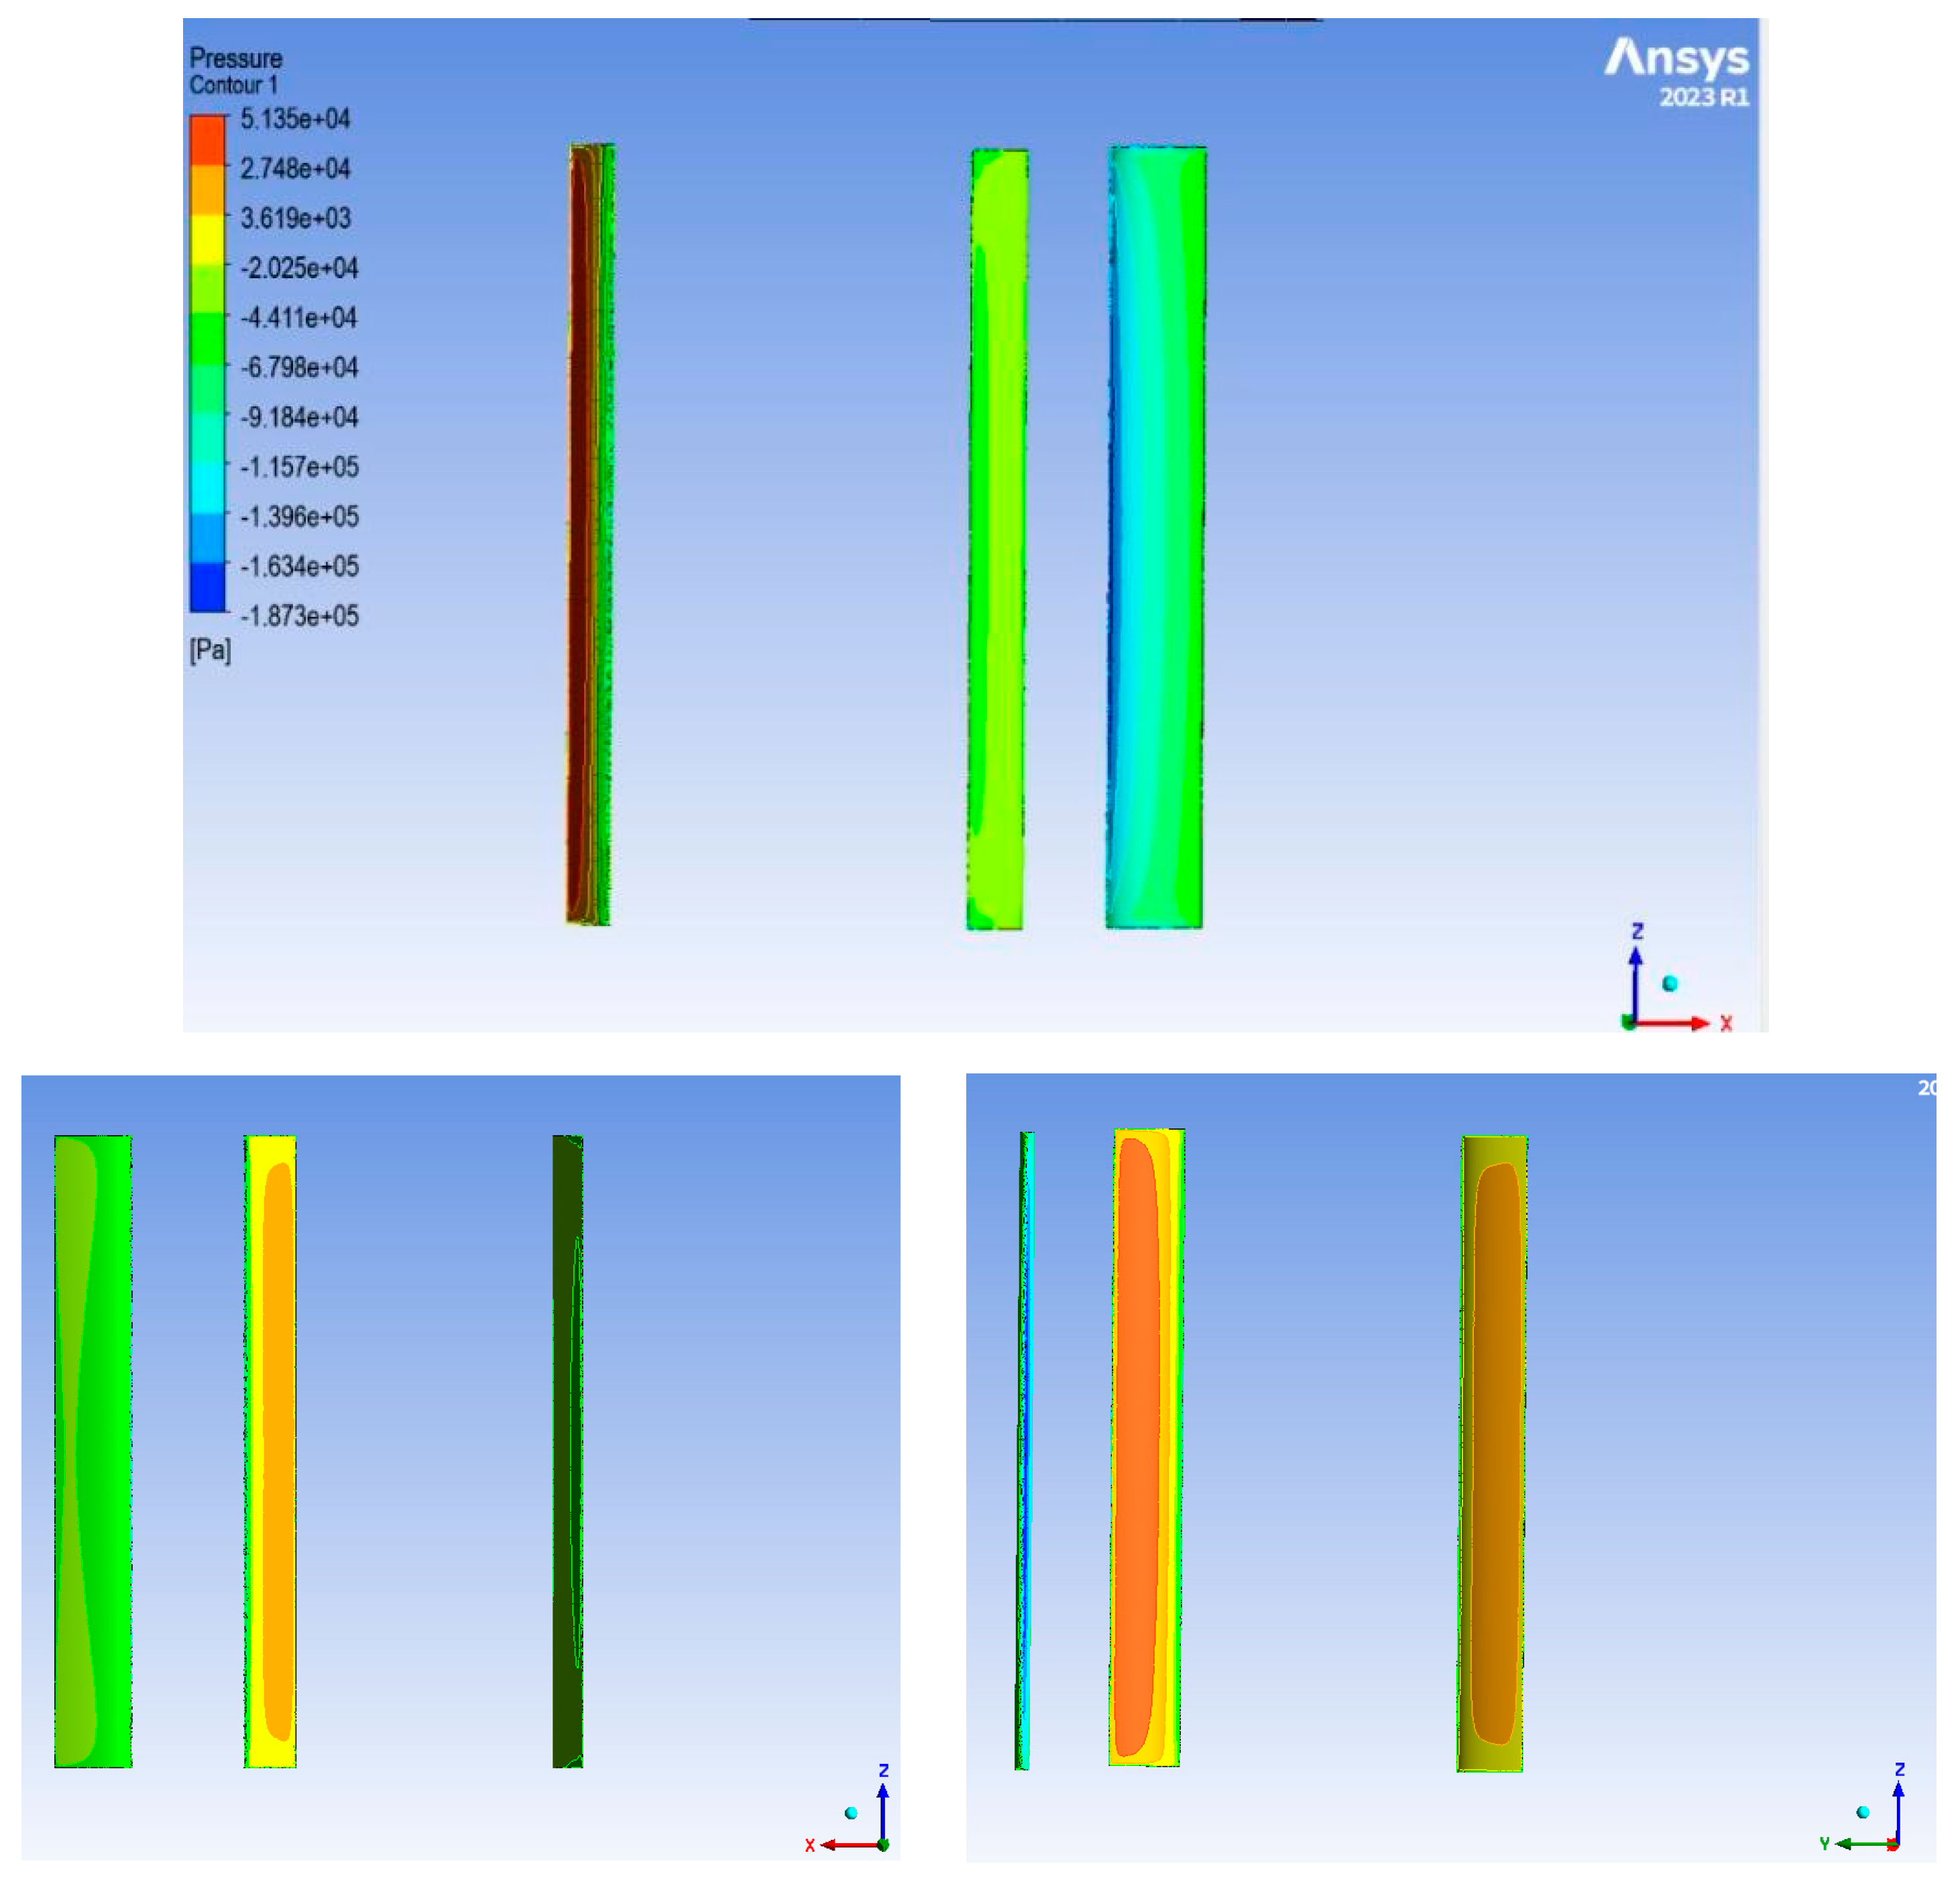
The pressure contours around the blades of the vertical axis wind turbine (VAWT) obtained from the CFD simulation results using ANSYS Fluent are shown in Figure 10. Two views are provided, corresponding to different visualization orientations, which allow for a detailed analysis of the pressure distribution on the blade surfaces. A high-pressure value from +5.13 × 10⁴ Pa can be seen in the red to yellow areas in different areas of the blade. The red to yellow areas are mostly located at the front of the blade, which faces the incoming wind, where the airflow slows down and there is overpressure, i.e., the stagnation region. In contrast, the blue zones show highly negative pressure values (up to −1.87 × 10⁵ Pa) which indicates a suction on the back face of the blade, and this suction leads to a lift creation and thus the needed torque for rotation. The asymmetry in pressure between the two blade surfaces is a characteristic of good aerodynamic behavior, confirming that the studied blade profile is able to efficiently convert the kinetic energy of the wind into mechanical energy and thus validating the chosen design in terms of aerodynamic performance and the physical consistency of the high- and low-pressure zones within this 3D simulation.
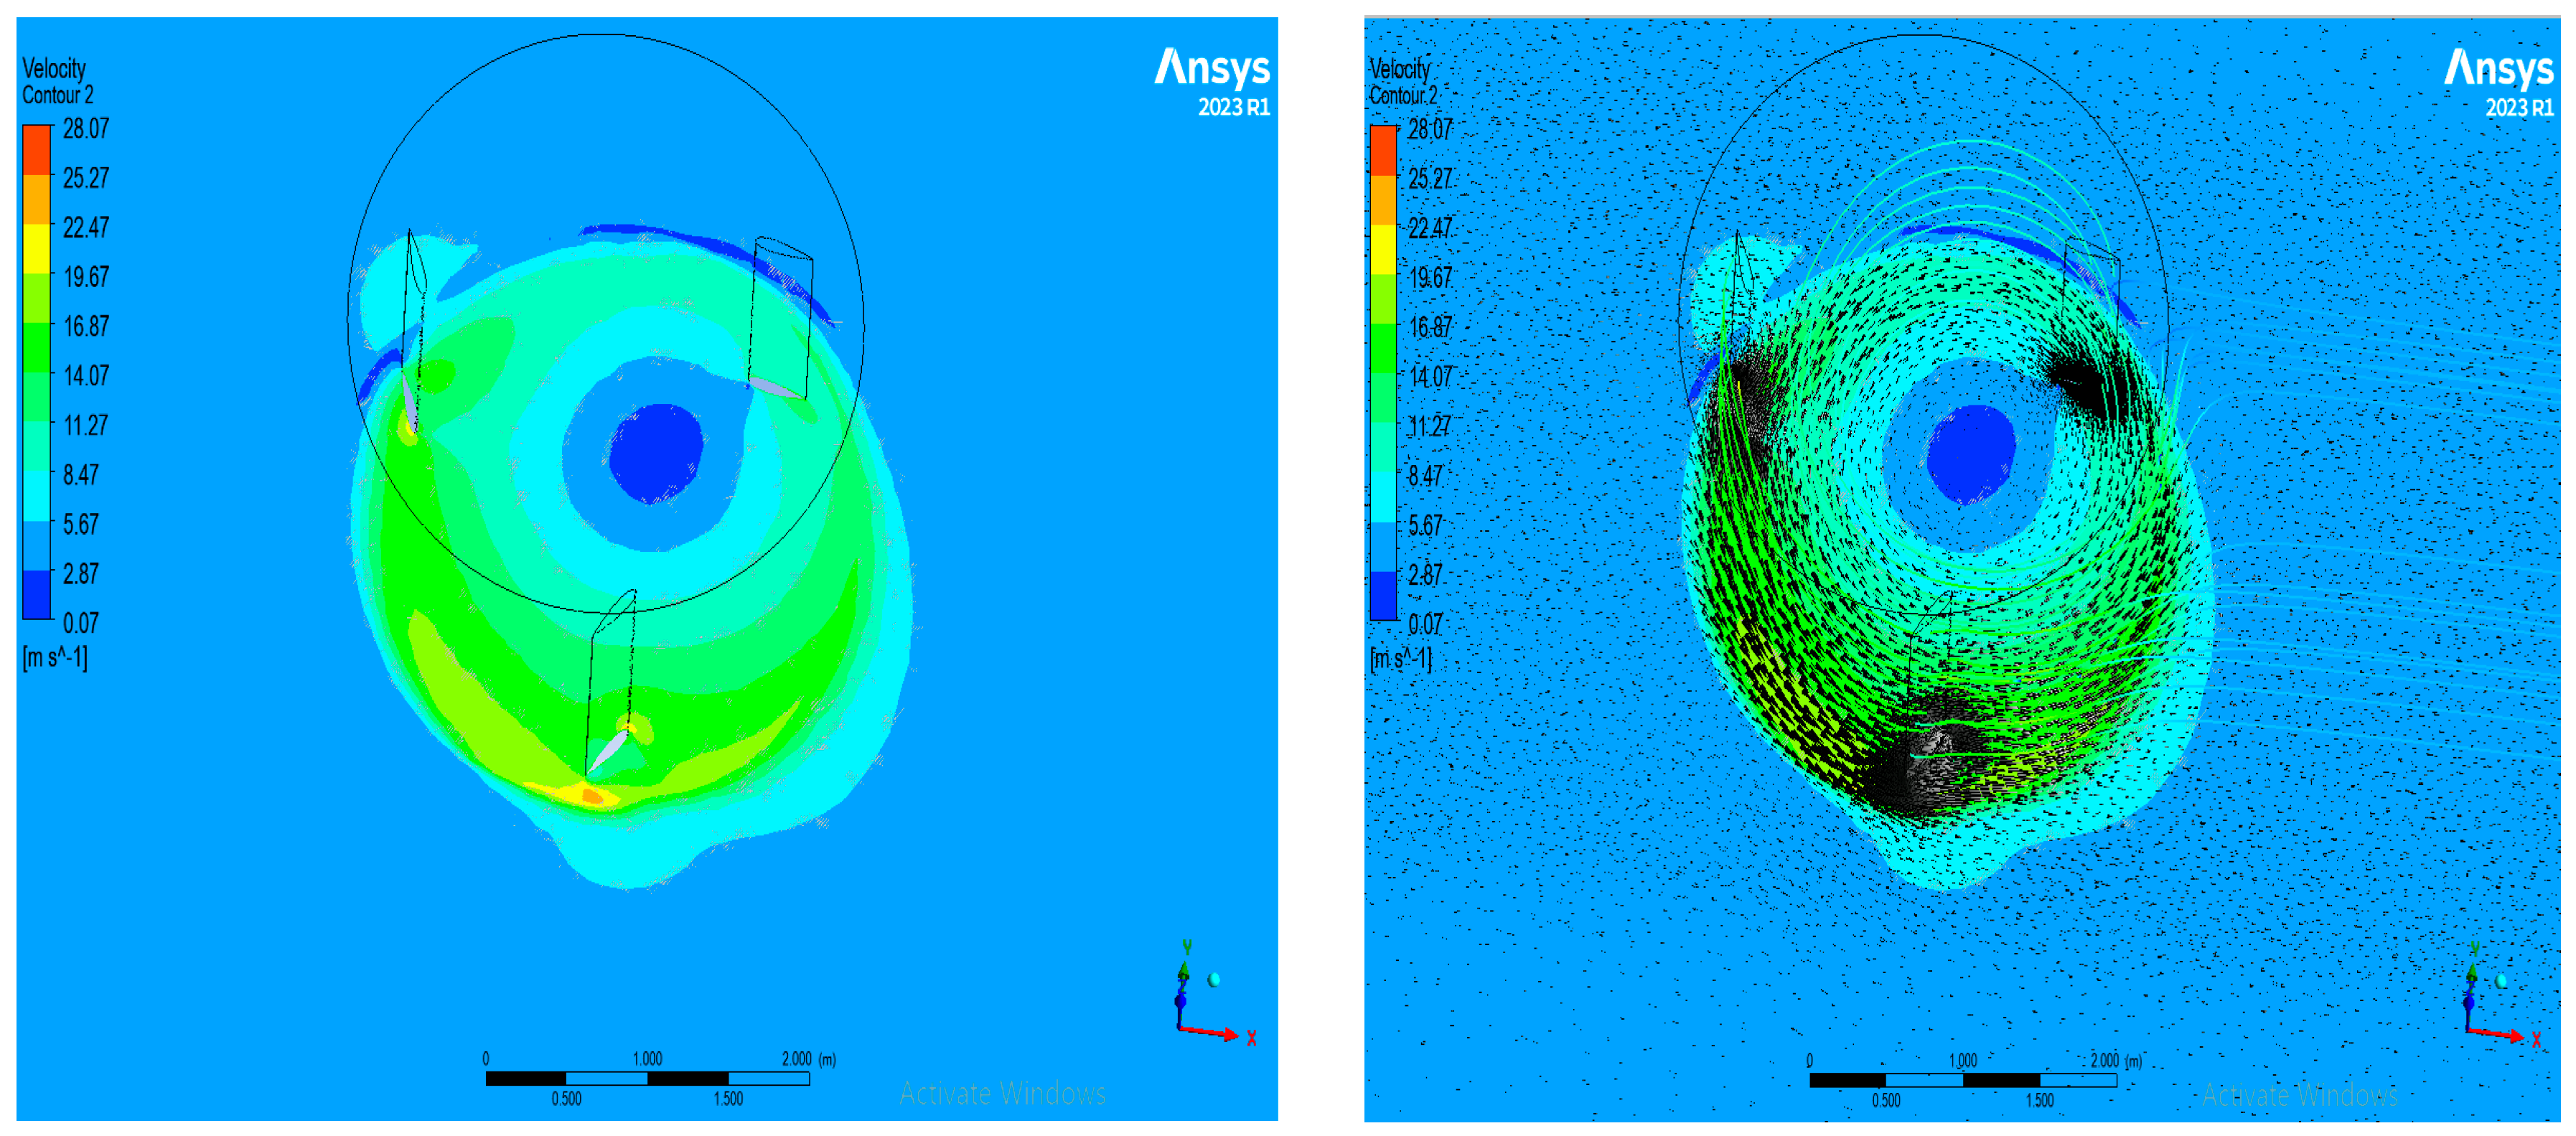
Figure 11 shows the velocity field distribution around the blades of the VAWT obtained from CFD simulations. The upper part shows the velocity contours in m/s and the lower part shows the velocity vectors showing the direction and magnitude of the airflow in the computational domain, in the right image, the black circles indicate the rotor swept area, within which the blades rotate during the CFD simulation. Low velocities (blue) are observed within the rotating domain, especially behind the blades, which corresponds to the wake region where the energy extraction causes a decrease in the fluid velocity. High velocities (red and yellow) are observed in the outer regions where the flow is less disturbed and keeps high kinetic energy. The velocity vectors clearly show the deflection of the flow around the blades and the formation of vortices in the wake region, which are characteristic of the unsteady aerodynamic behavior of the VAWTs and contribute to the generation of lift and drag forces. The results emphasize the importance of fluid–structure interaction in the blade design and confirm the ability of the studied configuration to drive the flow to generate useful torque.
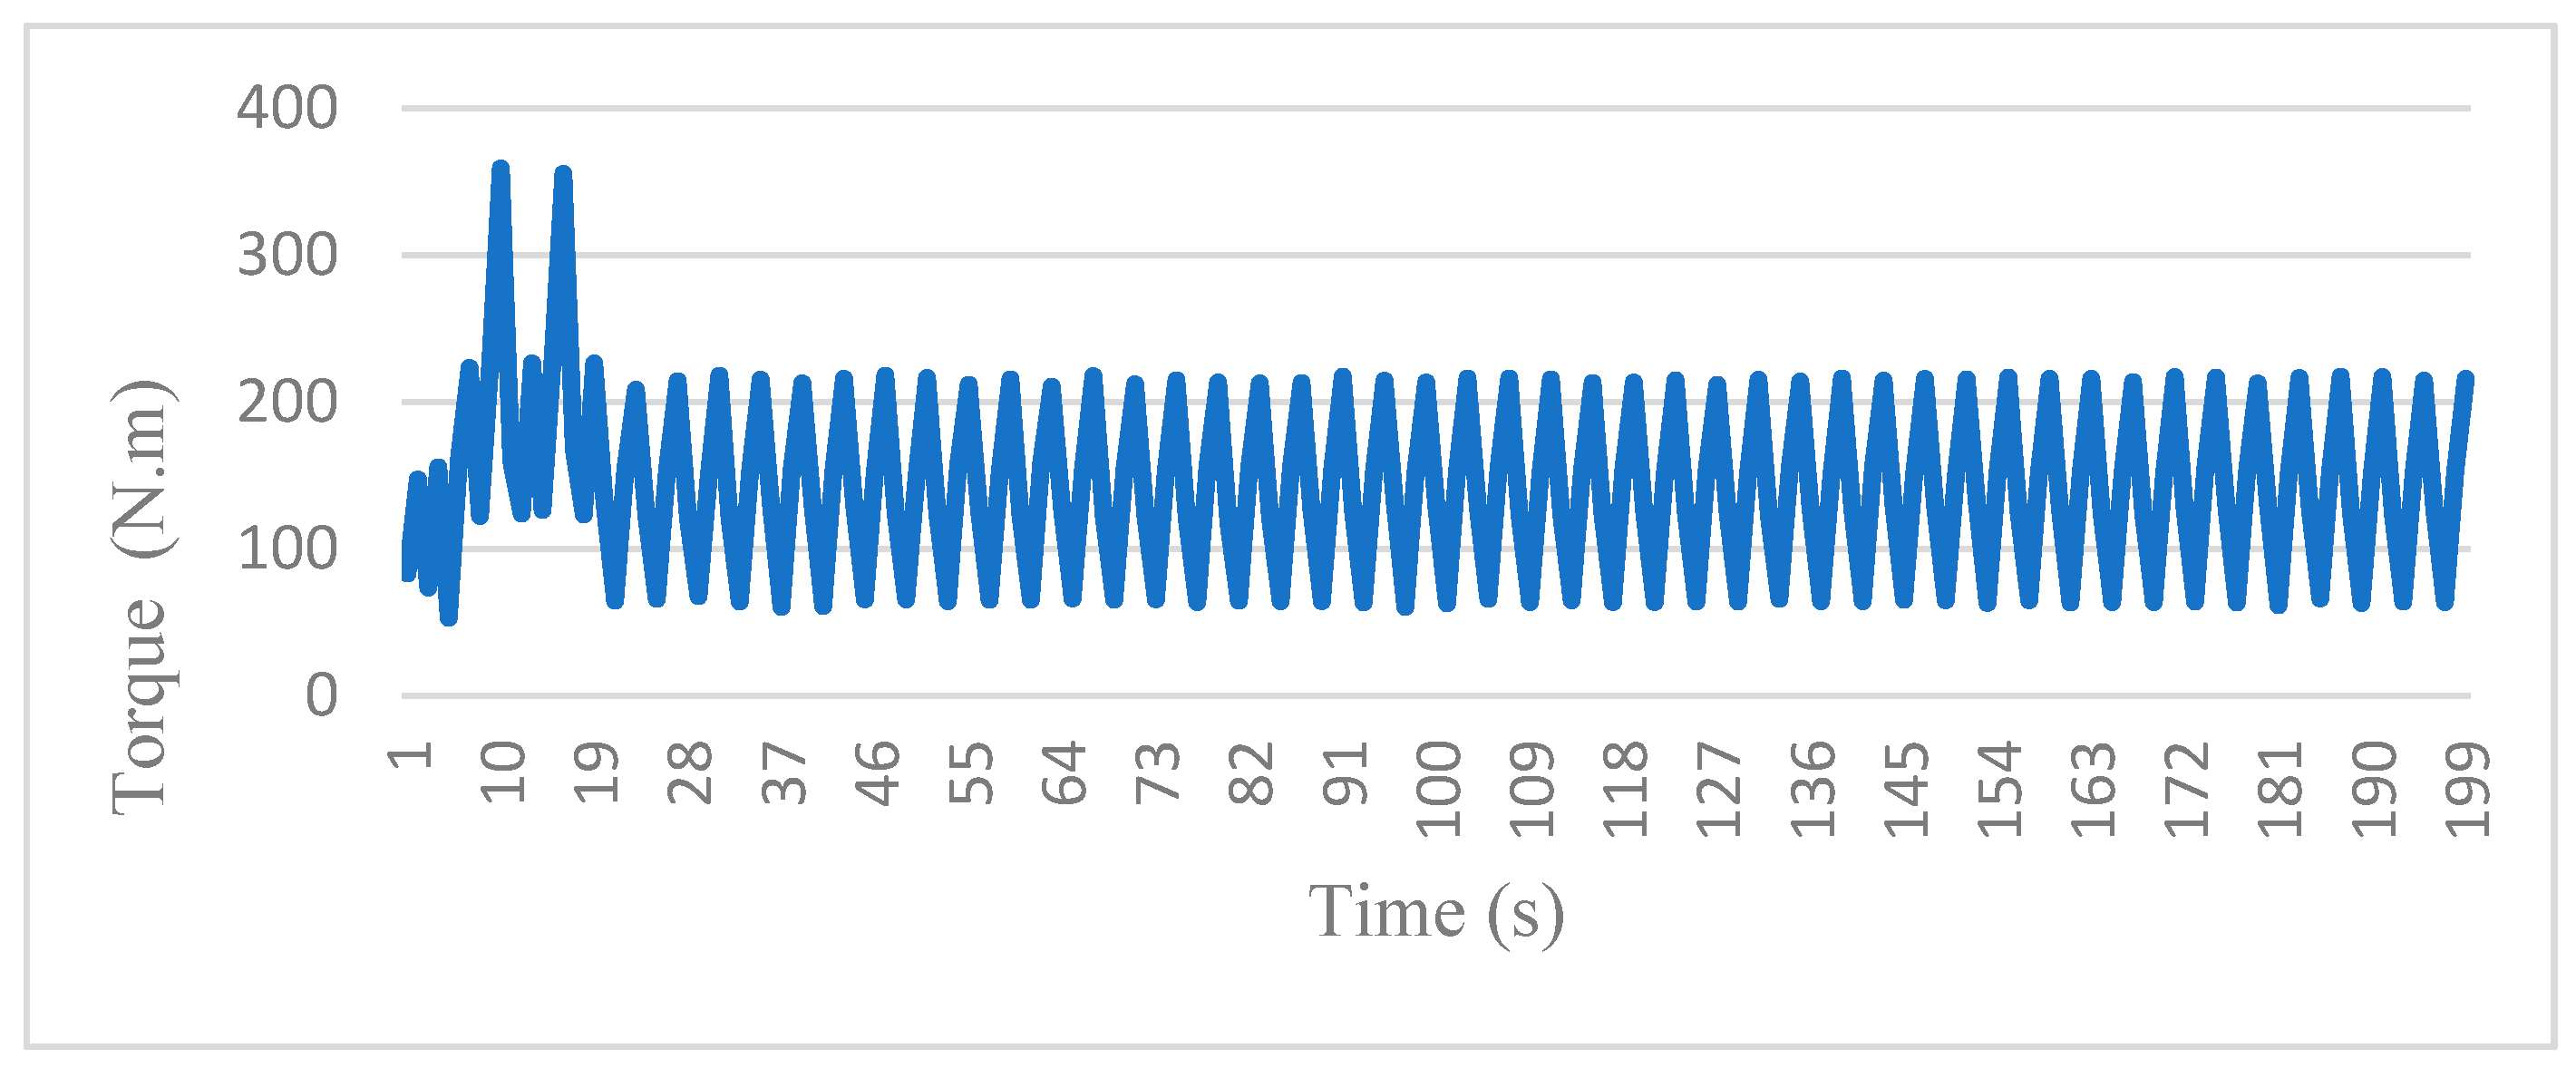
Another result obtained from the simulation is the variation in the torque in the function of time, see Figure 12. The torque is periodic with a minimum value of approximately 60 N.m and a maximum of approximately 220 N.m. With these minimum and maximum torque values, the related extreme powers (Pmin and Pmax) and the respective power coefficients (Cp) were calculated. The results presented in Table 4 show that C reaches a value around 0.39 at maximum torque, which is an excellent efficiency for a Darrieus-type vertical axis wind turbine.
The power coefficient obtained from the CFD simulations, Cp ≈ 0.40, represents approximately 65.1% of the theoretical Betz limit of Cp,Betz = 16/27 ≈ 0.593, which is a realistic and physically consistent value for a lift-driven H-Darrieus VAWT of this solidity and configuration. The reported Cp value was extracted by averaging the instantaneous power coefficient over the final rotor revolutions of the transient simulation, after the flow field had reached a periodic steady state, ensuring that the reported value reflects the true time-averaged aerodynamic performance of the turbine.

4. Conclusions and Perspectives

This project resulted in the design and optimization of a 2 kW H-rotor vertical axis wind turbine by a combined theoretical, numerical and urban-constraint-aware approach. Aerodynamic analysis identified the key performance parameters, supported by a local wind resource assessment to confirm site feasibility. The last configuration was selected based on QBlade simulations: a three-bladed turbine with a NACA 0018 profile, 3 m rotor height, 2.4 m diameter and 0.37 m chord length, which has the ability to self-start at wind speeds as low as 1.3 m/s, a key advantage for urban deployment. The structural analysis performed with CATIA made it possible to validate the choice of an aluminum blade assembly of thickness 4 mm with four supports of 2 mm, for a total weight of 13 kg, as an optimum compromise between mechanical strength and weight, with a stress level far below the elastic limit of the material. The results indicated stresses well below yield strength. Two-dimensional CFD simulations found an optimum attack angle of 10° corresponding to the maximum lift/drag ratio. Three-dimensional transient simulations of the entire turbine showed a controlled unsteady flow behavior, a favorable pressure and velocity distribution and a power coefficient Cp close to 0.4, validating the aerodynamic efficiency of the chosen geometry. While a Cp value of 0.40 is consistent with previously reported values for H-Darrieus rotors of comparable size, the novelty of the present work does not lie primarily in surpassing this aerodynamic threshold but rather in three specific contributions that distinguish it from prior studies. Future work will aim at validating an experimental prototype in urban environments and assessing its acoustic impact. The results overall confirm the robustness of the adopted methodology and provide a solid basis for the development of reliable high-performance urban wind turbines suitable to face the current energy challenges.

Author Contributions

Conceptualization, A.E.H., A.C. and F.B.; Methodology, A.E.H., A.C. and F.B.; Software, A.E.H., A.C. and F.B.; Validation, A.C. and F.B.; Formal analysis, A.E.H.; Investigation, A.E.H.; Resources, A.C. and F.B.; Writing—original draft, A.E.H.; Writing—review & editing, A.C. and F.B.; Visualization, A.E.H. and F.B.; Supervision, A.C. and F.B.; Project administration, A.C. and F.B. All authors have read and agreed to the published version of the manuscript.

Funding

This research received no external funding.

Data Availability Statement

The original contributions presented in this study are included in the article. Further inquiries can be directed to the corresponding author.

Conflicts of Interest

The authors declare no conflict of interest.

Abbreviations

The following abbreviations are used in this manuscript:
VAWTVertical axis wind turbine
HAWTHorizontal axis wind turbine
CFDComputational fluid dynamics
ReReynolds number
TSRTip speed ratio
CpPower coefficient
ClLift coefficient
CdDrag coefficient
L/DLift-to-drag ratio
FEAFinite element analysis
SSTShear stress transport
NACANational Advisory Committee for Aeronautics
AoAAngle of attack

References

  1. Abdolahifar, A.; Zanj, A. Addressing VAWT aerodynamic challenges as the key to unlocking their potential in the wind energy sector. Energies 2024, 17, 5052. [Google Scholar] [CrossRef] [Scilit]
  2. Bošnjaković, M.; Santa, R.; Topić Božič, J.; Muhič, S. The future of vertical-axis wind turbines: Opportunities, challenges, and sustainability perspectives. Energies 2025, 18, 6369. [Google Scholar] [CrossRef] [Scilit]
  3. Gallegos-Molina, J.-S.; Chavero-Navarrete, E. A Systematic Review of Technological Strategies to Improve Self-Starting in H-Type Darrieus VAWT. Sustainability 2025, 17, 7878. [Google Scholar] [CrossRef] [Scilit]
  4. Fertahi, S.; Rehman, S.; Benini, E.; Lahrech, K. Insights from the last decade in CFD design and performance enhancement of Darrieus wind turbines. Processes 2025, 13, 370. [Google Scholar] [CrossRef] [Scilit]
  5. Rezaeiha, A.; Montazeri, H.; Blocken, B. Towards optimal aerodynamic design of vertical axis wind turbines: Impact of solidity and number of blades. Energy 2018, 165, 1129–1148. [Google Scholar] [CrossRef] [Scilit]
  6. Michna, J.; Rogowski, K. A refined approach for angle of attack estimation and dynamic force hysteresis in H-type Darrieus wind turbines. Energies 2024, 17, 6264. [Google Scholar] [CrossRef] [Scilit]
  7. Didane, D.H.; Rosly, N.; Zulkafli, M.F.; Shamsudin, S.S. Numerical investigation of a novel contra-rotating vertical axis wind turbine. Sustain. Energy Technol. Assess. 2019, 31, 43–53. [Google Scholar] [CrossRef] [Scilit]
  8. Qasemi, K.; Azadani, L.N. Optimization of the power output of a vertical axis wind turbine augmented with a flat plate deflector. Energy 2020, 202, 117745. [Google Scholar] [CrossRef] [Scilit]
  9. Wong, K.H.; Chong, W.T.; Poh, S.C.; Shiah, Y.C.; Sukiman, N.L.; Wang, C.T. 3D CFD simulation and parametric study of a flat plate deflector for vertical axis wind turbine. Renew. Energy 2018, 129, 32–55. [Google Scholar] [CrossRef] [Scilit]
  10. Ansaf, R.; Abdelhameed, H.S.; Hashem, I.; Harun, Z. Efficiency-based design optimization of the H-type Darrieus wind turbine with fixed guiding-walls. Energy Rep. 2023, 9, 3576–3592. [Google Scholar] [CrossRef] [Scilit]
  11. Sanaye, S.; Farvizi, A. Optimizing a vertical axis wind turbine with helical blades: Application of 3D CFD and Taguchi method. Energy Rep. 2024, 12, 2527–2547. [Google Scholar] [CrossRef] [Scilit]
  12. Abdallah, A.; William, M.A.; Moharram, N.A.; Zidane, I.F. Boosting H-Darrieus vertical axis wind turbine performance: A CFD investigation of J-blade aerodynamics. Results Eng. 2025, 26, 104679. [Google Scholar] [CrossRef] [Scilit]
  13. Celik, Y.; Ingham, D.; Ma, L.; Pourkashanian, M. Design and aerodynamic performance analyses of the self-starting H-type VAWT having J-shaped aerofoils considering various design parameters using CFD. Energy 2022, 251, 123881. [Google Scholar] [CrossRef] [Scilit]
  14. Miller, M.A.; Duvvuri, S.; Hultmark, M. Solidity effects on the performance of vertical-axis wind turbines. Flow 2021, 1, E9. [Google Scholar] [CrossRef] [Scilit]
  15. Li, X.; Yang, K.; Bai, J.; Xu, J. Study on the pitch angle effect on the power coefficient and blade fatigue load of a vertical axis wind turbine. Energies 2023, 16, 7279. [Google Scholar] [CrossRef] [Scilit]
  16. Chen, W.H.; Wang, Y.S.; Chang, M.H.; Show, P.L.; Hoang, A.T. Operation parameter interaction and optimization of vertical axis wind turbine analyzed by Taguchi method with modified additive model and ANOVA. Energy Rep. 2024, 11, 5189–5200. [Google Scholar] [CrossRef] [Scilit]
  17. Ghafoorian, F.; Hosseini Rad, S.; Moghimi, M. Enhancing self-starting capability and efficiency of hybrid Darrieus–Savonius vertical axis wind turbines with a dual-shaft configuration. Machines 2025, 13, 87. [Google Scholar] [CrossRef] [Scilit]
  18. Alexander, A.S.; Santhanakrishnan, A. Mechanisms of power augmentation in two side-by-side vertical axis wind turbines. Renew. Energy 2020, 148, 600–610. [Google Scholar] [CrossRef] [Scilit]
  19. Khedr, A.; Castellani, F. Critical issues in the CFD simulation of small horizontal axis wind turbines. Energy Convers. Manag. 2024, 22, 100551. [Google Scholar] [CrossRef] [Scilit]
  20. Hameed, M.S.; Afaq, S.K. Finite element analysis of a composite VAWT blade. Ocean Eng. 2015, 109, 669–676. [Google Scholar] [CrossRef] [Scilit]
  21. Abhinaya, V.; Kumar, G.G. A comprehensive review on H-type Darrieus wind turbine: Aerodynamics, blade profile, CFD simulations. J. Eng. Appl. Sci. 2026, 73, 106. [Google Scholar] [CrossRef] [Scilit]
  22. Jang, H.; Hwang, Y.; Paek, I.; Lim, S. Performance evaluation and validation of H-Darrieus small vertical axis wind turbine. Int. J. Precis. Eng. Manuf. Green Technol. 2021, 8, 1687–1697. [Google Scholar] [CrossRef] [Scilit]
  23. Salvador-Gutiérrez, B.; Sanchez-Cortez, L.; Hinojosa-Manrique, M.; Lozada-Pedraza, A.; Ninaquispe-Soto, M. Vertical-axis wind turbines in emerging energy applications (1979–2025): Global trends and technological gaps revealed by a bibliometric analysis and review. Energies 2025, 18, 3810. [Google Scholar] [CrossRef] [Scilit]
  24. Zhao, Z.; Wang, D.; Wang, T.; Shen, W.; Liu, H.; Chen, M. A review: Approaches for aerodynamic performance improvement of lift-type vertical axis wind turbine. Sustain. Energy Technol. Assess. 2022, 49, 101789. [Google Scholar] [CrossRef] [Scilit]
  25. Díaz, A.; Moya, I. Urban wind energy with resilience approach. Renew. Sustain. Energy Rev. 2024, 199, 114525. [Google Scholar] [CrossRef] [Scilit]
  26. Bangga, G. Performance analysis of a H-Darrieus wind turbine for a series of 4-digit NACA airfoils. Energies 2020, 13, 3196. [Google Scholar] [CrossRef] [Scilit]
  27. Gerrie, C.; Islam, S.Z.; Gerrie, S.; Turner, N.; Asim, T. 3D CFD modelling of performance of a vertical axis turbine. Energies 2023, 16, 1144. [Google Scholar] [CrossRef] [Scilit]
  28. Akash, M.A.H.; Hossain, M.S.; Hossain, M.M.; Islam, M.N. Design optimization and performance evaluation of a 3D-printed Archimedes spiral wind turbine for renewable energy generation in Bangladesh. Energy Rep. 2026, 15, 109125. [Google Scholar] [CrossRef] [Scilit]
  29. Calautit, K.; Johnstone, C. Investigation of the integration of an oscillating aerofoil-based energy harvester into the building roof. Energy Rep. 2024, 11, 4080–4095. [Google Scholar] [CrossRef] [Scilit]
  30. El Hammoumi, A.; Chorak, A.; Bahraoui, F. Aerodynamic design and optimization of a Darrieus H-rotor wind turbine: Structural analysis and performance optimization. EPJ Web Conf. 2026, 369, 01004. [Google Scholar] [CrossRef] [Scilit]
  31. Liang, Y.; Zhang, L.; Li, E.; Liu, X.; Yang, Y. Design considerations of rotor configuration for straight-bladed vertical axis wind turbines. Adv. Mech. Eng. 2014, 6, 534906. [Google Scholar] [CrossRef] [Scilit]
  32. Maalouly, M.; Souaiby, M.; ElCheikh, A.; Issa, J.S.; Elkhoury, M. Transient analysis of H-type vertical axis wind turbines using CFD. Energy Rep. 2022, 8, 4570–4588. [Google Scholar] [CrossRef] [Scilit]
  33. Zamani, M.; Maghrebi, M.J.; Varedi, S.R. Starting torque improvement using J-shaped straight-bladed Darrieus vertical axis wind turbine by means of numerical simulation. Renew. Energy 2016, 95, 109–126. [Google Scholar] [CrossRef] [Scilit]
  34. Muñoz-Reja, M.; Salinas-Casanova, D.A.; Chica-Arrieta, E.L. Vorticity and Its Relationship to Vortex Separation, Dynamic Stall, and Performance, in an H-Darrieus Vertical-Axis Wind Turbine Using CFD Simulations. Processes 2024, 12, 1556. [Google Scholar] [CrossRef] [Scilit]
  35. Baca, G.; Santos, G.; Salviano, L. Range-Wide Aerodynamic Optimization of Darrieus Vertical Axis Wind Turbines Using CFD and Surrogate Models. Wind 2026, 6, 2. [Google Scholar] [CrossRef] [Scilit]
Figure 1. Flowchart of the design methodology adopted.
Energies 19 04035 g001
Figure 2. Weibull distribution.
Energies 19 04035 g002
Figure 3. The wind rose of the installation site. Note: The wind data employed in this section were collected from the meteorological station at Tangier Ibn Battouta Airport (Tangier, Morocco) the nearest official measurement station to the industrial zone.
Energies 19 04035 g003
Figure 4. Comparison of the aerodynamic efficiency of NACA 0015 and NACA 0018 airfoils.
Energies 19 04035 g004
Figure 5. Cp and power curves for H = 3 m, D = 2.4 m, and a chord length of 0.37 m. (The colored curves represent the power of the turbine at different tip speed ratios (TSRs). The pink curve corresponds to the selected design with the optimum TSR = 2.5).
Energies 19 04035 g005
Figure 6. Computational domain of the wind turbine blades in ANSYS Fluent.
Energies 19 04035 g006
Figure 7. Surface (a) and volume (b) mesh results in ANSYS Fluent.
Energies 19 04035 g007
Figure 8. Von Mises stress distribution (in GPa) of (a) configuration 1; (b) configuration 2; (c) configuration 3; (d) configuration 4; (e) configuration 5; (f) configuration 6. The yellow circle indicates the axis of rotation and red arrows indicate the direction of the rotation and the green triangle denotes the probe location.
Energies 19 04035 g008aEnergies 19 04035 g008b
Figure 9. Velocity distribution around the NACA airfoil for different angles of attack.
Energies 19 04035 g009
Figure 10. Pressure distribution around the blades.
Energies 19 04035 g010
Figure 11. CFD analysis of the flow around the wind turbine: velocity distribution and flow directions.
Energies 19 04035 g011
Figure 12. Torque as a function of time.
Energies 19 04035 g012
Table 1. Chord length as a function of solidity.
Solidityc (m)ReCp (max)Pmax (W)
0.100.2513194,2370.442510
0.130.3267252,5090.432450
0.150.3768291,3560.422400
0.170.4272330,2040.412340
0.200.5024388,4750.382200
0.230.5778446,7460.372150
0.250.6280485,5940.362100
Table 2. Theoretical maximum power output for different dimensional configurations.
H (m)D (m)A (m2)Cp (max)Pmax (W)Configuration Type
2.5250.41630.475Configurations compliant with company requirements
2.52.460.41956.57Configurations compliant with company requirements
32.47.20.42347.884Configuration recommended by our team
3.32.89.20.43013.1178Configurations targeting power outputs above 3 kW
3.5310.50.43423.9975Configurations targeting power outputs above 3 kW
Table 3. Description of the different configurations.
CaseConfigurationThicknessInternal SupportsAnchor ReinforcementMass (kg)
1Blade 4 mm4 mm12
2Blade 6 mm6 mm18
3Blade 4 mm + 4 vertical supports of 2 mm4 mm4 × (2 mm × [58, 64, 58, 42] mm × 3 m)13
4Blade 4 mm + 4 NACA0018 supports4 mm4 × (2 mm × 370 mm × 66 mm)12.5
5Configuration 3 + reinforcement4 mm3 × (2 mm × [58, 64, 58] mm × 3 m)1 × (8 mm × 24 mm × 3 m)14.3
6Configuration 4 + reinforcement4 mm4 × (2 mm × 370 mm × 66 mm)1 × (8 mm × 24 mm × 3 m)14.1
Table 4. Wind power, turbine power, and power coefficient (Cp).
P Wind (W)T (N.m)ω (rad/s)Pturbine (W)Cp
Max5869.71220.0010.422291.670.39
Min952.5660.005.00300.000.31
Disclaimer/Publisher’s Note: The statements, opinions and data contained in all publications are solely those of the individual author(s) and contributor(s) and not of MDPI and/or the editor(s). MDPI and/or the editor(s) disclaim responsibility for any injury to people or property resulting from any ideas, methods, instructions or products referred to in the content.