


Abstract
Urban energy transition requires the deployment of clean energy alongside technologies that lower the carbon intensity of urban economic activity. Yet the effect of climate-smart technology may change with the stage of technology diffusion. Using city-level data from 282 Chinese cities between 2010 and 2019, this study uses carbon emission intensity as an inverse indicator of urban energy transition, and tests whether climate-smart technology affects it linearly or in a stage-dependent manner. This study employs a fixed-effects specification, supplemented by exploratory channel and heterogeneity analyses. The results show a stage-dependent relationship with a turning point of 3.35, which lies 0.44 standard deviations below the mean. This indicates that while climate-smart technology constrains urban energy transition at low levels, it can facilitate transition once past this threshold, and positive effects prevail for most observations in our sample. The channel analyses suggest that energy intensity and climate attention may represent potential pathways associated with this shift. The heterogeneity results show that the non-linear pattern is more evident in non-resource-dependent cities and in cities excluded from the “Broadband China” pilot programme. These findings suggest that climate-smart technology supports the energy transition when digital diffusion is coordinated with energy efficiency improvements, cleaner infrastructure operations, and more precise environmental governance.
1. Introduction
The energy transition is now closely linked to climate governance, energy security, and sustainable economic development [1]. Shifting away from fossil fuels requires cleaner, more efficient energy systems, along with adjustments in industrial structure, corporate behaviour, public policy, and urban governance [2,3]. Under the Paris Agreement, reducing carbon emission intensity and improving energy efficiency have become important policy objectives for many economies [4,5]. For China, this issue is especially important, because cities are the main spaces where industrial activity, energy consumption, and carbon emissions are concentrated [6,7]. China’s rapid urbanisation and industrialisation have increased the pressure on urban energy systems. Energy demand remains high in many cities, while carbon-reduction targets require a faster shift towards cleaner energy use, more efficient production, and stronger environmental governance [8,9]. The energy transition therefore requires more than expanding renewable energy capacity. It also depends on whether cities can improve energy allocation, reduce energy waste, and guide companies toward low-carbon production [10]. This creates a clear need to discuss the economic and policy conditions under which technological progress contributes to urban energy transition.
Climate-smart technology offers a potential pathway for this transition. It refers to a set of technologies that integrate climate risk response, energy efficiency improvements, clean energy development, and intelligent management [11,12]. In urban energy systems, climate-smart technologies can be applied to energy-saving equipment, smart energy management, carbon-emission monitoring, predictive maintenance, and renewable energy control [13,14]. By improving energy information, system coordination, and renewable energy utilisation, these applications can strengthen the technical basis for the urban energy transition [15,16]. For this reason, climate-smart technology is tied to the urban energy transition. This technology affects the technical operation of energy systems and the way cities govern them [17]. In China, recent policy has placed this technology within the same agenda as energy reform. The Energy Development Strategy Action Plan, issued in 2014, outlined measures to adjust the energy structure [18]. The Made in China 2025 Strategy, launched in 2015, promoted intelligent manufacturing and digital transformation in high-energy-demand sectors [19]. The 2020 carbon-neutrality commitment gave climate-related technologies in the energy sector greater policy weight [20]. Taken together, these policies indicate that climate-smart technology is not a separate technical measure. It forms part of a policy approach through which cities connect technological upgrading, carbon reduction, and sustainable economic development [21,22].
The link between climate-smart technology and the energy transition may vary with a country’s level of development [23]. In the early stages, cities often need sensors, data platforms, computing facilities, communication networks, and intelligent equipment. This infrastructure can raise electricity demand and carbon emissions before efficiency gains materialise. It can also draw funding away from renewable energy facilities and other energy investments, in some cities [24,25]. For this reason, climate-smart technology may slow the energy transition for a short period while its use remains limited. This effect may change as the technology becomes more established [26]. Wider use can improve energy management, support continuous monitoring, and reduce waste in the main parts of the urban energy system. It can also improve environmental regulation by enabling local governments to identify carbon-intensive activities, track emissions, and design more targeted policy tools [27,28]. The central issue is whether climate-smart technology shifts from an early constraint to a later source of support for the urban energy transition [29]. This question helps explain why the same technology may produce different transition outcomes across cities.
Studies have linked green innovation, digital technology, smart energy systems, and the energy transition in different ways. Some evidence suggests that climate-smart technologies can support renewable energy integration, improve system performance, and reduce a region’s “energy intensity” through intelligent monitoring, energy-saving equipment, and demand-side management. Digital tools may also improve energy demand analysis, support distributed renewable energy, and make energy systems more operationally efficient [30,31]. Yet this effect is not always immediate. Digital infrastructure, data centres, communication facilities, and smart devices require electricity during construction and deployment, so the carbon-reduction benefits may appear only after the technology is widely used in production and governance systems [32,33]. Evidence from urban energy systems points to the same tension. Some cities experience higher energy demand during the early stages of intelligent infrastructure expansion. Others convert digital capacity into carbon-reduction gains more effectively when industrial adaptation is stronger and electricity supply is cleaner [34,35,36]. The effect of climate-smart technology may therefore depend on technological maturity, energy structure, policy support, and local industrial conditions. What remains unclear is whether climate-smart technology follows a non-linear path in the urban energy transition, and how energy intensity and attention to climate concerns condition this effect in Chinese cities.
Based on city-level panel data covering 282 Chinese cities from 2010 to 2019, this study adopts carbon emission intensity as an inverse measure of urban energy transition, and examines whether variations in the effects of climate-smart technologies on urban energy transition are conditional on technological development stages. The results show that climate-smart technology constrains the urban energy transition at an early stage but promotes it once the technology becomes more mature. The channel analyses suggest that energy intensity and climate attention may represent potential pathways associated with this shift. The non-linear pattern is more evident in non-resource-dependent cities and in cities excluded from the “Broadband China” pilot programme. These results indicate that climate-smart technology should not be treated as a uniform driver of the energy transition. Its effect depends on industrial structure, policy design, and the stage of digital infrastructure development.
This study advances the related discussion in two ways. (1) Previous research has primarily focused on the impact of the digital economy on carbon emissions [26]. This study provides city-level evidence on the economic consequences of climate-smart technology in China. The results show that climate-smart technology affects the urban energy transition differently across the early deployment and mature application stages. (2) Beyond simply identifying the non-linear effect, we further explore potential channels by examining both energy intensity and climate attention. By separating cities across different urban characteristics and pilot-programme statuses, the analysis clarifies when climate-smart technology is more effective at improving the transition outcomes. In sum, these findings provide evidence for the design of policy frameworks that coordinate digital infrastructure, clean energy use and environmental governance.
The next section, Section 2, develops the research background and hypotheses. The data, variables and empirical strategy are then introduced in Section 3. Section 4 presents the benchmark estimates and robustness checks, followed by the channel and heterogeneity analysis in Section 5. Section 6 summarises the main findings and discusses their policy implications.
2. Literature Review
2.1. Urban Energy Transition
In energy economics and climate policy, the urban energy transition refers to the process through which cities reduce reliance on fossil fuels and develop more efficient energy systems [2,6]. It involves changes in energy structure, energy efficiency, company production, infrastructure investment, and environmental governance. Cities are central to this process because they concentrate energy use and emissions. They are also the administrative units through which many energy, industrial, and environmental policies are carried out [37,38]. Previous studies have examined several drivers of the energy transition, including economic growth, trade policy, financial instruments, urbanisation, and government subsidies [39,40].
Economic growth is an essential force shaping the urban energy transition, but its effect depends on the quality of that growth. Higher-quality growth can create fiscal space for renewable energy research and infrastructure investment. For example, a city with a stable gross domestic product growth of 3 to 4% each year may be better able to fund smart grid upgrades than a city with volatile or resource-dependent growth [41,42]. Trade policy also affects the transition by shaping cross-border flows of energy products and technologies. Policies that reduce the import costs of solar panels or battery storage systems can support low-carbon urban development. By contrast, trade protectionism raises these costs and may delay the transition [43,44]. Finance influences the transition by directing capital towards clean energy projects, grid upgrades, and energy-saving renovations. Green loans and bonds can bring private capital into new energy projects, ease funding pressure for district heating retrofits and electric vehicle charging networks, and increase pressure on energy-intensive industries to adopt cleaner processes [45,46]. Urbanisation is also closely connected with the energy transition. Population-based and industrial agglomeration change energy consumption patterns, which can strain traditional supply systems while creating practical settings for technologies, such as community solar schemes and waste-to-energy plants [47,48]. Government subsidies provide another policy tool. Direct financial support and tax incentives can lower the barriers to adopting new energy technologies. They boost company participation and foster an environment for reducing carbon emissions across the urban energy system [41,49,50].
2.2. Climate-Smart Technology
Scientific measurement of climate-smart technology underpins the relevant empirical research. Given the breadth of climate-smart technology, previous studies lack a unified measurement standard. Three mainstream methods have emerged for measuring climate-smart technology [11]. First, one widely used measure captures the extent of industrial robot application by relating robot installation to workforce size [51,52]. Robot density intuitively reflects the level of production automation and enterprises’ willingness to undergo digital transformation. However, this indicator is characterized by relatively weak climate adaptability [53]. Second, fixed asset investment is considered to gauge climate-smart technology from a capital expenditure perspective. It primarily reflects the scale of regional investment in computing power facilities and software infrastructure [54]. However, because this indicator mainly measures the scale of capital investment, it does not fully capture technological maturity or the practical effectiveness of applications [55,56]. Third, the quantity of patents in climate-smart technology directly reflects technological innovation capacity. A sustained increase in patent applications and grants indicates rising R&D investment and heightened innovation activity [57]. Because the data are objective, stable, and easily categorised, they are frequently used to measure a region’s accumulation of climate-smart technology and innovation output [58]. According to the logic of technological industrialisation, patents represent original technological innovation, investment reflects the capital transformation of achievements, and industrial robot application embodies practical industrial implementation. Together, these three dimensions describe the full development process of climate-smart technology. These three approaches assess climate-smart technology from a specific level. As a result, related studies on the development of climate-smart technology in given researched regions often exhibit a one-sided perspective.
Climate-smart technology is now used in many areas of social production and economic activity, including agriculture, finance, manufacturing, and urban development. It can support industrial upgrading and improve resilience and sustainability in these sectors [13,14]. In agriculture, it supports adaptive practices such as precision irrigation [59]. In finance, patent activity in climate adaptation technologies is associated with stronger sustainable-finance indices [60]. These applications can improve agricultural adaptation, support green transformation in companies, and contribute to low-carbon urban development. The effects of climate-smart technology are uneven. Although it can reduce environmental pressure, it may also increase inequality and widen the digital divide [58]. Evidence from urban energy departments suggests that higher-income cities often deploy renewable energy technologies faster than lower-income cities [61,62]. This difference can lead to unequal carbon-emission reductions. The effect depends on digital literacy, resource endowment, company characteristics, and urban income levels. In the long run, lower clean energy costs may reduce these gaps, but short-term inequalities may appear during early adoption [63]. This means that climate-smart technology can support sustainable development, but its uneven effects require a policy design suited to local city conditions [64].
2.3. Climate-Smart Technology and Urban Energy Transition
The link between climate-smart technology and the urban energy transition can be understood through two related lines of evidence [30,31]. The first emphasises its enabling role [65]. Intelligent monitoring can help identify inefficient energy use in factories, buildings, and public infrastructure. Smart grid systems can improve electricity allocation and reduce transmission and distribution losses [66]. Digital platforms can support renewable energy integration by improving demand forecasting and system scheduling. These functions reduce the practical constraints on clean energy use and strengthen the technical basis for energy transition [67,68]. Another view stresses the early cost of technology deployment [69,70]. Climate-smart technology often requires large investments in digital infrastructure, data systems, and intelligent equipment. These investments consume electricity and materials. They can also divert public fiscal resources and company resources away from more direct renewable energy projects, especially in cities with limited budgets. In its early stage, the technology may not yet be connected to production systems, environmental regulations, or clean energy supply. Its carbon-reduction benefits may therefore be weak, while its energy demand is already evident. This can slow urban energy transition in the short term [68,71].
A non-linear framework can reconcile these two views. During the initial development stage of climate-smart technology, the inhibitory effect on urban energy transition is dominant. Research and development, system deployment, and physical infrastructure construction require considerable amounts of capital, human resources, and materials. Consequently, these demands inevitably compete for limited resources that could otherwise support clean energy substitution and energy structure optimisation [72,73]. In addition, climate-smart technologies remain technologically immature at this stage. Application scenarios across different energy production and consumption sectors are not yet fully integrated. The low-carbon and efficiency dividends cannot be fully realised. Short-term resource allocation distortions, combined with transition costs, further slow progress in the urban energy transition [74]. Urban energy departments often face a difficult trade-off between investing in novel technologies and expanding proven renewable energy technologies. This trade-off characterises the initial phase of low-carbon urban development [75,76].
When the development level of climate-smart technology crosses a certain threshold, its technological system matures. Application scenarios then expand and penetrate various links in the energy production and consumption chain. At this stage, the promotional effect gradually emerges and replaces the inhibitory effect, becoming dominant [77]. Climate-smart technology has been associated with improvements in energy efficiency, such as the enhanced distribution efficiency observed in smart grid operations [78]. As climate-smart technology matures, it can improve energy resource allocation and reduce reliance on fossil fuels. Wider application may spread these benefits across industries and urban energy networks. At a larger scale, network effects can increase the technology’s value and support the upgrading of the urban energy structure. These patterns suggest that climate-smart technology affects the urban energy transition in stages rather than through a linear, constant effect [79,80]. This study therefore proposes Hypothesis 1.
Hypothesis 1.
As climate-smart technology develops, it first inhibits and then promotes the urban energy transition, forming a non-linear pattern.
2.4. Urban Energy Transition Channels
The energy intensity reflects the amount of energy used in urban economic production. A decline in energy intensity means that cities can maintain economic output with lower energy inputs, easing dependence on fossil fuels and creating better conditions for the energy transition [81]. In many cities, this reduction is necessary because expanding renewable energy alone cannot fully offset the pressure from rising energy demand [82]. Climate-smart technology can reduce energy intensity through intelligent optimisation. In industrial production, sensors and data platforms can monitor equipment operation in real time and identify wasteful energy use. In urban energy management, smart grid systems and digital dispatch platforms can improve the allocations of electricity, heat, and other energy resources. In public services and buildings, intelligent control systems can adjust energy consumption according to actual demand. These applications improve urban energy management by reducing waste and supporting more efficient resource allocation [83]. This channel also has a clear economic meaning. The energy transition requires cities to reduce the energy cost of economic output. Climate-smart technology can provide the information and control tools needed for this reduction [84]. As the technology becomes more mature, it helps companies and local governments identify inefficient processes and adjust energy use. In this process, reduced energy intensity links climate-smart technologies with improved performance in urban energy transitions [62,85]. This leads to the following hypothesis, Hypothesis 2.
Hypothesis 2.
Climate-smart technology first raises energy intensity at low diffusion stages and reduces it after crossing a critical threshold, forming an inverted-U-shaped mediating channel.
Urban energy transition calls for broad social consensus and sustained policy attention, since enterprises tend to neglect the long-term risks that carbon-intensive production poses to the climate system [86,87]. By shaping public opinion, guiding investor preferences, and setting government agendas, climate attention can profoundly reshape corporate behaviours and push firms to incorporate climate performance into their core strategic considerations [88,89]. At the urban level, whether climate attention translates into tangible action depends heavily on information accessibility and transparency. Without making accurate and real-time data on energy consumption and carbon emissions accessible to local governments and the public, climate attention may remain superficial and fail to generate effective decision-making pressure [90]. Climate-smart technology is mutually reinforcing with rising climate attention and significantly strengthens the driving effect of such attention on energy transition. By continuously enhancing the scientific rationality and urgency reflected in climate attention, climate-smart technology can eventually be converted into superior energy-transition performance [2]. The maturation and in-depth application of this technology comprehensively support upgrading urban climate governance awareness and improving response systems [91]. First, equipped with digital tools such as big data, the Internet of Things, and satellite remote sensing, climate-smart technology enables continuous monitoring of urban energy consumption and carbon emissions and translates remote, macroscopic climate changes into localised risk maps. It enables precise identification, dynamic tracking, and trend prediction of high-carbon-emission sources, addressing the longstanding drawbacks of delayed attention and ambiguous thinking in traditional climate governance and greatly improving perception accuracy and targeted responses across all stakeholders in high-energy-consuming sectors [92]. Furthermore, by mining urban energy consumption and environmental governance data, climate-smart technology simulates climate impact pathways under diverse development scenarios and quantifies emission-reduction outcomes. It thus provides solid scientific evidence for persistent climate attention, strengthens the forward-looking nature of policy formulation and the effectiveness of public participation, and prevents climate issues from being marginalised amid short-term economic fluctuations [93,94]. Through these transmission pathways, climate-smart technology markedly elevates cities’ overall climate attention and scientific decision-making capacity. Sustained and effective climate attention imposes strong external constraints on enterprises’ traditional high-carbon-development modes, compelling firms to face transition pressure, scale up investment in low-carbon technological research and development, restructure entire industrial chains from procurement to sales, and proactively increase clean-energy inputs. Ultimately, the socio-economic pressure driven by intensive climate attention will indirectly yet powerfully advance the achievement of urban energy-transition goals [95]. This leads to the following hypothesis, Hypothesis 3.
Hypothesis 3.
Climate-smart technology first raises climate attention at low diffusion stages and reduces it after crossing a critical threshold, forming an inverted-U-shaped mediating channel.
3. Methods
3.1. Sample and Data Resource
Based on annual observations for 282 Chinese prefecture-level cities from 2010 to 2019, the study evaluates the link between climate-smart technology and urban energy transition. The city-level setting suits this analysis because Chinese cities are key units for energy consumption, carbon emission reduction, environmental governance, and industrial policy implementation. The sample period covers the early expansion of digital and climate-related intelligent technologies in China, enabling the examination of non-linear effects.
The data are collected from several sources. The energy-related variables are constructed from the China Energy Statistical Yearbook. Based on these, we calculate the energy and carbon intensities. Urban socio-economic variables are mainly drawn from the China Urban Statistical Yearbook and the China Stock Market Accounting Research Database, including economic development, population density, industrial structure, education level, and pollution emission indicators. Climate-smart technology companies are identified through registration records from the China Enterprise Registration Database and AIQICHA Credit Information Limited Company. The final balanced panel contains 2820 city–year observations. Several data-processing steps improve comparability across cities and years. (1) This study selects a sample period from 2010 to 2019, which coincides with the initial germination and rapid expansion of climate-smart technology in China. This window captures the non-linear evolutionary process and enables us to identify stage-based changes. The sample ends in 2019, which helps avoid the influence of the COVID-19 pandemic. (2) Economic variables are adjusted to the 2008 constant price index where needed. Energy variables are standardised in measurement units. (3) Missing values are supplemented through linear interpolation.
3.2. Model
The empirical model is specifically designed to test whether climate-smart technology affects urban energy transition in a non-linear manner:
(1) denotes the urban energy-transition situation. (2) and denote the climate-smart technology situation. The coefficient captures the linear association between climate-smart technology and urban energy transition, while captures the non-linear effect. (3) is the vector of control variables. is the corresponding parameter vector. (4) City- and year-fixed effects are captured by and . (5) denotes the intercept. denotes the disturbance term.
Since urban energy transition is measured by carbon emission intensity, a higher value of the dependent variable indicates weaker transition performance. If is positive and is negative, climate-smart technology first raises carbon emission intensity and later reduces it after reaching a higher development level. This pattern means that climate-smart technology initially constrains the urban energy transition but later enables it as the technology matures. The specification uses city-fixed effects to remove unobserved urban attributes that remain stable over time, such as geographic conditions. Year-fixed effects capture shocks shared by all cities in a given year, such as changes in national energy policy, macroeconomic conditions, and general technological progress. This model design helps identify the within-city relationship between climate-smart technology and urban energy transition over time.
3.3. Variable Definition
3.3.1. Dependent Variable
Urban energy transition () is the dependent variable. Consistent with [51], carbon emission intensity is adopted as an inverse measure of transition performance. The indicator captures carbon dioxide emissions relative to urban GDP, so a smaller value reflects lower carbon pressure for a given level of economic output. Emissions are estimated using the 2006 IPCC Guidelines for National Greenhouse Gas Inventories together with China’s fossil energy consumption structure.
The calculation is as follows, where denotes total carbon dioxide emissions in city in year . represents the consumption of fossil fuel . is the standard coal conversion coefficient, and is the carbon emission factor. The term 44/12 converts carbon into carbon dioxide. As the China Energy Statistical Yearbook reports energy balances only at the provincial level, this study disaggregates provincial fossil fuel consumption to the prefecture level, using each city’s share of the province’s industrial output value as the weighting factor. The eight fossil fuels include raw coal, coke, crude oil, gasoline, kerosene, diesel, fuel oil, and natural gas. The standard coal conversion coefficients (SCCs) for these eight fuels are 0.7143, 0.9714, 1.4286, 1.4714, 1.4714, 1.4571, 1.4286, and 1.3300 tce/t, respectively (with natural gas in tce/103 m3), as sourced from the China Energy Statistical Yearbook. The corresponding carbon emission factors (CEFs) are 0.7476, 0.1128, 0.5854, 0.5532, 0.3416, 0.5913, 0.6176, and 0.4479 tC/tce, respectively, as sourced from the 2006 IPCC Guidelines. These CEFs values are expressed in tons of carbon per ton of standard coal equivalent and are multiplied by 44/12 in Equation (2) to convert carbon into carbon dioxide.
The carbon emission intensity is obtained from the ratio of urban carbon dioxide emissions to GDP. Because this indicator is a reverse measure of energy transition, a decline in it indicates improved urban energy transition.
3.3.2. Independent Variable
Climate-smart technology () is the independent variable. This variable is measured using the natural logarithm of the number of climate-related smart technology companies. It can effectively reflect the innovation and deployment levels of urban climate-smart intelligent technologies. Following the method described in [96], this study classifies a firm as climate-smart technology type if its business scope contains at least one intelligent technology keyword, specifically, “smart sensor” or “remote sensing”, and at least one climate-related application keyword, specifically, “carbon accounting”, “climate risk”, “smart grid”, “smart energy management”, “carbon emission monitoring”, or similar terms, using the information from the China Enterprise Registration Database and the AIQICHA Credit Information Limited Company [97]. To assess the possible non-linear association, the specification includes the quadratic term of “climate-smart technology”. To further account for the possibility that firm counts are mechanically driven by city size and the overall scale of local business registration, the raw count is normalised and then transformed using the following natural logarithm:
This enterprise-based measure has two advantages for the analysis of urban energy transition. It captures the local diffusion of climate-smart technology rather than only innovation output or investment scale. It also reflects the application base of climate-related intelligent technologies at the city level and the relative prevalence of climate-smart technology rather than absolute agglomeration effects.
3.3.3. Other Variables
The channel variables include energy intensity () and climate attention (). (1) Energy intensity is used to examine the efficiency channel. It indicates the energy input associated with economic production; a smaller value indicates that cities use less energy to generate output. Climate-smart technology may reduce energy intensity by improving production processes, monitoring energy use and optimising energy allocation [81]. (2) Climate attention is used to examine the cognitive channel. It is measured by the frequency of local government work reports mentioning climate disasters. This text-based indicator reflects the priority and cognitive salience that local policymakers and the public assign to climate risks and low-carbon transition targets. Climate-smart technology may raise climate attention by improving data transparency, enhancing the visibility of real-time carbon anomalies, and providing a more accessible visualisation of urban emission trajectories [98].
The control variables include economic development, openness, public expenditure, population concentration, industrial structure, and pollution conditions. Gross domestic product growth rate () captures urban growth. Foreign direct investment ratio () reflects the degree of external economic openness. The education expenditure ratio () captures public investment in human capital. Population density () reflects the urban agglomeration situation. The secondary industry added value () captures each urban industrial structure. Industrial sulphur dioxide emission intensity () reflects industrial pollution levels and the environmental pressure they impose. This setting limits potential bias from other city-level factors when estimating the links between the variables of interest [6,99,100].
4. Results
4.1. Statistics
Table 1 presents the summary statistics. The mean value of urban energy transition (), measured by carbon emission intensity, is 0.3920, with a standard deviation of 0.3536. These statistics suggest clear differences in transition performance across Chinese cities. Some cities have achieved relatively low carbon intensity, while others still rely more heavily on carbon-intensive energy use and production. The mean value of climate-smart technology () is 3.7643, with observed values falling between 0.1238 and 8.0557. This wide range indicates that climate-smart technology development is uneven across cities. Cities with stronger digital infrastructure, better industrial foundations and more active low-carbon technology companies usually show higher values. Overall, the descriptive statistics show substantial differences in energy transition, climate-smart technology, and urban development conditions across the 282 Chinese cities.
Table 1.
Descriptive statistics.
4.2. Geographic Statistics
In Figure 1a–c illustrate the spatiotemporal evolution of climate-smart technology in China from 2010 to 2019. Overall, climate-smart technology expanded steadily during the sample period and became more visible across Chinese cities. In spatial terms, higher values are concentrated in leading regions and decline gradually towards less developed areas. First, the eastern coastal regions form a high-value agglomeration area. Second, the levels of climate-smart technology development in central cities such as Wuhan and Chongqing are higher than in surrounding cities. Over time, high-value areas expand from single points to contiguous clusters, indicating faster diffusion of climate-smart technology and stronger regional linkages.
Figure 1.
Spatial distribution of climate-smart technology and the urban energy transition. (a–c) depict the spatial distribution of climate-smart technology, quantified as the number of firms with climate-smart technology per 10,000 registered enterprises, for 2010, 2014, and 2019, respectively. (d–f) illustrate the spatial pattern of the urban energy transition, calculated as total city carbon emissions divided by city GDP, for 2010, 2014, and 2019, in sequence.
Additionally, Figure 1d–f show changes in the urban energy transition across Chinese cities from 2010 to 2019. Overall, the data indicate a steady decline over time, with the spatial pattern characterised by a distinct gradient. Specifically, cities with high carbon emission intensity (marked in red and orange tones) were widely distributed across the country in 2010. By 2014, the coverage of red-coloured areas shrinks substantially, and the 2019 map is predominantly composed of regions with low carbon emission intensity (grey and blue tones). This temporal shift suggests a non-linear decline in urban carbon intensity over the decade, preliminarily hinting at a potential non-linear association between climate-smart technology diffusion and the urban energy transition. This study further relies on regression analyses and Lind–Mehlum tests to systematically identify the relationship between climate-smart technology and the urban energy transition.
4.3. Benchmark Estimations
Table 2 reports the benchmark results. Columns (1) and (2) compare the estimates before and after the inclusion of control variables. Notably, both specifications consistently control for city- and year-fixed effects. Across the two specifications, the coefficient remains similar in magnitude and retains similar statistical significance, suggesting the preliminary findings are not sensitive to the inclusion of control variables. Interpreted in terms of carbon emission intensity, the estimated coefficients reveal a typical inverted-U-shaped pattern. In the early stages of climate-smart technology development, investment in digital infrastructure and intelligent equipment increases consumption and emissions. Before climate-smart technology reaches a mature application stage, its carbon reduction benefits may remain weak. As climate-smart technology gradually matures, it delivers its full technological dividends. It helps optimise industrial structure, improve energy efficiency, and support more refined environmental regulations. Consequently, mature climate-smart technology effectively reduces carbon-emission intensity, thereby significantly accelerating the urban energy transition.
Table 2.
Benchmark estimations.
This study formally tests the inverted-U non-linear relationship using the Lind and Mehlum test [101]. The overall test yields a p-value of 0.0099, thereby rejecting the null hypothesis of monotonic or pure U-shaped effects at the 5% significance level. The turning point for climate-smart technology is 3.35, with a 95% Fieller confidence interval [1.51, 6.08] that lies entirely within the observed data range [0.12, 8.06]. The slope at the lower bound of climate-smart technology is significantly positive (slope = 0.1061, p = 0.006), whereas the slope at the upper bound is significantly negative (slope = −0.1544, p = 0.010), confirming that climate-smart technology first increases carbon emission intensity and then reduces it as its diffusion level rises. Notably, the turning point (3.35) lies about 0.44 standard deviations below the sample mean of climate-smart technology (3.76), implying that most observations have already surpassed the threshold.
4.4. Endogeneity Analysis
To alleviate potential endogeneity bias arising from reverse causality and omitted variables, this study adopts two identification strategies: a lagged independent variable and an instrumental variable (2SLS).
The first concern is reverse causality between the two variables of interest. Climate-smart technology can reduce carbon emissions intensity through energy management, production optimisation, and environmental monitoring. Cities that make faster progress in the energy transition may also provide better market conditions, policy incentives, and infrastructure support for climate-smart technologies. This two-way relationship may bias the estimated coefficient if it is not addressed. To reduce this concern, this study uses the first-period lag of climate-smart technology and its squared term to analysis endogeneity [102]. In Table 3, column (1) shows that the lagged independent variable () and its quadratic term () form a significant inverted-U curve for energy transition, preliminarily verifying the non-linear relationship.
Table 3.
Endogeneity results.
Second, this study employs an instrumental variable approach to further address endogeneity. It uses an interaction term between “the number of post offices per million people” and “the number of patents in 1984” as the instrument. The first-stage regression in column (2) confirms that the instrument is significantly correlated with the independent variable (), satisfying the relevance requirement. After replacing climate-smart technology with its instrumental variable, the squared term remains significantly negative in column (3) of Table 3. The second-stage result is consistent with the benchmark estimate, indicating that the inverted-U relationship remains statistically significant. The endogeneity test therefore supports the main finding. The non-linear effect remains stable after accounting for potential feedback from the urban energy transition to climate-smart technology. This result is consistent with a stage-based process of technology diffusion rather than a simple correlation.
4.5. Robustness Estimations
Table 4 reports three robustness estimations for the benchmark results: adding province-by-year-fixed effects, adjusting the sample, and introducing environmental policy variables. Column (1) includes province-by-year-fixed effects to control for provincial factors, such as energy policies and industrial planning. Column (2) adjusts the sample by excluding Beijing, Shanghai, Tianjin, and Chongqing. This mitigates the influence of these municipalities, which may be outliers in higher-performing regions. Column (3) introduces a policy-exposure dummy to identify cities affected by national or local environmental protection policies. This helps alleviate omitted-variable bias arising from ignoring policy-driven environmental governance effects. Overall, the three robustness estimations indicate that the non-linear relationship is stable.
Table 4.
Robustness results.
5. Discussion
5.1. Non-Linear Channel
The benchmark results suggest that the urban energy transition responds to climate-smart technology in a non-linear manner. However, the results do not explain the channels through which this effect forms. Table 5 examines two channels: energy intensity () and climate attention ().
Table 5.
Channel estimations.
5.1.1. Energy Intensity
Columns (1) and (2) use energy intensity () as the channel variable. The estimates show a positive linear term and a negative quadratic term. These significant coefficients support an inverted-U-shaped association between climate-smart technology and energy intensity. In the early stages, climate-smart technology may increase energy intensity because digital infrastructure, data systems, intelligent equipment, and computing facilities require additional electricity and capital investment. In many cities, these inputs appear before the energy-saving benefits of smart systems become visible. The immediate effect may therefore be higher energy intensity, which creates short-term pressure on the urban energy transition.
As climate-smart technology advances, its impact on energy intensity evolves. More mature technologies can be used for energy monitoring, production process optimisation, smart grid management, and demand-side adjustment. These applications improve coordination in energy use across different stages of economic activity. They reduce inefficient consumption and improve resource allocation. After the turning point, energy intensity therefore begins to decline. This channel supports the urban energy transition by reducing the energy needed to produce a given level of output. The evidence supports a stage-based interpretation, in which climate-smart technology must reach sufficient maturity before efficiency gains can offset its initial energy costs.
5.1.2. Climate Attention
Columns (3) and (4) examine climate attention () as another potential channel. The coefficient pattern again supports an inverted-U-shaped relationship. This result suggests that climate-smart technology affects how climate issues enter the attention space of local policymakers and the public. Early on, the proliferation of digital monitoring tools may increase the visibility of climate anomalies, extreme weather events, and carbon emission fluctuations in media coverage and government reports. Local governments and locally affected residents receive more frequent signals about environmental disruptions because intelligent sensors and emission-tracking networks provide real-time data on local energy disturbances. Yet when such technological coverage remains fragmented and data interpretation capacity lags, climate attention may still rest on general risk perception rather than structured cognitive engagement with specific mitigation pathways.
As climate-smart technology matures, its contribution to climate attention becomes more cognitively profound. Integrated big-data platforms, high-resolution satellite inversion data, and regional carbon assimilation systems make the spatial distributions and dynamic evolution of climate risks more accessible and interpretable. Local governments can identify high-emission hotspots more precisely, firms can evaluate their carbon footprints along supply chains more systematically, and the public can perceive the carbon implications of daily energy consumption more intuitively. This higher-quality climate attention encourages governments to formulate evidence-based decarbonisation roadmaps, pushes enterprises to prioritise low-carbon process reconfiguration, and strengthens social oversight of carbon-intensive projects. Through this channel, climate-smart technology supports the urban energy transition by improving climate attention.
5.1.3. Non-Linear Channel Discussions
Overall, the empirical tests show that energy intensity () and climate attention () are important channels. Energy intensity reflects the efficiency effects of technology, while climate attention reflects the level of emphasis placed on climate governance. These two channels also help explain why the main relationship is non-linear. At an early stage, infrastructure construction and adaptation costs may increase energy use and weaken transition performance. At a more mature stage, climate-smart technology improves energy efficiency and strengthens climate attention, thereby reducing carbon intensity and supporting the urban energy transition.
5.2. Heterogeneity Analysis
5.2.1. Resource-Dependent Cities
Table 6 divides the sample into resource-dependent and non-resource-dependent cities. For the resource-dependent cities in column (1), neither the linear nor the quadratic term of climate-smart technology is statistically significant. This insignificant non-linear pattern indicates that climate-smart technology does not present a stage-dependent influence on energy transition in resource-based cities. A plausible explanation is that resource-dependent cities are dominated by high levels of carbon extraction and heavy industries with fixed energy consumption structures. Their energy-saving improvement mainly relies on traditional technological renovation and industrial rectification rather than emerging digital climate technology. At the current stage of development, climate-smart technology has not yet developed a systematic scale effect to reshape their energy-transition trajectory, resulting in an insignificant non-linear relationship.
Table 6.
Heterogeneity estimations.
In non-resource-dependent cities, the linear term of climate-smart technology is significantly positive, whereas the quadratic term is significantly negative. The estimates therefore indicate an inverted-U-shaped association. This means that climate-smart technology initially constrains the urban energy transition but later promotes it once technological development advances. A possible explanation lies in the broader technological structure of these cities. Non-resource-dependent cities usually have more diversified industries, stronger service sectors, and wider digital application scenarios. In the early stages, expanding data platforms, intelligent equipment, and digital infrastructure can increase electricity consumption and raise emission intensity. The carbon-reduction benefits are not fully realised because application systems and energy management practices need time to mature. As climate-smart technology becomes more deeply embedded in production, transport, buildings, and public governance, its energy-saving and coordination effects become stronger. This may help account for the more pronounced non-linear relationships observed in non-resource-dependent cities.
5.2.2. The “Broadband China” Pilot Programme
Columns (3) and (4) present the heterogeneity results based on whether cities were included in the “Broadband China” pilot programme. In the pilot cities, neither the linear nor the squared term is statistically significant. Although broadband pilot policies provide solid digital infrastructure foundations, early-stage massive construction of communication equipment and data centres creates persistent rigidity in energy consumption. A one-dimensional digital infrastructure advantage cannot, on its own, generate low-carbon governance dividends.
By comparison, non-pilot cities, those without preferential digital policy support, present a significant inverted-U-shaped relationship. Without policy-driven over-investment in digital infrastructure, climate-smart technology develops more steadily and endogenously matches local industrial and energy endowments. In the initial stage, sporadic digital technology application increases marginal energy consumption. With continued technological penetration and matching facility improvements, energy-saving and efficiency-improving effects gradually emerge, creating a significant stage-dependent non-linear transition effect. The result also shows that digital infrastructure alone is not enough to promote the energy transition. Broadband networks can support climate-smart technology, but their carbon effects depend on their connections with clean electricity, energy-saving standards, and urban environmental governance. Without this coordination, digital infrastructure may increase urban energy demand before it improves energy efficiency. For cities in the “Broadband China” pilot programme, the policy focus should therefore shift from infrastructure expansion alone to cleaner operations, energy-saving design, and integration with low-carbon urban governance.
5.2.3. Heterogeneity Discussions
Overall, the heterogeneous results demonstrate that the non-linear influence of climate-smart technology is highly context-dependent. Resource-dependent cities feature rigid industrial and energy structures, which lead to insignificant non-linear effects of climate-smart technologies. Non-resource-dependent cities exhibit a typical inverted-U pattern, reflecting the phased characteristics of digital low-carbon transformation. Regarding policy heterogeneity, cities in the “Broadband China” pilot programme fail to form effective non-linear constraints because of excessive rigidity in digital infrastructure energy use, whereas non-pilot cities show robust inverted-U characteristics. These results indicate that climate-smart technology should not be treated as a uniform driver of the energy transition. Its effect depends on the industrial structure, policy design, and the stage of digital infrastructure development.
6. Conclusions and Implications
6.1. Conclusions
Using city-level data for 282 Chinese cities from 2010 to 2019, this study examines the relationship between climate-smart technology and the urban energy transition. A fixed-effects specification is used to test the average non-linear effect, potential channels, and heterogeneity across cities. The main findings remain robust under alternative specifications.
- (1)
- The main estimates show a stage-based relationship between climate-smart technology and the urban energy transition. At an early stage, climate-smart technology may complicate or impede the transition, but its impact becomes supportive as technological development advances. This pattern reflects the urban diffusion process of new technologies. Early deployment requires investment in digital infrastructure, data platforms, and intelligent equipment, which can increase energy demand and capital expenditure before carbon reduction benefits are fully realised. As climate-smart technology matures, it improves energy management, supports cleaner production, and strengthens coordination across urban energy systems. These functions reduce carbon emission intensity and support the urban energy transition. In the majority of this study’s observations, climate-smart technology has passed its initial deployment phase and is now associated with improved energy-transition performance.
- (2)
- Energy intensity and climate attention are two important channels. Climate-smart technology affects the urban energy transition by improving energy efficiency. At an early stage, digital facilities and intelligent equipment may increase electricity demand and raise energy consumption per unit of output. As the technology matures, intelligent monitoring, production optimisation, and smart scheduling help reduce energy waste and improve energy allocation. This lowers energy intensity and supports the energy transition. Climate-smart technology also functions through the channel of climate attention. Advanced digital monitoring and data systems enable local governments to pinpoint carbon-intensive activities, track emission fluctuations in real time, and design targeted climate governance schemes. Such tangible, quantified climate information makes climate risks intuitive and concrete, thereby consolidating government climate attention, arousing sustained public climate concern, and consolidating the cognitive foundation for long-term carbon mitigation.
- (3)
- The heterogeneity evidence indicates that the role of climate-smart technology is not uniform across cities. In resource-dependent cities, the estimated effect of climate-smart technology is not statistically significant, suggesting its transition benefits have not yet materialised, possibly because of the rigidity of local industrial and energy structures. In non-resource-dependent cities, the non-linear relationship is more evident, because early digital expansion can increase energy demand before later efficiency gains appear. In non-pilot cities, those not in the “Broadband China” pilot programme, the inverted-U-shaped relationship is statistically significant, suggesting that, without policy-driven over-investment, climate-smart technology development may follow a stage-dependent path. In contrast, for cities in the “Broadband China” pilot programme, neither the linear nor the quadratic term is statistically significant. Early-stage infrastructure construction in these pilot cities may have created persistent energy-consumption rigidities that offset potential efficiency gains from climate-smart technology.
Overall, the findings show that climate-smart technology is not a simple linear driver of the urban energy transition. Its effect depends on technological maturity, energy-efficiency improvements, environmental governance capacity, and local urban conditions. The evidence supports a stage-based view of the energy transition, in which early technology deployment may increase carbon pressure, while mature applications can reduce carbon intensity and improve transition performance.
6.2. Policy Implications
This study suggests targeted implications at several different levels to harness the potential of climate-smart technology in the energy transition.
- (1)
- Urban governments should reduce the carbon costs of early climate-smart technology deployment. Climate-smart technology needs digital infrastructure, computing capacity, communication networks, and intelligent equipment. These inputs may increase electricity consumption before energy-saving benefits appear. Policy design should therefore link climate-smart technology investment with clean electricity supply, energy-saving standards, and carbon monitoring requirements. Data centres, broadband facilities, and smart energy platforms should be encouraged to use renewable electricity and high-efficiency equipment. This may help mitigate the short-term carbon pressure created by infrastructure expansion and help climate-smart technology reach a stage where it supports the energy transition.
- (2)
- Cities should use climate-smart technology to improve energy intensity. Energy intensity is a direct channel through which climate-smart technology affects urban energy transition. Local governments can encourage companies to apply intelligent monitoring, smart scheduling and process optimisation in production, buildings, transport and public infrastructure. Fiscal incentives, green credits, and technical guidance can be used to support energy-saving renovations in high-energy sectors. For resource-dependent cities, policy attention should focus on climate-smart technologies in mining, energy processing, and traditional manufacturing. These sectors have clear energy-saving potential, and targeted application can reduce carbon-emission intensity more directly.
- (3)
- Climate attention should be integrated with climate-smart technology. Climate-smart technology consolidates and elevates climate attention by delivering more precise data on energy consumption and carbon emissions. Local governments ought to build digital monitoring platforms that integrate carbon emission statistics, energy consumption records, and corporate production information. Such platforms can support targeted action on climate issues and narrow information asymmetry between municipal governments and enterprises. For pilot cities under the “Broadband China” pilot programme, priority should be given to the low-carbon and clean operation of digital infrastructure, rather than treating the expansion of digital networks as an isolated policy objective.
6.3. Limitations
Future research should address several limitations. (1) The sample period of the present study ends in 2019, and thus does not capture the period after China announced its carbon neutrality targets in 2020. Subsequent policy shocks, including intensified carbon peaking and carbon neutrality commitments, the nationwide rollout of the ETS, and accelerated renewable energy deployment under the “14th Five-Year Plan”, may fundamentally alter the stage-dependent relationship identified in this study. Future research extending the sample window to cover these years would be valuable in the examination of whether shifts in climate policy intensity modify the main relationship between the variables of interest. (2) The measurement of climate-smart technology, while constructed with a two-step keyword strategy, inevitably raises construct-validity concerns. The firm-level identification relies on business scope keywords that, despite our efforts to manually exclude purely AI firms and retain only those with explicit climate relevance, are ultimately text-based proxies rather than direct observations of climate-smart innovation output or deployment. Some firms may be misclassified because their business scope is broad or imprecise, while others may engage in climate-smart activities without listing the relevant keywords. Furthermore, although informed by the prior literature, the keyword selection is not exhaustive and may miss emerging technology domains such as AI-driven climate modelling, digital twins for urban energy systems, or blockchain-based carbon tracking. Future research could complement this text-based measure with patent data, technology licensing records, or survey-based technology adoption indicators to improve measurement precision and validate the robustness of the results. (3) Because the “Broadband China” pilot programme was rolled out in staggered batches, future work could adopt a multi-period difference-in-differences framework to enable a more granular policy assessment. (4) Potential spatial dependence issues remain unaddressed. Subsequent research may further investigate the spatial spillover effects of climate-smart technology. (5) The evidence obtained from our mediation analysis remains associational rather than strictly causal. Future research could leverage quasi-experimental designs to draw more robust causal inferences regarding underlying transmission mechanisms.
Author Contributions
Conceptualisation, J.L.; methodology, J.L.; software, J.L.; validation, J.L.; formal analysis, J.L. and Y.L.; investigation, J.L.; resources, J.L.; data curation, J.L.; writing—original draft preparation, J.L. and Y.L.; writing—review and editing, J.L. and Y.L.; visualisation, J.L.; supervision, Y.L.; project administration, Y.L.; funding acquisition, Y.L. All authors have read and agreed to the published version of the manuscript.
Funding
This research was funded by “the National Natural Science Foundation of China, grant number 72604296”, “the Collaborative Innovation Center for Emissions Trading System Co-constructed by the Province and Ministry, grant number 25CICETS-YB010”, “the China Postdoctoral Science Foundation, grant number 2024M762456”, “the Hubei Province Postdoctoral Innovative Program, grant number 2024HBBHCXB069”, and “the Fundamental Research Funds for the Central Universities of Wuhan University, grant numbers 2026PTJS001, 1203-413000163, 1203-413000172, and 1203-413100198”.
Institutional Review Board Statement
Not applicable.
Informed Consent Statement
Not applicable.
Data Availability Statement
The raw data supporting the conclusions of this article will be made available by the authors on request. The energy-related variables are constructed from the China Energy Statistical Yearbook. Urban socio-economic-related variables are mainly drawn from the China Urban Statistical Yearbook and the China Stock Market Accounting Research Database. Climate-smart technology companies are identified from registration records in the China Enterprise Registration Database and data from the AIQICHA Credit Information Limited Company. The final balanced panel contains 2820 city–year observations.
Acknowledgments
The authors are grateful to the editor and anonymous reviewers for their constructive feedback. The authors confirm that no generative-AI tools were used during manuscript preparation. The final content has been reviewed and approved by the authors, who bear full responsibility for the publication.
Conflicts of Interest
Author J.L. declares that he has no conflicts of interest. Author Y.L. is the guest editor and he was blinded during the review process. This research was handled by an academic editor from the Editorial Office who has no conflicts of interest.
References
- Jindal, A.; Shrimali, G.; Gallice, B.; Buller, A.; Cervenka, J.; Sarkar, A.; Borsuk, M. Energy-Transition Risks Create Uneven Financial Impacts across India’s Power Sector. Commun. Earth Environ. 2026, 7, 517. [Google Scholar] [CrossRef] [Scilit]
- Sharma, A.; Singh, S.N.; Serratos, M.M.; Sahu, D.; Strezov, V. Urban Energy Transition in Smart Cities: A Comprehensive Review of Sustainability and Innovation. Sustain. Futures 2025, 10, 100940. [Google Scholar] [CrossRef] [Scilit]
- Yatzkan, O.; Cohen, R.; Yaniv, E.; Rotem-Mindali, O. Urban Energy Transitions: A Systematic Review. Land 2025, 14, 566. [Google Scholar] [CrossRef] [Scilit]
- Dong, H.; Liu, Y.; Zhao, Z.; Tan, X.; Managi, S. Carbon Neutrality Commitment for China: From Vision to Action. Sustain. Sci. 2022, 17, 1741–1755. [Google Scholar] [CrossRef] [Scilit]
- Xiao, L.; Jia, J.; Lei, Q.; Zhang, Z. Energy Transition and Urban Green Technological Innovation: Evidence from New Energy Demonstration City Policy. Energy 2026, 350, 140641. [Google Scholar] [CrossRef] [Scilit]
- Liu, Y.; Deng, L. Mapping Carbon Emission Networks in China: Insights from Province-Level Spatial Differentiation. Carbon Footpr. 2024, 3, 18. [Google Scholar] [CrossRef] [Scilit]
- Zhang, S.; Chen, W. Exploring the Feasible Net-Zero Transition Pathway in China Considering Energy System Flexibility. Nat. Commun. 2026, 17, 5440. [Google Scholar] [CrossRef] [Scilit]
- Liu, P.; Peng, H. What Drives the Green and Low-Carbon Energy Transition in China?: An Empirical Analysis Based on a Novel Framework. Energy 2022, 239, 122450. [Google Scholar] [CrossRef] [Scilit]
- Xu, H.; Cao, Z.; Han, D. Towards Sustainable Development: Can Industrial Intelligence Promote Carbon Emission Reduction. Sustainability 2025, 17, 370. [Google Scholar] [CrossRef] [Scilit]
- Delic, M.; Bucksteeg, M. Implications of the Solar Rebound Effect for the European Energy Transition. Nat. Energy 2026, 11, 876–888. [Google Scholar] [CrossRef] [Scilit]
- Nshakira-Rukundo, E.; Tabe-Ojong, M.P.J.; Gebrekidan, B.H.; Agaba, M.; Surendran-Padmaja, S.; Dhehibi, B. Adoption of Climate-Smart Agricultural Technologies and Practices in Fragile and Conflict-Affected Settings. Commun. Earth Environ. 2026, 7, 304. [Google Scholar] [CrossRef] [Scilit]
- Wang, R.; Li, C.; An, Z.; Chang, S.X. Climate-Smart Forestry: Strategies, Policies, and Technologies for Enhancing Climate Change Mitigation and Ecosystem Sustainability. Clim. Smart Agric. 2026, 3, 100110. [Google Scholar] [CrossRef] [Scilit]
- Probst, B.; Touboul, S.; Glachant, M.; Dechezleprêtre, A. Global Trends in the Invention and Diffusion of Climate Change Mitigation Technologies. Nat. Energy 2021, 6, 1077–1086. [Google Scholar] [CrossRef] [Scilit]
- Mishra, T.; Gaurav, S.; Bose, D.; Kumar, A.; Singh, M. Exploring Barriers to Adoption of Climate-Smart Agriculture among Smallholder Farmers in Odisha, India. Sci. Rep. 2026, 16, 13125. [Google Scholar] [CrossRef] [Scilit]
- Battini, F.; Menapace, A.; Stradiotti, G.; Zanfei, A.; Nicolosi, F.F.; Dalla Torre, D.; Renzi, M.; Pernigotto, G.; Ravazzolo, F.; Righetti, M.; et al. Urban Smart Energy Systems from a Climate Change Perspective: Technical, Economic and Environmental Optimization Analysis. Smart Energy 2025, 18, 100180. [Google Scholar] [CrossRef] [Scilit]
- Renukappa, S.; English, V.; Suresh, S.; Subbarao, C.; Veenith, T. Delivering Climate Resilient Water Sector: A Smart Cities Perspective. Cities 2026, 174, 107057. [Google Scholar] [CrossRef] [Scilit]
- Halleck-Vega, S.; Mandel, A.; Millock, K. Accelerating Diffusion of Climate-Friendly Technologies: A Network Perspective. Ecol. Econ. 2018, 152, 235–245. [Google Scholar] [CrossRef] [Scilit]
- Guilhot, L. An Analysis of China’s Energy Policy from 1981 to 2020: Transitioning towards to a Diversified and Low-Carbon Energy System. Energy Policy 2022, 162, 112806. [Google Scholar] [CrossRef] [Scilit]
- Wang, J.; Wu, H.; Chen, Y. Made in China 2025 and Manufacturing Strategy Decisions with Reverse QFD. Int. J. Prod. Econ. 2020, 224, 107539. [Google Scholar] [CrossRef] [Scilit]
- Boiral, O.; Morin, G.; Yuriev, A.; Talbot, D. Managing Organizational Carbon Neutrality: A Systematic Review. Corp. Soc. Responsib. Environ. Manag. 2025, 32, 2191–2206. [Google Scholar] [CrossRef] [Scilit]
- He, R.; Dai, Y.; Sun, G. How Agricultural Extension Services Affect Farmers’ Adoption of Climate-Smart Technology? Evidence from Rural China. J. Environ. Plan. Manag. 2026, 69, 2173–2203. [Google Scholar] [CrossRef] [Scilit]
- Zewdu, D.; Krishnan, C.M.; Raj, P.P.N.; Arlikatti, S.; McAleavy, T. Climate-Smart Innovation Practices and Sustainable Rural Livelihoods: A Systematic Literature Review. Technol. Soc. 2025, 82, 102914. [Google Scholar] [CrossRef] [Scilit]
- Sadiq, M.; Aldeehani, T.M.; Salman, S.M.; Riaz, S.; Khan, A. Emerging Sustainable Energy Technologies to Combat Climate Change: Evidence Using Non-Linear ARDL Estimation. Transform. Bus. Econ. 2025, 24, 136–154. [Google Scholar] [CrossRef] [Scilit]
- Ma, Y.; Feng, G.-F.; Chang, C.-P. The Impact of Energy Security on Energy Innovation: A Non-Linear Analysis. Appl. Econ. 2025, 57, 1867–1887. [Google Scholar] [CrossRef] [Scilit]
- Sun, Y.; Razzaq, A.; Sun, H.; Irfan, M. The Asymmetric Influence of Renewable Energy and Green Innovation on Carbon Neutrality in China: Analysis from Non-Linear ARDL Model. Renew. Energy 2022, 193, 334–343. [Google Scholar] [CrossRef] [Scilit]
- Bai, L.; Guo, T.; Xu, W.; Liu, Y.; Kuang, M.; Jiang, L. Effects of Digital Economy on Carbon Emission Intensity in Chinese Cities: A Life-Cycle Theory and the Application of Non-Linear Spatial Panel Smooth Transition Threshold Model. Energy Policy 2023, 183, 113792. [Google Scholar] [CrossRef] [Scilit]
- Bousnina, R.; Lajnaf, R.; Mnif, S.; Gabsi, F.B. Economic Growth, Technological Innovation and CO2 Emissions in Developed Countries: Is There an Inverted U-Shaped Relationship? Manag. Environ. Qual. Int. J. 2025, 36, 2106–2126. [Google Scholar] [CrossRef] [Scilit]
- Khurshid, N.; Fiaz, A.; Khurshid, J.; Ali, K. Impact of Climate Change Shocks on Economic Growth: A New Insight from Non-Linear Analysis. Front. Environ. Sci. 2022, 10, 1039128. [Google Scholar] [CrossRef] [Scilit]
- Liu, B.; Yin, W.; Chen, G.; Yao, J. The Threshold Effect of Climate Risk and the Non-Linear Role of Climate Policy Uncertainty on Insurance Demand: Evidence from OECD Countries. Financ. Res. Lett. 2023, 55, 103820. [Google Scholar] [CrossRef] [Scilit]
- Khan, B.; Ali, S.M.; Ullah, Z. Deep Learning Based Digital Twins Augmented Reality: Model Predictive Control for Battery and Storage Optimisation in Renewable Energy Prosumers Districts. J. Energy Storage 2025, 131, 117565. [Google Scholar] [CrossRef] [Scilit]
- Munonye, W.C. Circular Economy Meets Smart Energy Grids: Designing Systems for Resource Optimization and Carbon Reduction. Front. Sustain. 2025, 6, 1568254. [Google Scholar] [CrossRef] [Scilit]
- Latchiba, W.E.; Waita, S.; Krueger, R.; Mwabora, J.M. Assessment of the Life Cycle of Photovoltaic Solar Technologies for Sustainable Energy Transitions: Implications for Climate Policy and Low-Carbon System Integration. Resour. Environ. Sustain. 2026, 25, 100328. [Google Scholar] [CrossRef] [Scilit]
- Zhang, C.; Li, R.; Wang, Q. Artificial Intelligence and Sustainable Development: A Global Non-linear Analysis of the Moderating Roles of Human Capital and Renewable Energy. Renew. Sustain. Energy Rev. 2026, 228, 116574. [Google Scholar] [CrossRef] [Scilit]
- Chen, W.; Song, Z.; Xie, Y. Energy Transition across the Climate Policy Uncertainty Divide: The Critical Role of Green Technology Innovation and Digital Transformation. Econ. Anal. Policy 2026, 90, 322–342. [Google Scholar] [CrossRef] [Scilit]
- De Bruyn, C.; Said, F.B.; Venter, M.; Castanho, R.A. Are Smart Technologies Enough to Build Climate-Resilient Cities? A Bibliometric Assessment of Global Trends and Research Gaps. City Environ. Interact. 2026, 29, 100306. [Google Scholar] [CrossRef] [Scilit]
- Zambrano-Monserrate, M.A.; Gyamfi, B.A.; Usman, O.; Sanchez-Loor, D.A. The Network Effect of Green Finance: Driving China’s Sustainable Energy Transition. Glob. Financ. J. 2026, 71, 101281. [Google Scholar] [CrossRef] [Scilit]
- Yang, X.; Wang, W.; Yu, M. Smart Supply Chain Adoption and Urban Energy Transition: Empirical Evidence on de-Coalization Effects. J. Environ. Manag. 2025, 390, 126210. [Google Scholar] [CrossRef] [Scilit]
- Yu, J.; Cai, X.; Ji, X.; Liang, L.; Yang, J. Promoting Urban Energy Transitions: Lessons from Interpretable Machine Learning with Evidence from China. Energy 2025, 334, 137812. [Google Scholar] [CrossRef] [Scilit]
- Hu, Y.; Liu, Y.; Wang, Z. How Does China’s Energy Quota Trading Policy Affect Regional Energy Transition? Util. Policy 2026, 100, 102171. [Google Scholar] [CrossRef] [Scilit]
- Shobande, O.A.; Ogbeifun, L.; Tiwari, A.K. Carbon Neutrality: Synergy for Energy Transition, Circular Economy and Inclusive Green Growth. J. Environ. Manag. 2025, 374, 124114. [Google Scholar] [CrossRef] [Scilit]
- Tan, X.; Xiao, Z.; Liu, Y.; Taghizadeh-Hesary, F.; Wang, B.; Dong, H. The Effect of Green Credit Policy on Energy Efficiency: Evidence from China. Technol. Forecast. Soc. Change 2022, 183, 121924. [Google Scholar] [CrossRef] [Scilit]
- Zhou, Y. Low-Carbon Transition in Smart City with Sustainable Airport Energy Ecosystems and Hydrogen-Based Renewable-Grid-Storage-Flexibility. Energy Rev. 2022, 1, 100001. [Google Scholar] [CrossRef] [Scilit]
- Dong, H.; Xue, M.; Xiao, Y.; Liu, Y. Do Carbon Emissions Impact the Health of Residents? Considering China’s Industrialization and Urbanization. Sci. Total Environ. 2021, 758, 143688. [Google Scholar] [CrossRef] [Scilit]
- Chen, G.; Liu, Y.; Gao, Q.; Zhang, J. Does Regional Services Development Enhance Manufacturing Firm Productivity? A Manufacturing Servitization Perspective. Int. Rev. Econ. Financ. 2023, 86, 451–466. [Google Scholar] [CrossRef] [Scilit]
- Cheng, Y.S.; Tsang, K.P.; Woo, C.K. Protectionism’s Adverse Impact on Renewable Energy Deployment: Evidence from the European Union’s Import Duties on China-Made Photovoltaic Panels. Energy Policy 2025, 206, 114789. [Google Scholar] [CrossRef] [Scilit]
- Ge, J. Artificial Intelligence and Urban Energy Sustainability: A Spatial Analysis from Chinese Cities. Smart Grids Sustain. Energy 2026, 11, 5. [Google Scholar] [CrossRef] [Scilit]
- Buonomano, A.; Forzano, C.; Giuzio, G.F.; Maka, R.; Palombo, A.; Russo, G. Optimising Renewable Energy Community Aggregation for Urban Districts Decarbonisation. Renew. Sustain. Energy Rev. 2026, 226, 116411. [Google Scholar] [CrossRef] [Scilit]
- Wang, Q.; Wang, L.; Li, R. Could Trade Protectionism Reshape the Nexus of Energy-Economy-Environment? Insight from Different Income Groups. Resour. Policy 2023, 85, 103937. [Google Scholar] [CrossRef] [Scilit]
- Liu, Y.; Tan, X. ESG-Driven Supply Chains: A Path to Energy Transition. Sustain. Futures 2026, 11, 101937. [Google Scholar] [CrossRef] [Scilit]
- Tang, J.; Wang, L. More Green Subsidies, Less Carbon Emissions? Evidence from China’s NEVs Subsidy Stimulus and Rollback. Resour. Conserv. Recycl. 2026, 225, 108639. [Google Scholar] [CrossRef] [Scilit]
- Yan, X.; Sun, T. Artificial Intelligence Development and Carbon Emission Intensity: Evidence from Industrial Robot Application. Sustainability 2025, 17, 3867. [Google Scholar] [CrossRef] [Scilit]
- Zhang, X.; Liu, P.; Zhu, H. The Impact of Industrial Intelligence on Energy Intensity: Evidence from China. Sustainability 2022, 14, 7219. [Google Scholar] [CrossRef] [Scilit]
- Li, L.; Jin, S.; Zhao, J.; Ma, C.; Diao, Y. Artificial Intelligence and Digital Industry Agglomeration Development -Theory and Empirical Analysis from Urban Economics. Econ. Anal. Policy 2026, 90, 1071–1088. [Google Scholar] [CrossRef] [Scilit]
- Park, G.; Kang, S.; Yi, S.; Kim, J. Diverse Impacts of AI Investments on Productivity Gains: Effects of Industry and Innovation Characteristics. Technol. Forecast. Soc. Change 2026, 224, 124471. [Google Scholar] [CrossRef] [Scilit]
- Chen, P.; Gao, J.; Ji, Z.; Liang, H.; Peng, Y. Do Artificial Intelligence Applications Affect Carbon Emission Performance?—Evidence from Panel Data Analysis of Chinese Cities. Energies 2022, 15, 5730. [Google Scholar] [CrossRef] [Scilit]
- Li, Z.; Yang, H.; Zhang, T. Impact of Enterprise Artificial Intelligence Development on Human Capital Structure. Financ. Res. Lett. 2025, 82, 107600. [Google Scholar] [CrossRef] [Scilit]
- Kartal, M.T.; Kim, E.; Mukhtarov, S.; Taşkın, D.; Kirikkaleli, D.; Kılıç Depren, S.; Park, J. Effect of AI-Related Patents, Energy Transition, Environmental Policy Stringency, Income, and Energy Consumption Sub-Types on the Environmental Sustainability: Evidence from China by KRLS Approach. J. Environ. Manag. 2025, 395, 127924. [Google Scholar] [CrossRef] [Scilit]
- Kartal, M.T.; Kim, E.; Mukhtarov, S.; Taşkın, D.; Kirikkaleli, D.; Kılıç Depren, S.; Park, J. Relationship between CO2 Emissions and Energy Consumption Sub-Types under Impact of AI-Related Patents and Energy-Related R&D Investments: Evidence from the USA by Novel Quantile-Based Methods. J. Clean. Prod. 2026, 538, 147299. [Google Scholar] [CrossRef] [Scilit]
- Nurmalitasari; Nurchim; Lestari, R.D. Artificial Intelligence-Driven Solar Smart Irrigation for Sustainable Agriculture: Trends, Challenges, and SDG Implications—A Systematic Review. Smart Agric. Technol. 2025, 12, 101665. [Google Scholar] [CrossRef] [Scilit]
- Wang, F.; Guan, G.; Wang, Q. Green Financing the Future: How Smart Cities Transform China’s Carbon Emissions Landscape. Int. Rev. Econ. Financ. 2026, 105, 104823. [Google Scholar] [CrossRef] [Scilit]
- Habtewold, T.M. Impact of Climate-Smart Agricultural Technology on Multidimensional Poverty in Rural Ethiopia. J. Integr. Agric. 2021, 20, 1021–1041. [Google Scholar] [CrossRef] [Scilit]
- Wang, H.J.; Chong, W.Y.; Wang, B.N. Institutional Barriers to Digital Transformation in China’s Renewable Energy: Evidence from Ningxia. Energy Strategy Rev. 2026, 63, 102028. [Google Scholar] [CrossRef] [Scilit]
- Ouédraogo, M.; Houessionon, P.; Zougmoré, R.B.; Partey, S.T. Uptake of Climate-Smart Agricultural Technologies and Practices: Actual and Potential Adoption Rates in the Climate-Smart Village Site of Mali. Sustainability 2019, 11, 4710. [Google Scholar] [CrossRef] [Scilit]
- Zakaria, A.; Alhassan, S.I.; Kuwornu, J.K.M.; Azumah, S.B.; Derkyi, M.A.A. Factors Influencing the Adoption of Climate-Smart Agricultural Technologies Among Rice Farmers in Northern Ghana. Earth Syst. Environ. 2020, 4, 257–271. [Google Scholar] [CrossRef] [Scilit]
- Tanti, P.C.; Jena, P.R.; Aryal, J.P.; Rahut, D.B. Role of Institutional Factors in Climate-smart Technology Adoption in Agriculture: Evidence from an Eastern Indian State. Environ. Chall. 2022, 7, 100498. [Google Scholar] [CrossRef] [Scilit]
- Mwongera, C.; Shikuku, K.M.; Twyman, J.; Läderach, P.; Ampaire, E.; Van Asten, P.; Twomlow, S.; Winowiecki, L.A. Climate Smart Agriculture Rapid Appraisal (CSA-RA): A Tool for Prioritising Context-Specific Climate Smart Agriculture Technologies. Agric. Syst. 2017, 151, 192–203. [Google Scholar] [CrossRef] [Scilit]
- Mastoi, M.S.; Wang, D.; Ma, N.; Hassan, M.; Shafiullah, M.; Bashir, T.; Hassan, A.; Flah, A. AI-Driven Control and Optimization for Renewable Energy Integration in Smart Grids: Challenges, Applications, and Future Research Directions. Energy Strategy Rev. 2026, 64, 102049. [Google Scholar] [CrossRef] [Scilit]
- Saadi, S.A.; Katekhaye, D.; Magda, R. Applications of Artificial Intelligence in Renewable Energy Transition: A Systematic Literature Review. Energies 2026, 19, 1839. [Google Scholar] [CrossRef] [Scilit]
- Baškarada, S.; McKay, T.; McKenna, T. Technology Deployment Process Model. Oper. Manag. Res. 2013, 6, 105–118. [Google Scholar] [CrossRef] [Scilit]
- Lehmann, P.; Söderholm, P. Can Technology-Specific Deployment Policies Be Cost-Effective? The Case of Renewable Energy Support Schemes. Environ. Resour. Econ. 2018, 71, 475–505. [Google Scholar] [CrossRef] [Scilit]
- Anjanappa, J.; Samant, S.M. Assessing Enabling Environment and Challenges for Deploying Climate Technologies in Energy Sector for India. J. Oper. Strateg. Plan. 2025, 8, 8–34. [Google Scholar] [CrossRef] [Scilit]
- Grahmann, K.; Thielemann, L.; Rohlmann, L.; Roy, A.; Weltzien, C. The Role of Autonomous Mechanical Weeding Robots in Climate-Smart Soil Management: A Scoping Review. Eur. J. Soil Sci. 2026, 77, e70302. [Google Scholar] [CrossRef] [Scilit]
- Sow Badji, A.; Gathu, C. Leveraging Public-Private Partnerships for Climate Finance: Advancing Climate-Smart Agriculture for NDC Implementation in Kenya and Senegal. Clim. Policy 2026, 1–15. [Google Scholar] [CrossRef] [Scilit]
- Alemayehu, S.; Ayalew, Z.; Sileshi, M.; Zeleke, F. The Impact of Climate Smart Agriculture Practices on the Technical Efficiency of Wheat Farmers in Northwestern Ethiopia. Environ. Dev. Sustain. 2024, 28, 7231–7253. [Google Scholar] [CrossRef] [Scilit]
- Radtke, J.; Canzler, W. Editorial: Energy Transitions in Times of Crisis: A Social Science Perspective. Renew. Sustain. Energy Rev. 2026, 230, 116717. [Google Scholar] [CrossRef] [Scilit]
- Wang, H.; Liu, L.-J. Innovation-Economic Trade-Offs: A Perspective of Low-Carbon Policy Intensity. Econ. Model. 2026, 158, 107527. [Google Scholar] [CrossRef] [Scilit]
- Zaghwan, A.; Gunawan, I. Energy Loss Impact in Electrical Smart Grid Systems in Australia. Sustainability 2021, 13, 7221. [Google Scholar] [CrossRef] [Scilit]
- Malik, A.S.; Bouzguenda, M. Effects of Smart Grid Technologies on Capacity and Energy Savings—A Case Study of Oman. Energy 2013, 54, 365–371. [Google Scholar] [CrossRef] [Scilit]
- Kaushal, L.A.; Dwivedi, A. Human Capital, Digital Transition and Carbon Emissions: Investigating Non-Linear Dynamics for Sustainable and Human-Centric Future. J. Environ. Manag. 2026, 398, 128449. [Google Scholar] [CrossRef] [Scilit]
- Sibt-e-Ali, M.; Xiqiang, X.; Javed, K.; Javaid, M.Q.; Vasa, L. Greening the Future: Assessing the Influence of Technological Innovation, Energy Transition and Financial Globalization on Ecological Footprint in Selected Emerging Countries. Environ. Dev. Sustain. 2026, 28, 2105–2131. [Google Scholar] [CrossRef] [Scilit]
- Barrios-Sánchez, J.M.; De Blas, I.; Brazzini, T.; Miguel-González, L.J. Historical Baselines and Empirical Constraints on Global and Sectoral Energy Intensity Pathways. Energy Strategy Rev. 2026, 64, 102197. [Google Scholar] [CrossRef] [Scilit]
- Evro, S.; Alamooti, M.; Tomomewo, O.S. Quantifying the Global Energy Transition: A Policy-Ready Framework Linking Renewable Deployment and Emissions Outcomes. Renew. Sustain. Energy Rev. 2026, 225, 116189. [Google Scholar] [CrossRef] [Scilit]
- Feng, Y.; Zhang, J.; Geng, Y.; Jin, S.; Zhu, Z.; Liang, Z. Explaining and Modeling the Reduction Effect of Low-Carbon Energy Transition on Energy Intensity: Empirical Evidence from Global Data. Energy 2023, 281, 128276. [Google Scholar] [CrossRef] [Scilit]
- Hou, Y.; Yang, M.; Ma, Y.; Zhang, H. Study on City’s Energy Transition: Evidence from the Establishment of the New Energy Demonstration Cities in China. Energy 2024, 292, 130549. [Google Scholar] [CrossRef] [Scilit]
- Lee, C.-C.; Feng, Y.; Peng, D. A Green Path towards Sustainable Development: The Impact of Low-Carbon City Pilot on Energy Transition. Energy Econ. 2022, 115, 106343. [Google Scholar] [CrossRef] [Scilit]
- Zou, Y.; Wang, M. Does Environmental Regulation Improve Energy Transition Performance in China? Environ. Impact Assess. Rev. 2024, 104, 107335. [Google Scholar] [CrossRef] [Scilit]
- Zheng, L.; An, Q.; Shi, Y. Does Policy-Oriented Corporate Climate Attention Improve Firms’ ESG Performance? Res. Int. Bus. Financ. 2026, 90, 103523. [Google Scholar] [CrossRef] [Scilit]
- Liu, Y.; Huang, J.; Xu, J.; Xiong, S. Natural Resource Dependence and Sustainable Development Policy: Insights from City-Level Analysis. Resour. Policy 2024, 91, 104928. [Google Scholar] [CrossRef] [Scilit]
- Pandey, R.; Asche, F.; Rani, N. The Impact of Corporate Climate Change Exposure and ESG Media Coverage on Renewable Energy Consumption. Int. Rev. Econ. Financ. 2026, 109, 105424. [Google Scholar] [CrossRef] [Scilit]
- Chen, P.; Dagestani, A.A. Urban Planning Policy and Clean Energy Development Harmony- Evidence from Smart City Pilot Policy in China. Renew. Energy 2023, 210, 251–257. [Google Scholar] [CrossRef] [Scilit]
- Jadhav, S.; Durairaj, M.; Reenadevi, R.; Subbulakshmi, R.; Gupta, V.; Ramesh, J.V.N. Spatiotemporal Data Fusion and Deep Learning for Remote Sensing-Based Sustainable Urban Planning. Int. J. Syst. Assur. Eng. Manag. 2024. [Google Scholar] [CrossRef] [Scilit]
- Tong, H.; Xia, E.; Sun, C.; Zhu, F.; Huang, J. How Climate-Smart Agricultural Technologies Impact Farmers’ Income and Yield in China. Smart Agric. Technol. 2025, 12, 101622. [Google Scholar] [CrossRef] [Scilit]
- Bakaeva, N.; Le, M.T. Determination of Urban Pollution Islands by Using Remote Sensing Technology in Moscow, Russia. Ecol. Inform. 2022, 67, 101493. [Google Scholar] [CrossRef] [Scilit]
- Cheung, T.T.T.; Fuller, S.; Oßenbrügge, J. Mobilising Change in Cities: A Capacity Framework for Understanding Urban Energy Transition Pathways. Environ. Policy Gov. 2023, 33, 531–545. [Google Scholar] [CrossRef] [Scilit]
- Stoeglehner, G.; Abart-Heriszt, L. Integrated Spatial and Energy Planning in Styria—A Role Model for Local and Regional Energy Transition and Climate Protection Policies. Renew. Sustain. Energy Rev. 2022, 165, 112587. [Google Scholar] [CrossRef] [Scilit]
- Nie, C.; Lu, Z.; Feng, Y. The Smarter the Cleaner: Evaluating the Impact of Artificial Intelligence on Haze Pollution. Urban Clim. 2024, 58, 102202. [Google Scholar] [CrossRef] [Scilit]
- Liu, Y.; Dong, H.; Wang, Y. In the Same Boat: Climate Risk and Hidden Debt in the Supply Chain. J. Int. Money Financ. 2025, 153, 103299. [Google Scholar] [CrossRef] [Scilit]
- Zhu, K.; Du, L.; Feng, Y. Government Attention on Environmental Protection and Firms’ Carbon Reduction Actions: Evidence from Text Analysis of Manufacturing Enterprises. J. Clean. Prod. 2023, 423, 138703. [Google Scholar] [CrossRef] [Scilit]
- Zhang, G.; Chang, F.; Liu, J. Carbon Emission Prediction of 275 Cities in China Considering Artificial Intelligence Effects and Feature Interaction: A Heterogeneous Deep Learning Modeling Framework. Sustain. Cities Soc. 2024, 114, 105776. [Google Scholar] [CrossRef] [Scilit]
- Zhang, G.; Ma, S.; Zheng, M.; Li, C.; Chang, F.; Zhang, F. Impact of Digitization and Artificial Intelligence on Carbon Emissions Considering Variable Interaction and Heterogeneity: An Interpretable Deep Learning Modeling Framework. Sustain. Cities Soc. 2025, 125, 106333. [Google Scholar] [CrossRef] [Scilit]
- Lind, J.T.; Mehlum, H. With or Without U? The Appropriate Test for a U-Shaped Relationship. Oxf. Bull. Econ. Stat. 2010, 72, 109–118. [Google Scholar] [CrossRef] [Scilit]
- Honma, S.; Ushifusa, Y.; Taghizadeh-Hesary, F.; Vandercamme, L. How Do Energy Efficiency and Renewable Energy Impact Carbon Emissions in Asian Economies? Energy Strategy Rev. 2025, 62, 101993. [Google Scholar] [CrossRef] [Scilit]
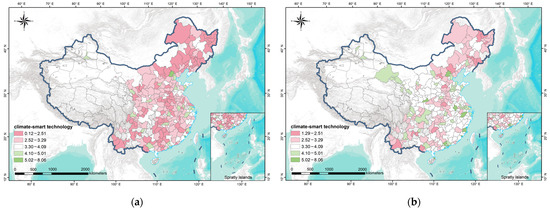
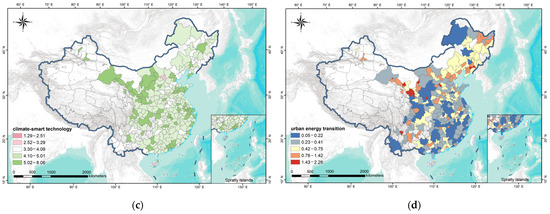
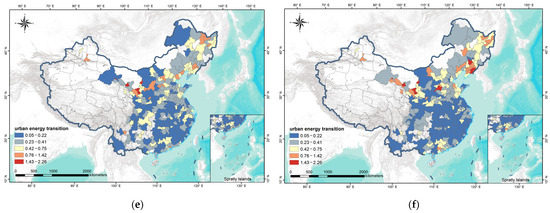
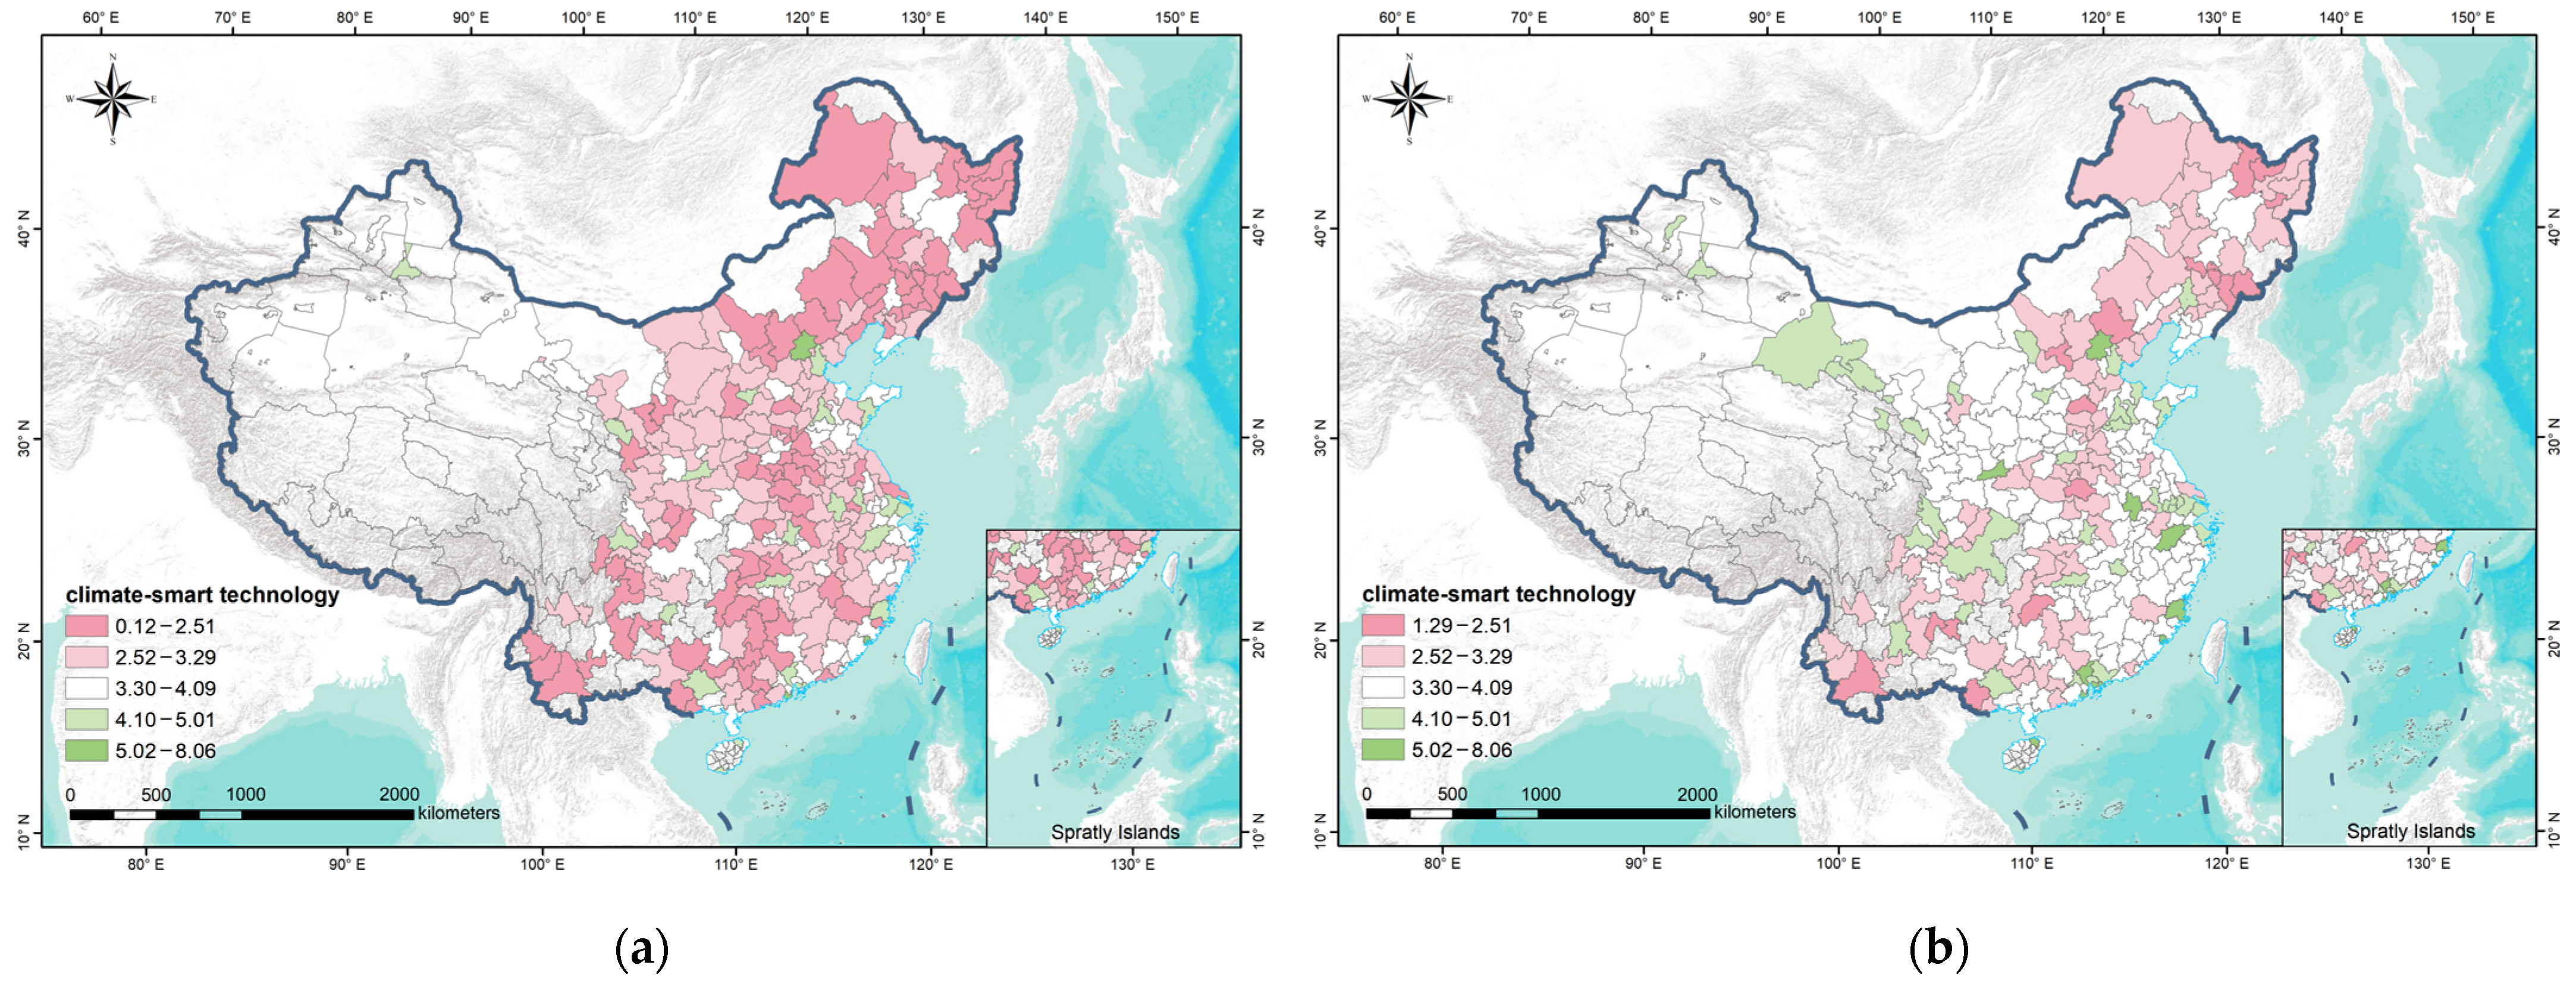
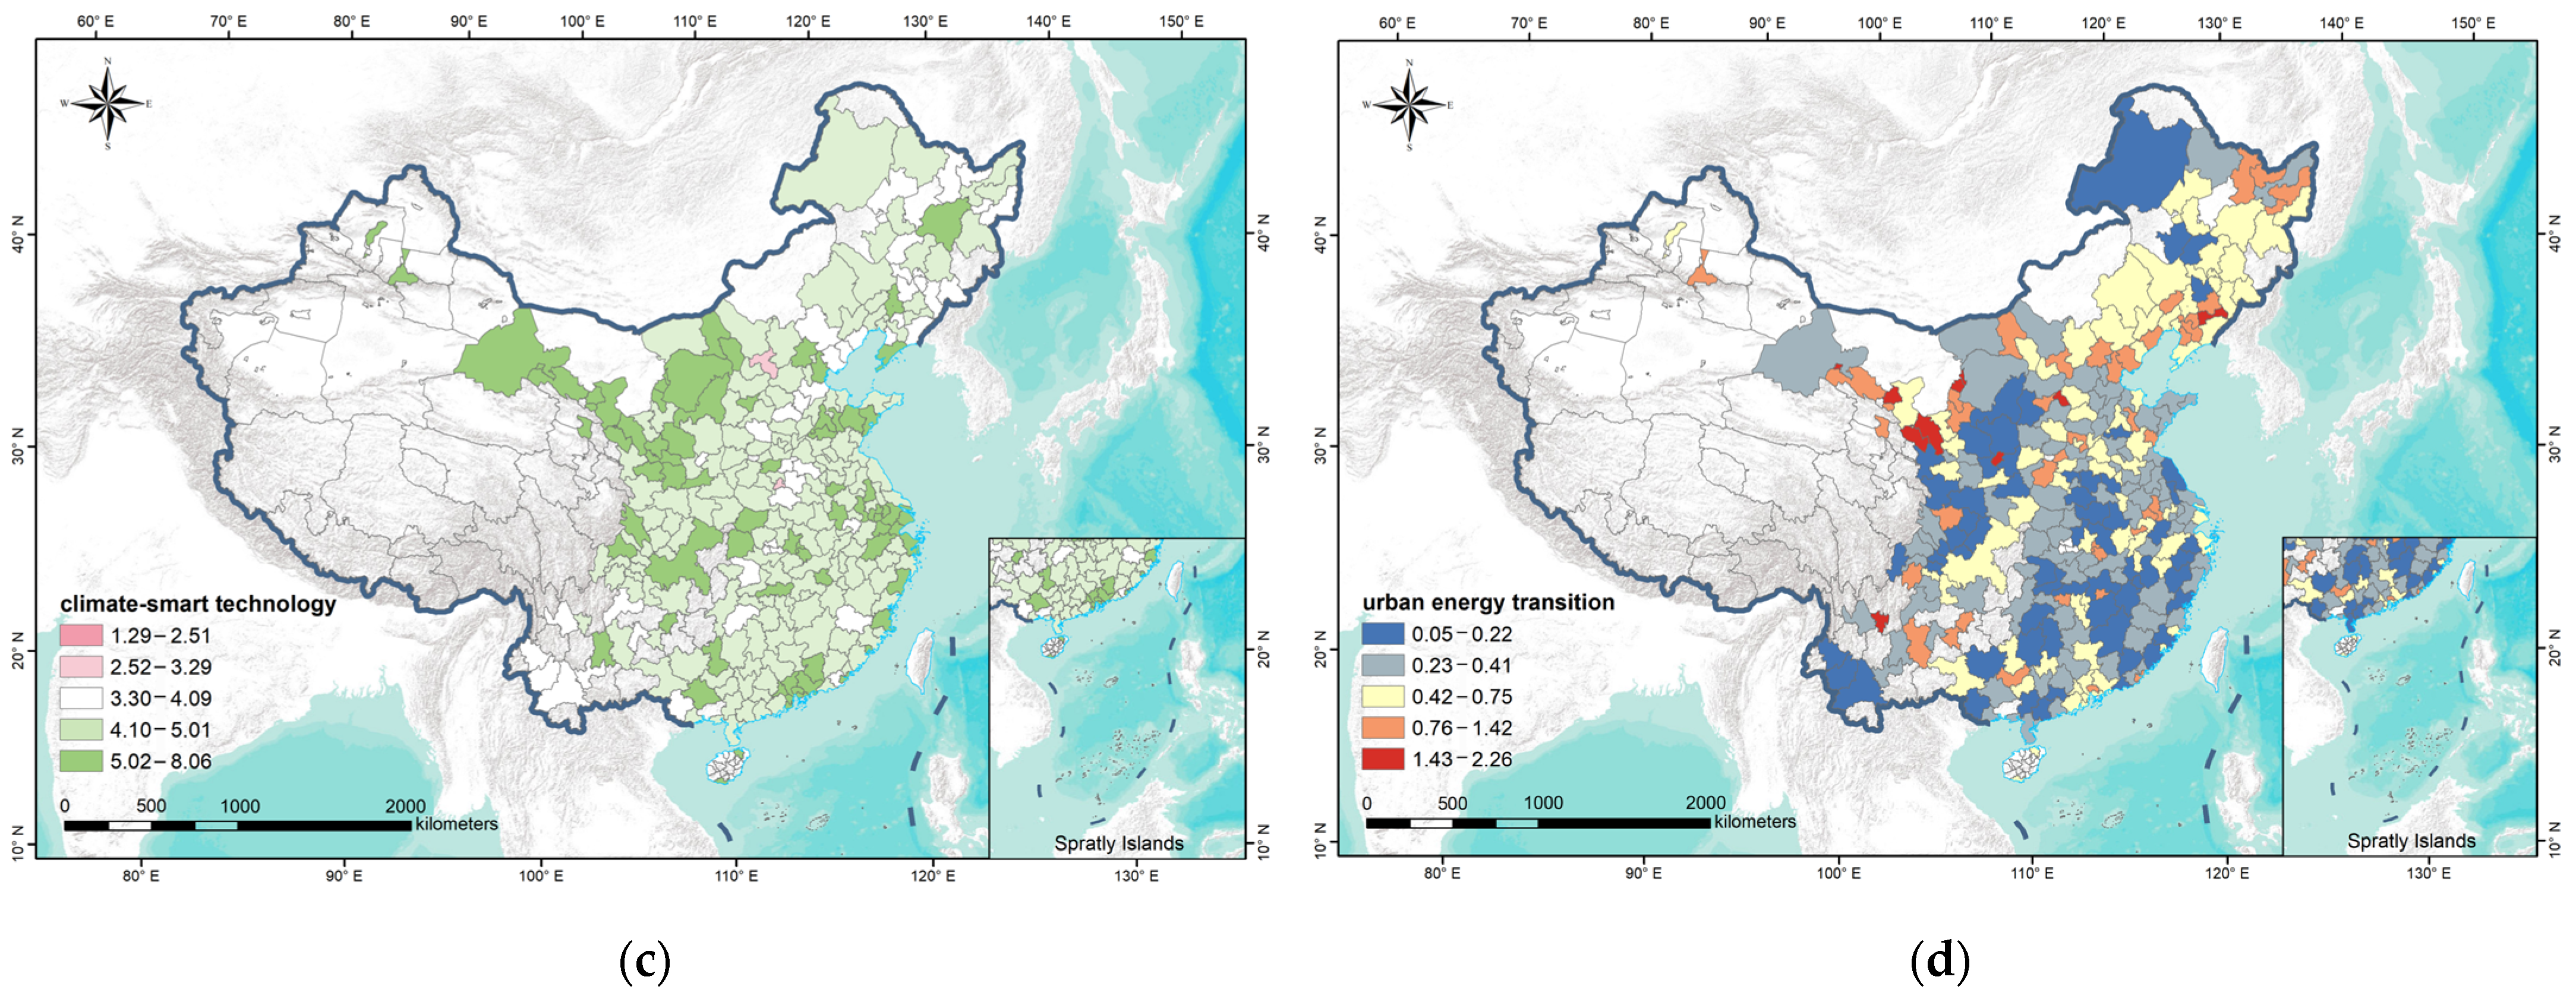
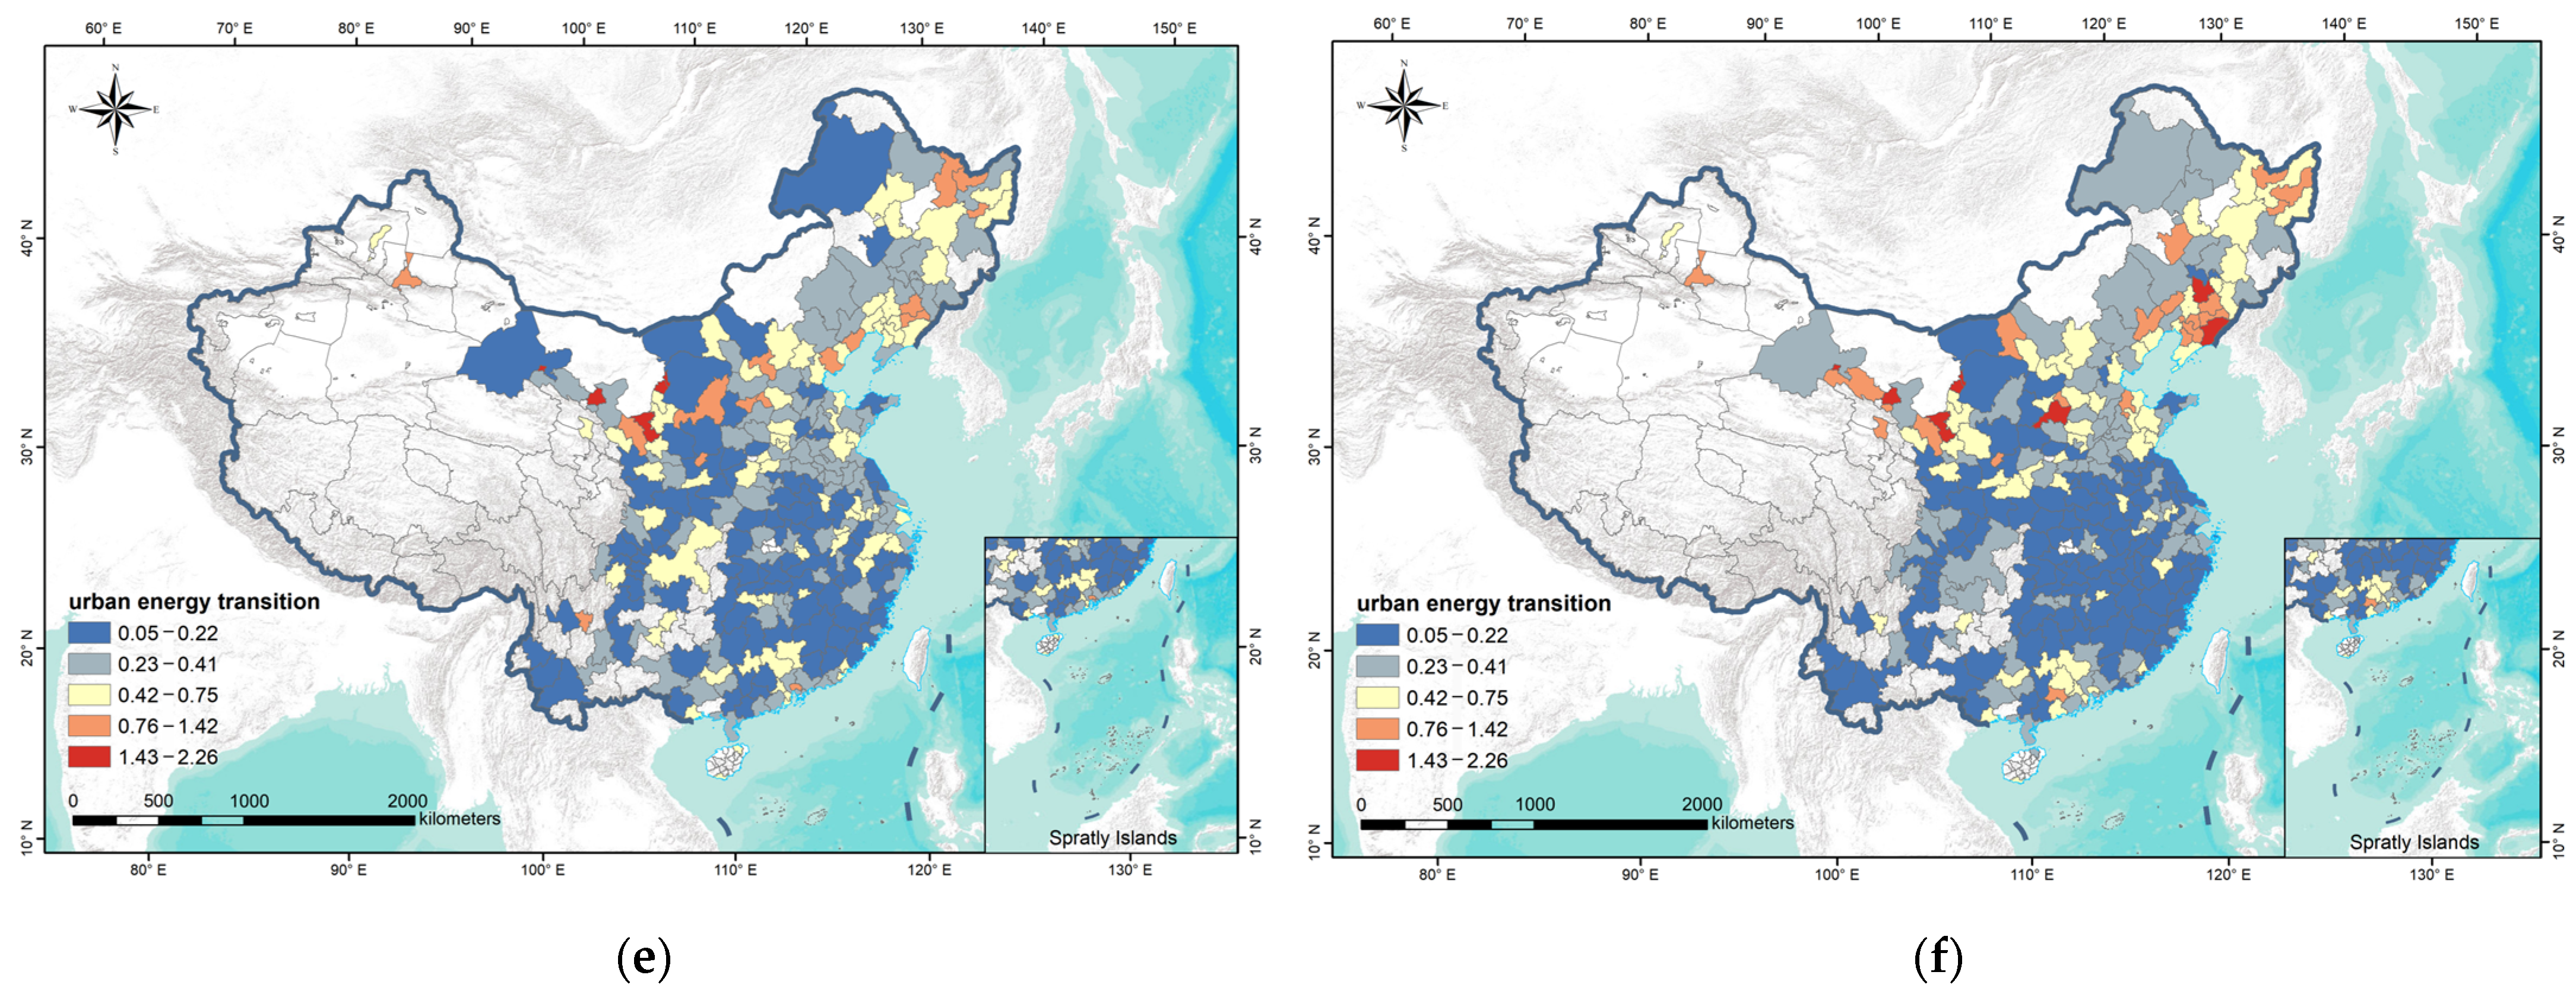

Disclaimer/Publisher’s Note: The statements, opinions and data contained in all publications are solely those of the individual author(s) and contributor(s) and not of MDPI and/or the editor(s). MDPI and/or the editor(s) disclaim responsibility for any injury to people or property resulting from any ideas, methods, instructions or products referred to in the content. |
© 2026 by the authors. Licensee MDPI, Basel, Switzerland. This article is an open access article distributed under the terms and conditions of the Creative Commons Attribution (CC BY) license.