


Abstract
This study investigates multi-horizon forecasting of solar-based green hydrogen (H2) production in Southern Morocco (Dakhla: 23.7° N, 15.9° W; Laâyoune: 27.2° N, 13.2° W; and Guelmim: 29.0° N, 10.1° W) using daily meteorological time series (2010–2025) derived from NASA POWER and PVGIS. Daily H2 production (kg/day) is estimated through a PV-to-hydrogen conversion model assuming a 100 MW PV plant, a performance ratio of 0.75, and a specific electricity consumption of 50 kWh/kg-H2. We formulate a supervised learning problem to predict H2 at multiple horizons (J + 1, J + 3, and J + 7), combining calendar features, physically motivated variables, and lagged/rolling statistics. Models are trained on 2010–2023 and evaluated on 2024–2025 using R2, RMSE, and sMAPE. CatBoost, Random Forest, and LSTM are compared; additionally, a physically interpretable two-step framework is proposed. For J + 1, the best results reach R2 values of 0.863 in Dakhla, 0.795 in Laâyoune, and 0.669 in Guelmim. At the J + 7 horizon, predictive performance remains robust with R2 values of 0.792, 0.759, and 0.556, respectively. The proposed two-step approach yields comparable accuracy (e.g., Dakhla J + 1 R2 = 0.862) while improving physical consistency.
1. Introduction
Green hydrogen is increasingly recognized as a strategic energy vector for deep decarbonization of hard-to-abate sectors, especially when produced from renewable electricity in high-irradiation regions [1,2]. In this context, accurate forecasting of hydrogen production is becoming essential for operational planning, including electrolyzer dispatch, storage management, and offtake scheduling under variable solar resource conditions [3,4].
Southern Morocco, particularly Dakhla-Oued Ed-Dahab, Laâyoune-Sakia El Hamra, and Guelmim-Oued Noun, provides highly favorable solar resources and strong potential for large-scale green hydrogen deployment [5,6]. However, production-oriented forecasting remains challenging because hydrogen output is influenced by non-stationary meteorological variability, seasonal effects, and nonlinear transformations between irradiance and final hydrogen yield [7,8]. Although persistence-based and seasonal baselines are useful reference points, their predictive skill generally decreases as forecast horizon increases [9,10]. In addition, purely data-driven models may provide limited physical interpretability if the PV-to-hydrogen conversion pathway is not explicitly represented [11,12].
Recent studies report growing adoption of machine-learning and deep-learning techniques for renewable-energy and hydrogen-related forecasting tasks, including tree-based methods and sequence models [13,14]. At the same time, there is still a methodological gap between direct statistical prediction of hydrogen production and physics-aware formulations that preserve interpretability and improve robustness across forecast horizons [15,16]. Recent benchmarking practice also emphasizes chronological validation, transparent baseline comparison, and multi-metric evaluation to ensure practical relevance and reproducibility [1,2,17].
To address these limitations, this study proposes a hybrid multi-horizon framework for daily green hydrogen forecasting at J + 1, J + 3, and J + 7 across three southern Moroccan regions. The framework combines calendar descriptors, physically informed predictors, lagged dynamics, and rolling statistics. It compares direct hydrogen forecasting with a two-step pathway that first predicts future irradiance and then converts it into hydrogen through a photovoltaic-to-hydrogen mapping [11,18]. CatBoost is adopted as the principal model, Random Forest is used as a machine-learning baseline, and LSTM is included as an optional deep-learning baseline. The proposed protocol is designed as a reproducible and publication-oriented benchmark for solar-based hydrogen forecasting in emerging green hydrogen hubs.
2. Related Work
2.1. Data-Driven Forecasting of Green Hydrogen Production
Recent studies increasingly investigate direct forecasting of green hydrogen production using machine learning and deep learning models trained on meteorological variables and renewable generation signals. For instance, long historical datasets from Moroccan PV installations have been used to benchmark classical ML models (e.g., Random Forest, SVR) against deep architectures (e.g., MLP, LSTM-CNN), highlighting strong seasonality effects and the sensitivity of predictive performance to PV technology and local climate regimes [19]. Similarly, hybrid decomposition–deep learning pipelines (e.g., CEEMDAN-GRU) have been proposed to improve stability and accuracy, especially when the electrolysis supply is driven by highly variable renewables [20]. In parallel, explainable AI approaches based on deep regression models and SHAP-based interpretation have been introduced to increase transparency of hydrogen-related predictions and to identify dominant drivers (temperature, pressure, humidity, operating conditions) behind model outputs [21]. Beyond single-site studies, recent work also explores leakage-resistant rolling schemes and privacy-preserving learning (federated learning) to forecast green hydrogen production potential from combined solar radiation and wind speed signals, addressing real-world constraints on data sharing and deployment [22].
2.2. Forecast-Informed Operation, Scheduling, and Techno-Economic Coupling in PV-to-H2 Systems
A second line of research integrates forecasting into operational strategies and techno-economic evaluation of PV-to-hydrogen systems. Forecast-driven rolling control has been used to mitigate electrolyzer switching fluctuations and improve conversion efficiency by coupling short-term PV power forecasts with multi-objective operational decision-making [23]. At a system-design level, PV–PEM electrolyzer integration studies demonstrate that optimal PV sizing, clipping usage, and cost assumptions strongly affect hydrogen economics, motivating region-specific forecasting and optimization frameworks rather than one-size-fits-all models [24]. In this spirit, district-scale workflows have combined irradiance forecasting (e.g., XGBoost) with LCOE/LCOH mapping to produce granular spatial decision-support tools for hydrogen hub planning in solar-rich regions [25]. Complementarily, comprehensive reviews clarify that electrolyzer scheduling under renewable intermittency is a core determinant of efficiency, aging, and cost, and underline the importance of realistic operating constraints in predictive and optimization models [26,27].
2.3. Physics-Aware and Two-Step Formulations for Improved Interpretability and Robustness
A methodological gap still exists between black-box direct prediction of hydrogen output and physics-aware formulations that explicitly represent the conversion chain. In solar forecasting, physics-based “two-step” methods (NWP → irradiance → PV power through a physical model chain) have been shown to yield measurable economic value in day-ahead scheduling and can outperform purely statistical competitors under realistic grid penalty schemes, while providing reproducible pipelines [28,29]. These results support analogous two-step designs in hydrogen forecasting, where irradiance is forecast first and then mapped to hydrogen yield via a physically interpretable PV → H2 conversion relationship. In parallel, recent PV forecasting research proposes physics-guided deep architectures that inject physically meaningful features (e.g., indices quantifying cloud attenuation) to improve causal interpretability and performance under rapidly changing sky conditions [30,31]. Very recent work further advances interpretability by decomposing PV time series into physics-estimated and residual components within attention-based neural architectures for days-ahead horizons, directly targeting non-stationarity and distribution shifts [32]. These developments collectively motivate hybrid frameworks that combine (i) strong ML predictors, (ii) explicit physical intermediates, and (iii) transparent two-step conversion logic.
2.4. Benchmarking Protocols, Leakage Control, and Reproducibility
Finally, robust benchmarking is increasingly recognized as essential in multi-horizon forecasting of renewable-driven hydrogen systems. Domain reviews emphasize that forecast accuracy must be assessed in relation to real operational value and forecast error costs, not only via technical metrics [32]. At the methodological level, recent benchmarking platforms propose comprehensive and fair evaluation pipelines, stressing standardized temporal splits, multi-metric reporting, and safeguards against evaluation biases and data leakage—requirements that become critical when comparing heterogeneous models across horizons and regions [33]. For hydrogen applications specifically, the operational scheduling literature highlights that chronological validation and scenario realism are necessary to avoid overly optimistic results that do not generalize to deployment settings [34].
Positioning of this study.
Building on these directions, the present work benchmarks direct daily hydrogen forecasting against a two-step irradiance → hydrogen pathway under strict chronological evaluation and transparent baselines, targeting J + 1, J + 3 and J + 7 horizons across three high-irradiation regions in Southern Morocco (Table 1).
Table 1.
Summary of related work.
3. Methodology
3.1. Study Design and Data Foundation
This study develops a physics-aware and data-driven forecasting framework for estimating daily green hydrogen production potential in three strategic regions of southern Morocco, namely Dakhla, Laayoune, and Guelmim. The objective is not only to predict hydrogen output at different short-term horizons, but also to preserve the physical link between the solar resource, photovoltaic conversion, and hydrogen generation. The methodology therefore combines long-term climatic time series, physically meaningful target construction, engineered temporal predictors, and supervised machine-learning models within a single forecasting pipeline. This type of integrated design is consistent with the recent solar forecasting literature, which emphasizes that forecasting performance depends strongly on the interaction between the quality of the input data, the forecasting horizon, and the structure of the predictive model [35].
The database was constructed at a daily resolution for the period 2010–2025 using five core predictors: global horizontal irradiance (GHI), clear-sky irradiance (GHI_clear), ambient temperature, relative humidity, and wind speed. These variables were selected because they jointly describe the amount of solar energy available for photovoltaic conversion and the atmospheric conditions that may modulate both PV performance and the temporal variability of the hydrogen production potential. The solar component of the dataset is consistent with the use of PVGIS-based solar resource assessment, while the meteorological variables are compatible with NASA POWER products, which are frequently used in renewable-energy and climate applications where in-situ measurements are scarce or incomplete [35,36].
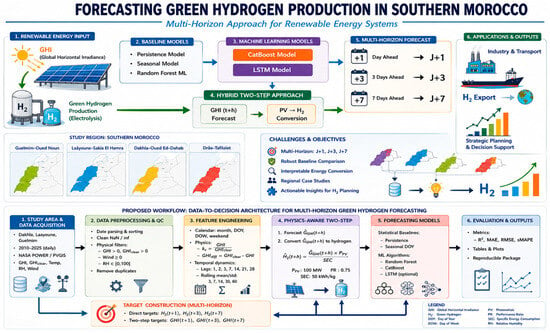
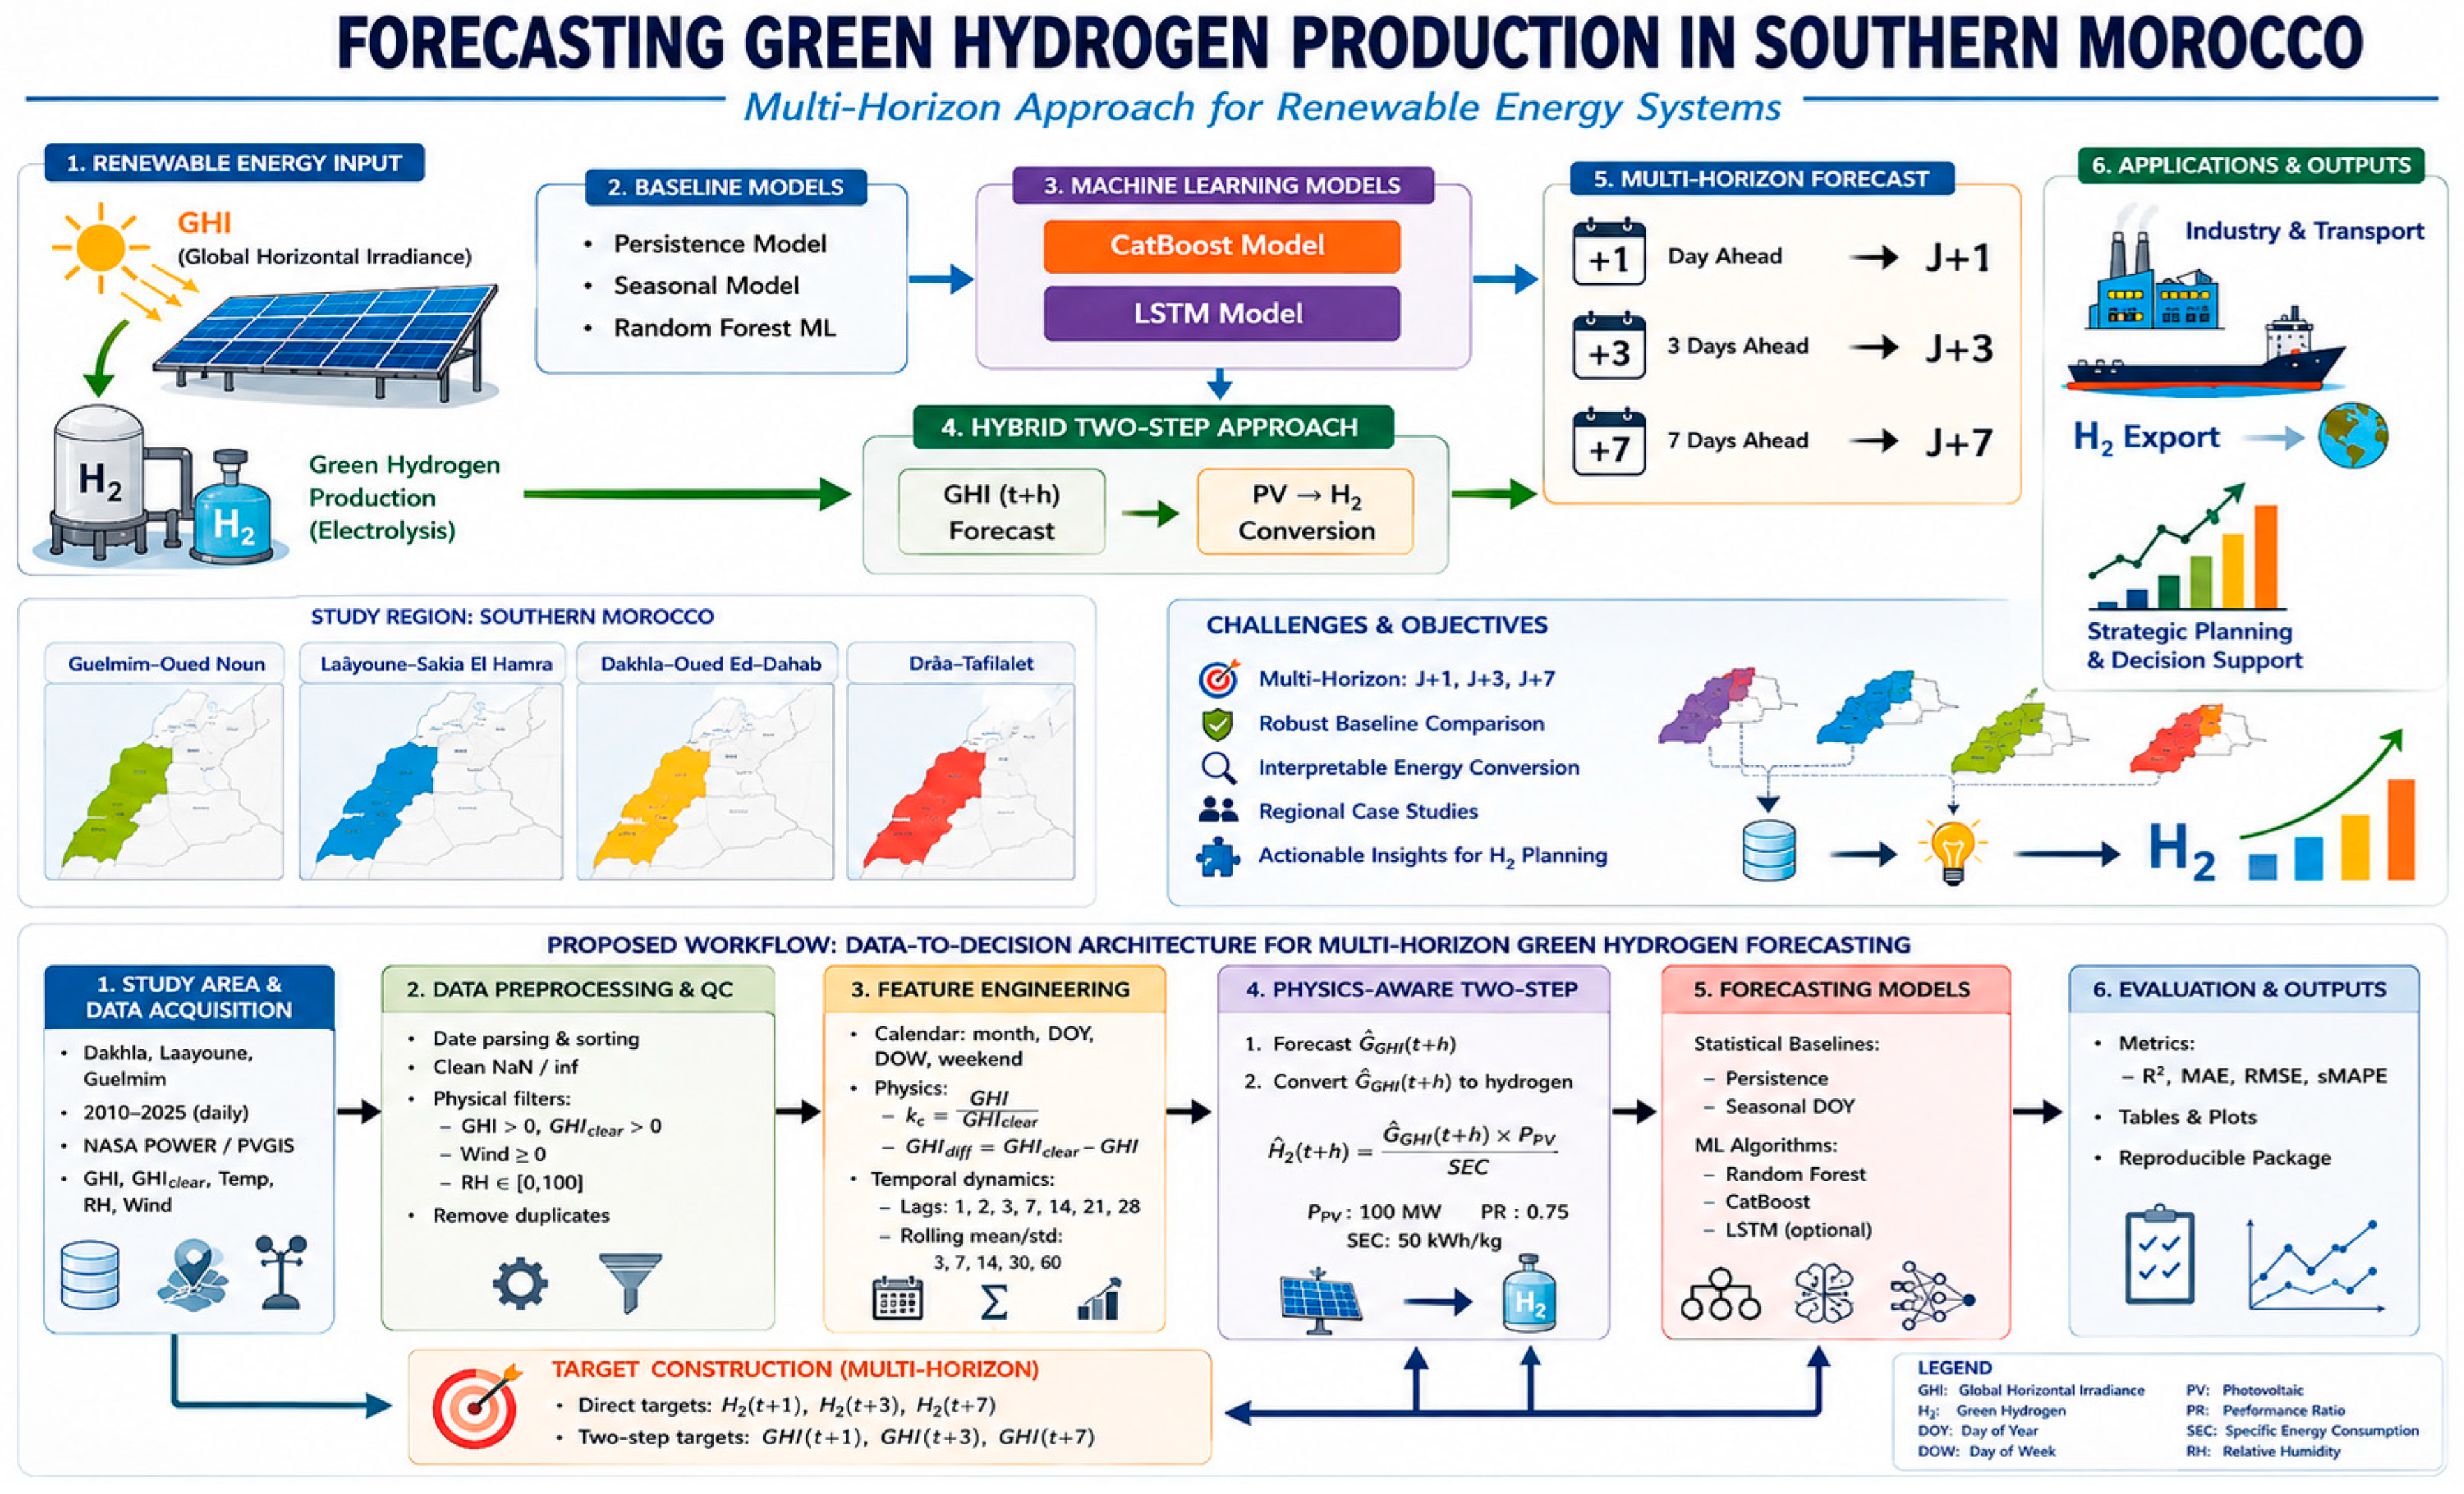
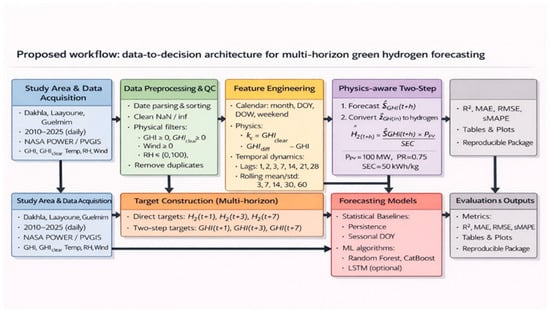
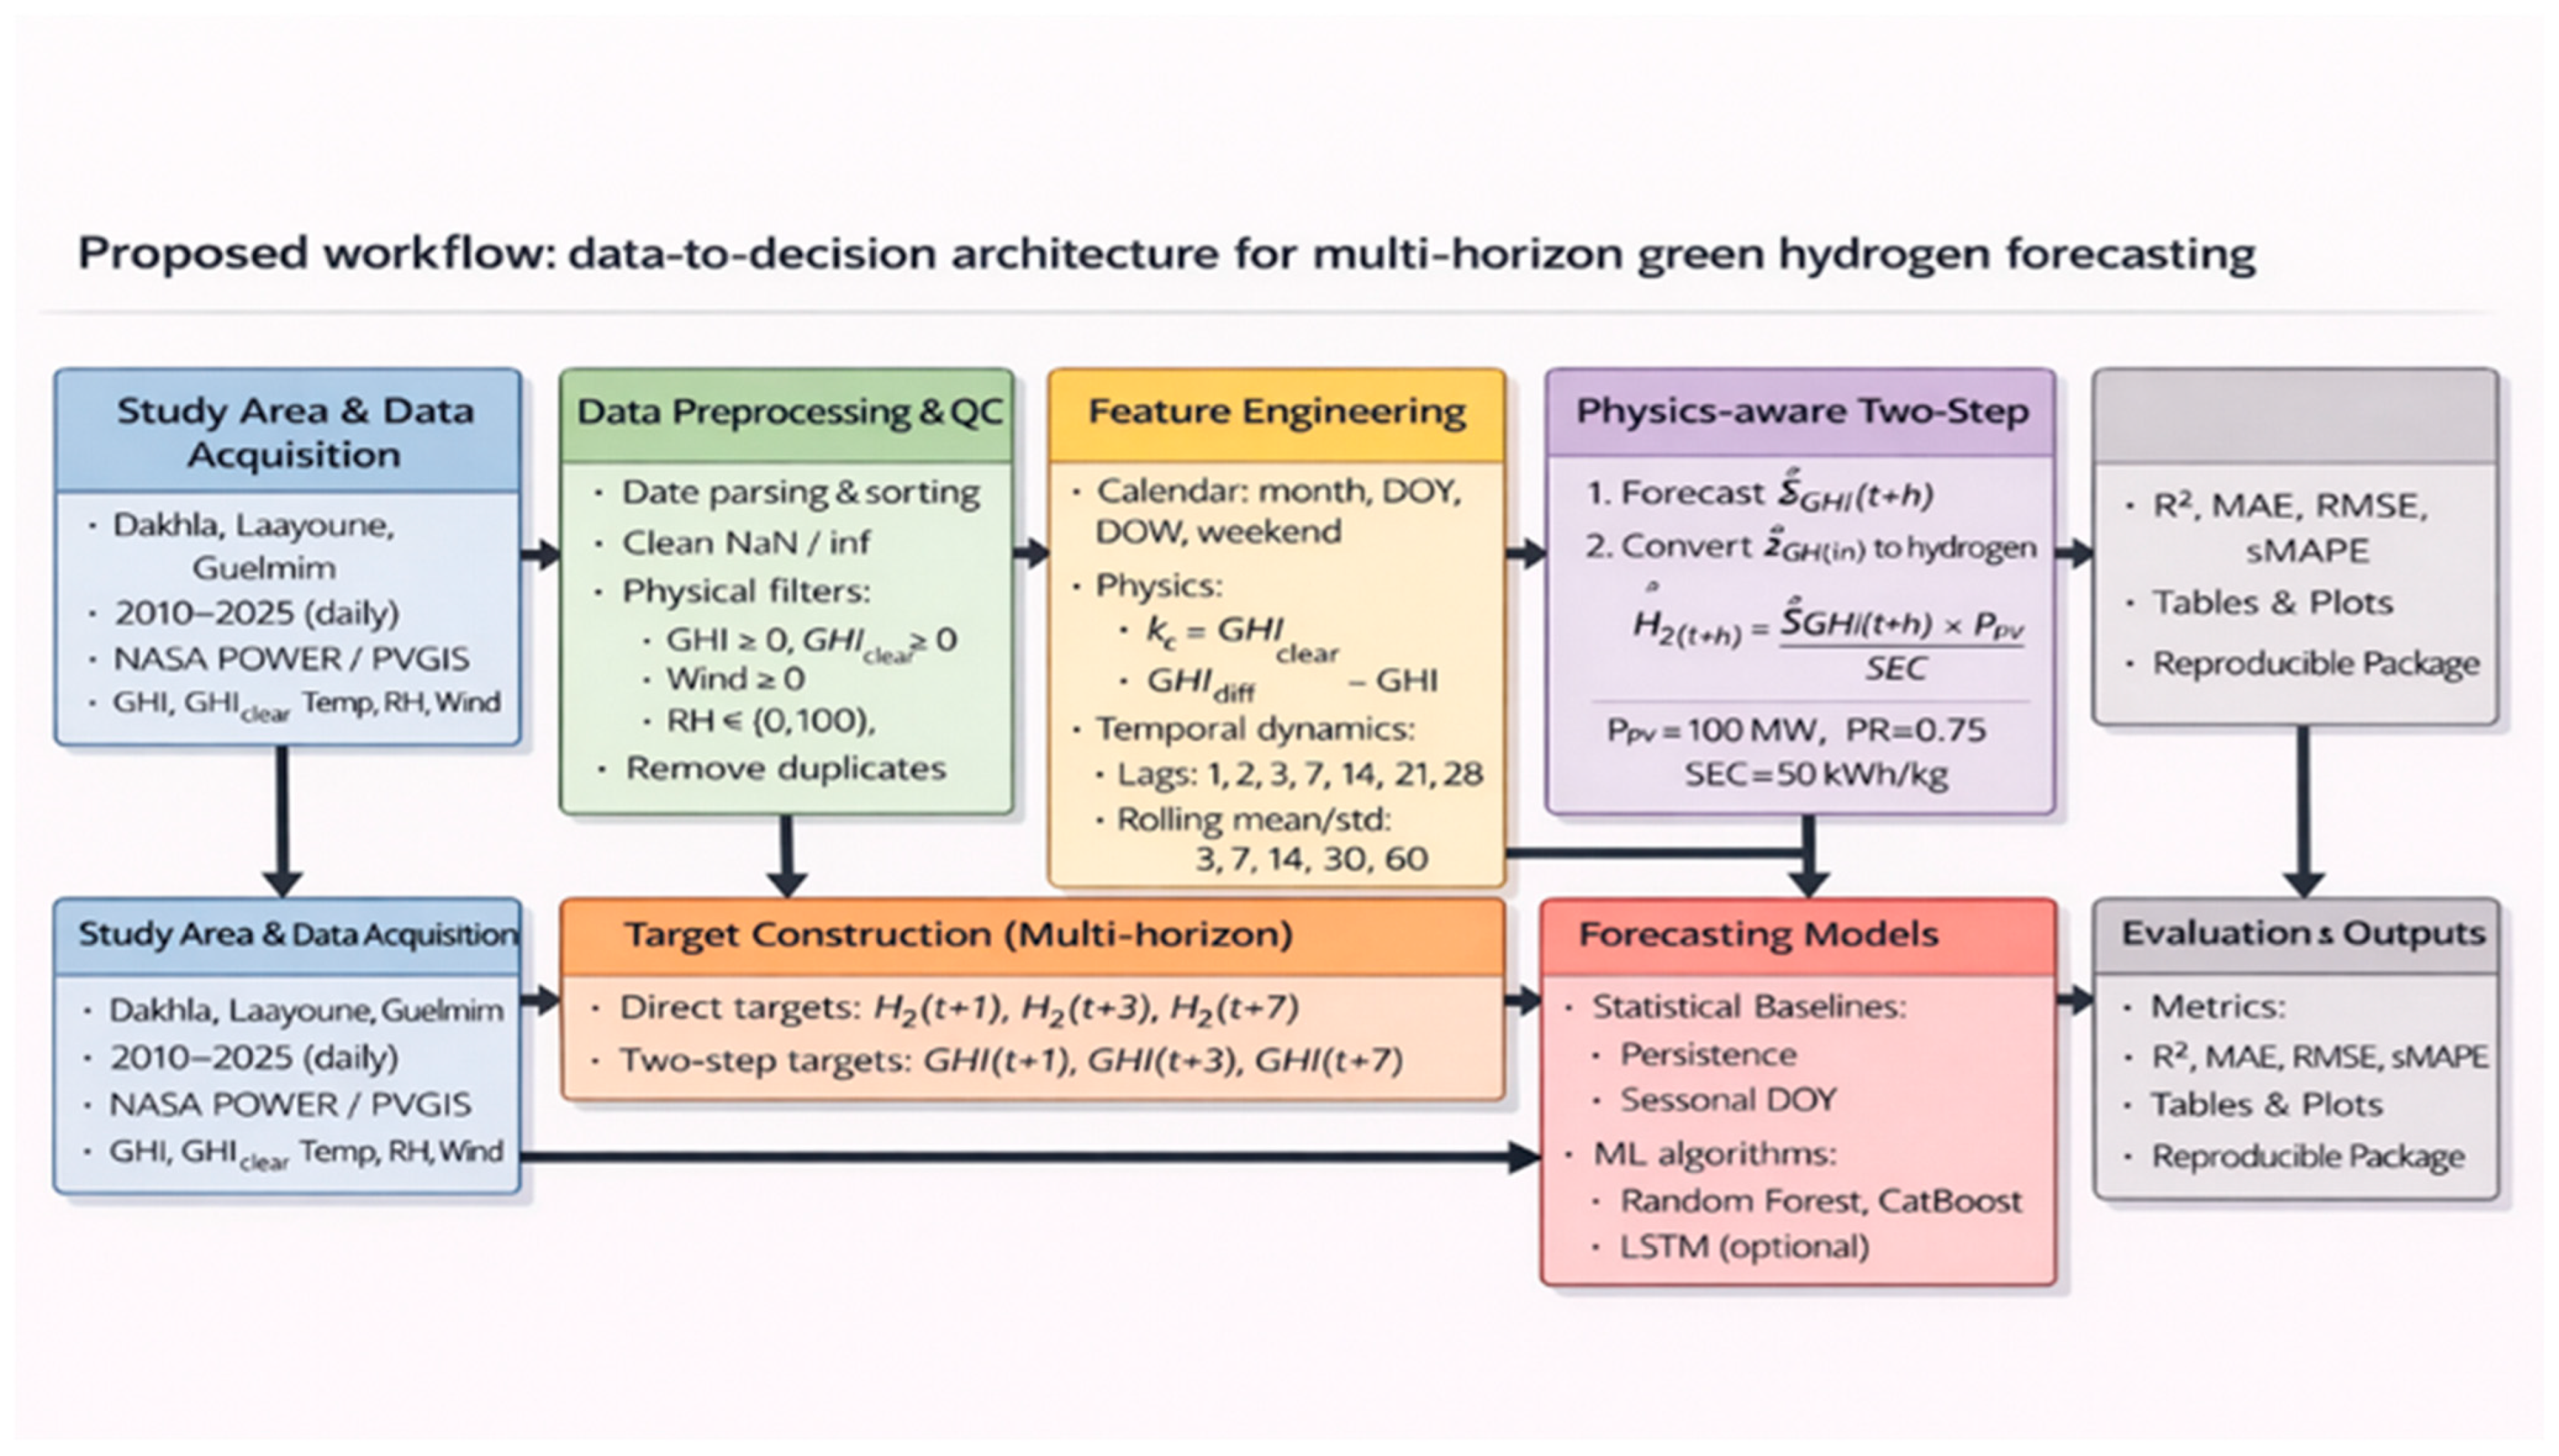
At the conceptual level, the complete methodological chain is summarized in Figure 1 and Figure 2; it visually explains the transition from raw climatic observations to multi-horizon hydrogen forecasts. The figure clearly shows the logic of the study: data acquisition, quality control, feature engineering, target construction, forecasting, and final evaluation.
Figure 1.
Forecasting Green Hydrogen Production in Southern Morocco.
Figure 2.
Proposed workflow: data-to-decision architecture for multi-horizon green hydrogen forecasting.
3.2. Data Preprocessing and Physics-Based Target Construction
Before any modeling step, the raw series were subjected to a strict preprocessing and quality-control stage. First, all observations were parsed and ordered chronologically in order to preserve temporal consistency across the whole 2010–2025 period. Second, missing values, infinite values, duplicated records, and obviously inconsistent entries were removed. Third, simple but essential physical plausibility filters were applied: . This stage is crucial because forecast models based on lags and rolling statistics are highly sensitive to anomalies propagating through time. In other words, the quality of the forecasting outputs depends directly on the physical consistency of the cleaned inputs.
After cleaning, the hydrogen target was derived from the available solar resource through a simplified PV-to-hydrogen conversion chain. Rather than treating hydrogen production as an abstract output variable, the study formulates it as a physically interpretable quantity estimated from irradiance and techno-operational assumptions. The daily hydrogen production potential is computed from the equivalent solar energy available to a photovoltaic system and then converted into hydrogen mass through the electrolyzer-specific energy consumption:
where is the nominal photovoltaic capacity, PR is the performance ratio, is the reference irradiance, and SEC is the specific energy consumption of the electrolyzer. In this study, the nominal assumptions are . This choice is methodologically reasonable because recent green-hydrogen studies report practical electrolysis electricity requirements commonly in the range of about 50–83 kWh/kg, making 50 kWh/kg an acceptable reference assumption for a simplified production-potential model [35].
Two forecasting logics are then considered. The first is a direct strategy, in which the model predicts directly. The second is a physics-aware two-step strategy, in which the model first predicts future irradiance and then converts it into hydrogen production using the same physical formulation. This second design is especially valuable because it keeps the model closer to the real energy-conversion chain and allows the final prediction to remain interpretable from a solar-resource perspective.
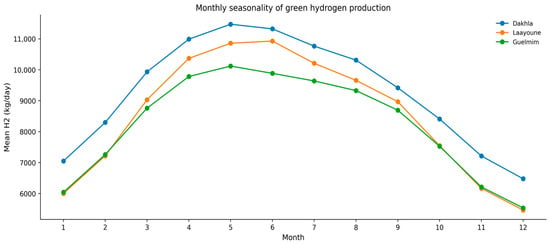
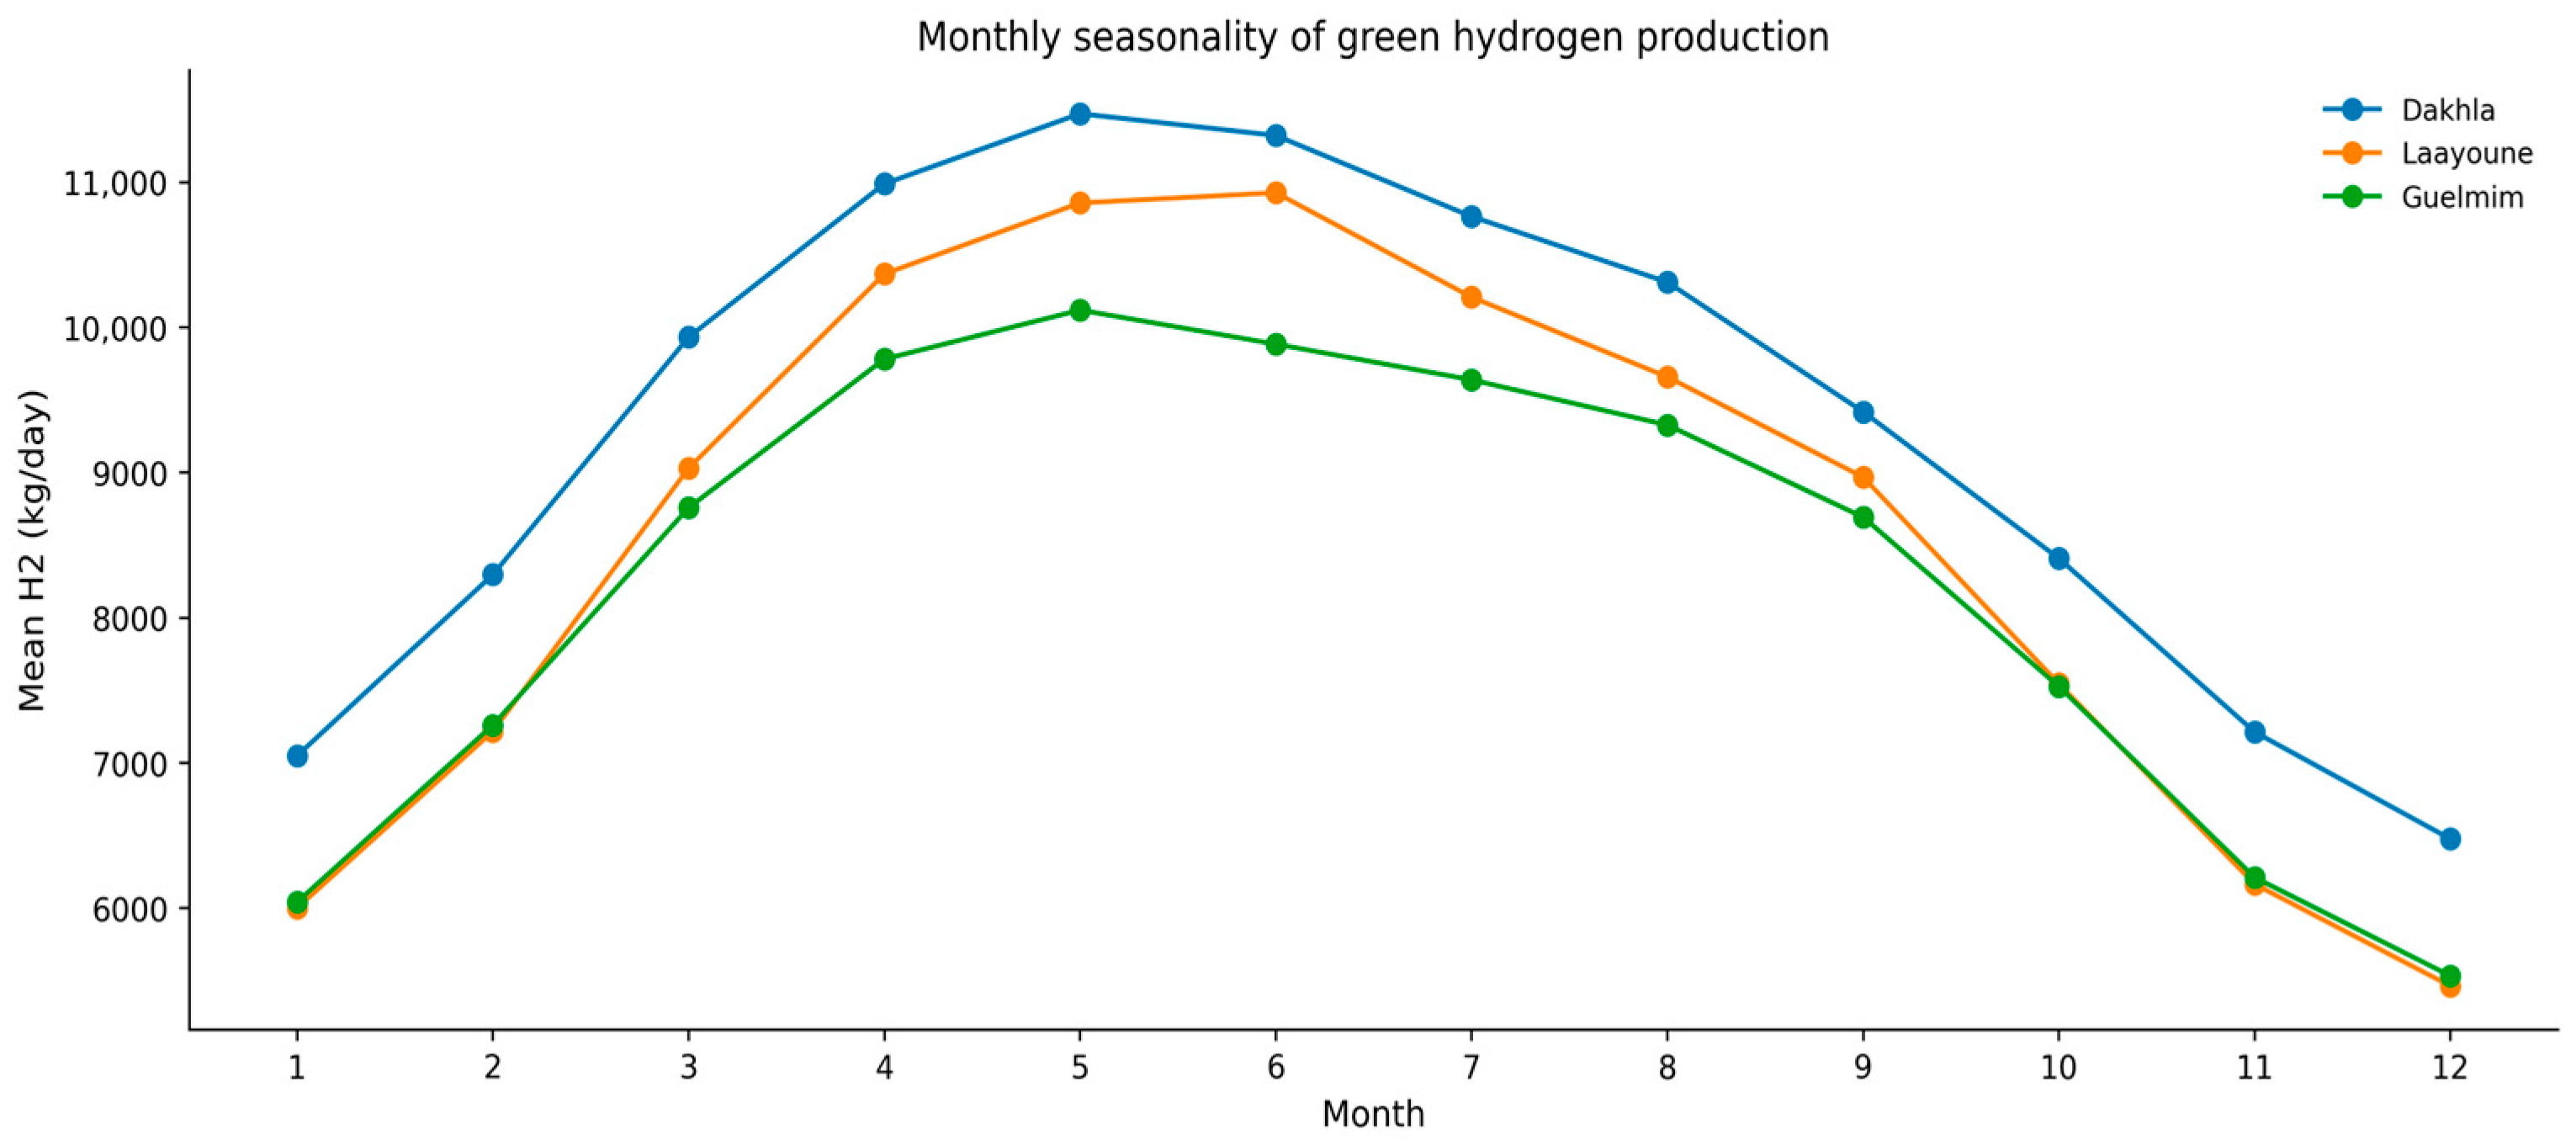
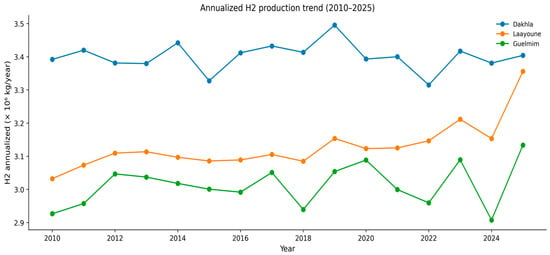
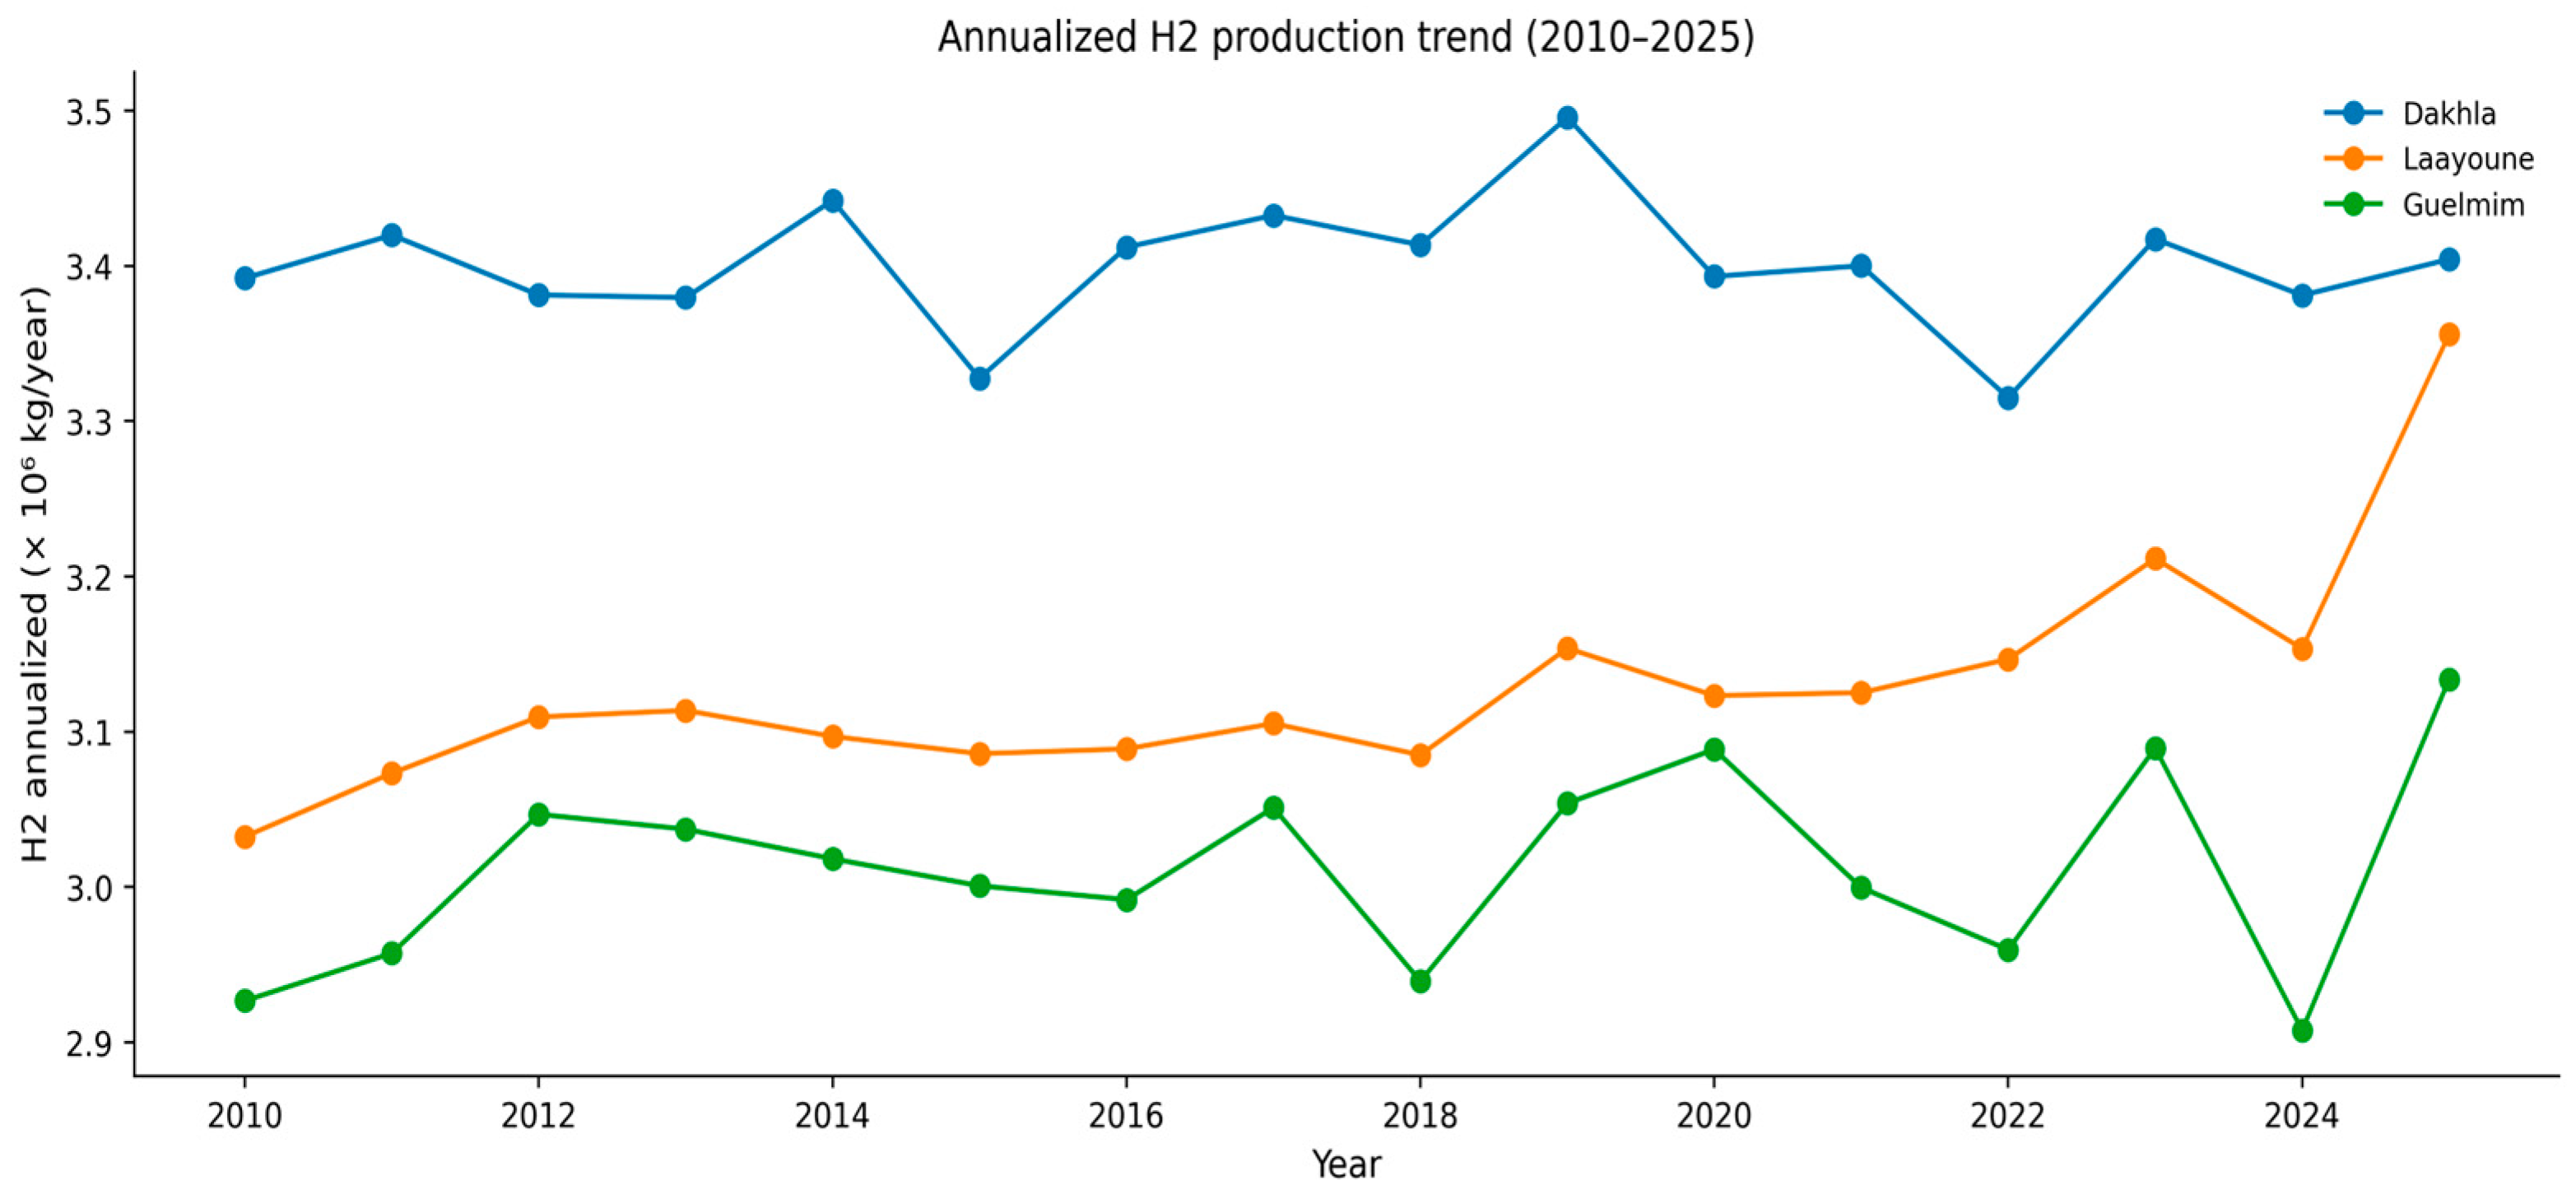
In the same spirit, Figure 3 and Figure 4 shows the annualized hydrogen production trend between 2010 and 2025. Although a statistically significant long-term trend (increasing or decreasing) was not identified for this specific period (p > 0.05), the series exhibits a noticeable interannual variability with a coefficient of variation (CV) of approximately 5–8% across regions, confirming that the forecasting task must account for decadal-scale climatic fluctuations.
Figure 3.
Monthly seasonality of green hydrogen production in Dakhla, Laayoune, and Guelmim.
Figure 4.
Annualized trend of estimated green hydrogen production over the period 2010–2025.
3.3. Feature Engineering and Multi-Horizon Formulation
Because hydrogen production potential inherits both the deterministic seasonality of solar irradiance and the short-term persistence of weather conditions, feature engineering constitutes a central part of the methodology. A first family of predictors is composed of calendar descriptors, including month, day of year, day of week, and weekend indicator. However, because seasonal variation is periodic rather than linear, the day-of-year signal is also encoded through trigonometric transformations such as sin(2πDOY/365) and cos(2πDOY/365). This type of encoding is particularly appropriate for solar-energy forecasting because it avoids artificial discontinuities between the end and the beginning of the year.
A second family of predictors is physics-aware. In particular, the framework uses the clear-sky normalization idea through variables such as the ratio between measured irradiance and clear-sky irradiance:
as well as the deviation term:
These variables help separate the stochastic atmospheric component from the deterministic astronomical component. This choice is strongly supported by the solar-energy literature, where the clear-sky index is widely used to remove seasonal effects, improve stationarity, and enhance forecasting performance [37]. Clear-sky irradiance itself is also recognized as a key normalization function in solar radiation modeling and forecasting [36,37].
A third family of predictors captures temporal memory. For that reason, lagged values are generated for the main solar and meteorological variables at delays of 1, 2, 3, 7, 14, 21, and 28 days. In parallel, rolling means and rolling standard deviations are computed over short and medium windows such as 3, 7, 14, 30, and 60 days. The purpose of these variables is to allow the models to learn not only the instantaneous weather state, but also the recent trajectory of the local climatic regime. This is especially important in daily hydrogen forecasting, where short periods of cloudy conditions, wind anomalies, or humidity changes may produce delayed effects on the estimated output.
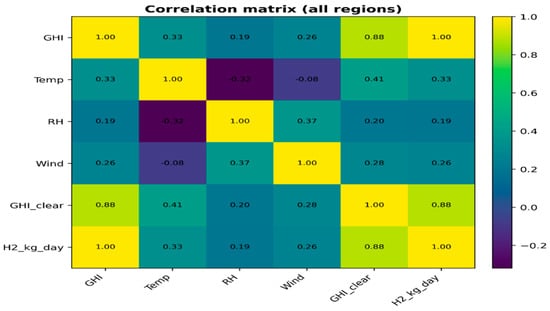
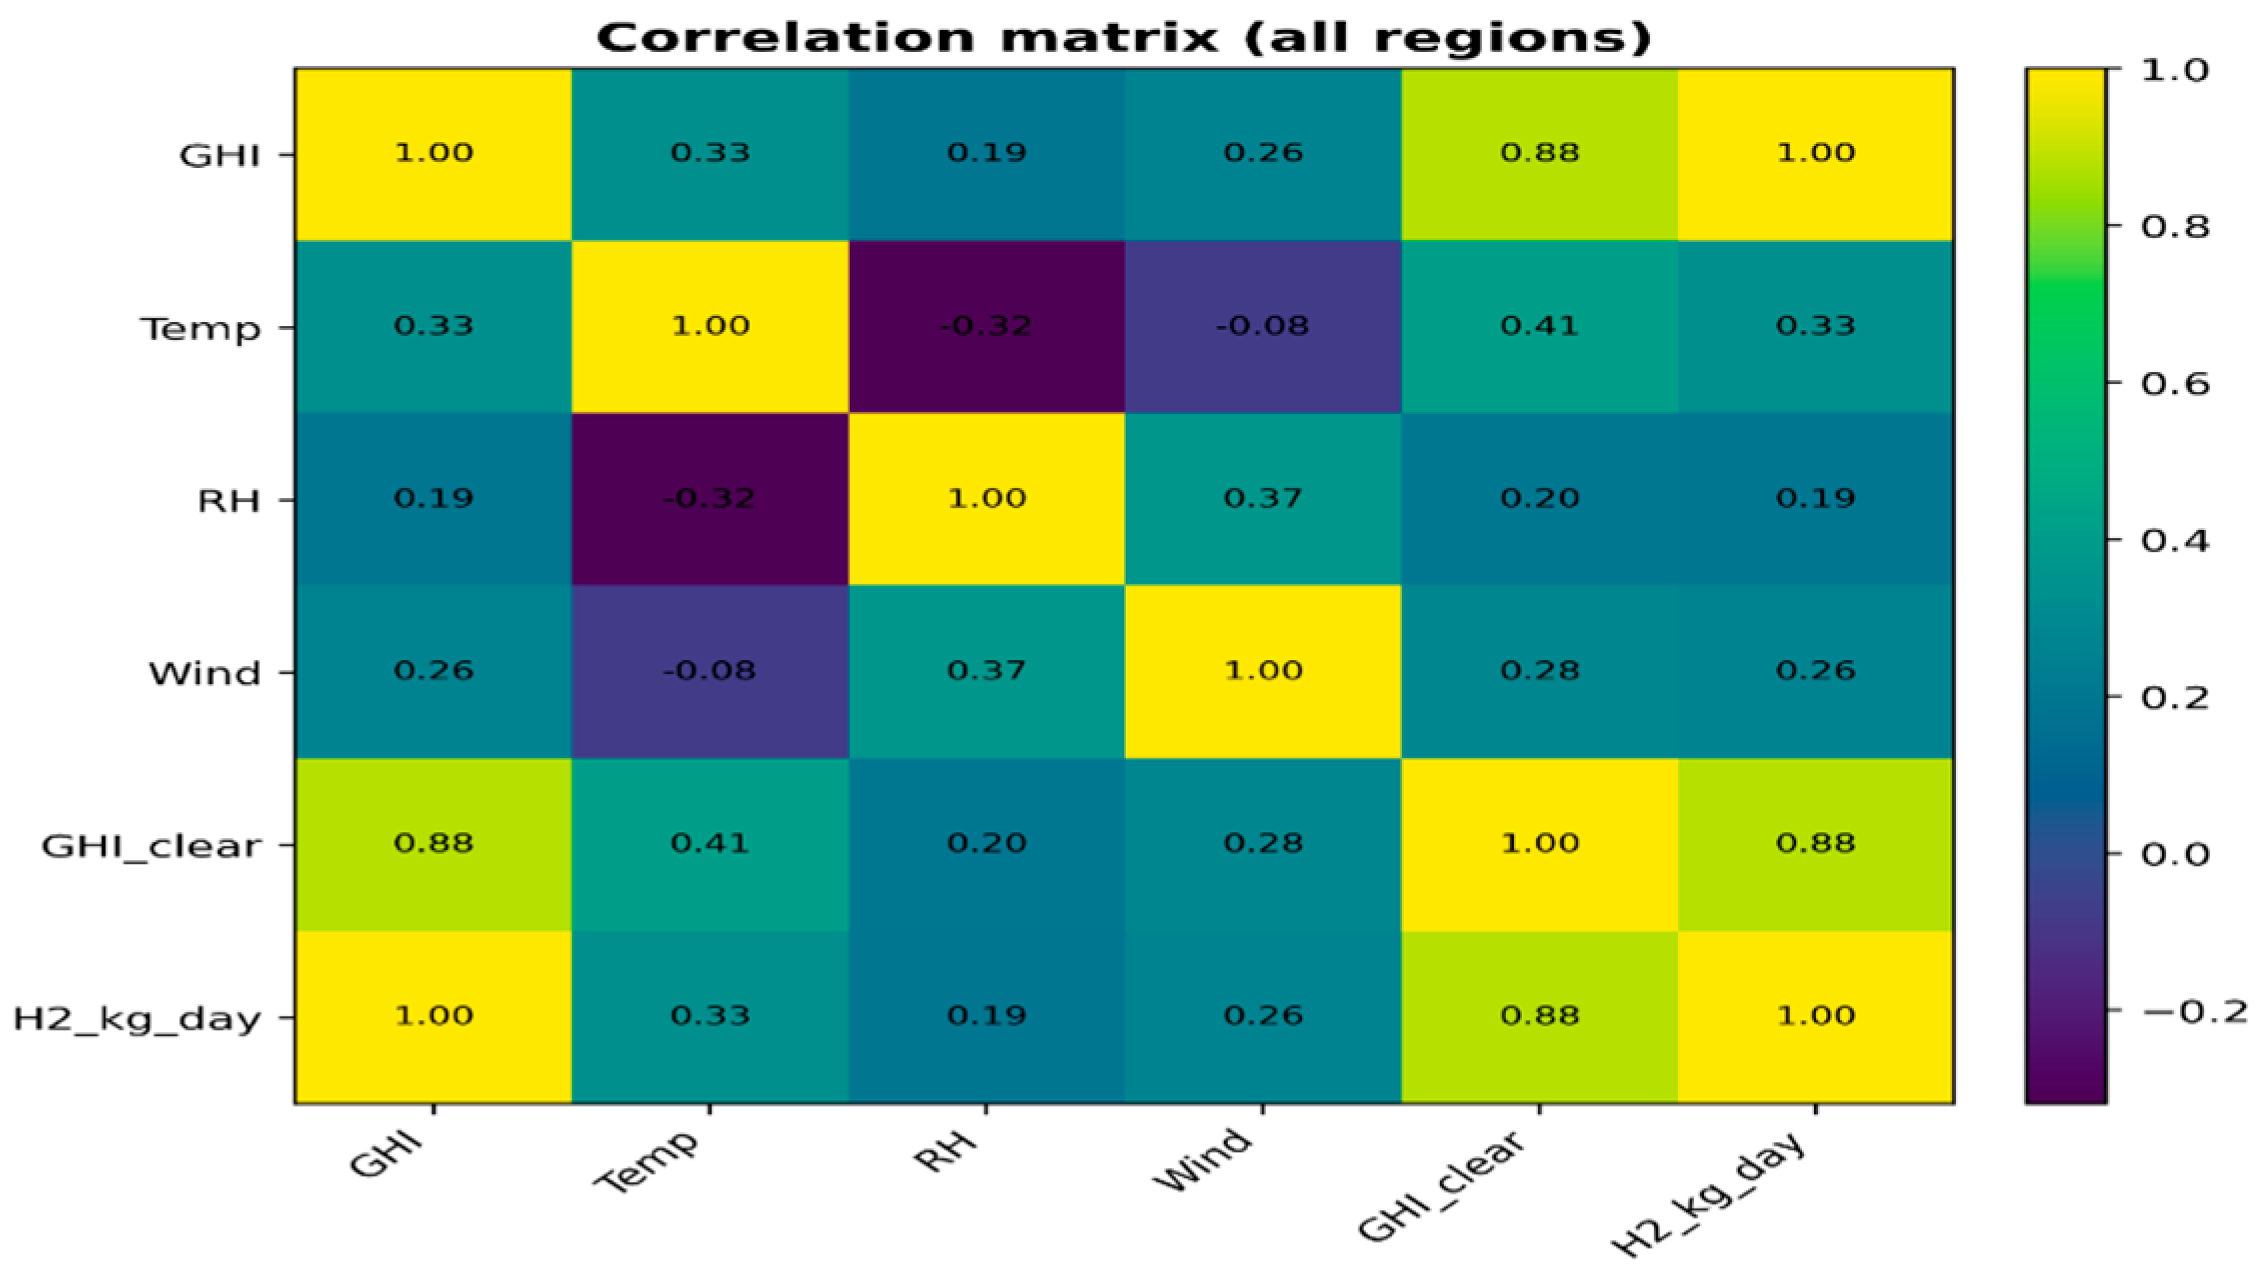
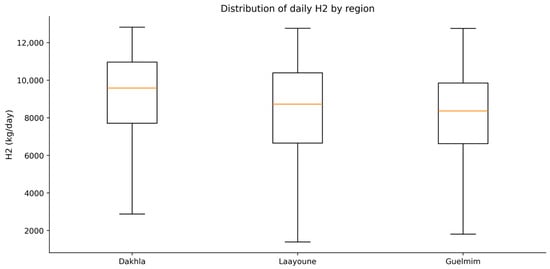
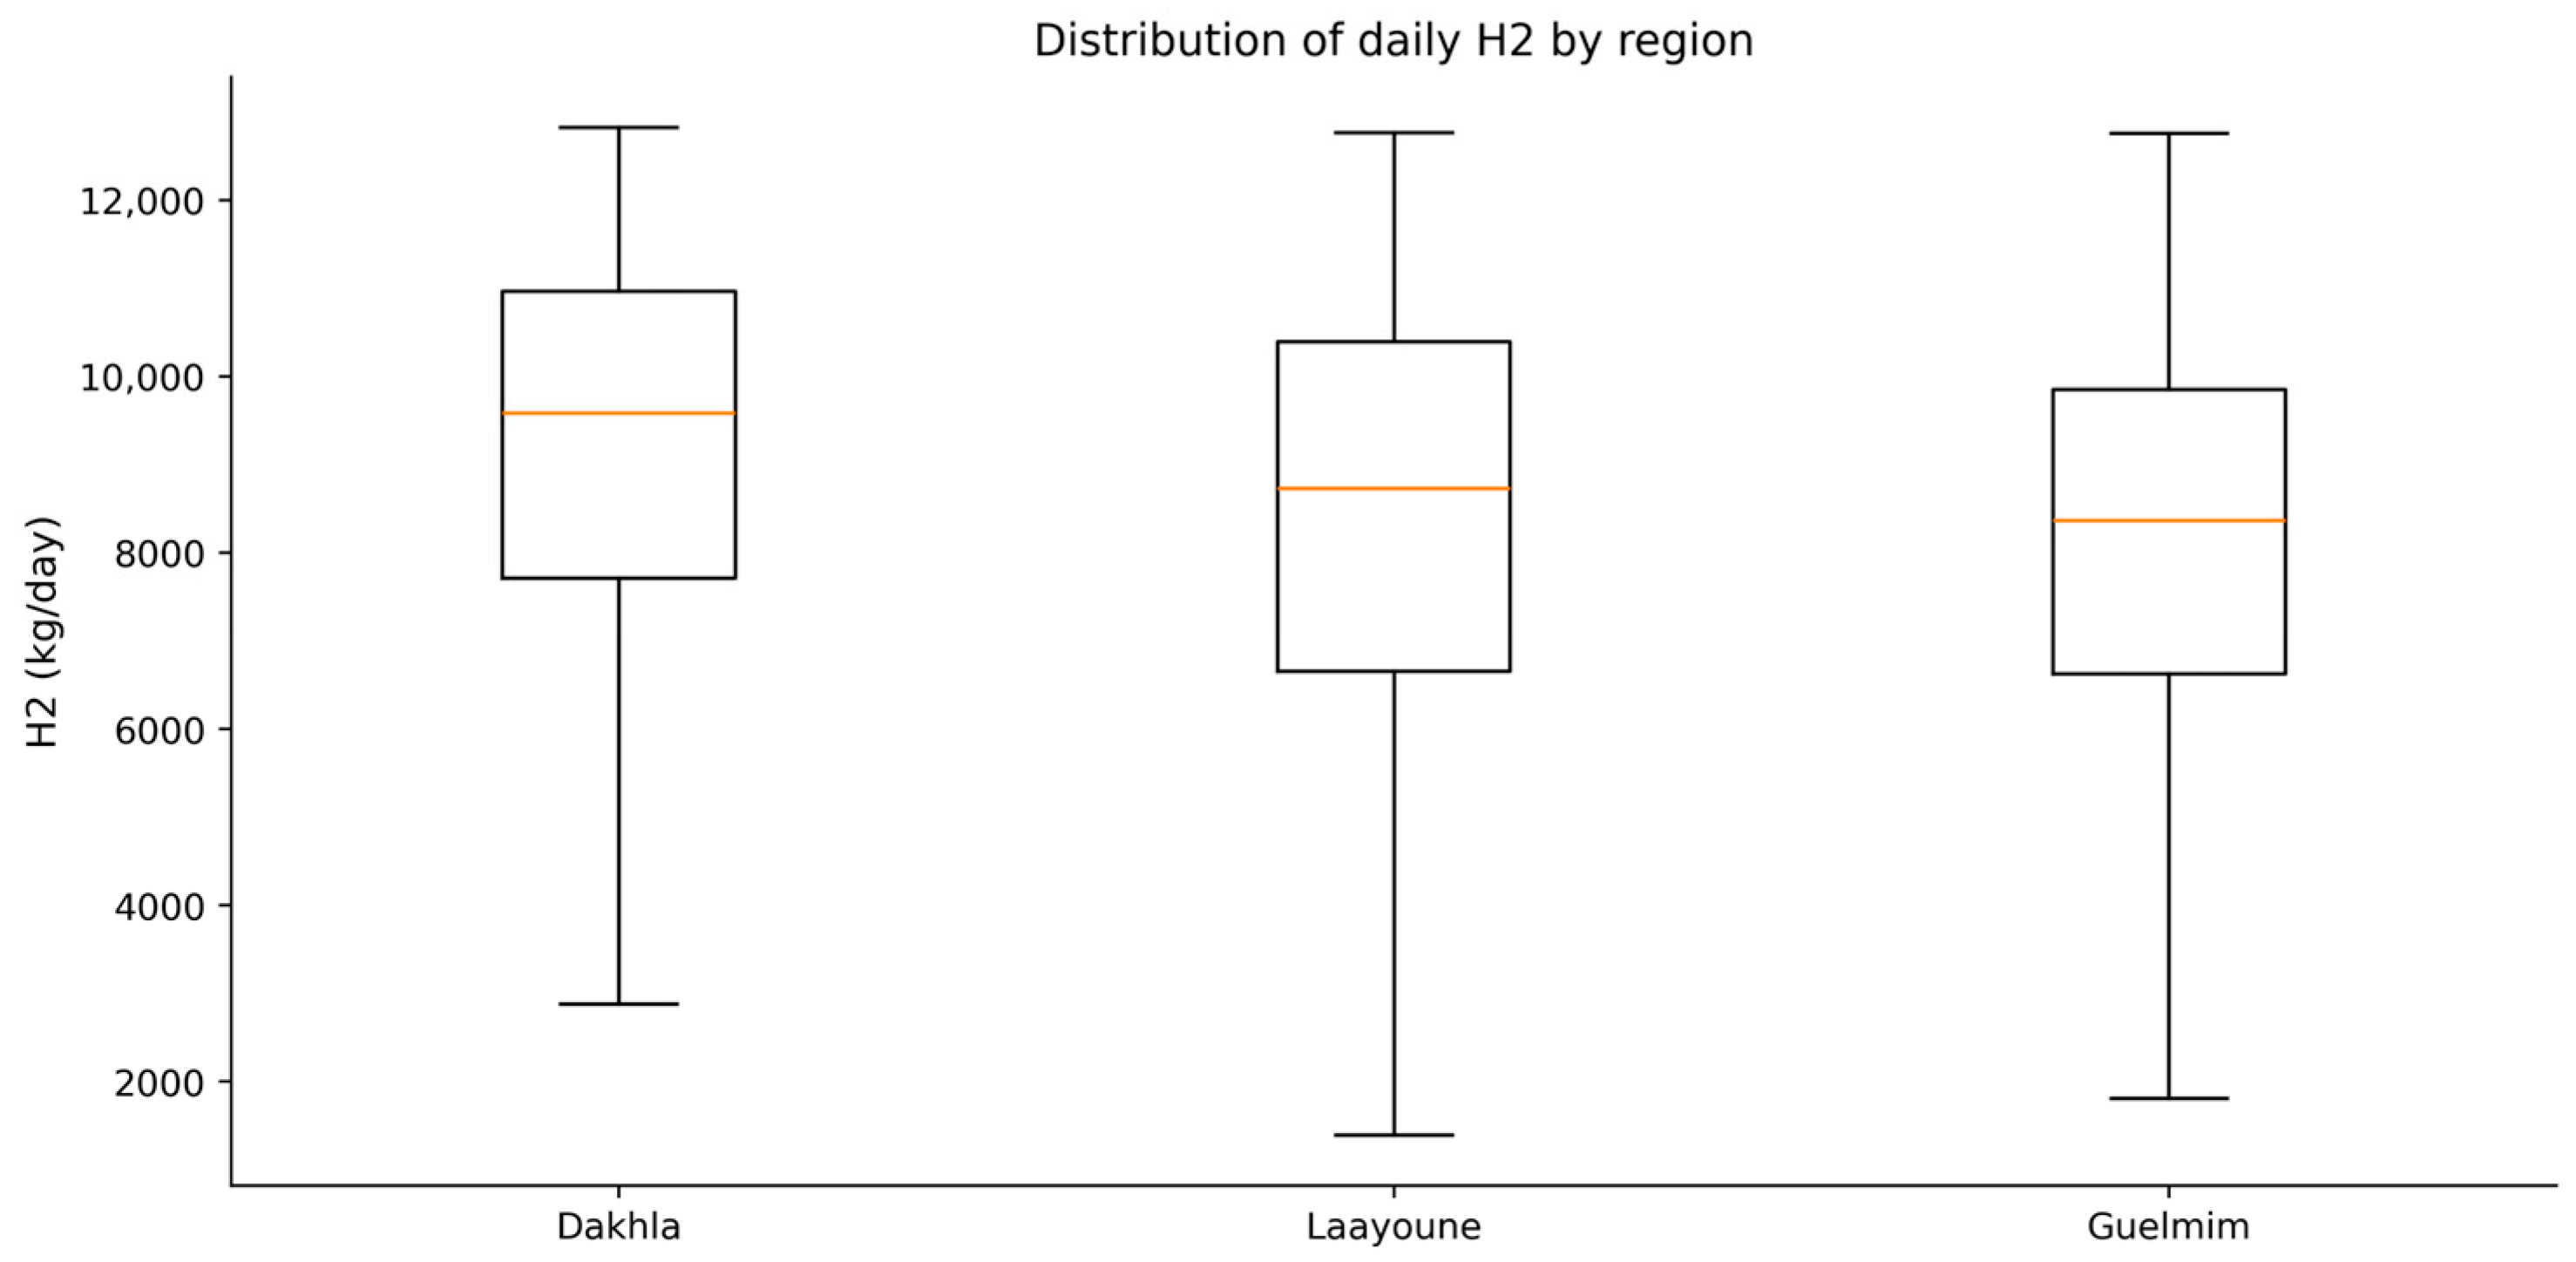
The relevance of the selected predictors is also supported by the exploratory analyses presented in the following figures. Figure 4 shows that GHI and H2_kg_day are strongly associated, which is physically expected since hydrogen is derived from the solar resource. A strong association is also visible between GHI_clear and hydrogen production, confirming the value of clear-sky-related variables in the predictor set. In addition, Figure 5 reveals that the three regions do not have the same distribution of daily hydrogen output, which means the forecasting problem has a clear regional component and should not be treated as perfectly homogeneous across sites.
Figure 5.
Correlation matrix between solar, meteorological, and hydrogen-production variables for all regions.
The forecasting problem is finally formulated as a multi-horizon supervised regression task. For each day t, the model uses only the information available up to t to estimate future hydrogen production at horizons t + 1, t + 3, and t + 7. This horizon-based design is important because the literature shows that model behavior and forecast difficulty vary substantially with lead time; a model that performs well at day-ahead scale does not necessarily remain optimal at longer horizons [36].
3.4. Forecasting Models, Validation Protocol, and Evaluation
The predictive stage combines baseline forecasting and machine-learning forecasting. As a first benchmark, a persistence-type baseline may be used, since naive approaches remain standard reference points in time-series forecasting. However, the core of the proposed methodology relies on supervised machine-learning models capable of capturing nonlinear interactions among seasonality, solar variables, meteorological conditions, and lagged information. In this work, the methodological comparison includes Random Forest, CatBoost, and optionally LSTM as a deep-learning benchmark. Random Forest was retained because it is one of the most established ensemble methods for nonlinear regression [38], while LSTM remains a canonical architecture for sequential learning and long-range temporal dependencies [39]. More recent solar forecasting studies also confirm the relevance of gradient-boosting families, including CatBoost, in structured solar-radiation prediction tasks [40,41].
Although several models can be explored, the present framework gives particular importance to CatBoost because the problem is fundamentally a tabular regression problem with heterogeneous engineered predictors. This type of model is well suited for capturing nonlinear effects while remaining compatible with post hoc interpretability tools such as feature importance analysis. In practice, this balance between predictive accuracy and interpretability is important for green hydrogen forecasting, because the purpose of the study is not only to generate accurate values, but also to explain why specific variables dominate the prediction in each region and at each horizon.
To avoid information leakage and overly optimistic results, all models are trained and evaluated using a strict chronological split. The oldest observations are used for training, the intermediate block for validation and model tuning, and the most recent block for testing. Random shuffling is deliberately avoided because it breaks temporal dependence and can artificially inflate predictive performance. This choice follows the standard recommendations of the time-series forecasting literature, which warns against using conventional random cross-validation when future observations may leak information into the training process [42].
The predictive performance is assessed through four complementary metrics: the coefficient of determination R2R^2R2, the mean absolute error (MAE), the root mean squared error (RMSE), and the symmetric mean absolute percentage error (sMAPE). These metrics are used jointly because each one captures a different dimension of forecast quality: explained variance, average deviation, sensitivity to large errors, and scale-normalized relative discrepancy. Forecast evaluation studies have repeatedly emphasized that no single metric is sufficient on its own for a rigorous comparison of time-series methods [43].
3.5. Interpretation and Visual Validation of the Forecasting Framework
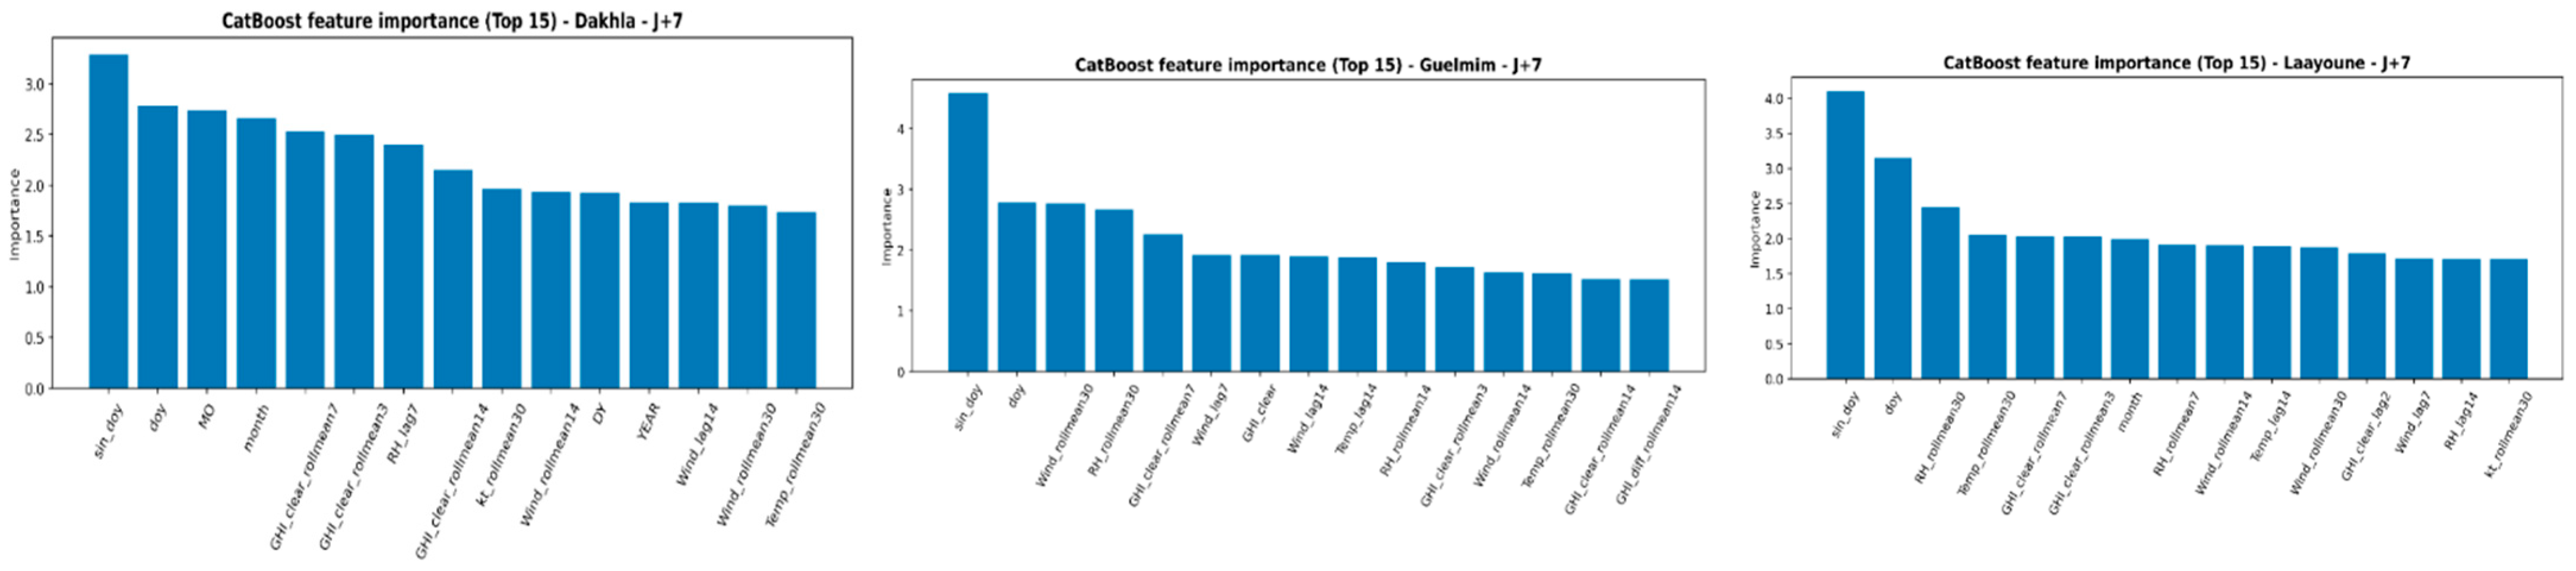
A strong methodological point of the proposed framework is that it includes an explicit interpretation stage. Rather than stopping at predictive scores, the workflow examines how the models use the input information. This is where Figure 6 becomes particularly useful. The CatBoost feature-importance plots for Dakhla, Laayoune, and Guelmim at the J + 7 horizon show that the most influential predictors are not random; they are dominated by seasonal variables such as sin_doysin\_doysin_doy and doydoydoy, together with rolling aggregates and clear-sky-related features. Methodologically, this is a very coherent result because it confirms that the model is learning a combination of astronomical seasonality and short-term meteorological memory rather than relying on spurious correlations.
Figure 6.
Distribution of daily hydrogen production by region.
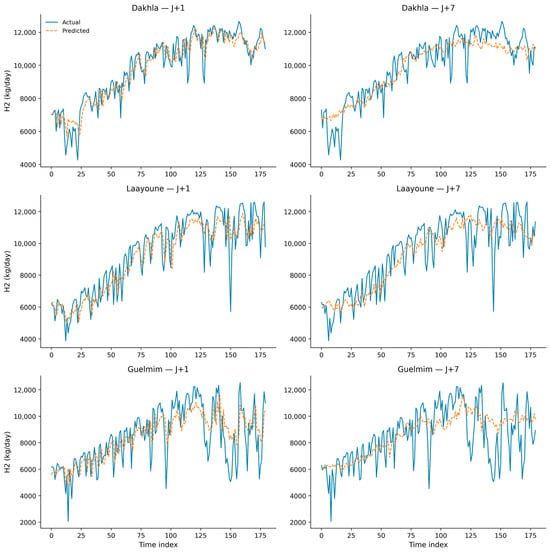
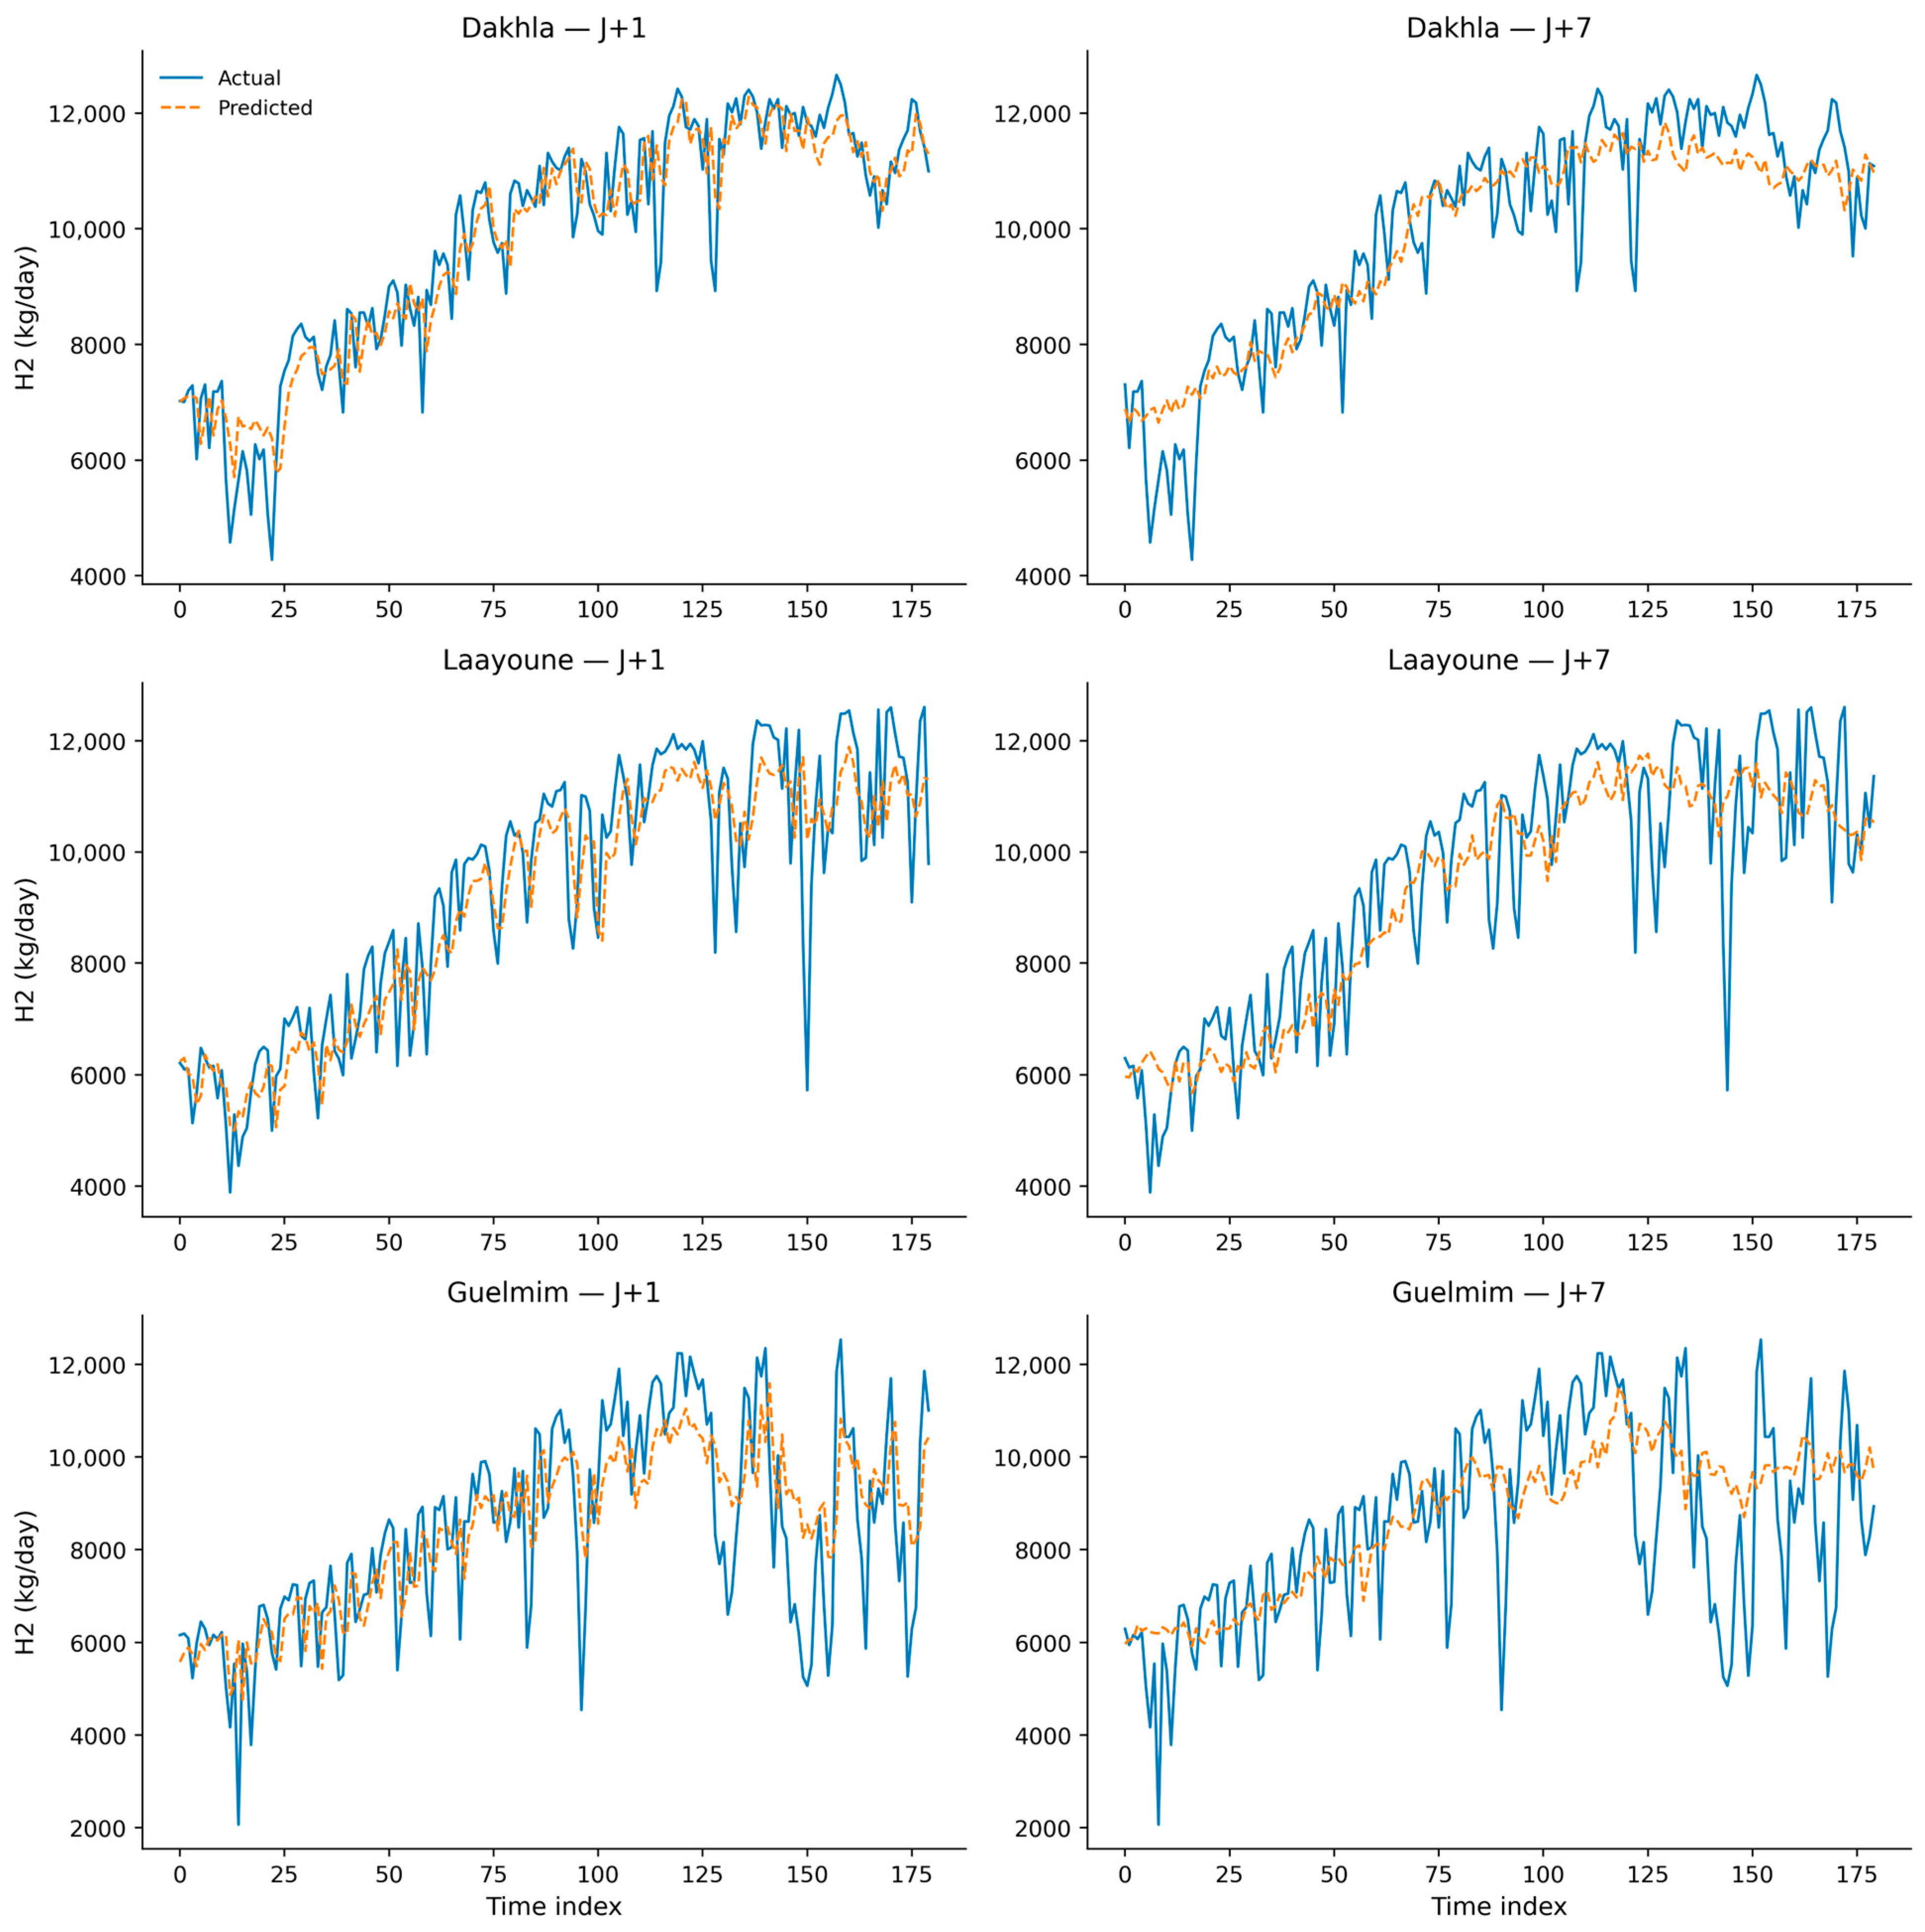
The final methodological validation is presented in Figure 7, where the predicted and actual hydrogen series are compared for J + 1 and J + 7 in the three study regions. These plots are important because they complement the numerical metrics with visual evidence. In a high-quality journal article, such figures are especially valuable for showing whether the model is able to reproduce local fluctuations, seasonal transitions, sudden drops, and amplitude changes. Therefore, even though Figure 8 is often placed in the Results section, it can also be justified at the end of the methodology as part of the validation protocol, since it visually demonstrates how the forecasting framework behaves under different horizons and regional conditions.
Figure 7.
CatBoost feature importance for J + 7 forecasting in Dakhla, Laayoune, and Guelmim.
Figure 8.
Actual versus predicted daily hydrogen production for J + 1 and J + 7 in Dakhla, Laayoune, and Guelmim.
Overall, the methodology was intentionally designed as a transparent and reproducible forecasting pipeline: data are first checked for physical coherence, then transformed into a meaningful hydrogen target, enriched through temporal and physics-aware features, modeled through nonlinear predictors, and finally validated through both numerical and graphical analyses.
4. Results and Discussion
4.1. Comparative Forecasting Performance Across Regions and Horizons
The forecasting results reveal a clear difference in predictive behavior across the three study regions and across the considered lead times. Overall, Dakhla emerges as the most favorable site, Laayoune shows intermediate predictability, and Guelmim remains the most challenging case. This ranking is consistent with the visual structure of the predicted series and with the reported performance metrics, indicating that the local dynamics of solar-driven hydrogen production are not equally easy to model across southern Morocco. More broadly, this kind of region-dependent behavior is consistent with recent solar and hydrogen forecasting studies, which emphasize that the relative performance of machine-learning models often changes with local climate variability, feature design, and prediction horizon [44,45,46,47,48].
Using the performance scores reported in your study, the best day-ahead forecasting result is obtained in Dakhla, where CatBoost achieves = 0.863, MAE = 522.3 kg/day, and RMSE = 687.1 kg/day. In Laayoune, the best and RMSE at J + 1 are obtained with Random Forest (, RMSE = 949.7 kg/day), while CatBoost remains competitive by yielding the lowest MAE and sMAPE. In Guelmim, CatBoost again provides the strongest day-ahead result, with = 0.669, MAE = 849.2 kg/day, and RMSE = 1101.0 kg/day. These results indicate that the short-horizon hydrogen signal is learnable in all three regions, but with a clearly different level of difficulty depending on the local temporal structure of the data.
At longer horizons, the model ranking becomes more site-specific. In Dakhla, Random Forest performs best at J + 3 in terms of and RMSE, whereas LSTM becomes the best model at J + 7, reaching = 0.792 and RMSE = 838.3 kg/day. In Laayoune, LSTM is the strongest model at both J + 3 and J + 7, with = 0.760 and 0.759, respectively. In Guelmim, Random Forest gives the best and RMSE at both J + 3 and J + 7, although the absolute error remains higher than in the other two sites. This confirms that increasing the lead time amplifies the role of local irregularity and that no single model dominates across all locations and all horizons. The recent literature similarly shows that boosting methods, tree ensembles, and recurrent architectures can all be competitive, but their ranking typically depends on the interaction between horizon length, data structure, and regional meteorological variability [49].
A further point of interest is the comparison between the direct CatBoost approach and the two-step GHI → H2 strategy. In Dakhla and Laayoune, the two approaches remain numerically very close at J + 3 and J + 7, which suggests that once the dominant seasonal and meteorological information is captured, the additional decomposition through irradiance does not drastically alter the predictive outcome. In Guelmim, however, the two-step approach becomes slightly more beneficial at J + 7, where it improves the MAE and sMAPE relative to the direct CatBoost configuration (Table 2). This observation is meaningful because it suggests that a physics-aware intermediate step may become more useful when the site is more volatile and the prediction horizon is longer. Recent hydrogen-focused reviews have also highlighted the growing interest in hybrid and physics-informed machine-learning strategies as a promising direction for improving robustness and interpretability in hydrogen-energy applications [43,44,49].
Table 2.
Best-performing models by region and forecast horizon.
4.2. Visual Analysis of the Predicted Time Series
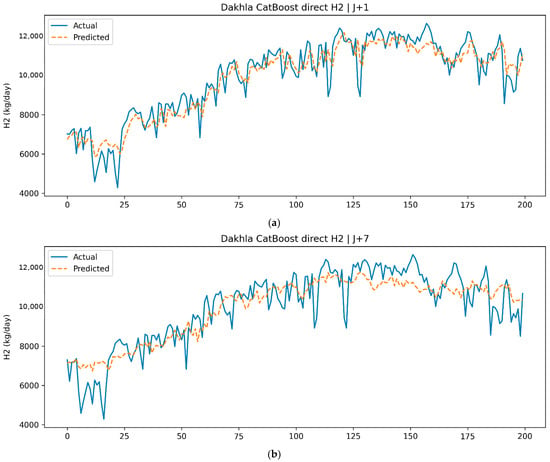
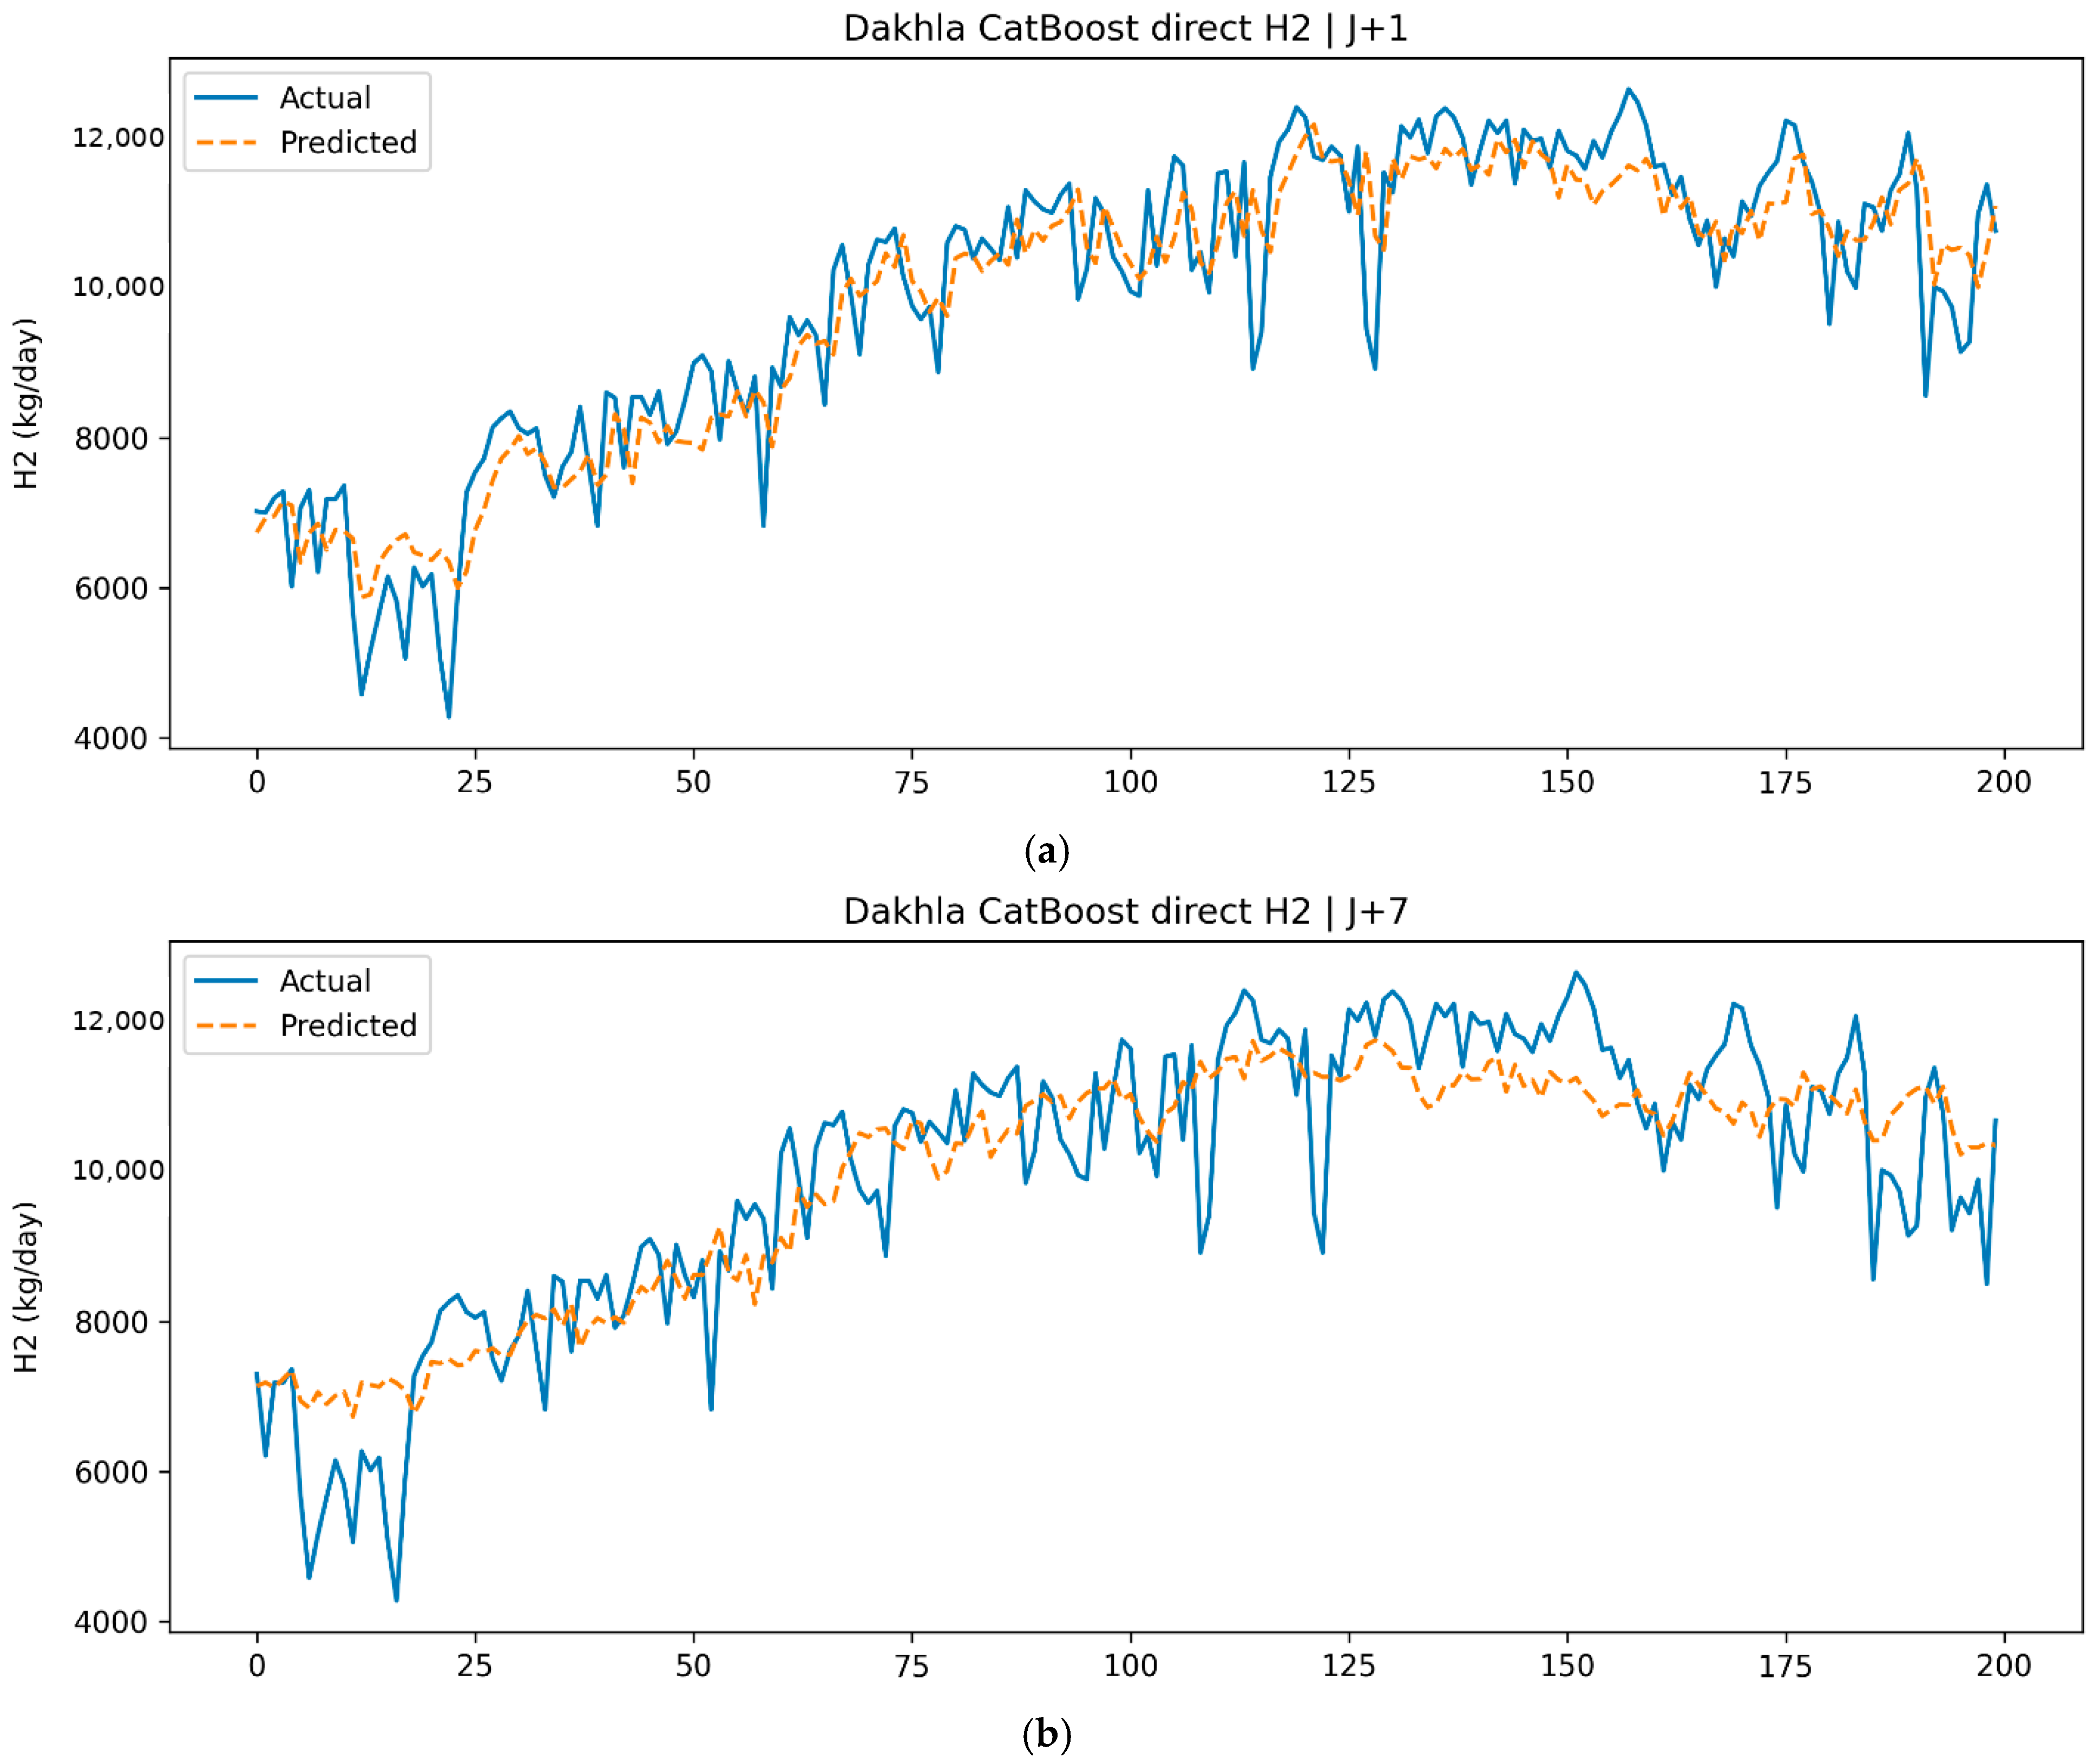
The numerical scores are strongly supported by the time-series plots generated for each region. In Dakhla, the comparison between actual and predicted hydrogen production under the CatBoost direct model shows a generally close agreement at both J + 1 and J + 7. At J + 1, the predicted curve follows the observed day-to-day evolution with relatively limited deviation, and the main rises and drops of the signal are reproduced with good fidelity. At J + 7, the model still preserves the overall temporal regime, although the predicted trajectory becomes smoother and the sharpest local fluctuations are less accurately reproduced. Even so, the agreement remains visually strong, which is consistent with the fact that Dakhla also shows the highest quantitative skill among the three study regions Figure 9.
Figure 9.
Actual versus predicted hydrogen production in Dakhla using the CatBoost direct model: (a) J + 1 and (b) J + 7.
This visual behavior suggests that the hydrogen production series in Dakhla is governed by a relatively strong regular component, which the model is able to learn effectively even when the horizon is extended. The tendency for the J + 7 forecast to appear smoother than the observed series is not unexpected. Similar behavior is frequently reported in recent solar forecasting studies, where short-horizon models tend to reconstruct the main regime of the signal better than the most abrupt local disturbances, especially when the forecast horizon increases [49].
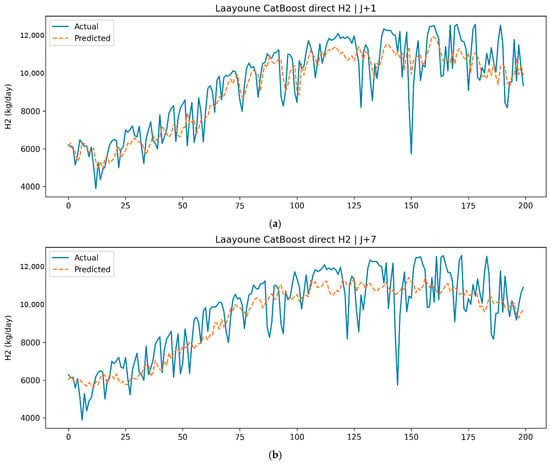
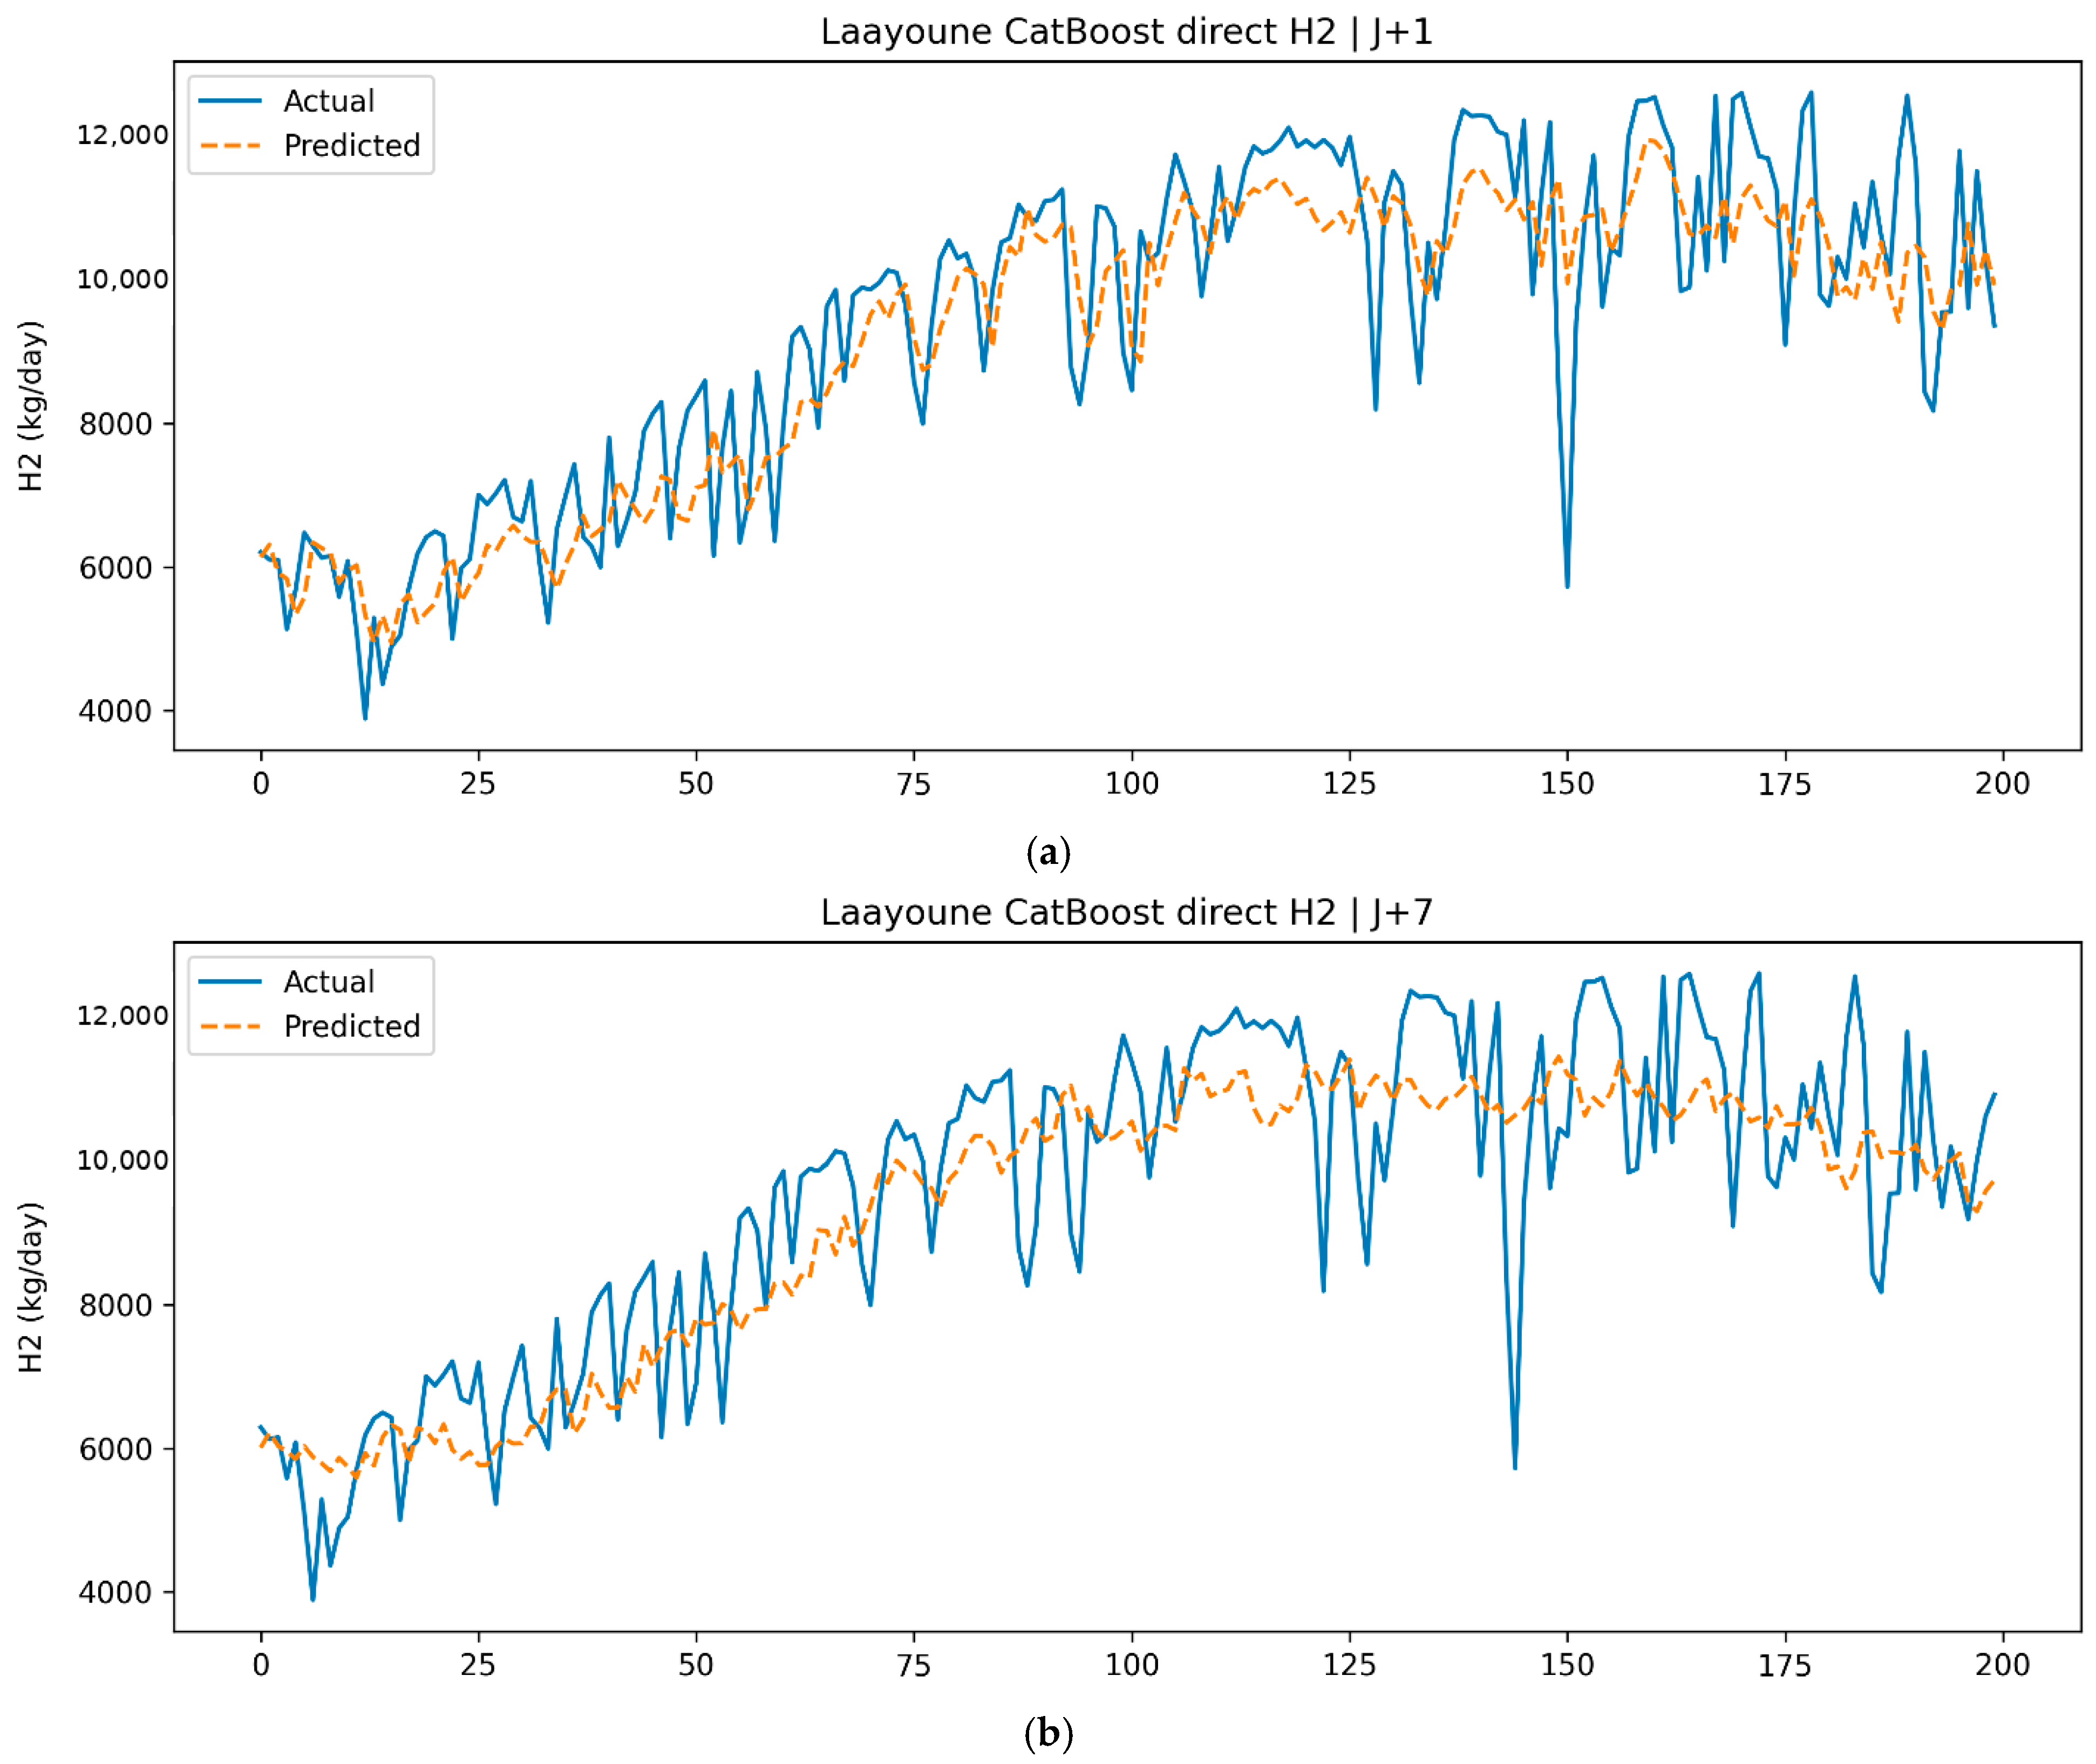
In Laayoune, the model still provides a convincing reconstruction of the observed hydrogen production, but the deviations become more visible than in Dakhla. At J + 1, the CatBoost direct model captures the overall temporal structure of the series and follows the broad ups and downs of the observed curve. However, some local extrema are slightly underestimated or delayed. At J + 7, the smoothing effect becomes more pronounced, and the model prioritizes the dominant trend over the exact amplitude of rapid variations. Nevertheless, the predicted series remains coherent and physically plausible, which is consistent with the relatively strong performance of Laayoune in the comparative metrics and with the fact that LSTM becomes particularly competitive at longer horizons in this region Figure 10.
Figure 10.
Actual versus predicted hydrogen production in Laayoune using the CatBoost direct model: (a) J + 1 and (b) J + 7.
From an interpretive perspective, Laayoune appears to occupy an intermediate position between the regularity of Dakhla and the stronger instability of Guelmim. The model is able to reproduce the expected production regime, but with more difficulty around short-lived excursions. This is consistent with recent studies showing that longer-horizon renewable-energy forecasts often benefit from architectures capable of representing temporal memory more explicitly, especially when the series combines seasonality with irregular local disturbances [47,48].
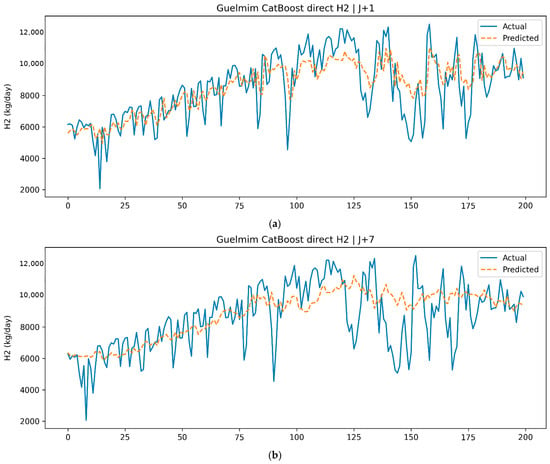
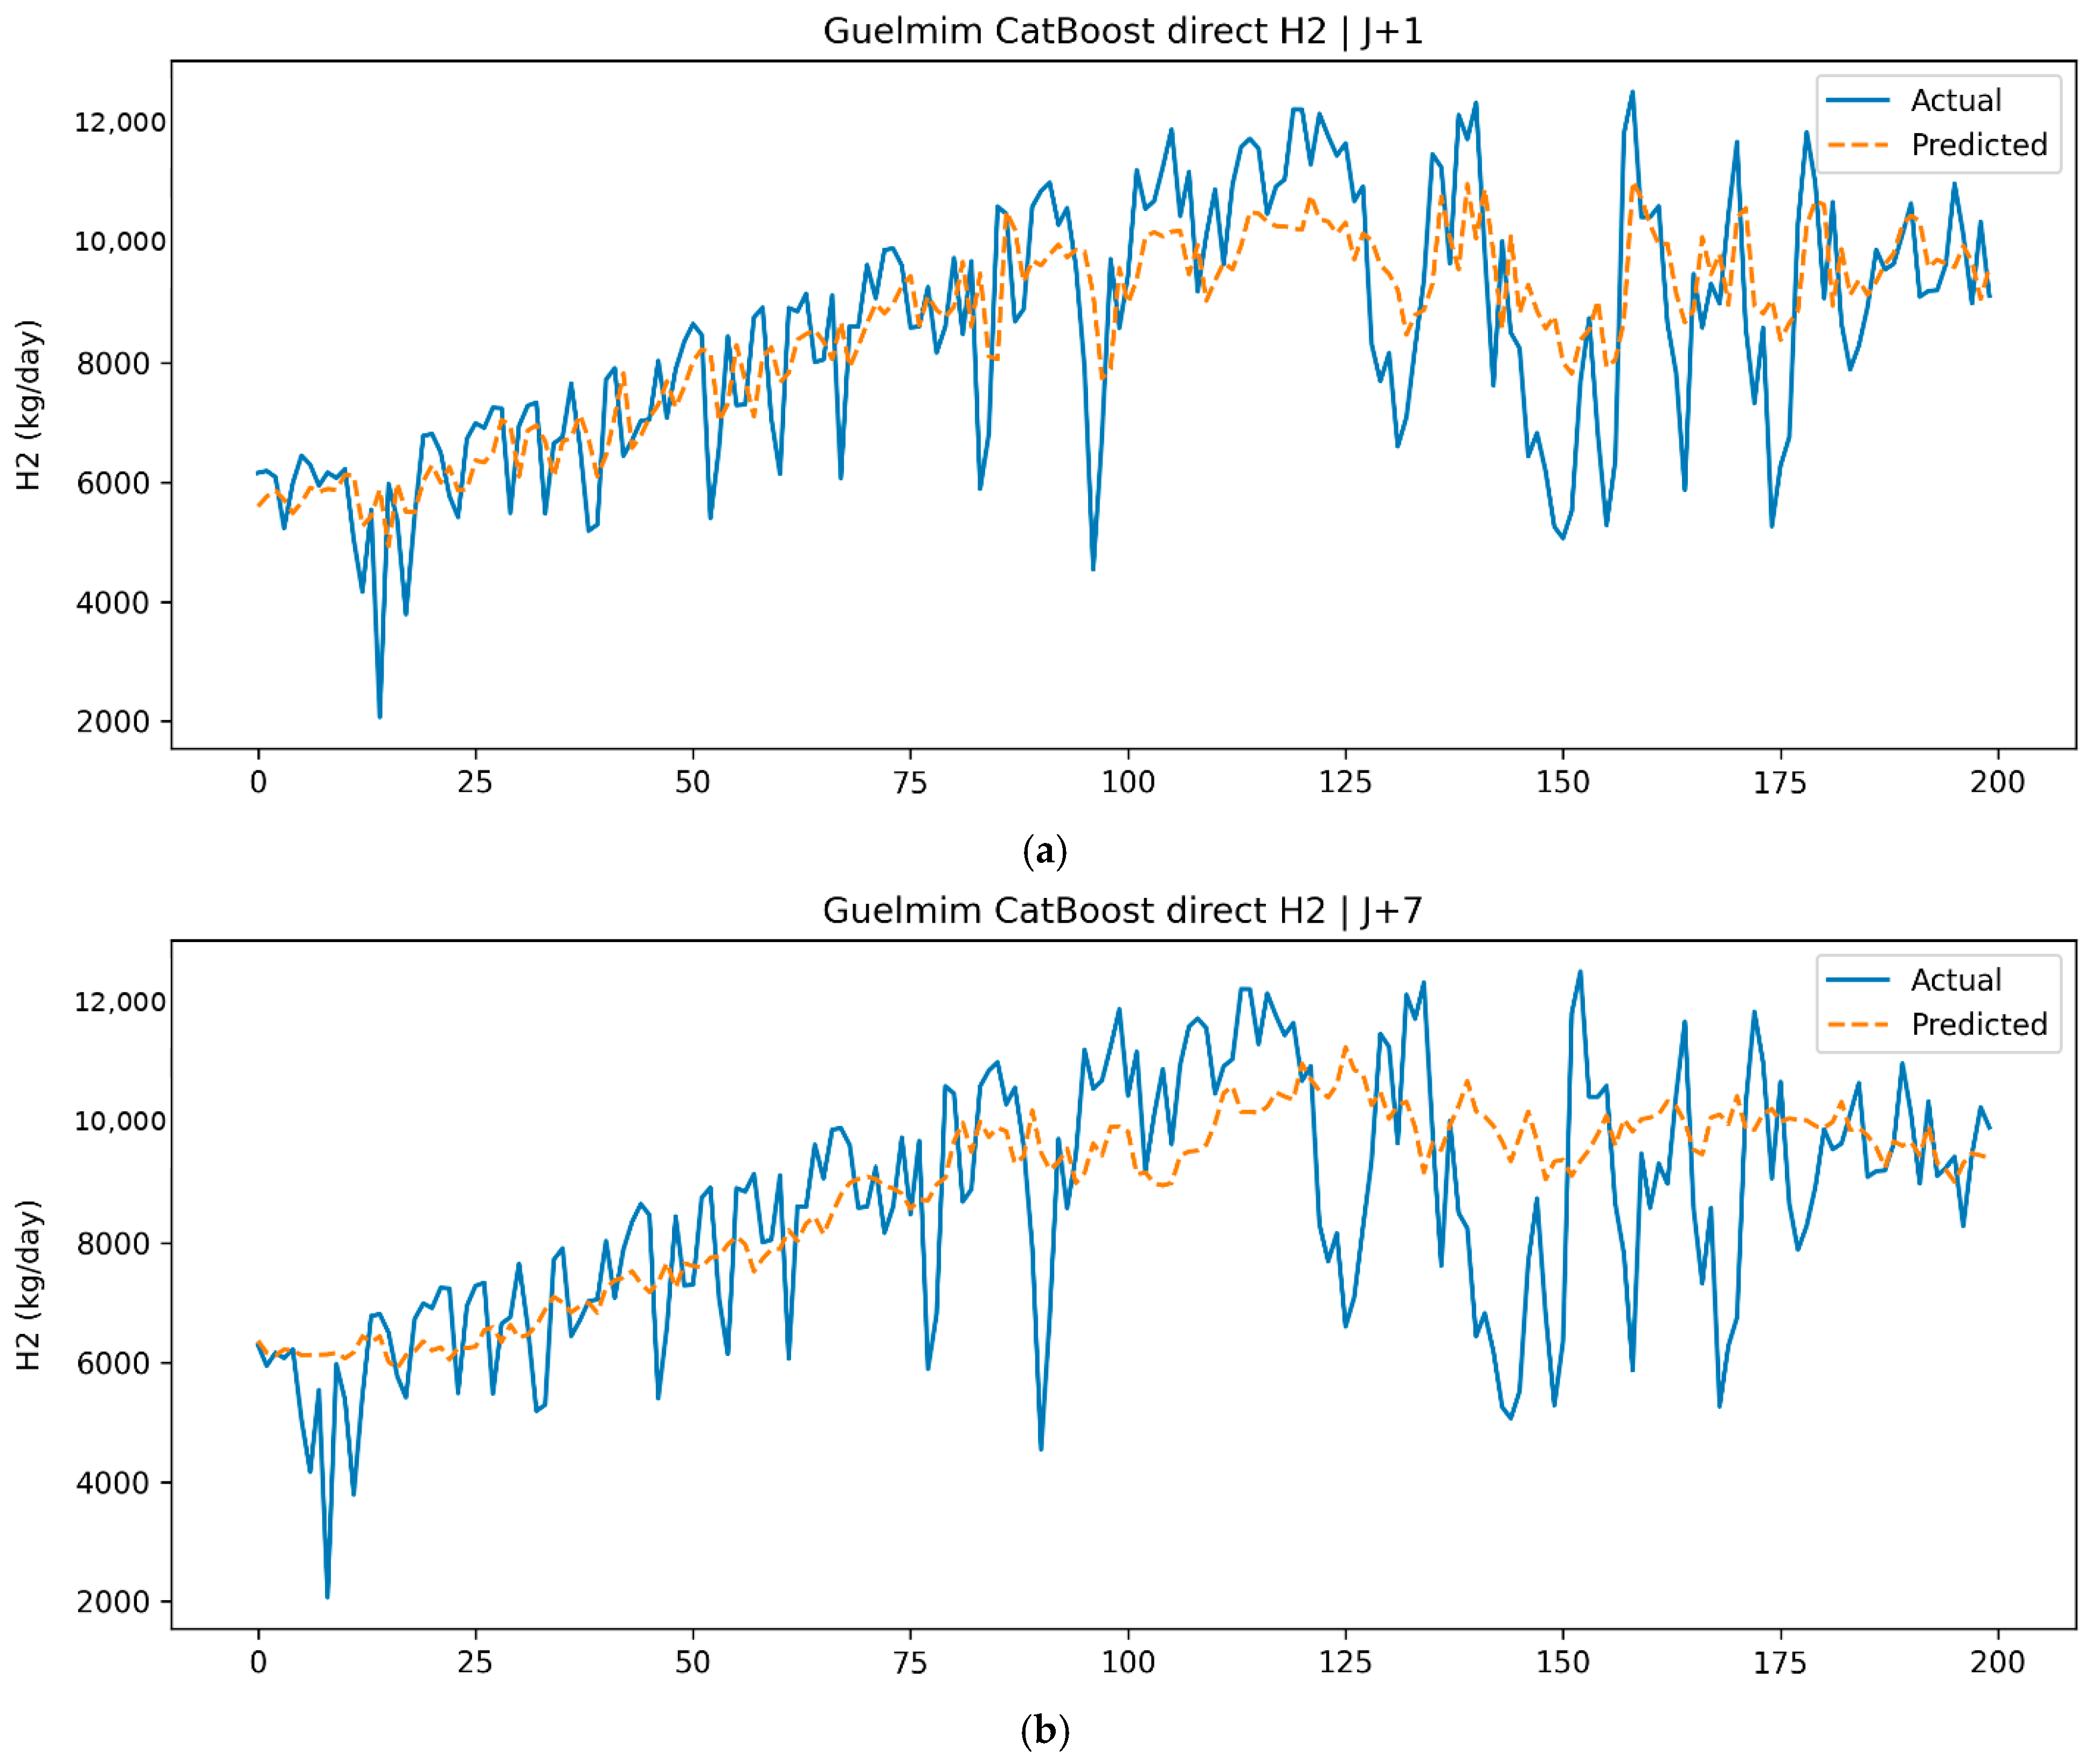
The most challenging case is Guelmim, where the difference between observed and predicted values is visually larger than in the other two regions. At J + 1, the CatBoost direct model still captures the main structure of the signal, but the observed series contains sharper and deeper short-term deviations that are not fully matched by the predictions. At J + 7, this limitation becomes even more visible. The model tracks the general level and medium-scale evolution of the series, but several abrupt drops and recoveries are smoothed out. This visual impression agrees with the quantitative results, which identify Guelmim as the least predictable site across all horizons and confirm that the local hydrogen signal is more difficult to approximate accurately Figure 11.
Figure 11.
Actual versus predicted hydrogen production in Guelmim using the CatBoost direct model: (a) J + 1 and (b) J + 7.
The behavior observed in Guelmim is especially informative because it illustrates the practical limit of purely data-driven short-term forecasting in a more irregular regime. The model is still effective for representing the expected production envelope, but not all abrupt disturbances can be recovered accurately several days in advance. Recent reviews on hydrogen and solar forecasting similarly point out that model accuracy often deteriorates more quickly in settings where short-term weather variability plays a stronger role, and that this is precisely where hybrid, physics-guided, or ensemble methods may provide the greatest added value [49].
4.3. Discussion in Light of Recent Literature
Taken together, the results indicate that the proposed framework is capable of delivering robust short-term forecasts of green hydrogen production potential, but that predictive skill remains strongly conditioned by the site and the forecast horizon. The best overall case is Dakhla, where all tested models achieve relatively strong performance and where the visual agreement between observed and predicted values remains convincing even at J + 7. Laayoune remains a favorable but more complex site, while Guelmim constitutes the hardest forecasting environment. This gradation is scientifically important because it shows that the challenge is not only algorithmic; it is also fundamentally linked to the structure of the local signal. Recent 2024–2026 studies reach similar conclusions, emphasizing that renewable-energy and hydrogen forecasting performance cannot be generalized uniformly across locations and that the most effective model often depends on the climate regime and the way the predictors are engineered [49].
Another important implication is that the present results do not support a simplistic “one-model-fits-all” conclusion. CatBoost performs very strongly at day-ahead scale, especially in Dakhla and Guelmim. Random Forest remains highly competitive and even becomes the best choice for several longer-horizon cases. LSTM becomes particularly effective in Dakhla and Laayoune when the horizon is extended. This is a valuable outcome because it aligns with recent hydrogen forecasting research, where no universal best model has emerged and where practitioners increasingly rely on comparative model selection rather than on a priori assumptions about a single dominant architecture [46,47,48,49].
From an application standpoint, the results suggest that operational hydrogen forecasting in southern Morocco could benefit from a region-specific deployment strategy. In a region such as Dakhla, where the hydrogen signal is comparatively regular, a boosting-based model such as CatBoost may already provide a strong balance between accuracy and simplicity. In Laayoune, recurrent learning becomes more attractive at longer horizons. In Guelmim, where short-term irregularity is more pronounced, additional gains may come from combining physical intermediate targets with machine learning, or from using ensemble strategies designed to handle volatile conditions more explicitly. Recent reviews in hydrogen-energy AI likewise emphasize that the next methodological step is likely to involve more explainable, hybrid, and physically informed workflows, especially when the final goal is operational decision support rather than purely statistical fitting [49].
Overall, the findings of this study support a balanced interpretation: the forecasting framework is clearly effective, but its performance depends on the degree of temporal regularity of the site and on the forecast horizon. This makes the comparative evaluation across Dakhla, Laayoune, and Guelmim particularly relevant, because it demonstrates that green hydrogen forecasting should be treated not as a generic solar-regression task, but as a structured regional problem where physical context, temporal scale, and model architecture all interact.
4.4. Generalization, Limitations, and Computational Efficiency
A limitation of the current study is the reliance on a simplified PV-to-H2 conversion model (SEC = 50 kWh/kg) due to the lack of real-world operational data from large-scale electrolyzers in the region. While these assumptions are consistent with recent benchmark studies [49], future validation using experimental plant data would further strengthen the framework’s reliability. Regarding generalization, the proposed models were trained on high-irradiation arid climates; their performance in temperate or tropical regions may vary due to different cloud-cover dynamics and humidity effects.
From a computational standpoint, tree-based models (CatBoost, RF) exhibited high efficiency, with training times under 2 min and sub-second prediction times on standard hardware (Intel i7, 16 GB RAM). Deep learning models (LSTM) required longer training (approx. 10–15 min) but remained feasible for real-time applications. Future work will investigate more advanced models such as LightGBM, Temporal Fusion Transformers (TFT) and Informer models to further enhance multi-horizon forecasting accuracy and uncertainty quantification.
5. Conclusions
This study proposed a data-driven and physics-aware framework for forecasting green hydrogen production potential in three strategic regions of southern Morocco, namely, Dakhla, Laayoune, and Guelmim. By combining solar-resource-derived hydrogen estimation with supervised machine-learning models, the study showed that short-term hydrogen forecasting can be performed with good accuracy, although the predictive performance remains strongly dependent on both the region and the forecast horizon. Among the three sites, Dakhla emerged as the most favorable case, combining the highest hydrogen production potential with the best forecasting performance, while Laayoune showed intermediate predictability and Guelmim remained the most challenging region because of its stronger short-term variability and lower overall stability.
The comparative analysis also demonstrated that no single model dominated under all conditions. CatBoost performed particularly well at the day-ahead horizon, especially in Dakhla and Guelmim, whereas Random Forest remained highly competitive for several intermediate cases, and LSTM became more advantageous in some longer-horizon forecasts, especially in Dakhla and Laayoune. Another important finding is that the two-step GHI → H2 strategy produced results very close to the direct forecasting approach, with slight advantages in the most difficult configurations, particularly for Guelmim at J + 7. This suggests that the integration of physical intermediate variables may improve robustness when the local production signal becomes more irregular.
Beyond the predictive scores themselves, the results highlighted the importance of seasonality, solar resource structure, and meteorological memory in shaping hydrogen production forecasts. The strong differences observed across the three regions confirm that green hydrogen forecasting should not be treated as a generic regression task, but rather as a site-specific and horizon-sensitive problem in which local climatic structure directly affects model behavior. In this sense, the proposed framework provides not only forecasting capability, but also a useful methodological basis for understanding how solar-driven hydrogen potential evolves across different Moroccan environments.
From an application perspective, these findings support the use of machine-learning-based forecasting as a valuable decision-support tool for the planning and operation of future green hydrogen systems in Morocco. Reliable short-term forecasts can help anticipate production variability, improve operational scheduling, and support more informed management of renewable hydrogen infrastructures. Future work may extend this study by integrating additional exogenous variables, testing hybrid and ensemble learning strategies, incorporating uncertainty quantification, and coupling the forecasting framework with techno-economic or operational optimization models for real hydrogen production systems.
Author Contributions
Conceptualization, I.J.; methodology, M.K.B.; software, I.J. and M.K.B.; validation, Y.F.; formal analysis, Y.F.; investigation, M.K.B.; resources, I.J.; data curation, M.K.B.; writing—original draft preparation, Y.F.; writing—review and editing, Y.F.; visualization, Y.F.; supervision, Y.F.; project administration, Y.F.; funding acquisition, M.K.B. All authors have read and agreed to the published version of the manuscript.
Funding
This work is supported by the National Center for Technical and Scientific Research “CNRST” under the “PhD-Associate Scholarship—PASS” Program.
Data Availability Statement
The datasets used in this study are publicly available from the corresponding data repositories. The relevant data sources and access information are provided in the manuscript.
Acknowledgments
AI Usage Disclosure: The authors used AI-based tools solely for language editing and proofreading during the preparation of this manuscript and the AI tool (ChatGPT4) in the Materials Section (Section 3) (Figure 1). The authors take full responsibility for the content, scientific accuracy, and conclusions of the manuscript.
Conflicts of Interest
The authors declare no conflicts of interest.
Abbreviations
| GHI | Global Horizontal Irradiance |
| PV | Photovoltaic |
| H2 | Hydrogen |
| PR | Performance Ratio |
| SEC | Specific Energy Consumption |
| LSTM | Long Short-Term Memory |
| RF | Random Forest |
| MAE | Mean Absolute Error |
| RMSE | Root Mean Square Error |
| sMAPE | symmetric Mean Absolute Percentage Error |
References
- International Energy Agency (IEA). Global Hydrogen Review 2024; IEA: Paris, France, 2024. [Google Scholar]
- International Energy Agency (IEA). Global Hydrogen Review 2025; IEA: Paris, France, 2025. [Google Scholar]
- Li, G.; Shi, X.; Lv, H.; Tang, H.; Wang, Y.; Guo, W.; Liu, S.; Zhao, D.; Chen, Z. Hydrogen-driven thermoelectric trigeneration for sustainable homes: Electricity, water, and heat. Energy Environ. Sci. 2026, 19, 3823–3833. [Google Scholar] [CrossRef] [Scilit]
- Erbay, C. Machine learning models for solar forecasting and impact on green hydrogen production costs. Int. J. Hydrogen Energy 2025, 132, 225–238. [Google Scholar] [CrossRef] [Scilit]
- International Renewable Energy Agency (IRENA). Renewable Power Generation Costs in 2024; IRENA: Abu Dhabi, United Arab Emirates, 2025. [Google Scholar]
- Government of Morocco. National Roadmap and Policy Framework for Green Hydrogen and Power-to-X (Official Documents), Rabat, 2024–2025. Available online: https://www.mem.gov.ma/Lists/Lst_rapports/Attachments/36/Feuille%20de%20route%20de%20hydrog%C3%A8ne%20vert.pdf (accessed on 5 February 2026).
- Salari, A.; Shakibi, H.; Soleimanzadeh, M.A.; Sadrzadeh, M.; Hakkaki-Fard, A. Application of machine learning in evaluating and optimizing the hydrogen production performance of a solar-based electrolyzer system. Renew. Energy 2024, 220, 119626. [Google Scholar] [CrossRef] [Scilit]
- Xie, Y.; Ling, X. Forecasting green hydrogen production in China: Hybrid deep learning assessment of economic, environmental, and renewable energy integration. Renew. Energy 2026, 256, 124414. [Google Scholar] [CrossRef] [Scilit]
- Hyndman, R.J.; Athanasopoulos, G. Forecasting: Principles and Practice, 3rd ed.; OTexts: Melbourne, Australia, 2021. [Google Scholar]
- Brownlee, J. Backtest Machine Learning Models for Time Series Forecasting; Machine Learning Mastery: San Juan, PR, USA, 2019. [Google Scholar]
- European Commission, Joint Research Centre (JRC). PVGIS: Photovoltaic Geographical Information System—User Manual and API Documentation; European Commission: Brussels, Belgium, 2024. [Google Scholar]
- NASA POWER Project. POWER Data Access Viewer and API Documentation; NASA: Washington, DC, USA, 2024. [Google Scholar]
- Schauberger, G.; Klug, S.J.; Berger, M. Random forests for the analysis of matched case–control studies. BMC Bioinform. 2024, 25, 253. [Google Scholar] [CrossRef] [Scilit] [PubMed]
- Hochreiter, S.; Schmidhuber, J. Long short-term memory. Neural Comput. 1997, 9, 1735–1780. [Google Scholar] [CrossRef] [Scilit] [PubMed]
- Prokhorenkova, L.; Gusev, G.; Vorobev, A.; Dorogush, A.V.; Gulin, A. CatBoost: Unbiased boosting with categorical features. Adv. Neural Inf. Process. Syst. 2018, 31, 6638–6648. [Google Scholar]
- Makridakis, S.; Spiliotis, E.; Assimakopoulos, V. The M5 accuracy competition: Results, findings and conclusions. Int. J. Forecast. 2022, 38, 1346–1364. [Google Scholar] [CrossRef] [Scilit]
- International Energy Agency (IEA). Hydrogen in the Energy System: Tracking and Deployment Updates; IEA: Paris, France, 2024. [Google Scholar]
- Hydrogen Council. Global Hydrogen Compass 2025; Hydrogen Council: Brussels, Belgium, 2025. [Google Scholar]
- Babay, M.-A.; Adar, M.; Chebak, A.; Mabrouki, M. Forecasting green hydrogen production: An assessment of renewable energy systems using deep learning and statistical methods. Fuel 2025, 381, 133496. [Google Scholar] [CrossRef] [Scilit]
- Emeksiz, C.; Tan, M. An innovative adaptive hybrid prediction model based on deep learning methods (CEEMDAN-GRU) for green hydrogen production, In case study: Turkey. Int. J. Hydrogen Energy 2024, 52, 1266–1279. [Google Scholar] [CrossRef] [Scilit]
- Ahmed, R.; Shehab, S.A.; Elzeki, O.M.; Darwish, A.; Hassanein, A.E. An explainable AI for green hydrogen production: A deep learning regression model. Int. J. Hydrogen Energy 2024, 83, 1226–1242. [Google Scholar] [CrossRef] [Scilit]
- Cui, X.; Yin, S.; Chen, H.; Niu, D. A temporal–image parallel hybrid solar radiation–wind speed–green hydrogen production potential prediction model based on federated learning and rolling real-time decomposition. Energy 2025, 337, 138516. [Google Scholar] [CrossRef] [Scilit]
- Yang, B.; Zhang, Z.; Li, J.; Wang, J.; Zhang, R.; Li, S.; Jiang, L.; Sang, Y. Efficient multi-objective rolling strategy of photovoltaic/hydrogen system via short-term photovoltaic power forecasting. Int. J. Hydrogen Energy 2024, 80, 1339–1355. [Google Scholar] [CrossRef] [Scilit]
- Arias, I.; Battisti, F.G.; Romero-Ramos, J.A.; Pérez, M.; Valenzuela, L.; Cardemil, J.; Escobar, R. Assessing system-level synergies between photovoltaic and proton exchange membrane electrolyzers for solar-powered hydrogen production. Appl. Energy 2024, 368, 123495. [Google Scholar] [CrossRef] [Scilit]
- Wang, J.; Wen, J.; Wang, J.; Yang, B.; Jiang, L. Water electrolyzer operation scheduling for green hydrogen production: A review. Renew. Sustain. Energy Rev. 2024, 203, 114779. [Google Scholar] [CrossRef] [Scilit]
- Gandhi, O.; Zhang, W.; Kumar, D.S.; Rodríguez-Gallegos, C.D.; Yagli, G.M.; Yang, D.; Reindl, T.; Srinivasan, D. The value of solar forecasts and the cost of their errors: A review. Renew. Sustain. Energy Rev. 2024, 189, 113915. [Google Scholar] [CrossRef] [Scilit]
- Wang, W.; Guo, Y.; Yang, D.; Zhang, Z.; Kleissl, J.; van der Meer, D.; Yang, G.; Hong, T.; Liu, B.; Huang, N.; et al. Economics of physics-based solar forecasting in power system day-ahead scheduling. Renew. Sustain. Energy Rev. 2024, 199, 114448. [Google Scholar] [CrossRef] [Scilit]
- Erbay, C. District-level solar forecasting and green hydrogen cost mapping in Türkiye using XGBoost machine learning method. Int. J. Hydrogen Energy 2025, 166, 150993. [Google Scholar] [CrossRef] [Scilit]
- Duan, F.; Sheng, W.; Sha, G.; Wu, Y. Nonlinear dynamics-based control strategy for hydrogen-based sustainable energy grid with flexible load of P2H system. Sustain. Energy Technol. Assess. 2025, 79, 104361. [Google Scholar] [CrossRef] [Scilit]
- Qiu, X.; Hu, J.; Zhou, L.; Wu, X.; Du, J.; Zhang, B.; Guo, C.; Zhou, A.; Jensen, C.S.; Sheng, Z.; et al. TFB: Towards comprehensive and fair benchmarking of time series forecasting methods. Proc. VLDB Endow. 2024, 17, 2363–2377. [Google Scholar] [CrossRef] [Scilit]
- Li, H.; Wu, W.; Chen, W.; Zhang, M. RTI-Net: Physics-informed deep learning for photovoltaic power forecasting. Renew. Energy 2026, 256, 124152. [Google Scholar] [CrossRef] [Scilit]
- Yu, Y.; Loskot, P.; Gao, Y. PhysEmbedFormer: A physics-guided interpretable architecture for days-ahead forecasting of PV power. Sci. Rep. 2026, 16, 4705. [Google Scholar] [CrossRef] [Scilit] [PubMed]
- Huld, T.; Müller, R.; Gambardella, A. A new solar radiation database for estimating PV performance in Europe and Africa. Sol. Energy 2012, 86, 1803–1815. [Google Scholar] [CrossRef] [Scilit]
- Aboelkhair, H.; Morsy, M.; El Afandi, G. Assessment of agroclimatology NASA POWER reanalysis datasets for temperature types and relative humidity at 2 m against ground observations over Egypt. Adv. Space Res. 2019, 64, 129–142. [Google Scholar] [CrossRef] [Scilit]
- Tayyeh, H.K.; Mohammed, R. Analysis of NASA POWER reanalysis products to predict temperature and precipitation in Euphrates River basin. J. Hydrol. 2023, 619, 129327. [Google Scholar] [CrossRef] [Scilit]
- Voyant, C.; Notton, G.; Kalogirou, S.; Nivet, M.-L.; Paoli, C.; Motte, F.; Fouilloy, A. Machine learning methods for solar radiation forecasting: A review. Renew. Energy 2017, 105, 569–582. [Google Scholar] [CrossRef] [Scilit]
- Engerer, N.A.; Mills, F.P. KPV: A clear-sky index for photovoltaics. Sol. Energy 2014, 105, 679–693. [Google Scholar] [CrossRef] [Scilit]
- Breiman, L. Random Forests. Mach. Learn. 2001, 45, 5–32. [Google Scholar] [CrossRef] [Scilit]
- Prater, R.R.; Hanne, T.; Dornberger, R. Generalized Performance of LSTM in Time-Series Forecasting. Appl. Artif. Intell. 2024, 38(1). [Google Scholar] [CrossRef] [Scilit]
- Hyndman, R.J.; Koehler, A.B. Another look at measures of forecast accuracy. Int. J. Forecast. 2006, 22, 679–688. [Google Scholar] [CrossRef] [Scilit]
- Bergmeir, C.; Benítez, J.M. On the use of cross-validation for time series predictor evaluation. Inf. Sci. 2012, 191, 192–213. [Google Scholar] [CrossRef] [Scilit]
- Zerouali, B.; Bailek, N.; Qaysi, S.; Difi, S.; Alarifi, N.; Elbeltagi, A.; Santos, C.A.G.; He, K.; Youssef, Y.M. Hybrid machine learning optimization for solar radiation forecasting. Phys. Chem. Earth Parts A/B/C 2025, 140, 104052. [Google Scholar] [CrossRef] [Scilit]
- Allal, Z.; Noura, H.N.; Salman, O.; Vernier, F.; Chahine, K. A review on machine learning applications in hydrogen energy systems. Int. J. Thermofluids 2025, 26, 101119. [Google Scholar] [CrossRef] [Scilit]
- Askr, H.; Basha, S.H.; Abdelnapi, N.M.M.; Elgeldawi, E.; Darwish, A.; Hassanien, A.E. Artificial intelligence for sustainable green hydrogen production: A systematic literature review. Renew. Sustain. Energy Rev. 2025, 224, 116071. [Google Scholar] [CrossRef] [Scilit]
- Chu, Y.; Wang, Y.; Yang, D.; Chen, S.; Li, M. A review of distributed solar forecasting with remote sensing and deep learning. Renew. Sustain. Energy Rev. 2024, 198, 114391. [Google Scholar] [CrossRef] [Scilit]
- Ahmed, U.; Khan, A.R.; Mahmood, A.; Rafiq, I.; Ghannam, R.; Zoha, A. Short-term global horizontal irradiance forecasting using weather classified categorical boosting. Appl. Soft Comput. 2024, 155, 111441. [Google Scholar] [CrossRef] [Scilit]
- Urhan, B.B.; Erdoğmuş, A.; Dokuz, A.Ş.; Gökçek, M. Predicting green hydrogen production using electrolyzers driven by photovoltaic panels and wind turbines based on machine learning techniques: A pathway to on-site hydrogen refuelling stations. Int. J. Hydrogen Energy 2025, 101, 1421–1438. [Google Scholar] [CrossRef] [Scilit]
- He, Q.; Zhao, M.; Li, S.; Li, X.; Wang, Z. Machine Learning Prediction of Photovoltaic Hydrogen Production Capacity Using Long Short-Term Memory Model. Energies 2025, 18, 543. [Google Scholar] [CrossRef] [Scilit]
- van der Laag, R.; Rizzato, A.; Bäck, T.; Fan, Y. Machine learning for hydrogen technologies: A comprehensive review of challenges, opportunities, and emerging trends. Int. J. Hydrogen Energy 2026, 197, 152556. [Google Scholar] [CrossRef] [Scilit]

Disclaimer/Publisher’s Note: The statements, opinions and data contained in all publications are solely those of the individual author(s) and contributor(s) and not of MDPI and/or the editor(s). MDPI and/or the editor(s) disclaim responsibility for any injury to people or property resulting from any ideas, methods, instructions or products referred to in the content. |
© 2026 by the authors. Licensee MDPI, Basel, Switzerland. This article is an open access article distributed under the terms and conditions of the Creative Commons Attribution (CC BY) license.